Embed Size (px)
Citation preview
UK-WHO Growth Charts
Magda Sachs, PhD
Why new charts from WHO?
Because breastfed baby growth pattern observed to be different from other-fed babies
Concerns that routine weighing was undermining breastfeeding
Also of concern here in the UK
WHO growth charts
Sample of breastfed infants of non- smoking non-deprived mothers in 6 countries. Very similar linear growth patterns in all 6 centres
Charts are a description of optimal rather than average growth
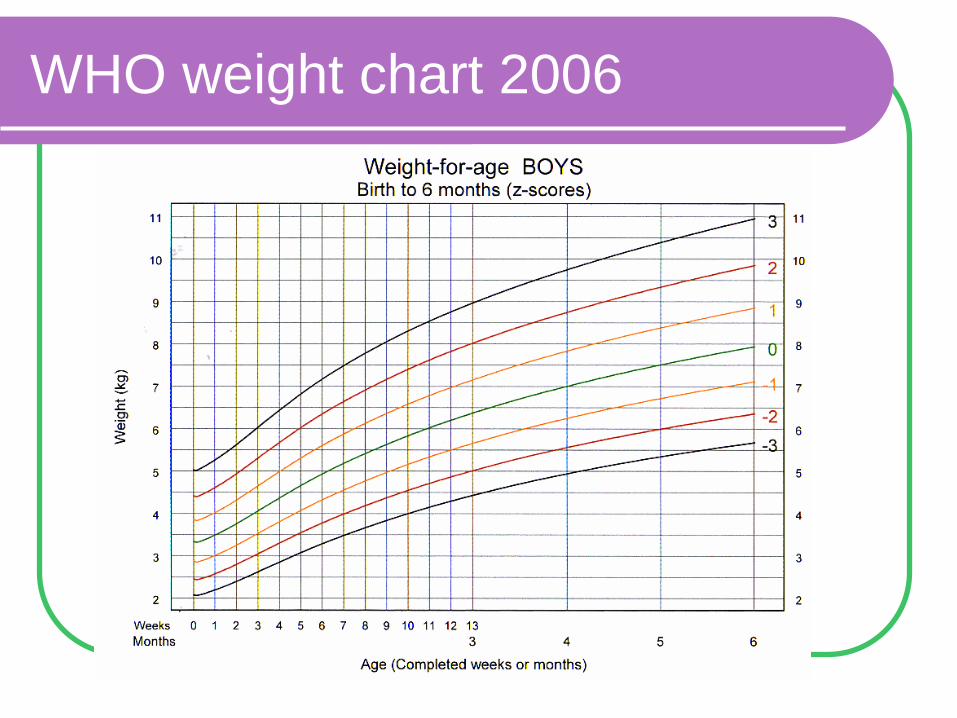
WHO weight chart 2006
Age (days)
Mea
n of
Len
gth
(cm
)
0 200 400 600
5060
7080
BrazilGhanaIndiaNorwayOmanUSA
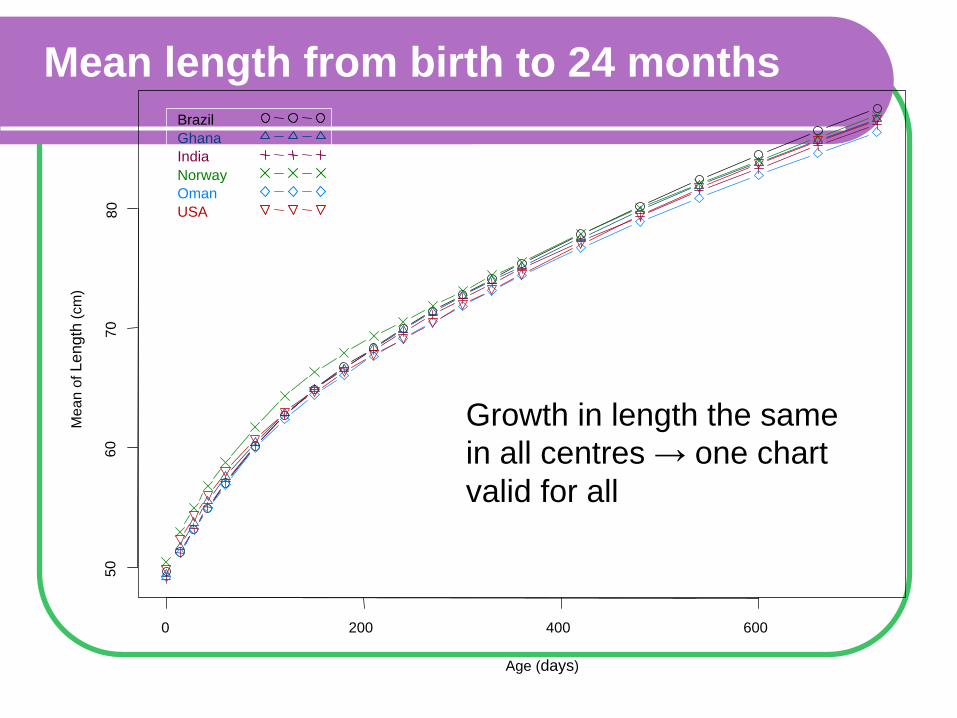
Mean length from birth to 24 months
Growth in length the same in all centres → one chart valid for all
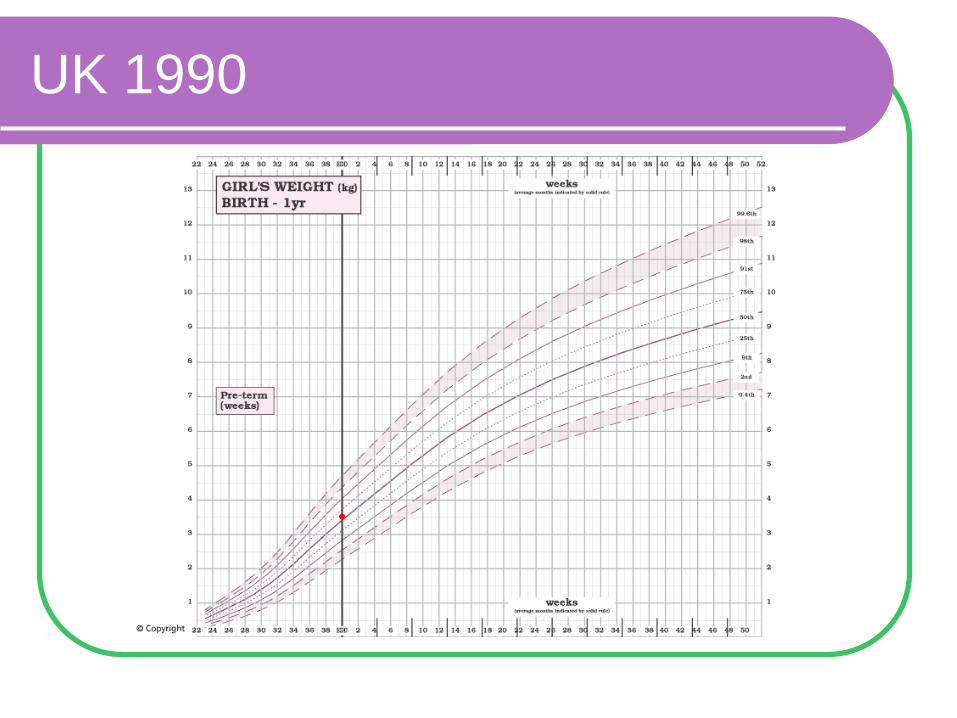
UK 1990
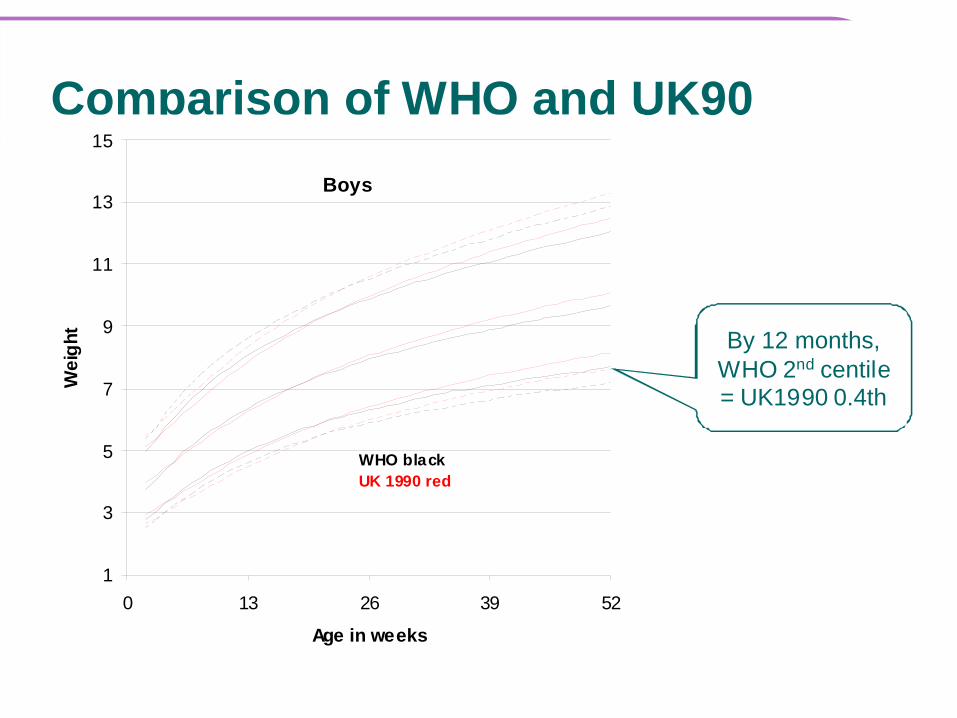
Comparison of WHO and UK90Boys
1
3
5
7
9
11
13
15
0 13 26 39 52
Age in weeks
Wei
ght
WHO blackUK 1990 red
By 12 months, WHO 2nd centile = UK1990 0.4th
UK-WHO chart:
Process
Product
Process
SACN (Scientific Advisory Committee on Nutrition)
Department of Health (England) commissioned Royal College of Paediatrics and Child Health to design charts and produce educational materials
Expert group convened to carry out the work
Professional plotting workshops
2 sets of workshops
Permutated exercises comparing UK1990 and several UK-WHO designs
Quantitative analysis
Qualitative comments in discussions
Informed the instructions
Informed the educational material
Parent consultations
3 sets
Influenced design (impact on professional instructions)
Information tested – content and wording
Personal Child Health Record (PCHR)
Fact sheet on website
Birth to Five
Educational materials
Drew on learning needs identified in professional (and parent) groups
Drafts written and evaluated
Delivered by one member of project team observed by another team member
Delivered by expert staff observed by team member
Delivered by expert staff who received the package alone, observed by team member
Product(s)
A4 charts with evidence-based instructions
A5 (PCHR charts) with information for parents
Education package online
Sets of slides for students and staff
Fact sheets
Plotting exercises
Parent information sheet
Low birthweight chart
Influence of findings from groups
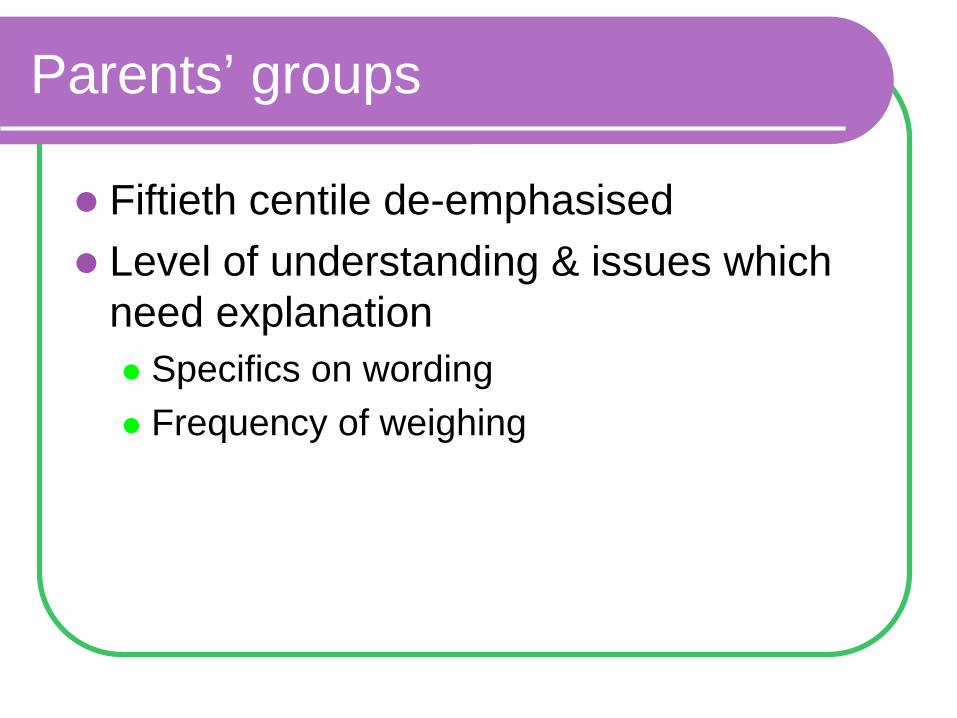
Parents’ groups
Fiftieth centile de-emphasised
Level of understanding & issues which need explanation
Specifics on wording
Frequency of weighing
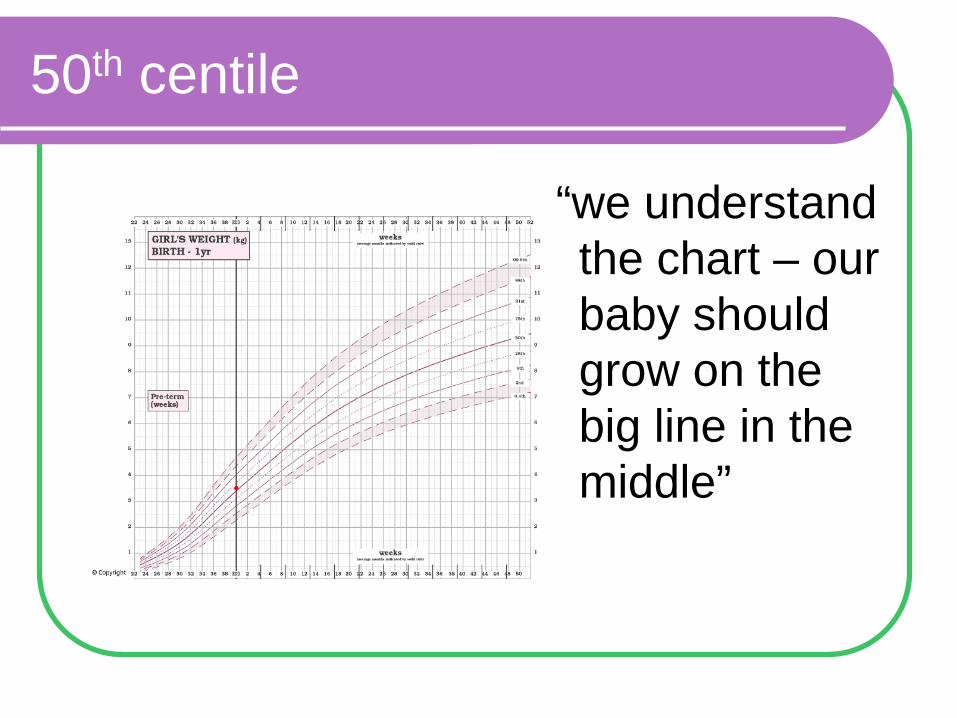
50th centile
“we understand the chart – our baby should grow on the big line in the middle”
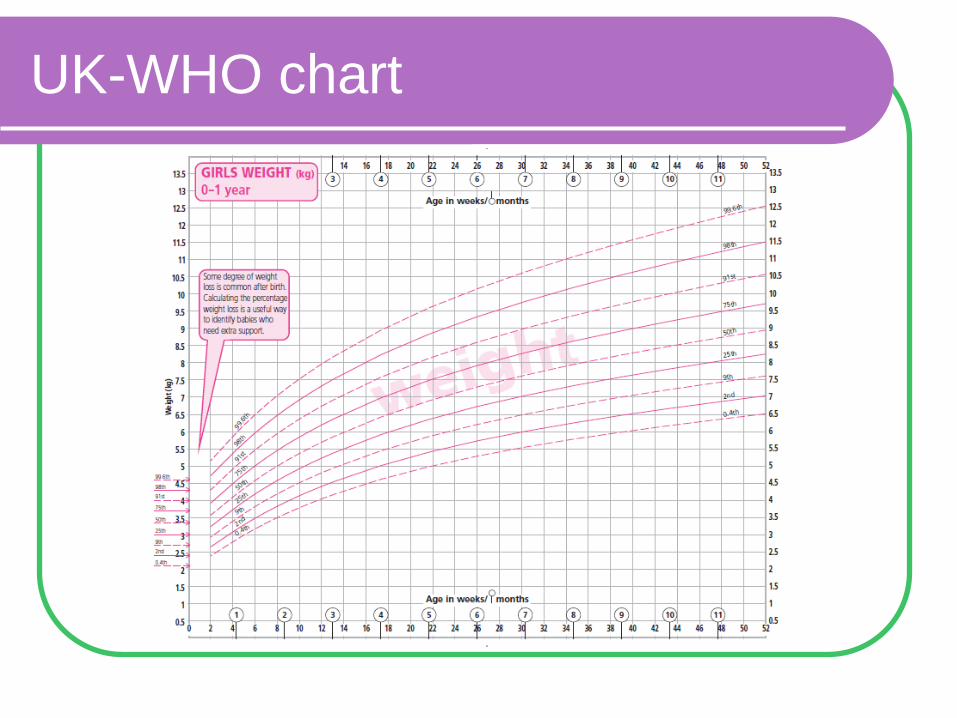
UK-WHO chart
© 2009 Royal College of Paediatrics and Child Health wwwgrowthcharts.rcpch.ac.uk
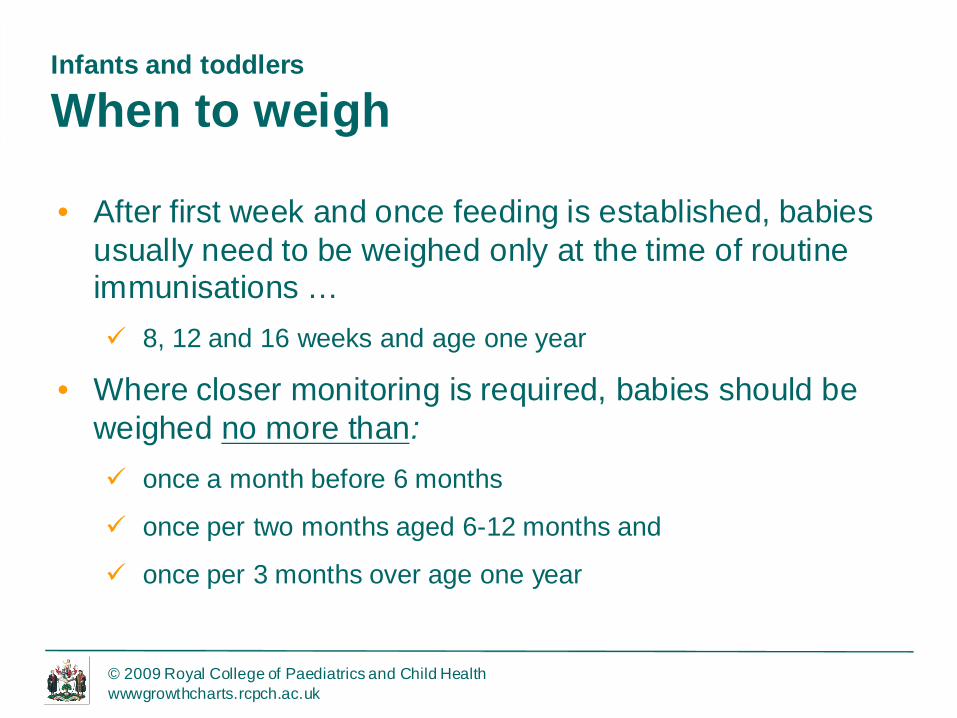
Infants and toddlers
When to weigh
• After first week and once feeding is established, babies usually need to be weighed only at the time of routine immunisations … 8, 12 and 16 weeks and age one year
• Where closer monitoring is required, babies should be weighed no more than: once a month before 6 months
once per two months aged 6-12 months and
once per 3 months over age one year
Professional workshops
Health visitors & team
Paediatricians
Midwives
Neonatal nurses
GPs
Dieticians
Breastfeeding support workers
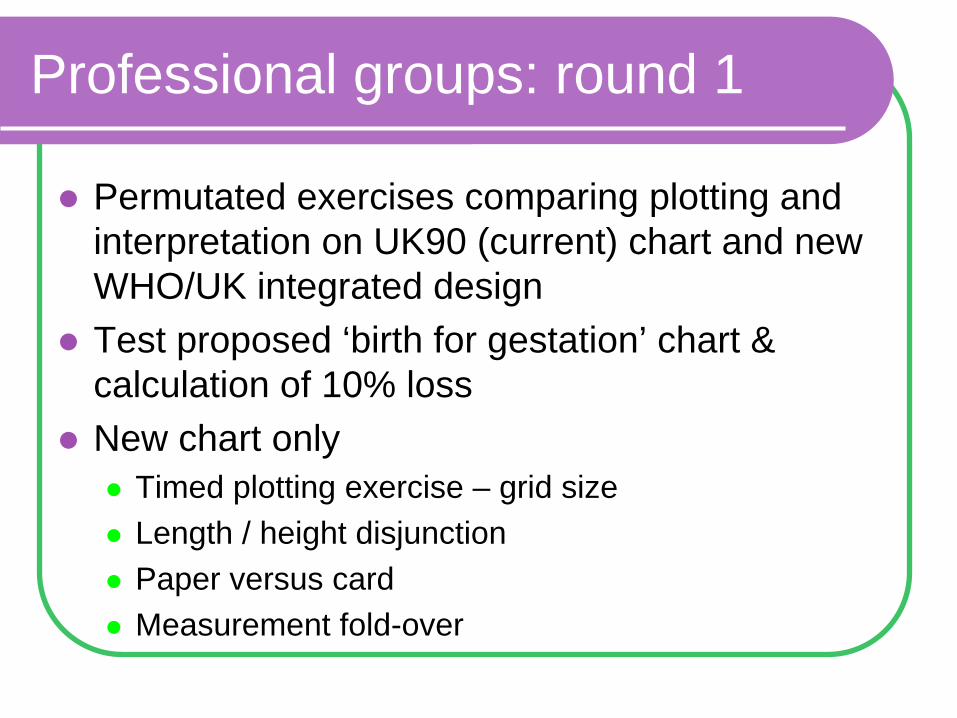
Professional groups: round 1
Permutated exercises comparing plotting and interpretation on UK90 (current) chart and new WHO/UK integrated design
Test proposed ‘birth for gestation’ chart & calculation of 10% loss
New chart only
Timed plotting exercise – grid size
Length / height disjunction
Paper versus card
Measurement fold-over
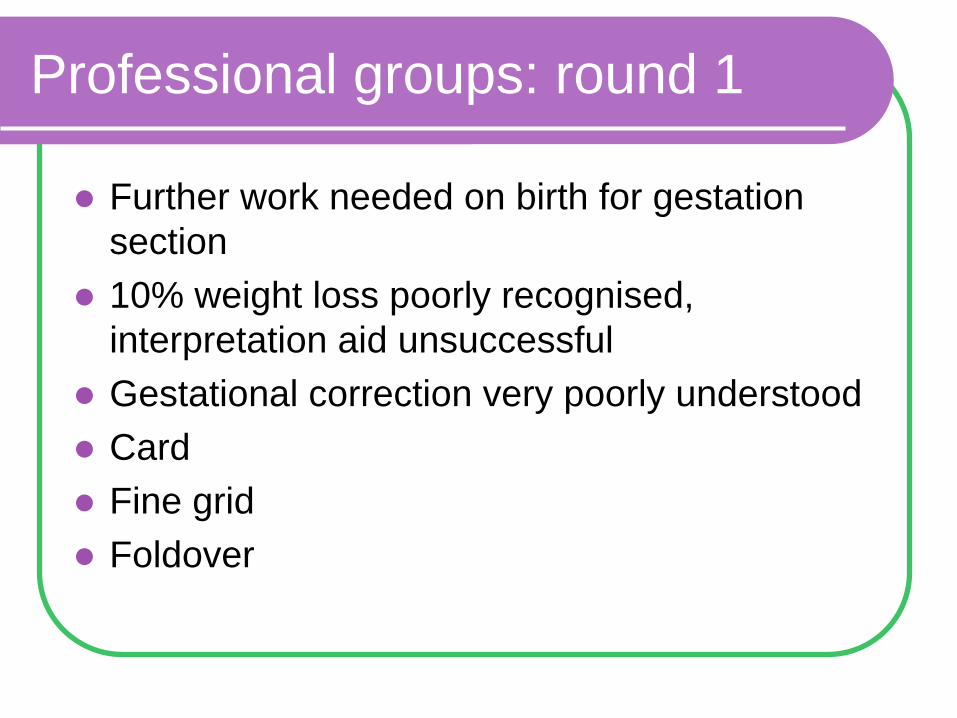
Professional groups: round 1
Further work needed on birth for gestation section
10% weight loss poorly recognised, interpretation aid unsuccessful
Gestational correction very poorly understood
Card
Fine grid
Foldover
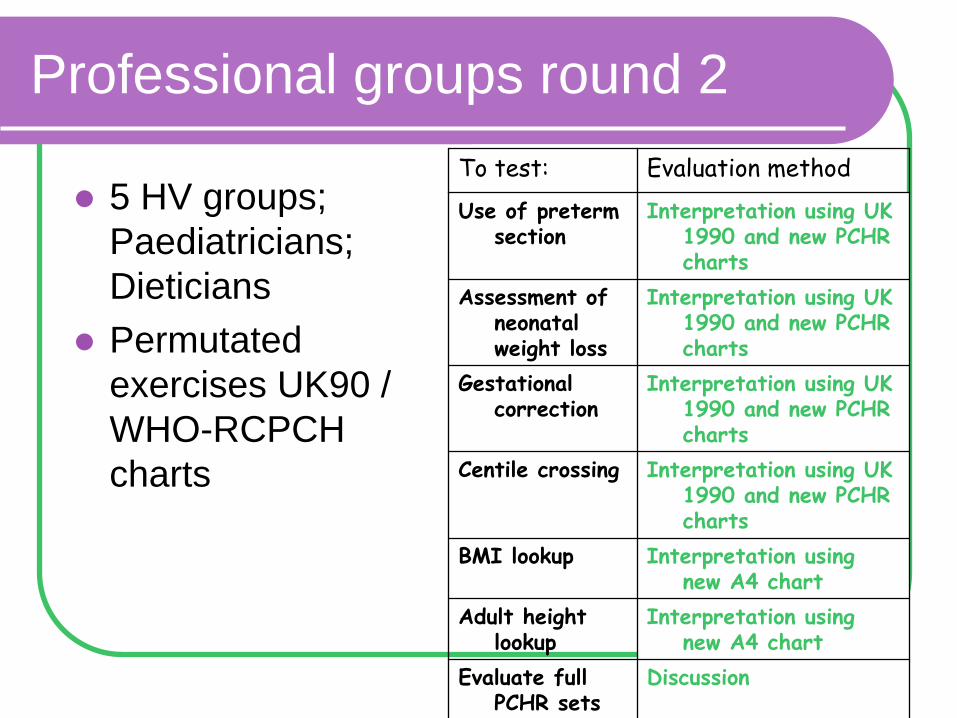
Professional groups round 2
5 HV groups; Paediatricians; Dieticians
Permutated exercises UK90 / WHO-RCPCH charts
To test: Evaluation methodUse of preterm
sectionInterpretation using UK
1990 and new PCHR charts
Assessment of neonatal weight loss
Interpretation using UK 1990 and new PCHR charts
Gestational correction
Interpretation using UK 1990 and new PCHR charts
Centile crossing Interpretation using UK 1990 and new PCHR charts
BMI lookup Interpretation using new A4 chart
Adult height lookup
Interpretation using new A4 chart
Evaluate full PCHR sets
Discussion
Workshops -- outcomes
Gestational age
Clear definition required
Clear instructions for transition preterm to main chart
Uniform method for showing gestational correction
Workshops - outcomes
Scenario with baby showing 12.5% weight loss between birth and 2 weeks
Only half participants would refer to paediatrician or breastfeeding counsellor
“I wouldn’t worry about this weight loss because they lose weight the first two weeks anyway and he’s breastfeeding.”
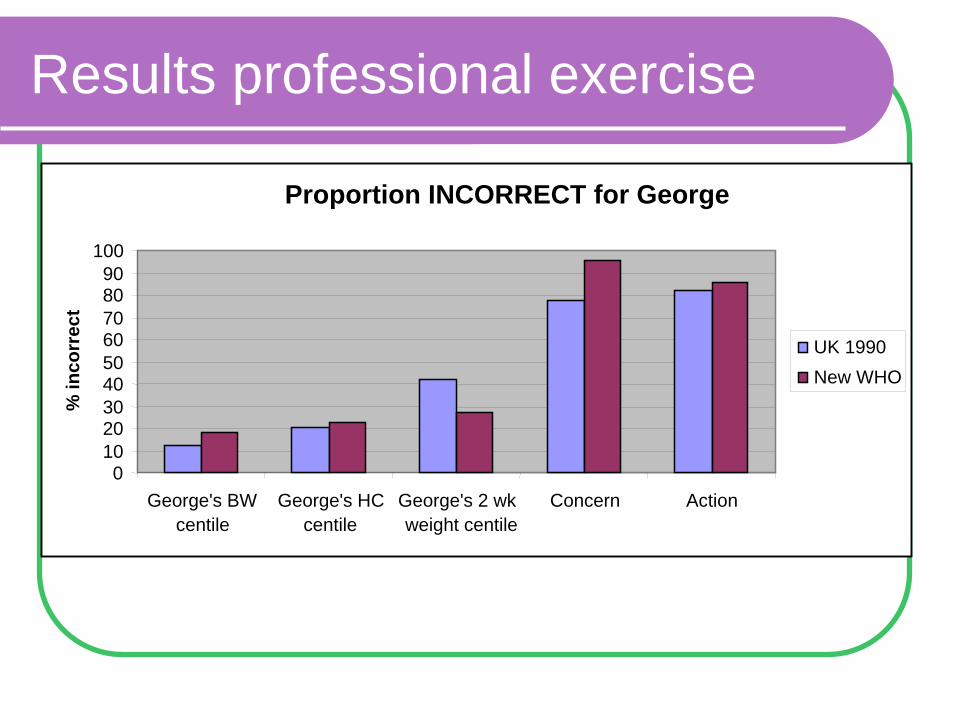
Results professional exercise
Proportion INCORRECT for George
0102030405060708090
100
George's BWcentile
George's HCcentile
George's 2 wkweight centile
Concern Action
% in
corr
ect
UK 1990New WHO
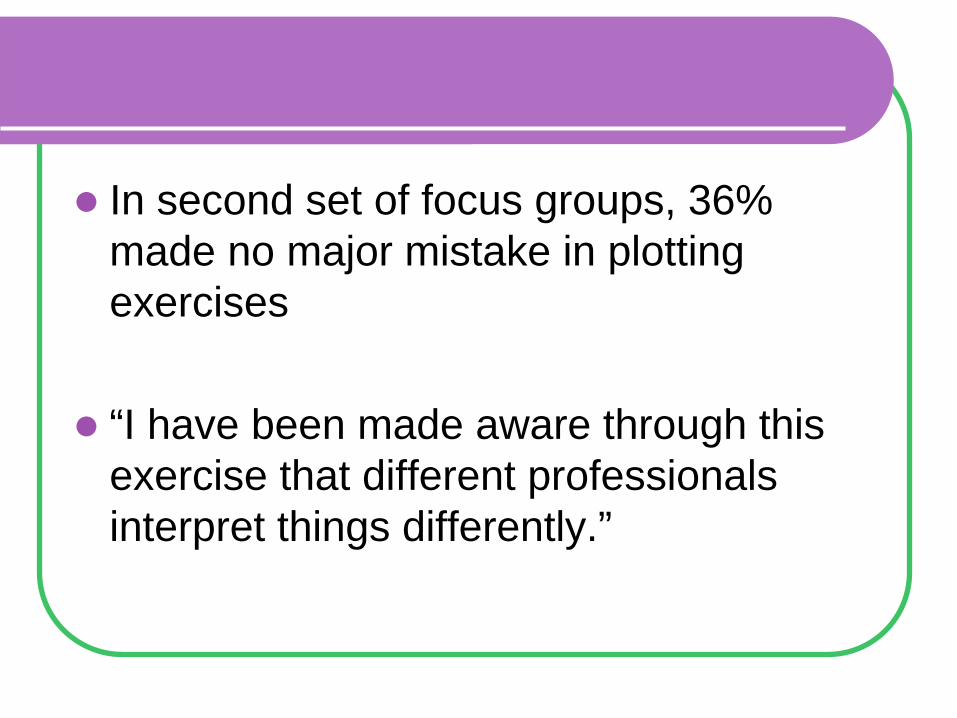
In second set of focus groups, 36% made no major mistake in plotting exercises
“I have been made aware through this exercise that different professionals interpret things differently.”
New chart features
Separate preterm section
No centiles 0-2 weeks
Gestational correction
Height look up
BMI centile look up
No centile lines in first 2 weeks
Data does not match:
UK preterm and birth data
WHO 2 weeks to 4 years
Individual patterns – percentage weight loss more relevant than centiles at this time
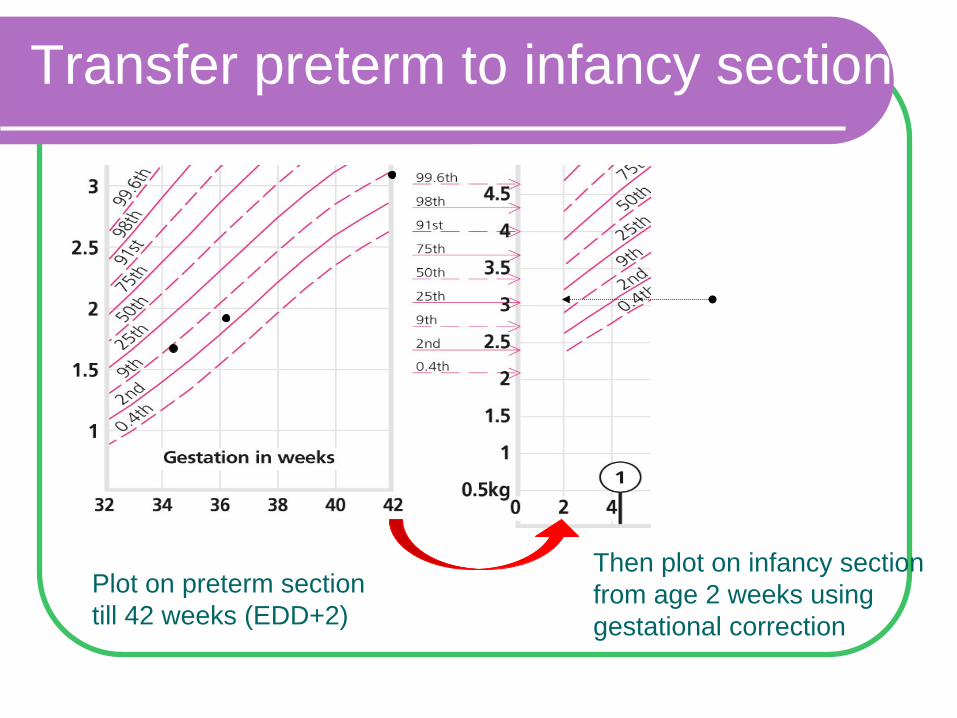
Transfer preterm to infancy section
Plot on preterm section till 42 weeks (EDD+2)
Then plot on infancy section from age 2 weeks using gestational correction
© 2009 Royal College of Paediatrics and Child Health wwwgrowthcharts.rcpch.ac.uk
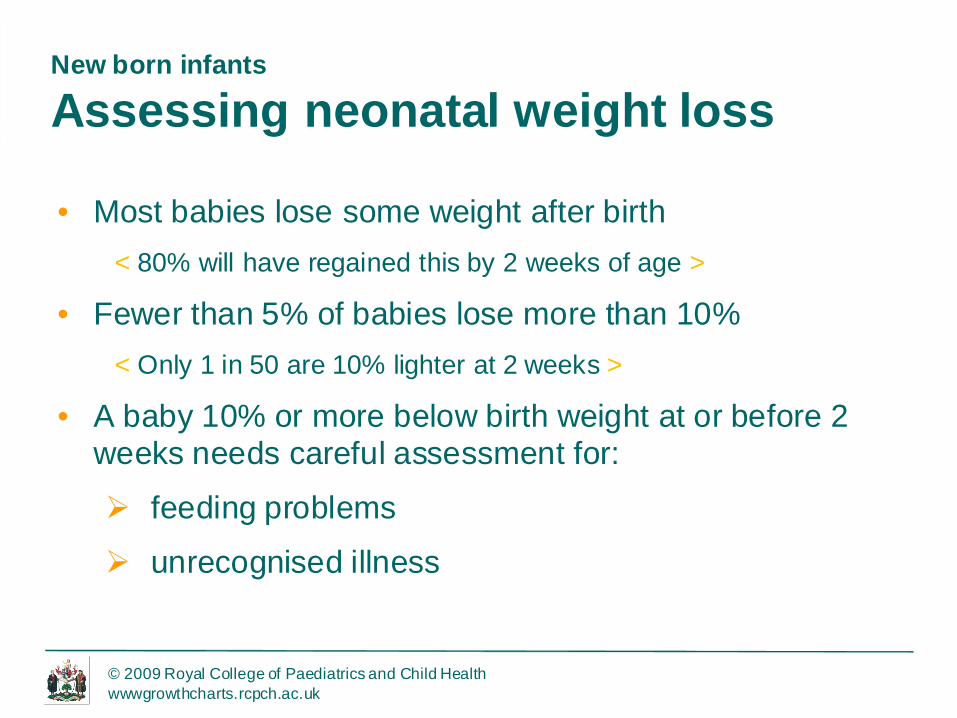
New born infants
Assessing neonatal weight loss
• Most babies lose some weight after birth< 80% will have regained this by 2 weeks of age >
• Fewer than 5% of babies lose more than 10% < Only 1 in 50 are 10% lighter at 2 weeks >
• A baby 10% or more below birth weight at or before 2 weeks needs careful assessment for:
feeding problems
unrecognised illness
© 2009 Royal College of Paediatrics and Child Health wwwgrowthcharts.rcpch.ac.uk
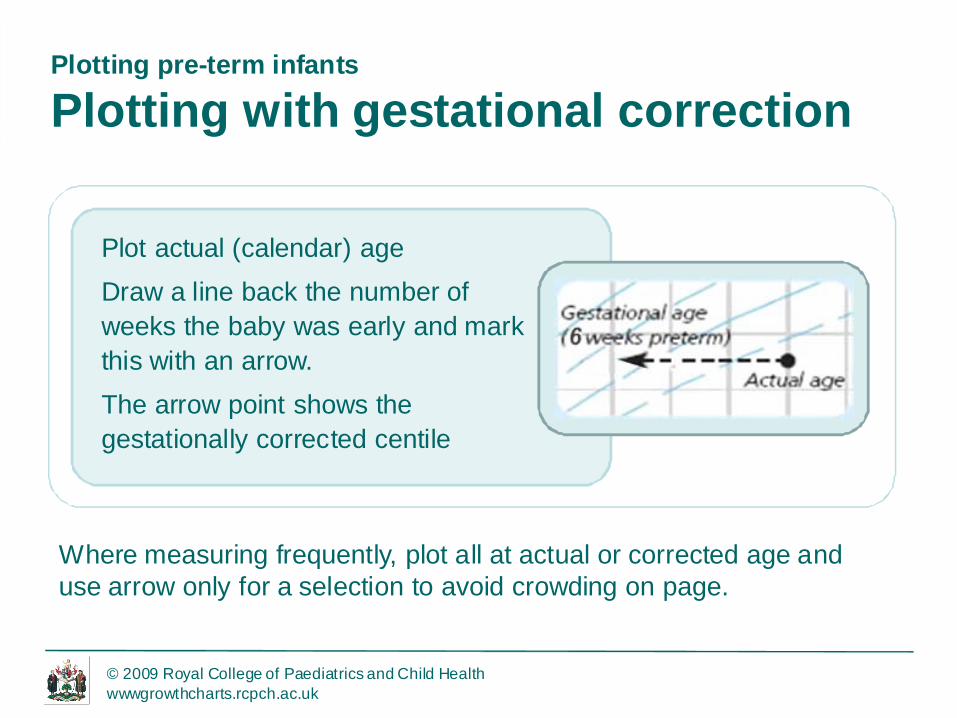
Plotting pre-term infants
Plotting with gestational correction
Where measuring frequently, plot all at actual or corrected age and use arrow only for a selection to avoid crowding on page.
Plot actual (calendar) ageDraw a line back the number of weeks the baby was early and mark this with an arrow. The arrow point shows the gestationally corrected centile
© 2009 Royal College of Paediatrics and Child Health wwwgrowthcharts.rcpch.ac.uk
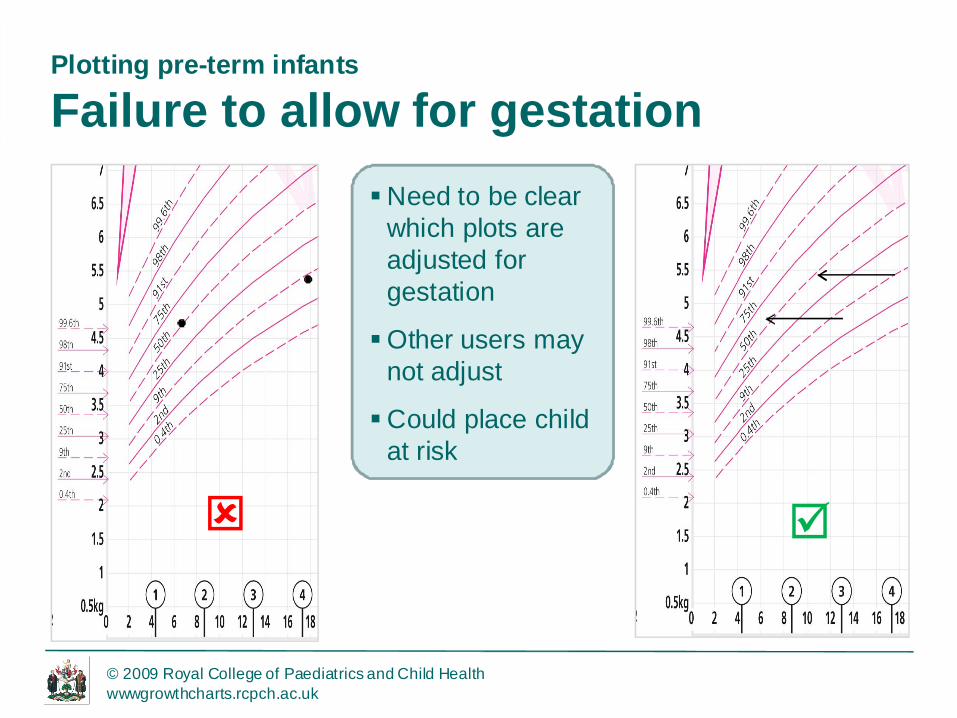
Plotting pre-term infants
Failure to allow for gestationNeed to be clear
which plots are adjusted for gestation
Other users may not adjust
Could place child at risk
© 2009 Royal College of Paediatrics and Child Health wwwgrowthcharts.rcpch.ac.uk
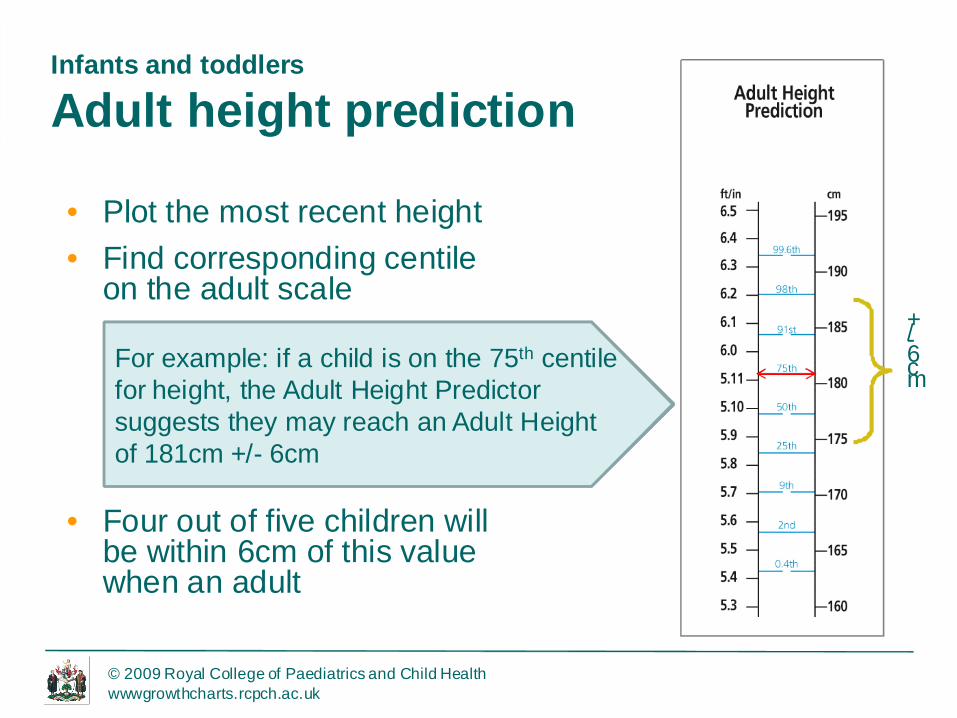
Infants and toddlers
Adult height prediction
• Plot the most recent height• Find corresponding centile
on the adult scale
• Four out of five children will be within 6cm of this value when an adult
For example: if a child is on the 75th centile for height, the Adult Height Predictor suggests they may reach an Adult Height of 181cm +/- 6cm
+/-6cm
© 2009 Royal College of Paediatrics and Child Health wwwgrowthcharts.rcpch.ac.uk
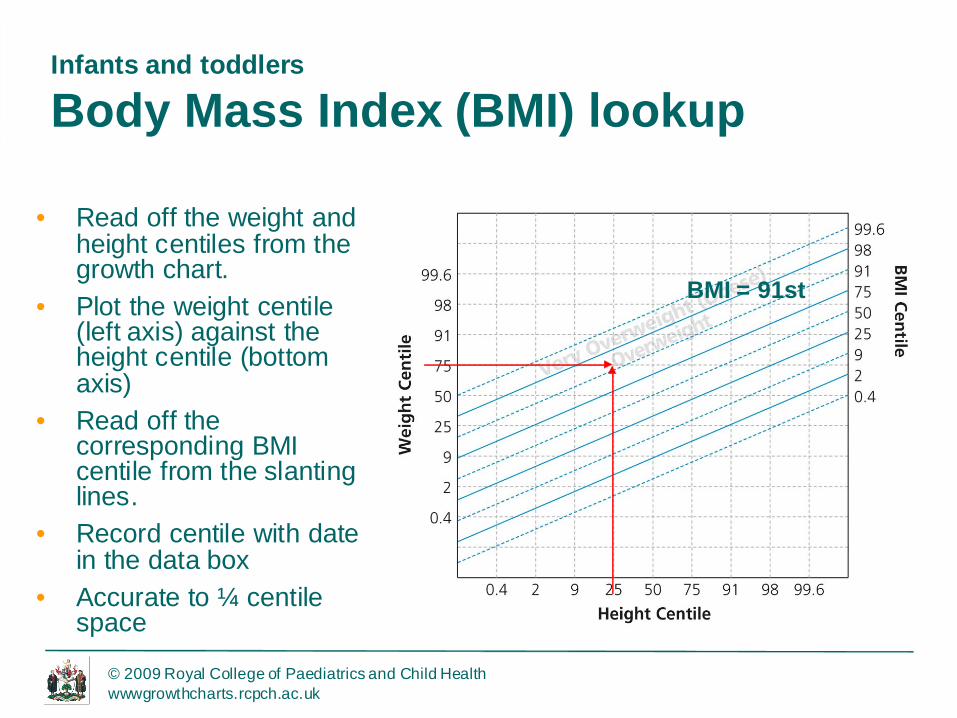
Infants and toddlers
Body Mass Index (BMI) lookup
BMI = 91st
• Read off the weight and height centiles from the growth chart.
• Plot the weight centile (left axis) against the height centile (bottom axis)
• Read off the corresponding BMI centile from the slanting lines.
• Record centile with date in the data box
• Accurate to ¼ centile space
“I just think nobody should be able to start plotting before they have had training – I think this would be a disaster waiting to happen”. Health Visitor
How will it make breastfed babies’ growth look?
Previous fantasy
Once we have the WHO charts, all weight concerns in breastfed babies ‘will be all right’.
Outcomes?
More accurate and appropriate growth monitoring?
Better understanding by parents?
Imprinting (optimal) breastfed growth as the normal pattern?
Increased confidence in breastfeeding?
Complex intervention
New chart
New centiles
Combination UK and WHO data
New instructions, based on evidence and focus groups
New information to parents
New features
Height predictor
BMI lookup
Education
Standard package
National recommendation to train staff
New chart features
General use of growth charts
www.rcpch.ac.uk/growthcharts
Thank you