Embed Size (px)
Citation preview

CDC-WHO Growth Charts
Special thanks to Washington State Department of Heath for allowing use of their materials.
June 2013
Colorado WIC Program

1 CDC-WHO Growth Charts
June 2013
Contents Contents ......................................................................... 1
Welcome to the CDC-WHO Growth Chart Training! ...... 2
Agenda ............................................................................ 2
Growth Charts are a Key Tool ......................................... 3
History of the Growth Charts ......................................... 3
Comparing the two Growth Charts ................................ 4
The WHO Hypothesis ..................................................... 5
Recommendation to Use the WHO Growth Charts ....... 5
Differences between the Charts ..................................... 6
Comparisons of charts .................................................... 8
Identifying risks ............................................................ 11

2 CDC-WHO Growth Charts
June 2013
Welcome to the CDC-WHO Growth Chart Training!
In 2006 the World Health Organization (WHO) published new growth standards. The
Center for Disease Control (CDC) released growth charts based on the WHO growth
standards. These are the new charts the Colorado WIC Program will be using. This
training will share information about the new charts and how we’ll implement them.
During this training we’ll use these terms when we talk about the charts:
CDC charts = the current charts we use in WIC
WHO charts = the new CDC-WHO charts we will be using soon
We are happy to share the new growth charts with you!
Agenda
Part 1: By the end of this section you will have:
Learned about the new charts and how they were created
Discovered the differences between the charts and identified trends in growth assessment with the new WHO growth charts
Seen the new WHO charts
Reviewed the new growth-related risks

3 CDC-WHO Growth Charts
June 2013
Growth Charts are a Key Tool
WIC uses growth charts to:
Assess growth
Identify potential nutrition or health concerns
Share information with caregivers
Have open conversations about growth, nutrition and healthy habits.
Keep these things in mind through-out this training and think about how they might be
affected by the new growth charts.
History of the Growth Charts
Growth charts have been around for at least a century! Here’s a brief review of the
recent history of the charts used in WIC.
A Growth Reference or a Growth Standard?
Growth Reference – Describes how certain children grew in a particular place and time.
It gives a point of comparison.
Growth Standard – Describes how healthy children should grow in a healthy environment regardless of time, place or ethnicity. It defines what is normal or optimal.
19
77
NC
HS National Center for
Health Statistics
From 1977 - 2000
Growth reference
20
00
CD
C
Center for Disease Control
Used since 2000
Growth reference
20
06
WH
O
World Health Organization
Released 2006
Growth standard
Physical growth is a way to assess the health and wellness of
infants and children.

4 CDC-WHO Growth Charts
June 2013
Comparing the two Growth Charts
This table shows the differences between the 2000 CDC and 2006 WHO growth charts.
Characteristic 2000 CDC Charts 2006 WHO Charts
Reference or Standard
Reference:
Describes growth of children in the U.S. during the 1970’s and 1980’s.
Standard:
Describes how children should grow under optimal conditions regardless of time, place, or ethnicity.
Data Limited number of measurements taken less often. Based on data from national health surveys and birth certificates in the U.S.
Large number of measurements taken frequently from birth to 24 months. Based on data taken in six world locations:
Pelotas, Brazil
Accra, Ghana
Delhi, India
Oslo, Norway
Muscat, Oman
Davis, California – U.S.
Requirements No special requirements to be included in the data.
Had to meet these requirements to be included in the data:
Adequate socioeconomic status to support growth
Access to health care and breastfeeding support
Full term birth
No smoking during pregnancy or breastfeeding
Exclusive or primarily breastfeeding > 4 months
Began feeding solids by 6 months
Continued breastfeeding > 12 months
Additional factors:
The American Academy of Pediatrics states that the healthy breastfed infant is the standard against which all other infants should be compared. The WHO charts are based on this premise.
The WHO charts were created with high quality data.
The WHO charts support the theory that optimal nutrition + optimal environment + optimal care = optimal growth regardless of time, place or ethnicity.

5 CDC-WHO Growth Charts
June 2013
The WHO Hypothesis
Children throughout the world will grow similarly if exposed to optimal circumstances.
This chart shows the birth to 24 months growth data from the 6 WHO countries.
Recommendation to Use the WHO Growth Charts
The Center for Disease Control (CDC), the National Institutes of Health (NIH), and the
American Academy of Pediatrics (AAP) recommend using the WHO growth charts for
children birth to 24 months in the United States.
USDA accepts the recommendation for WIC.
“For the first time, we now have a technically robust tool to measure,
monitor and evaluate the growth of all children worldwide, regardless of
ethnicity, socioeconomic status or type of feeding.”
WHO Committee Member
Colorado WIC will use these growth charts:
WHO growth charts for children 0 – 24 months of age
Length/Age & Weight/Age, Weight/Length & Head Circumference/Age
CDC growth charts for children 2 – 5 years old
Height/Age & Weight/Age and BMI/Age
CDC weight/length and length/age charts for children 24 - 36 months who can’t be measured standing up. These charts are for education only.

6 CDC-WHO Growth Charts
June 2013
Differences between the Charts
In general the WHO charts show a higher rate of weight gain in the first months of life, then the rate of weight gain tapers off from 6 to 23 months compared to the CDC growth charts. The chart below shows this comparison.
“The healthy breastfed infant is the standard against which all other infants should be compared.”
American Academy of Pediatrics
The WHO charts show a different pattern
of growth than the CDC charts.
WHO measured healthy children under
ideal conditions.
Breastfed infants and children were the
standard.

7 CDC-WHO Growth Charts
June 2013
Differences between the Charts
Here are some of the differences you may notice with the
WHO growth charts:
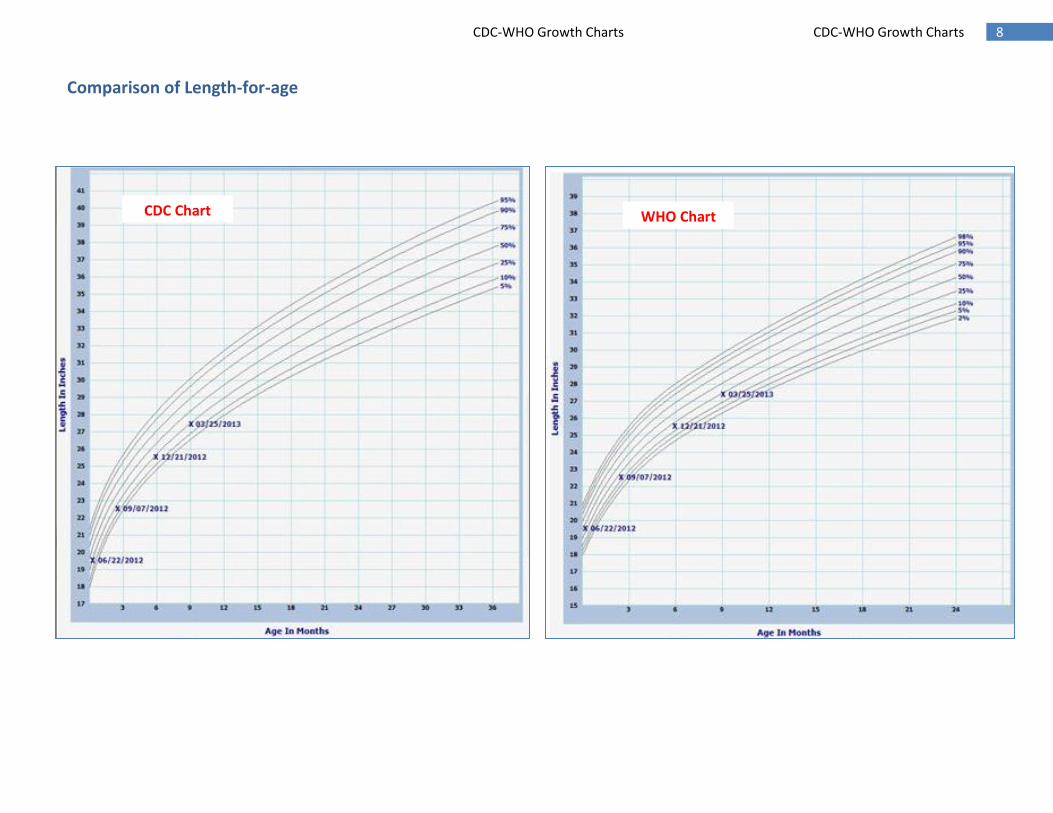
Length-for-age:
Slightly more infants and children will plot in the lower length-for-age percentiles.
Weight-for-age:
Fewer infants and children will be identified with low weight-for-age, especially between 6 and 23 months of age.
Weight-for-length:
Slightly lower number of infants and children with
low weight-for-length.
Fewer infants and children with high weight-for-length.
This bar graph compares the growth patterns between the CDC and WHO growth charts.
The WHO charts use different percentiles to identify nutrition risks.
WHO growth standards are based on healthy children living in optimal conditions so more extreme cutoffs are used to identify nutrition risk.
Use new cutoffs at the 2nd and 98th percentiles on the WHO charts.
We’ll continue to use the 5th and 95th percentiles on the CDC growth charts for older
children.
8 CDC-WHO Growth Charts CDC-WHO Growth Charts
Comparison of Length-for-age
CDC Chart WHO Chart

9 CDC-WHO Growth Charts
Comparison of Weight-for-age
CDC Chart WHO Chart

10 CDC-WHO Growth Charts
Comparison of Weight-for-length
CDC Chart WHO Chart

11 CDC-WHO Growth Charts CDC-WHO Growth Charts
Identifying risks
This table lists all the risk changes related to the new WHO growth charts. Bolded risks indicate high risk nutrition
risk factors. Highlighted risks are new Colorado WIC nutrition risk factors.
* Assignment of NRF 121A and 121B for premature infants is based on adjusted gestational age.
Note: Children 24-36 months measured recumbently will no longer be plotted on the 0-36 month CDC chart.
They will be plotted on the 2-5 year CDC chart. Staff will indicate an inaccurate reason for a child measured
recumbently after 24 months of age; the recumbent check box has been removed from the Anthropometric
panel in Compass.
Special considerations with Compass switch to WHO charts
With the new release, the 0-36 month CDC charts will be removed from Compass. All the previous growth measurements
will be transferred to the new WHO 0-24 month charts. Thus, prior assessment and risking may not match the percentile
of the plot point in the new WHO growth charts.
Category NRF Current Risks New Risks
Infant 103B Weight/Length < 5th Weight/Length < 2nd
Infant 103A Weight/Length > 5th and < 10th Weight/Length > 2nd and < 5th
Infant 115 No overweight risk for infants Weight/Length > 98th
Infant 121B* Length/Age < 5th Length/Age < 2nd
Infant 121A* Length/Age < 10th Length/Age >2nd and < 5th
Child 103B Weight/Length < 5th Weight/Length < 2nd (12 to < 24 months)
Child 103A Weight/Length > 5th and < 10th Weight/Length > 2nd and < 5th (12 to < 24 months)
Child 115 No overweight risk for children 12–24 months
Weight/Length > 98th (12 to < 24 months)
Child 121B Length/Age < 5th Length/Age < 2nd (12 to < 24 months)
Child 121A Length/Age < 10th Length/Age >2nd and < 5th (12 to < 24 months)


![Growth+Charts+2 20[1]](https://img.pdfslide.us/doc/110x75/577d25411a28ab4e1e9e620d/growthcharts2-201.jpg)