Embed Size (px)
Citation preview
UK Biodiversity Partnership Standing Committee (UKBPSC)
23 April 2009
UK Biodiversity Indicators: 2009 update (UK SC 09-07)
For other UKBPSC papers and minutes of UKBPSC meetings visit http:// www.jncc.gov.uk/page-5699
For more information about the UK Biodiversity Action Plan (UK BAP) visit
http://www.jncc.gov.uk/page-5155
2
UK BIODIVERSITY INDICATORS: PROGRESS UPDATE Mark Stevenson on behalf of the UK Biodiversity Indicators Steering Group 02.04.09 1. Background 1.1. In October 2006, the UK Biodiversity Partnership Standing Committee
(UKSC) agreed to develop a set of 18 UK indicators. The indicators would provide evidence for assessing progress with commitments to halt or significantly reduce the rate of biodiversity loss. A Steering Group, with representatives from the devolved administrations, the four Country Agencies, and Wildlife and Countryside Link was established to oversee indicator development.
1.2. In May 2007, 14 indicators were published for the first time. They were published in summary form in UK Biodiversity Indicators in Your Pocket (BIYP), and in expanded form on www.jncc.gov.uk/biyp. The published versions included information on the work underway to develop the remaining four indicators.
1.3. UKSC committed to updating the indicators in 2008; developing the four outstanding indicators for future publication1 and producing a full update of BIYP in 2009.
1.4. The expanded version of the UK Biodiversity Indicators 2009 update, with 17 completed indicators, was published on the JNCC website on 3rd April 2009 and subsequently incorporated into the 4th National Report to the Convention on Biological Diversity
2. Recommendation 2.1. The Standing Committee is asked to note the content of the draft copy of
UK Biodiversity Indicators in Your Pocket 2009 (Annex 1). This will be finalised over the next few weeks and published as a hard copy A6 booklet on 22nd May 2009.
2.2. The Standing Committee is asked to note the changes to the Terms of Reference for the UK Biodiversity Indicators Steering Group (Annex 2) to comply with the provisions of the 2007 Statistics and Registration Act. In particular it is envisaged that the group will advise UKSC on revisions to the indicator set to ensure they remain relevant to current and future biodiversity targets.
2.3. The Standing Committee is also asked to comment on the proposals for publishing in 2010, which includes a partial web-based update in May 2010 and the option for a hard-copy ‘policy or Partnership response’ document in September 2010.
1 Genetic diversity in farm animals and crop plants, invasive non-native species, habitat connectivity and an indicator of marine ecosystem integrity.
3. Progress in 2009
3.1. The draft text for BIYP2009 is given in Annex 1. Overall, 23 (72%) of the 32 measures (in the 17 indicators which are assessed) are ‘improving’ or show ‘little or no overall change’ since the year 2000. This compares favourably with the long-term assessment (10 of the 32 measures) and with the 2008 ‘since-2000’ assessment (Annex 3, 19 (66%) of the 29 measures). There are three caveats to bear in mind when comparing short-term and long-term assessments:
• There is a higher proportion of long-term ‘insufficient data’ assessments compared with the short-term.
• Detection of change, particularly in the sample-based indicators such as butterfly populations, is more difficult in the shorter term (i.e. it is easier to detect change in a longer data run).
• Some indicators (Priority Species, Priority Habitats and Fish Stocks) measure rate of change, so the assessments shows the change in the rate of decline (i.e. a green light means a slowing in the rate of decline – an improvement – rather than a population increase).
3.2. There has been some further deterioration in selected ‘status’ measures when compared with the 2008 assessment (Annex 2). For example, ‘seabirds’ and ‘farmland birds’ now show a decline since 2000. In addition the data from Countryside Survey 2007 (which were not available for last year’s publication), although recording an increase in plant species richness in arable land since 2000, show ongoing deterioration in woodland, grassland and boundary habitats.
3.3. BIYP2009 (and the web version of the indicators) includes three new indicators and updates 13 of the remaining 14 indicators. One indicator (Biological River Quality) could not be updated due to changes to the river sampling strategy in each of the four countries.
3.4. The three new indicators, are: • Genetic diversity in selected breeds of farm animals.
• Impact of Invasive Species.
• Proportion of large fish in North Sea Populations.
3.5. It was not possible to finalise the indicator of habitat connectivity prior to publication. A progress update is provided on the website and the full version is likely to be ready by May 2010. An assessment of change in condition for UK protected sites is also likely to be available for the May 2010 update.
4. Changes to the Terms of Reference for the UK Biodiversity Indicators Steering Group
4.1. The UK Biodiversity Indicators are National Statistics. The 2007 Statistics and Registration Act places restrictions on the circulation of National Statistics prior to publication. Guidelines on the Act were strengthened in
3
2008 and Defra senior statisticians have advised that indicators should be circulated in advance of publication to a limited number of people, solely for the purpose of validating and quality assuring the indicators.
4.2. This advice has been implemented for the 2009 update. The Steering Group has only seen and commented on indicators that are newly developed or have been substantially refined to ensure that they are fit for purpose.
4.3. The implications of these changes is that the Steering Group can no longer act as a body to sign off the indicators, and its terms of reference have been revised to reflect the emerging role of the Group as a review and advisory body.
4.4. In particular, it is envisaged that the Steering Group will keep the indicators under review and make recommendations to UKSC to ensure that the indicators remain current and relevant, particularly under the following circumstances: • Supply of data stops or the basis of the data collection changes
significantly, as is happening or likely to happen for the indicators on status of UK BAP Species and Habitats, River Quality and the Condition of Protected Sites.
• To address issues of public understanding, obvious gaps or improved data sources. The most obvious gap at present is absence of a measure on plants in the indicator on genetic diversity.
• New biodiversity targets are introduced post-2010. Whilst the indicator set has been designed to be relevant beyond 2010, a significant change to the biodiversity target, for example to provide a greater focus on ecosystem services, might require changes to the indicator set.
4
5. Plans for publication in 2010. 5.1 The 4th National Report will be submitted to the CBD Secretariat in May
2009. Global Biodiversity Outlook 3, which will draw on information in the National Reports, will be produced in 2010, prior to the next Conference of the Parties (COP) in October 2010.
5.2 It would be possible to publish an update to the UK indicators in May 2010, prior to the 2010 COP. Indicator data are supplied on varying cycles and so only 12 of the 18 indicators could be updated in 2010 (although this should include Habitat Connectivity and Protected Site Condition). Table 1 overleaf gives details of the indicators and component measures which can be updated in 2010.
5.3 The Steering Group propose that 12 indicators are updated in May 2010, in web-form only (either in summary or expanded format). It would also be possible to produce a policy or Partnership response document in September 2010 for circulation at COP2010, although no decision has been taken about how this would be co-ordinated or resourced.
Mark Stevenson 3rd April 2009
5
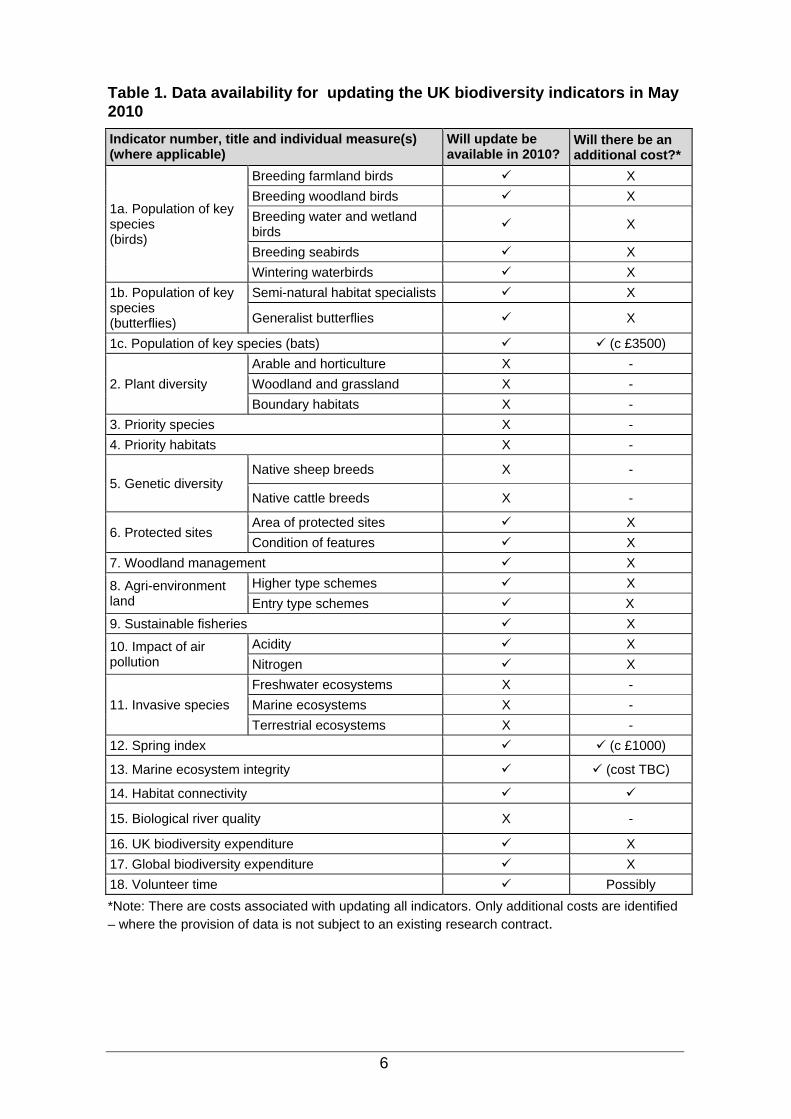
Table 1. Data availability for updating the UK biodiversity indicators in May 2010 Indicator number, title and individual measure(s) (where applicable)
Will update be available in 2010?
Will there be an additional cost?*
1a. Population of key species (birds)
Breeding farmland birds X Breeding woodland birds X Breeding water and wetland birds X
Breeding seabirds X Wintering waterbirds X
1b. Population of key species (butterflies)
Semi-natural habitat specialists X
Generalist butterflies X
1c. Population of key species (bats) (c £3500)
2. Plant diversity Arable and horticulture X - Woodland and grassland X - Boundary habitats X -
3. Priority species X - 4. Priority habitats X -
5. Genetic diversity Native sheep breeds X -
Native cattle breeds X -
6. Protected sites Area of protected sites X Condition of features X
7. Woodland management X
8. Agri-environment land
Higher type schemes X Entry type schemes X
9. Sustainable fisheries X
10. Impact of air pollution
Acidity X Nitrogen X
11. Invasive species Freshwater ecosystems X - Marine ecosystems X - Terrestrial ecosystems X -
12. Spring index (c £1000)
13. Marine ecosystem integrity (cost TBC)
14. Habitat connectivity
15. Biological river quality X -
16. UK biodiversity expenditure X 17. Global biodiversity expenditure X 18. Volunteer time Possibly *Note: There are costs associated with updating all indicators. Only additional costs are identified – where the provision of data is not subject to an existing research contract.
6
7
Annex 1. Draft text for UK Biodiversity Indicators in Your Pocket 2009 UK Biodiversity Indicators 2009
Introduction
Biodiversity is the variety of life on earth. It includes the diversity of individual species, the genetic diversity within species and the range of ecosystems that support them. The UK Government has committed to two important international targets to protect biodiversity:
1. In 2001, European Union Heads of State or Government agreed that biodiversity decline should be halted with the aim of reaching this objective by 20102
2. In 2002, Heads of State at the United Nations World Summit on Sustainable Development committed themselves to achieve, by 2010, a significant reduction of the current rate of biodiversity loss at the global, regional and national level, as a contribution to poverty alleviation and to the benefit of all life on Earth3
A suite of biodiversity indicators for the UK was first published in June 2007. The indicators show changes in aspects of biodiversity such as the population size of important species or the area of land managed for wildlife. They provide part of the evidence to assess whether the targets set out above have been achieved. Eighteen UK biodiversity indicators are presented in this document, although one, habitat connectivity, is still under development and presented with limited data. The indicators are grouped under the six focal areas aligned to those used by the Convention on Biological Diversity and in the European biodiversity indicators:
1. Status and trends in components of biodiversity 2. Sustainable use 3. Threats to biodiversity 4. Ecosystem integrity and ecosystem goods and services 5. Status of resource transfers and use 6. Public awareness and participation
Whilst indicators are useful tools for summarising broad trends and highlighting high-level messages, they can never describe all the changes in the UK’s biodiversity. They are best seen, as their name suggests, as indicative of the general state of biodiversity. Whilst they will form the basis of the UK’s assessment of progress towards the biodiversity targets, other factors and sources of information are being taken into account.
2 ec.europa.eu/environment/nature 3 www.un.org/esa/sustdev/sdissues/biodiversity/biod.htm
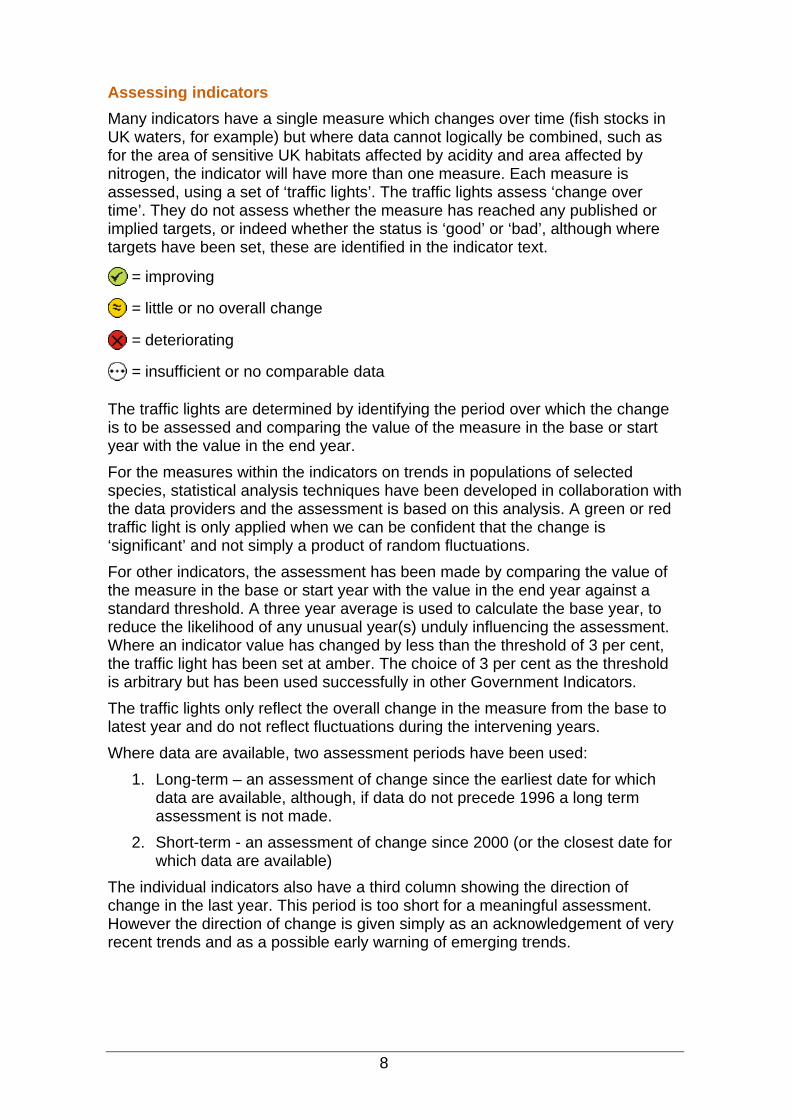
Assessing indicators Many indicators have a single measure which changes over time (fish stocks in UK waters, for example) but where data cannot logically be combined, such as for the area of sensitive UK habitats affected by acidity and area affected by nitrogen, the indicator will have more than one measure. Each measure is assessed, using a set of ‘traffic lights’. The traffic lights assess ‘change over time’. They do not assess whether the measure has reached any published or implied targets, or indeed whether the status is ‘good’ or ‘bad’, although where targets have been set, these are identified in the indicator text.
= improving
= little or no overall change
= deteriorating
= insufficient or no comparable data
The traffic lights are determined by identifying the period over which the change is to be assessed and comparing the value of the measure in the base or start year with the value in the end year. For the measures within the indicators on trends in populations of selected species, statistical analysis techniques have been developed in collaboration with the data providers and the assessment is based on this analysis. A green or red traffic light is only applied when we can be confident that the change is ‘significant’ and not simply a product of random fluctuations. For other indicators, the assessment has been made by comparing the value of the measure in the base or start year with the value in the end year against a standard threshold. A three year average is used to calculate the base year, to reduce the likelihood of any unusual year(s) unduly influencing the assessment. Where an indicator value has changed by less than the threshold of 3 per cent, the traffic light has been set at amber. The choice of 3 per cent as the threshold is arbitrary but has been used successfully in other Government Indicators. The traffic lights only reflect the overall change in the measure from the base to latest year and do not reflect fluctuations during the intervening years. Where data are available, two assessment periods have been used:
1. Long-term – an assessment of change since the earliest date for which data are available, although, if data do not precede 1996 a long term assessment is not made.
2. Short-term - an assessment of change since 2000 (or the closest date for which data are available)
The individual indicators also have a third column showing the direction of change in the last year. This period is too short for a meaningful assessment. However the direction of change is given simply as an acknowledgement of very recent trends and as a possible early warning of emerging trends.
8
9
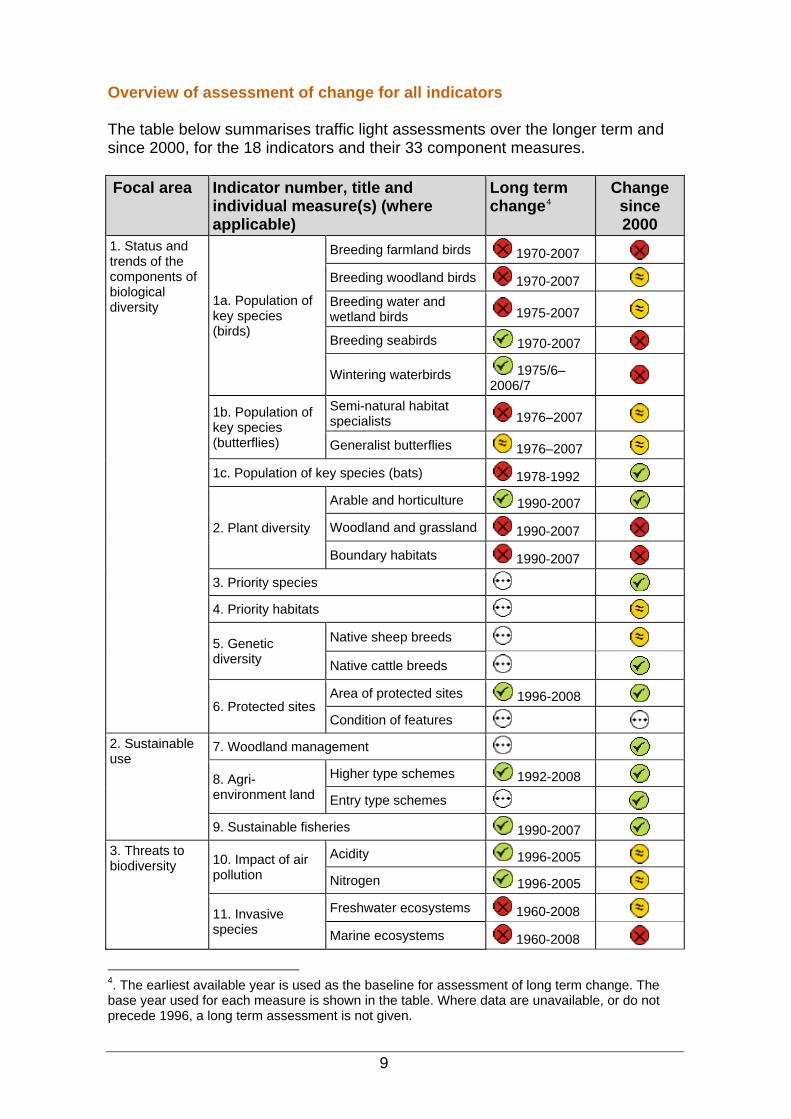
Overview of assessment of change for all indicators
The table below summarises traffic light assessments over the longer term and since 2000, for the 18 indicators and their 33 component measures.
Focal area Indicator number, title and individual measure(s) (where applicable)
Long term change4
Change since 2000
1. Status and trends of the components of biological diversity 1a. Population of
key species (birds)
Breeding farmland birds 1970-2007
Breeding woodland birds 1970-2007
Breeding water and wetland birds 1975-2007
Breeding seabirds 1970-2007
Wintering waterbirds 1975/6–2006/7
1b. Population of key species (butterflies)
Semi-natural habitat specialists 1976–2007
Generalist butterflies 1976–2007
1c. Population of key species (bats) 1978-1992
2. Plant diversity
Arable and horticulture 1990-2007
Woodland and grassland 1990-2007
Boundary habitats 1990-2007
3. Priority species
4. Priority habitats
5. Genetic diversity
Native sheep breeds
Native cattle breeds
6. Protected sites Area of protected sites 1996-2008
Condition of features
2. Sustainable use
7. Woodland management
8. Agri-environment land
Higher type schemes 1992-2008
Entry type schemes
9. Sustainable fisheries 1990-2007
3. Threats to biodiversity 10. Impact of air
pollution Acidity 1996-2005
Nitrogen 1996-2005
11. Invasive species
Freshwater ecosystems 1960-2008
Marine ecosystems 1960-2008
4. The earliest available year is used as the baseline for assessment of long term change. The base year used for each measure is shown in the table. Where data are unavailable, or do not precede 1996, a long term assessment is not given.
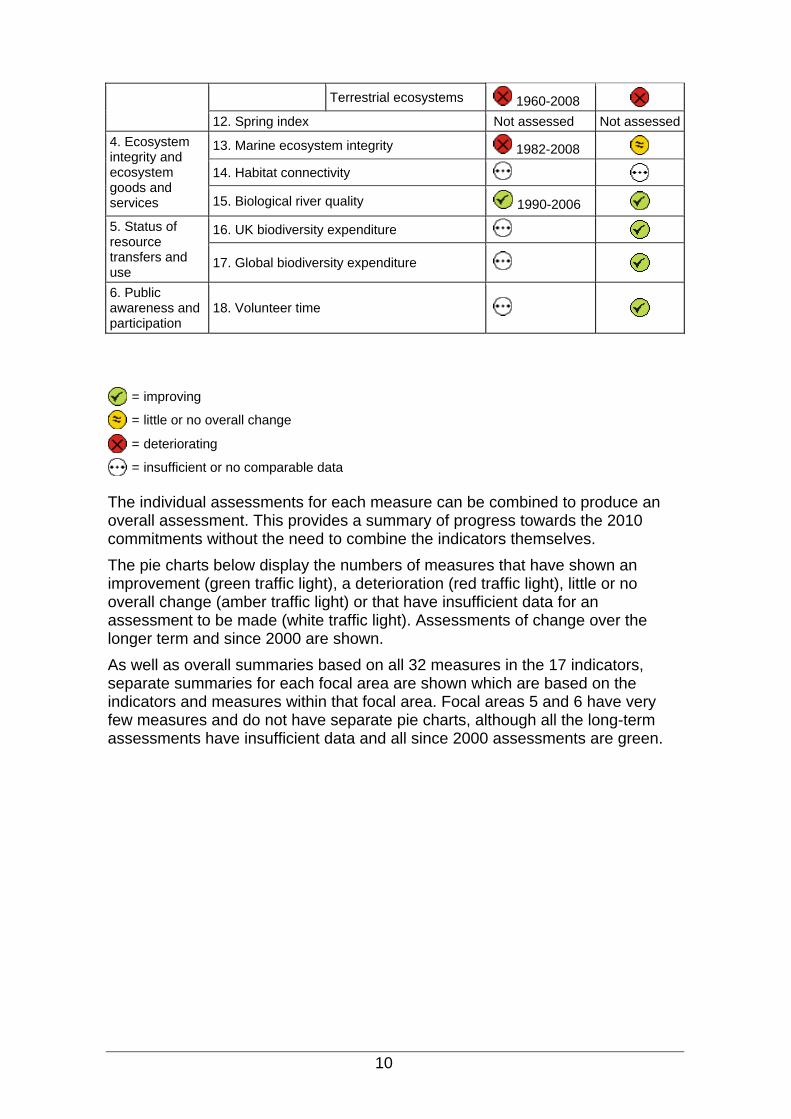
Terrestrial ecosystems 1960-2008
12. Spring index Not assessed Not assessed4. Ecosystem integrity and ecosystem goods and services
13. Marine ecosystem integrity 1982-2008
14. Habitat connectivity
15. Biological river quality 1990-2006
5. Status of resource transfers and use
16. UK biodiversity expenditure
17. Global biodiversity expenditure
6. Public awareness and participation
18. Volunteer time
= improving
= little or no overall change
= deteriorating
= insufficient or no comparable data The individual assessments for each measure can be combined to produce an overall assessment. This provides a summary of progress towards the 2010 commitments without the need to combine the indicators themselves. The pie charts below display the numbers of measures that have shown an improvement (green traffic light), a deterioration (red traffic light), little or no overall change (amber traffic light) or that have insufficient data for an assessment to be made (white traffic light). Assessments of change over the longer term and since 2000 are shown. As well as overall summaries based on all 32 measures in the 17 indicators, separate summaries for each focal area are shown which are based on the indicators and measures within that focal area. Focal areas 5 and 6 have very few measures and do not have separate pie charts, although all the long-term assessments have insufficient data and all since 2000 assessments are green.
10
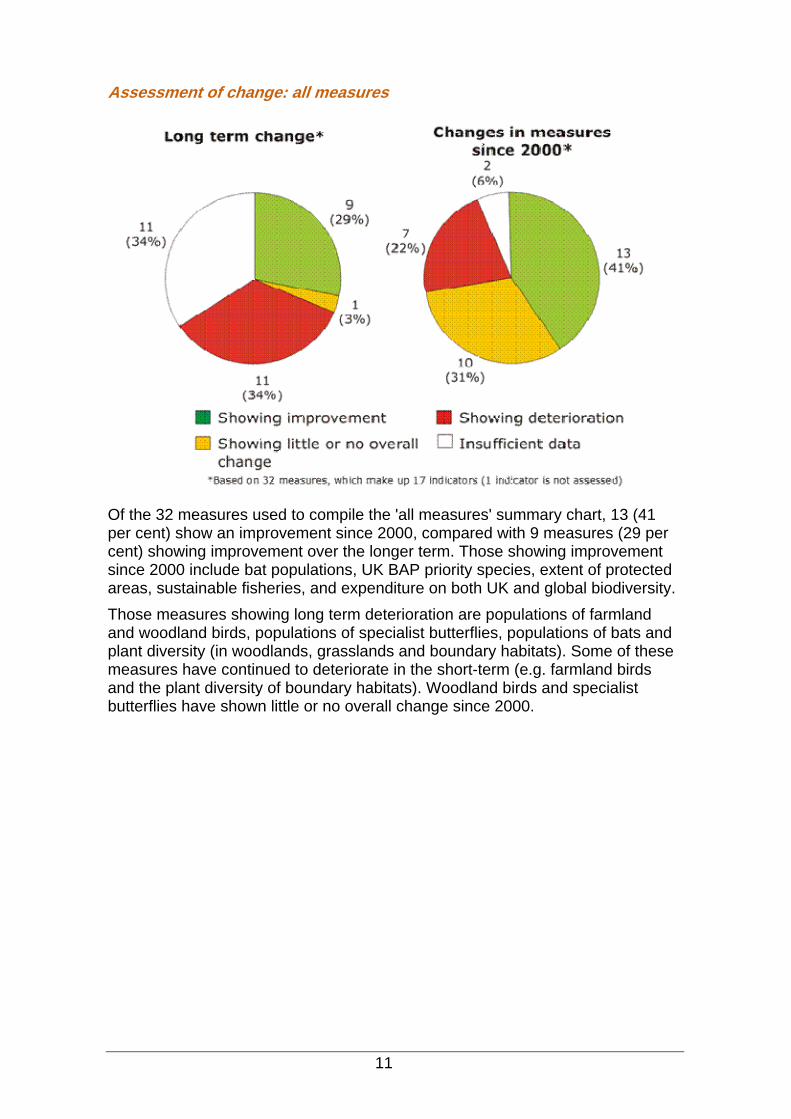
Assessment of change: all measures
Of the 32 measures used to compile the 'all measures' summary chart, 13 (41 per cent) show an improvement since 2000, compared with 9 measures (29 per cent) showing improvement over the longer term. Those showing improvement since 2000 include bat populations, UK BAP priority species, extent of protected areas, sustainable fisheries, and expenditure on both UK and global biodiversity. Those measures showing long term deterioration are populations of farmland and woodland birds, populations of specialist butterflies, populations of bats and plant diversity (in woodlands, grasslands and boundary habitats). Some of these measures have continued to deteriorate in the short-term (e.g. farmland birds and the plant diversity of boundary habitats). Woodland birds and specialist butterflies have shown little or no overall change since 2000.
11
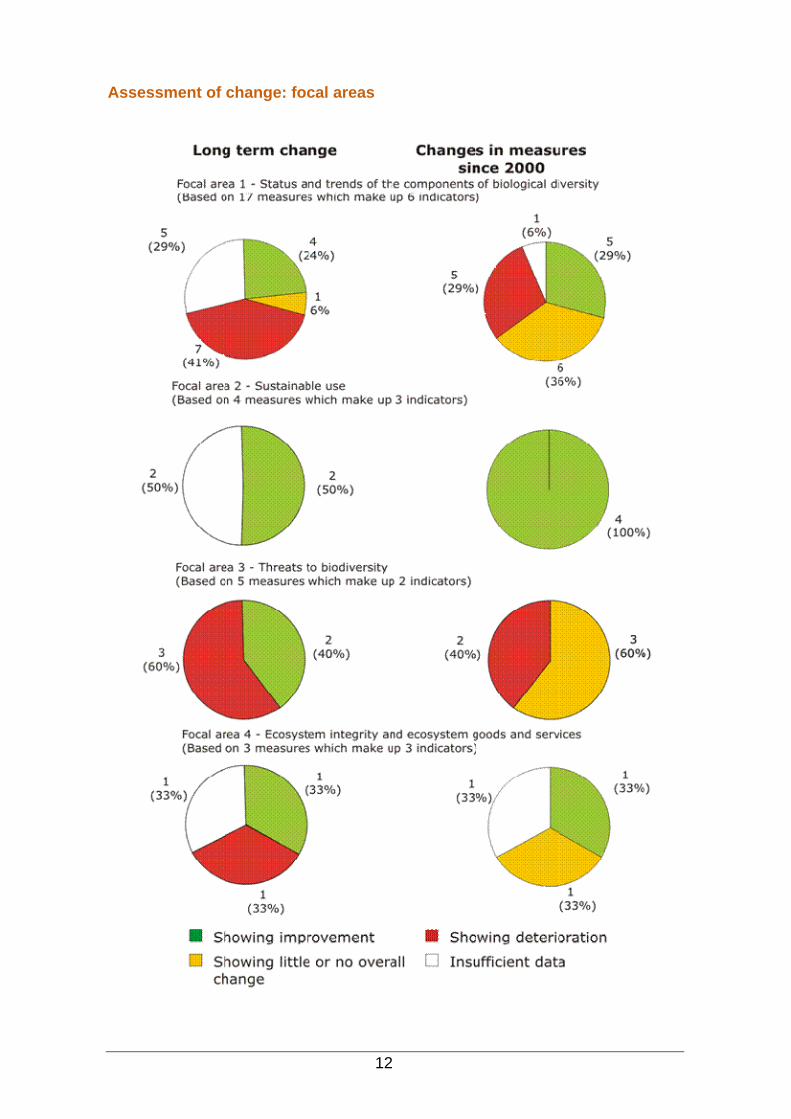
Assessment of change: focal areas
12
There were long-term declines for 7 measures (41 per cent) within focal area 1, reflecting the very large declines in bird, butterfly and bat populations seen in the 1970s and 80s. Since 2000 these long term declines have generally slowed, with some measures previously assessed as deteriorating showing either improvement or little or no overall change since 2000. These conclusions should be viewed with some caution as changes are more difficult to assess over the short term. Two measures within focal area 1, breeding seabirds and wintering waterbirds, have changed from a long term improving assessment to deteriorating since 2000. The indicators in focal area 3 and 4 show little difference in their short-term assessments. Focal area 3 has the greatest proportion of red and amber assessments in both the long and short-term, reflecting a pattern of continuing or growing threat to biodiversity in the UK.
13
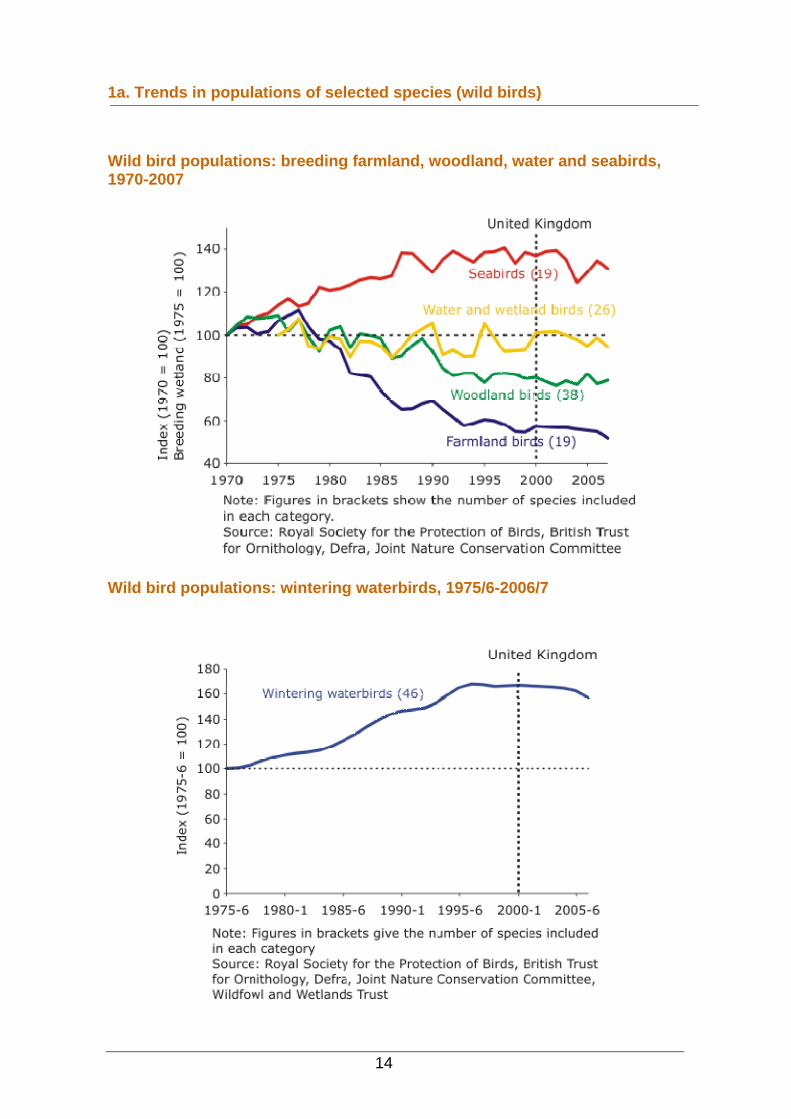
1a. Trends in populations of selected species (wild birds)
Wild bird populations: breeding farmland, woodland, water and seabirds, 1970-2007
Wild bird populations: wintering waterbirds, 1975/6-2006/7
14
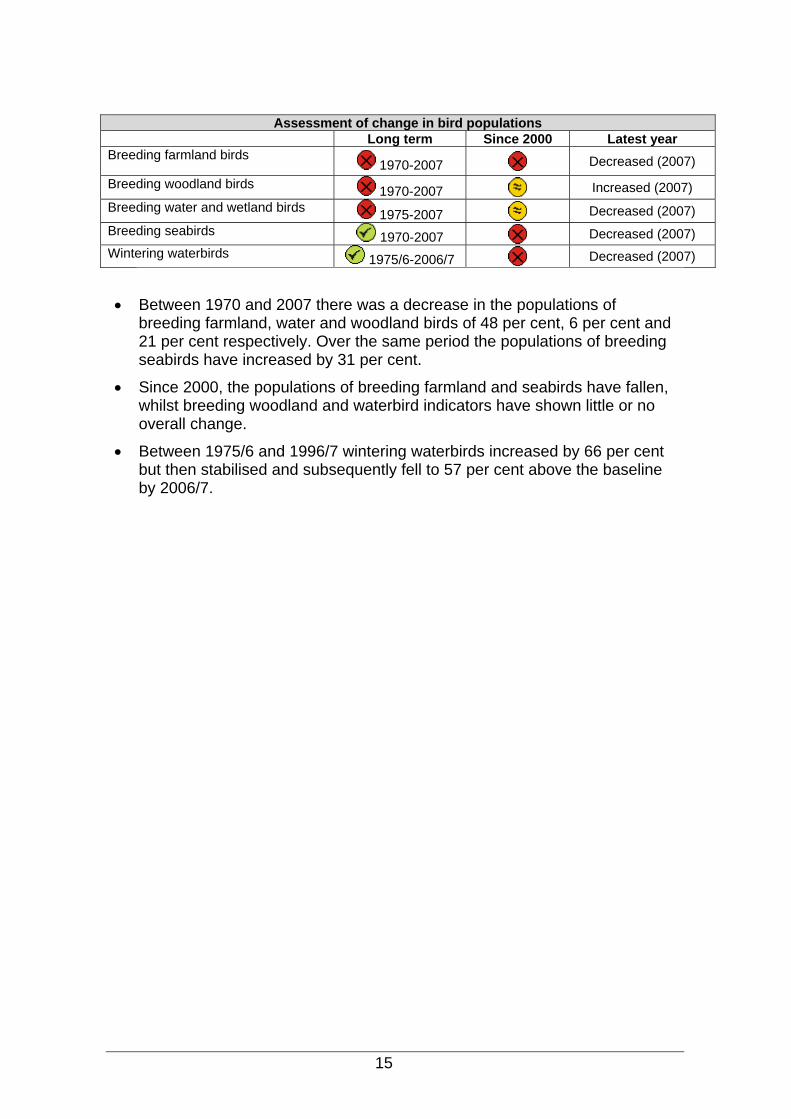
Assessment of change in bird populations Long term Since 2000 Latest year Breeding farmland birds
1970-2007 Decreased (2007)
Breeding woodland birds 1970-2007 Increased (2007) Breeding water and wetland birds 1975-2007 Decreased (2007) Breeding seabirds 1970-2007 Decreased (2007) Wintering waterbirds 1975/6-2006/7 Decreased (2007)
• Between 1970 and 2007 there was a decrease in the populations of breeding farmland, water and woodland birds of 48 per cent, 6 per cent and 21 per cent respectively. Over the same period the populations of breeding seabirds have increased by 31 per cent.
• Since 2000, the populations of breeding farmland and seabirds have fallen, whilst breeding woodland and waterbird indicators have shown little or no overall change.
• Between 1975/6 and 1996/7 wintering waterbirds increased by 66 per cent but then stabilised and subsequently fell to 57 per cent above the baseline by 2006/7.
15
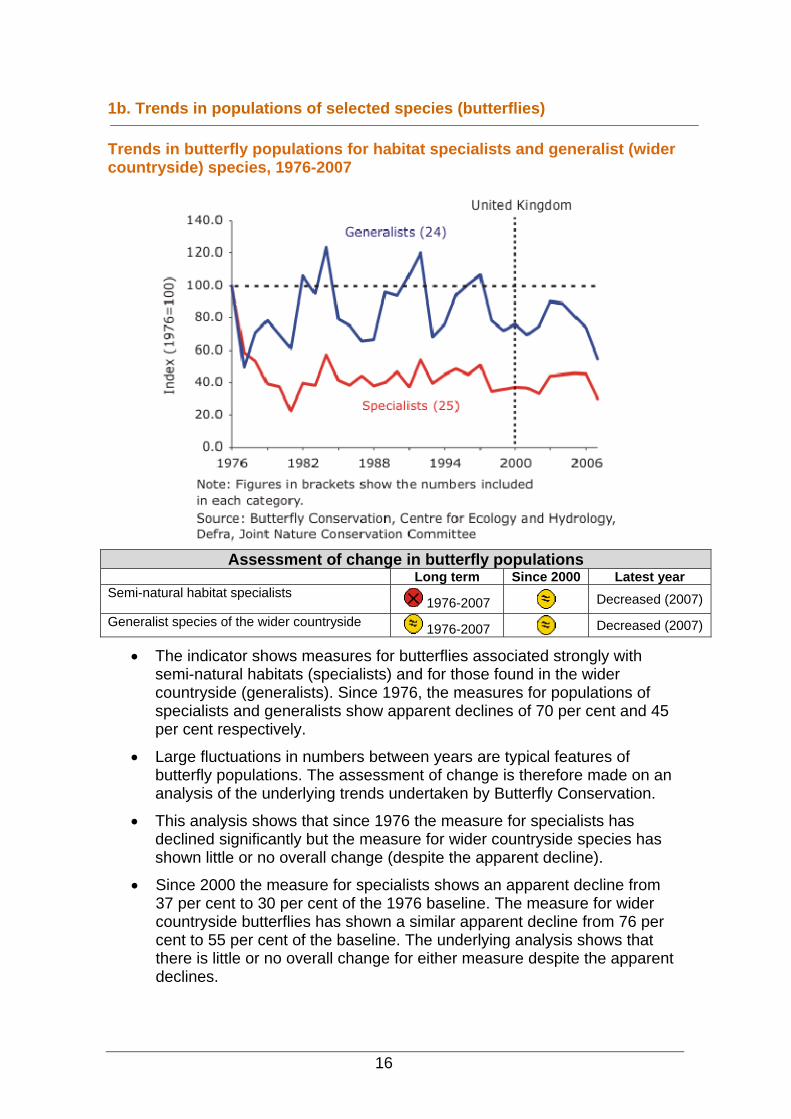
1b. Trends in populations of selected species (butterflies) Trends in butterfly populations for habitat specialists and generalist (wider countryside) species, 1976-2007
Assessment of change in butterfly populations
Long term Since 2000 Latest year Semi-natural habitat specialists
1976-2007 Decreased (2007)
Generalist species of the wider countryside 1976-2007 Decreased (2007)
• The indicator shows measures for butterflies associated strongly with semi-natural habitats (specialists) and for those found in the wider countryside (generalists). Since 1976, the measures for populations of specialists and generalists show apparent declines of 70 per cent and 45 per cent respectively.
• Large fluctuations in numbers between years are typical features of butterfly populations. The assessment of change is therefore made on an analysis of the underlying trends undertaken by Butterfly Conservation.
• This analysis shows that since 1976 the measure for specialists has declined significantly but the measure for wider countryside species has shown little or no overall change (despite the apparent decline).
• Since 2000 the measure for specialists shows an apparent decline from 37 per cent to 30 per cent of the 1976 baseline. The measure for wider countryside butterflies has shown a similar apparent decline from 76 per cent to 55 per cent of the baseline. The underlying analysis shows that there is little or no overall change for either measure despite the apparent declines.
16
1c. Trends in populations of selected species (bats)
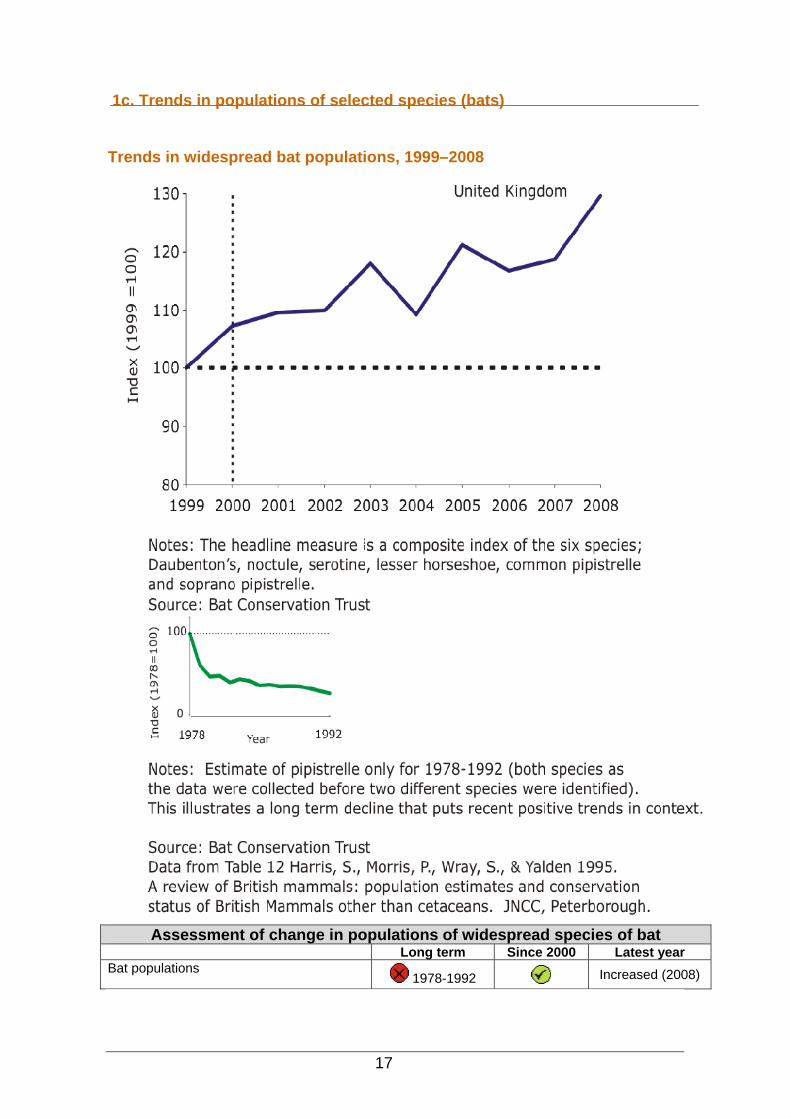
Trends in widespread bat populations, 1999–2008
Assessment of change in populations of widespread species of bat
Long term Since 2000 Latest year Bat populations
1978-1992 Increased (2008)
17
• Bat populations are considered to be a good indicator of the broad state of wildlife and environmental quality because bats are sensitive to pressures experienced by many other taxa.
• Bats have undergone severe declines historically. However since 2000, populations of bat species included in the indicatorhave increased by 21 per cent.
18
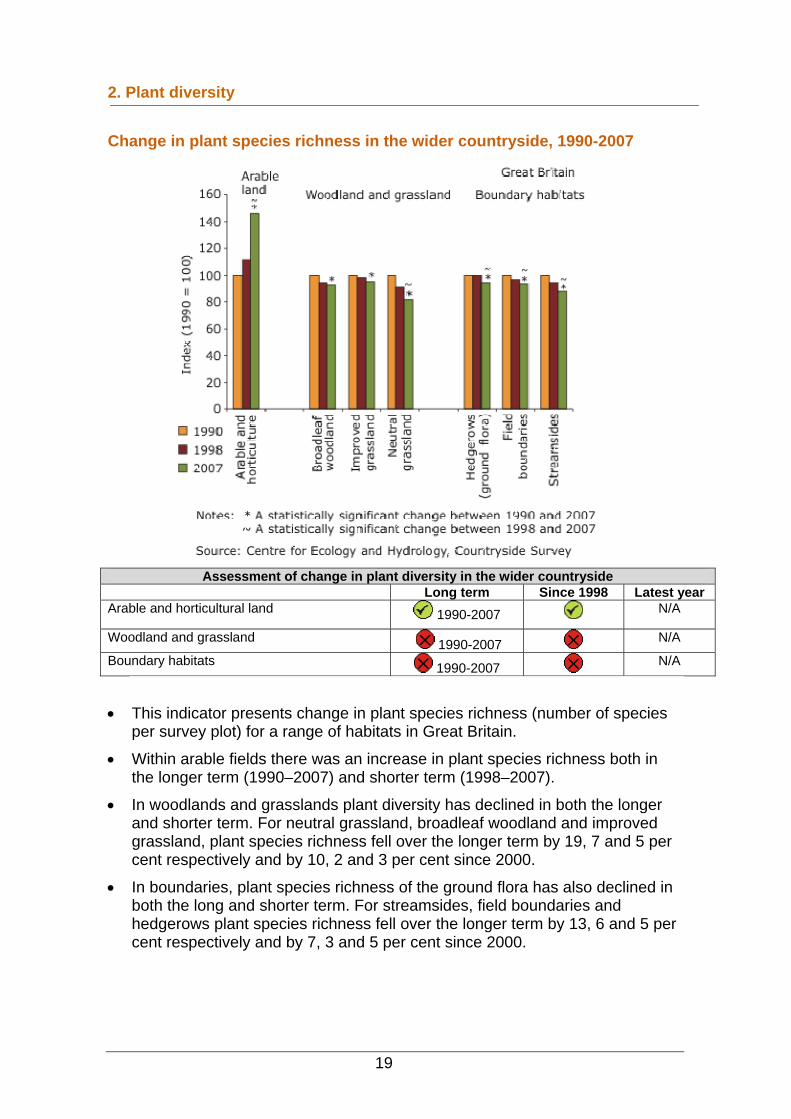
2. Plant diversity Change in plant species richness in the wider countryside, 1990-2007
Assessment of change in plant diversity in the wider countryside
Long term Since 1998 Latest year Arable and horticultural land 1990-2007 N/A
Woodland and grassland 1990-2007 N/A
Boundary habitats 1990-2007 N/A
• This indicator presents change in plant species richness (number of species per survey plot) for a range of habitats in Great Britain.
• Within arable fields there was an increase in plant species richness both in the longer term (1990–2007) and shorter term (1998–2007).
• In woodlands and grasslands plant diversity has declined in both the longer and shorter term. For neutral grassland, broadleaf woodland and improved grassland, plant species richness fell over the longer term by 19, 7 and 5 per cent respectively and by 10, 2 and 3 per cent since 2000.
• In boundaries, plant species richness of the ground flora has also declined in both the long and shorter term. For streamsides, field boundaries and hedgerows plant species richness fell over the longer term by 13, 6 and 5 per cent respectively and by 7, 3 and 5 per cent since 2000.
19
20
3. Status of UK Biodiversity Action Plan Priority Species
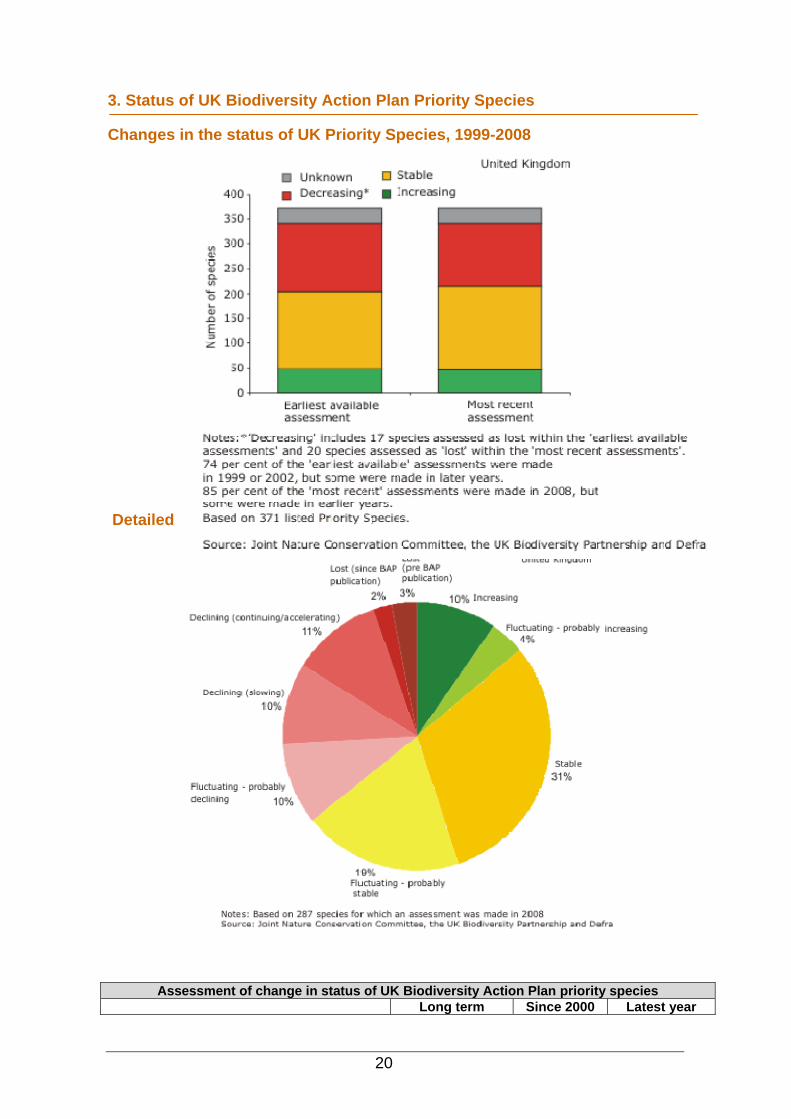
Changes in the status of UK Priority Species, 1999-2008
Detailed status of UK Priority Species in 2008
Assessment of change in status of UK Biodiversity Action Plan priority species Long term Since 2000 Latest year
21
Priority Species that are stable or increasing
Not available
• The UK Biodiversity Action Plan is the UK’s national biodiversity strategy produced in response to the Convention on Biological Diversity. The Plan was revised in 2007 and the number of priority species increased but the indicator is based on the 371 species which were assessed between 1999 and 2008.
• An assessment of the status of the priority species has been provided every three years by experts across the UK.
• A status assessment is available in at least one of the assessment years for 339 species. 32 species have had an unknown status over the period.
• Based on a comparison of the earliest available and most recent assessment for each species, the number either ‘stable’ or ‘increasing’ in number or extent has risen by 3.5 per cent from 202 to 214. The number decreasing (or lost) fell from 137 to 125.
• Despite this modest improvement, the number of species assessed as ‘increasing’ has fallen from 48 to 45, 89 are still declining and 6 have been lost from the UK since the Plan was published in 1994. Even those that are stable may have populations well below target levels.
22 22
4. Status of UK Biodiversity Action Plan Priority Habitats
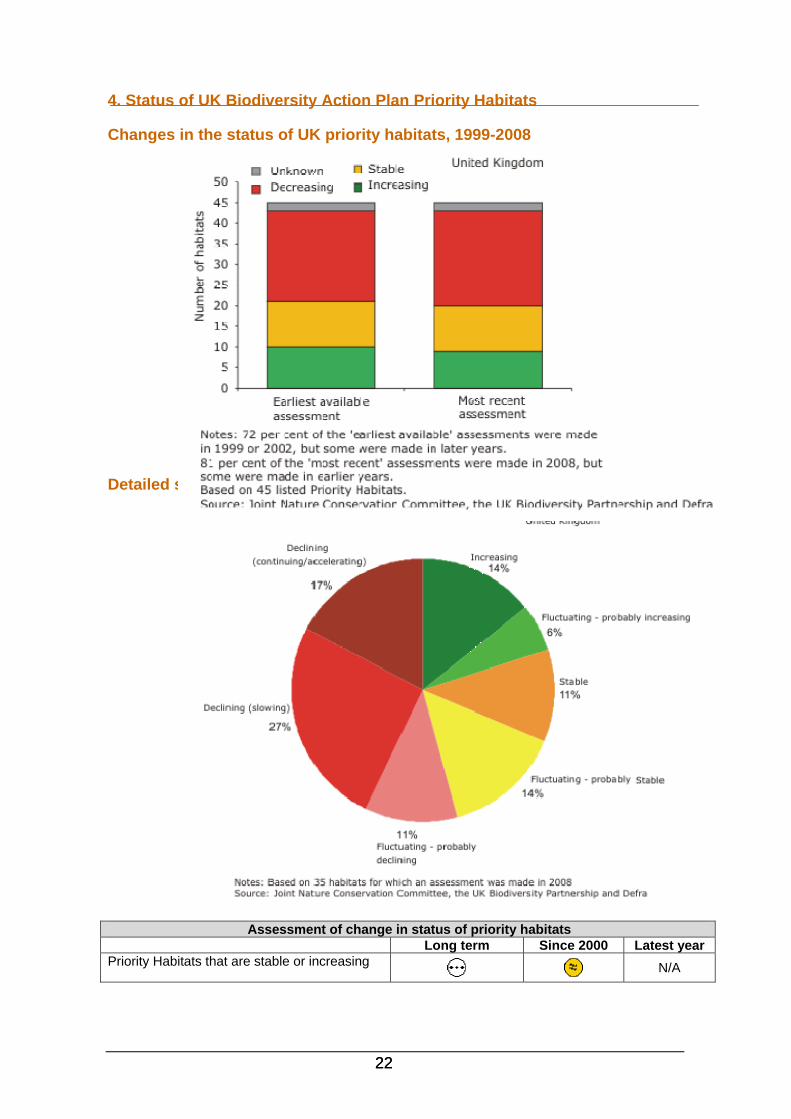
Changes in the status of UK priority habitats, 1999-2008
Detailed status of the UK Priority Habitats in 2008
Assessment of change in status of priority habitats Long term Since 2000 Latest year Priority Habitats that are stable or increasing
N/A
23
• The UK Biodiversity Action Plan is the UK’s national biodivproduced in response to the Convention on Biological Div
ersity strategy ersity. The Plan creased but the
and 2008
• An assessment of the status of the priority habitats has been provided every three years by experts across the UK.
• A status assessment is available in at least one of the assessment years for 43 habitats. Two have remained ‘unknown’ throughout the period.
• Based on a comparison of the earliest available and most recent assessment for each habitat, the number either ‘stable’ or ‘increasing’ in area has fallen from 21 to 20 (2.5 per cent of the known habitats).
• Despite this position of little or no overall change, 15 priority habitats (44 per cent) are still declining in extent.
was revised in 2007 and the number of priority habitats inindicator is based on the 45 habitats which were assessed between 1999
24
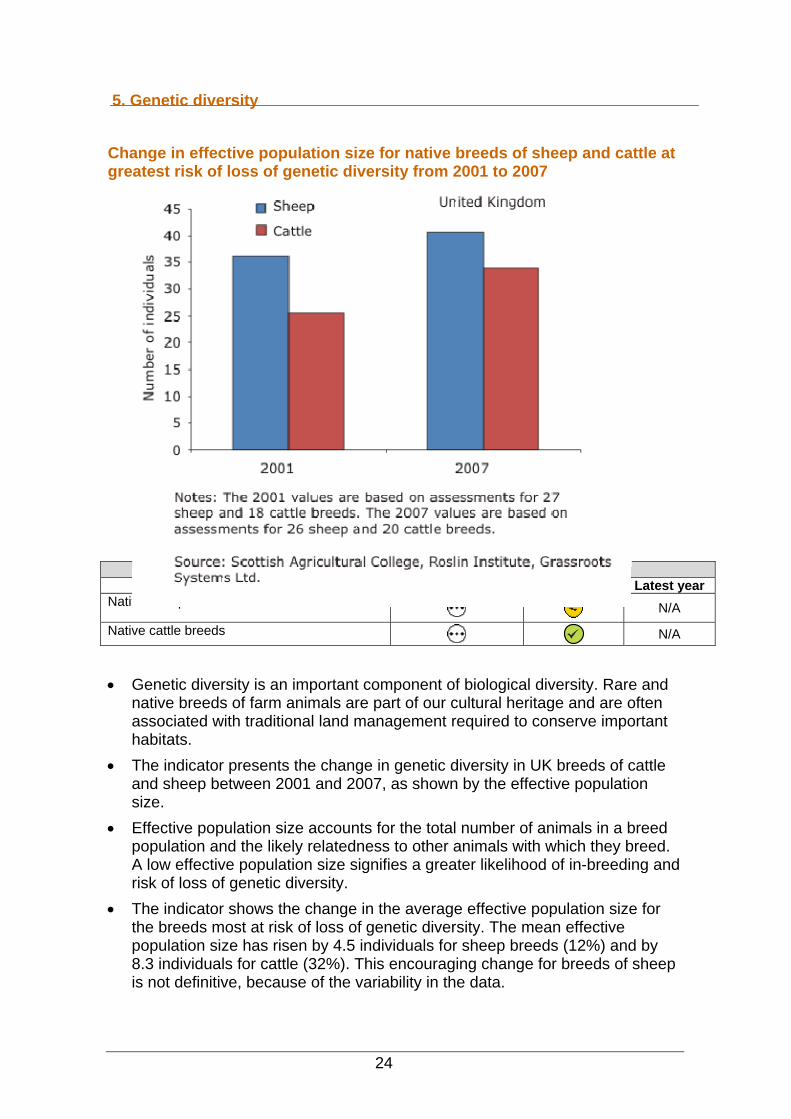
5. Genetic diversity Change in effective population size for native breeds of sheep and cattle at greatest risk of loss of genetic diversity from 2001 to 2007
Assessment of change in effective population size
Long term Since 2001 Latest year Native sheep breeds
N/A
Native cattle breeds N/A
• Genetic diversity is an important component of biological diversity. Rare and native breeds of farm animals are part of our cultural heritage and are often associated with traditional land management required to conserve important habitats.
• The indicator presents the change in genetic diversity in UK breeds of cattle and sheep between 2001 and 2007, as shown by the effective population size.
• Effective population size accounts for the total number of animals in a breed population and the likely relatedness to other animals with which they breed. A low effective population size signifies a greater likelihood of in-breeding and risk of loss of genetic diversity.
• The indicator shows the change in the average effective population size for the breeds most at risk of loss of genetic diversity. The mean effective population size has risen by 4.5 individuals for sheep breeds (12%) and by 8.3 individuals for cattle (32%). This encouraging change for breeds of sheep is not definitive, because of the variability in the data.
25
• There has been no reported UK extinction of any breed of sheep or cattle since 2001.
26
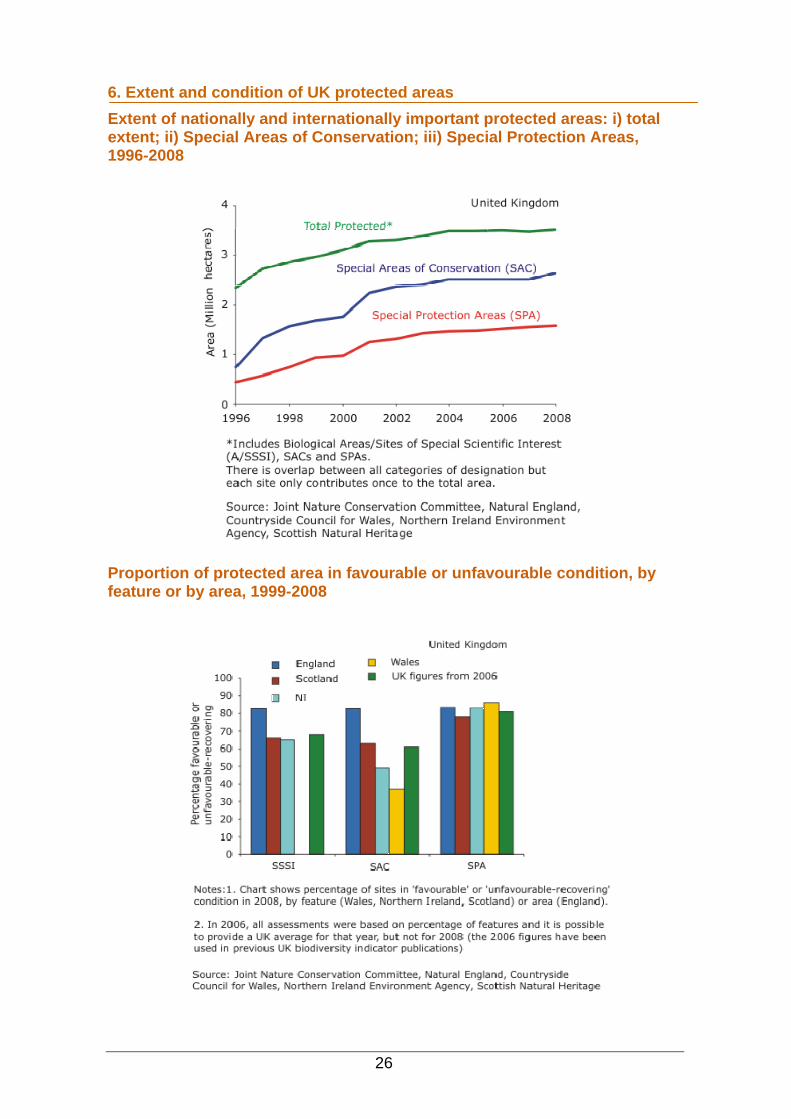
6. Extent and condition of UK protected areas Extent of nationally and internationally important protected areas: i) total extent; ii) Special Areas of Conservation; iii) Special Protection Areas, 1996-2008
Proportion of protected area in favourable or unfavourable condition, by feature or by area, 1999-2008
27
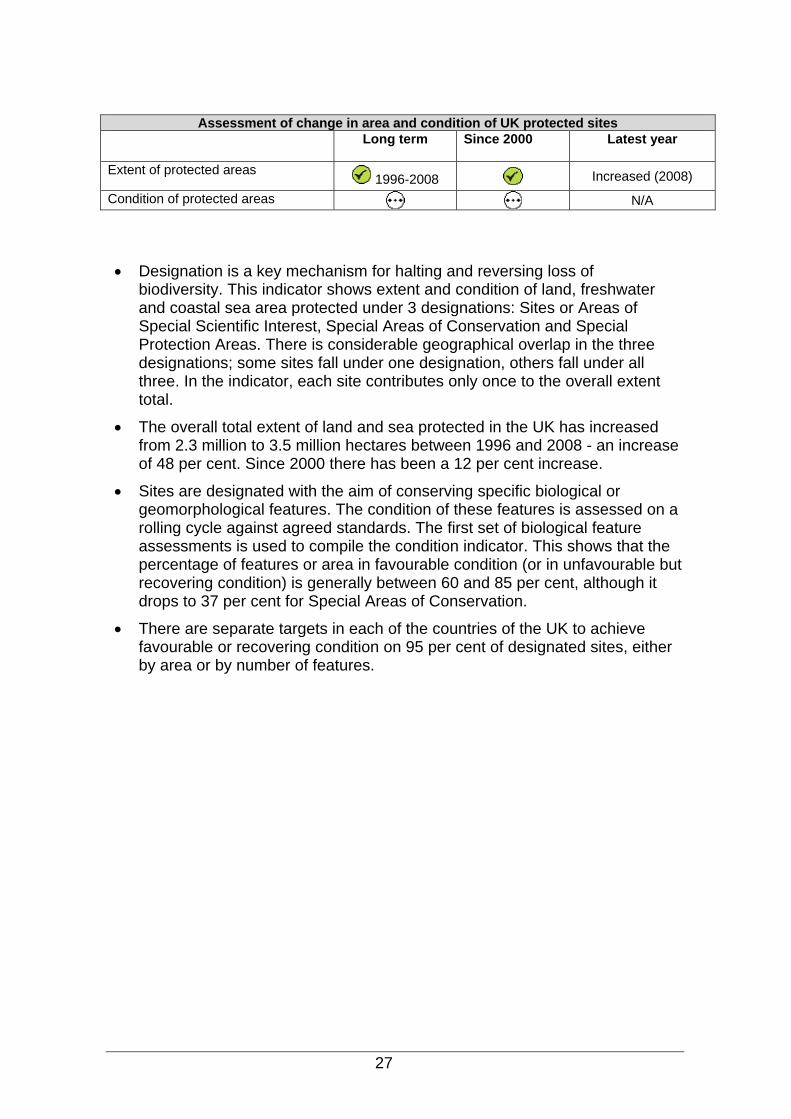
Assessment of change in area and condition of UK protected sites Long term Since 2000 Latest year
Extent of protected areas 1996-2008 Increased (2008)
Condition of protected areas N/A
• Designation is a key mechanism for halting and reversing loss of biodiversity. This indicator shows extent and condition of land, freshwater and coastal sea area protected under 3 designations: Sites or Areas of Special Scientific Interest, Special Areas of Conservation and Special Protection Areas. There is considerable geographical overlap in the three designations; some sites fall under one designation, others fall under all three. In the indicator, each site contributes only once to the overall extent total.
• The overall total extent of land and sea protected in the UK has increased from 2.3 million to 3.5 million hectares between 1996 and 2008 - an increase of 48 per cent. Since 2000 there has been a 12 per cent increase.
• Sites are designated with the aim of conserving specific biological or geomorphological features. The condition of these features is assessed on a rolling cycle against agreed standards. The first set of biological feature assessments is used to compile the condition indicator. This shows that the percentage of features or area in favourable condition (or in unfavourable but recovering condition) is generally between 60 and 85 per cent, although it drops to 37 per cent for Special Areas of Conservation.
• There are separate targets in each of the countries of the UK to achieve favourable or recovering condition on 95 per cent of designated sites, either by area or by number of features.
28
7. Woodland management
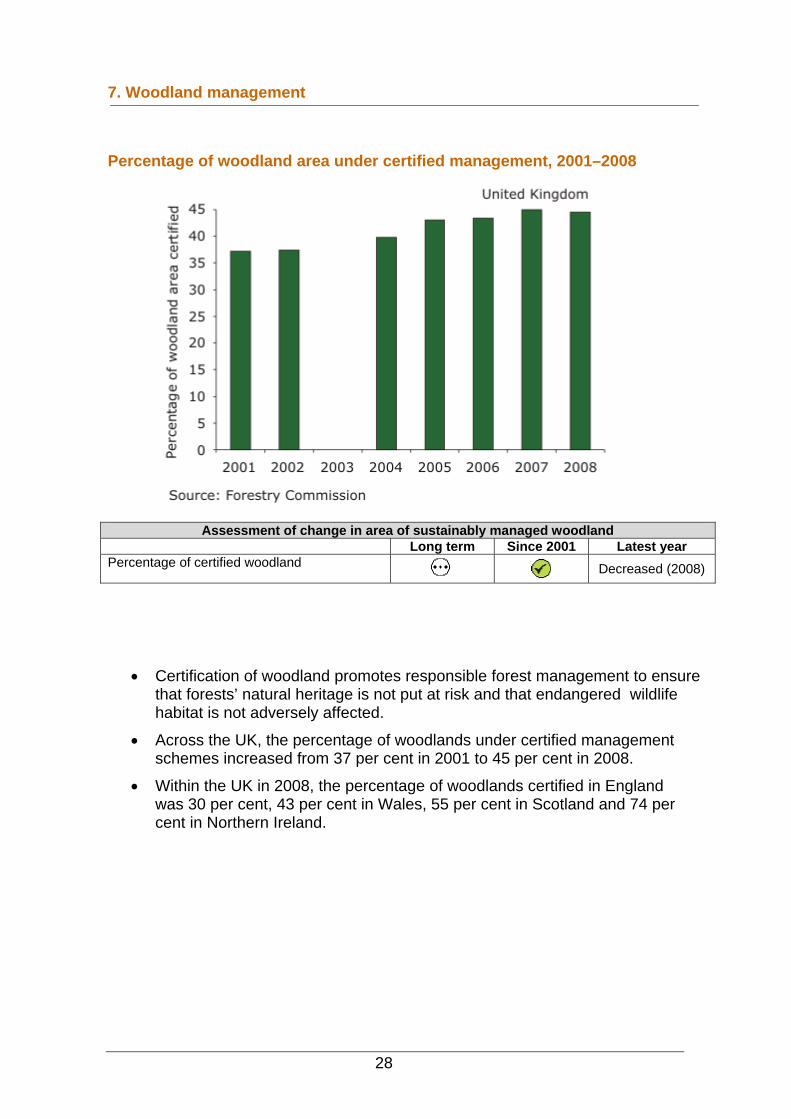
Percentage of woodland area under certified management, 2001–2008
Assessment of change in area of sustainably managed woodland
Long term Since 2001 Latest year Percentage of certified woodland
Decreased (2008)
• Certification of woodland promotes responsible forest management to ensure that forests’ natural heritage is not put at risk and that endangered wildlife habitat is not adversely affected.
• Across the UK, the percentage of woodlands under certified management schemes increased from 37 per cent in 2001 to 45 per cent in 2008.
• Within the UK in 2008, the percentage of woodlands certified in England was 30 per cent, 43 per cent in Wales, 55 per cent in Scotland and 74 per cent in Northern Ireland.
29
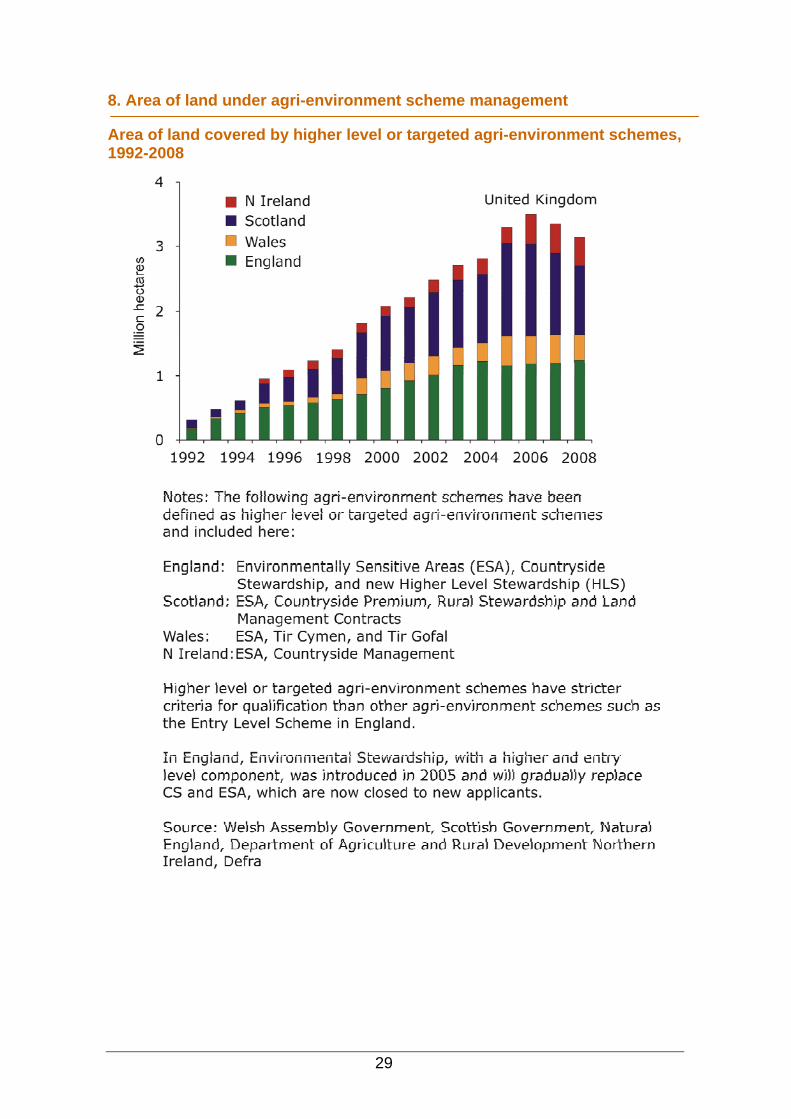
8. Area of land under agri-environment scheme management
Area of land covered by higher level or targeted agri-environment schemes, 1992-2008
30
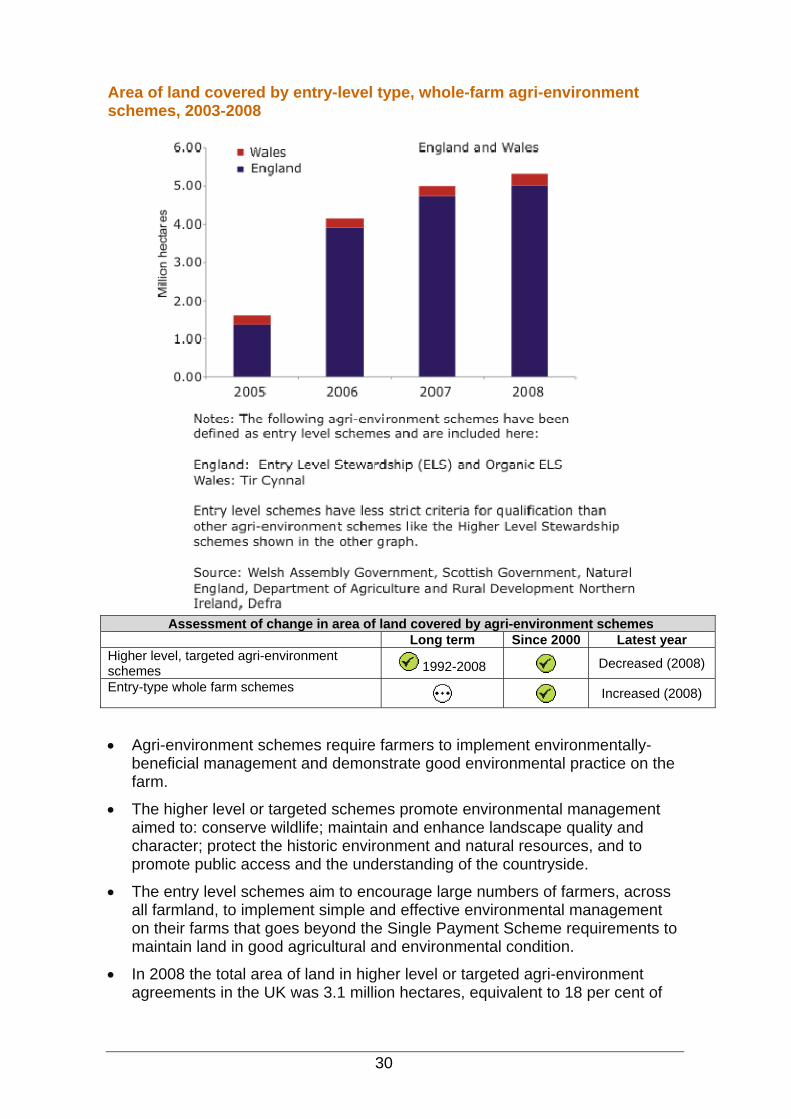
Area of land covered by entry-level type, whole-farm agri-environment schemes, 2003-2008
Assessment of change in area of land covered by agri-environment schemes
Long term Since 2000 Latest year Higher level, targeted agri-environment schemes 1992-2008 Decreased (2008)
Entry-type whole farm schemes Increased (2008)
• Agri-environment schemes require farmers to implement environmentally-beneficial management and demonstrate good environmental practice on the farm.
• The higher level or targeted schemes promote environmental management aimed to: conserve wildlife; maintain and enhance landscape quality and character; protect the historic environment and natural resources, and to promote public access and the understanding of the countryside.
• The entry level schemes aim to encourage large numbers of farmers, across all farmland, to implement simple and effective environmental management on their farms that goes beyond the Single Payment Scheme requirements to maintain land in good agricultural and environmental condition.
• In 2008 the total area of land in higher level or targeted agri-environment agreements in the UK was 3.1 million hectares, equivalent to 18 per cent of
31
UK agricultural land. There were 5.3 million hectares in entry level schemes in England and Wales.
• In England, 13 per cent of agricultural land is managed under a higher level or targeted schemes; 27 per cent in Wales; 19 per cent in Scotland and 43 per cent in Northern Ireland.
• In England 54 per cent of agricultural land is managed under an entry level agreement and 20 per cent in Wales. These are whole farm schemes, the England area includes land in Organic ELS.
• The majority of land on higher level schemes are also in entry level schemes, therefore the areas cannot be summed.
32
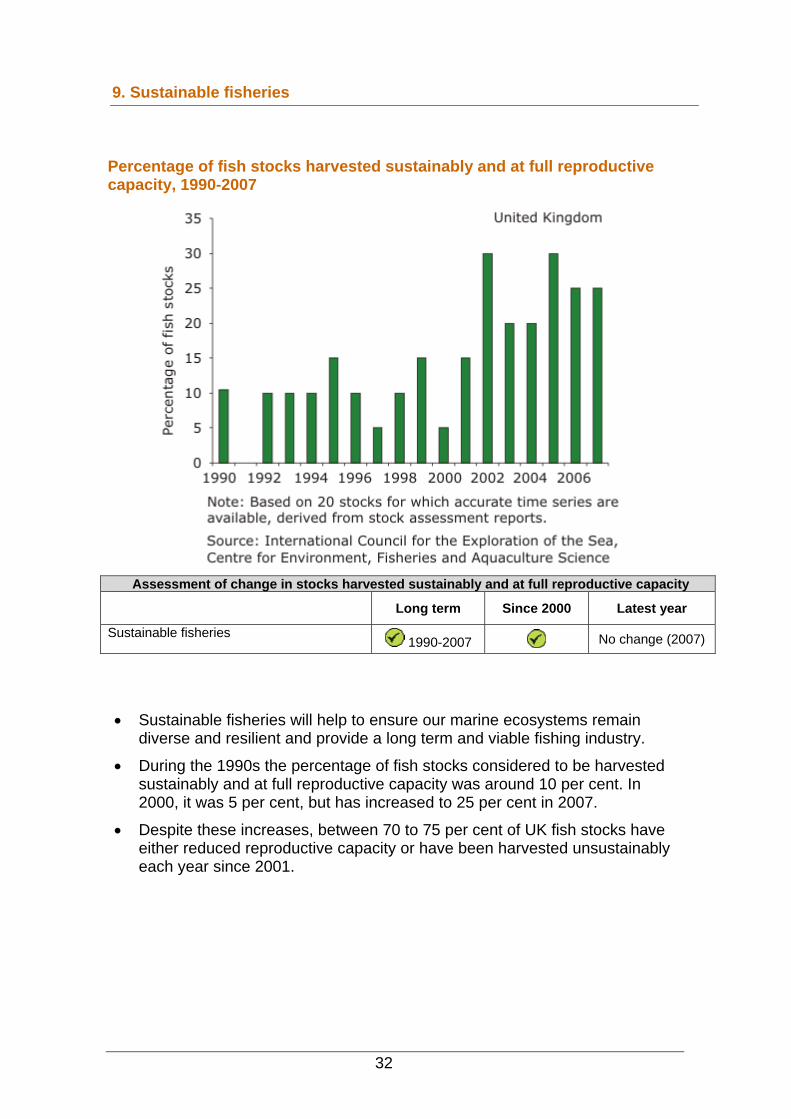
9. Sustainable fisheries
Percentage of fish stocks harvested sustainably and at full reproductive capacity, 1990-2007
Assessment of change in stocks harvested sustainably and at full reproductive capacity
Long term Since 2000 Latest year
Sustainable fisheries 1990-2007 No change (2007)
• Sustainable fisheries will help to ensure our marine ecosystems remain diverse and resilient and provide a long term and viable fishing industry.
• During the 1990s the percentage of fish stocks considered to be harvested sustainably and at full reproductive capacity was around 10 per cent. In 2000, it was 5 per cent, but has increased to 25 per cent in 2007.
• Despite these increases, between 70 to 75 per cent of UK fish stocks have either reduced reproductive capacity or have been harvested unsustainably each year since 2001.
33
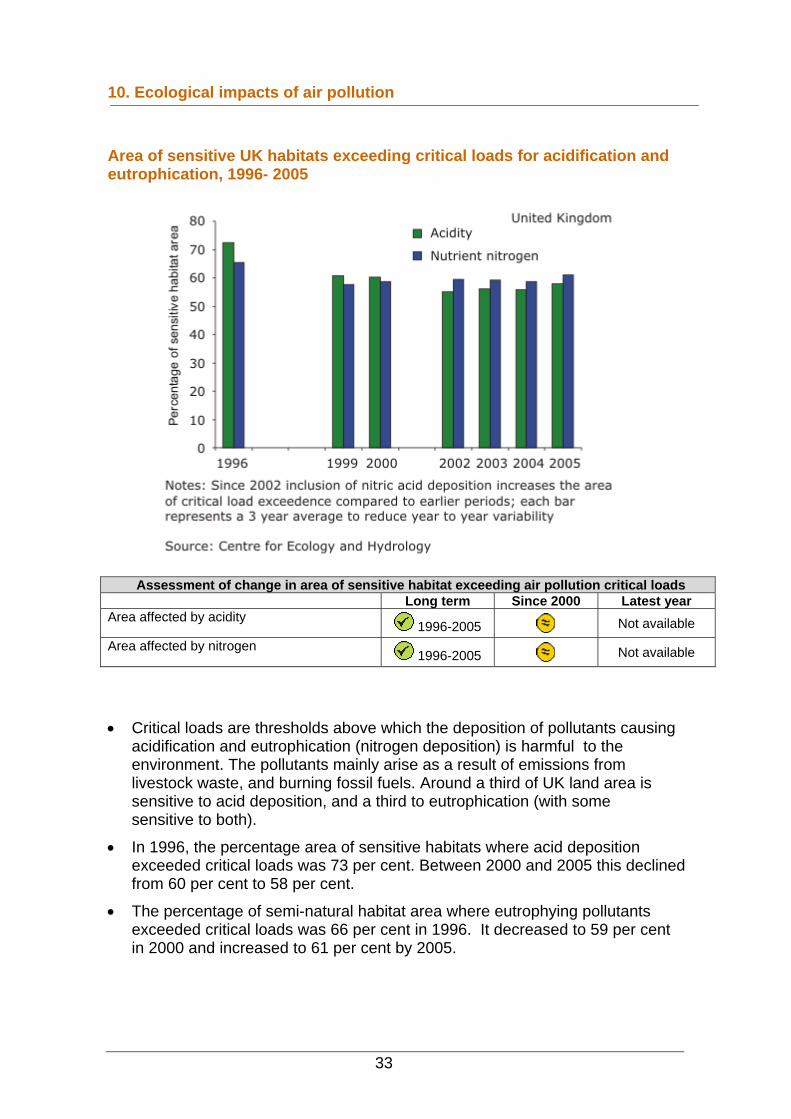
10. Ecological impacts of air pollution
Area of sensitive UK habitats exceeding critical loads for acidification and eutrophication, 1996- 2005
Assessment of change in area of sensitive habitat exceeding air pollution critical loads
Long term Since 2000 Latest year Area affected by acidity
1996-2005 Not available
Area affected by nitrogen 1996-2005 Not available
ng
as 73 per cent. Between 2000 and 2005 this declined from 60 per cent to 58 per cent.
• The percentage of semi-natural habitat area where eutrophying pollutants exceeded critical loads was 66 per cent in 1996. It decreased to 59 per cent in 2000 and increased to 61 per cent by 2005.
• Critical loads are thresholds above which the deposition of pollutants causiacidification and eutrophication (nitrogen deposition) is harmful to the environment. The pollutants mainly arise as a result of emissions from livestock waste, and burning fossil fuels. Around a third of UK land area issensitive to acid deposition, and a third to eutrophication (with somesensitive to both).
• In 1996, the percentage area of sensitive habitats where acid deposition exceeded critical loads w
34
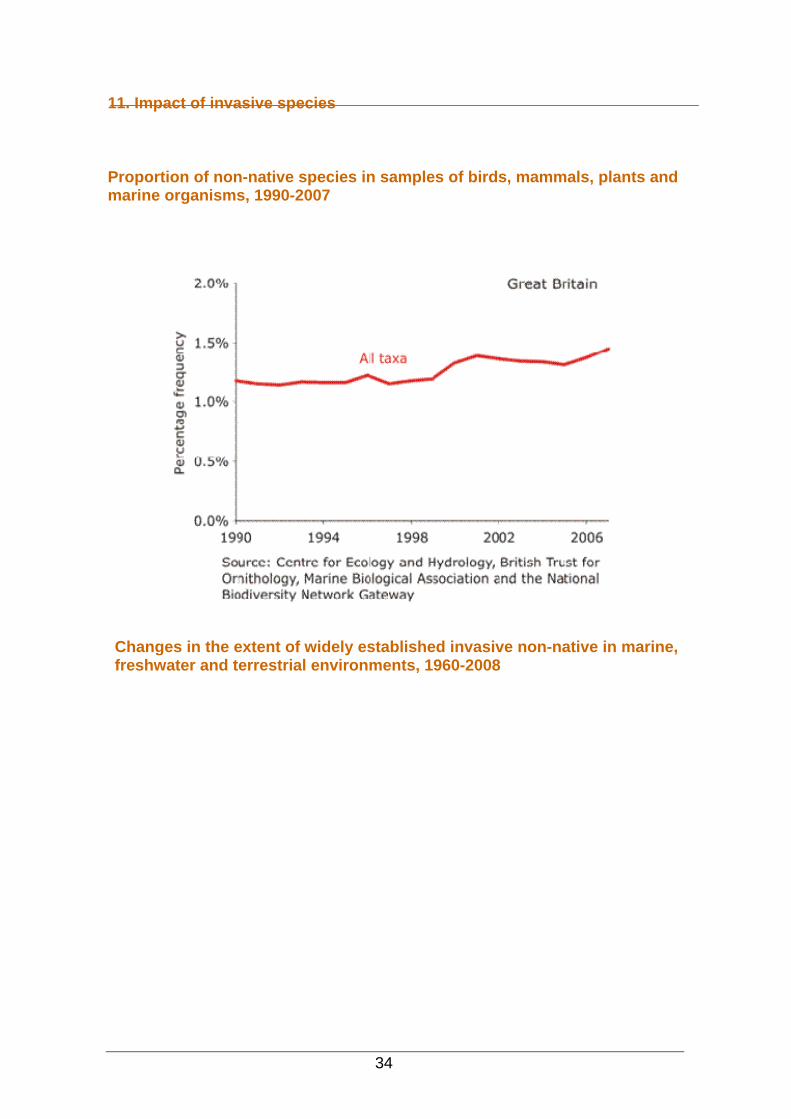
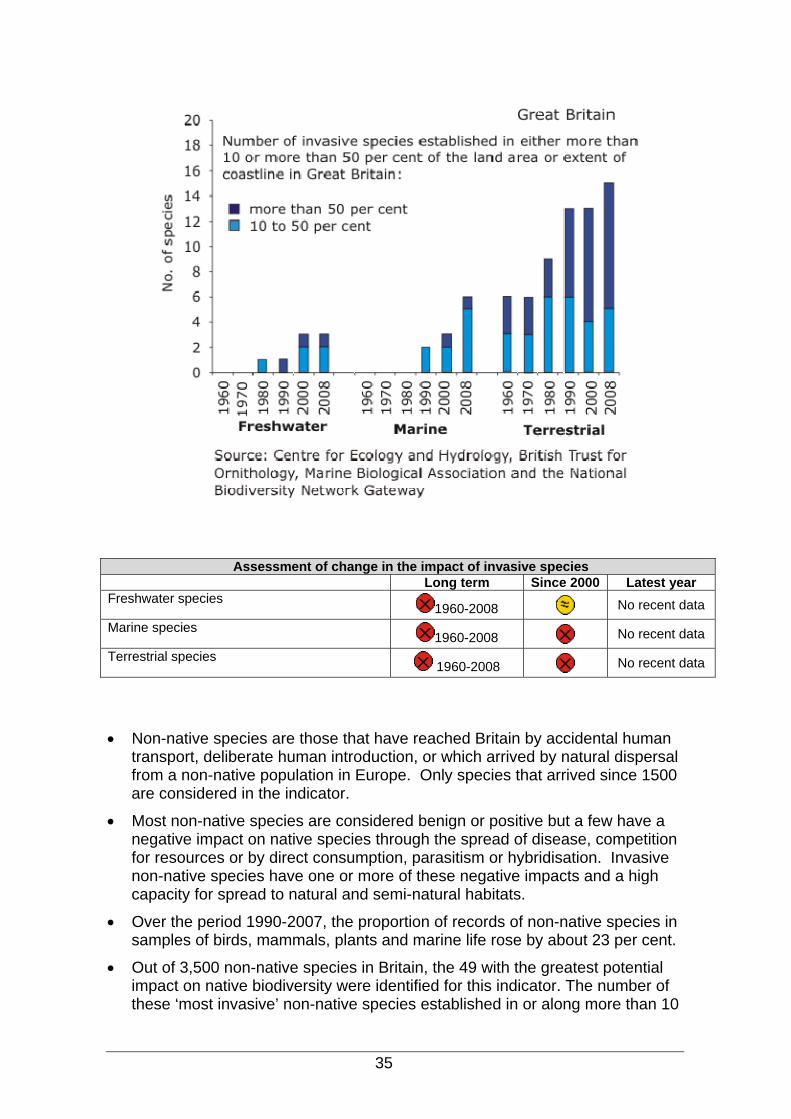
11. Impact of invasive species
Proportion of non-native species in samples of birds, mammals, plants and marine organisms, 1990-2007
Changes in the extent of widely establis ive non-native inhed invas marine, freshwater and terrestrial environments, 1960-2008
35
Assessment of change in the impact of invasive species Long term Since 2000 Latest year Freshwater species
1960-2008 No recent data
Marine species 1960-2008 No recent data
Terrestrial species 1960-2008 No recent data
• Non-native species are those that have reached Britain by accidental human transport, deliberate human introduction, or which arrived by natural dispersal from a non-native population in Europe. Only species that arrived since 1500 are considered in the indicator.
• Most non-native species are considered benign or positive but a few have a negative impact on native species through the spread of disease, competition for resources or by direct consumption, parasitism or hybridisation. Invasive non-native species have one or more of these negative impacts and a high capacity for spread to natural and semi-natural habitats.
• Over the period 1990-2007, the proportion of records of non-native species in samples of birds, mammals, plants and marine life rose by about 23 per cent.
• Out of 3,500 non-native species in Britain, the 49 with the greatest potential impact on native biodiversity were identified for this indicator. The number of these ‘most invasive’ non-native species established in or along more than 10
36
per cent of Great Britain’s land area or coastline has increased since 1960 in the freshwater, terrestrial and marine environment, increasing the likely pressure on native biodiversity.
37
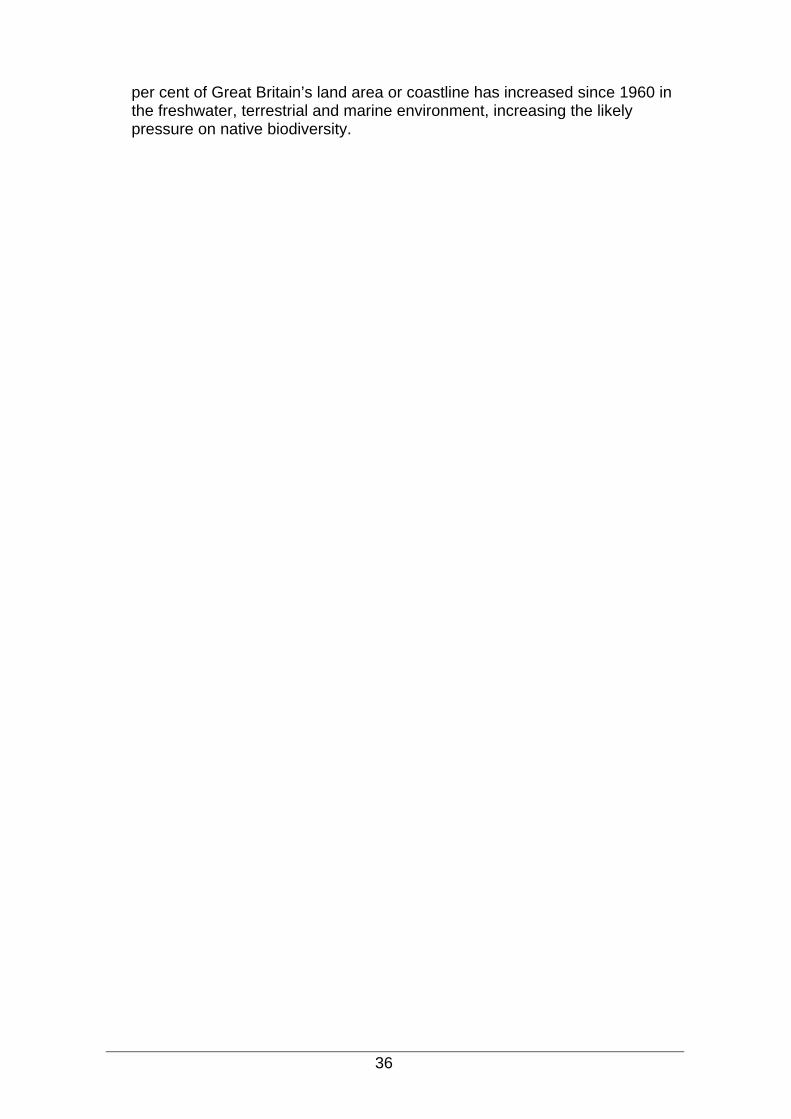
12. Spring Index
Index of the timing of biological spring events in the UK, 1891-1947 and 1999-2008
This is a context indicator and as such is not assessed. • This is a contextual indicator that shows how changes in climate can lead to
changes in the timing of biological events.
• The UK Spring Index is calculated from the annual mean observation date of the following four biological events: first flowering of hawthorn, first flowering of horse chestnut, first recorded flight of orange-tip butterfly and first sight of swallow.
• The 1900-1947 data were collected by the Royal Meteorological Society and the 1999-2008 data by the UK Phenology Network.
• While the indicator has fluctuated from year to year, on average spring events in the UK occurred seven days earlier in the years between 1999-2008 than between 1900-1947. These changes in the Spring Index are strongly linked to increases in temperature in March and April.
38
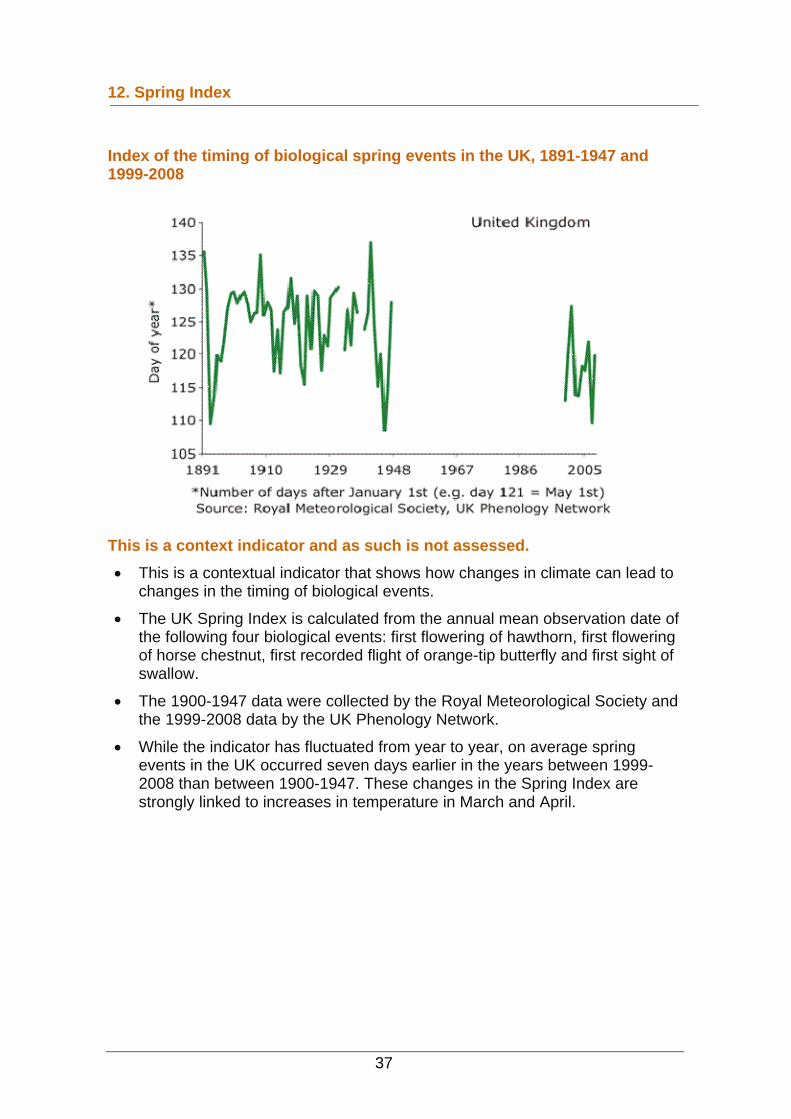
13. Marine ecosystem integrity (size of fish in the North Sea) Proportion of large fish (equal to or larger than 40cm), by weight, in the
northern North Sea, 1982–2008
Assessment of change in the proportion of large individuals in North Sea fish populations Long term Since 2000 Latest year Northern North Sea
1982-2008 Decrease (2008)
• Changes in the size structure of fish populations and communities reflect
changes in their composition, diversity and productivity.
• This indicator shows changes in the proportion of large fish (40 cm or greater in length) in the northern part of the UK area of the North Sea.
• There has been a steady decline in the proportion of large fish, by weight, in the northern North Sea since 1982. The proportion fell from around 15 percent of the fish community in 1982 to around 5 per cent between 1982 and2008, although there has been little overall change since 2000.
• This broad pattern of general decline, followed by a more recent period of apparent stability is repeated in other seas around the UK.
39
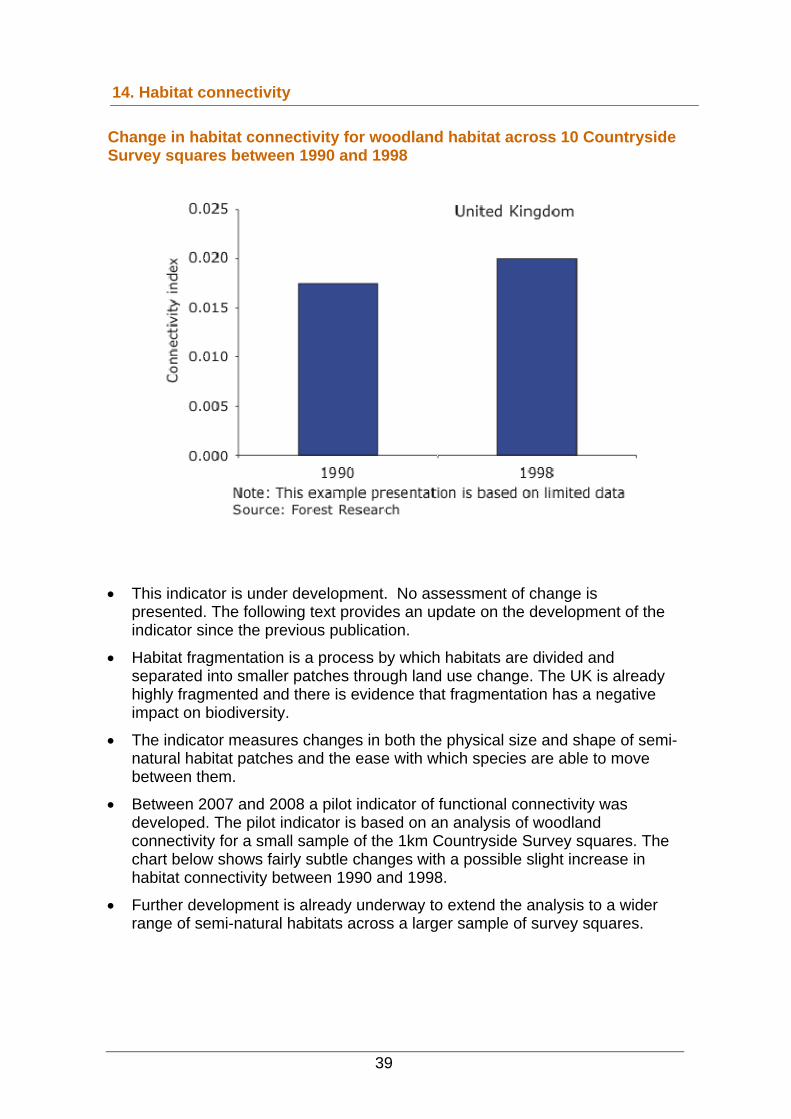
14. Habitat connectivity Change in habitat connectivity for woodland habitat across 10 CountrysiSurvey squares between 1990 and 1998
de
• This indicator is under development. No assessment of change is presented. The following text provides an update on the development of the indicator since the previous publication.
• Habitat fragmentation is a process by which habitats are divided and separated into smaller patches through land use change. The UK is already highly fragmented and there is evidence that fragmentation has a negative impact on biodiversity.
• The indicator measures changes in both the physical size and shape of semi-natural habitat patches and the ease with which species are able to move between them.
• Between 2007 and 2008 a pilot indicator of functional connectivity was developed. The pilot indicator is based on an analysis of woodland connectivity for a small sample of the 1km Countryside Survey squares. The chart below shows fairly subtle changes with a possible slight increase in habitat connectivity between 1990 and 1998.
• Further development is already underway to extend the analysis to a wider range of semi-natural habitats across a larger sample of survey squares.
40
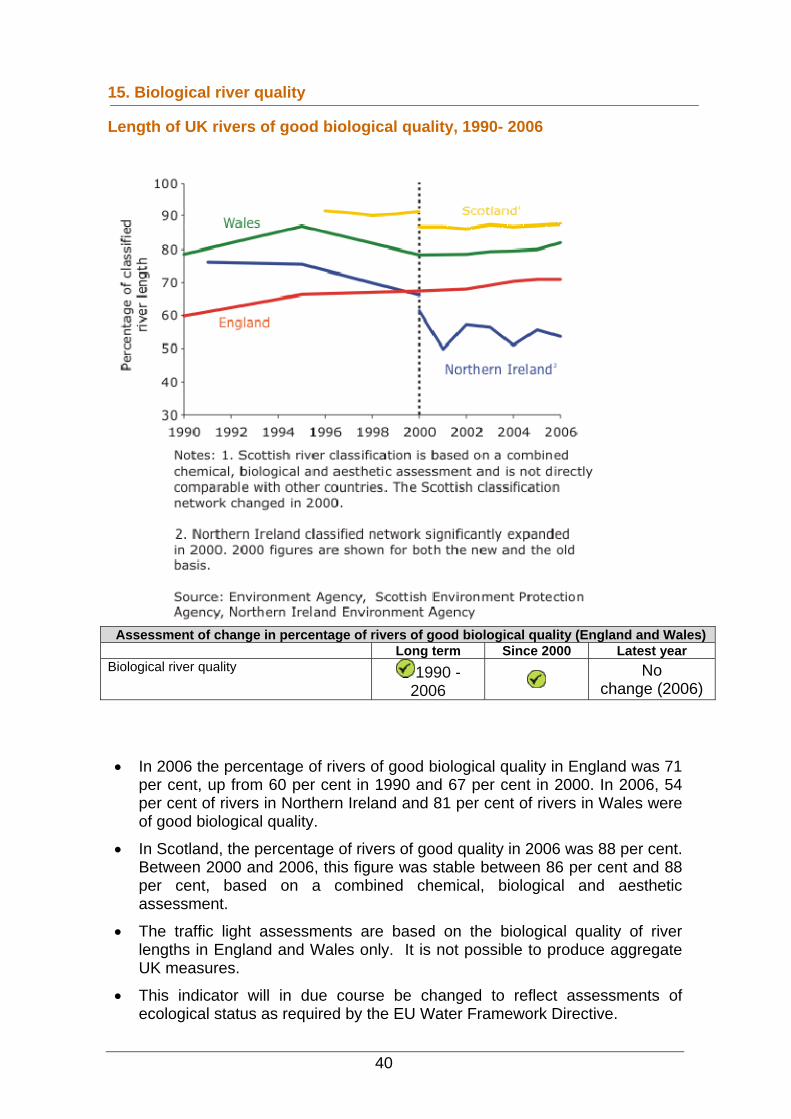
15. Biological river quality
Length of UK rivers of good biological quality, 1990- 2006
Assessment of change in percentage of rivers of good biological quality (England and Wales) Long term Since 2000 Latest year Biological river quality 1990 -
2006 No
change (2006)
• In 2006 the percentage of rivers of good biological quality in England wasper cent, up fro
71 m 60 per cent in 1990 and 67 per cent in 2000. In 2006, 54
s were
. 88
iver lengths in England and Wales only. It is not possible to produce aggregate UK measures.
• This indicator will in due course be changed to reflect assessments of ecological status as required by the EU Water Framework Directive.
per cent of rivers in Northern Ireland and 81 per cent of rivers in Waleof good biological quality.
• In Scotland, the percentage of rivers of good quality in 2006 was 88 per centBetween 2000 and 2006, this figure was stable between 86 per cent andper cent, based on a combined chemical, biological and aesthetic assessment.
• The traffic light assessments are based on the biological quality of r
41
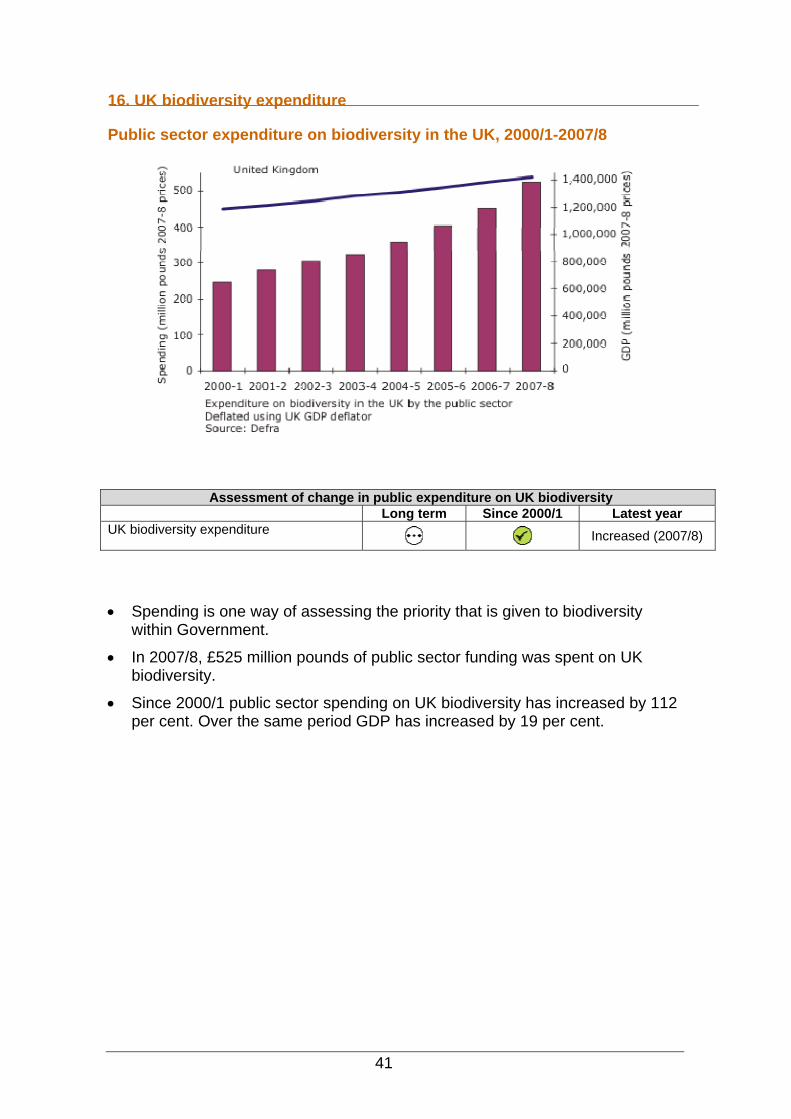
16. UK biodiversity expenditure
Public sector expenditure on biodiversity in the UK, 2000/1-2007/8
Assessment of change in public expenditure on UK biodiversity Long term Since 2000/1 Latest year UK biodiversity expenditure
Increased (2007/8)
• Spending is one way of assessing the priority that is given to biodiv rsity ewithin Government.
• In 2007/8, £525 million pounds of pub undi nt onlic sector f ng was spe UK biodiversity.
• Since 2000/1 public sector spending on iodiversity has increased by 112 UK bper cent. Over the same period GDP has increased by 19 per cent.
42
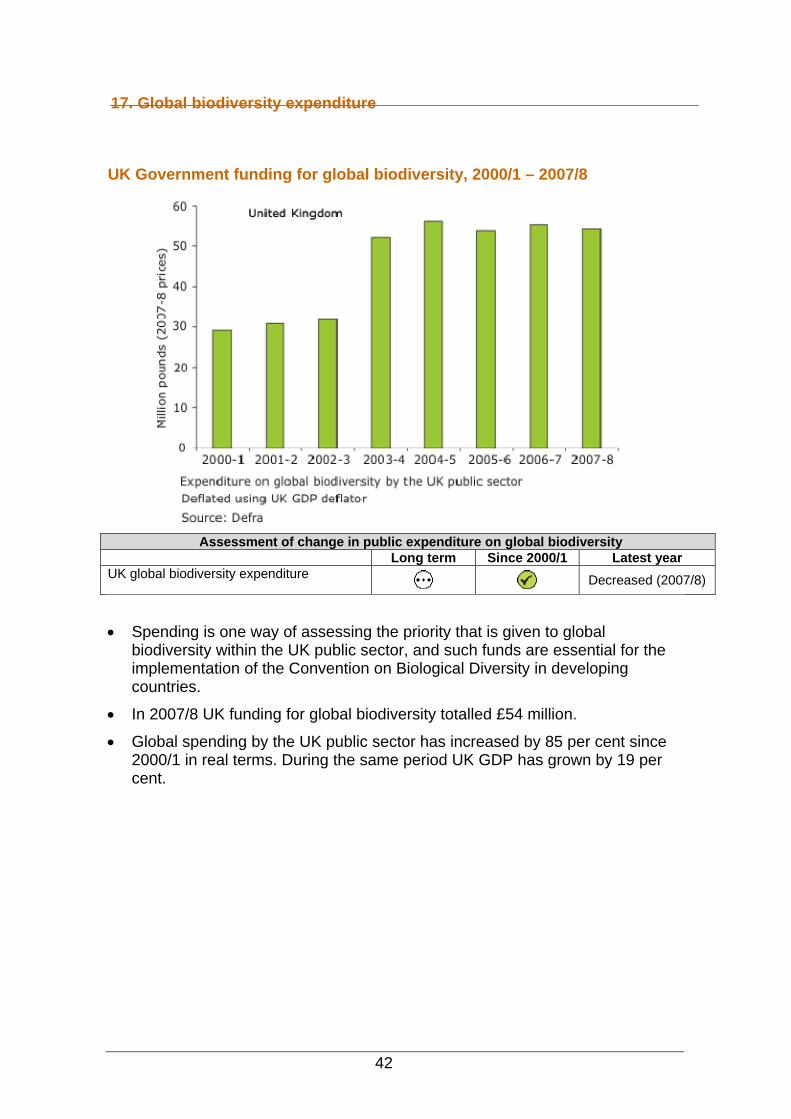
17. Global biodiversity expenditure
UK Government funding for global biodiversity, 2000/1 – 2007/8
Assessment of change in public ex e on global biodivpenditur ersity
Long term Since 2000/1 Latest year UK global biodiversity expenditure
Decreased (2007/8)
• Spending is one way of assessing the priority that is given to global biodiversity within the UK public sector, and such funds are essential for the implementation of the Convention on Biological Diversity in developing countries.
• In 2007/8 UK funding for global biodiversity totalled £54 million.
• lobal spending by the UK public sector has increased by 85 per cent since G2000/1 in real terms. During the same period UK GDP has grown by 19 per cent.
43
18. Conservation volunteering
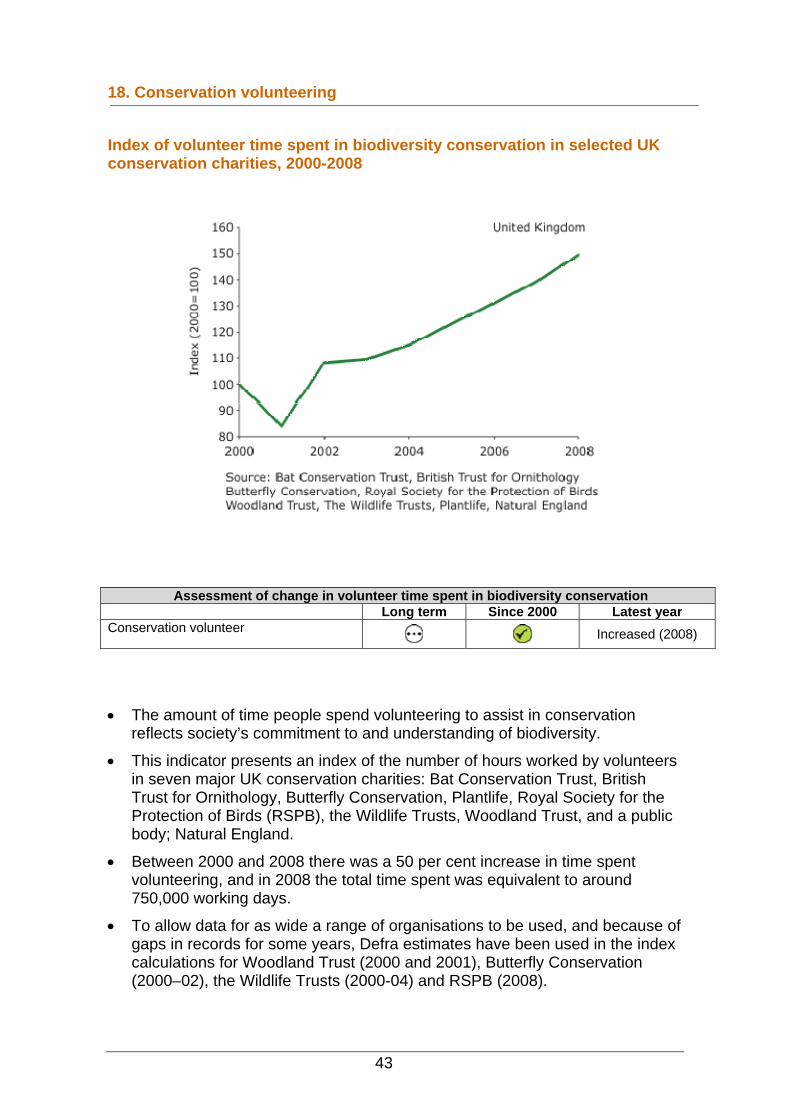
Index of volunteer time spent in biodiversity conservation in selected UK conservation charities, 2000-2008
Assessment of change in volunteer time spent in biodiversity conservation Long term Since 2000 Latest year Conservation volunteer
Increased (2008)
• The amount of time people spend volunteering to assist in conservation reflects society’s commitment to and understanding of biodiversity.
• This indicator presents an index of the number of hours worked by volunteers in seven major UK conservation charities: Bat Conservation Trust, British Trust for Ornithology, Butterfly Conservation, Plantlife, Royal Society for the Protection of Birds (RSPB), the Wildlife Trusts, Woodland Trust, and a public body; Natural England.
• Between 2000 and 2008 there was a 50 per cent increase in time spent volunteering, and in 2008 the total time spent was equivalent to around 750,000 working days.
• To allow data for as wide a range of organisations to be used, and because of gaps in records for some years, Defra estimates have been used in the index calculations for Woodland Trust (2000 and 2001), Butterfly Conservation (2000–02), the Wildlife Trusts (2000-04) and RSPB (2008).
44
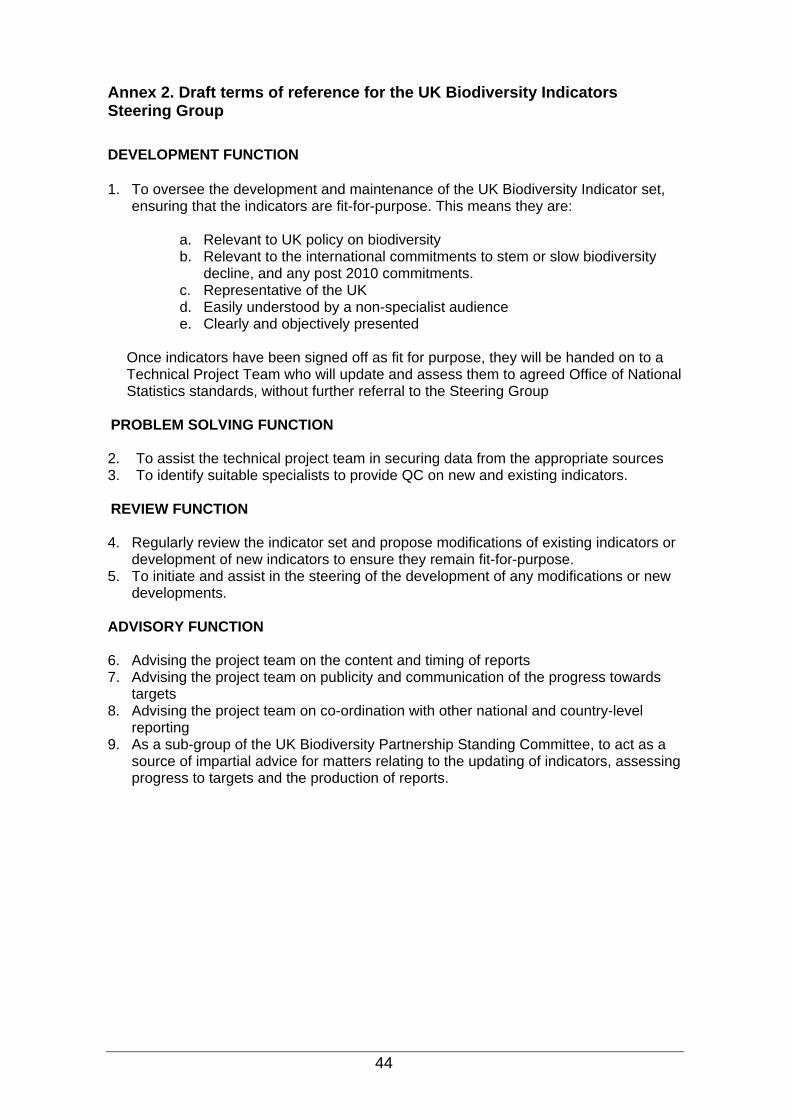
Annex 2. Draft terms of reference for the UK Biodiversity Indicators Steering Group DEVELOPMENT FUNCTION
1. To oversee the development and maintenance of the UK Biodiversity Indicator set,
ensuring that the indicators are fit-for-purpose. This means they are:
a. Relevant to UK policy on biodiversity b. Relevant to the international commitments to stem or slow biodiversity
decline, and any post 2010 commitments. c. Representative of the UK d. Easily understood by a non-specialist audience e. Clearly and objectively presented
Once indicators have been signed off as fit for purpose, they will be handed on to a Technical Project Team who will update and assess them to agreed Office of National Statistics standards, without further referral to the Steering Group
PROBLEM SOLVING FUNCTION 2. To assist the technical project team in securing data from the appropriate sources 3. To identify suitable specialists to provide QC on new and existing indicators. REVIEW FUNCTION 4. Regularly review the indicator set and propose modifications of existing indicators or
development of new indicators to ensure they remain fit-for-purpose. 5. To initiate and assist in the steering of the development of any modifications or new
deve
N 6. Advising the project team on the content and timing of reports
Advising the project team on publicity and communication of the progress towards targets
lopments. ADVISORY FUNCTIO
7.
8. Advising the project team on co-ordination with other national and country-levelreporting
9. As a sub-group of the UK Biodiversity Partnership Standing Committee, to act as a source of impartial advice for matters relating to the updating of indicators, assessing progress to targets and the production of reports.
45
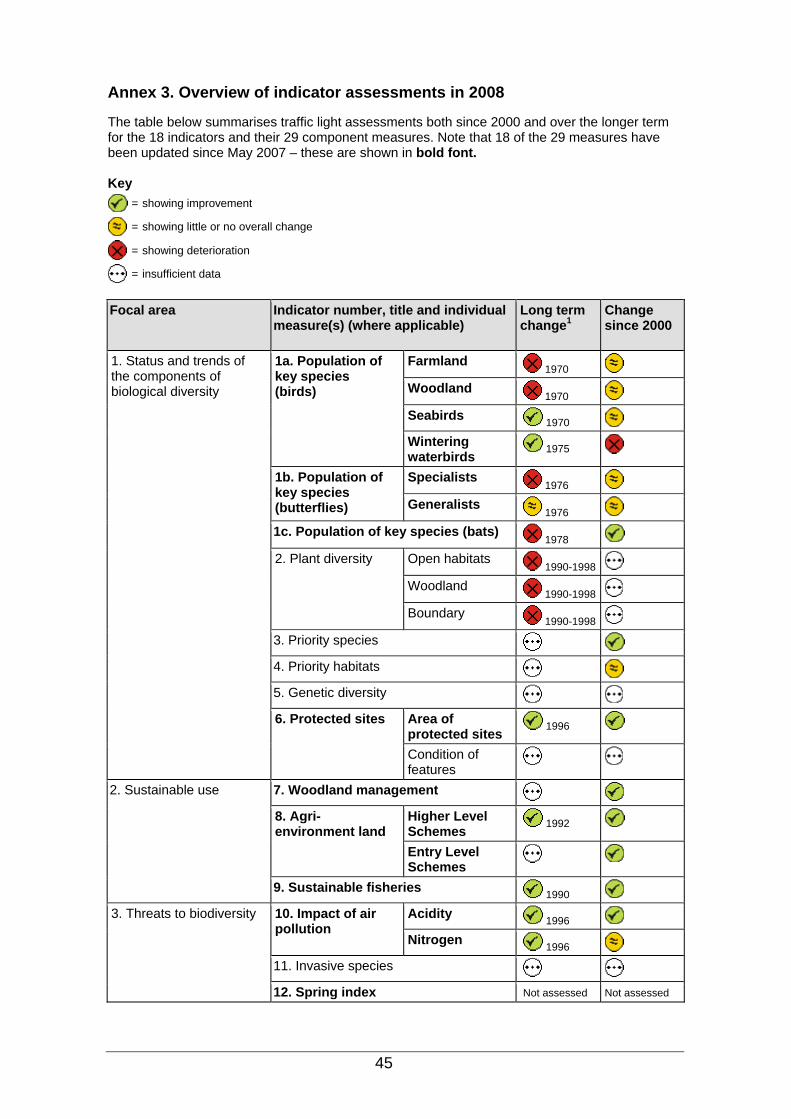
Annex 3. Overview of indicator assessments in 2008 The table below summarises traffic light assessments both since 2000 and over the longer term for the 18 indicators and their 29 component measures. Note that 18 of the 29 measures have been updated since May 2007 – these are shown in bold font. Key
= showing improvement
= showing little or no overall change
= showing deterioration
= insufficient data
Focal area Indicator number, title and individual
measure(s) (where applicable)
Long term change1
Change since 2000
1. Status and trends of the components of biological diversity
1a. Population of key species (birds)
Farmland 1970
Woodland 1970
Seabirds 1970
Wintering waterbirds 1975
1b. Population of key species (butterflies)
Specialists 1976
Generalists 1976
1c. Population of key species (bats) 1978
2. Plant diversity Open habitats 1990-1998
Woodland 1990-1998
Boundary 1990-1998
3. Priority species
4. Priority habitats
5. Genetic diversity
6. Protected sites Area of protected sites 1996
Condition of features
2. Sustainable use 7. Woodland management
8. Agri-environment land
Higher Level Schemes 1992
Entry Level Schemes
9. Sustainable fisheries 1990
3. Threats to biodiversity 10. Impact of air pollution
Acidity 1996
Nitrogen 1996
11. Invasive species
12. Spring index Not assessed Not assessed
46
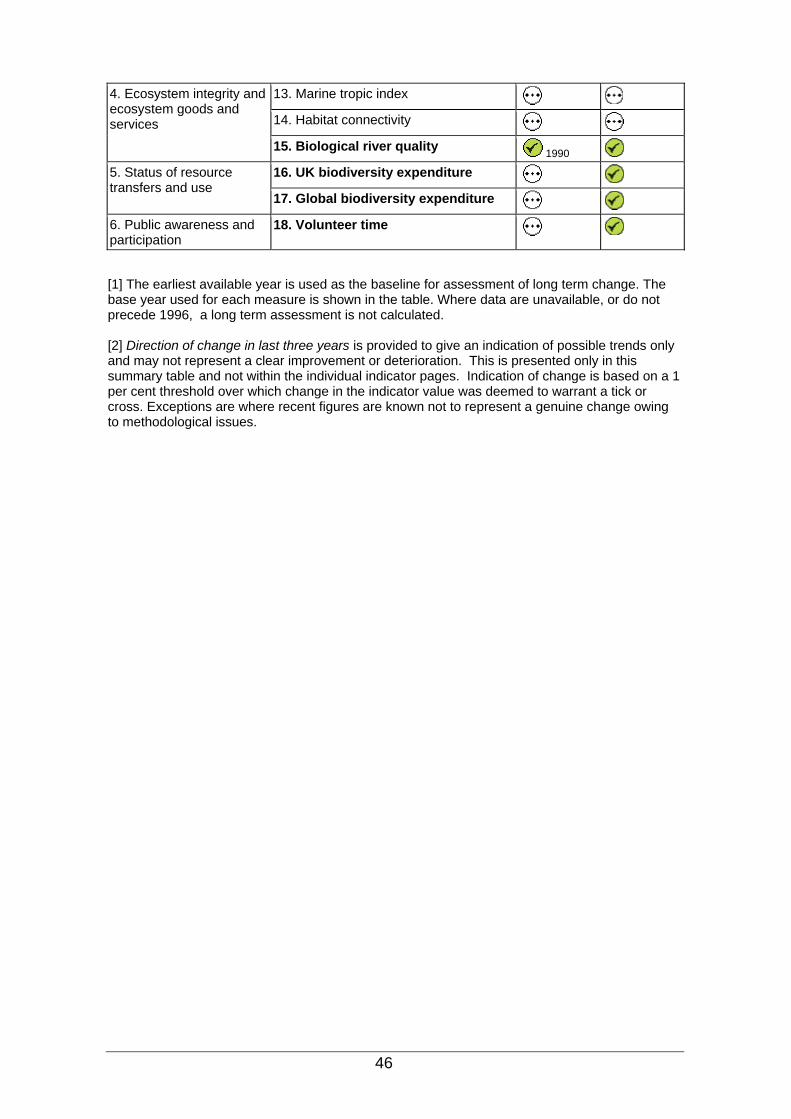
4. Ecosystem integrity and 13. Marine tropic index ecosystem goods and
14. Habitat connectivity services
15. Biological river quality 1990
5. Status of resource 16. UK biodiversity expenditure transfers and use
17. Global biodiversity expenditure
6. Public awareness and participation
18. Volunteer time
[1] The earliest available year is used as the baseline for assessment of long term change. The base year used for each measure i s shown in the table. Where data are unavailable, or do notprecede 1996, a long term assessment is not calculated. [2] Direction of change in la e years is provided to give an indication of possible trends only st threand may not represent a cle ete his is prese nly in this ar improvement or d rioration. T nted osummary table and not with l indicator pages. Indicatio of sed on a 1 in the individua n change is baper cent threshold over whic in the indica em d t rant a tic or h change tor value was de e o war kcross. Exceptions are where recent figures are kno present a genui change owing wn not to re neto methodological issues.