Embed Size (px)
Citation preview

UK Biodiversity Action Plan: Preparing Costings for Species and Habitat Action Plans
Costings Summary Report
Revised Report to Defra and Partners
Submitted by GHK Consulting Ltd
in association with
RPS Ecology
Residence 2, Royal William Yard, Plymouth, PL1 3RP
Tel: 01752 262244; Fax 01752 262299
526 Fulham Road, London SW6 5NR
Tel: 020 7471 8000; Fax: 020 7735 0784
www.ghkint.com
J2003 1
Document Control
Document BAP Costings Summary Report
Job No. J2003
Prepared by Matt Rayment
Checked by Gitte Lindberg
Date 28 April 2006
BAP Costings Summary Report
J2003 2
CONTENTS 1 INTRODUCTION................................................................................................................. 3 2 SUMMARY OF APPROACH .............................................................................................. 5 2.1 HAP Costings ................................................................................................................... 5 2.2 SAP Costings ................................................................................................................... 6 2.3 Review of BAP Expenditures ........................................................................................... 8 3 METHODOLOGICAL ISSUES ......................................................................................... 10 3.1 Overview ........................................................................................................................ 10 3.2 Total and Additional Costs ............................................................................................. 10 3.3 BAP Attributable Costs................................................................................................... 11 3.4 Land Purchase ............................................................................................................... 11 3.5 Opportunity Costs........................................................................................................... 11 3.6 Net and Gross Costs...................................................................................................... 12 3.7 Public and Private Sector Costs..................................................................................... 12 3.8 Grants and Incentives .................................................................................................... 12 3.9 Marginal Costs ............................................................................................................... 13 3.10 Differences in Country Level Costs.............................................................................. 13 3.11 Administration and Central Costs................................................................................. 14 3.12 Staff Costs.................................................................................................................... 15 3.13 Inflation......................................................................................................................... 15 3.14 Voluntary Activities ....................................................................................................... 15 3.15 The Impact of Policy Change ....................................................................................... 15 3.16 Response Bias ............................................................................................................. 16 4 SUMMARY OF COSTS .................................................................................................... 17 4.1 HAP Costings ................................................................................................................. 17 4.2 SAP Costings ................................................................................................................. 19 4.3 Existing BAP Expenditures ............................................................................................ 21 4.4 Comparison of Costs and Existing Funding................................................................... 21
BAP Costings Summary Report
J2003 3
1 INTRODUCTION
The UK Biodiversity Action Plan sets out the Government’s commitments to conserve and enhance biodiversity in the UK, through a series of individual Habitat Action Plans (HAPs) and Species Action Plans (SAPs) which specify targets for the conservation of habitats and species, and actions designed to meet these targets.
The indicative costs of delivering each of these HAPs and SAPs were estimated at the time they were first published, between 1995 and 1998, and these estimates are now out of date. They were based on prices in the years in which the plans were published. In the light of subsequent experience, many of the actions which were costed at that time no longer appear relevant, appropriate, or the most cost effective means of delivering the BAP targets. The targets themselves are also being updated through a comprehensive BAP targets review, due to be completed in 2006, which will have implications for the costs of delivering the BAP. The original costings were also known to contain significant gaps, particularly in relation to the costs of meeting targets for widespread species. Experience in delivering the BAP has also brought new insights into the true costs of biodiversity conservation and the best means of measuring them1. As a result of these factors, and with a view to the forthcoming Government Spending Review, a review of the BAP costings is timely.
GHK Consulting Ltd and RPS Ecology Ltd were commissioned in 2005 by Defra, English Nature, the Welsh Assembly, the Scottish Executive and the Department of the Environment in Northern Ireland to review and update estimates of the costs of delivering the UK BAP. The first stage of the study involved a methodological review of the HAP costings and the development of revised estimates for species costs, including new estimates of the costs of conserving widespread species through habitat actions at the landscape scale. This was followed by a complete revision of the HAP costings estimates.
This report summarises the methodology employed in revising the BAP costings, and presents a summary of the provisional cost estimates, based on latest available targets. It is accompanied by four more detailed volumes presenting estimates of:
The Costs of delivering Habitat Action Plans
1 For example, a 2002 report for Defra compared actual expenditures under the BAP to date with the indicative costings. This was somewhat inconclusive, because of large data gaps, and a difficulty in identifying whether variations in expenditure were due to changes in the scale of activity or unit costs incurred. However, it suggested that the costs of many plans had been underestimated and some possibly overestimated. Source: Shepherd, P.A., Gillespie, J., Garrod, G. and Willis, K. (2002) An Initial Investigation of the Actual Costs of Implementing UK Biodiversity Action Plans

BAP Costings Summary Report
J2003 4
The Costs of delivering Species Action Plans (through actions for individual species)
The Costs of delivering Species Action Plans (through habitat management for widespread species at the landscape scale); and
Current BAP Expenditures in the UK.

BAP Costings Summary Report
J2003 5
2 SUMMARY OF APPROACH
2.1 HAP Costings
The HAP costings review was informed by an initial methodological review, which examined different approaches and methodological issues in assessing the costs of HAP delivery. The review involved completion of six case studies to revise the costs for particular HAPs2.
The methodological review concluded that the original indicative costings were substantially out of date and did not provide a good estimate of expected future HAP costs. It identified significant methodological problems and limitations in the earlier costings, and concluded that there was a need for the costs of these HAPs to be reviewed on a plan by plan basis.
However, the review recommended that, rather than attempting to cost the HAPs on an action by action basis, that the revised costs should focus as far as possible on the costs of delivering the HAP targets. The review found that for most HAPs, over 95% of the indicative costings related to the costs of delivering habitat management, restoration and re-creation targets, and that the many other costed actions (relating, for example, to research, advice, communications, publicity and international actions) accounted collectively for only a small proportion of overall costs. Furthermore, many of the original actions set out in the HAPs are now out of date and do not reflect current priorities, and therefore inappropriate as a basis for the costings.
The methodological review therefore found that the terrestrial HAPs can be costed by identifying appropriate per hectare management, creation and restoration costs, and applying these to the revised HAP targets. An allowance for non-land related costs can be made by adding a small (5%) mark-up to these cost estimates.
Such an approach does not work for certain freshwater and marine HAPs, given that they do not involve a land management approach, and instead depend heavily on other actions such as survey, research and monitoring activities. For these HAPs, the costs can be estimated by identifying the broad areas of activity involved and estimating the appropriate level of resourcing for the programmes of work required.
The costs of delivering each HAP have been revised on the basis of the approach identified above. The necessary information was gathered through telephone interviews with the lead partner and country leads for each HAP, with data also being sought from habitat restoration and re-creation projects for the habitats in question. These interviews were supplemented by reviews of published information on habitat costs, and by reference to agri-environment and forestry grant scheme literature for each country.
In many cases habitat costs are highly variable and site specific. Where possible, therefore, the approach has been to identify costs that can be averaged over a
2 GHK Consulting Ltd and RPS Ecology Ltd (2005) Revising Estimates of Delivering Habitat Action Plans. Report for Defra and Partners. The six case study HAPs were Blanket Bog, Coastal and Floodplain Grazing Marsh, Upland Oakwood, Sublittoral Sands and Gravels (and other marine HAPs), Lowland Heathland and Eutrophic Standing Waters.

BAP Costings Summary Report
J2003 6
large number of projects and hectares to identify unit costs that are applicable to more than one site. For some HAPs, no such data were found, and it was necessary to develop generalised cost models employing assumptions about the various operations and costs required. The Annexes to the HAP costings report set out in detail the approach adopted for each individual HAP.
The revision of the HAP costings has been complicated somewhat by the evolving nature of the revised targets, which are still under review and not expected to be finalised until Summer 2006. The estimates in this report, which have been updated to include the draft targets at March 2006, are provisional and are likely to change with further target revisions.
The cost estimates for each HAP have been developed using a simple spreadsheet model that combines data on targets and unit costs to produce cost estimates for each HAP. This model is designed to be easily updated if targets change in future or if new unit cost estimates are employed.
2.2 SAP Costings
2.2.1 Individual Species Costs
Budgetary and time constraints precluded a complete review of the detailed costs of delivering all 391 SAPs in the UKBAP. Instead, the consultants reviewed the costs of delivering a sample of SAPs, in order to use this review as a basis for estimating the overall costs of SAP delivery.
The sample was chosen to include two groups of SAPs:
Group 1: High Cost SAPs. Those SAPs known to have the highest delivery costs.
Group 2: Other SAPs. A wider sample of other SAPs, informally stratified to cover a variety of different taxa.
This two stage sampling approach enabled the study to review a collection of SAPs that together account for a large proportion of the indicative SAP costings, while also enabling a review of a wider sample of SAPs to assess possible differences in findings between high cost and lower cost SAPs.
In all, the costs of delivery of 34 SAPs were reviewed, comprising:
Group 1: 13 SAPs with indicative costs greater than £100k per year
Group 2: 21 SAPs selected through an informal stratification procedure and covering a variety of taxa.
The sample, which covers 8% of the SAPs by number, accounts for 49% of the costs of SAP delivery, as estimated by the previous indicative costings.
The study involved a series of telephone interviews with lead and support partners in SAP delivery. In many cases it was possible to gain the information required from the lead partner. However, for more complex and wide ranging SAPs such as those for marine mammals, it was necessary to contact several partners to gain the necessary information.
BAP Costings Summary Report
J2003 7
These interviews enabled the delivery costs of each SAP to be assessed. These costs were estimated for the five year period between 2006 and 2011. Partners in the SAPs generally had a clear idea of the actions necessary in the next five years, and their likely resource implications. However, an assessment of the costs of delivering SAPs beyond 2011 was found not to be feasible, given the great uncertainties involved.
The total costs of delivery of individual species actions was estimated by taking the combined costs of the 34 SAPs in the sample and adding to this an estimate of the costs of delivering the remaining 357 SAPs in the UK BAP. The latter was estimated by applying a scaling factor to the earlier indicative costings, calculated on the basis of the difference in the estimated cost of delivery of the SAPs for the 21 Group 2 species in the sample.3
2.2.2 Landscape Scale Action for Widespread Species
As well as the costs of delivering actions for individual species, meeting SAP targets also requires the delivery of habitat management at the landscape scale, in order to deliver targets for widespread species (notably farmland birds, but also other taxa). These SAP-related costs were not covered by the earlier SAP costings (which focused on actions focused on the needs of individual species, such as research, monitoring and advice), nor are they adequately covered by the HAP costings (since they depend on management of widespread, non-priority habitats such as general agricultural land).
For example, delivering SAP targets for the Song Thrush requires particular actions dedicated to understanding and addressing the needs of the individual species, as well as wider action at the landscape scale which will deliver the broad habitat requirements of a suite of widespread BAP species, including Song Thrush. This landscape scale action has not been costed by previous studies.
The costs of delivering SAP actions for widespread species at the landscape scale have been calculated using a method that involved six steps, as follows:
Divide the UK into landscape units
Select the species for modelling
Model the response of those species to the habitat changes
Apply a suite of habitat changes financed by environmental schemes
Assess the achievement of the SAP targets
Cost the changes for the UK, countries and the broad habitats
3 The report found that the costs for these SAPs were 168% higher than previous estimates, and this factor was applied to the previous estimate of the indicative costs of delivery of the 357 unsampled SAPs. The aggregation method used was based on advice received from Defra and GHK statisticians. For full details please see the report on individual SAP costings.
BAP Costings Summary Report
J2003 8
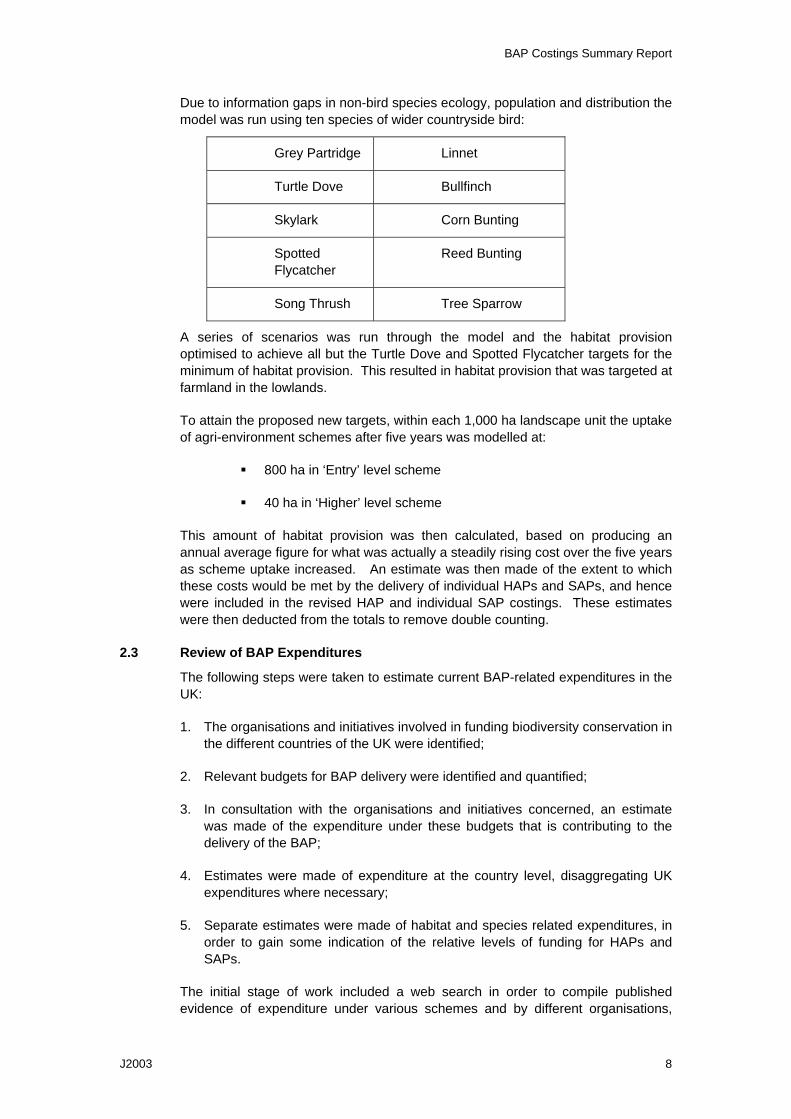
Due to information gaps in non-bird species ecology, population and distribution the model was run using ten species of wider countryside bird:
Grey Partridge Linnet
Turtle Dove Bullfinch
Skylark Corn Bunting
Spotted Flycatcher
Reed Bunting
Song Thrush Tree Sparrow
A series of scenarios was run through the model and the habitat provision optimised to achieve all but the Turtle Dove and Spotted Flycatcher targets for the minimum of habitat provision. This resulted in habitat provision that was targeted at farmland in the lowlands.
To attain the proposed new targets, within each 1,000 ha landscape unit the uptake of agri-environment schemes after five years was modelled at:
800 ha in ‘Entry’ level scheme
40 ha in ‘Higher’ level scheme
This amount of habitat provision was then calculated, based on producing an annual average figure for what was actually a steadily rising cost over the five years as scheme uptake increased. An estimate was then made of the extent to which these costs would be met by the delivery of individual HAPs and SAPs, and hence were included in the revised HAP and individual SAP costings. These estimates were then deducted from the totals to remove double counting.
2.3 Review of BAP Expenditures
The following steps were taken to estimate current BAP-related expenditures in the UK:
1. The organisations and initiatives involved in funding biodiversity conservation in the different countries of the UK were identified;
2. Relevant budgets for BAP delivery were identified and quantified;
3. In consultation with the organisations and initiatives concerned, an estimate was made of the expenditure under these budgets that is contributing to the delivery of the BAP;
4. Estimates were made of expenditure at the country level, disaggregating UK expenditures where necessary;
5. Separate estimates were made of habitat and species related expenditures, in order to gain some indication of the relative levels of funding for HAPs and SAPs.
The initial stage of work included a web search in order to compile published evidence of expenditure under various schemes and by different organisations,

BAP Costings Summary Report
J2003 9
across England, Scotland, Wales and Northern Ireland, and to create a table of BAP related expenditure. Sources included annual reports of different organisations and initiatives, and financial information found on their respective websites.
Once this stage had been completed, telephone interviews were conducted with the different organisations and initiatives to obtain further information about current expenditures and to inform the analysis of expenditures attributable to the BAP, to HAPs and SAPs, and to the different UK countries.
BAP Costings Summary Report
J2003 10
3 METHODOLOGICAL ISSUES
3.1 Overview
The revised BAP costings:
Refer to the total costs of delivering the BAP, rather than attempting to estimate additional costs relative to existing expenditures;
Aim to identify costs attributable to the BAP itself, rather than other legislative drivers, or costs incurred as part of the core duties of the statutory conservation agencies;
Are based on a combination of BAP targets and actions, as appropriate;
Include the costs of land purchase where this is necessary to meet habitat and species targets;
Include opportunity costs where these are reflected in grant rates and land purchase costs;
Refer to the net costs of actions, taking account of any revenues and cost savings;
Use existing grant rates as far as these are available, relevant and appropriate;
Include estimates of administrative and central costs;
Are all expressed in 2005/06 prices.
Some of the key methodological issues are discussed below.
3.2 Total and Additional Costs
The previous indicative costings attempted to assess the additional costs of delivering the BAP, taking account of existing expenditures and aiming to identify the extra expenditures involved. In practice, the extent to which this was possible varied, with some cost estimates deducting existing expenditures and others failing to do so. The exercise was complicated by a lack of data on existing expenditures (e.g. for the woodland HAPs). As a result, the earlier indicative costings were somewhat inconsistent and comprised a combination of total costs and additional costs. Where additional costs were estimated, they were relative to expenditure levels at the time the plan was introduced (1995 or 1998).
The current exercise has been based on the total, rather than additional costs, of BAP delivery. This approach partly reflects the difficulties in assessing existing expenditures for many of the individual plans, which make an assessment of additional costs difficult. However, it is also argued that estimates of total costs are likely to be more transparent and robust over time than estimates of additional costs based on historic expenditure levels. The cost estimates can then be compared with existing BAP expenditures in aggregate to assess any additional resources needed at a particular point in time. The BAP funding assessment undertaken as part of this exercise provides a basis for comparison of BAP costs with existing expenditures.

BAP Costings Summary Report
J2003 11
3.3 BAP Attributable Costs
The costings exercise has aimed to assess the costs of implementing the requirements of the UK Biodiversity Action Plan, and the actions and targets within it. It has therefore sought to exclude costs which result primarily from other drivers, such as the EU Habitats and Water Framework Directives, SSSI legislation and the Local Biodiversity Action Plan process.
However, the boundaries between these different drivers are often not clear cut. In some cases, the costs of actions that clearly contribute to the BAP have been excluded because they are primarily driven by other processes. An example would be the monitoring of a BAP habitat as a requirement of the Habitats Directive, the recruitment of a SAC project officer to oversee management of a particular site, or the restoration of wetland sites being undertaken as a requirement of the Water Framework Directive, where in each case the action involved is not a requirement of the BAP.
However, in other cases, the requirements of BAP and other drivers cannot be disentangled. For example, the HAPs include targets for the creation, restoration and management of individual habitats. These targets include areas of sites designated under the Habitats and Birds Directives and under SSSI legislation. On the grounds that meeting these targets is a requirement of the BAP, as well as a lack of data in many cases on designated and non-designated areas, the approach has been to assess the costs of delivering the BAP targets as a whole.
Thus it could be argued that a proportion of the costs identified – while important for the delivery of the BAP - would be incurred even in the absence of the BAP, as a result of other drivers such as SSSI legislation. It is important therefore to recognise these areas of overlap and to ensure that there is consistent treatment where the costings are used to inform policy decisions. For example, comparisons of costs and existing expenditures need to be made on a like for like basis.
The costings also exclude the core duties of the statutory conservation agencies, including only the costs of particular HAP or SAP related actions. Examples of excluded activities are the general administration of the SSSI system, routine casework, and general educational and policy activities.
3.4 Land Purchase
The costings include the costs of land purchase where this is necessary to achieve BAP targets. In most cases land purchase is not necessary, and it is assumed that appropriate management can be met under private ownership, using appropriate incentives. However, for some habitats, such as the creation of saltmarsh and mudflat through managed realignment schemes, land purchase has a major role to play. The land purchase and incentive-based approaches are often interchangeable. For example, a managed realignment scheme might be achieved by buying farmland at £5,000 to £7,000 per hectare or by compensating the farmer for income foregone, paying an agri-environment payment of £500-£700 per hectare per year for ten years.
3.5 Opportunity Costs
In general the costings include the opportunity costs of BAP related activities, since in most cases these give rise to some form of compensation, and therefore result in a direct financial cost. For example, the creation and management of habitats often results in a loss of agricultural production. The income foregone is reflected in agri-environment payment rates, and therefore included in the costings. Alternatively it
BAP Costings Summary Report
J2003 12
might be captured by the purchase of the land by the conservation agencies at the market rate (for example for use in a managed realignment scheme). By using similar per hectare costs irrespective of land ownership, the cost estimates aim to include opportunity costs as if the land were in private and productive use.
3.6 Net and Gross Costs
Where there is a difference between the net and gross costs of an action, for example because it yields revenues or results in a cost saving elsewhere, the net costs are used. Examples might include the sale of timber, which might reduce the net cost of a sand dune restoration scheme which involves removal of forestry, or a managed realignment scheme, which avoids the need to replace existing flood defences. In some instances, the costs of habitat creation may even be negative, where the alternative is a more costly option.
3.7 Public and Private Sector Costs
The costings estimate the cost of delivering the BAP targets as a whole, and aim to include both public and private sector costs. The majority of these costs are met by the public sector, which, as well as managing land and undertaking a wide range of BAP related activity itself, also provides grants to private and voluntary sector land managers.
Many of the HAPs are costed using unit costs from agri-environment and woodland grant schemes, which are assumed to reflect the costs of meeting the area based targets, irrespective of land ownership. The general approach is to estimate the costs on the assumption that a grant or incentive needs to be paid from the public sector to a private land owner or land manager in order to achieve the given targets. In practice, incentives will not always be paid in every case, since the land may be in public ownership, or there may be eligibility restrictions that restrict the levels of payments made. In these cases, it is argued that the relevant payment rate is still the best estimate of the unit cost of meeting the target, on the grounds that it reflects a combination of financial and opportunity costs associated with land management, irrespective of who bears these costs.
In the case of SAPs, a significant proportion of costs are met by the voluntary sector, because much of the species related work undertaken by organisations like the RSPB and Wildlife Trusts is not eligible for grant funding from the public sector.
3.8 Grants and Incentives
For many of the HAPs, it is assumed that the current grants and incentive payments available under agri-environment and woodland grant schemes represent the best available estimate of the per hectare costs of meeting BAP targets.
Certain assumptions are needed in using these payment rates. For example, where different options are available for different land and habitat types, it is often necessary to make an assumption about the extent to which each option applies to the habitat in question. An example might be where a different payment rate is available from re-establishing a habitat from arable land and from grassland. In these cases the cost model specifies the proportions in which different rates are used.
In general, capital costs present greater methodological problems than annual costs, because they tend to be more variable and discretionary. For example, different payment rates are available under agri-environment schemes for
BAP Costings Summary Report
J2003 13
clearance of scrub, depending on its nature, while it is also necessary to come to a view about the extent to which scrub clearance (as opposed to other operations) is required in the restoration of the habitat. In each case it is necessary to make assumptions and these are specified in the annexes for each habitat and in the cost model.
The use of current standard payment rates, while providing a transparent and evidence based approach, does raise some issues with respect to the treatment of marginal costs and variations in payments between countries (see below). In general these tend to make the cost estimates conservative.
3.9 Marginal Costs
Use of current payment rates for agri-environment and forestry schemes is a conservative approach that will tend to underestimate the true costs of BAP delivery. This is because we would expect the management, creation and restoration of habitats to have an upward sloping marginal cost curve. As the area of habitat increases, we expect the unit cost of that habitat to increase, as it becomes necessary to include land that is more difficult or costly to manage, and/or to entice more reluctant land managers to enter schemes. The result is that while payment rates are often fixed over specified periods, and while it may be possible to manage, restore or create a certain area of habitat at a particular unit cost, increasing the area target may only be achievable at a higher per hectare cost. This will not necessarily be the case where land management schemes are currently oversubscribed. In addition, it is possible that some factors will help to reduce costs as the area of habitat delivered increases, such as economies of scale and increased experience and knowledge.
Estimating marginal cost curves for each habitat would not be possible without a much larger and more complex study than this one. In the absence of such evidence, cost estimates based on current payment rates should be regarded as conservative.
3.10 Differences in Country Level Costs
The use of available incentive rates for land management also gives rise to some anomalies in the assumed unit costs for different countries. Differences in agri-environment rates between countries do reflect some differences in the real costs of land management. For example, they tend to be higher in England where land prices, agricultural productivity and labour costs tend to be higher than for the other countries of the UK.
However, there are also some differences in incentive payments between the different devolved administrations that are unlikely to be explained by the true costs of habitat management, and it appears that some schemes are more generous than others. Payment rates can be set at a variable proportion of the estimated costs incurred and income foregone, particularly to give greater encouragement to certain activities than to others. In this respect differences in payment rates are likely to reflect differences in the incentives that have to be offered to land managers in different countries to meet the priorities at the country level.
Once again, it is argued that the available payment rates in different countries provide the best available estimates of marginal unit costs, but that they should be treated as being conservative.
BAP Costings Summary Report
J2003 14
3.11 Administration and Central Costs
The previous indicative costings generally assumed that administration costs would add 10% to the costs of BAP delivery. An allowance for this was made in the Tranche 1 costings, but not those for Tranche 2, so it was added separately to the aggregate totals in the summary report.
The revised costings do not use a blanket 10% estimate but consider the administration of species and habitat actions on a case per case basis.
HAP Administration Costs
In all cases the HAP costings include an allowance for the costs of co-ordinating and administering the actions for each habitat.
The methodological review concluded that costs of administering land management schemes and projects are higher than suggested by the earlier indicative costings, and that 15% is a more realistic estimate. This includes not only basic costs of administering the relevant schemes but also associated advisory, monitoring and evaluation work, which is often critical to the effectiveness of delivery. As a result, an allowance of 15% has been added to identified costs of habitat management in this report to allow for administration and central costs4.
For some habitats requiring particularly complex actions, a greater allowance has been made. For example, for managed retreat schemes for saltmarsh, mudflat and saline lagoon creation, a 50% cost of design and project management has been assumed, based on Environment Agency estimates.
In addition, to the administration of habitat management work, there are further administration costs associated with the co-ordination of the delivery of the HAP as a whole and the various other actions within it. These are dealt with in one of two ways:
For those (terrestrial and some wetland) HAPs dominated by land management, and for which a 15% allowance is included to cover the cost of this land management work, any further administration costs are assumed to be included in the 5% allowance for “other costs”;
For the other freshwater, coastal and marine HAPs where individual actions or packages of actions have been costed, the costs of co-ordination of the HAP have been estimated separately. In some cases this cost is the cost of appointing a dedicated HAP co-ordinator, while in others a certain number of days of co-ordination activity have been costed.
SAP Administration Costs
For some SAPs, the costs of administration and co-ordination of actions have been estimated in consultation with the lead partner, based on required time inputs. In
4 In practice, administration costs vary between schemes, with the costs of running some agri-environment and woodland management schemes higher than for others. 15% is taken as an overall average. See the HAP costings methodological review for more details.
BAP Costings Summary Report
J2003 15
all other cases, administration and co-ordination costs are assumed to add 10% to the SAP costings, in line with previous estimates in the indicative costings. 5
3.12 Staff Costs
Delivery of many HAPs and SAPs requires employment of dedicated officers to undertake particular actions (e.g. co-ordinators, policy, advisory and education officers). The cost of employing staff is more than just the cost of salaries, but includes other financial costs such as National Insurance and pension costs, office expenses, IT costs, travel and subsistence costs, training and other human resource costs, administrative support, and other expenses such as the cost of conferences and publications. While these extra costs vary from one post to another, they are estimated to be on average equal to salary costs. Thus the total cost of employing staff is assumed to be twice the cost of staff salaries.
3.13 Inflation
The indicative costings were expressed in prices current at the time they were made. General prices (as measured by HM Treasury’s GDP deflator) have increased by 28% since 1995/96 and 17% since 1998/99. Therefore, any comparisons or analysis based on the indicative costings in this report have inflated them by 28% (for Tranche 1) and 17% (Tranche 2) to express them in 2005/06 prices.
3.14 Voluntary Activities
Costs of voluntary activities are not estimated separately, but do form a small part of the overall costs of HAP delivery. The costings take account of labour costs, and where voluntary labour replaces paid labour (e.g. in nature reserve management), the overall cost estimates will include some volunteer time. While the HAP costings found no examples where the treatment of voluntary activities would have any significant bearing on the costings, voluntary activities were found to be more significant in the costings of species. Fully accounting for volunteer time (such as the work undertaken by amateur ornithologists) would add substantially to the species costings6.
3.15 The Impact of Policy Change
Policy changes can have a significant effect on the costs of BAP delivery. For example, the implementation of the Water Framework Directive is helping to meet the costs of monitoring and restoring many of the freshwater and coastal HAPs, reducing the need for additional and dedicated expenditures under the BAP.
In many of the HAPs, the recent CAP reform and the introduction of the Single Farm Payment is likely to influence the costs of land management by reducing incentives for intensive agriculture. By reducing incentives for intensification of agriculture it may also contribute to targets for farmland SAPs. It is possible that this may reduce the agri-environment payments required to deliver the required habitat and species targets. However, this may not always be the case, while there may be a need for new types of incentives to prevent agricultural
5 The 10% figure is used for consistency with the previous estimates, and is also supported by the lead partner interviews. In several cases estimates by partners of their inputs in administering and co-ordinating SAPs approximated to 10% of the SAP costs. 6 For example, the species costings include estimates of the financial costs for administering the Breeding Bird Survey under different farmland bird species costings, but exclude the cost of the voluntary fieldwork involved, which involves many thousands of amateur ornithologists.
BAP Costings Summary Report
J2003 16
abandonment. Agri-environment payments in England and Wales have recently been revised, and the costings have used the current payment rates.
The earlier methodological review for the HAP costings considered the possible impacts of policy change on the costs of delivering each of the case study HAPs. It concluded that, while policy change had significant potential to influence the costs (positively or negatively) in future, the direction and magnitude of change was often uncertain, and that the costings exercise should be based on the latest available data for unit costs and payment rates.
3.16 Response Bias
For the SAPs in particular, as well as for HAPs where the costings were based on the identification of a package of actions designed to meet the targets, the cost estimates had to rely to a large extent on the judgement of the delivery partners for each plan, who were asked to indicate the actions and resources required to meet the targets. While this is fully consistent with the BAP process, which places responsibility on lead partners to co-ordinate the actions necessary to deliver plans, it does raise some potential concerns about possible biases related to the responses of individual partners. Thus it is possible that some respondents underestimated resource requirements, constraining their responses according to expectations about the resources available, while others may have made overestimates, perhaps to make the case for additional resources for their organisations and activities.
The consultants were fully aware of these risks in interviewing the partners concerned, and stressed that estimates needed to be made of the resources required for BAP delivery (rather than those which partners expected to be available). It was also stressed that the exercise was informing an overall analysis of the costs of BAP delivery, rather than the resourcing of individual plans, in an attempt to minimise the risk of strategic responses.
While the cost estimates are based on responses received from the partners, they also incorporate analysis by the consultants of the costs involved. The analysis has attempted to assess the costs of BAP delivery in a realistic manner. In some cases this required selective and critical analysis of the information provided by consultees about the desired actions and resources, and the removal of some costs not considered absolutely essential for BAP delivery.

BAP Costings Summary Report
J2003 17
4 SUMMARY OF COSTS
4.1 HAP Costings
The combined annual cost of delivering all of the UK Habitat Action Plans is provisionally estimated at £321 million between 2005 and 2010, rising to £401 million between 2015 and 2020.
Table 4.1: Estimated Annual Costs of Habitat Action Plans, UK (£000) 2005 to 2010 2010 to 2015 2015 to 2020Wood Pasture and Parkland 3,415 6,693 7,982Native Woodlands 92,332 73,631 78,442Lowland Heathland 14,192 17,747 20,180Upland Heath 15,505 17,148 16,254Blanket Bog 37,802 59,949 59,949Lowland Raised Bogs 1,230 2,388 3,500Coastal and Floodplain Grazing Marsh 25,528 49,750 51,475Purple Moor Grass and Rush Pastures 7,195 8,927 10,180Lowland Calcareous Grassland 12,595 10,786 9,848Lowland Dry Acid Grassland 4,678 5,336 5,803Upland Calcareous Grassland 1,486 2,309 2,320Upland Hay Meadows 214 244 242Lowland Meadows 1,520 1,962 2,129Hedgerows 44,589 72,279 72,541Arable Field Margins 23,626 32,021 33,418Limestone Pavements 568 545 545Fens 563 1,209 1,530Reedbed 1,419 1,707 1,718Aquifer Fed Naturally Fluctuating Water Bodies 17 17 8Eutrophic Standing Waters 1,590 1,590 1,570Mesotrophic Lakes 1,372 1,372 1,362Chalk Rivers 1,359 1,394 1,250Machair 1,508 1,479 1,438Vegetated Shingle 636 636 636Maritime Cliff and Slope 2,599 2,522 2,520Sand Dunes 3,414 2,913 2,913Saltmarsh 3,423 3,423 2,793Mudflats 10,524 10,524 7,524Saline Lagoons 676 510 373Marine Habitats (12 HAPs) 6,012 5,912 912 321,586 396,924 401,354
The increase in costs over time is largely explained by the increase in areas of habitat that require ongoing management.
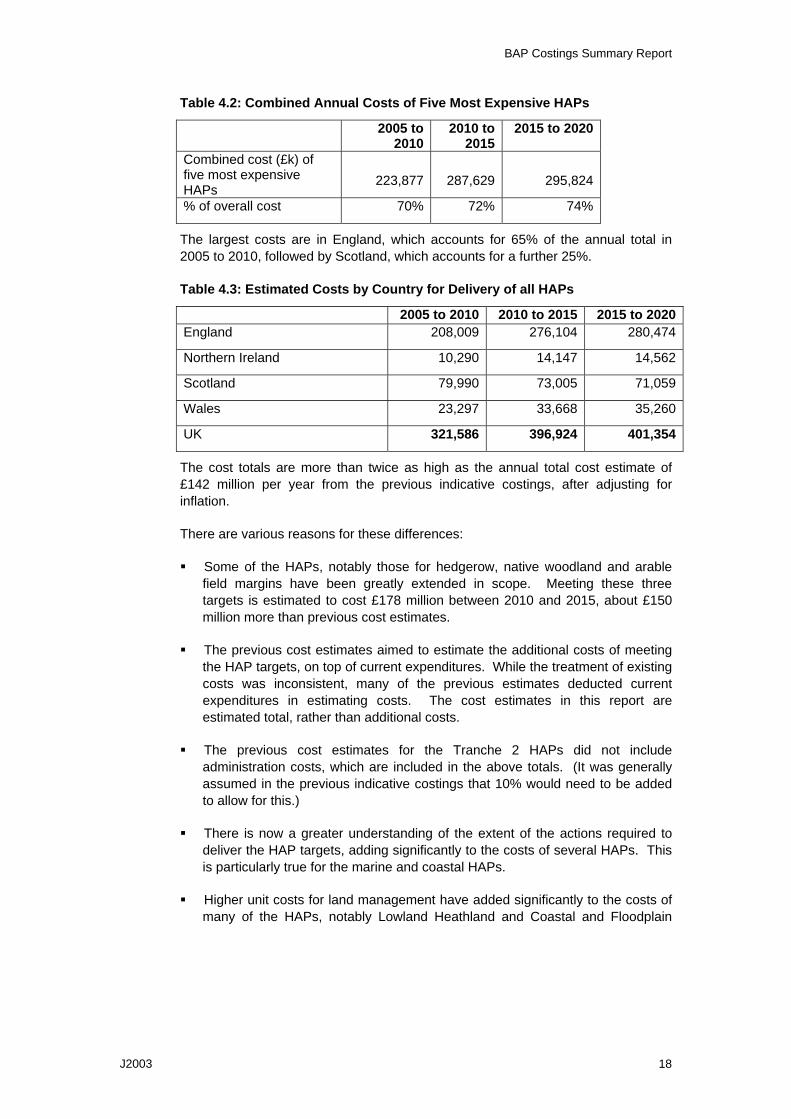
As with the previous indicative costings, the costs are heavily concentrated among a few expensive HAPs. The five HAPs with largest costs of more than £20 million per year (hedgerow, native woodlands, coastal and floodplain grazing marsh, blanket bog, and arable field margins) together account for 70% of the costs (Table 4.2).
BAP Costings Summary Report
J2003 18
Table 4.2: Combined Annual Costs of Five Most Expensive HAPs
2005 to 2010
2010 to 2015
2015 to 2020
Combined cost (£k) of five most expensive HAPs
223,877 287,629 295,824
% of overall cost 70% 72% 74%
The largest costs are in England, which accounts for 65% of the annual total in 2005 to 2010, followed by Scotland, which accounts for a further 25%.
Table 4.3: Estimated Costs by Country for Delivery of all HAPs
2005 to 2010 2010 to 2015 2015 to 2020England 208,009 276,104 280,474
Northern Ireland 10,290 14,147 14,562
Scotland 79,990 73,005 71,059
Wales 23,297 33,668 35,260
UK 321,586 396,924 401,354
The cost totals are more than twice as high as the annual total cost estimate of £142 million per year from the previous indicative costings, after adjusting for inflation.
There are various reasons for these differences:
Some of the HAPs, notably those for hedgerow, native woodland and arable field margins have been greatly extended in scope. Meeting these three targets is estimated to cost £178 million between 2010 and 2015, about £150 million more than previous cost estimates.
The previous cost estimates aimed to estimate the additional costs of meeting the HAP targets, on top of current expenditures. While the treatment of existing costs was inconsistent, many of the previous estimates deducted current expenditures in estimating costs. The cost estimates in this report are estimated total, rather than additional costs.
The previous cost estimates for the Tranche 2 HAPs did not include administration costs, which are included in the above totals. (It was generally assumed in the previous indicative costings that 10% would need to be added to allow for this.)
There is now a greater understanding of the extent of the actions required to deliver the HAP targets, adding significantly to the costs of several HAPs. This is particularly true for the marine and coastal HAPs.
Higher unit costs for land management have added significantly to the costs of many of the HAPs, notably Lowland Heathland and Coastal and Floodplain
BAP Costings Summary Report
J2003 19
Grazing Marsh. These reflect higher agri-environment payment rates, notably under the English Higher Level Stewardship Scheme7.
The revised costings include some items not included in the previous cost estimates. For example, the costs of meeting the targets for mudflat creation were not included in the previous estimates but add an additional £10.5 million to the estimated annual costs between 2005 and 2015.
4.2 SAP Costings
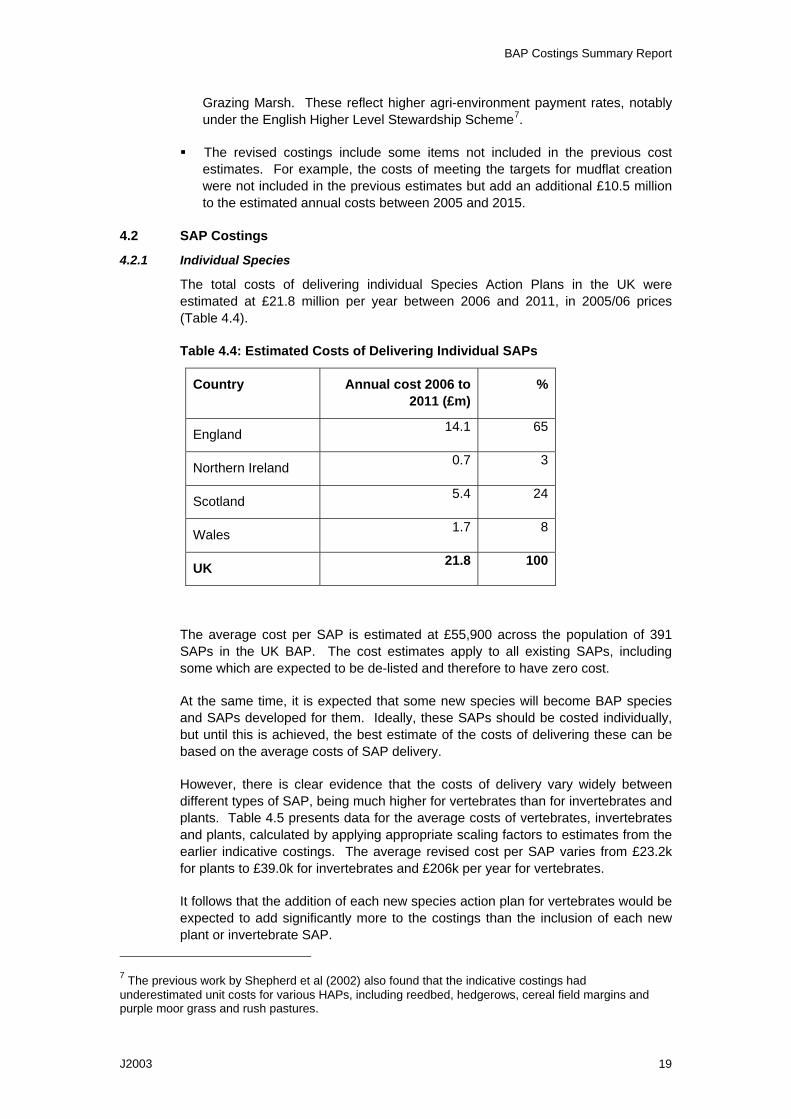
4.2.1 Individual Species
The total costs of delivering individual Species Action Plans in the UK were estimated at £21.8 million per year between 2006 and 2011, in 2005/06 prices (Table 4.4).
Table 4.4: Estimated Costs of Delivering Individual SAPs
Country Annual cost 2006 to 2011 (£m)
%
England 14.1 65
Northern Ireland 0.7 3
Scotland 5.4 24
Wales 1.7 8
UK 21.8 100
The average cost per SAP is estimated at £55,900 across the population of 391 SAPs in the UK BAP. The cost estimates apply to all existing SAPs, including some which are expected to be de-listed and therefore to have zero cost.
At the same time, it is expected that some new species will become BAP species and SAPs developed for them. Ideally, these SAPs should be costed individually, but until this is achieved, the best estimate of the costs of delivering these can be based on the average costs of SAP delivery.
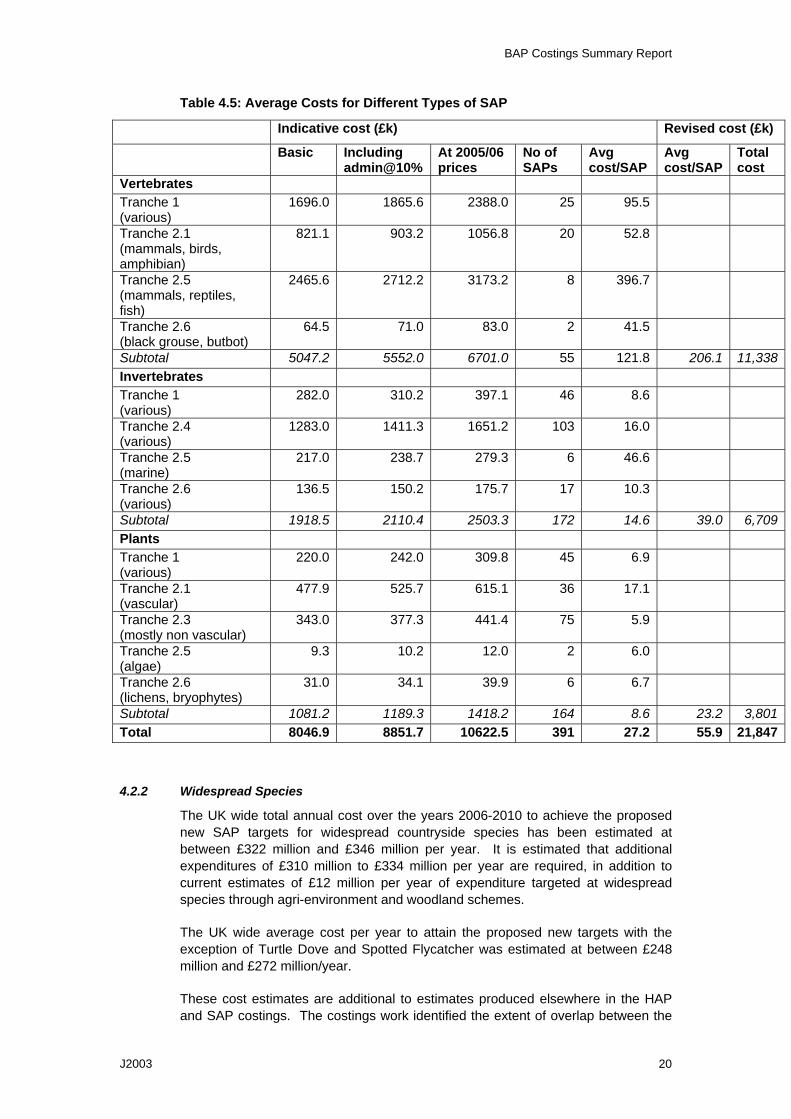
However, there is clear evidence that the costs of delivery vary widely between different types of SAP, being much higher for vertebrates than for invertebrates and plants. Table 4.5 presents data for the average costs of vertebrates, invertebrates and plants, calculated by applying appropriate scaling factors to estimates from the earlier indicative costings. The average revised cost per SAP varies from £23.2k for plants to £39.0k for invertebrates and £206k per year for vertebrates.
It follows that the addition of each new species action plan for vertebrates would be expected to add significantly more to the costings than the inclusion of each new plant or invertebrate SAP.
7 The previous work by Shepherd et al (2002) also found that the indicative costings had underestimated unit costs for various HAPs, including reedbed, hedgerows, cereal field margins and purple moor grass and rush pastures.
BAP Costings Summary Report
J2003 20
Table 4.5: Average Costs for Different Types of SAP
Indicative cost (£k) Revised cost (£k)
Basic Including admin@10%
At 2005/06 prices
No of SAPs
Avg cost/SAP
Avg cost/SAP
Total cost
Vertebrates Tranche 1 (various)
1696.0 1865.6 2388.0 25 95.5
Tranche 2.1 (mammals, birds, amphibian)
821.1 903.2 1056.8 20 52.8
Tranche 2.5 (mammals, reptiles, fish)
2465.6 2712.2 3173.2 8 396.7
Tranche 2.6 (black grouse, butbot)
64.5 71.0 83.0 2 41.5
Subtotal 5047.2 5552.0 6701.0 55 121.8 206.1 11,338Invertebrates Tranche 1 (various)
282.0 310.2 397.1 46 8.6
Tranche 2.4 (various)
1283.0 1411.3 1651.2 103 16.0
Tranche 2.5 (marine)
217.0 238.7 279.3 6 46.6
Tranche 2.6 (various)
136.5 150.2 175.7 17 10.3
Subtotal 1918.5 2110.4 2503.3 172 14.6 39.0 6,709Plants Tranche 1 (various)
220.0 242.0 309.8 45 6.9
Tranche 2.1 (vascular)
477.9 525.7 615.1 36 17.1
Tranche 2.3 (mostly non vascular)
343.0 377.3 441.4 75 5.9
Tranche 2.5 (algae)
9.3 10.2 12.0 2 6.0
Tranche 2.6 (lichens, bryophytes)
31.0 34.1 39.9 6 6.7
Subtotal 1081.2 1189.3 1418.2 164 8.6 23.2 3,801Total 8046.9 8851.7 10622.5 391 27.2 55.9 21,847
4.2.2 Widespread Species
The UK wide total annual cost over the years 2006-2010 to achieve the proposed new SAP targets for widespread countryside species has been estimated at between £322 million and £346 million per year. It is estimated that additional expenditures of £310 million to £334 million per year are required, in addition to current estimates of £12 million per year of expenditure targeted at widespread species through agri-environment and woodland schemes.
The UK wide average cost per year to attain the proposed new targets with the exception of Turtle Dove and Spotted Flycatcher was estimated at between £248 million and £272 million/year.
These cost estimates are additional to estimates produced elsewhere in the HAP and SAP costings. The costings work identified the extent of overlap between the
BAP Costings Summary Report
J2003 21
widespread species costings and the costings for HAPs and individual SAPs, and made deductions from the widespread species costings to avoid double counting.
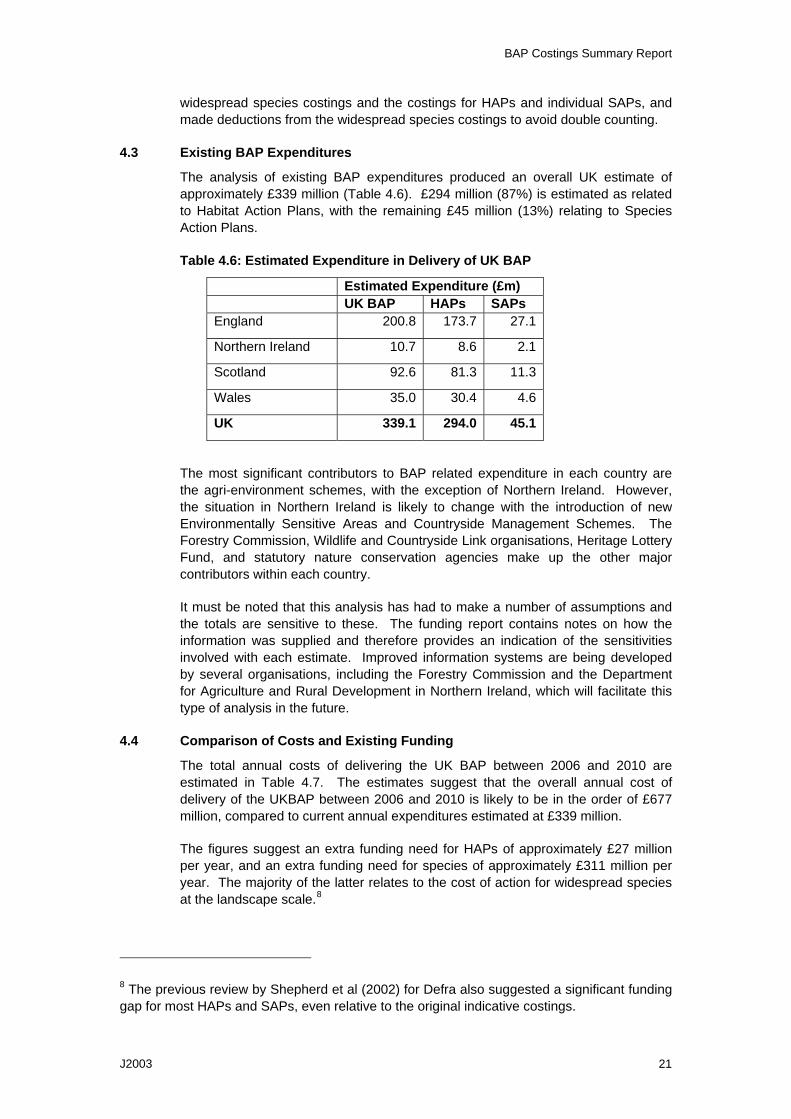
4.3 Existing BAP Expenditures
The analysis of existing BAP expenditures produced an overall UK estimate of approximately £339 million (Table 4.6). £294 million (87%) is estimated as related to Habitat Action Plans, with the remaining £45 million (13%) relating to Species Action Plans.
Table 4.6: Estimated Expenditure in Delivery of UK BAP
Estimated Expenditure (£m) UK BAP HAPs SAPs England 200.8 173.7 27.1
Northern Ireland 10.7 8.6 2.1
Scotland 92.6 81.3 11.3
Wales 35.0 30.4 4.6
UK 339.1 294.0 45.1
The most significant contributors to BAP related expenditure in each country are the agri-environment schemes, with the exception of Northern Ireland. However, the situation in Northern Ireland is likely to change with the introduction of new Environmentally Sensitive Areas and Countryside Management Schemes. The Forestry Commission, Wildlife and Countryside Link organisations, Heritage Lottery Fund, and statutory nature conservation agencies make up the other major contributors within each country.
It must be noted that this analysis has had to make a number of assumptions and the totals are sensitive to these. The funding report contains notes on how the information was supplied and therefore provides an indication of the sensitivities involved with each estimate. Improved information systems are being developed by several organisations, including the Forestry Commission and the Department for Agriculture and Rural Development in Northern Ireland, which will facilitate this type of analysis in the future.
4.4 Comparison of Costs and Existing Funding
The total annual costs of delivering the UK BAP between 2006 and 2010 are estimated in Table 4.7. The estimates suggest that the overall annual cost of delivery of the UKBAP between 2006 and 2010 is likely to be in the order of £677 million, compared to current annual expenditures estimated at £339 million.
The figures suggest an extra funding need for HAPs of approximately £27 million per year, and an extra funding need for species of approximately £311 million per year. The majority of the latter relates to the cost of action for widespread species at the landscape scale.8
8 The previous review by Shepherd et al (2002) for Defra also suggested a significant funding gap for most HAPs and SAPs, even relative to the original indicative costings.

BAP Costings Summary Report
J2003 22
Table 4.7: Comparison of Revised Annual Costs and Current Expenditures, 2006 to 2010
Estimated Costs (£m)
Estimated Current Spend
(£m)
HAPs 321 294
Individual species
22
Widespread species
334
SAPs
Total species 356 45
Overall Total 677 339
The estimated cost of HAP delivery is expected to increase to £397 million between 2010 and 2015, and £401 million between 2015 and 2020, suggesting the need for expenditure on HAP delivery to increase by £80 million over this period.
The largest current funding gap relates to action for widespread species. It is important to note that this is also where the greatest level of uncertainty lies, given that the costings are sensitive to the predictions of the population model for widespread species.
Table 4.8: Comparison of Estimated Costs and Funding by Country, 2006 to 2010
England NI Scotland Wales UK Costs HAP 208 10 80 23 321SAP Individual 14 1 5 2 22 Widespread 244 13 50 27 334 SAP Total 258 14 55 29 356Total 466 24 135 52 677Funding HAP 174 9 81 30 294SAP 27 2 11 5 45Total 201 11 92 35 339 Estimated Shortfall
265 13 43 17 338
Table 4.8 compares estimated costs and levels of funding by country. This points to a significant shortfall in biodiversity funding in each country of the UK, with the largest funding gaps relating to widespread species. However, it is also estimated that there is a funding gap of £34 million for delivery of HAPs in England between 2006 and 2010.
UK Biodiversity Action Plan: Preparing Costings for Species and Habitat Action Plans
Updating Estimates of Current and Future BAP Expenditures in the UK
Final Report to Defra and Partners:
Submitted by GHK Consulting Ltd
Residence 2, Royal William Yard, Plymouth, PL1 3RP
Tel: 01752 262244; Fax 01752 262299
526 Fulham Road, London SW6 5NR
Tel: 020 7471 8000; Fax: 020 7735 0784
www.ghkint.com
Updating Estimates of Current and Future BAP Expenditures in the UK
Document Control
Document Updating Estimates of Current and Future BAP Expenditures in the UK – Final Report
Job No. J2003
Prepared by Andy White
Checked by Matt Rayment
J2003

Updating Estimates of Current and Future BAP Expenditures in the UK
CONTENTS
1 INTRODUCTION..........................................................................................................................................2 2 METHODOLOGY.........................................................................................................................................3 2.1 Overall Approach.......................................................................................................................................3 2.2 Key Methodological Issues .......................................................................................................................3 2.3 Research Methods ....................................................................................................................................4 3 RESULTS.....................................................................................................................................................6 3.1 England .....................................................................................................................................................6 3.2 Scotland ................................................................................................................................................. 10 3.3 Wales...................................................................................................................................................... 10 3.4 Northern Ireland ..................................................................................................................................... 12 4 CONCLUSIONS........................................................................................................................................ 13 4.1 The Current Estimates of BAP Related Expenditure ............................................................................. 13 4.2 Future Estimates of BAP Related Expenditure ...................................................................................... 13 4.3 Implications for the Funding Gap ........................................................................................................... 14 ANNEX 1 – DETAILED EXPENDITURE ESTIMATES AND NOTES BY COUNTRY ................................... 17 ANNEX 2 – DETAILED PROJECTIONS OF ESTIMATED EXPENDITURE BY COUNTRY ........................ 20
J2003 1

Updating Estimates of Current and Future BAP Expenditures in the UK
1 INTRODUCTION
GHK Consulting Ltd was commissioned by Defra, the Scottish Executive, the Welsh Assembly and the Department of the Environment in Northern Ireland to undertake a small study to update previous estimates of expenditure relating to the UK Biodiversity Action Plan (BAP) and profile the expenditure levels to the year 2010/11. The estimation of funding provision has been part of a wider piece of work, undertaken by GHK Consulting Ltd with RPS Ecology Ltd, to provide revised estimates of the costs of delivering the UK BAP. One of the overall aims has been to compare current levels of BAP related expenditure with the estimated costs, in order to identify whether current funding provision was adequate to meet the costs identified.
The previous study found that it is often not possible to identify current levels of expenditure attributable to individual HAPs and SAPs. Data available from the agriculture departments, Forestry Commission and statutory agencies often do not provide sufficient detail to enable such an analysis, either because expenditure programmes deal with more than one habitat or species, or because data are not provided in sufficiently disaggregated form. A comparison of expenditures with identified costs is therefore most easily achieved at the aggregate level.
Funding for biodiversity conservation is provided by a wide range of organisations and initiatives. For some organisations biodiversity conservation is a core objective, and accounts for a large proportion of the overall budget, while for others it represents a minor proportion of overall expenditure. This report provides estimates of current and future BAP-related expenditures for all organisations with a significant involvement in funding biodiversity action.
This report provides an estimate of overall BAP related expenditure in the UK, and estimates for each of the four countries (England, Northern Ireland, Scotland and Wales), in order to enable a comparison with the cost estimates. We have sought to identify and update the current levels of BAP related expenditure in each country and then, where possible, provide an estimate of future BAP related expenditure for the year 2010/11.
More detailed data are presented in an Annex to this report and include an estimate of the split between expenditure contributing to progress against habitat action plan (HAP) targets, and against species action plan (SAP) targets.
J2003 2
Updating Estimates of Current and Future BAP Expenditures in the UK
2 METHODOLOGY
2.1 Overall Approach
The following steps were taken to estimate current BAP-related expenditures in the UK:
1. The organisations and initiatives identified by the previous study as being involved in funding biodiversity conservation in the different countries of the UK were contacted again;
2. Some changes had taken place, since the earlier study, to organisations, initiatives and personnel, so the original list of funding streams and contacts was amended accordingly;
3. In consultation with the organisations and initiatives concerned, an estimate was made of the current expenditure that is contributing to the delivery of the BAP;
4. Separate estimates were then obtained, wherever possible, for future BAP related expenditure in the year 2010/11, along with reasons for any expected change;
5. Estimates were made of expenditure at the country level, disaggregating UK expenditures where necessary;
All estimates are expressed in 2005/06 prices.
Some of the key methodological issues that had to be addressed in this process are discussed in Section 2.2.
2.2 Key Methodological Issues
2.2.1 Identifying BAP Expenditures
The analysis attempts to identify current and future expenditures/funding that contribute to the delivery of species and habitat action plans under the UK BAP. In practice, many organisations provided data relating to programmes or budgets with wider environmental, landscape or rural development objectives, so it was necessary to identify what proportion of these expenditures was BAP related. Also important is the distinction between biodiversity related and BAP related expenditures, since not all spending on biodiversity conservation contributes directly to the UK BAP. For example, spending on the co-ordination and delivery of Local Biodiversity Action Plans does not all contribute to UK BAP targets. Similarly some national expenditure by statutory agencies on policy, educational and research activities may be designed to benefit biodiversity as a whole but does not necessarily contribute to the delivery of HAPs and SAPs. Some expenditure on habitat management may produce direct biodiversity benefits without contributing to BAP targets, where it focuses on non-priority habitats such as coniferous woodland or improved grassland without benefiting priority species.
In order to estimate current and future BAP related expenditure, it has therefore been necessary to identify that proportion of the relevant budgets that is likely to be attributable to BAP species and BAP habitats. The major issue remains the limited availability of reliable data on BAP related expenditure and the ability of the organisations to distinguish between general biodiversity expenditure and BAP-related
J2003 3
Updating Estimates of Current and Future BAP Expenditures in the UK
expenditure. In many cases information systems could not enable this segregation and so an informed view of key individuals within each organisation was the best possible estimate. In the absence of feedback from the relevant organisations, GHK has generated an estimate of the proportion of expenditure that is BAP-related, based on information provided by similar organisations in the other countries.
2.2.2 Estimating Future BAP Expenditures
There are inevitable difficulties with estimating future expenditure, particularly given the complexities of estimating current levels of BAP-related expenditure. Many organisations stated that the task of forecasting future expenditure levels was particularly difficult because of uncertainty over future priorities, especially for organisations awaiting the outcomes of organisational reviews and/or Comprehensive Spending Reviews. Organisations in Northern Ireland faced added uncertainties over future budgets and expenditure as a result of the newly elected Northern Ireland Assembly and uncertainty over plans for devolution.
2.2.3 Estimating Country Level Costs
While some organisations such as the statutory nature conservation agencies and agriculture departments focus their expenditures on individual countries, others such as the Forestry Commission, Heritage Lottery Fund, Wildlife and Countryside Link Organisations, Landfill Communities Fund, Environment Agency, Ministry of Defence, Natural Environment Research Council and the Centre for Environment, Fisheries and Aquaculture Science spend money in more than one country. Where data has permitted, the expenditure has been split to accurately reflect actual expenditure in each country. Where this was not possible the organisations were asked to provide their best estimate. If this was still not possible the UK expenditure was split between the four UK countries relative to their land mass.
2.2.4 Avoiding Double Counting
Double counting is a significant issue in relation to some of the funding programmes. For example, the biodiversity work of voluntary sector organisations such as the RSPB and Wildlife Trusts benefits from significant funding from agri-environment programmes, the Heritage Lottery Fund, Landfill Communities Fund and other sources. There is therefore a risk that recording expenditures under all of these organisations and programmes will double count some expenditures. Care has therefore been taken to avoid double counting in producing the expenditure estimates. The expenditure figures provided by Wildlife and Countryside Link organisations are net of external funding, so as to exclude double counting.
2.3 Research Methods
The initial stage of work included contacting the relevant organisations and initiatives by email and telephone to obtain information about current expenditures under the various schemes and by different organisations, across England, Scotland, Wales and Northern Ireland. Information was also obtained about expectations of future expenditure levels in 2010/11 and the reasons for any expected changes.
Where it was not possible to obtain the necessary information directly from the relevant organisations, a web search was undertaken in order to compile published evidence of current expenditure and, where available, evidence of expected future changes to the level of expenditure. Sources included annual reports of different organisations and initiatives, and financial information found on their respective websites. If this
J2003 4

Updating Estimates of Current and Future BAP Expenditures in the UK
information was still not available, the expenditure levels of the previous study have been assumed to continue to the year 2010/11.
J2003 5
Updating Estimates of Current and Future BAP Expenditures in the UK
J2003 6
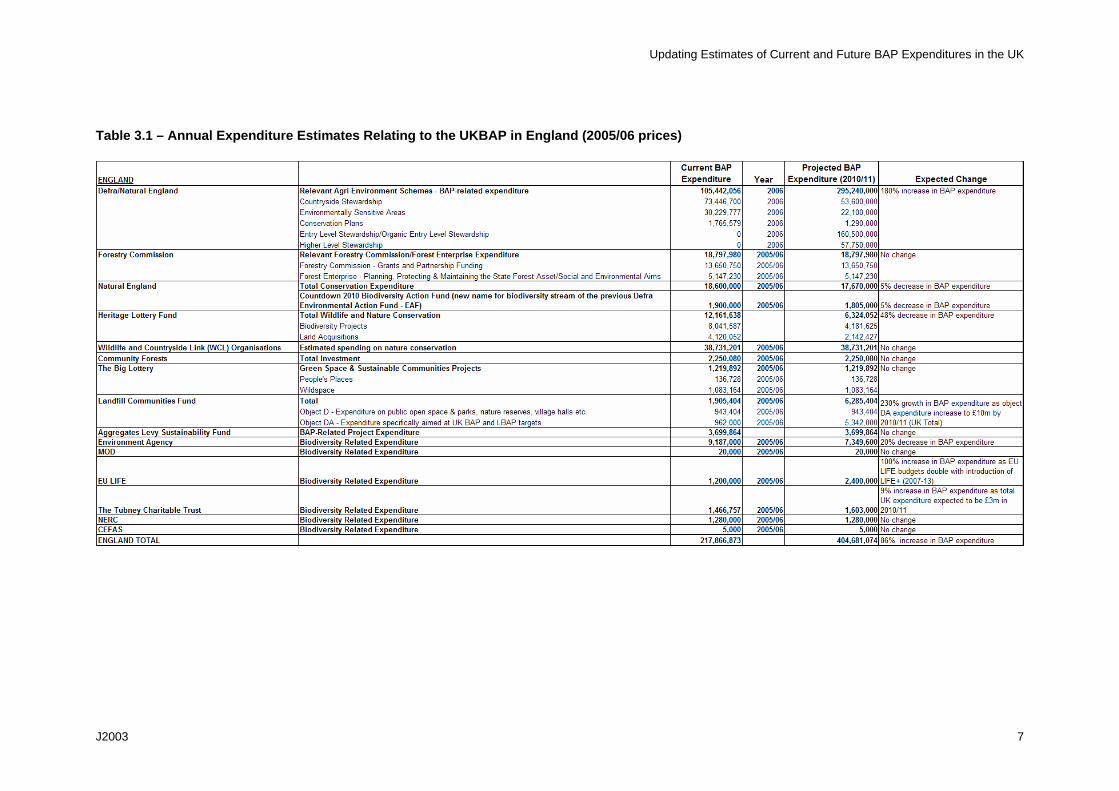
3 RESULTS 3.1 England
Table 3.1 presents the best estimate of current and future annual expenditure relating to the UK Biodiversity Action Plan in England in constant prices (2005/06). The data suggest that BAP-related expenditure in England currently totals approximately £219 million per annum and is expected to increase to £405 million per annum by 2010/11. The current figures included in the table are annual expenditure estimates and are based on the latest available financial reporting period of each organisation or initiative. In some cases expenditure spans a number of years, and in order to estimate an annual figure, this expenditure is assumed to be spread evenly across the time period. The figures for 2010/11 are the best estimates of future expenditure, obtained from the relevant organisations and initiatives.
Agri-environment schemes are the major source of BAP-related expenditure in England, accounting for 48% of the current total, and are expected to become even more significant, accounting for 73% of the estimated total in 2010/11. Defra supplied detailed expenditure data relating to Countryside Stewardship, Environmentally Sensitive Areas, Conservation Plans, Entry Level Stewardship (ELS) and Higher Level Stewardship (HLS), which suggest BAP-related agri-environment expenditure for 2006 totalled £105 million.
The newly-created Natural England organisation brings together the environment activities of the Rural Development Service, English Nature and the Countryside Agency's Landscape, Access and Recreation division. This new organisation will deliver the Government's programme of financial incentives to farmers and land managers for the protection and enhancement of the natural environment, including agri-environment schemes. It is expected that the ELS and HLS schemes will deliver significantly higher levels of BAP-related expenditure than the previous schemes. The previous schemes are now closed and expenditure under these schemes is expected to fall by more than a quarter to 2010/11. However the introduction of ELS and HLS suggests BAP-related agri-environment expenditure is expected to increase to £295 million by 2010/11.
The combined total of the Wildlife and Countryside Link organisations (WCL) is the second largest contributor to BAP expenditure in England. The estimated spending by WCL organisations on nature conservation in the UK is £195m per year. These budgets are used to manage a substantial part of the UK’s existing biodiversity, including hundreds of nature reserves and many priority species and habitats. Of this, approximately £126m (64%) is spent on direct nature conservation activities in the UK. The difference is used for things like education and communications work, general policy work and administration. Of the money spent on nature conservation, it is estimated that £10.7m comes from external funding sources. Net of external funding, between £65 and £80m of spending (33-40% of overall conservation spending, 50-67% of direct spend) directly relates to BAP habitats and species in the UK. The majority of this is devoted to maintaining existing populations or areas of species and habitats. An average figure of £72.5 million has been included in this analysis and has been split between the four UK countries according to their relative land masses, providing an estimated BAP-related spend of approximately £40 million in England. Future expenditure levels are not expected to change significantly and have been assumed to remain stable in constant prices to 2010/11.
Updating Estimates of Current and Future BAP Expenditures in the UK
J2003 7
Table 3.1 – Annual Expenditure Estimates Relating to the UKBAP in England (2005/06 prices)
Updating Estimates of Current and Future BAP Expenditures in the UK
J2003 8
The next largest contributor of BAP-related expenditure in England is Natural England (excluding agri-environment schemes). Natural England suggested that the expenditure estimates included in the previous study still provide the best estimate of expenditure directly related to the UK BAP (£18.6m). This figure is supplemented by the Countdown 2010: Biodiversity Action Fund budget of £1.9m per annum. This fund replaces the previous Defra Environmental Action Fund, and provides a Natural England total BAP related expenditure of £20.5 million. Natural England suggested a best estimate of a 5% decline in this expenditure as priorities shift towards tackling climate change and away from biodiversity, falling to approximately £19.5 million by 2010/11.
The Forestry Commission (FC) is the next largest contributor. In the previous study the FC England provided a best estimate that 75% of the grants and partnerships budget, and 11% of the Forest Enterprise budget for social and environmental aims and maintaining the State Forest Asset, is BAP related. This estimate for Forest Enterprise (FE) is significantly less than the 75% estimate for FC, as one might expect given that FE’s estate is much more focused on coniferous plantations than the grant system. These assumptions are still believed to provide the most accurate estimate of FC BAP related expenditure, which is currently estimated to total £19 million in England. FC England suggested that the best estimate of future BAP related expenditure in 2010/11 would be to assume no change in constant prices.
These top four sources currently account for £183 million or 84% of estimated BAP-related expenditure in England. This is expected to increase to £372 million (92% of the England total) by 2010/11.
The levels of BAP-related expenditure amongst some of the other contributors in England are expected to show some significant changes by 2010/11. For example:
Heritage Lottery Fund (HLF) expenditure on BAP projects is expected to fall significantly as Lottery funds are diverted to the 2012 Olympics and the HLF Lottery Distribution Accounts 2005/06 state that the interest HLF receives from the National Lottery Distribution Fund will fall by almost half.
The Environment Agency reported having to cut resources by about 20% over the next few years whilst delivering all existing and additional responsibilities, which will inevitably have to squeeze resources for biodiversity projects.
However, the Landfill Communities Fund (the new name for Landfill Tax Credits) expects the UK budget for object DA to increase significantly to £10 million by 2010/11. Object DA relates directly to physical conservation of specific species or habitats that are BAP or LBAP listed.
The EU LIFE budget is expected to double as the programme enters a new stage and evolves from LIFE III to LIFE+. Annual budgets are expected to increase from approximately €150 million to €300 million under LIFE+, which will operate from 2007 to 2013.
Updating Estimates of Current and Future BAP Expenditures in the UK
J2003 9
Table 3.2 – Annual Expenditure Estimates Relating to the UKBAP in Scotland (2005/06 prices)
Updating Estimates of Current and Future BAP Expenditures in the UK
J2003 10
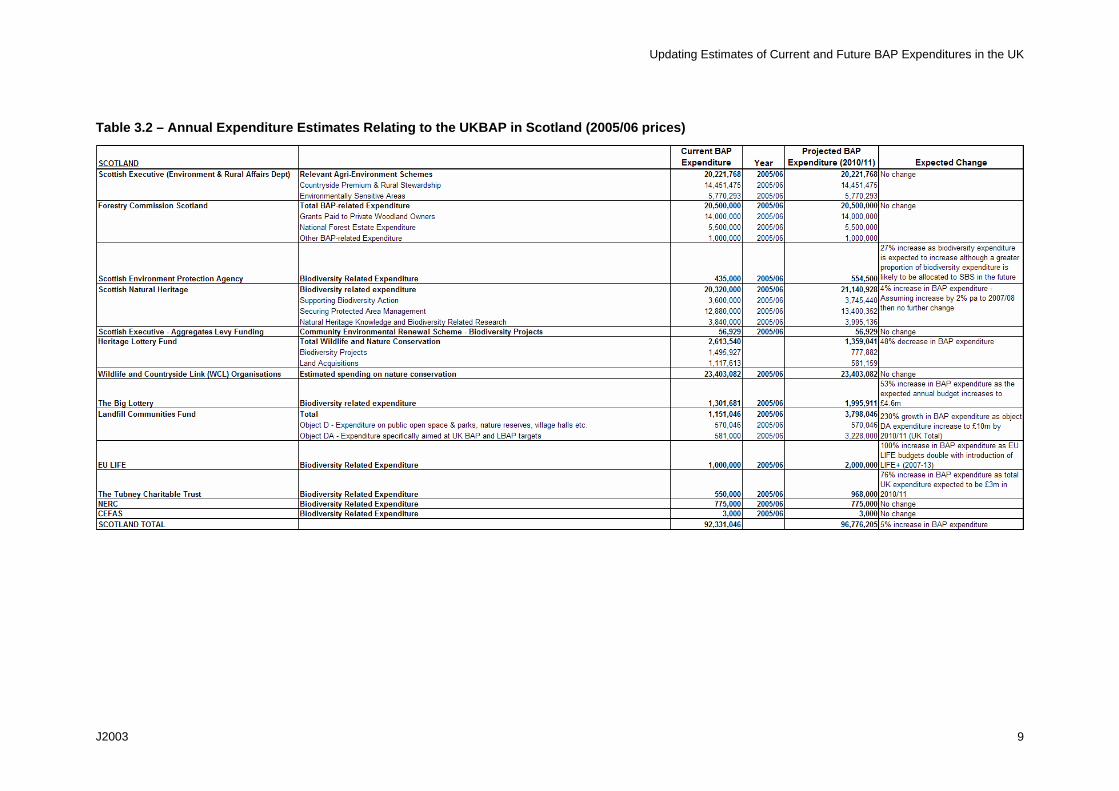
3.2 Scotland
Current and future annual BAP-related expenditure is estimated for Scotland in Table 3.2 above. This suggests that BAP-related expenditure in Scotland currently totals approximately £92 million per annum and is expected to increase to £97 million by 2010/11 (2005/06 prices).
The major players in terms of BAP-related expenditure in Scotland are the Wildlife and Countryside Link organisations (£23 million), Forestry Commission (£20.5m), Scottish Natural Heritage (£20m) and the agri-environment programme (£20m). These top four organisations in Scotland currently spend an estimated £84 million on BAP related activity each year, which equates to 91% of the total figure.
SNH expects BAP related expenditure to increase slightly to 2007/08 but was not able to predict expenditure levels post 2008 until after the Spending Review settlement has been announced later this year, while it was not possible to estimate future agri-environment expenditure either. The best estimates provided by FC Scotland and the WCL organisations suggest no change in future BAP related expenditure in 2010/11 in constant prices. This suggests the top four contributors in Scotland are expecting to spend more than £85 million in 2010/11, accounting for 88% of the total in Scotland.
3.3 Wales
Similar information is provided for Wales in Table 3.3 below, which suggests that BAP-related expenditure currently totals approximately £63 million per annum. This figure is expected to increase to £70 million by 2010/11.
BAP-related expenditure in Wales is dominated by the agri-environment schemes, which currently account for £44 million of the Welsh total. The Welsh Assembly, and Countryside Council for Wales (CCW), both expect BAP related expenditure to increase by 5% per annum for the next three years as resources are reallocated from other funding streams. This suggests that expenditure relating to the UK BAP in 2010/11 will total £51 million for relevant agri-environment schemes and £5.7 million for CCW.
WCL organisations are estimated to spend £6 million on BAP related activities in Wales, while the Forestry Commission in Wales does not expect future BAP related expenditure to increase above the current total of £4.5 million. The top four contributing organisations in Wales are estimated to currently provide 95% of the total BAP-related expenditure and this is expected to increase slightly to 96% by 2010/11.

Updating Estimates of Current and Future BAP Expenditures in the UK
J2003 11
Table 3.3 – Annual Expenditure Estimates Relating to the UKBAP in Wales (2005/06 prices)
Table 3.4 – Annual Expenditure Estimates Relating to the UKBAP in Northern Ireland (2005/06 prices)
Updating Estimates of Current and Future BAP Expenditures in the UK
3.4 Northern Ireland
The largest BAP-related expenditure is provided by the agri-environment schemes, contributing an estimated £5.5 million to the current Northern Ireland total (Table 3.4 above). The next largest is the Environment and Heritage Service (EHS), contributing an estimated £4.5 million of BAP-related expenditure. This estimated figure (50% of Natural Heritage Grants and Directorate Costs) was based on previous discussions with representatives of EHS, who still believe this to provide the best estimate of BAP related expenditure.
The other leading contributors in Northern Ireland are the combined WCL organisations with an estimated BAP-related expenditure of just over £4 million. BAP-related expenditure of the Forest Service in Northern Ireland is relatively small compared to the other UK countries.
The BAP-related expenditure of the Department of Agriculture and Rural Development (DARD), EHS, WCL organisations and the Northern Ireland Forest Service is together estimated to contribute 96% of the Northern Ireland total of almost £15.5 million.
However, as explained above, Northern Ireland currently faces uncertainty over future budgets, due to the recent and impending political changes. Neither DARD, nor EHS or the Forest Service could provide estimates of future expenditure and it has been assumed that the best estimate at this time is believed to be one of no change in BAP related expenditure levels at constant prices by 2010/11.
Changes to other contributors suggest that the expected level of BAP related expenditure will increase by approximately £0.5 million by 2010/11, accounted for by the Landfill Communities Fund.
J2003 12
Updating Estimates of Current and Future BAP Expenditures in the UK
4 CONCLUSIONS
4.1 The Current Estimates of BAP Related Expenditure
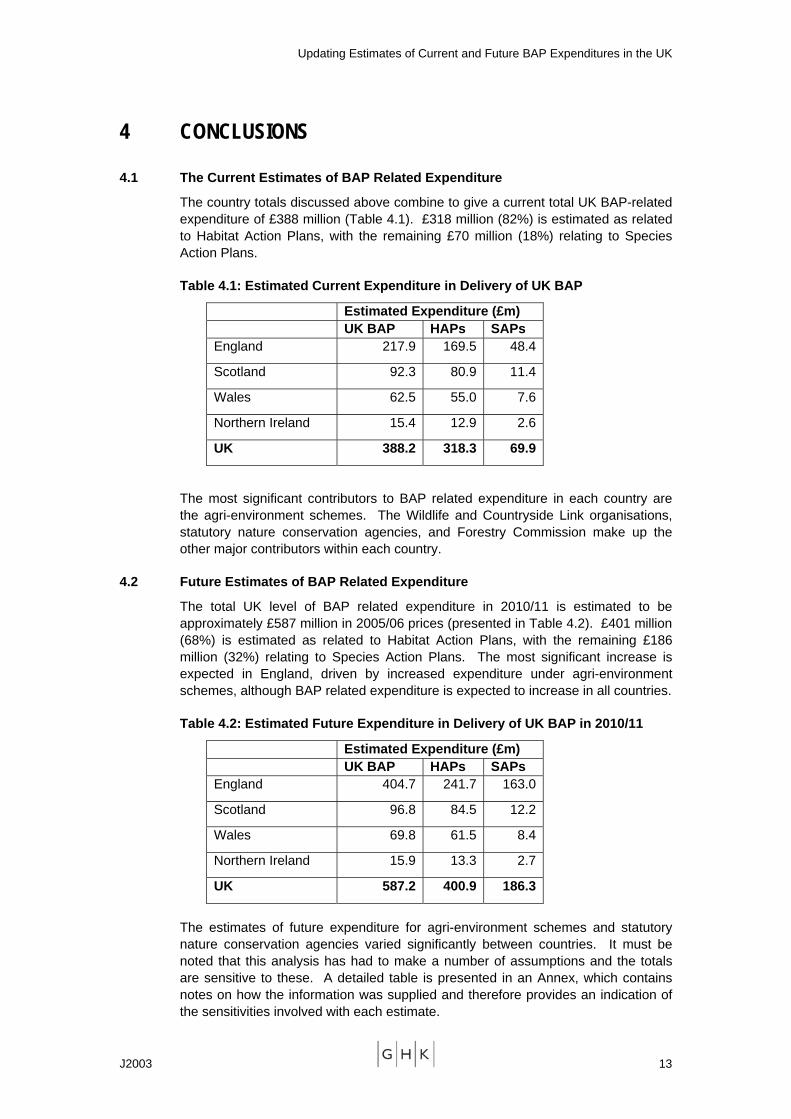
The country totals discussed above combine to give a current total UK BAP-related expenditure of £388 million (Table 4.1). £318 million (82%) is estimated as related to Habitat Action Plans, with the remaining £70 million (18%) relating to Species Action Plans.
Table 4.1: Estimated Current Expenditure in Delivery of UK BAP
Estimated Expenditure (£m) UK BAP HAPs SAPs England 217.9 169.5 48.4
Scotland 92.3 80.9 11.4
Wales 62.5 55.0 7.6
Northern Ireland 15.4 12.9 2.6
UK 388.2 318.3 69.9
The most significant contributors to BAP related expenditure in each country are the agri-environment schemes. The Wildlife and Countryside Link organisations, statutory nature conservation agencies, and Forestry Commission make up the other major contributors within each country.
4.2 Future Estimates of BAP Related Expenditure
The total UK level of BAP related expenditure in 2010/11 is estimated to be approximately £587 million in 2005/06 prices (presented in Table 4.2). £401 million (68%) is estimated as related to Habitat Action Plans, with the remaining £186 million (32%) relating to Species Action Plans. The most significant increase is expected in England, driven by increased expenditure under agri-environment schemes, although BAP related expenditure is expected to increase in all countries.
Table 4.2: Estimated Future Expenditure in Delivery of UK BAP in 2010/11
Estimated Expenditure (£m) UK BAP HAPs SAPs England 404.7 241.7 163.0
Scotland 96.8 84.5 12.2
Wales 69.8 61.5 8.4
Northern Ireland 15.9 13.3 2.7
UK 587.2 400.9 186.3
The estimates of future expenditure for agri-environment schemes and statutory nature conservation agencies varied significantly between countries. It must be noted that this analysis has had to make a number of assumptions and the totals are sensitive to these. A detailed table is presented in an Annex, which contains notes on how the information was supplied and therefore provides an indication of the sensitivities involved with each estimate.
J2003 13
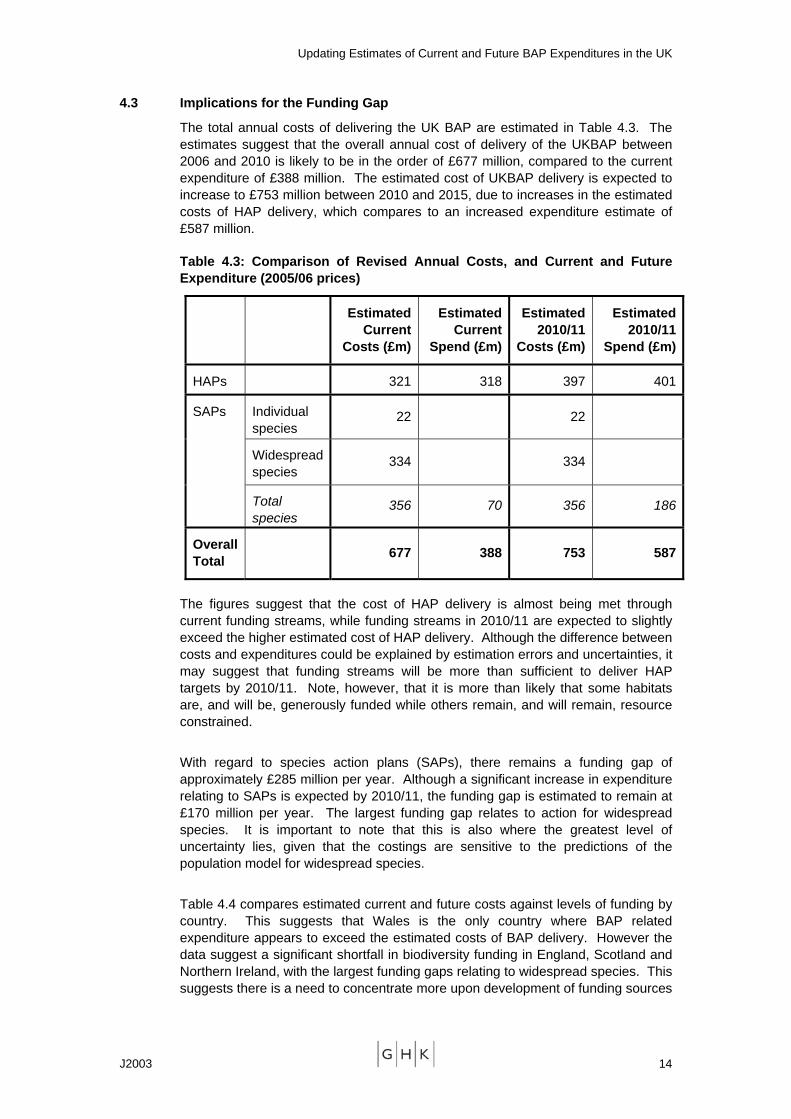
Updating Estimates of Current and Future BAP Expenditures in the UK
4.3 Implications for the Funding Gap
The total annual costs of delivering the UK BAP are estimated in Table 4.3. The estimates suggest that the overall annual cost of delivery of the UKBAP between 2006 and 2010 is likely to be in the order of £677 million, compared to the current expenditure of £388 million. The estimated cost of UKBAP delivery is expected to increase to £753 million between 2010 and 2015, due to increases in the estimated costs of HAP delivery, which compares to an increased expenditure estimate of £587 million.
Table 4.3: Comparison of Revised Annual Costs, and Current and Future Expenditure (2005/06 prices)
Estimated Current
Costs (£m)
Estimated Current
Spend (£m)
Estimated 2010/11
Costs (£m)
Estimated 2010/11
Spend (£m)
HAPs 321 318 397 401
Individual species
22 22
Widespread species
334 334
SAPs
Total species
356 70 356 186
Overall Total
677 388 753 587
The figures suggest that the cost of HAP delivery is almost being met through current funding streams, while funding streams in 2010/11 are expected to slightly exceed the higher estimated cost of HAP delivery. Although the difference between costs and expenditures could be explained by estimation errors and uncertainties, it may suggest that funding streams will be more than sufficient to deliver HAP targets by 2010/11. Note, however, that it is more than likely that some habitats are, and will be, generously funded while others remain, and will remain, resource constrained.
With regard to species action plans (SAPs), there remains a funding gap of approximately £285 million per year. Although a significant increase in expenditure relating to SAPs is expected by 2010/11, the funding gap is estimated to remain at £170 million per year. The largest funding gap relates to action for widespread species. It is important to note that this is also where the greatest level of uncertainty lies, given that the costings are sensitive to the predictions of the population model for widespread species.
Table 4.4 compares estimated current and future costs against levels of funding by country. This suggests that Wales is the only country where BAP related expenditure appears to exceed the estimated costs of BAP delivery. However the data suggest a significant shortfall in biodiversity funding in England, Scotland and Northern Ireland, with the largest funding gaps relating to widespread species. This suggests there is a need to concentrate more upon development of funding sources
J2003 14
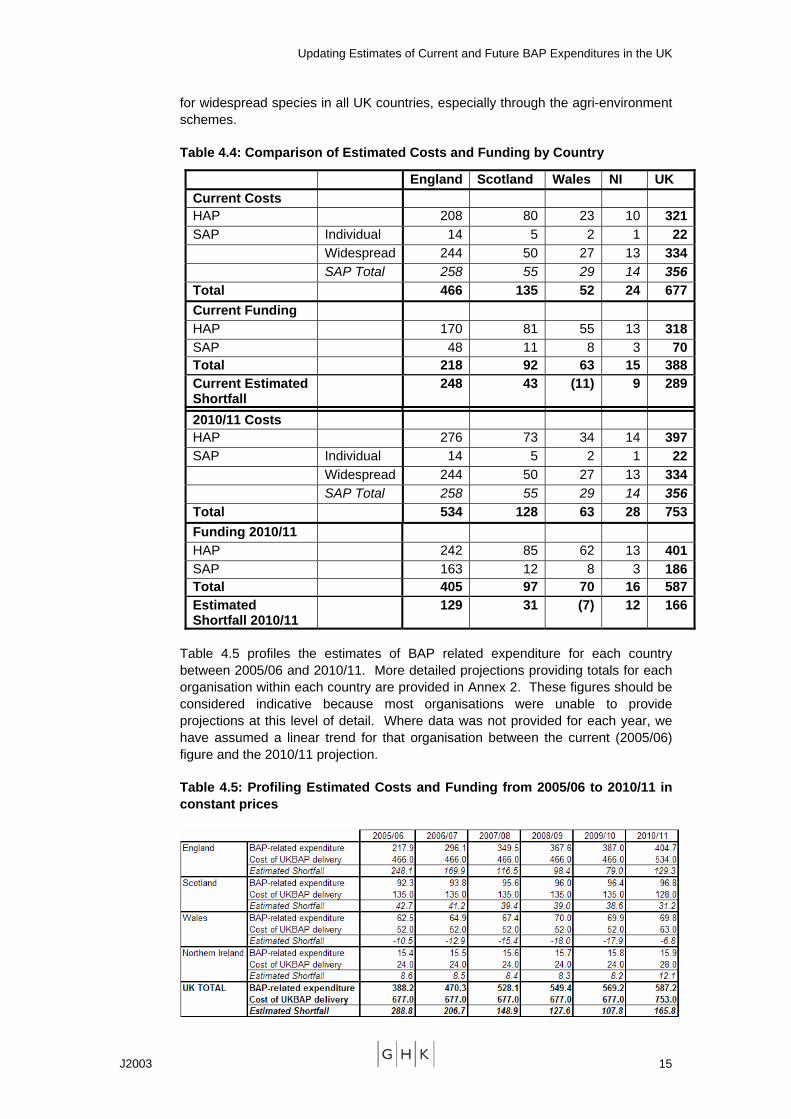
Updating Estimates of Current and Future BAP Expenditures in the UK
for widespread species in all UK countries, especially through the agri-environment schemes.
Table 4.4: Comparison of Estimated Costs and Funding by Country
England Scotland Wales NI UK Current Costs HAP 208 80 23 10 321SAP Individual 14 5 2 1 22 Widespread 244 50 27 13 334 SAP Total 258 55 29 14 356Total 466 135 52 24 677Current Funding HAP 170 81 55 13 318SAP 48 11 8 3 70Total 218 92 63 15 388Current Estimated Shortfall
248 43 (11) 9 289
2010/11 Costs HAP 276 73 34 14 397SAP Individual 14 5 2 1 22 Widespread 244 50 27 13 334 SAP Total 258 55 29 14 356Total 534 128 63 28 753Funding 2010/11 HAP 242 85 62 13 401SAP 163 12 8 3 186Total 405 97 70 16 587Estimated Shortfall 2010/11
129 31 (7) 12 166
Table 4.5 profiles the estimates of BAP related expenditure for each country between 2005/06 and 2010/11. More detailed projections providing totals for each organisation within each country are provided in Annex 2. These figures should be considered indicative because most organisations were unable to provide projections at this level of detail. Where data was not provided for each year, we have assumed a linear trend for that organisation between the current (2005/06) figure and the 2010/11 projection.
Table 4.5: Profiling Estimated Costs and Funding from 2005/06 to 2010/11 in constant prices
J2003 15
Updating Estimates of Current and Future BAP Expenditures in the UK
J2003 16
The data suggest that future levels of funding in the UK will increase to 2010/11, with the most rapid growth up to 2008. Expenditure in England is expected to follow the same trend, while BAP expenditure in Northern Ireland is expected to increase slowly but steadily over the period. Expenditures in Scotland and Wales are expected to increase relatively quickly initially, before becoming more stable from 2008.
When comparing the level of funding against the estimated costs of delivering the UKBAP, the data suggests that the shortfall will increase in Northern Ireland to 2010/11, but will decline in England and Scotland. The apparent surplus funding in Wales is estimated to decline based on this data, but is expected to continue to exceed estimated costs. The overall result is that the UK shortfall is expected to decrease from approximately £290 million to £166 million by 2010/11. The increase in the surplus between 2009/10 and 2010/11 is due to the increase in the estimated costs of delivering the UKBAP from 2010 to 2015.

Updating Estimates of Current and Future BAP Expenditures in the UK
ANNEX 1 – DETAILED EXPENDITURE ESTIMATES AND NOTES BY COUNTRY
J2003 17
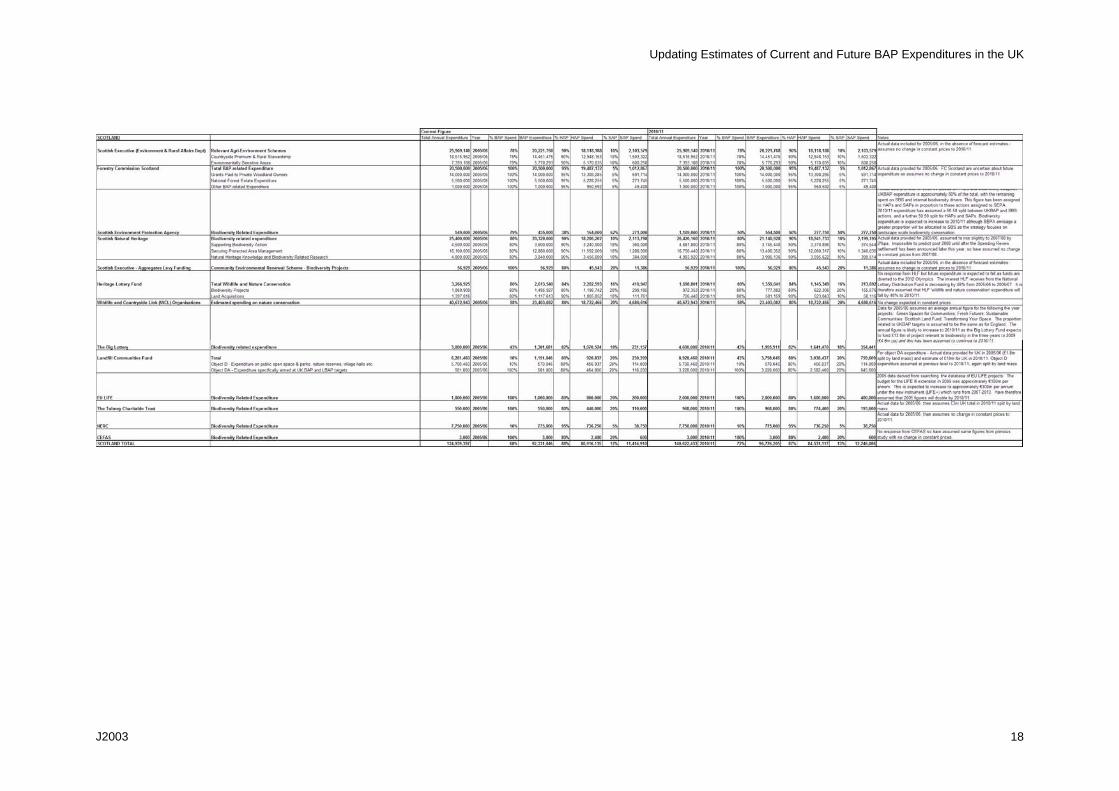
Updating Estimates of Current and Future BAP Expenditures in the UK
J2003 18
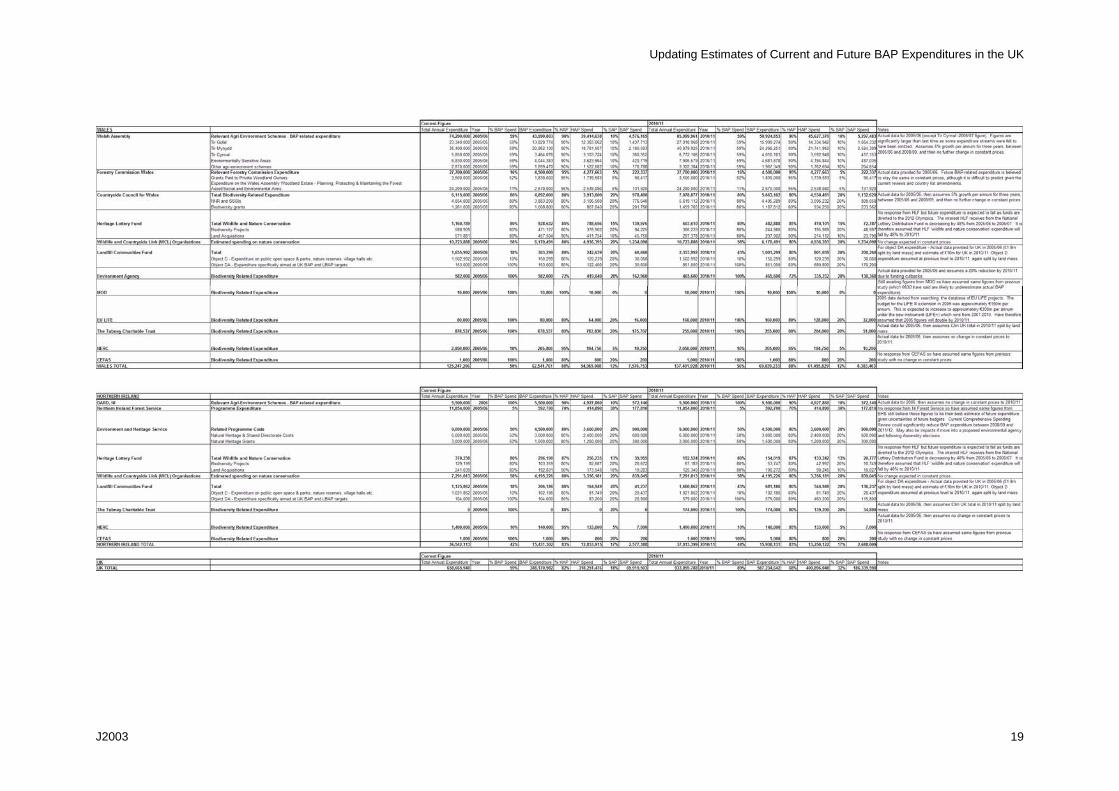
Updating Estimates of Current and Future BAP Expenditures in the UK
J2003 19
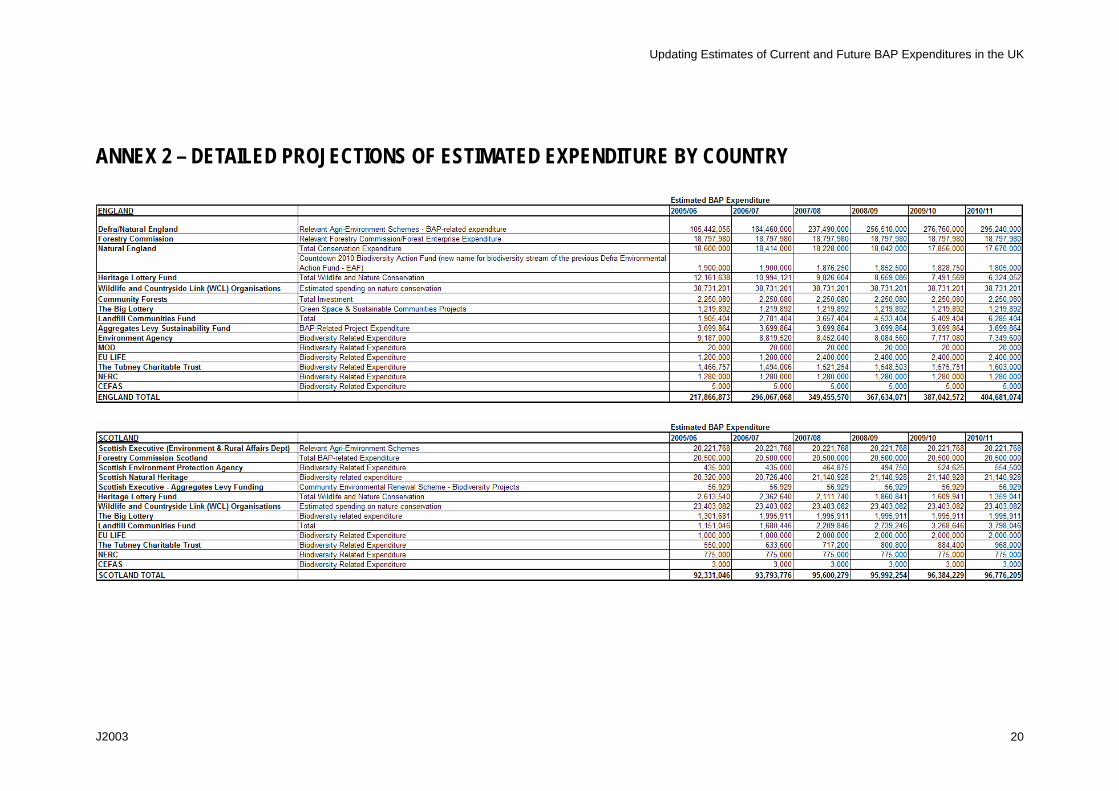
Updating Estimates of Current and Future BAP Expenditures in the UK
ANNEX 2 – DETAILED PROJECTIONS OF ESTIMATED EXPENDITURE BY COUNTRY
J2003 20
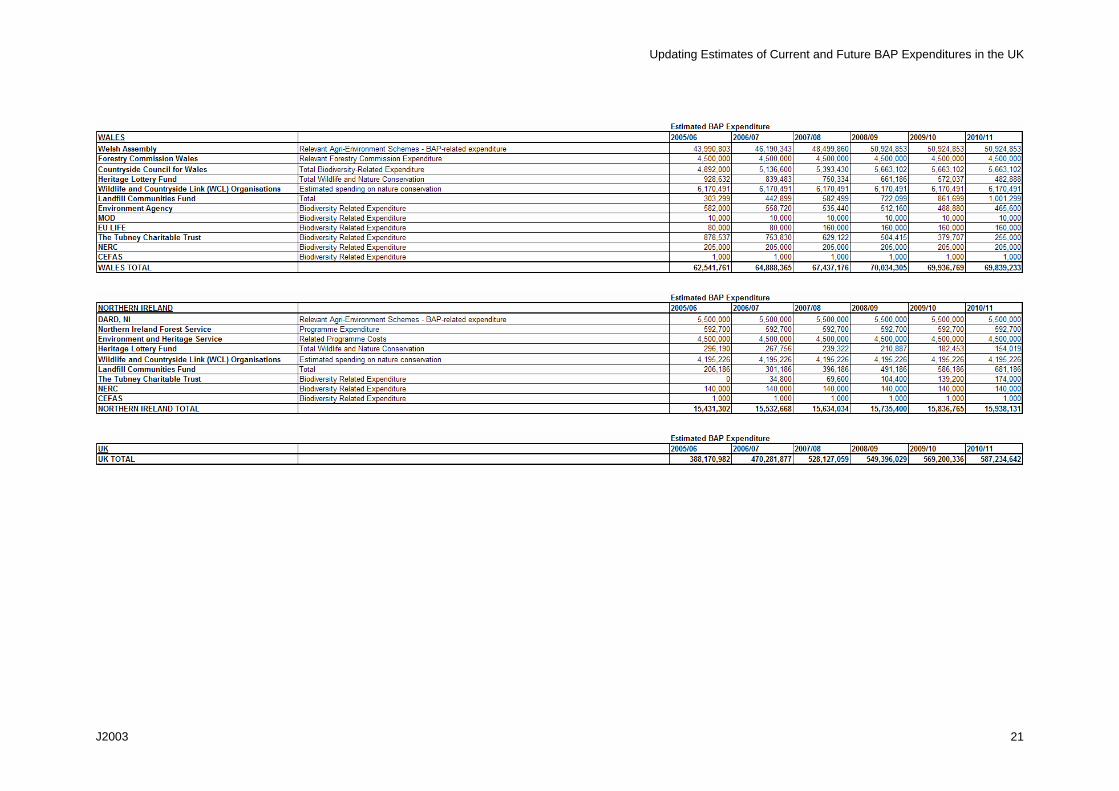
Updating Estimates of Current and Future BAP Expenditures in the UK
J2003 21

UK Biodiversity Action Plan: Preparing Costings for Species and Habitat Action Plans
Estimating Current BAP Expenditures in the UK
Final Report to Defra and Partners:
Submitted by GHK Consulting Ltd
in association with
RPS Ecology
Residence 2, Royal William Yard, Plymouth, PL1 3RP
Tel: 01752 262244; Fax 01752 262299
526 Fulham Road, London SW6 5NR
Tel: 020 7471 8000; Fax: 020 7735 0784
www.ghkint.com
Estimating Current BAP Expenditures in the UK
Document Control
Document Estimating Current BAP Expenditures in the UK – Final Report
Job No. J2003
Prepared by Andy White
Checked by Matt Rayment
J2003
Estimating Current BAP Expenditures in the UK
CONTENTS
1 INTRODUCTION..........................................................................................................................................2 2 METHODOLOGY.........................................................................................................................................3 2.1 Overall Approach.......................................................................................................................................3 2.2 Key Methodological Issues .......................................................................................................................3 2.3 Research Methods ....................................................................................................................................4 3 RESULTS.....................................................................................................................................................5 3.1 England .....................................................................................................................................................5 3.2 Northern Ireland ........................................................................................................................................8 3.3 Scotland ....................................................................................................................................................8 3.4 Wales...................................................................................................................................................... 10 4 CONCLUSIONS........................................................................................................................................ 12
J2003 1
Estimating Current BAP Expenditures in the UK
1 INTRODUCTION
GHK Consulting Ltd and RPS Ecology Ltd were commissioned by Defra, English Nature, the Department of the Environment in Northern Ireland, the Scottish Executive and the Welsh Assembly to provide revised estimates of the costs of delivering the UK Biodiversity Action Plan (BAP). One of the aims of the study was to compare current levels of BAP-related expenditure with the estimated costs, in order to identify whether current funding provision was adequate to meet the costs identified.
The study has found that it is often not possible to identify current levels of expenditure attributable to individual HAPs and SAPs. Data available from the agriculture departments, Forestry Commission and statutory agencies often do not provide sufficient detail to enable such an analysis, either because expenditure programmes deal with more than one habitat or species, or because data are not provided in sufficiently disaggregated form. A comparison of expenditures with identified costs is therefore most easily achieved at the aggregate level.
Funding for biodiversity conservation is provided by a wide range of organisations and initiatives. For some organisations biodiversity conservation is a core objective, and accounts for a large proportion of the overall budget, while for others it represents a minor proportion of overall expenditure. This report provides estimates of current BAP-related expenditures for all organisations with a significant involvement in funding biodiversity action.
This report provides an estimate of overall BAP related expenditure in the UK, and estimates for each of the four countries (England, Northern Ireland, Scotland and Wales), in order to enable a comparison with the cost estimates. The figures also estimate the split between expenditure contributing to progress against habitat action plan (HAP) targets, and against species action plan (SAP) targets.
J2003 2
Estimating Current BAP Expenditures in the UK
2 METHODOLOGY
2.1 Overall Approach
The following steps were taken to estimate current BAP-related expenditures in the UK:
1. The organisations and initiatives involved in funding biodiversity conservation in the different countries of the UK were identified;
2. Relevant budgets for BAP delivery were identified and quantified;
3. In consultation with the organisations and initiatives concerned, an estimate was made of the expenditure under these budgets that is contributing to the delivery of the BAP;
4. Estimates were made of expenditure at the country level, disaggregating UK expenditures where necessary;
5. Separate estimates were made of habitat and species related expenditures, in order to gain some indication of the relative levels of funding for HAPs and SAPs.
Some of the key methodological issues that had to be addressed in this process are discussed in Section 2.2.
2.2 Key Methodological Issues
2.2.1 Identifying BAP Expenditures
The analysis attempts to identify expenditures/funding that contribute to the delivery of species and habitat action plans under the UK BAP. In practice, many organisations provided data relating to programmes or budgets with wider environmental, landscape or rural development objectives, so it was necessary to identify what proportion of these expenditures was BAP related. Also important is the distinction between biodiversity related and BAP related expenditures, since not all spending on biodiversity conservation contributes directly to the UK BAP. For example, spending on the co-ordination and delivery of Local Biodiversity Action Plans does not all contribute to UK BAP targets. Similarly some national expenditure by statutory agencies on policy, educational and research activities may be designed to benefit biodiversity as a whole but does not necessarily contribute to the delivery of HAPs and SAPs. Some expenditure on habitat management may produce direct biodiversity benefits without contributing to BAP targets, where it focuses on non-priority habitats such as coniferous woodland or improved grassland without benefiting priority species.
In order to estimate BAP related expenditure, it has therefore been necessary to identify that proportion of the relevant budgets that is likely to be attributable to BAP species and BAP habitats. The major issue remains the limited availability of reliable data on BAP related expenditure and the ability of the organisations to distinguish between general biodiversity expenditure and BAP-related expenditure. In many cases information systems could not enable this segregation and so an informed view of key individuals within each organisation was the best possible estimate. In the absence of feedback from the relevant organisations, GHK has generated an estimate of the proportion of
J2003 3

Estimating Current BAP Expenditures in the UK
expenditure that is BAP-related, based on information provided by similar organisations in the other countries.
2.2.2 Estimating Country Level Costs
While some organisations such as the statutory nature conservation agencies and agriculture departments focus their expenditures on individual countries, others such as the Forestry Commission, Heritage Lottery Fund, Wildlife and Countryside Link Organisations, Landfill Tax Credit Scheme, Environment Agency, Ministry of Defence, Natural Environment Research Council and the Centre for Environment, Fisheries and Aquaculture Science spend money in more than one country. Where data has permitted the expenditure has been split to accurately reflect actual expenditure in each country. Where this was not possible the organisations were asked to provide their best estimate. If this was still not possible the UK expenditure was split between the four UK countries relative to their land mass.
2.2.3 Estimating HAP and SAP Costs
Where the relevant data were available, expenditure data relating to the UK BAP could be split between species and habitat action plans. However, for many of the relevant programmes, no such breakdown was available, and an estimate had to be made by the consultants, where possible with the assistance of the organisations concerned.
2.2.4 Avoiding Double Counting
Double counting is a significant issue in relation to some of the funding programmes. For example, the biodiversity work of voluntary sector organisations such as the RSPB and Wildlife Trusts benefits from significant funding from agri-environment programmes, the Heritage Lottery Fund, Landfill Tax Credit Scheme and other sources. There is therefore a risk that recording expenditures under all of these organisations and programmes will double count some expenditures. Care has therefore been taken to avoid double counting in producing the expenditure estimates. The expenditure figures provided by Wildlife and Countryside Link organisations are net of external funding, so as to exclude double counting.
2.3 Research Methods
The initial stage of work included a web search in order to compile published evidence of expenditure under various schemes and by different organisations, across England, Scotland, Wales and Northern Ireland, and to create a table of BAP related expenditure. Sources included annual reports of different organisations and initiatives, and financial information found on their respective websites.
Once this stage had been completed, telephone interviews were conducted with the different organisations and initiatives to obtain further information about current expenditures and to inform the analysis of expenditures attributable to the BAP, to HAPs and SAPs, and to the different UK countries.
J2003 4
Estimating Current BAP Expenditures in the UK
J2003 5
3 RESULTS
3.1 England
Table 3.1 presents the best estimate of typical annual expenditure relating to the UK Biodiversity Action Plan in England. The data suggest that BAP-related expenditure in England totals approximately £200 million per annum. 87% of this total is estimated to correspond to habitat action plans and 13% relates to species action plans.
The figures included in the table are annual expenditure estimates and are based on the latest available financial reporting period of each organisation or initiative. In some cases expenditure spans a number of years, and in order to estimate an annual figure, this expenditure is assumed to be spread evenly across the time period.
Agri-environment schemes are the major source of BAP-related expenditure in England, accounting for almost half of the total. Defra supplied detailed expenditure data relating to Countryside Stewardship and Environmentally Sensitive Areas, which GHK was able to segment into the different categories listed below:
Definitely not BAP related – e.g. walls, buildings, access, archaeology.
Probably not BAP related – expenditure which may have wildlife benefits but not specific to the priority habitats and species. e.g. improved grassland.
Possibly BAP related – the creation/management of broad habitats that may include BAP habitats. e.g. grassland and woodland.
Clearly HAP related – relating to priority habitats such as heathland, chalk grassland, cereal field margins, coastal and floodplain grazing marsh, purple moor grass, and heather moorland.
Clearly BAP related but contributing to SAPs rather than HAPs – non priority habitats but which provide benefit to priority species, e.g. winter stubbles and spring cereals.
The data suggest agri-environment expenditure for 2004/05 totalled £163 million. Using the segmentation process described above, GHK estimated that £97 million is related to the UK BAP. The remaining £67 million is not BAP-related expenditure, for example expenditure relating to landscape, access, cultural heritage, etc.
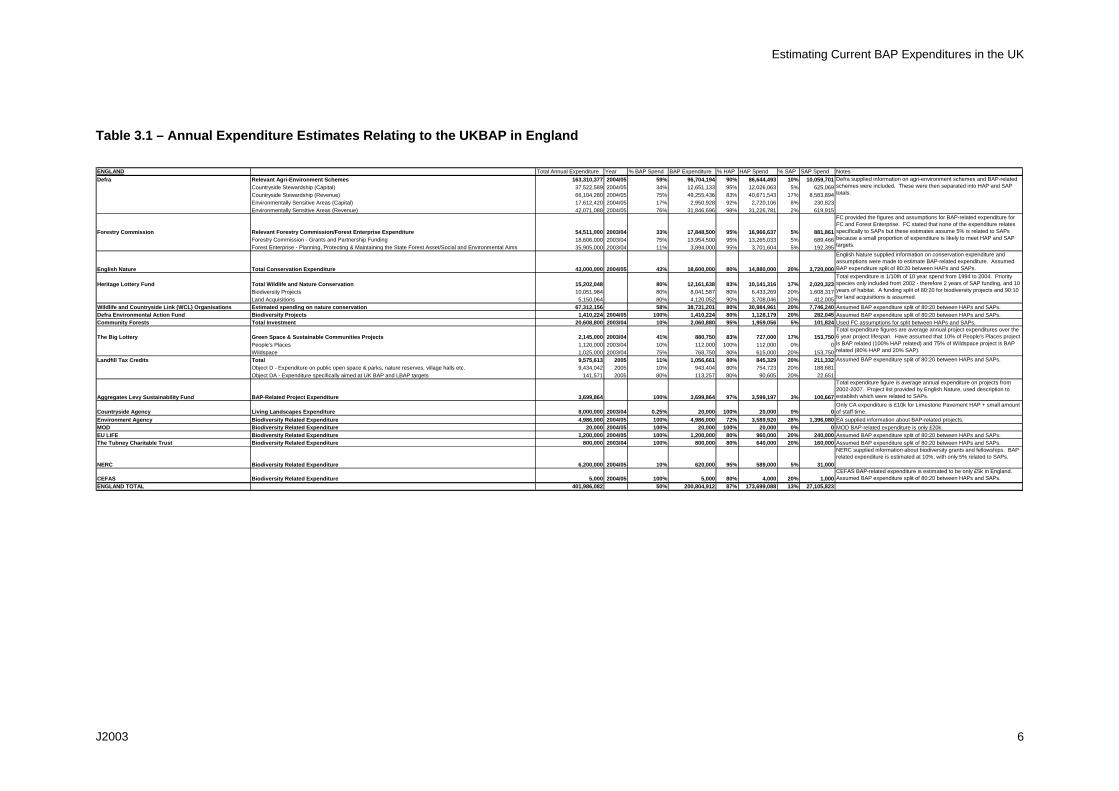
Estimating Current BAP Expenditures in the UK
J2003 6
ENGLAND Total Annual Expenditure Year % BAP Spend BAP Expenditure % HAP HAP Spend % SAP SAP Spend NotesDefra Relevant Agri-Environment Schemes 163,310,377 2004/05 59% 96,704,194 90% 86,644,493 10% 10,059,701
Countryside Stewardship (Capital) 37,522,589 2004/05 34% 12,651,133 95% 12,026,063 5% 625,069Countryside Stewardship (Revenue) 66,104,280 2004/05 75% 49,255,436 83% 40,671,543 17% 8,583,894Environmentally Sensitive Areas (Capital) 17,612,420 2004/05 17% 2,950,928 92% 2,720,106 8% 230,823Environmentally Sensitive Areas (Revenue) 42,071,088 2004/05 76% 31,846,696 98% 31,226,781 2% 619,915
Forestry Commission Relevant Forestry Commission/Forest Enterprise Expenditure 54,511,000 2003/04 33% 17,848,500 95% 16,966,637 5% 881,861Forestry Commission - Grants and Partnership Funding 18,606,000 2003/04 75% 13,954,500 95% 13,265,033 5% 689,466Forest Enterprise - Planning, Protecting & Maintaining the State Forest Asset/Social and Environmental Aims 35,905,000 2003/04 11% 3,894,000 95% 3,701,604 5% 192,395
English Nature Total Conservation Expenditure 43,000,000 2004/05 43% 18,600,000 80% 14,880,000 20% 3,720,000
English Nature supplied information on conservation expenditure and assumptions were made to estimate BAP-related expenditure. Assumed BAP expenditure split of 80:20 between HAPs and SAPs.
Heritage Lottery Fund Total Wildlife and Nature Conservation 15,202,048 80% 12,161,638 83% 10,141,316 17% 2,020,323Biodiversity Projects 10,051,984 80% 8,041,587 80% 6,433,269 20% 1,608,317Land Acquisitions 5,150,064 80% 4,120,052 90% 3,708,046 10% 412,005
Wildlife and Countryside Link (WCL) Organisations Estimated spending on nature conservation 67,312,156 58% 38,731,201 80% 30,984,961 20% 7,746,240 Assumed BAP expenditure split of 80:20 between HAPs and SAPs.Defra Environmental Action Fund Biodiversity Projects 1,410,224 2004/05 100% 1,410,224 80% 1,128,179 20% 282,045 Assumed BAP expenditure split of 80:20 between HAPs and SAPs.Community Forests Total Investment 20,608,800 2003/04 10% 2,060,880 95% 1,959,056 5% 101,824 Used FC assumptions for split between HAPs and SAPs.
The Big Lottery Green Space & Sustainable Communities Projects 2,145,000 2003/04 41% 880,750 83% 727,000 17% 153,750People's Places 1,120,000 2003/04 10% 112,000 100% 112,000 0% 0Wildspace 1,025,000 2003/04 75% 768,750 80% 615,000 20% 153,750
Landfill Tax Credits Total 9,575,613 2005 11% 1,056,661 80% 845,329 20% 211,332Object D - Expenditure on public open space & parks, nature reserves, village halls etc. 9,434,042 2005 10% 943,404 80% 754,723 20% 188,681Object DA - Expenditure specifically aimed at UK BAP and LBAP targets 141,571 2005 80% 113,257 80% 90,605 20% 22,651
Aggregates Levy Sustainability Fund BAP-Related Project Expenditure 3,699,864 100% 3,699,864 97% 3,599,197 3% 100,667
Total expenditure figure is average annual expenditure on projects from 2002-2007. Project list provided by English Nature, used description to establish which were related to SAPs.
Countryside Agency Living Landscapes Expenditure 8,000,000 2003/04 0.25% 20,000 100% 20,000 0% 0Only CA expenditure is £10k for Limestone Pavement HAP + small amount of staff time.
Environment Agency Biodiversity Related Expenditure 4,986,000 2004/05 100% 4,986,000 72% 3,589,920 28% 1,396,080 EA supplied information about BAP-related projects.MOD Biodiversity Related Expenditure 20,000 2004/05 100% 20,000 100% 20,000 0% 0 MOD BAP-related expenditure is only £20k.EU LIFE Biodiversity Related Expenditure 1,200,000 2004/05 100% 1,200,000 80% 960,000 20% 240,000 Assumed BAP expenditure split of 80:20 between HAPs and SAPs.The Tubney Charitable Trust Biodiversity Related Expenditure 800,000 2003/04 100% 800,000 80% 640,000 20% 160,000 Assumed BAP expenditure split of 80:20 between HAPs and SAPs.
NERC Biodiversity Related Expenditure 6,200,000 2004/05 10% 620,000 95% 589,000 5% 31,000
NERC supplied information about biodiversity grants and fellowships. BAP related expenditure is estimated at 10%, with only 5% related to SAPs.
CEFAS Biodiversity Related Expenditure 5,000 2004/05 100% 5,000 80% 4,000 20% 1,000CEFAS BAP-related expenditure is estimated to be only £5k in England. Assumed BAP expenditure split of 80:20 between HAPs and SAPs.
ENGLAND TOTAL 401,986,082 50% 200,804,912 87% 173,699,088 13% 27,105,823
FC provided the figures and assumptions for BAP-related expenditure for FC and Forest Enterprise. FC stated that none of the expenditure relates specifically to SAPs but these estimates assume 5% is related to SAPs because a small proportion of expenditure is likely to meet HAP and SAP targets.
Defra supplied information on agri-environment schemes and BAP-related schemes were included. These were then separated into HAP and SAP totals.
Total expenditure is 1/10th of 10 year spend from 1994 to 2004. Priority species only included from 2002 - therefore 2 years of SAP funding, and 10 years of habitat. A funding split of 80:20 for biodiversity projects and 90:10 for land acquisitions is assumed.
Total expenditure figures are average annual project expenditures over the 6 year project lifespan. Have assumed that 10% of People's Places project is BAP related (100% HAP related) and 75% of Wildspace project is BAP related (80% HAP and 20% SAP).
Assumed BAP expenditure split of 80:20 between HAPs and SAPs.
Table 3.1 – Annual Expenditure Estimates Relating to the UKBAP in England
Estimating Current BAP Expenditures in the UK
The combined total of the Wildlife and Countryside Link organisations (WCL) is the second largest contributor to BAP expenditure in England. The estimated spending by WCL organisations on nature conservation in the UK is £195m per year. These budgets are used to manage a substantial part of the UK’s existing biodiversity, including hundreds of nature reserves and many priority species and habitats. Of this, approximately £126m (64%) is spent on direct nature conservation activities in the UK. The difference is used for things like education and communications work, general policy work and administration. Of the money spent on nature conservation, it is estimated that £10.7m comes from external funding sources. Net of external funding, between £65 and £80m of spending (33-40% of overall conservation spending, 50-67% of direct spend) directly relates to BAP habitats and species in the UK. The majority of this is devoted to maintaining existing populations or areas of species and habitats. An average figure of £72.5 million has been included in this analysis and has been split between the four UK countries according to their relative land masses, providing an estimated BAP-related spend of approximately £40 million in England.
The next largest contributor of BAP-related expenditure in England is English Nature (EN). EN supplied detailed data relating to their conservation expenditure, which totalled £43m in 2004/05. Using assumptions developed with EN, it is estimated that £18.6m of this conservation expenditure is directly related to the UK BAP.
The Forestry Commission (FC) is the next largest contributor. The FC information systems could not currently provide accurate details, although development of a new HAP reporting tool is nearing completion and will enable more detailed analysis of this nature in the future. In the absence of the new tool, the FC provided a best estimate that 75% of the grants and partnerships budget is BAP related, claiming that the bulk of the remainder would be social, but there is clearly a lot of cross over. The 75% estimate compares with estimates that 90% of the area of new woodland planting grant aided in England in the financial year 2004/05 was broadleaved, as was 80% of area aided under Annual Management Grant1.
Estimates for Forest Enterprise BAP-related expenditure are available from a recent Parliamentary Written Answer2. This put total expenditure on conservation of natural heritage and enhancement of biodiversity on the public forest estate at £3.9 million in 2005/06, equivalent to 11% of total expenditure towards social and environmental aims and maintaining the State Forest Asset. This is significantly less than the 75% estimate for FC, as one might expect given that FE’s estate is much more focused on coniferous plantations than is the grant system. The overall estimate of BAP-related expenditure by the Forestry Commission in England is £18 million. The FC was not aware of any expenditure specific to species but there would be likely to be some expenditure relating to both, so a figure of 5% was used in the model for SAP-related expenditure.
The Heritage Lottery Fund (HLF) is the other major contributor to BAP-related expenditure in England. HLF provided data for expenditure on biodiversity projects and land acquisitions in England, Scotland, Wales and Northern Ireland since funding began 10 years ago. HLF biodiversity funding totals £200 million for the UK over this ten year period, with £126 million relating to biodiversity projects and
1 Forestry Commission (2005) Forestry Facts and Figures 2005. www.forestry.gov.uk 2 House of Commons Written Answers 27 Feb 2006 : Column 270W
J2003 7
Estimating Current BAP Expenditures in the UK
J2003 8
£74 million relating to land acquisitions. The vast majority of these projects are directly related to the UK BAP so the model assumes 80% of this funding is related, with an annual expenditure of £16 million across the UK as a whole. HLF funding was only extended to include priority species in 2002, so the data only contains two years of SAP related funding, with the previous eight years solely focused on habitats. Between 2002 and 2004, HLF funded biodiversity projects contributed to targets for priority species including black grouse, basking sharks, water voles, horseshoe bats and red kites. It is estimated that 90% of BAP related expenditures are related to HAPs and 10% are related to SAPs. The funding tables show the figures for each country, with an estimated expenditure of more than £12 million in England.
These five sources (Defra, WCL, EN, FC and HLF) account for £184 million or 92% of estimated BAP-related expenditure in England.
3.2 Northern Ireland
The major organisations, in terms of BAP-related expenditure, in Northern Ireland differ slightly from those in England, Wales and Scotland. The largest BAP-related expenditure is provided by the Environment and Heritage Service (EHS), contributing an estimated £4.5 million to the Northern Ireland total (Table 3.2). This estimated figure (50% of Natural Heritage Grants and Directorate Costs) was based on discussions with representatives of EHS, who were not able to provide a more detailed breakdown within the timescale of this study.
The other leading contributors in Northern Ireland are the combined WCL organisations with an estimated BAP-related expenditure of just over £4 million. BAP-related expenditure of the agri-environment schemes in Northern Ireland is relatively small compared to the other UK countries, estimated at slightly less than £1 million. However this figure is likely to increase in the future as these estimates were based on CMS1 & ESA1 schemes which ran from 2000 to 2005 and the estimated proportion of BAP-related expenditure is expected to increase from 33% (which is the estimate used in the model) to 86% with the introduction of the CMS2 & ESA2 schemes, which are more closely aligned with HAPs and SAPs.
The BAP-related expenditure of EHS, WCL organisations and the Department of Agriculture and Rural Development (DARD) is together estimated to contribute 90% of the Northern Ireland total.
3.3 Scotland
Annual BAP-related expenditure is estimated for Scotland in Table 3.3 below. This suggests that BAP-related expenditure in Scotland totals approximately £93 million per annum. 88% of this total is estimated to correspond to Habitat Action Plans and 12% relates to Species Action Plans.
The major players in terms of BAP-related expenditure in Scotland are the agri-environment programme (£28m), Wildlife and Countryside Link (£23m), Scottish Natural Heritage (£20 million) and Forestry Commission (£15m). The top four organisations in Scotland spend an estimated £87 million on BAP related activity each year, which equates to 94% of the total figure.
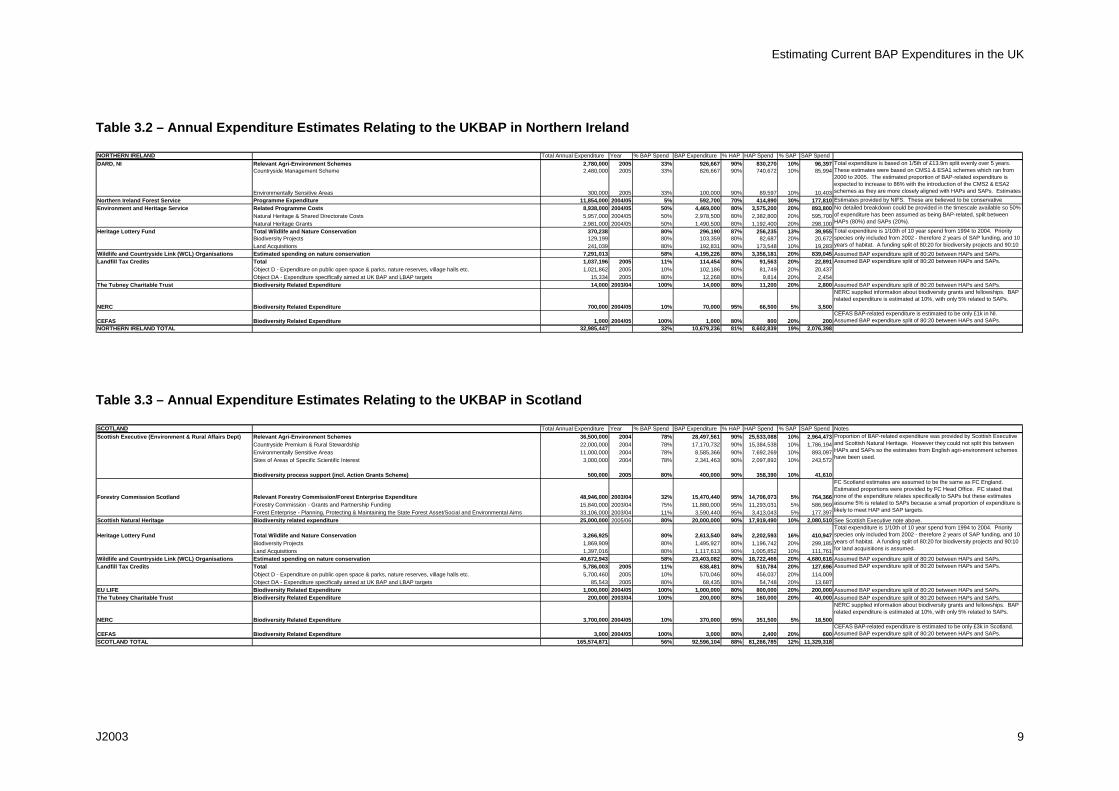
Estimating Current BAP Expenditures in the UK
J2003 9
NORTHERN IRELAND Total Annual Expenditure Year % BAP Spend BAP Expenditure % HAP HAP Spend % SAP SAP SpendDARD, NI Relevant Agri-Environment Schemes 2,780,000 2005 33% 926,667 90% 830,270 10% 96,397
Countryside Management Scheme 2,480,000 2005 33% 826,667 90% 740,672 10% 85,994
Environmentally Sensitive Areas 300,000 2005 33% 100,000 90% 89,597 10% 10,403Northern Ireland Forest Service Programme Expenditure 11,854,000 2004/05 5% 592,700 70% 414,890 30% 177,810 Estimates provided by NIFS. These are believed to be conservative Environment and Heritage Service Related Programme Costs 8,938,000 2004/05 50% 4,469,000 80% 3,575,200 20% 893,800
Natural Heritage & Shared Directorate Costs 5,957,000 2004/05 50% 2,978,500 80% 2,382,800 20% 595,700Natural Heritage Grants 2,981,000 2004/05 50% 1,490,500 80% 1,192,400 20% 298,100
Heritage Lottery Fund Total Wildlife and Nature Conservation 370,238 80% 296,190 87% 256,235 13% 39,955Biodiversity Projects 129,199 80% 103,359 80% 82,687 20% 20,672Land Acquisitions 241,039 80% 192,831 90% 173,548 10% 19,283
Wildlife and Countryside Link (WCL) Organisations Estimated spending on nature conservation 7,291,013 58% 4,195,226 80% 3,356,181 20% 839,045 Assumed BAP expenditure split of 80:20 between HAPs and SAPs.Landfill Tax Credits Total 1,037,196 2005 11% 114,454 80% 91,563 20% 22,891
Object D - Expenditure on public open space & parks, nature reserves, village halls etc. 1,021,862 2005 10% 102,186 80% 81,749 20% 20,437Object DA - Expenditure specifically aimed at UK BAP and LBAP targets 15,334 2005 80% 12,268 80% 9,814 20% 2,454
The Tubney Charitable Trust Biodiversity Related Expenditure 14,000 2003/04 100% 14,000 80% 11,200 20% 2,800 Assumed BAP expenditure split of 80:20 between HAPs and SAPs.
NERC Biodiversity Related Expenditure 700,000 2004/05 10% 70,000 95% 66,500 5% 3,500
NERC supplied information about biodiversity grants and fellowships. BAP related expenditure is estimated at 10%, with only 5% related to SAPs.
CEFAS Biodiversity Related Expenditure 1,000 2004/05 100% 1,000 80% 800 20% 200CEFAS BAP-related expenditure is estimated to be only £1k in NI. Assumed BAP expenditure split of 80:20 between HAPs and SAPs.
NORTHERN IRELAND TOTAL 32,985,447 32% 10,679,236 81% 8,602,839 19% 2,076,398
Assumed BAP expenditure split of 80:20 between HAPs and SAPs.
Total expenditure is 1/10th of 10 year spend from 1994 to 2004. Priority species only included from 2002 - therefore 2 years of SAP funding, and 10 years of habitat. A funding split of 80:20 for biodiversity projects and 90:10 f l d i iti i d
Total expenditure is based on 1/5th of £13.9m split evenly over 5 years. These estimates were based on CMS1 & ESA1 schemes which ran from 2000 to 2005. The estimated proportion of BAP-related expenditure is expected to increase to 86% with the introduction of the CMS2 & ESA2 schemes as they are more closely aligned with HAPs and SAPs. Estimates f E li h i i t h h b d f th lit
No detailed breakdown could be provided in the timescale available so 50% of expenditure has been assumed as being BAP-related, split between HAPs (80%) and SAPs (20%).
SCOTLAND Total Annual Expenditure Year % BAP Spend BAP Expenditure % HAP HAP Spend % SAP SAP Spend NotesScottish Executive (Environment & Rural Affairs Dept) Relevant Agri-Environment Schemes 36,500,000 2004 78% 28,497,561 90% 25,533,088 10% 2,964,473
Countryside Premium & Rural Stewardship 22,000,000 2004 78% 17,170,732 90% 15,384,538 10% 1,786,194Environmentally Sensitive Areas 11,000,000 2004 78% 8,585,366 90% 7,692,269 10% 893,097Sites of Areas of Specific Scientific Interest 3,000,000 2004 78% 2,341,463 90% 2,097,892 10% 243,572
Biodiversity process support (incl. Action Grants Scheme) 500,000 2005 80% 400,000 90% 358,390 10% 41,610
Forestry Commission Scotland Relevant Forestry Commission/Forest Enterprise Expenditure 48,946,000 2003/04 32% 15,470,440 95% 14,706,073 5% 764,366Forestry Commission - Grants and Partnership Funding 15,840,000 2003/04 75% 11,880,000 95% 11,293,031 5% 586,969Forest Enterprise - Planning, Protecting & Maintaining the State Forest Asset/Social and Environmental Aims 33,106,000 2003/04 11% 3,590,440 95% 3,413,043 5% 177,397
Scottish Natural Heritage Biodiversity related expenditure 25,000,000 2005/06 80% 20,000,000 90% 17,919,490 10% 2,080,510 See Scottish Executive note above.
Heritage Lottery Fund Total Wildlife and Nature Conservation 3,266,925 80% 2,613,540 84% 2,202,593 16% 410,947Biodiversity Projects 1,869,909 80% 1,495,927 80% 1,196,742 20% 299,185Land Acquisitions 1,397,016 80% 1,117,613 90% 1,005,852 10% 111,761
Wildlife and Countryside Link (WCL) Organisations Estimated spending on nature conservation 40,672,943 58% 23,403,082 80% 18,722,466 20% 4,680,616 Assumed BAP expenditure split of 80:20 between HAPs and SAPs.Landfill Tax Credits Total 5,786,003 2005 11% 638,481 80% 510,784 20% 127,696
Object D - Expenditure on public open space & parks, nature reserves, village halls etc. 5,700,460 2005 10% 570,046 80% 456,037 20% 114,009Object DA - Expenditure specifically aimed at UK BAP and LBAP targets 85,543 2005 80% 68,435 80% 54,748 20% 13,687
EU LIFE Biodiversity Related Expenditure 1,000,000 2004/05 100% 1,000,000 80% 800,000 20% 200,000 Assumed BAP expenditure split of 80:20 between HAPs and SAPs.The Tubney Charitable Trust Biodiversity Related Expenditure 200,000 2003/04 100% 200,000 80% 160,000 20% 40,000 Assumed BAP expenditure split of 80:20 between HAPs and SAPs.
NERC Biodiversity Related Expenditure 3,700,000 2004/05 10% 370,000 95% 351,500 5% 18,500
NERC supplied information about biodiversity grants and fellowships. BAP related expenditure is estimated at 10%, with only 5% related to SAPs.
CEFAS Biodiversity Related Expenditure 3,000 2004/05 100% 3,000 80% 2,400 20% 600CEFAS BAP-related expenditure is estimated to be only £3k in Scotland. Assumed BAP expenditure split of 80:20 between HAPs and SAPs.
SCOTLAND TOTAL 165,574,871 56% 92,596,104 88% 81,266,785 12% 11,329,318
Total expenditure is 1/10th of 10 year spend from 1994 to 2004. Priority species only included from 2002 - therefore 2 years of SAP funding, and 10 years of habitat. A funding split of 80:20 for biodiversity projects and 90:10 for land acquisitions is assumed.
FC Scotland estimates are assumed to be the same as FC England. Estimated proportions were provided by FC Head Office. FC stated that none of the expenditure relates specifically to SAPs but these estimates assume 5% is related to SAPs because a small proportion of expenditure is likely to meet HAP and SAP targets.
Assumed BAP expenditure split of 80:20 between HAPs and SAPs.
Proportion of BAP-related expenditure was provided by Scottish Executive and Scottish Natural Heritage. However they could not split this between HAPs and SAPs so the estimates from English agri-environment schemes have been used.
Table 3.2 – Annual Expenditure Estimates Relating to the UKBAP in Northern Ireland
Table 3.3 – Annual Expenditure Estimates Relating to the UKBAP in Scotland

Estimating Current BAP Expenditures in the UK
J2003 10
3.4 Wales
Similar information is provided for Wales in Table 3.4 below, which suggests that BAP-related expenditure totals approximately £35 million per annum. 87% of this total is estimated to correspond to Habitat Action Plans and 13% relates to Species Action Plans.
The major contributors to BAP-related expenditure in Wales are similar to those in England and have been discussed in detail above. Agri-environment schemes are the major contributor. The Welsh Assembly was unable to provide information on BAP expenditures within the timescales of this study, so it was necessary to assume that a similar proportion of the budget as in England was spent on BAP-related activities. This resulted in an estimated BAP-related spend of £16 million (46% of the total for Wales).
WCL organisations are estimated to spend £6 million on BAP related activities, only marginally higher than the Forestry Commission in Wales. As for Forestry Commission expenditure in England, these figures are based on the estimates made by FC Head Office and available forestry statistics. The next largest organisation is the Countryside Council for Wales (CCW) with £4.5 million. The top four contributing organisations in Wales are estimated to provide 93% of the total BAP-related expenditure.

Estimating Current BAP Expenditures in the UK
J2003 11
WALES Total Annual Expenditure Year % BAP Spend BAP Expenditure % HAP HAP Spend % SAP SAP Spend NotesWelsh Assembly Relevant Agri-Environment Schemes 27,000,000 2004 59% 15,988,042 90% 14,324,878 10% 1,663,164
Tir Cymen & Tir Gofal 20,000,000 2004 59% 11,842,994 90% 10,611,021 10% 1,231,973Environmentally Sensitive Areas 5,000,000 2004 59% 2,960,749 90% 2,652,755 10% 307,993Sites of Special Scientific Interest 1,000,000 2004 59% 592,150 90% 530,551 10% 61,599Other agri-environment schemes 1,000,000 2004 59% 592,150 90% 530,551 10% 61,599
Forestry Commission Wales Relevant Forestry Commission/Forest Enterprise Expenditure 21,511,000 2003/04 28% 5,966,652 95% 5,671,851 5% 294,801Forestry Commission - Grants and Partnership Funding 5,664,000 2003/04 75% 4,248,000 95% 4,038,114 5% 209,886Forest Enterprise - Planning, Protecting & Maintaining the State Forest Asset/Social and Environmental Aims 15,847,000 2003/04 11% 1,718,652 95% 1,633,737 5% 84,915
Countryside Council for Wales Total Biodiversity-Related Expenditure 5,654,000 2003/04 80% 4,523,200 80% 3,618,560 20% 904,640NNR and SSSIs 4,430,000 2003/04 80% 3,544,000 80% 2,835,200 20% 708,800Biodiversity grants 1,224,000 2003/04 80% 979,200 80% 783,360 20% 195,840
Heritage Lottery Fund Total Wildlife and Nature Conservation 1,160,789 80% 928,632 85% 788,656 15% 139,976Biodiversity Projects 588,909 80% 471,127 80% 376,902 20% 94,225Land Acquisitions 571,881 80% 457,504 90% 411,754 10% 45,750
Wildlife and Countryside Link (WCL) Organisations Estimated spending on nature conservation 10,723,888 58% 6,170,491 80% 4,936,393 20% 1,234,098 Assumed BAP expenditure split of 80:20 between HAPs and SAPs.Landfill Tax Credits Total 1,525,546 2005 11% 168,343 80% 134,674 20% 33,669
Object D - Expenditure on public open space & parks, nature reserves, village halls etc. 1,502,992 2005 10% 150,299 80% 120,239 20% 30,060Object DA - Expenditure specifically aimed at UK BAP and LBAP targets 22,554 2005 80% 18,044 80% 14,435 20% 3,609
Environment Agency Biodiversity Related Expenditure 1,088,000 2004/05 100% 1,088,000 72% 783,360 28% 304,640 EA supplied information about BAP-related projects.MOD Biodiversity Related Expenditure 10,000 2004/05 100% 10,000 100% 10,000 0% 0 MOD BAP-related expenditure is only £10k in Wales.EU LIFE Biodiversity Related Expenditure 80,000 2004/05 100% 80,000 80% 64,000 20% 16,000 Assumed BAP expenditure split of 80:20 between HAPs and SAPs.The Tubney Charitable Trust Biodiversity Related Expenditure 20,000 2003/04 100% 20,000 80% 16,000 20% 4,000 Assumed BAP expenditure split of 80:20 between HAPs and SAPs.
NERC Biodiversity Related Expenditure 1,000,000 2004/05 10% 100,000 95% 95,000 5% 5,000
NERC supplied information about biodiversity grants and fellowships. BAP related expenditure is estimated at 10%, with only 5% related to SAPs.
CEFAS Biodiversity Related Expenditure 1,000 2004/05 100% 1,000 80% 800 20% 200CEFAS BAP-related expenditure is estimated to be only £1k in Wales. Assumed BAP expenditure split of 80:20 between HAPs and SAPs.
WALES TOTAL 69,774,224 50% 35,044,360 87% 30,444,172 13% 4,600,188
The Welsh Assembly could not provide the information within the given timescales so the estimated proportions of BAP, HAP and SAP related expenditure use English estimates for agri-environment and apply those to the Wales annual expenditure totals for agri-environment schemes.
Assumed BAP expenditure split of 80:20 between HAPs and SAPs.
FC Wales estimates are assumed to be the same as FC England. Estimated proportions were provided by FC Head Office. FC stated that none of the expenditure relates specifically to SAPs but these estimates assume 5% is related to SAPs because a small proportion of expenditure is likely to meet HAP and SAP targets.
Total expenditure is 1/10th of 10 year spend from 1994 to 2004. Priority species only included from 2002 - therefore 2 years of SAP funding, and 10 years of habitat. A funding split of 80:20 for biodiversity projects and 90:10 for land acquisitions is assumed.
Proportion of BAP-related expenditure was provided by the Countryside Council for Wales. However they could not split this between HAPs and SAPs so these have been split 80:20.
Table 3.4 – Annual Expenditure Estimates Relating to the UKBAP in Wales

Estimating Current BAP Expenditures in the UK
4 CONCLUSIONS
The country totals discussed above combine to give a total UK BAP-related expenditure of £339 million (Table 4.1). £294 million (87%) is estimated as related to Habitat Action Plans, with the remaining £45 million (13%) relating to Species Action Plans.
Table 4.1: Estimated Expenditure in Delivery of UK BAP
Estimated Expenditure (£m) UK BAP HAPs SAPs England 200.8 173.7 27.1
Northern Ireland 10.7 8.6 2.1
Scotland 92.6 81.3 11.3
Wales 35.0 30.4 4.6
UK 339.1 294.0 45.1
The most significant contributors to BAP related expenditure in each country are the agri-environment schemes, with the exception of Northern Ireland. However, the situation in Northern Ireland is likely to change with the introduction of new Environmentally Sensitive Areas and Countryside Management Schemes. The Wildlife and Countryside Link organisations, statutory nature conservation agencies, Forestry Commission, and Heritage Lottery Fund make up the other major contributors within each country.
It must be noted that this analysis has had to make a number of assumptions and the totals are sensitive to these. The sections of each table contain notes on how the information was supplied and therefore provide an indication of the sensitivities involved with each estimate. Improved information systems are being developed by several organisations, including the Forestry Commission and the Department or Agriculture and Rural Development in Northern Ireland, which will facilitate this type of analysis in the future.
J2003 12

UK Biodiversity Action Plan: Preparing Costings for Species and Habitat Action Plans
Revising the Costs of Delivering Habitat Action Plans
Revised Report to Defra and Partners, with Provisional
Cost Estimates Based on March 2006 Targets
Submitted by GHK Consulting Ltd
in association with
RPS Ecology
Residence 2, Royal William Yard, Plymouth, PL1 3RP
Tel: 01752 262244; Fax 01752 262299
526 Fulham Road, London SW6 5NR
Tel: 020 7471 8000; Fax: 020 7735 0784
www.ghkint.com
J2003 1
Document Control
Document Revising the Costs of Delivering Habitat Action Plans – Second Revised Report Incorporating March 2006 Targets
Job No. J2003
Prepared by Matt Rayment
Checked by Gitte Lindberg
Date 18 April 2006
HAP Costings
J2003 1
CONTENTS
1 INTRODUCTION..........................................................................................................................................7 2 METHODOLOGY.........................................................................................................................................9 2.1 Overall Approach.......................................................................................................................................9 2.2 Key Methodological Issues .................................................................................................................... 10 2.3 Total and Additional Costs ..................................................................................................................... 10 2.4 BAP Attributable Costs........................................................................................................................... 11 2.5 Land Purchase ....................................................................................................................................... 11 2.6 Opportunity Costs................................................................................................................................... 12 2.7 Net and Gross Costs .............................................................................................................................. 12 2.8 Public and Private Sector Costs............................................................................................................. 12 2.9 Grants and Incentives ............................................................................................................................ 12 2.10 Marginal Costs ..................................................................................................................................... 13 2.11 Differences in Country Level Costs...................................................................................................... 13 2.12 Administration and Central Costs......................................................................................................... 14 2.13 Staff Costs............................................................................................................................................ 14 2.14 Inflation................................................................................................................................................. 15 2.15 Voluntary Activities ............................................................................................................................... 15 2.16 The Impact of Policy Change ............................................................................................................... 15 3 WOOD PASTURE AND PARKLAND ...................................................................................................... 16 3.1 Method ................................................................................................................................................... 16 3.2 Revised Targets ..................................................................................................................................... 16 3.3 Unit Costs............................................................................................................................................... 17 3.4 Cost Estimates ....................................................................................................................................... 17 3.5 Comparison with Indicative Costings ..................................................................................................... 18 3.6 Consultees ............................................................................................................................................. 19 4 NATIVE WOODLANDS ............................................................................................................................ 20 4.1 Method ................................................................................................................................................... 20 4.2 Revised Targets ..................................................................................................................................... 20 4.3 Unit Costs............................................................................................................................................... 21 4.4 Cost Estimates ....................................................................................................................................... 21 4.5 Comparison with Indicative Costings ..................................................................................................... 22 4.6 Consultees ............................................................................................................................................. 22 5 LOWLAND HEATHLAND......................................................................................................................... 24 5.1 Method ................................................................................................................................................... 24 5.2 Revised Targets ..................................................................................................................................... 24 5.3 Unit Costs............................................................................................................................................... 25 5.4 Cost Estimates ....................................................................................................................................... 25 5.5 Comparison with Indicative Costings ..................................................................................................... 27
HAP Costings
J2003 2
5.6 Consultees ............................................................................................................................................. 27 6 UPLAND HEATHLAND............................................................................................................................ 28 6.1 Method ................................................................................................................................................... 28 6.2 Revised targets ...................................................................................................................................... 28 6.3 Unit costs................................................................................................................................................ 29 6.4 Cost Estimates ....................................................................................................................................... 30 6.5 Comparison with Indicative Costings ..................................................................................................... 31 6.6 Consultees ............................................................................................................................................. 32 7 BLANKET BOG........................................................................................................................................ 33 7.1 Method ................................................................................................................................................... 33 7.2 Revised Targets ..................................................................................................................................... 33 7.3 Unit Costs............................................................................................................................................... 33 7.4 Cost Estimates ....................................................................................................................................... 34 7.5 Comparison with Indicative Costings ..................................................................................................... 35 7.6 Consultees ............................................................................................................................................. 35 8 LOWLAND RAISED BOG ........................................................................................................................ 37 8.1 Method ................................................................................................................................................... 37 8.2 Revised targets ...................................................................................................................................... 37 8.3 Unit costs................................................................................................................................................ 38 8.4 Cost Estimates ....................................................................................................................................... 38 8.5 Comparison with Indicative Costings ..................................................................................................... 39 8.6 Consultees ............................................................................................................................................. 40 9 COASTAL AND FLOODPLAIN GRAZING MARSH................................................................................ 41 9.1 Method ................................................................................................................................................... 41 9.2 Revised Targets ..................................................................................................................................... 41 9.3 Unit Costs............................................................................................................................................... 42 9.4 Cost Estimates ....................................................................................................................................... 42 9.5 Comparison with Indicative Costings ..................................................................................................... 43 9.6 Consultees ............................................................................................................................................. 43 10 PURPLE MOOR GRASS AND RUSH PASTURE ................................................................................. 44 10.1 Method ................................................................................................................................................. 44 10.2 Revised targets .................................................................................................................................... 44 10.3 Unit costs.............................................................................................................................................. 45 10.4 Cost Estimates ..................................................................................................................................... 45 10.5 Comparison with Indicative Costings ................................................................................................... 46 10.6 Consultees ........................................................................................................................................... 47 11 LOWLAND CALCAREOUS GRASSLAND............................................................................................ 48 11.1 Method ................................................................................................................................................. 48 11.2 Revised targets .................................................................................................................................... 48 11.3 Unit costs.............................................................................................................................................. 49 11.4 Cost Estimates ..................................................................................................................................... 49
HAP Costings
J2003 3
11.5 Comparison with Indicative Costings ................................................................................................... 50 12 LOWLAND DRY ACID GRASSLAND.................................................................................................... 52 12.1 Method ................................................................................................................................................. 52 12.2 Revised targets .................................................................................................................................... 52 12.3 Unit Costs............................................................................................................................................. 53 12.4 Cost Estimates ..................................................................................................................................... 53 12.5 Comparison with Indicative Costings ................................................................................................... 54 12.6 Consultees ........................................................................................................................................... 55 13 UPLAND CALCAREOUS GRASSLAND............................................................................................... 56 13.1 Method ................................................................................................................................................. 56 13.2 Revised targets .................................................................................................................................... 56 13.3 Unit costs.............................................................................................................................................. 57 13.4 Cost Estimates ..................................................................................................................................... 58 13.5 Comparison with Indicative Costings ................................................................................................... 59 13.6 Consultees ........................................................................................................................................... 59 14 UPLAND HAY MEADOWS..................................................................................................................... 61 14.1 Method ................................................................................................................................................. 61 14.2 Revised targets .................................................................................................................................... 61 14.3 Unit costs.............................................................................................................................................. 62 14.4 Cost Estimates ..................................................................................................................................... 62 14.5 Comparison with Indicative Costings ................................................................................................... 63 14.6 Consultees ........................................................................................................................................... 63 15 LOWLAND MEADOW ............................................................................................................................ 65 15.1 Method ................................................................................................................................................. 65 15.2 Revised targets .................................................................................................................................... 65 15.3 Unit costs.............................................................................................................................................. 66 15.4 Cost Estimates ..................................................................................................................................... 66 15.5 Comparison with Indicative Costings ................................................................................................... 68 15.6 Consultees ........................................................................................................................................... 68 16 HEDGEROWS ........................................................................................................................................ 70 16.1 Method ................................................................................................................................................. 70 16.2 Revised targets .................................................................................................................................... 70 16.3 Unit costs.............................................................................................................................................. 72 16.4 Cost Estimates ..................................................................................................................................... 72 16.5 Comparison with Indicative Costings ................................................................................................... 73 16.6 Consultees ........................................................................................................................................... 74 17 ARABLE FIELD MARGINS.................................................................................................................... 75 17.1 Method ................................................................................................................................................. 75 17.2 Revised targets .................................................................................................................................... 75 17.3 Unit costs.............................................................................................................................................. 76 17.4 Cost Estimates ..................................................................................................................................... 76

HAP Costings
J2003 4
17.5 Comparison with Indicative Costings ................................................................................................... 77 17.6 Consultees ........................................................................................................................................... 78 18 LIMESTONE PAVEMENT ...................................................................................................................... 79 18.1 Method ................................................................................................................................................. 79 18.2 Revised Targets ................................................................................................................................... 79 18.3 Unit Costs............................................................................................................................................. 80 18.4 Cost Estimates ..................................................................................................................................... 81 18.5 Comparison with Indicative Costings ................................................................................................... 82 18.6 Consultees ........................................................................................................................................... 82 19 FENS....................................................................................................................................................... 83 19.1 Method ................................................................................................................................................. 83 19.2 Revised targets .................................................................................................................................... 83 19.3 Unit costs.............................................................................................................................................. 84 19.4 Cost Estimates ..................................................................................................................................... 84 19.5 Comparison with Indicative Costings ................................................................................................... 86 19.6 Consultees ........................................................................................................................................... 86 20 REEDBEDS ............................................................................................................................................ 87 20.1 Method ................................................................................................................................................. 87 20.2 Revised targets .................................................................................................................................... 87 20.3 Unit costs.............................................................................................................................................. 88 20.4 Cost Estimates ..................................................................................................................................... 89 20.5 Comparison with Indicative Costings ................................................................................................... 90 21 AQUIFER FED NATURALLY FLUCTUATING WATER BODIES......................................................... 91 21.1 Method ................................................................................................................................................. 91 21.2 Revised Targets ................................................................................................................................... 91 21.3 Unit Costs............................................................................................................................................. 91 21.4 Cost Estimates ..................................................................................................................................... 91 21.5 Comparison with Indicative Costings ................................................................................................... 92 21.6 Consultees ........................................................................................................................................... 92 22 EUTROPHIC STANDING WATERS....................................................................................................... 93 22.1 Method ................................................................................................................................................. 93 22.2 Revised Targets ................................................................................................................................... 93 22.3 Unit Costs............................................................................................................................................. 94 22.4 Cost Estimates ..................................................................................................................................... 94 22.5 Comparison with Indicative Costings ................................................................................................... 95 22.6 Consultees ........................................................................................................................................... 95 23 MESOTROPHIC LAKES ........................................................................................................................ 97 23.1 Method ................................................................................................................................................. 97 23.2 Revised Targets ................................................................................................................................... 97 23.3 Unit Costs............................................................................................................................................. 98 23.4 Cost Estimates ..................................................................................................................................... 98
HAP Costings
J2003 5
23.5 Comparison with Indicative Costings ................................................................................................... 99 23.6 Consultees ........................................................................................................................................... 99 24 CHALK RIVERS ................................................................................................................................... 101 24.1 Method ............................................................................................................................................... 101 24.2 Revised Targets ................................................................................................................................. 101 24.3 Unit Costs........................................................................................................................................... 102 24.4 Cost Estimates ................................................................................................................................... 103 24.5 Comparison with Indicative Costings ................................................................................................. 103 24.6 Consultees ......................................................................................................................................... 104 25 MACHAIR ............................................................................................................................................. 105 25.1 Method ............................................................................................................................................... 105 25.2 Revised Targets ................................................................................................................................. 105 25.3 Unit Costs........................................................................................................................................... 106 25.4 Cost Estimates ................................................................................................................................... 107 25.5 Comparison with Indicative Costings ................................................................................................. 107 25.6 Consultees ......................................................................................................................................... 108 26 COASTAL VEGETATED SHINGLE..................................................................................................... 109 26.1 Method ............................................................................................................................................... 109 26.2 Revised Targets ................................................................................................................................. 109 26.3 Unit Costs........................................................................................................................................... 110 26.4 Cost Estimates ................................................................................................................................... 110 26.5 Comparison with Indicative Costings ................................................................................................. 111 26.6 Consultees ......................................................................................................................................... 111 27 MARITIME CLIFF AND SLOPES......................................................................................................... 113 27.1 Method ............................................................................................................................................... 113 27.2 Revised Targets ................................................................................................................................. 113 27.3 Unit Costs........................................................................................................................................... 114 27.4 Cost Estimates ................................................................................................................................... 114 27.5 Comparison with Indicative Costings ................................................................................................. 115 27.6 Consultees ......................................................................................................................................... 116 28 COASTAL SAND DUNES .................................................................................................................... 117 28.1 Method ............................................................................................................................................... 117 28.2 Revised Targets ................................................................................................................................. 117 28.3 Unit Costs........................................................................................................................................... 118 28.4 Cost Estimates ................................................................................................................................... 119 28.5 Comparison with Indicative Costings ................................................................................................. 120 28.6 Consultees ......................................................................................................................................... 120 29 SALTMARSH........................................................................................................................................ 121 29.1 Method ............................................................................................................................................... 121 29.2 Revised Targets ................................................................................................................................. 121 29.3 Unit Costs........................................................................................................................................... 121
HAP Costings
J2003 6
29.4 Cost Estimates ................................................................................................................................... 122 29.5 Comparison with Indicative Costings ................................................................................................. 122 29.6 Consultees ......................................................................................................................................... 123 30 MUDFLAT ............................................................................................................................................. 124 30.1 Method ............................................................................................................................................... 124 30.2 Revised Targets ................................................................................................................................. 124 30.3 Unit Costs........................................................................................................................................... 124 30.4 Cost Estimates ................................................................................................................................... 125 30.5 Comparison with Indicative Costings ................................................................................................. 125 30.6 Consultees ......................................................................................................................................... 125 31 SALINE LAGOONS.............................................................................................................................. 127 31.1 Method ............................................................................................................................................... 127 31.2 Revised Targets ................................................................................................................................. 127 31.3 Unit Costs........................................................................................................................................... 128 31.4 Cost Estimates ................................................................................................................................... 128 31.5 Comparison with Indicative Costings ................................................................................................. 129 31.6 Consultees ......................................................................................................................................... 129 32 MARINE HAPS ..................................................................................................................................... 131 32.1 Method ............................................................................................................................................... 131 32.2 Revised Targets ................................................................................................................................. 132 32.3 Unit Costs........................................................................................................................................... 132 32.4 Cost Estimates ................................................................................................................................... 132 32.5 Comparison with Indicative Costings ................................................................................................. 133 32.6 Consultees ......................................................................................................................................... 133 33 SUMMARY AND CONCLUSIONS ....................................................................................................... 134
HAP Costings
J2003 7
1 INTRODUCTION
The UK Biodiversity Action Plan sets out the Government’s commitments to conserve and enhance biodiversity in the UK, through a series of individual Habitat Action Plans (HAPs) and Species Action Plans (SAPs) setting out targets for the conservation of habitats and species, and actions designed to meet these targets. The indicative costs of delivering each of these HAPs and SAPs were estimated at the time they were published, between 1995 and 1998.1
GHK Consulting Ltd and RPS Ecology Ltd were commissioned in 2005 by Defra, English Nature, the Welsh Assembly, the Scottish Executive and the Department of the Environment in Northern Ireland to review and update estimates of the costs of delivering the UK BAP.
The first stage of the study involved a review of methodological approaches to revising the HAP costings. This concluded that the estimated costs of delivering HAPs had substantially changed since the HAPs were originally costed, for a variety of reasons. The most significant of these included:
New understanding of the actions required to meet the HAP targets and the costs of delivering them;
Changing unit costs (especially as a result of developments in land management schemes); and
Substantially revised targets, as a result of the current targets review.
The second stage of the study therefore involved a complete revision of the estimated costs of delivering each HAP. This report presents the results of this review.
Because the current HAP targets review is still incomplete, the costings in this report are based on the latest available targets rather than the final HAP targets. This second revised report updates the earlier analysis to reflect the latest draft targets in March 2006, which are currently subject to consultation at the country level. The targets used are still therefore only provisional and the costings will need to be updated again when the review is completed in Summer 2006.
Section 2 of this report presents a summary of the methodology employed in revising the HAP costings, explaining how key methodological issues were addressed. The next thirty sections present reviews of the costs of individual HAPs. In the case of native woodlands and the marine HAPs, combined cost estimates are produced. The final section presents and discusses the overall cost estimates for the HAPs as a whole.
1 The costings reports and the plans themselves comprise a series of documents and can be found on the UK Biodiversity Action Plan website at http://www.ukbap.org.uk/Library.aspx

HAP Costings
J2003 8

HAP Costings
J2003 9
2 METHODOLOGY
2.1 Overall Approach
The HAP costings review was informed by an initial methodological review, which examined different approaches and methodological issues in assessing the costs of HAP delivery. The review involved completion of six case studies to revise the costs for particular HAPs.2 It also drew on previous studies, such as a 2002 review for Defra3 which had investigated actual expenditures under the BAP to date and compared them with the indicative costings.
The methodological review concluded that the original indicative costings were substantially out of date and did not provide a good estimate of expected future HAP costs. It also identified significant methodological problems and limitations in the earlier costings, and concluded that there was a need for the costs of these HAPs to be reviewed on a plan by plan basis.
However, the review recommended that, rather than attempting to cost the HAPs on an action by action basis, that the revised costs should focus on the costs of delivering the HAP targets. The review found that for most HAPs over 95% of the indicative costings related to the costs of delivering habitat management, restoration and re-creation targets, and that the many other costed actions (relating, for example, to research, advice, communications, publicity and international actions) accounted collectively for only a small proportion of overall costs. Furthermore, many of the original actions set out in the HAPs are now out of date and do not reflect current priorities, and are therefore inappropriate as a basis for the costings.
The methodological review therefore found that the terrestrial HAPs and some wetland and coastal HAPs can be costed by identifying appropriate per hectare management, creation and restoration costs, and applying these to the revised HAP targets. An allowance for non-land related costs can be made by adding a small (5%) mark-up to these cost estimates.
Such an approach does not work for certain freshwater and marine HAPs, given that they do not involve a land management approach, and instead depend heavily on other actions such as survey, research and monitoring activities. For these HAPs, the costs can be estimated by identifying the broad areas of activity involved and estimating the appropriate level of resourcing for the programmes of work required.
The costs of delivering each HAP have been revised on the basis of the approach identified above. The necessary information was gathered through telephone interviews with the lead partner and country leads for each HAP, with data also being sought from restoration and re-creation projects with experience in the habitats in question. These interviews were supplemented by reviews of published
2 GHK Consulting Ltd and RPS Ecology Ltd (2005) Revising Estimates of Delivering Habitat Action Plans. Report for Defra and Partners. The six case study HAPs were Blanket Bog, Coastal and Floodplain Grazing Marsh, Upland Oakwood, Sublittoral Sands and Gravels (and other marine HAPs), Lowland Heathland and Eutrophic Standing Waters. 3 Shepherd, P.A., Gillespie, J., Garrod, G. and Willis, K. (2002) An Initial Investigation of the Actual Costs of Implementing UK Biodiversity Action Plans
HAP Costings
J2003 10
information on habitat costs, and by reference to agri-environment and forestry grant scheme literature for each country.
In many cases habitat costs are highly variable and site specific. Where possible, therefore, the approach has been to identify costs that can be averaged over a large number of projects and hectares to identify unit costs that are applicable to more than one site. For some HAPs, no such data was found, and it was necessary to develop generalised cost models employing assumptions about the various operations and costs required. The Annexes to the HAP costings report set out in detail the approach adopted for each individual HAP.
The cost estimates for each HAP have been developed using a simple spreadsheet model that combines data on targets and unit costs to produce cost estimates for each HAP. This model is designed to be easily updated if targets change in future or if new unit cost estimates are employed.
2.2 Key Methodological Issues
The revised BAP costings:
Refer to the total costs of delivering the HAPs, rather than attempting to estimate additional costs relative to existing expenditures;
Aim to identify costs attributable to the BAP itself, and its targets and actions, rather than other legislative drivers, or costs incurred as part of the core duties of the statutory conservation agencies;
Are based on a combination of HAP targets and actions, as appropriate;
Include the costs of land purchase where this is necessary to meet habitat targets;
Include opportunity costs where these are reflected in grant rates and land purchase costs;
Refer to the net costs of actions, taking account of any revenues and cost savings;
Use existing grant rates as far as these are available, relevant and appropriate;
Include estimates of administrative and central costs;
Are all expressed in 2005/06 prices.
Some of the key methodological issues are discussed below.
2.3 Total and Additional Costs
The previous indicative costings attempted to assess the additional costs of delivering the BAP, taking account of existing expenditures and aiming to identify the extra expenditures involved. In practice, the extent to which this was possible varied, with some cost estimates deducting existing expenditures and others failing to do so. The exercise was complicated by a lack of data on existing expenditures (e.g. for the woodland HAPs). As a result, the earlier indicative costings were somewhat inconsistent and comprised a combination of total costs and additional costs. Where additional costs were estimated, they were relative to expenditure levels at the time the plan was introduced (1995 or 1998).
The current exercise has been based on the total, rather than additional costs, of BAP delivery. This approach partly reflects the difficulties in assessing existing

HAP Costings
J2003 11
expenditures for many of the individual plans, which make an assessment of additional costs difficult. However, it is also argued that estimates of total costs are likely to be more transparent and robust over time than estimates of additional costs based on historic expenditure levels. The cost estimates can then be compared with existing BAP expenditures in aggregate to assess any additional resources needed at a particular point in time. The BAP funding assessment undertaken as part of this exercise provides a basis for comparison of BAP costs with existing expenditures.
2.4 BAP Attributable Costs
The costings exercise has aimed to assess the costs of implementing the requirements of the UK Biodiversity Action Plan, and the actions and targets within it. It has therefore sought to exclude costs which result primarily from other drivers, such as the EU Habitats and Water Framework Directives, SSSI legislation and the Local Biodiversity Action Plan process.
However, the boundaries between these different drivers are often not clear cut. In some cases, the costs of actions that clearly contribute to the BAP have been excluded because they are primarily driven by other processes. An example would be the monitoring of a BAP habitat as a requirement of the Habitats Directive, the recruitment of a SAC project officer to oversee management of a particular site, or the restoration of wetland sites being undertaken as a requirement of the Water Framework Directive, where in each case the action involved is not a requirement of the BAP.
However, in other cases, the requirements of BAP and other drivers cannot be disentangled. For example, the HAPs include targets for the creation, restoration and management of individual habitats. These targets include areas of sites designated under the Habitats and Birds Directives and under SSSI legislation. On the grounds that meeting these targets is a requirement of the BAP, as well as a lack of data in many cases on designated and non-designated areas, the approach has been to assess the costs of delivering the BAP targets as a whole.
Thus it could be argued that a proportion of the costs identified – while important for the delivery of the BAP - would be incurred even in the absence of the BAP, as a result of other drivers such as SSSI legislation. It is important therefore to recognise these areas of overlap and to ensure that there is consistent treatment where the costings are used to inform policy decisions. For example, comparisons of costs and existing expenditures need to be made on a like for like basis.
The costings also exclude the core duties of the statutory conservation agencies, including only the costs of particular HAP related actions. Examples of excluded activities are the general administration of the SSSI system, routine casework, and general educational and policy activities.
2.5 Land Purchase
The costings include the costs of land purchase where this is necessary to achieve BAP targets. In most cases land purchase is not necessary, and it is assumed that appropriate management can be met under private ownership, using appropriate incentives. However, for some habitats, such as the creation of saltmarsh and mudflat through managed realignment schemes, land purchase has a major role to play. The land purchase and incentive-based approaches are often interchangeable. For example, a managed realignment scheme might be achieved by buying farmland at £5,000 to £7,000 per hectare or by compensating the farmer
HAP Costings
J2003 12
for income foregone, paying an agri-environment payment of £500-£700 per hectare per year for ten years.
2.6 Opportunity Costs
In general the costings include the opportunity costs of BAP related activities, since in most cases these give rise to some form of compensation, and therefore result in a direct financial cost. For example, the creation and management of habitats often results in a loss of agricultural production. The income foregone is reflected in agri-environment payment rates, and therefore included in the costings. Alternatively it might be captured by the purchase of the land by the conservation agencies at the market rate (for example for use in a managed realignment scheme). By using similar per hectare costs irrespective of land ownership, the cost estimates aim to include opportunity costs as if the land were in private and productive use.
2.7 Net and Gross Costs
Where there is a difference between the net and gross costs of an action, for example because it yields revenues or results in a cost saving elsewhere, the net costs are used. Examples might include the sale of timber, which might reduce the net cost of a sand dune restoration scheme which involves removal of forestry, or a managed realignment scheme, which avoids the need to replace existing flood defences. In some instances, the costs of habitat creation may even be negative, where the alternative is a more costly option.
2.8 Public and Private Sector Costs
The cost estimates estimate the cost of delivering the HAP targets as a whole, and aim to include both public and private sector costs. The majority of these costs are met by the public sector, which, as well as managing land and undertaking a wide range of HAP related activity itself, also provides grants to private and voluntary sector land managers.
Many of the HAPs are costed using unit costs from agri-environment and woodland grant schemes, which are assumed to reflect the costs of meeting the area based targets, irrespective of land ownership. The general approach is to estimate the costs on the assumption that a grant or incentive needs to be paid from the public sector to a private land owner or land manager in order to achieve the given targets. In practice, incentives will not always be paid in every case, since the land may be in public ownership, or there may be eligibility restrictions that restrict the levels of payments made. In these cases, it is argued that the relevant payment rate is still the best estimate of the unit cost of meeting the target, on the grounds that it reflects a combination of financial and opportunity costs associated with land management, irrespective of who bears these costs.
2.9 Grants and Incentives
In general, it is assumed that the current grants and incentive payments available under agri-environment and woodland grant schemes represent the best available estimate of the per hectare costs of meeting HAP targets.
Certain assumptions are needed in using these payment rates. For example, where different options are available for different land and habitat types, it is often necessary to make an assumption about the extent to which each option applies to the habitat in question. An example might be where a different payment rate is available from re-establishing a habitat from arable land and from grassland. In
HAP Costings
J2003 13
these cases the cost model specifies the proportions in which different rates are used.
In general capital costs present greater methodological problems than annual costs, because they tend to be more variable and discretionary. For example, different payment rates are available under agri-environment schemes for clearance of scrub, depending on its nature, while it is also necessary to come to a view about the extent to which scrub clearance (as opposed to other operations) is required in the restoration of the habitat. In each case it is necessary to make assumptions and these are specified in the annexes for each habitat and in the cost model.
The use of current standard payment rates, while providing a transparent and evidence based approach, does raise some issues with respect to the treatment of marginal costs and variations in payments between countries (see below). In general these tend to make the cost estimates conservative.
2.10 Marginal Costs
Use of current payment rates for agri-environment and forestry schemes is a conservative approach that will tend to underestimate the true costs of HAP delivery. This is because we would expect the management, creation and restoration of habitats to have an upward sloping marginal cost curve. As the area of habitat increases, we expect the unit cost of that habitat to increase, as it becomes necessary to include land that is more difficult or costly to manage, and/or to entice more reluctant land managers to enter schemes. The result is that while payment rates are often fixed over specified periods, and while it may be possible to manage, restore or create a certain area of habitat at a particular unit cost, increasing the area target may only be achievable at a higher per hectare cost. This will not necessarily be the case where land management schemes are currently oversubscribed. In addition, it is possible that some factors will help to reduce costs as the area of habitat delivered increases, such as economies of scale and increased experience and knowledge.
Estimating marginal cost curves for each habitat would not be possible without a much larger and more complex study than this one.
2.11 Differences in Country Level Costs
The use of available incentive rates for land management also gives rise to some anomalies in the assumed unit costs for different countries. Differences in agri-environment rates between countries do reflect some differences in the real costs of land management. For example, they tend to be higher in England where land prices, agricultural productivity and labour costs tend to be higher than for the other countries of the UK.
However, there are also some differences in incentive payments between the different devolved administrations that are unlikely to explained by the true costs of habitat management, and it appears that some schemes are more generous than others. Payment rates can be set at a variable proportion of the estimated costs incurred and income foregone, particularly to give greater encouragement to certain activities than to others. In this respect differences in payment rates are likely to reflect differences in the incentives that have to be offered to land managers in different countries to meet the priorities at the country level.
HAP Costings
J2003 14
Once again, it is argued that the available payment rates in different countries provide the best available estimates of marginal unit costs, but that they should be treated as being conservative.
2.12 Administration and Central Costs
In all cases the HAP costings in this report include an allowance for the costs of co-ordinating and administering the actions for each habitat. The previous indicative costings assumed that these would amount to 10% of the overall costs of HAP delivery. This estimate was included in the Tranche 1 costings but not the Tranche 2 costings, so it was added separately to the aggregate totals in the summary report.
The methodological review concluded that costs of administering land management schemes and projects are higher than suggested by the earlier indicative costings, and that 15% is a more realistic estimate. This includes not only basic costs of administering the relevant schemes but also associated advisory, monitoring and evaluation work, which is often critical to the effectiveness of delivery. As a result, an allowance of 15% has been added to identified costs of habitat management in this report to allow for administration and central costs4.
For some habitats requiring particularly complex actions, a greater allowance has been made. For example, managed retreat schemes for saltmarsh, mudflat and saline lagoon creation have assumed a 50% cost of design and project management, based on Environment Agency estimates.
In addition, to the administration of habitat management work, there are further administration costs associated with the co-ordination of the delivery of the HAP as a whole and the various other actions within it. These are dealt with in one of two ways:
For those (terrestrial and some wetland) HAPs dominated by land management, and for which a 15% allowance is included to cover the cost of this land management work, any further administration costs are assumed to be included in the 5% allowance for “other costs”;
For the other freshwater, coastal and marine HAPs where individual actions or packages of actions have been costed, the costs of co-ordination of the HAP have been estimated separately. In some cases this cost is the cost of appointing a dedicated HAP co-ordinator, while in others a certain number of days of co-ordination activity have been costed.
2.13 Staff Costs
Delivery of many HAPs requires employment of dedicated officers to undertake particular actions (e.g. co-ordinators, policy, advisory and education officers). The cost of employing staff is more than just the cost of salaries, but includes other financial costs such as National Insurance and pension costs, office expenses, IT costs, travel and subsistence costs, training and other human resource costs, administrative support, and other expenses such as the cost of conferences and publications. While these extra costs vary from one post to another, they are
4 In practice, administration costs vary between schemes, with the costs of running some agri-environment and woodland management schemes higher than for others. 15% is taken as an overall average. See the methodological review for more details.
HAP Costings
J2003 15
estimated to be on average equal to salary costs. Thus the total cost of employing staff is assumed to be twice the cost of staff salaries.
2.14 Inflation
The indicative costings were expressed in prices current at the time they were made. General prices (as measured by HM Treasury’s GDP deflator) have increased by 28% since 1995/96 and 17% since 1998/99. Therefore, any comparisons or analysis based on the indicative costings in this report have inflated them by 28% (for Tranche 1) and 17% (Tranche 2) to express them in 2005/06 prices.
2.15 Voluntary Activities
Costs of voluntary activities are not estimated separately, but do form a (very small) part of the overall costs of HAP delivery. The costings take account of labour costs, and where voluntary labour replaces paid labour (e.g. in nature reserve management), the overall cost estimates will include some volunteer time. However, the case studies found no examples where the treatment of voluntary activities would have any significant bearing on the costings. Voluntary activities are more significant in the costings of species5.
2.16 The Impact of Policy Change
Policy changes can have a significant effect on the costs of HAP delivery. For example, the implementation of the Water Framework Directive is helping to meet the costs of monitoring and restoring many of the freshwater and coastal HAPs, reducing the need for additional and dedicated expenditures under the BAP.
In many of the HAPs, the recent CAP reform and the introduction of the Single Farm Payment is likely to influence the costs of land management by reducing incentives for intensive agriculture. It is possible that this may reduce the agri-environment payment rates required to deliver the required habitat management. However, this may not always be the case, while there may be a need for new types of incentives to prevent agricultural abandonment. Agri-environment payments in England and Wales have recently been revised, and the costings have used the current payment rates.
The earlier methodological review considered the possible impacts of policy change on the costs of delivering each of the case study HAPs. It concluded that, while policy change had significant potential to influence the costs (positively or negatively) in future, the direction and magnitude of change was often uncertain, and that the costings exercise should be based on the latest available data for unit costs and payment rates.
5 For example, the species costings include estimates of the financial costs for administering the Breeding Bird Survey under different farmland bird species costings, but exclude the cost of the voluntary fieldwork involved, which involves many thousands of amateur ornithologists.
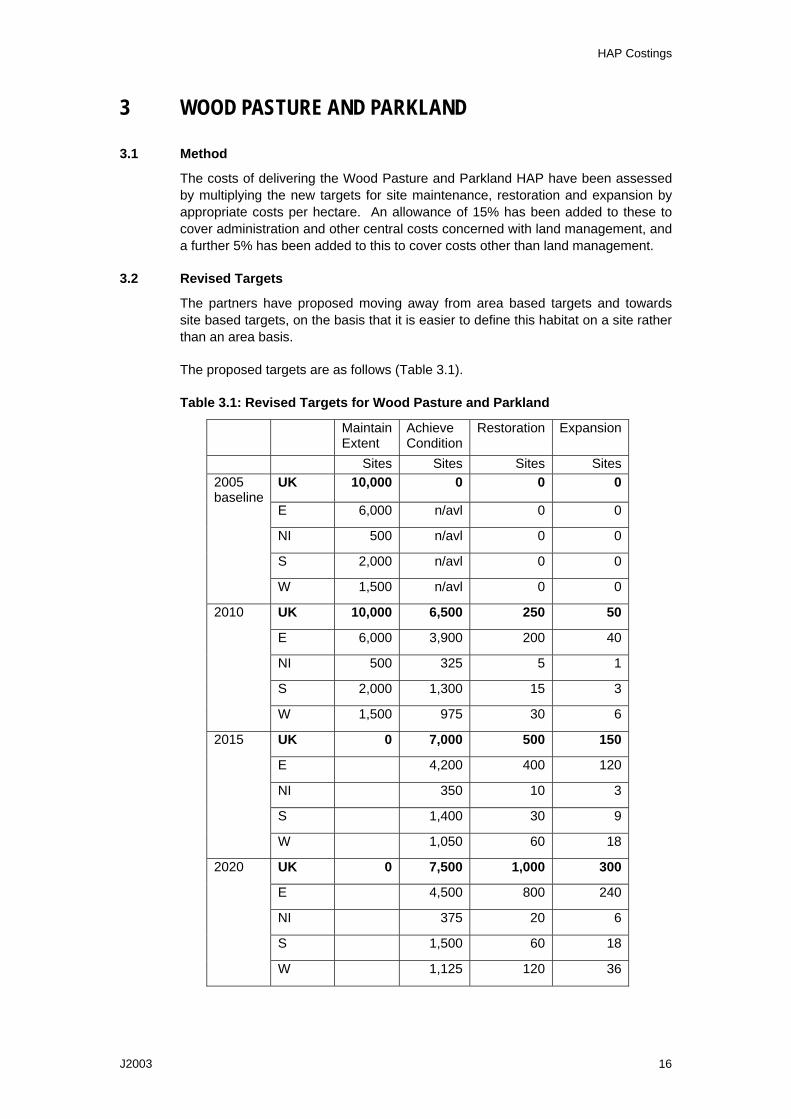
HAP Costings
J2003 16
3 WOOD PASTURE AND PARKLAND
3.1 Method
The costs of delivering the Wood Pasture and Parkland HAP have been assessed by multiplying the new targets for site maintenance, restoration and expansion by appropriate costs per hectare. An allowance of 15% has been added to these to cover administration and other central costs concerned with land management, and a further 5% has been added to this to cover costs other than land management.
3.2 Revised Targets
The partners have proposed moving away from area based targets and towards site based targets, on the basis that it is easier to define this habitat on a site rather than an area basis.
The proposed targets are as follows (Table 3.1).
Table 3.1: Revised Targets for Wood Pasture and Parkland
Maintain Extent
Achieve Condition
Restoration Expansion
Sites Sites Sites Sites UK 10,000 0 0 0
E 6,000 n/avl 0 0
NI 500 n/avl 0 0
S 2,000 n/avl 0 0
2005 baseline
W 1,500 n/avl 0 0
UK 10,000 6,500 250 50
E 6,000 3,900 200 40
NI 500 325 5 1
S 2,000 1,300 15 3
2010
W 1,500 975 30 6
UK 0 7,000 500 150
E 4,200 400 120
NI 350 10 3
S 1,400 30 9
2015
W 1,050 60 18
UK 0 7,500 1,000 300
E 4,500 800 240
NI 375 20 6
S 1,500 60 18
2020
W 1,125 120 36
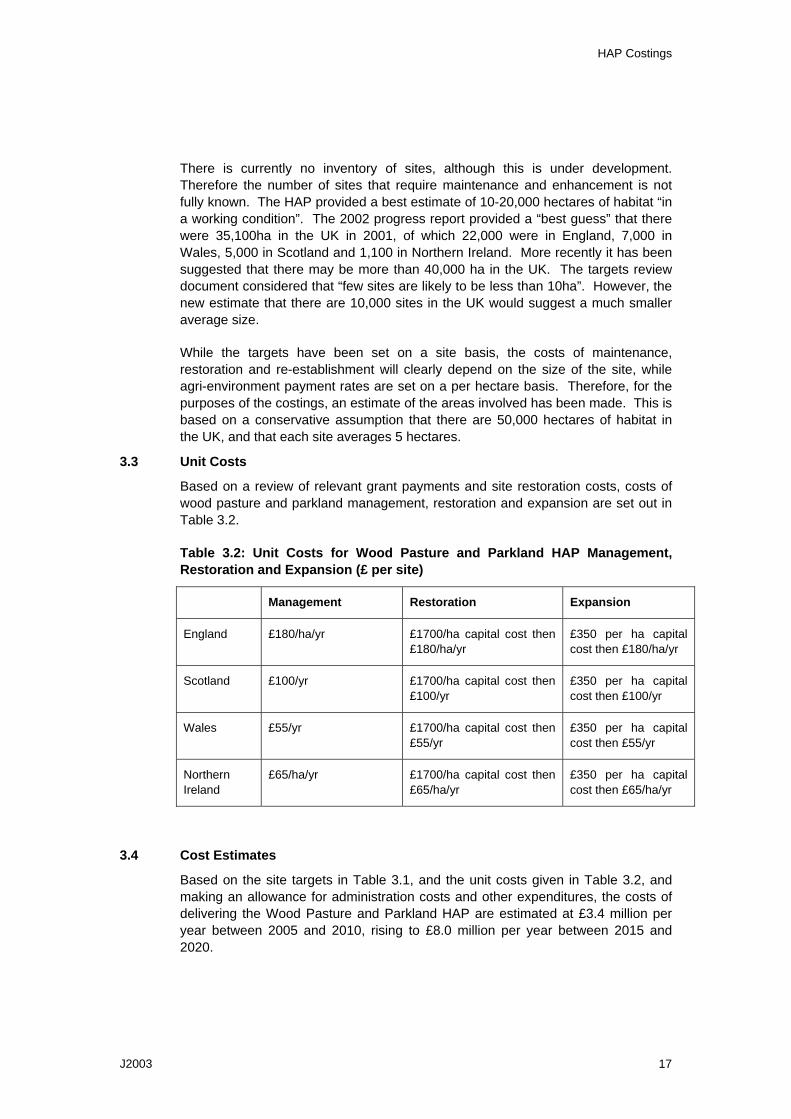
HAP Costings
J2003 17
There is currently no inventory of sites, although this is under development. Therefore the number of sites that require maintenance and enhancement is not fully known. The HAP provided a best estimate of 10-20,000 hectares of habitat “in a working condition”. The 2002 progress report provided a “best guess” that there were 35,100ha in the UK in 2001, of which 22,000 were in England, 7,000 in Wales, 5,000 in Scotland and 1,100 in Northern Ireland. More recently it has been suggested that there may be more than 40,000 ha in the UK. The targets review document considered that “few sites are likely to be less than 10ha”. However, the new estimate that there are 10,000 sites in the UK would suggest a much smaller average size.
While the targets have been set on a site basis, the costs of maintenance, restoration and re-establishment will clearly depend on the size of the site, while agri-environment payment rates are set on a per hectare basis. Therefore, for the purposes of the costings, an estimate of the areas involved has been made. This is based on a conservative assumption that there are 50,000 hectares of habitat in the UK, and that each site averages 5 hectares.
3.3 Unit Costs
Based on a review of relevant grant payments and site restoration costs, costs of wood pasture and parkland management, restoration and expansion are set out in Table 3.2.
Table 3.2: Unit Costs for Wood Pasture and Parkland HAP Management, Restoration and Expansion (£ per site)
Management Restoration Expansion
England £180/ha/yr £1700/ha capital cost then £180/ha/yr
£350 per ha capital cost then £180/ha/yr
Scotland £100/yr £1700/ha capital cost then £100/yr
£350 per ha capital cost then £100/yr
Wales £55/yr £1700/ha capital cost then £55/yr
£350 per ha capital cost then £55/yr
Northern Ireland
£65/ha/yr £1700/ha capital cost then £65/ha/yr
£350 per ha capital cost then £65/ha/yr
3.4 Cost Estimates
Based on the site targets in Table 3.1, and the unit costs given in Table 3.2, and making an allowance for administration costs and other expenditures, the costs of delivering the Wood Pasture and Parkland HAP are estimated at £3.4 million per year between 2005 and 2010, rising to £8.0 million per year between 2015 and 2020.
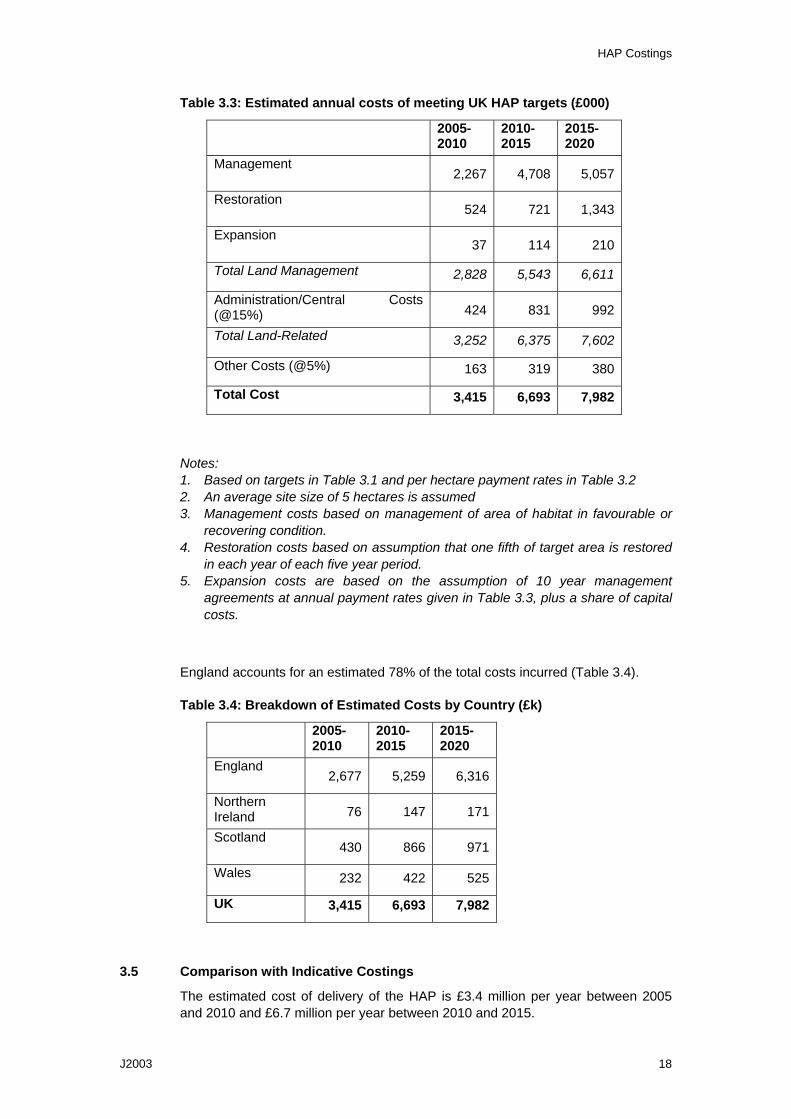
HAP Costings
J2003 18
Table 3.3: Estimated annual costs of meeting UK HAP targets (£000)
2005-2010
2010-2015
2015-2020
Management 2,267 4,708 5,057
Restoration 524 721 1,343
Expansion 37 114 210
Total Land Management 2,828 5,543 6,611
Administration/Central Costs (@15%) 424 831 992
Total Land-Related 3,252 6,375 7,602
Other Costs (@5%) 163 319 380
Total Cost 3,415 6,693 7,982
Notes: 1. Based on targets in Table 3.1 and per hectare payment rates in Table 3.2 2. An average site size of 5 hectares is assumed 3. Management costs based on management of area of habitat in favourable or
recovering condition. 4. Restoration costs based on assumption that one fifth of target area is restored
in each year of each five year period. 5. Expansion costs are based on the assumption of 10 year management
agreements at annual payment rates given in Table 3.3, plus a share of capital costs.
England accounts for an estimated 78% of the total costs incurred (Table 3.4).
Table 3.4: Breakdown of Estimated Costs by Country (£k)
2005-2010
2010-2015
2015-2020
England 2,677 5,259 6,316
Northern Ireland 76 147 171
Scotland 430 866 971
Wales 232 422 525
UK 3,415 6,693 7,982
3.5 Comparison with Indicative Costings
The estimated cost of delivery of the HAP is £3.4 million per year between 2005 and 2010 and £6.7 million per year between 2010 and 2015.
HAP Costings
J2003 19
These costs compare with estimates in the indicative costings of £675k per year in the first five years to 2003/4, falling to £461k per year in the 10 years to 2013/14. These figures are equivalent to £790k and £546k respectively at 2005 prices, only around one tenth of the cost estimates above. The reason for this major difference is that the indicative costings were based on only a small proportion of the area of the resource and that low per hectare costs were used. For example, it was assumed that only one third of the habitat would require management agreements, and that this would attract a payment rate of only £35/ha/yr.
3.6 Consultees
The consultants are grateful to the following consultees who provided helpful comments, advice and information:
Keith Kirby, English Nature
Richard Smithers, Woodland Trust
Stuart Warrington, National Trust
Jeremy Dagley, Corporation of London
David Clayden, English Nature
Helen Stace, English Nature
Nick Short, Forestry Commission
Pauline Harvey, English Nature
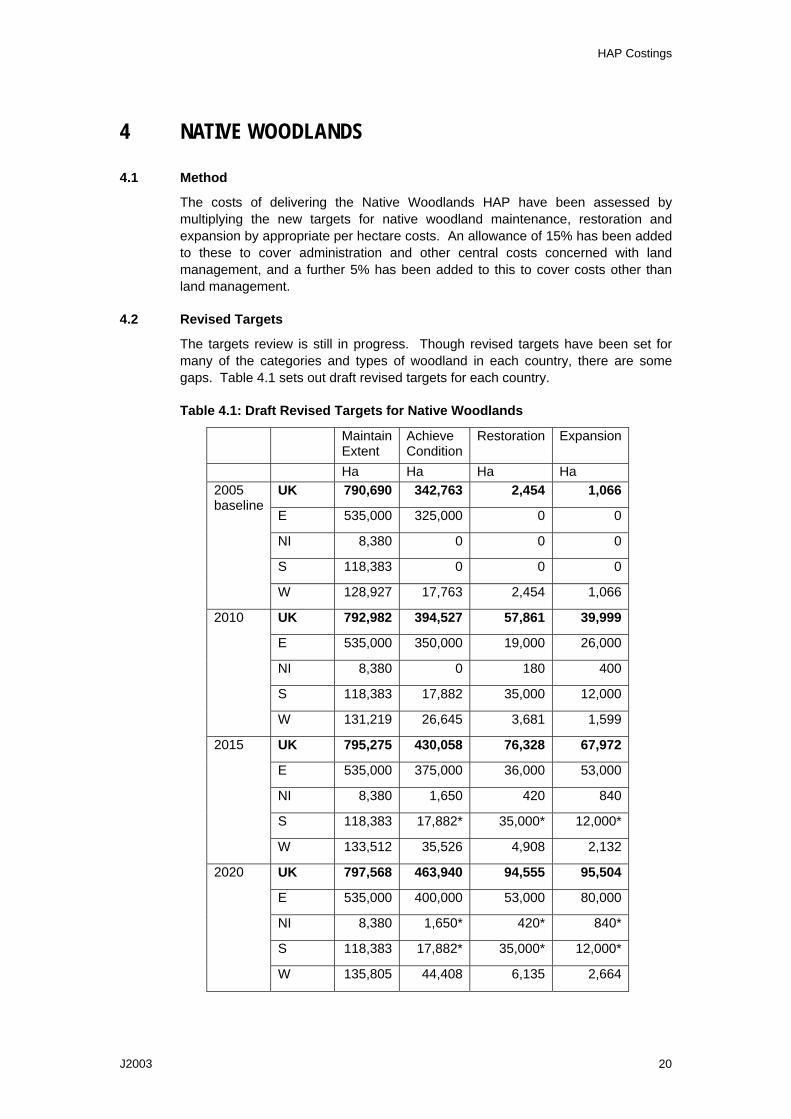
HAP Costings
J2003 20
4 NATIVE WOODLANDS
4.1 Method
The costs of delivering the Native Woodlands HAP have been assessed by multiplying the new targets for native woodland maintenance, restoration and expansion by appropriate per hectare costs. An allowance of 15% has been added to these to cover administration and other central costs concerned with land management, and a further 5% has been added to this to cover costs other than land management.
4.2 Revised Targets
The targets review is still in progress. Though revised targets have been set for many of the categories and types of woodland in each country, there are some gaps. Table 4.1 sets out draft revised targets for each country.
Table 4.1: Draft Revised Targets for Native Woodlands
Maintain Extent
Achieve Condition
Restoration Expansion
Ha Ha Ha Ha UK 790,690 342,763 2,454 1,066
E 535,000 325,000 0 0
NI 8,380 0 0 0
S 118,383 0 0 0
2005 baseline
W 128,927 17,763 2,454 1,066
UK 792,982 394,527 57,861 39,999
E 535,000 350,000 19,000 26,000
NI 8,380 0 180 400
S 118,383 17,882 35,000 12,000
2010
W 131,219 26,645 3,681 1,599
UK 795,275 430,058 76,328 67,972
E 535,000 375,000 36,000 53,000
NI 8,380 1,650 420 840
S 118,383 17,882* 35,000* 12,000*
2015
W 133,512 35,526 4,908 2,132
UK 797,568 463,940 94,555 95,504
E 535,000 400,000 53,000 80,000
NI 8,380 1,650* 420* 840*
S 118,383 17,882* 35,000* 12,000*
2020
W 135,805 44,408 6,135 2,664
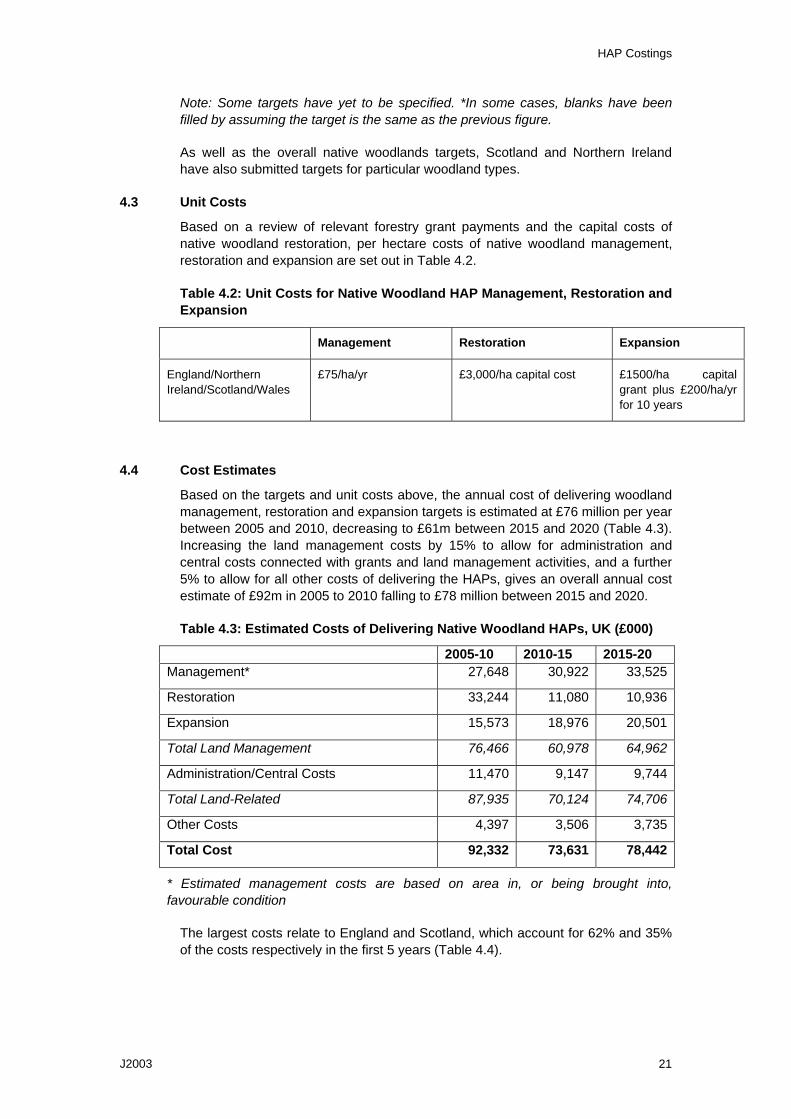
HAP Costings
J2003 21
Note: Some targets have yet to be specified. *In some cases, blanks have been filled by assuming the target is the same as the previous figure.
As well as the overall native woodlands targets, Scotland and Northern Ireland have also submitted targets for particular woodland types.
4.3 Unit Costs
Based on a review of relevant forestry grant payments and the capital costs of native woodland restoration, per hectare costs of native woodland management, restoration and expansion are set out in Table 4.2.
Table 4.2: Unit Costs for Native Woodland HAP Management, Restoration and Expansion
Management Restoration Expansion
England/Northern Ireland/Scotland/Wales
£75/ha/yr £3,000/ha capital cost £1500/ha capital grant plus £200/ha/yr for 10 years
4.4 Cost Estimates
Based on the targets and unit costs above, the annual cost of delivering woodland management, restoration and expansion targets is estimated at £76 million per year between 2005 and 2010, decreasing to £61m between 2015 and 2020 (Table 4.3). Increasing the land management costs by 15% to allow for administration and central costs connected with grants and land management activities, and a further 5% to allow for all other costs of delivering the HAPs, gives an overall annual cost estimate of £92m in 2005 to 2010 falling to £78 million between 2015 and 2020.
Table 4.3: Estimated Costs of Delivering Native Woodland HAPs, UK (£000)
2005-10 2010-15 2015-20 Management* 27,648 30,922 33,525
Restoration 33,244 11,080 10,936
Expansion 15,573 18,976 20,501
Total Land Management 76,466 60,978 64,962
Administration/Central Costs 11,470 9,147 9,744
Total Land-Related 87,935 70,124 74,706
Other Costs 4,397 3,506 3,735
Total Cost 92,332 73,631 78,442
* Estimated management costs are based on area in, or being brought into, favourable condition
The largest costs relate to England and Scotland, which account for 62% and 35% of the costs respectively in the first 5 years (Table 4.4).
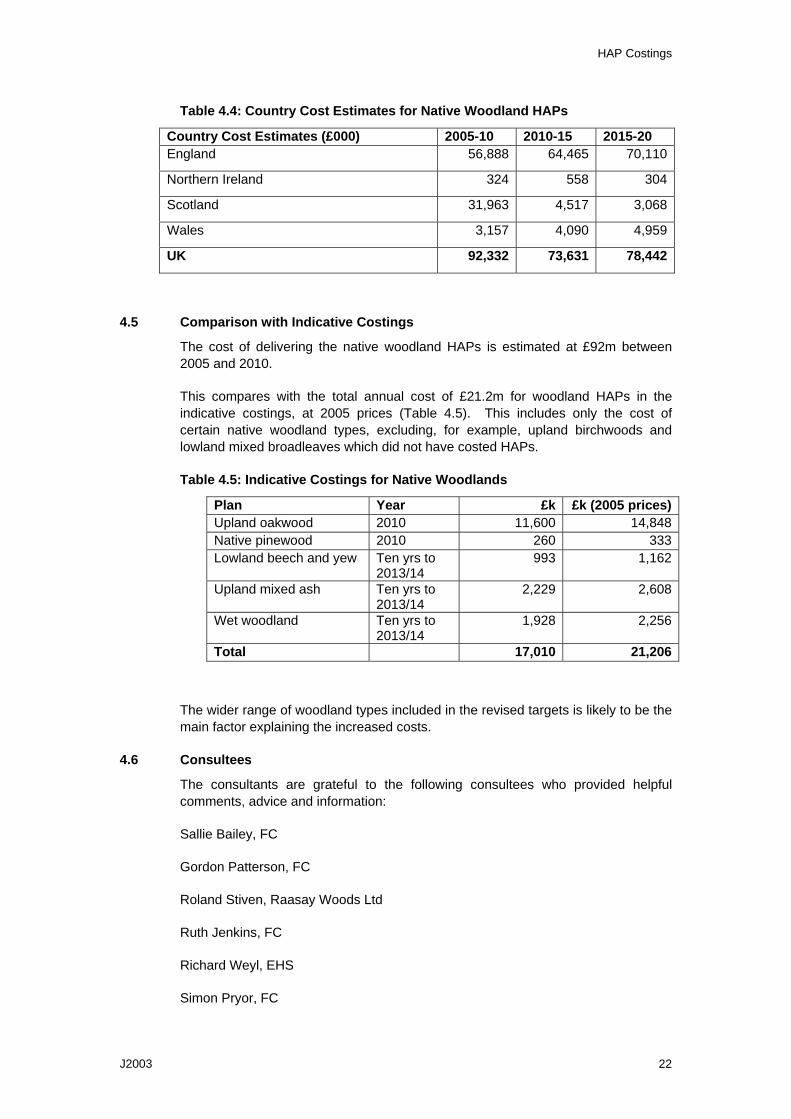
HAP Costings
J2003 22
Table 4.4: Country Cost Estimates for Native Woodland HAPs
Country Cost Estimates (£000) 2005-10 2010-15 2015-20 England 56,888 64,465 70,110
Northern Ireland 324 558 304
Scotland 31,963 4,517 3,068
Wales 3,157 4,090 4,959
UK 92,332 73,631 78,442
4.5 Comparison with Indicative Costings
The cost of delivering the native woodland HAPs is estimated at £92m between 2005 and 2010.
This compares with the total annual cost of £21.2m for woodland HAPs in the indicative costings, at 2005 prices (Table 4.5). This includes only the cost of certain native woodland types, excluding, for example, upland birchwoods and lowland mixed broadleaves which did not have costed HAPs.
Table 4.5: Indicative Costings for Native Woodlands
Plan Year £k £k (2005 prices)Upland oakwood 2010 11,600 14,848Native pinewood 2010 260 333Lowland beech and yew Ten yrs to
2013/14 993 1,162
Upland mixed ash Ten yrs to 2013/14
2,229 2,608
Wet woodland Ten yrs to 2013/14
1,928 2,256
Total 17,010 21,206
The wider range of woodland types included in the revised targets is likely to be the main factor explaining the increased costs.
4.6 Consultees
The consultants are grateful to the following consultees who provided helpful comments, advice and information:
Sallie Bailey, FC
Gordon Patterson, FC
Roland Stiven, Raasay Woods Ltd
Ruth Jenkins, FC
Richard Weyl, EHS
Simon Pryor, FC

HAP Costings
J2003 23
Richard Schaible, DARD
Phil Baarda, Highland Birchwoods
Irma White, FC Grants and Licences
Douglas Wright, FC
Simon Mead, Better Woods for Wales
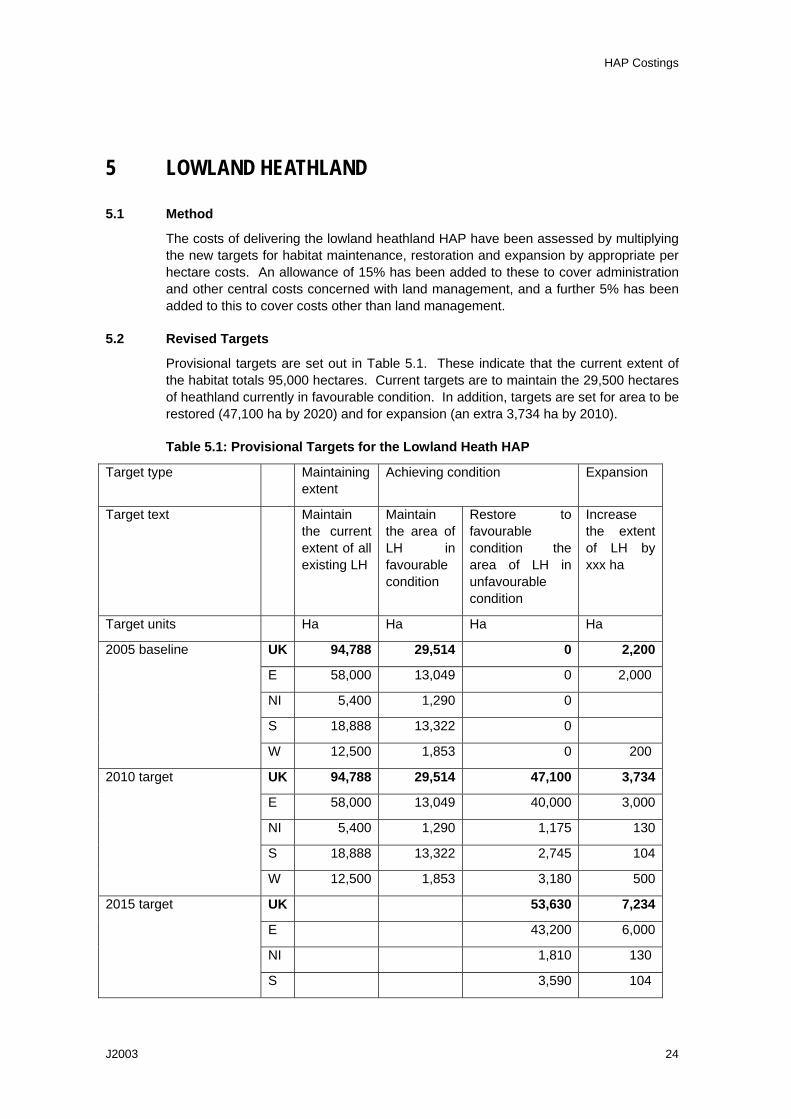
HAP Costings
J2003 24
5 LOWLAND HEATHLAND
5.1 Method
The costs of delivering the lowland heathland HAP have been assessed by multiplying the new targets for habitat maintenance, restoration and expansion by appropriate per hectare costs. An allowance of 15% has been added to these to cover administration and other central costs concerned with land management, and a further 5% has been added to this to cover costs other than land management.
5.2 Revised Targets
Provisional targets are set out in Table 5.1. These indicate that the current extent of the habitat totals 95,000 hectares. Current targets are to maintain the 29,500 hectares of heathland currently in favourable condition. In addition, targets are set for area to be restored (47,100 ha by 2020) and for expansion (an extra 3,734 ha by 2010).
Table 5.1: Provisional Targets for the Lowland Heath HAP
Target type Maintaining extent
Achieving condition Expansion
Target text Maintain the current extent of all existing LH
Maintain the area of LH in favourable condition
Restore to favourable condition the area of LH in unfavourable condition
Increase the extent of LH by xxx ha
Target units Ha Ha Ha Ha
UK 94,788 29,514 0 2,200
E 58,000 13,049 0 2,000
NI 5,400 1,290 0
S 18,888 13,322 0
2005 baseline
W 12,500 1,853 0 200
UK 94,788 29,514 47,100 3,734
E 58,000 13,049 40,000 3,000
NI 5,400 1,290 1,175 130
S 18,888 13,322 2,745 104
2010 target
W 12,500 1,853 3,180 500
UK 53,630 7,234
E 43,200 6,000
NI 1,810 130
2015 target
S 3,590 104
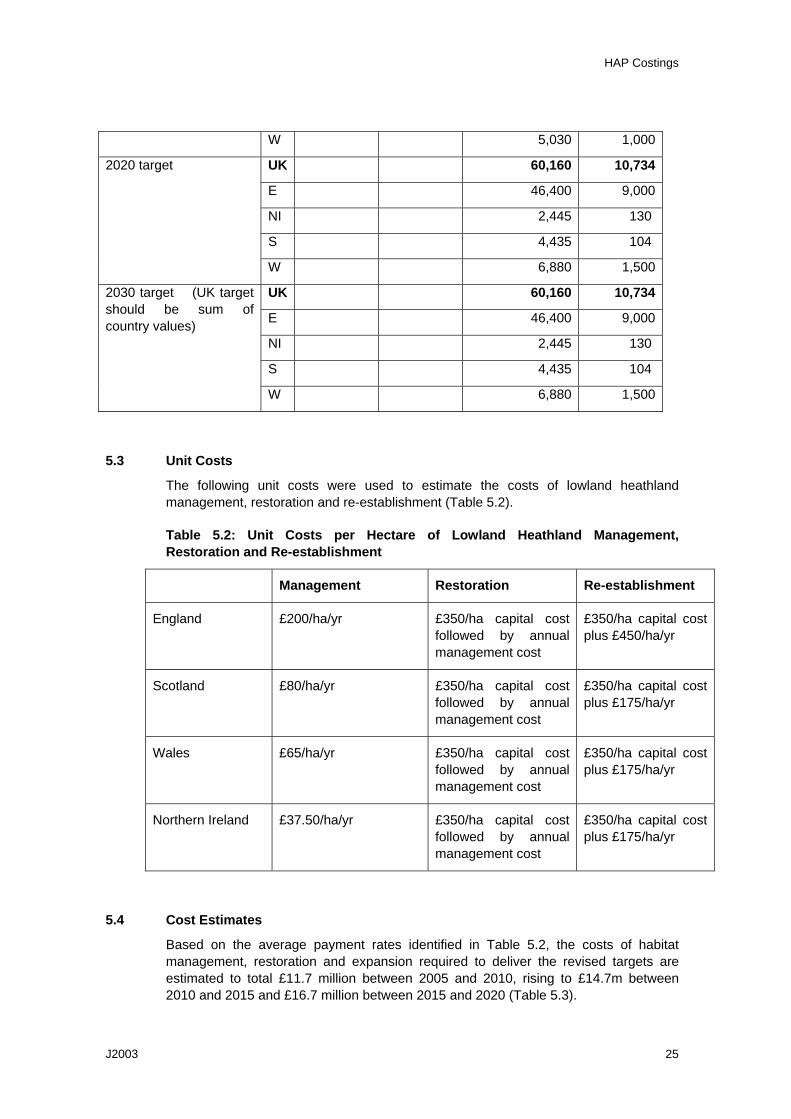
HAP Costings
J2003 25
W 5,030 1,000
UK 60,160 10,734
E 46,400 9,000
NI 2,445 130
S 4,435 104
2020 target
W 6,880 1,500
UK 60,160 10,734
E 46,400 9,000
NI 2,445 130
S 4,435 104
2030 target (UK target should be sum of country values)
W 6,880 1,500
5.3 Unit Costs
The following unit costs were used to estimate the costs of lowland heathland management, restoration and re-establishment (Table 5.2).
Table 5.2: Unit Costs per Hectare of Lowland Heathland Management, Restoration and Re-establishment
Management Restoration Re-establishment
England £200/ha/yr £350/ha capital cost followed by annual management cost
£350/ha capital cost plus £450/ha/yr
Scotland £80/ha/yr £350/ha capital cost followed by annual management cost
£350/ha capital cost plus £175/ha/yr
Wales £65/ha/yr £350/ha capital cost followed by annual management cost
£350/ha capital cost plus £175/ha/yr
Northern Ireland £37.50/ha/yr £350/ha capital cost followed by annual management cost
£350/ha capital cost plus £175/ha/yr
5.4 Cost Estimates
Based on the average payment rates identified in Table 5.2, the costs of habitat management, restoration and expansion required to deliver the revised targets are estimated to total £11.7 million between 2005 and 2010, rising to £14.7m between 2010 and 2015 and £16.7 million between 2015 and 2020 (Table 5.3).
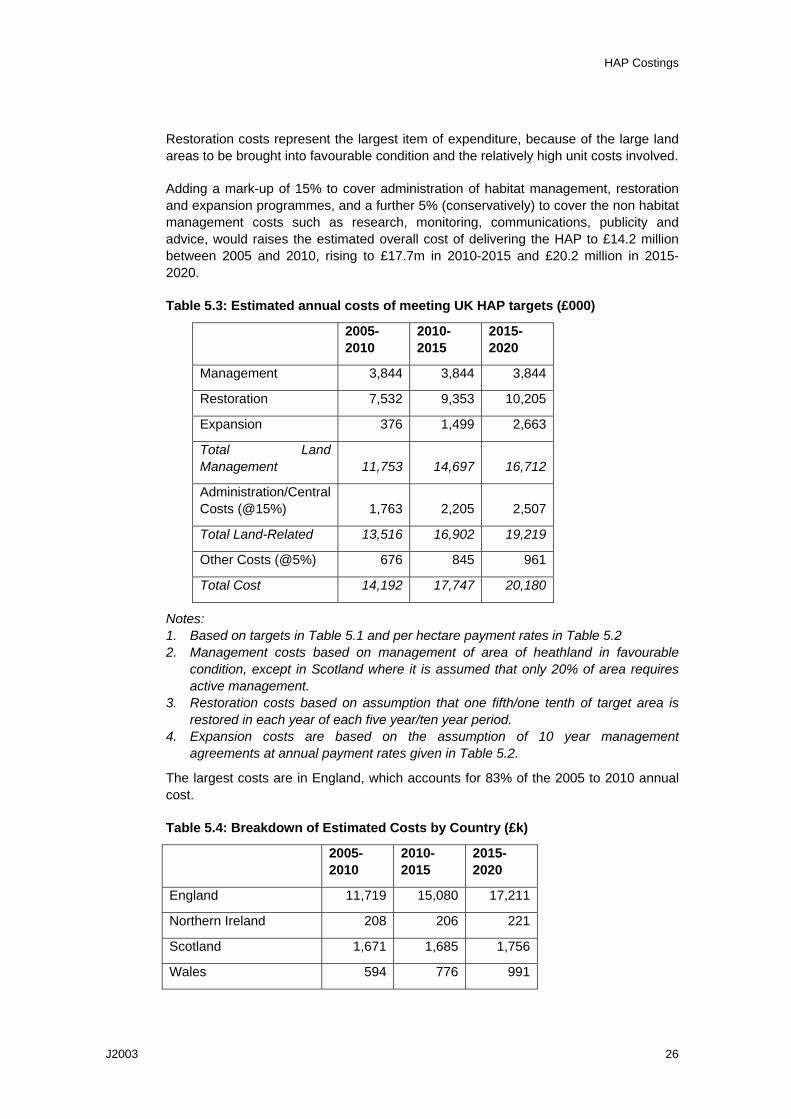
HAP Costings
J2003 26
Restoration costs represent the largest item of expenditure, because of the large land areas to be brought into favourable condition and the relatively high unit costs involved.
Adding a mark-up of 15% to cover administration of habitat management, restoration and expansion programmes, and a further 5% (conservatively) to cover the non habitat management costs such as research, monitoring, communications, publicity and advice, would raises the estimated overall cost of delivering the HAP to £14.2 million between 2005 and 2010, rising to £17.7m in 2010-2015 and £20.2 million in 2015-2020.
Table 5.3: Estimated annual costs of meeting UK HAP targets (£000)
2005-2010
2010-2015
2015-2020
Management 3,844 3,844 3,844
Restoration 7,532 9,353 10,205
Expansion 376 1,499 2,663
Total Land Management 11,753 14,697 16,712
Administration/Central Costs (@15%) 1,763 2,205 2,507
Total Land-Related 13,516 16,902 19,219
Other Costs (@5%) 676 845 961
Total Cost 14,192 17,747 20,180
Notes: 1. Based on targets in Table 5.1 and per hectare payment rates in Table 5.2 2. Management costs based on management of area of heathland in favourable
condition, except in Scotland where it is assumed that only 20% of area requires active management.
3. Restoration costs based on assumption that one fifth/one tenth of target area is restored in each year of each five year/ten year period.
4. Expansion costs are based on the assumption of 10 year management agreements at annual payment rates given in Table 5.2.
The largest costs are in England, which accounts for 83% of the 2005 to 2010 annual cost.
Table 5.4: Breakdown of Estimated Costs by Country (£k)
2005-2010
2010-2015
2015-2020
England 11,719 15,080 17,211
Northern Ireland 208 206 221
Scotland 1,671 1,685 1,756
Wales 594 776 991

HAP Costings
J2003 27
UK 14,192 17,747 20,180
5.5 Comparison with Indicative Costings
The estimated cost of delivery of the HAP is £14.2 million per year between 2005 and 2010 and £17.7 million per year between 2010 and 2015.
These costs are higher than those suggested by the indicative costings, which estimated the additional cost of delivering the HAP at £1.1 million in 1997, rising to £2.1 million in 2000 and £3.4 million in 2010 (central estimates), in addition to existing 1995 expenditures of £3.3million. If 1995 expenditures are included and the figures are updated to 2005/06 prices, the indicative costings imply total spending of £7.7m in 2000 and £8.6m in 2010. The main difference is accounted for by higher per hectare management costs, in line with current rates under Higher Level Stewardship.
5.6 Consultees
The consultants are grateful to the following consultees who provided helpful comments, advice and information:
Isabel Alonso, EN
Steve Clarke, EN
Jan Sherry, CCW
Lynne Farrell, SNH
Andrew Tuddenham, THH, Pembrokeshire
Sion Brackenbury, THH Gower
Richard Weyl, EHS
Nigel Symes, RSPB
Gy Ovenden, Defra
HAP Costings
J2003 28
6 UPLAND HEATHLAND
6.1 Method
Delivering the HAP for upland heathland requires habitat maintenance, restoration and re-establishment, as well as some research, monitoring, advisory and publicity activities. The costs of delivering the HAP have therefore been estimated by multiplying the targets for habitat maintenance, restoration and expansion by appropriate per hectare costs, in addition to which an allowance of 15% has been added to these to cover administration and other central costs concerned with land management. A further 5% has been added to this to cover the wider costs associated with delivery, including research and monitoring.
6.2 Revised targets
Provisional targets are set out in Table 6.1. These are largely based on the old HAP targets, since the numerical value of the revised targets for achieving condition and restoration is still being worked out.
The old targets state that 75% of the resource is to be in favourable condition by 2010. As the old indicative costing assumed that 25% was in favourable condition in 1997, we assume that progress in the intervening years towards the target means that 50% is now in favourable condition. We also assume that all of this is in agri-environment schemes for the purpose of calculating the costs of delivering the HAP. Hence, a further 25% will need to be brought under scheme and favourable management by 2010.
A target was set for restoration according to which 20,000 ha in England, 20,000 in Northern Ireland, 40,000 ha in Scotland and 20,000 ha in Wales are to be restored by 2010. We assume that half of this target has been achieved by 2005, and that the restoration targets are therefore in effect halved.
A target was set for re-creation according to which 650 ha in England, 150 in Northern Ireland, 4,000 ha in Scotland and 200 ha in Wales are to be re-created by 2010. As in the earlier indicative costings, we assume that half of this target has been achieved by 2005, and that the target is therefore in effect halved. The new targets will not include a target for creation.

HAP Costings
J2003 29
Table 6.1: Provisional Targets for the Upland heathland HAP
Target type Maintaining extent Achieving condition Expansion
Upland Heathland (UH)
Maintain the current extent of all existing UH
Maintain the area of UH in favourable or recovering condition
Restore xxx Ha of UH
Re-establish xxx ha of UH
Target units Ha Ha Ha Ha 2005 baseline UK 976,000 488,000 0 0
E 213,000 106,500 0 0
NI 60,000 30,000 0 0
S 623,000 311,500 0 0
W 80,000 40,000 0 0
2010 target UK 976,000 732,000 50,000 2500
E 213,000 159,750 10000 325
NI 60,000 45,000 10000 75
S 623,000 467,250 20000 2000
W 80,000 60,000 10000 100
2015 target UK 976,000 732,000 50,000 2500
E 213,000 159,750 10000 325
NI 60,000 45,000 10000 75
S 623,000 467,250 20000 2000
W 80,000 60,000 10000 100
2020 target UK 976,000 732,000 50,000 2500
E 213,000 159,750 10000 325
NI 60,000 45,000 10000 75
S 623,000 467,250 20000 2000
W 80,000 60,000 10000 100
Note: Revised targets are only available for maintaining extent (2005 and 2010). The remaining figures have been estimated by the consultants based on previous targets.
6.3 Unit costs
The following unit costs were used to estimate the costs of upland heathland management, restoration and re-creation. These are based on available agri-environment payment rates, and a review of the capital costs incurred by restoration and re-establishment projects.

HAP Costings
J2003 30
Table 6.2: Unit Costs per Hectare of Upland Heathland Management, Restoration and Re-establishment
Management Restoration Re-establishment
England £43.50/ha/yr annual cost
£150 capital costs/ha + £45.5/ha/yr annual cost
£60/ha/yr annual cost
Northern Ireland £46/ha/yr annual cost
£150 capital costs/ha + £46/ha/yr annual cost
£46/ha/yr annual cost
Scotland £1.55/ha/yr annual cost
£150 capital costs/ha + £1.55/ha/yr annual cost
£1/ha/yr annual cost
Wales £50/ha/yr annual cost
£150 capital costs/ha + £50/ha/yr annual cost
£110/ha/yr annual cost
The Annex provides a review of the unit costs listed in this table.
6.4 Cost Estimates
Based on the average payment rates identified in Table 6.2, the annual costs of habitat management, restoration and re-establishment required to deliver the revised targets are estimated to total £12.8 million between 2005 and 2010, £14.2 million between 2010 and 2015 and £13.5 million between 2015 and 2020.
Adding a mark-up of 15% to cover administration of habitat management, restoration and expansion programmes, and a further 5% to cover the non-habitat management costs such as research, monitoring, communications, publicity and advice would raise the overall costs of delivering the HAP to £15.5 million between 2005 and 2010, £17.1 million between 2010-2015 and £16.3 million between 2015-2020.
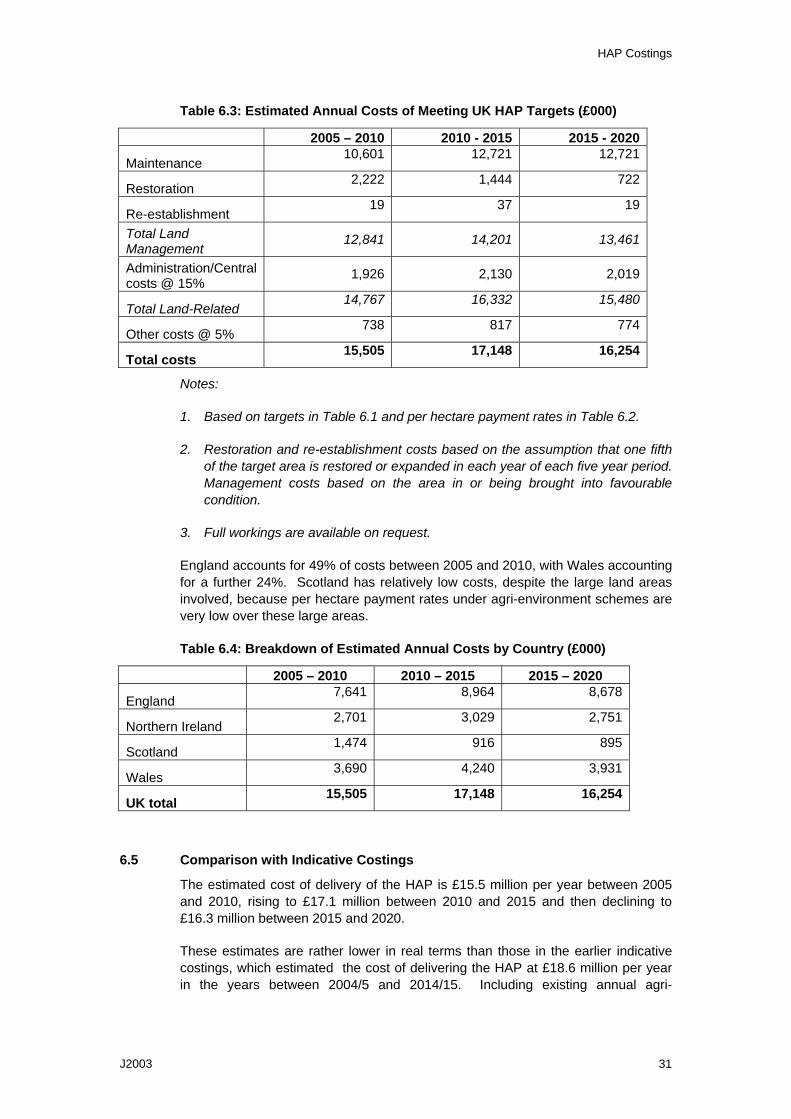
HAP Costings
J2003 31
Table 6.3: Estimated Annual Costs of Meeting UK HAP Targets (£000)
2005 – 2010 2010 - 2015 2015 - 2020
Maintenance 10,601 12,721 12,721
Restoration 2,222 1,444 722
Re-establishment 19 37 19
Total Land Management
12,841 14,201 13,461
Administration/Central costs @ 15%
1,926 2,130 2,019
Total Land-Related 14,767 16,332 15,480
Other costs @ 5% 738 817 774
Total costs 15,505 17,148 16,254
Notes:
1. Based on targets in Table 6.1 and per hectare payment rates in Table 6.2.
2. Restoration and re-establishment costs based on the assumption that one fifth of the target area is restored or expanded in each year of each five year period. Management costs based on the area in or being brought into favourable condition.
3. Full workings are available on request.
England accounts for 49% of costs between 2005 and 2010, with Wales accounting for a further 24%. Scotland has relatively low costs, despite the large land areas involved, because per hectare payment rates under agri-environment schemes are very low over these large areas.
Table 6.4: Breakdown of Estimated Annual Costs by Country (£000)
2005 – 2010 2010 – 2015 2015 – 2020
England 7,641 8,964 8,678
Northern Ireland 2,701 3,029 2,751
Scotland 1,474 916 895
Wales 3,690 4,240 3,931
UK total 15,505 17,148 16,254
6.5 Comparison with Indicative Costings
The estimated cost of delivery of the HAP is £15.5 million per year between 2005 and 2010, rising to £17.1 million between 2010 and 2015 and then declining to £16.3 million between 2015 and 2020.
These estimates are rather lower in real terms than those in the earlier indicative costings, which estimated the cost of delivering the HAP at £18.6 million per year in the years between 2004/5 and 2014/15. Including existing annual agri-

HAP Costings
J2003 32
environment expenditure (£3.5 million for the base year of 1997/98), and updating to 2005/06 prices, the indicative costings would reach £26.5 million for this period.
The main reason for the difference is the difference in annual management costs, assumed in the indicative costings to be £100/ha for all countries. This compares to current agri-environment payment rates of £40/ha/yr in England (basic payment under Higher Level Stewardship) and as low as £1/ha/yr in Scotland (basic payment under the Rural Stewardship Scheme). Including existing agri-environment payment rates in the revised costings provides a more accurate estimate of true costs, but should be regarded as conservative, particularly for Scotland where it is unclear whether existing payment rates are sufficient to achieve the level of management required.
6.6 Consultees
The consultants are grateful to the following consultees who provided helpful comments, advice and information:
Mick Rebane, English Nature
Barbara Jones, CCW
Jan Sherry, CCW
Sarah Hetherington, CCW
Andrew Coupar, SNH
Martin Bradley. DoE NI
Gavin McNeill, DoE NI
Patrick Lindley, RSPB, Project Manager for the Black Grouse Restoration Project
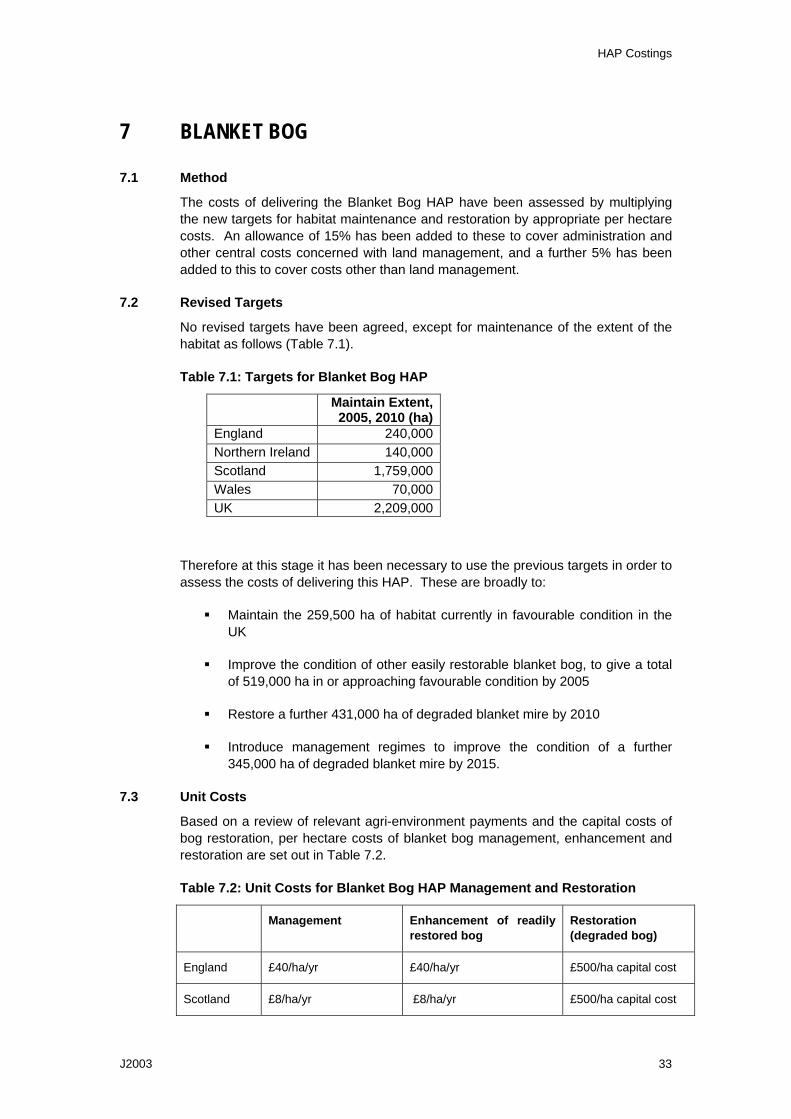
HAP Costings
J2003 33
7 BLANKET BOG
7.1 Method
The costs of delivering the Blanket Bog HAP have been assessed by multiplying the new targets for habitat maintenance and restoration by appropriate per hectare costs. An allowance of 15% has been added to these to cover administration and other central costs concerned with land management, and a further 5% has been added to this to cover costs other than land management.
7.2 Revised Targets
No revised targets have been agreed, except for maintenance of the extent of the habitat as follows (Table 7.1).
Table 7.1: Targets for Blanket Bog HAP
Maintain Extent, 2005, 2010 (ha)
England 240,000Northern Ireland 140,000Scotland 1,759,000Wales 70,000UK 2,209,000
Therefore at this stage it has been necessary to use the previous targets in order to assess the costs of delivering this HAP. These are broadly to:
Maintain the 259,500 ha of habitat currently in favourable condition in the UK
Improve the condition of other easily restorable blanket bog, to give a total of 519,000 ha in or approaching favourable condition by 2005
Restore a further 431,000 ha of degraded blanket mire by 2010
Introduce management regimes to improve the condition of a further 345,000 ha of degraded blanket mire by 2015.
7.3 Unit Costs
Based on a review of relevant agri-environment payments and the capital costs of bog restoration, per hectare costs of blanket bog management, enhancement and restoration are set out in Table 7.2.
Table 7.2: Unit Costs for Blanket Bog HAP Management and Restoration
Management Enhancement of readily restored bog
Restoration (degraded bog)
England £40/ha/yr £40/ha/yr £500/ha capital cost
Scotland £8/ha/yr £8/ha/yr £500/ha capital cost
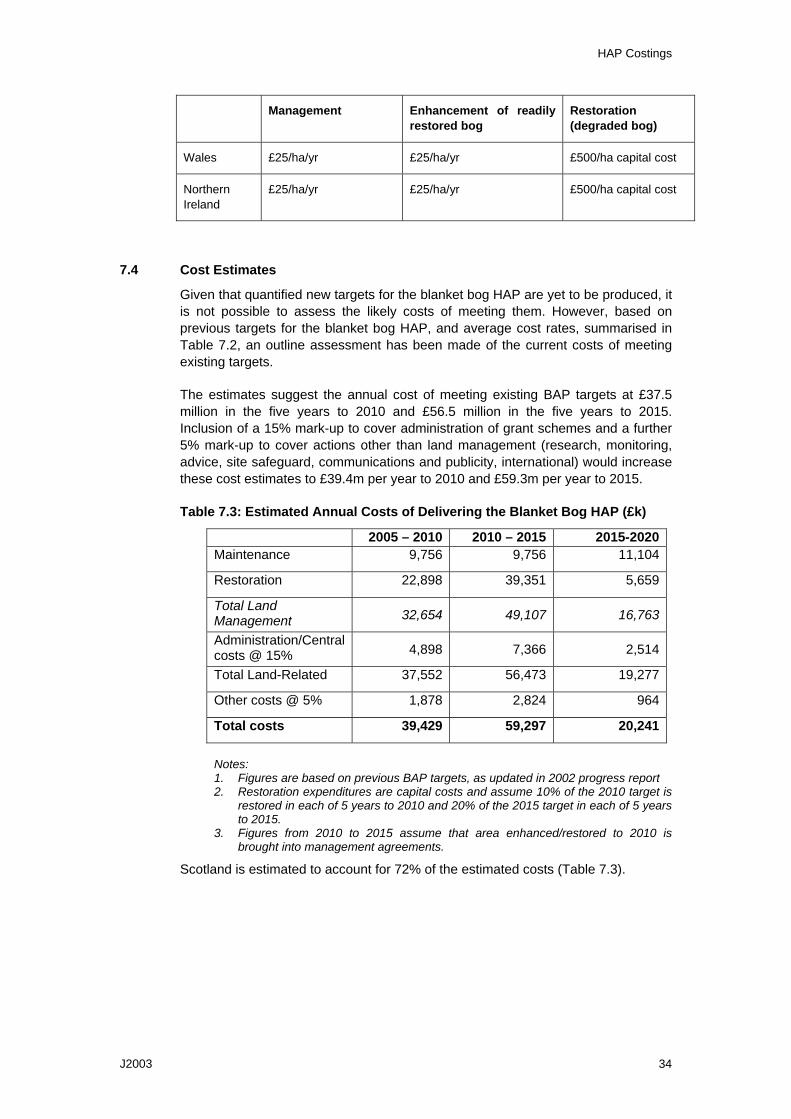
HAP Costings
J2003 34
Management Enhancement of readily restored bog
Restoration (degraded bog)
Wales £25/ha/yr £25/ha/yr £500/ha capital cost
Northern Ireland
£25/ha/yr £25/ha/yr £500/ha capital cost
7.4 Cost Estimates
Given that quantified new targets for the blanket bog HAP are yet to be produced, it is not possible to assess the likely costs of meeting them. However, based on previous targets for the blanket bog HAP, and average cost rates, summarised in Table 7.2, an outline assessment has been made of the current costs of meeting existing targets.
The estimates suggest the annual cost of meeting existing BAP targets at £37.5 million in the five years to 2010 and £56.5 million in the five years to 2015. Inclusion of a 15% mark-up to cover administration of grant schemes and a further 5% mark-up to cover actions other than land management (research, monitoring, advice, site safeguard, communications and publicity, international) would increase these cost estimates to £39.4m per year to 2010 and £59.3m per year to 2015.
Table 7.3: Estimated Annual Costs of Delivering the Blanket Bog HAP (£k)
2005 – 2010 2010 – 2015 2015-2020Maintenance 9,756 9,756 11,104
Restoration 22,898 39,351 5,659
Total Land Management 32,654 49,107 16,763
Administration/Central costs @ 15% 4,898 7,366 2,514
Total Land-Related 37,552 56,473 19,277
Other costs @ 5% 1,878 2,824 964
Total costs 39,429 59,297 20,241
Notes: 1. Figures are based on previous BAP targets, as updated in 2002 progress report 2. Restoration expenditures are capital costs and assume 10% of the 2010 target is
restored in each of 5 years to 2010 and 20% of the 2015 target in each of 5 years to 2015.
3. Figures from 2010 to 2015 assume that area enhanced/restored to 2010 is brought into management agreements.
Scotland is estimated to account for 72% of the estimated costs (Table 7.3).
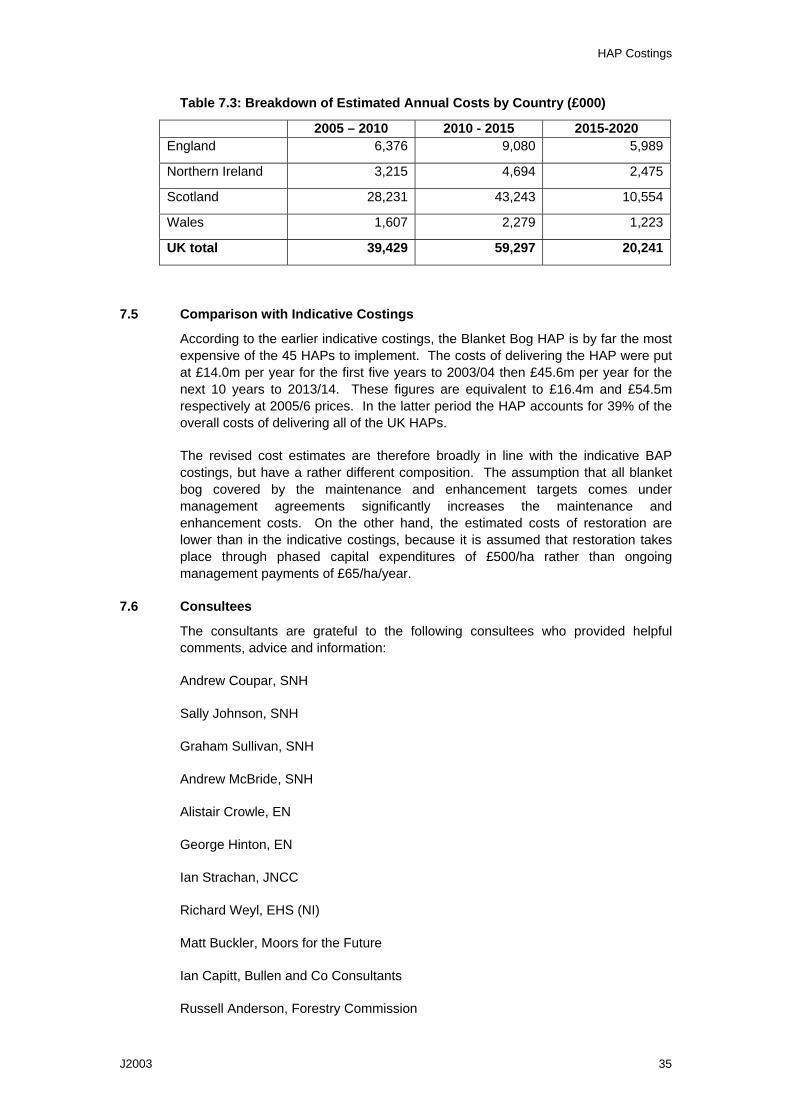
HAP Costings
J2003 35
Table 7.3: Breakdown of Estimated Annual Costs by Country (£000)
2005 – 2010 2010 - 2015 2015-2020 England 6,376 9,080 5,989
Northern Ireland 3,215 4,694 2,475
Scotland 28,231 43,243 10,554
Wales 1,607 2,279 1,223
UK total 39,429 59,297 20,241
7.5 Comparison with Indicative Costings
According to the earlier indicative costings, the Blanket Bog HAP is by far the most expensive of the 45 HAPs to implement. The costs of delivering the HAP were put at £14.0m per year for the first five years to 2003/04 then £45.6m per year for the next 10 years to 2013/14. These figures are equivalent to £16.4m and £54.5m respectively at 2005/6 prices. In the latter period the HAP accounts for 39% of the overall costs of delivering all of the UK HAPs.
The revised cost estimates are therefore broadly in line with the indicative BAP costings, but have a rather different composition. The assumption that all blanket bog covered by the maintenance and enhancement targets comes under management agreements significantly increases the maintenance and enhancement costs. On the other hand, the estimated costs of restoration are lower than in the indicative costings, because it is assumed that restoration takes place through phased capital expenditures of £500/ha rather than ongoing management payments of £65/ha/year.
7.6 Consultees
The consultants are grateful to the following consultees who provided helpful comments, advice and information:
Andrew Coupar, SNH
Sally Johnson, SNH
Graham Sullivan, SNH
Andrew McBride, SNH
Alistair Crowle, EN
George Hinton, EN
Ian Strachan, JNCC
Richard Weyl, EHS (NI)
Matt Buckler, Moors for the Future
Ian Capitt, Bullen and Co Consultants
Russell Anderson, Forestry Commission
HAP Costings
J2003 36
David Balharry, Deer Commission
Peter Kirk, Deer Commission
Andy Lietch, Forestry Commission (deer management)
Martin Mooney, DARD
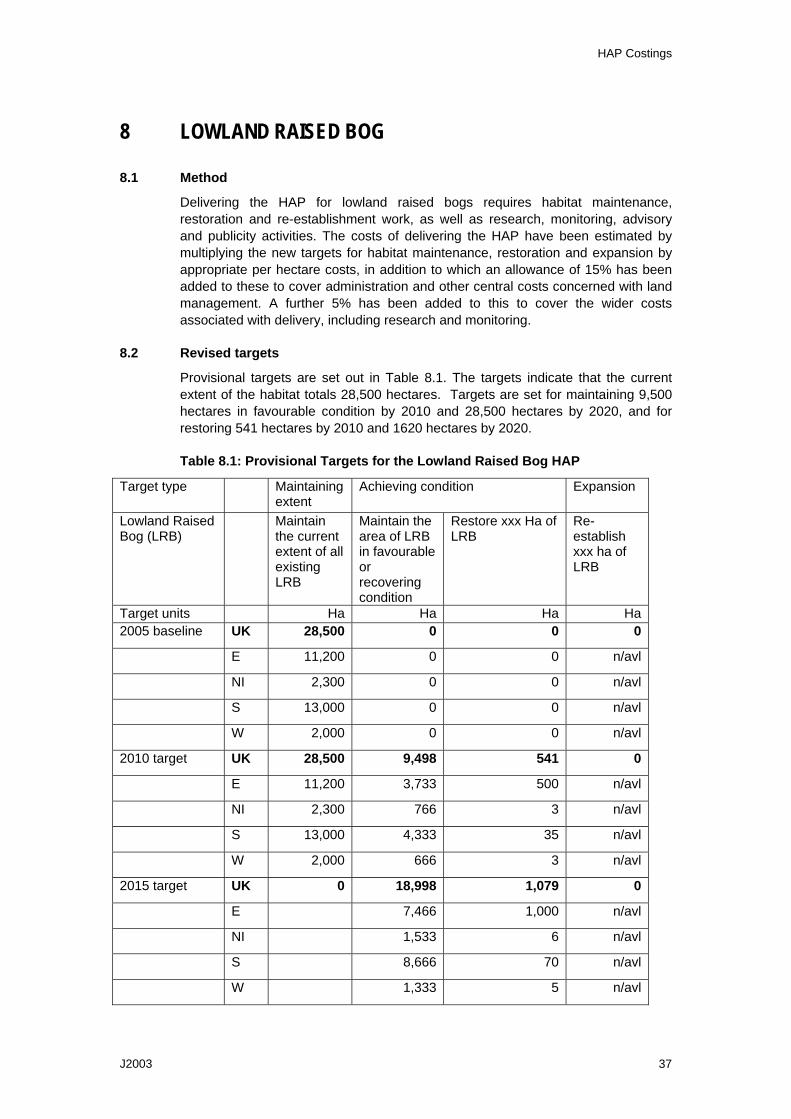
HAP Costings
J2003 37
8 LOWLAND RAISED BOG
8.1 Method
Delivering the HAP for lowland raised bogs requires habitat maintenance, restoration and re-establishment work, as well as research, monitoring, advisory and publicity activities. The costs of delivering the HAP have been estimated by multiplying the new targets for habitat maintenance, restoration and expansion by appropriate per hectare costs, in addition to which an allowance of 15% has been added to these to cover administration and other central costs concerned with land management. A further 5% has been added to this to cover the wider costs associated with delivery, including research and monitoring.
8.2 Revised targets
Provisional targets are set out in Table 8.1. The targets indicate that the current extent of the habitat totals 28,500 hectares. Targets are set for maintaining 9,500 hectares in favourable condition by 2010 and 28,500 hectares by 2020, and for restoring 541 hectares by 2010 and 1620 hectares by 2020.
Table 8.1: Provisional Targets for the Lowland Raised Bog HAP
Target type Maintaining extent
Achieving condition Expansion
Lowland Raised Bog (LRB)
Maintain the current extent of all existing LRB
Maintain the area of LRB in favourable or recovering condition
Restore xxx Ha of LRB
Re-establish xxx ha of LRB
Target units Ha Ha Ha Ha 2005 baseline UK 28,500 0 0 0
E 11,200 0 0 n/avl
NI 2,300 0 0 n/avl
S 13,000 0 0 n/avl
W 2,000 0 0 n/avl
2010 target UK 28,500 9,498 541 0
E 11,200 3,733 500 n/avl
NI 2,300 766 3 n/avl
S 13,000 4,333 35 n/avl
W 2,000 666 3 n/avl
2015 target UK 0 18,998 1,079 0
E 7,466 1,000 n/avl
NI 1,533 6 n/avl
S 8,666 70 n/avl
W 1,333 5 n/avl
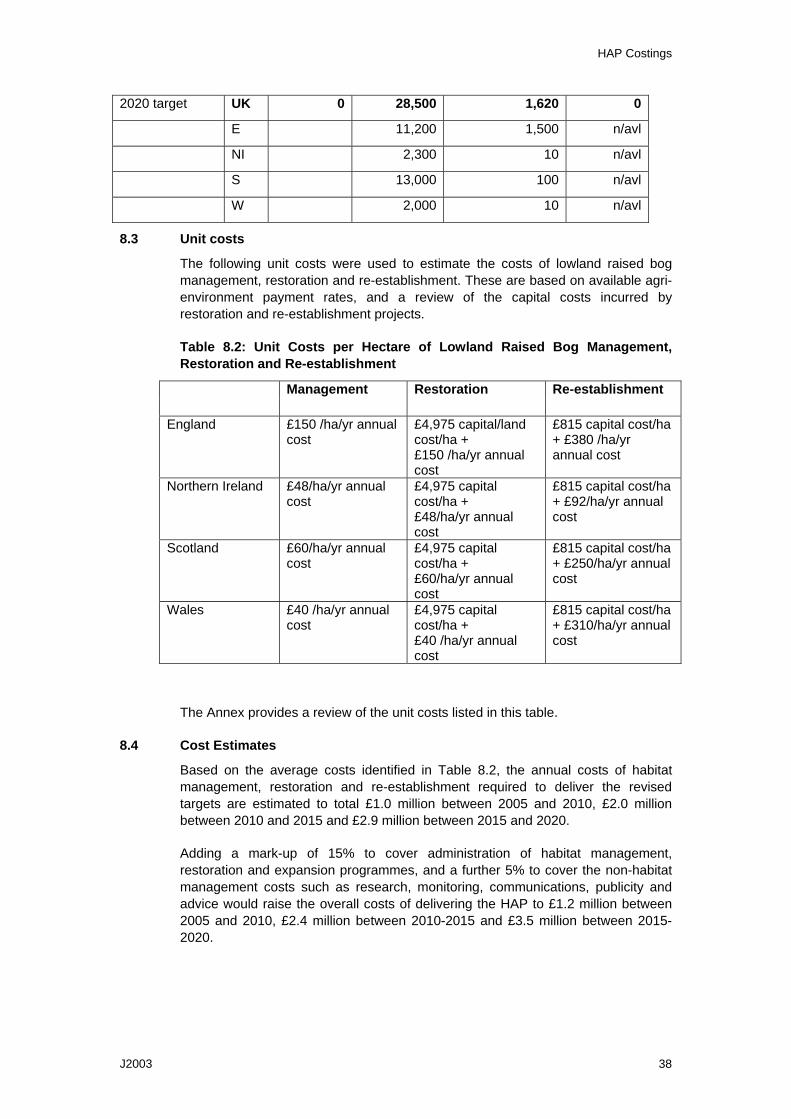
HAP Costings
J2003 38
2020 target UK 0 28,500 1,620 0
E 11,200 1,500 n/avl
NI 2,300 10 n/avl
S 13,000 100 n/avl
W 2,000 10 n/avl
8.3 Unit costs
The following unit costs were used to estimate the costs of lowland raised bog management, restoration and re-establishment. These are based on available agri-environment payment rates, and a review of the capital costs incurred by restoration and re-establishment projects.
Table 8.2: Unit Costs per Hectare of Lowland Raised Bog Management, Restoration and Re-establishment
Management Restoration Re-establishment
England £150 /ha/yr annual cost
£4,975 capital/land cost/ha + £150 /ha/yr annual cost
£815 capital cost/ha + £380 /ha/yr annual cost
Northern Ireland £48/ha/yr annual cost
£4,975 capital cost/ha + £48/ha/yr annual cost
£815 capital cost/ha + £92/ha/yr annual cost
Scotland £60/ha/yr annual cost
£4,975 capital cost/ha + £60/ha/yr annual cost
£815 capital cost/ha + £250/ha/yr annual cost
Wales £40 /ha/yr annual cost
£4,975 capital cost/ha + £40 /ha/yr annual cost
£815 capital cost/ha + £310/ha/yr annual cost
The Annex provides a review of the unit costs listed in this table.
8.4 Cost Estimates
Based on the average costs identified in Table 8.2, the annual costs of habitat management, restoration and re-establishment required to deliver the revised targets are estimated to total £1.0 million between 2005 and 2010, £2.0 million between 2010 and 2015 and £2.9 million between 2015 and 2020.
Adding a mark-up of 15% to cover administration of habitat management, restoration and expansion programmes, and a further 5% to cover the non-habitat management costs such as research, monitoring, communications, publicity and advice would raise the overall costs of delivering the HAP to £1.2 million between 2005 and 2010, £2.4 million between 2010-2015 and £3.5 million between 2015-2020.
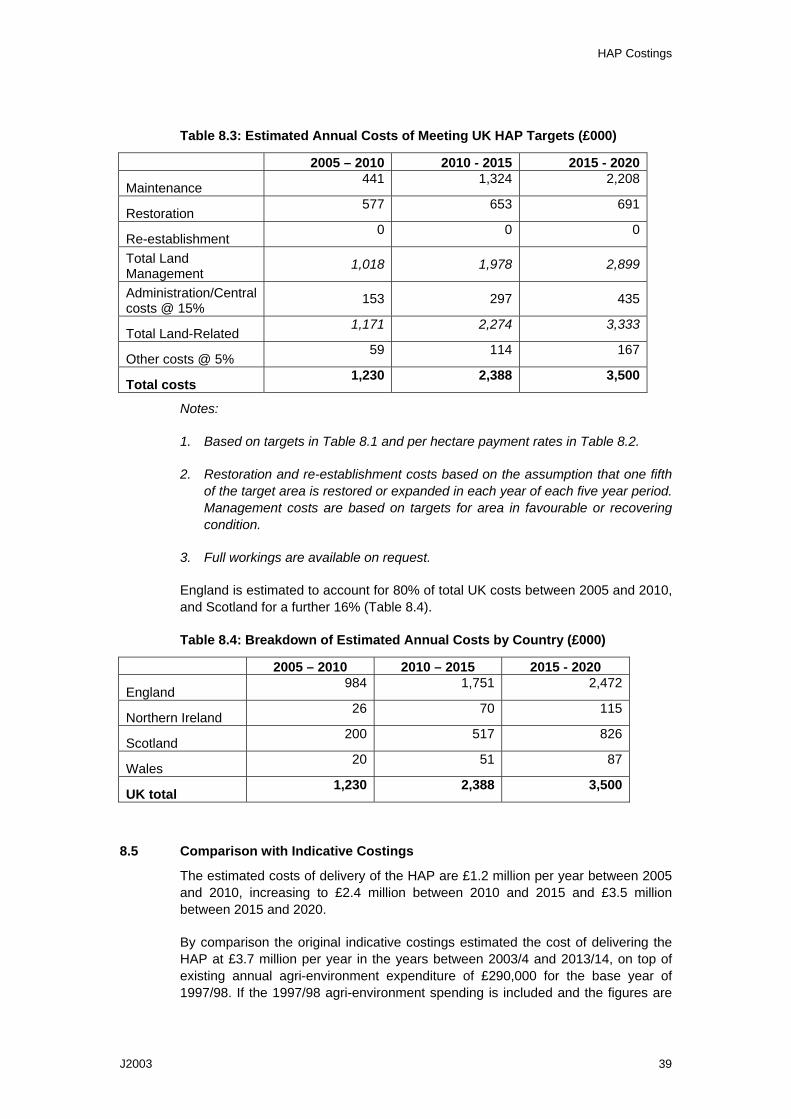
HAP Costings
J2003 39
Table 8.3: Estimated Annual Costs of Meeting UK HAP Targets (£000)
2005 – 2010 2010 - 2015 2015 - 2020
Maintenance 441 1,324 2,208
Restoration 577 653 691
Re-establishment 0 0 0
Total Land Management
1,018 1,978 2,899
Administration/Central costs @ 15%
153 297 435
Total Land-Related 1,171 2,274 3,333
Other costs @ 5% 59 114 167
Total costs 1,230 2,388 3,500
Notes:
1. Based on targets in Table 8.1 and per hectare payment rates in Table 8.2.
2. Restoration and re-establishment costs based on the assumption that one fifth of the target area is restored or expanded in each year of each five year period. Management costs are based on targets for area in favourable or recovering condition.
3. Full workings are available on request.
England is estimated to account for 80% of total UK costs between 2005 and 2010, and Scotland for a further 16% (Table 8.4).
Table 8.4: Breakdown of Estimated Annual Costs by Country (£000)
2005 – 2010 2010 – 2015 2015 - 2020
England 984 1,751 2,472
Northern Ireland 26 70 115
Scotland 200 517 826
Wales 20 51 87
UK total 1,230 2,388 3,500
8.5 Comparison with Indicative Costings
The estimated costs of delivery of the HAP are £1.2 million per year between 2005 and 2010, increasing to £2.4 million between 2010 and 2015 and £3.5 million between 2015 and 2020.
By comparison the original indicative costings estimated the cost of delivering the HAP at £3.7 million per year in the years between 2003/4 and 2013/14, on top of existing annual agri-environment expenditure of £290,000 for the base year of 1997/98. If the 1997/98 agri-environment spending is included and the figures are

HAP Costings
J2003 40
updated to 2005/06 prices, the indicative costings would reach £4.8 million for 2005/06 and £5.3 million in 2009/10.
Current estimates of the costs of delivering this HAP are therefore lower than the earlier indicative costings. The estimated costs are particularly low in the earlier years, since the targets for maintenance of habitat in favourable or recovering condition are geared towards the later years.
8.6 Consultees
The consultants are grateful to the following consultees who provided helpful comments, advice and information:
Roger Meade, English Nature
Peter Jones, CCW
Andrew McBride, SNH
Morag Milne, SNH
Martin Bradley, DoE NI
Joan Daniels, English Nature, Project Manager for the Fenn’s, Whixall & Bettisfield Mosses NNR
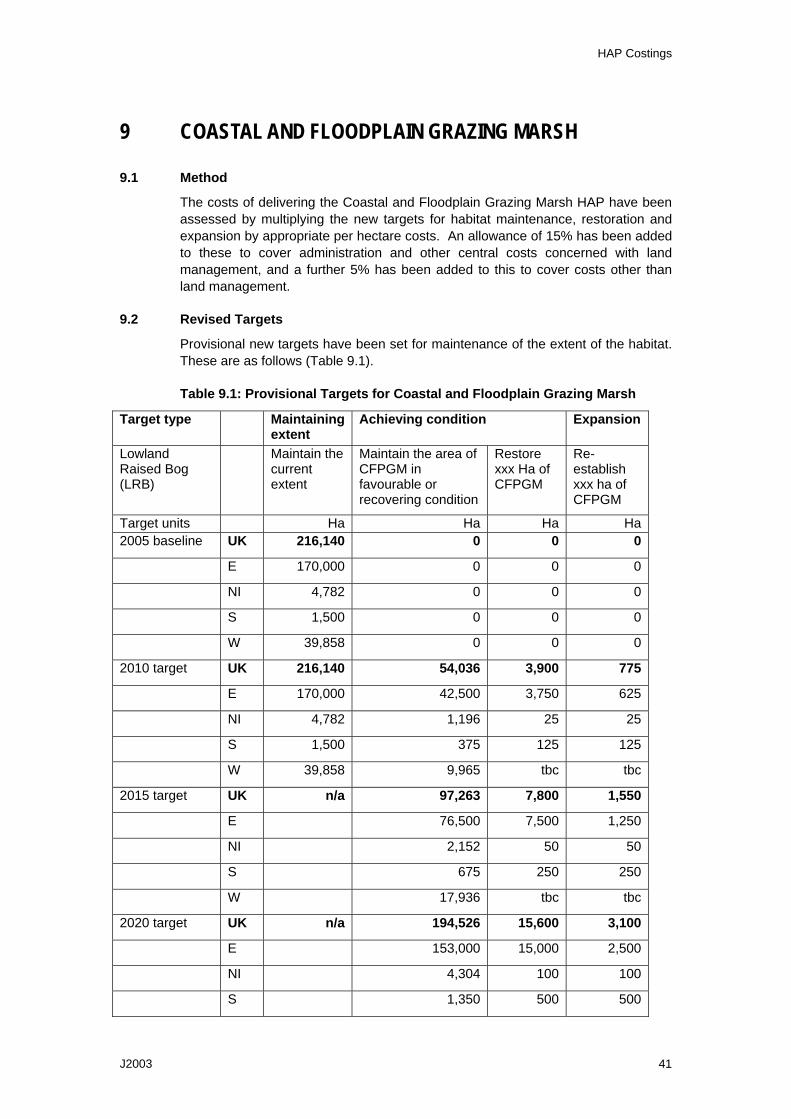
HAP Costings
J2003 41
9 COASTAL AND FLOODPLAIN GRAZING MARSH
9.1 Method
The costs of delivering the Coastal and Floodplain Grazing Marsh HAP have been assessed by multiplying the new targets for habitat maintenance, restoration and expansion by appropriate per hectare costs. An allowance of 15% has been added to these to cover administration and other central costs concerned with land management, and a further 5% has been added to this to cover costs other than land management.
9.2 Revised Targets
Provisional new targets have been set for maintenance of the extent of the habitat. These are as follows (Table 9.1).
Table 9.1: Provisional Targets for Coastal and Floodplain Grazing Marsh
Target type Maintaining extent
Achieving condition Expansion
Lowland Raised Bog (LRB)
Maintain the current extent
Maintain the area of CFPGM in favourable or recovering condition
Restore xxx Ha of CFPGM
Re-establish xxx ha of CFPGM
Target units Ha Ha Ha Ha 2005 baseline UK 216,140 0 0 0
E 170,000 0 0 0
NI 4,782 0 0 0
S 1,500 0 0 0
W 39,858 0 0 0
2010 target UK 216,140 54,036 3,900 775
E 170,000 42,500 3,750 625
NI 4,782 1,196 25 25
S 1,500 375 125 125
W 39,858 9,965 tbc tbc
2015 target UK n/a 97,263 7,800 1,550
E 76,500 7,500 1,250
NI 2,152 50 50
S 675 250 250
W 17,936 tbc tbc
2020 target UK n/a 194,526 15,600 3,100
E 153,000 15,000 2,500
NI 4,304 100 100
S 1,350 500 500
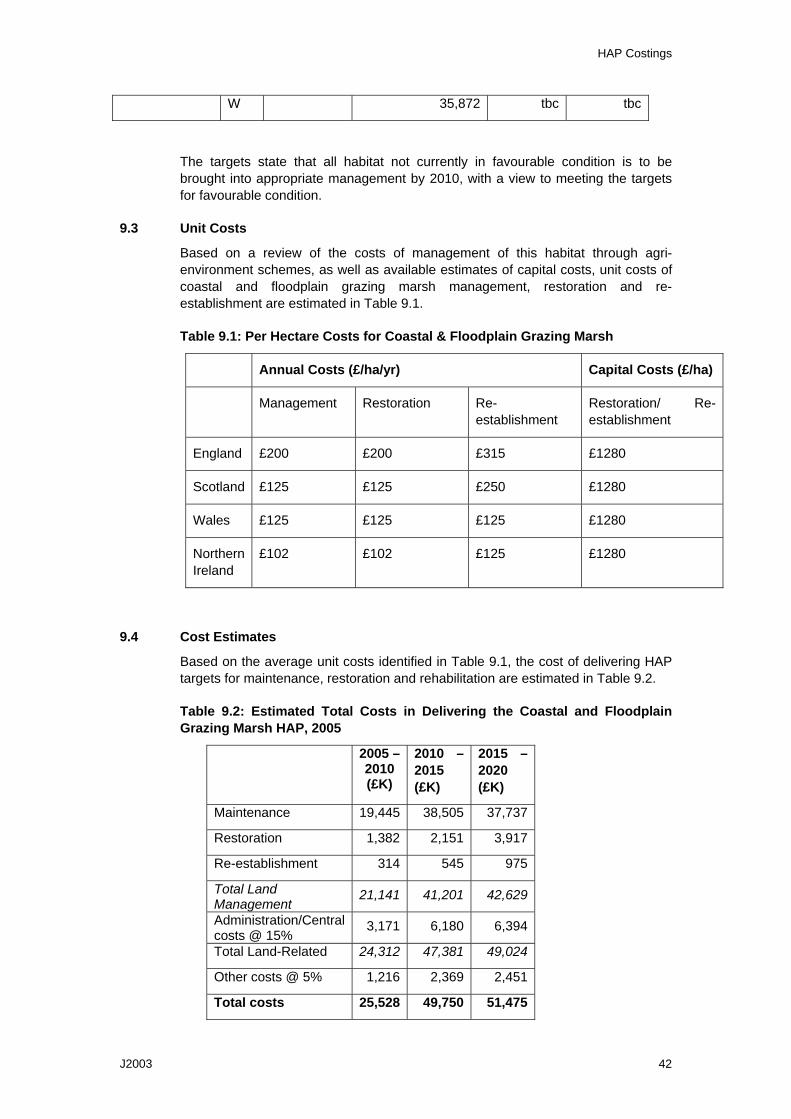
HAP Costings
J2003 42
W 35,872 tbc tbc
The targets state that all habitat not currently in favourable condition is to be brought into appropriate management by 2010, with a view to meeting the targets for favourable condition.
9.3 Unit Costs
Based on a review of the costs of management of this habitat through agri-environment schemes, as well as available estimates of capital costs, unit costs of coastal and floodplain grazing marsh management, restoration and re-establishment are estimated in Table 9.1.
Table 9.1: Per Hectare Costs for Coastal & Floodplain Grazing Marsh
Annual Costs (£/ha/yr) Capital Costs (£/ha)
Management Restoration Re-establishment
Restoration/ Re-establishment
England £200 £200 £315 £1280
Scotland £125 £125 £250 £1280
Wales £125 £125 £125 £1280
Northern Ireland
£102 £102 £125 £1280
9.4 Cost Estimates
Based on the average unit costs identified in Table 9.1, the cost of delivering HAP targets for maintenance, restoration and rehabilitation are estimated in Table 9.2.
Table 9.2: Estimated Total Costs in Delivering the Coastal and Floodplain Grazing Marsh HAP, 2005
2005 – 2010 (£K)
2010 – 2015 (£K)
2015 – 2020 (£K)
Maintenance 19,445 38,505 37,737
Restoration 1,382 2,151 3,917
Re-establishment 314 545 975
Total Land Management
21,141 41,201 42,629
Administration/Central costs @ 15%
3,171 6,180 6,394
Total Land-Related 24,312 47,381 49,024
Other costs @ 5% 1,216 2,369 2,451
Total costs 25,528 49,750 51,475
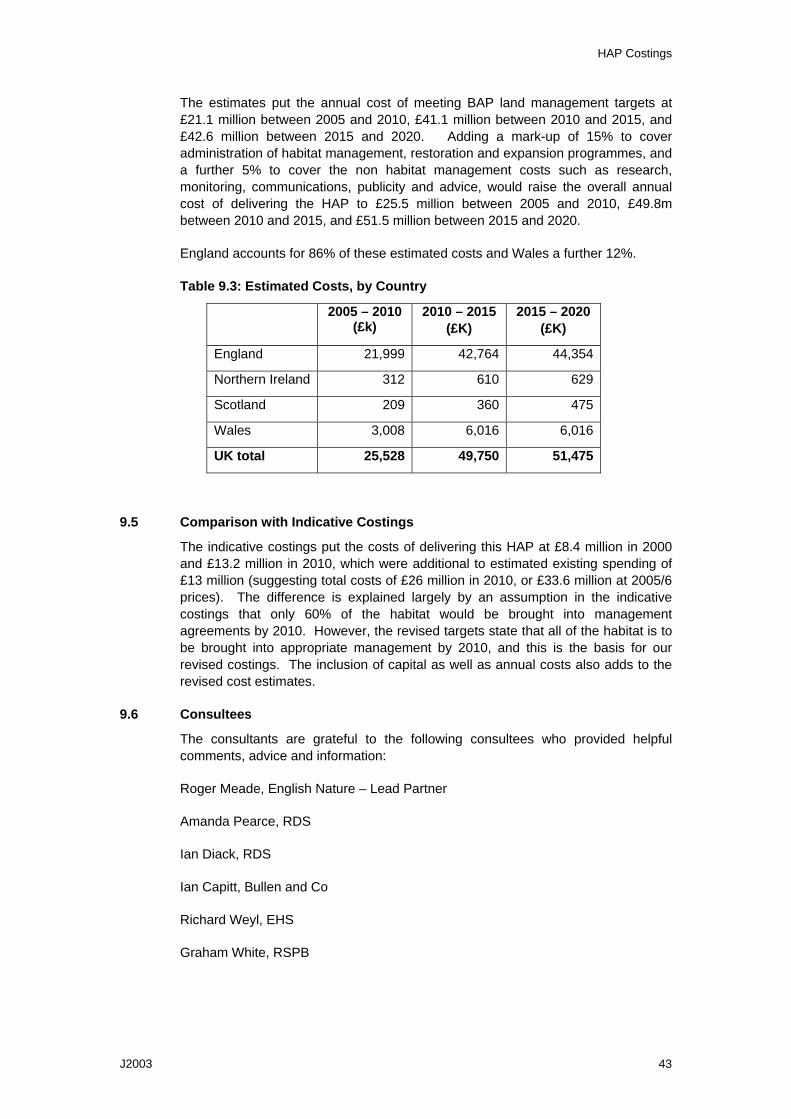
HAP Costings
J2003 43
The estimates put the annual cost of meeting BAP land management targets at £21.1 million between 2005 and 2010, £41.1 million between 2010 and 2015, and £42.6 million between 2015 and 2020. Adding a mark-up of 15% to cover administration of habitat management, restoration and expansion programmes, and a further 5% to cover the non habitat management costs such as research, monitoring, communications, publicity and advice, would raise the overall annual cost of delivering the HAP to £25.5 million between 2005 and 2010, £49.8m between 2010 and 2015, and £51.5 million between 2015 and 2020.
England accounts for 86% of these estimated costs and Wales a further 12%.
Table 9.3: Estimated Costs, by Country
2005 – 2010 (£k)
2010 – 2015 (£K)
2015 – 2020 (£K)
England 21,999 42,764 44,354
Northern Ireland 312 610 629
Scotland 209 360 475
Wales 3,008 6,016 6,016
UK total 25,528 49,750 51,475
9.5 Comparison with Indicative Costings
The indicative costings put the costs of delivering this HAP at £8.4 million in 2000 and £13.2 million in 2010, which were additional to estimated existing spending of £13 million (suggesting total costs of £26 million in 2010, or £33.6 million at 2005/6 prices). The difference is explained largely by an assumption in the indicative costings that only 60% of the habitat would be brought into management agreements by 2010. However, the revised targets state that all of the habitat is to be brought into appropriate management by 2010, and this is the basis for our revised costings. The inclusion of capital as well as annual costs also adds to the revised cost estimates.
9.6 Consultees
The consultants are grateful to the following consultees who provided helpful comments, advice and information:
Roger Meade, English Nature – Lead Partner
Amanda Pearce, RDS
Ian Diack, RDS
Ian Capitt, Bullen and Co
Richard Weyl, EHS
Graham White, RSPB
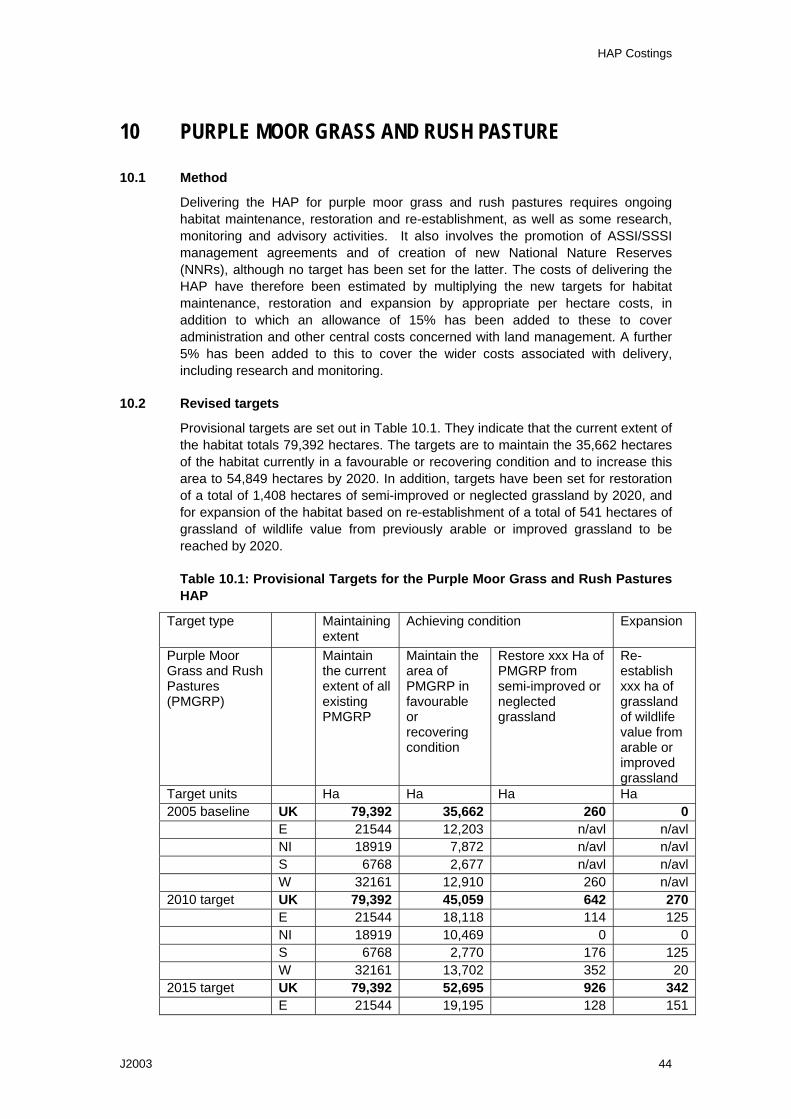
HAP Costings
J2003 44
10 PURPLE MOOR GRASS AND RUSH PASTURE
10.1 Method
Delivering the HAP for purple moor grass and rush pastures requires ongoing habitat maintenance, restoration and re-establishment, as well as some research, monitoring and advisory activities. It also involves the promotion of ASSI/SSSI management agreements and of creation of new National Nature Reserves (NNRs), although no target has been set for the latter. The costs of delivering the HAP have therefore been estimated by multiplying the new targets for habitat maintenance, restoration and expansion by appropriate per hectare costs, in addition to which an allowance of 15% has been added to these to cover administration and other central costs concerned with land management. A further 5% has been added to this to cover the wider costs associated with delivery, including research and monitoring.
10.2 Revised targets
Provisional targets are set out in Table 10.1. They indicate that the current extent of the habitat totals 79,392 hectares. The targets are to maintain the 35,662 hectares of the habitat currently in a favourable or recovering condition and to increase this area to 54,849 hectares by 2020. In addition, targets have been set for restoration of a total of 1,408 hectares of semi-improved or neglected grassland by 2020, and for expansion of the habitat based on re-establishment of a total of 541 hectares of grassland of wildlife value from previously arable or improved grassland to be reached by 2020.
Table 10.1: Provisional Targets for the Purple Moor Grass and Rush Pastures HAP
Target type Maintaining extent
Achieving condition Expansion
Purple Moor Grass and Rush Pastures (PMGRP)
Maintain the current extent of all existing PMGRP
Maintain the area of PMGRP in favourable or recovering condition
Restore xxx Ha of PMGRP from semi-improved or neglected grassland
Re-establish xxx ha of grassland of wildlife value from arable or improved grassland
Target units Ha Ha Ha Ha 2005 baseline UK 79,392 35,662 260 0 E 21544 12,203 n/avl n/avl NI 18919 7,872 n/avl n/avl S 6768 2,677 n/avl n/avl W 32161 12,910 260 n/avl2010 target UK 79,392 45,059 642 270 E 21544 18,118 114 125 NI 18919 10,469 0 0 S 6768 2,770 176 125 W 32161 13,702 352 202015 target UK 79,392 52,695 926 342 E 21544 19,195 128 151

HAP Costings
J2003 45
NI 18919 14,750 0 0 S 6768 3,100 353 151 W 32161 15,650 445 402020 target UK 79,392 59,018 1,408 541 E 21544 19,409 342 304 NI 18919 18,919 0 0 S 6768 3,431 529 178 W 32161 17,259 537 59
10.3 Unit costs
The following unit costs were used to estimate the costs of purple moor grass and rush pasture management, restoration and re-establishment. These are based on available agri-environment payment rates, and a review of the capital costs incurred by restoration and re-establishment projects.
Table 10.2: Unit Costs per Hectare of Purple Moor Grass and Rush Pasture Management, Restoration and Re-establishment
Management Restoration Re-establishment
England £200/ha/yr annual cost
£517 capital costs/ha + £200/ha/yr annual cost
£495 capital costs/ha + £280/ha/yr annual cost
Northern Ireland £160/ha/yr annual cost
£517 capital costs/ha + £160/ha/yr annual cost
£495 capital costs/ha + £160/ha/yr annual cost
Scotland £100/ha/yr annual cost
£517 capital costs/ha + £100/ha/yr annual cost
£495 capital costs/ha + £250 annual cost
Wales £80/ha/year annual cost
£517 capital costs/ha + £120/ha/yr annual cost
£495 capital costs/ha + £160/ha/yr annual cost
The Annex provides a review of the unit costs listed in this table.
10.4 Cost Estimates
Based on the average payment rates identified in Table 10.2, the annual costs of habitat management, restoration and re-establishment required to deliver the revised targets are estimated to total £6.0 million between 2005 and 2010, £7.4 million between 2010 and 2015 and £8.4 million between 2015 and 2020.
The calculations are based on the assumption that restoration of purple moor grass and rush pastures will take 10 years, i.e. following that time the restored number of hectares are included within the area to be maintained, and hence included within management costs. It is assumed that re-establishment takes 20 years.
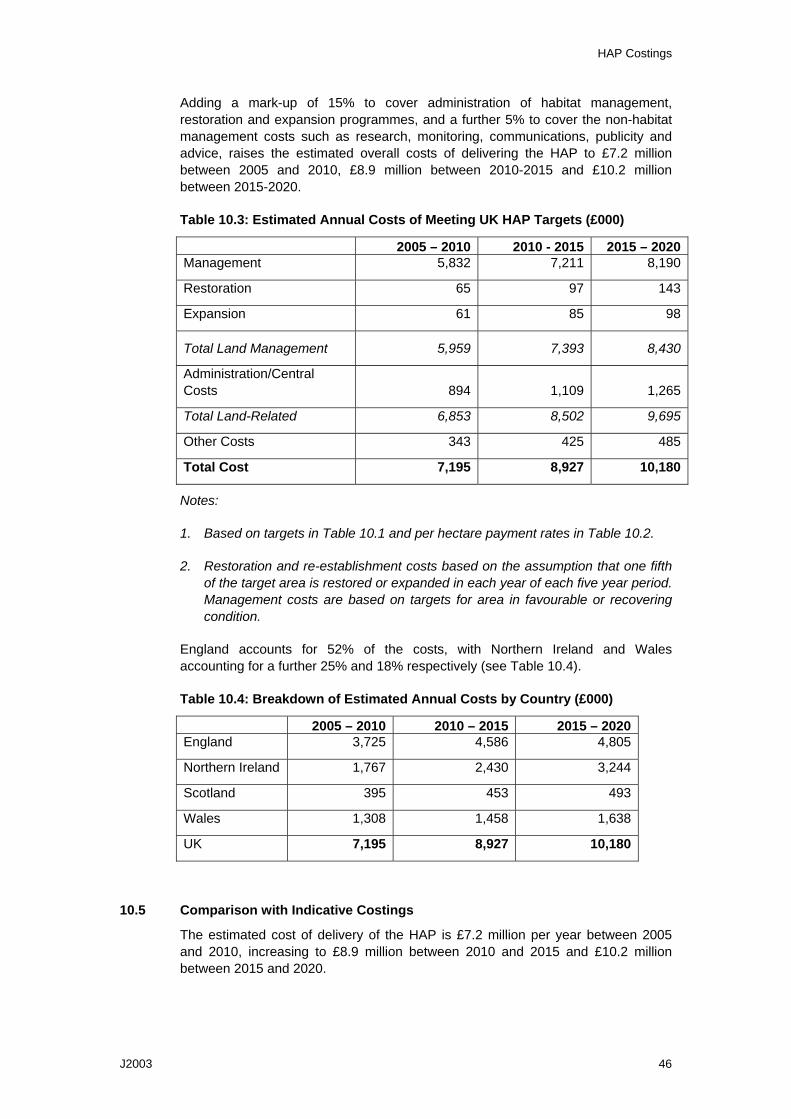
HAP Costings
J2003 46
Adding a mark-up of 15% to cover administration of habitat management, restoration and expansion programmes, and a further 5% to cover the non-habitat management costs such as research, monitoring, communications, publicity and advice, raises the estimated overall costs of delivering the HAP to £7.2 million between 2005 and 2010, £8.9 million between 2010-2015 and £10.2 million between 2015-2020.
Table 10.3: Estimated Annual Costs of Meeting UK HAP Targets (£000)
2005 – 2010 2010 - 2015 2015 – 2020Management 5,832 7,211 8,190
Restoration 65 97 143
Expansion 61 85 98
Total Land Management 5,959 7,393 8,430
Administration/Central Costs 894 1,109 1,265
Total Land-Related 6,853 8,502 9,695
Other Costs 343 425 485
Total Cost 7,195 8,927 10,180
Notes:
1. Based on targets in Table 10.1 and per hectare payment rates in Table 10.2.
2. Restoration and re-establishment costs based on the assumption that one fifth of the target area is restored or expanded in each year of each five year period. Management costs are based on targets for area in favourable or recovering condition.
England accounts for 52% of the costs, with Northern Ireland and Wales accounting for a further 25% and 18% respectively (see Table 10.4).
Table 10.4: Breakdown of Estimated Annual Costs by Country (£000)
2005 – 2010 2010 – 2015 2015 – 2020 England 3,725 4,586 4,805
Northern Ireland 1,767 2,430 3,244
Scotland 395 453 493
Wales 1,308 1,458 1,638
UK 7,195 8,927 10,180
10.5 Comparison with Indicative Costings
The estimated cost of delivery of the HAP is £7.2 million per year between 2005 and 2010, increasing to £8.9 million between 2010 and 2015 and £10.2 million between 2015 and 2020.
HAP Costings
J2003 47
This is significantly more than was suggested by the indicative costings, which estimated the additional cost of delivering the HAP at £240,000 per year in the years between 2000 and 2010, on top of existing annual agri-environment expenditure of £786,000 for 1995. If the 1995 agri-environment spending is included and the figures are updated to 2005/06 prices, the indicative costings would only reach £1.3 million for 2005/06 and £1.5 million in 2009/10.
The main reasons for the difference is the inclusion of capital costs of restoration and re-establishment in the costing of the revised targets (the indicative costings only used annual payment rates), the increase in annual payment rates since the indicative costings were undertaken, and, especially, a significant increase in the area to be grant aided, due to an increase in the target for maintenance in favourable condition and the assumption that delivery of this will require the whole of this area to be included in agri-environment schemes.
10.6 Consultees
The consultants are grateful to the following consultees who provided helpful comments, advice and information:
David Stevens, CCW
Carrie Rimes, CCW
Richard Jefferson, EN
Jane MacKintosh, SNH
Alastair Church, Doeni
Angie Polkie, Denmark Farm, Shared Earth Trust
David Wheeler, Project Manager for Rhos Llaw Cwrt
Gary Pilkington, North Devon Project Manager, Culm Grassland
Alan Bowley, Project Manager, Wicken Farm

HAP Costings
J2003 48
11 LOWLAND CALCAREOUS GRASSLAND
11.1 Method
Delivering the HAP for lowland calcareous grassland primarily requires habitat maintenance, restoration and re-establishment, but also some research and monitoring activities as well as the creation of new National Nature Reserves (NNRs). The costs of delivering the HAP have therefore been estimated by multiplying the new targets for habitat maintenance, restoration and expansion by appropriate per hectare costs, in addition to which an allowance of 15% has been added to cover administration and other central costs concerned with land management. A further 5% has been added to this to cover the wider costs associated with delivery, including research and monitoring.
11.2 Revised targets
Provisional targets are set out in Table 11.1. They indicate that the current extent of the habitat totals 40,594 hectares. The targets are to maintain the 25,450 hectares of the habitat currently in a favourable or recovering condition and to increase this area to 33,934 hectares by 2020. In addition, targets have been set for restoration of a total of 1,176 hectares of semi-improved or neglected grassland by 2020, and for expansion of the habitat based on re-establishment of a total of 8,557 hectares of grassland of wildlife value from previously arable or improved grassland to be reached by 2020.
Table 11.1: Provisional Targets for the Lowland Calcareous Grassland HAP
Target type Maintaining extent
Achieving condition Expansion
Lowland Calcareous grassland (LCG)
Maintain the current extent of all existing LCG
Maintain the area of LCG in favourable or recovering condition
Restore xxx Ha of LCG from semi-improved or neglected grassland
Re-establish xxx ha of grassland of wildlife value from arable or improved grassland
Target units Ha Ha Ha Ha 2005 baseline UK 40,594 25450 10 16 E 38,687 24879 n/avl n/avl S 761 275 n/avl n/avl W 1,146 296 10 162010 target UK 40,594 30421 399 8426 E 38,687 29497 363 8400 S 761 377 23 2 W 1,146 547 13 242015 target UK 40,594 33233 789 8478 E 38,687 32036 726 8426 S 761 415 46 4 W 1,146 782 17 482020 target UK 40,594 33934 1176 8557 E 38,687 32641 1088 8479 S 761 453 68 7 W 1,146 840 20 71
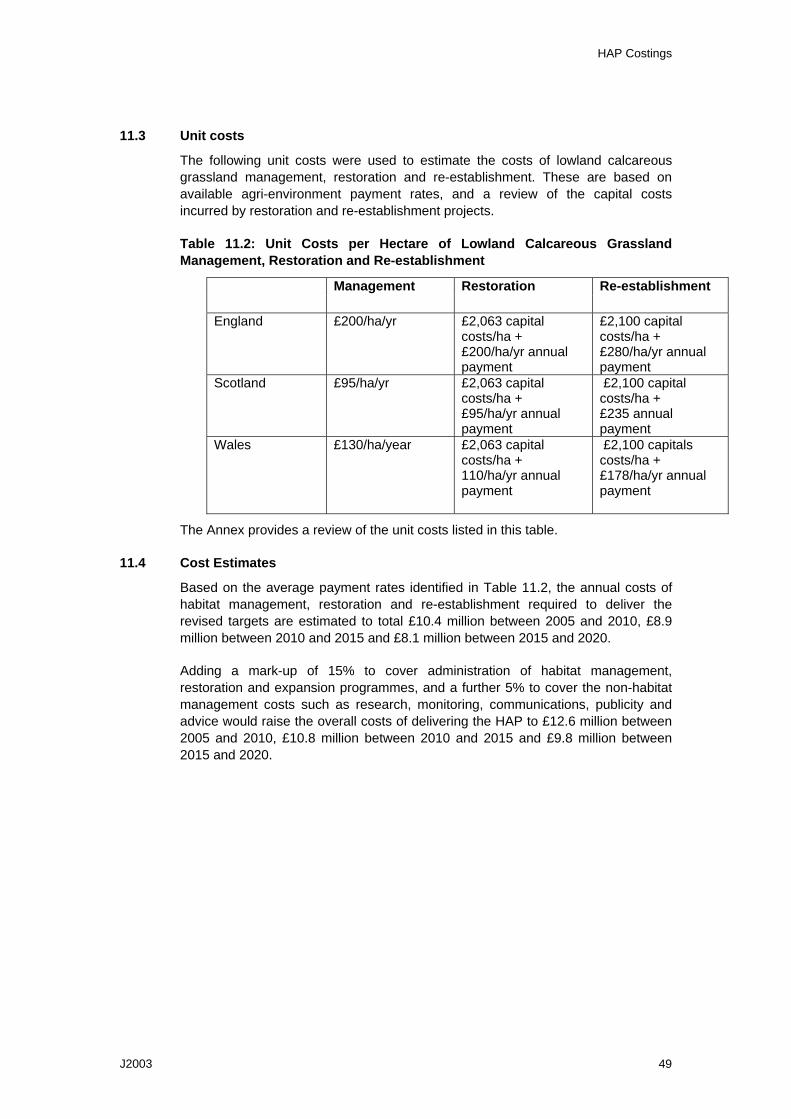
HAP Costings
J2003 49
11.3 Unit costs
The following unit costs were used to estimate the costs of lowland calcareous grassland management, restoration and re-establishment. These are based on available agri-environment payment rates, and a review of the capital costs incurred by restoration and re-establishment projects.
Table 11.2: Unit Costs per Hectare of Lowland Calcareous Grassland Management, Restoration and Re-establishment
Management Restoration Re-establishment
England £200/ha/yr £2,063 capital costs/ha + £200/ha/yr annual payment
£2,100 capital costs/ha + £280/ha/yr annual payment
Scotland £95/ha/yr £2,063 capital costs/ha + £95/ha/yr annual payment
£2,100 capital costs/ha + £235 annual payment
Wales £130/ha/year £2,063 capital costs/ha + 110/ha/yr annual payment
£2,100 capitals costs/ha + £178/ha/yr annual payment
The Annex provides a review of the unit costs listed in this table.
11.4 Cost Estimates
Based on the average payment rates identified in Table 11.2, the annual costs of habitat management, restoration and re-establishment required to deliver the revised targets are estimated to total £10.4 million between 2005 and 2010, £8.9 million between 2010 and 2015 and £8.1 million between 2015 and 2020.
Adding a mark-up of 15% to cover administration of habitat management, restoration and expansion programmes, and a further 5% to cover the non-habitat management costs such as research, monitoring, communications, publicity and advice would raise the overall costs of delivering the HAP to £12.6 million between 2005 and 2010, £10.8 million between 2010 and 2015 and £9.8 million between 2015 and 2020.
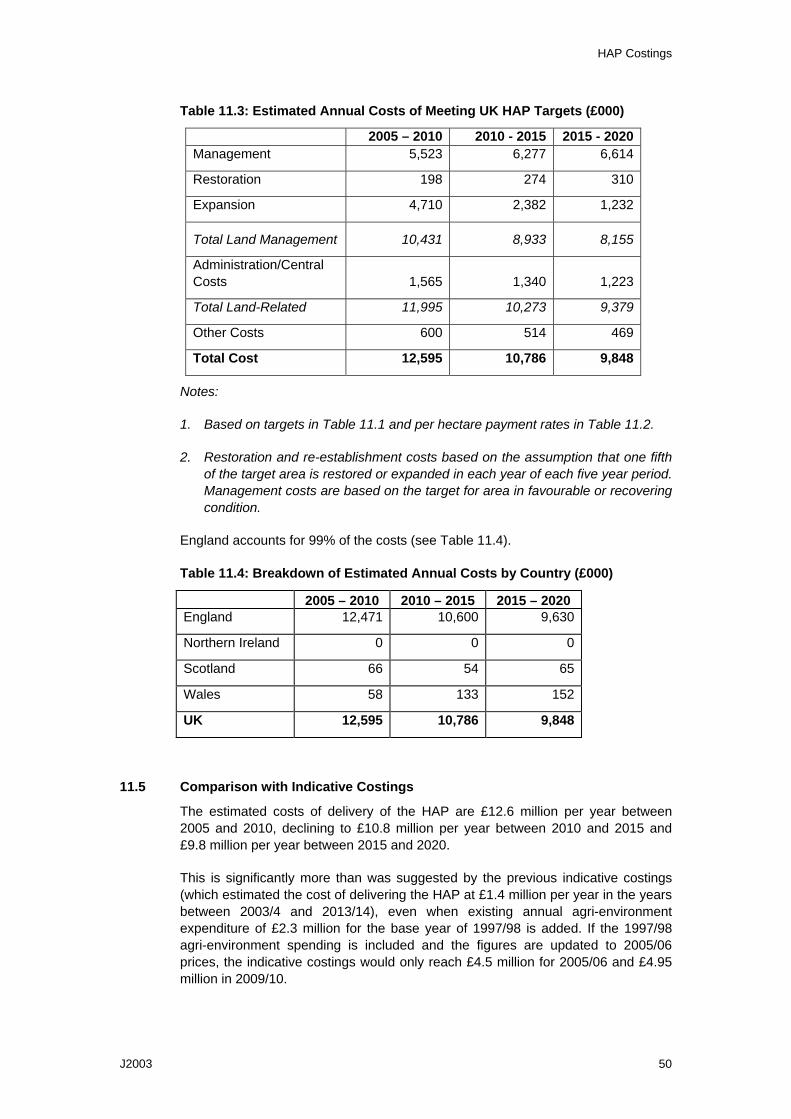
HAP Costings
J2003 50
Table 11.3: Estimated Annual Costs of Meeting UK HAP Targets (£000)
2005 – 2010 2010 - 2015 2015 - 2020 Management 5,523 6,277 6,614
Restoration 198 274 310
Expansion 4,710 2,382 1,232
Total Land Management 10,431 8,933 8,155
Administration/Central Costs 1,565 1,340 1,223
Total Land-Related 11,995 10,273 9,379
Other Costs 600 514 469
Total Cost 12,595 10,786 9,848
Notes:
1. Based on targets in Table 11.1 and per hectare payment rates in Table 11.2.
2. Restoration and re-establishment costs based on the assumption that one fifth of the target area is restored or expanded in each year of each five year period. Management costs are based on the target for area in favourable or recovering condition.
England accounts for 99% of the costs (see Table 11.4).
Table 11.4: Breakdown of Estimated Annual Costs by Country (£000)
2005 – 2010 2010 – 2015 2015 – 2020 England 12,471 10,600 9,630
Northern Ireland 0 0 0
Scotland 66 54 65
Wales 58 133 152
UK 12,595 10,786 9,848
11.5 Comparison with Indicative Costings
The estimated costs of delivery of the HAP are £12.6 million per year between 2005 and 2010, declining to £10.8 million per year between 2010 and 2015 and £9.8 million per year between 2015 and 2020.
This is significantly more than was suggested by the previous indicative costings (which estimated the cost of delivering the HAP at £1.4 million per year in the years between 2003/4 and 2013/14), even when existing annual agri-environment expenditure of £2.3 million for the base year of 1997/98 is added. If the 1997/98 agri-environment spending is included and the figures are updated to 2005/06 prices, the indicative costings would only reach £4.5 million for 2005/06 and £4.95 million in 2009/10.
HAP Costings
J2003 51
The main reasons for the difference is the inclusion of capital costs of restoration and re-establishment in the costing of the revised targets (the indicative costings only used annual payment rates), and the extent of the annual maintenance costs, which have increased as a result of an increase in payment rates and an increase in the extent of the habitat assumed to be under some form of management agreement. On a much smaller scale, the addition of targets for the habitat in Scotland has increased the costings slightly.
1.6 Consultees
The consultants are grateful to the following consultees who provided helpful comments, advice and information:
Richard Jefferson, EN
Clare Pinches, EN
William Du Croz, EN
Dick Lambert, EN
Anne Humble, CCW
Carrie Rimes, CCW
Jane MacKintosh, SNH
Kay Pritchard, SNH
John Hood, Scottish Executive
Richard Brand-Hardy, Defra
Andrew Cooke, RDS
Belinda Gordon, Defra
James Fisher, the Devil’s Dyke Project in Cambridgeshire
Paul Toynton & Rachel Crees, Salisbury Plain LIFE Project
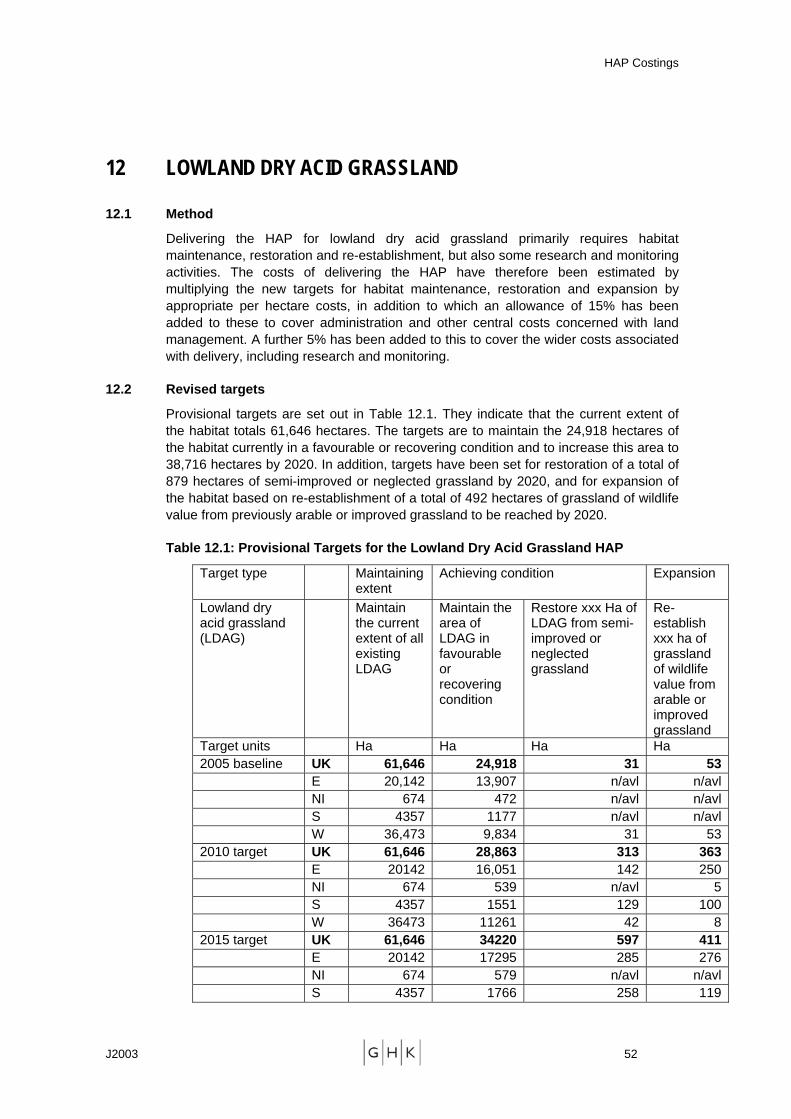
HAP Costings
J2003 52
12 LOWLAND DRY ACID GRASSLAND
12.1 Method
Delivering the HAP for lowland dry acid grassland primarily requires habitat maintenance, restoration and re-establishment, but also some research and monitoring activities. The costs of delivering the HAP have therefore been estimated by multiplying the new targets for habitat maintenance, restoration and expansion by appropriate per hectare costs, in addition to which an allowance of 15% has been added to these to cover administration and other central costs concerned with land management. A further 5% has been added to this to cover the wider costs associated with delivery, including research and monitoring.
12.2 Revised targets
Provisional targets are set out in Table 12.1. They indicate that the current extent of the habitat totals 61,646 hectares. The targets are to maintain the 24,918 hectares of the habitat currently in a favourable or recovering condition and to increase this area to 38,716 hectares by 2020. In addition, targets have been set for restoration of a total of 879 hectares of semi-improved or neglected grassland by 2020, and for expansion of the habitat based on re-establishment of a total of 492 hectares of grassland of wildlife value from previously arable or improved grassland to be reached by 2020.
Table 12.1: Provisional Targets for the Lowland Dry Acid Grassland HAP
Target type Maintaining extent
Achieving condition Expansion
Lowland dry acid grassland (LDAG)
Maintain the current extent of all existing LDAG
Maintain the area of LDAG in favourable or recovering condition
Restore xxx Ha of LDAG from semi-improved or neglected grassland
Re-establish xxx ha of grassland of wildlife value from arable or improved grassland
Target units Ha Ha Ha Ha 2005 baseline UK 61,646 24,918 31 53 E 20,142 13,907 n/avl n/avl NI 674 472 n/avl n/avl S 4357 1177 n/avl n/avl W 36,473 9,834 31 532010 target UK 61,646 28,863 313 363 E 20142 16,051 142 250 NI 674 539 n/avl 5 S 4357 1551 129 100 W 36473 11261 42 82015 target UK 61,646 34220 597 411 E 20142 17295 285 276 NI 674 579 n/avl n/avl S 4357 1766 258 119
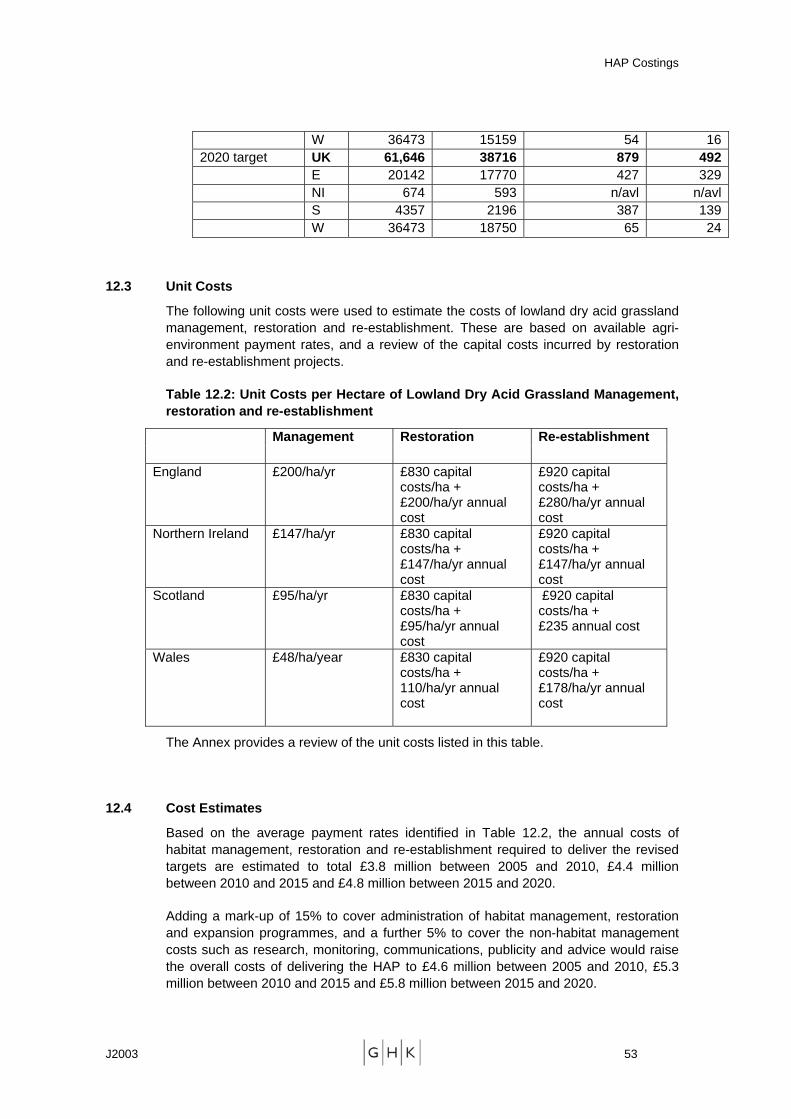
HAP Costings
J2003 53
W 36473 15159 54 162020 target UK 61,646 38716 879 492 E 20142 17770 427 329 NI 674 593 n/avl n/avl S 4357 2196 387 139 W 36473 18750 65 24
12.3 Unit Costs
The following unit costs were used to estimate the costs of lowland dry acid grassland management, restoration and re-establishment. These are based on available agri-environment payment rates, and a review of the capital costs incurred by restoration and re-establishment projects.
Table 12.2: Unit Costs per Hectare of Lowland Dry Acid Grassland Management, restoration and re-establishment
Management Restoration Re-establishment
England £200/ha/yr £830 capital costs/ha + £200/ha/yr annual cost
£920 capital costs/ha + £280/ha/yr annual cost
Northern Ireland £147/ha/yr £830 capital costs/ha + £147/ha/yr annual cost
£920 capital costs/ha + £147/ha/yr annual cost
Scotland £95/ha/yr £830 capital costs/ha + £95/ha/yr annual cost
£920 capital costs/ha + £235 annual cost
Wales £48/ha/year £830 capital costs/ha + 110/ha/yr annual cost
£920 capital costs/ha + £178/ha/yr annual cost
The Annex provides a review of the unit costs listed in this table.
12.4 Cost Estimates
Based on the average payment rates identified in Table 12.2, the annual costs of habitat management, restoration and re-establishment required to deliver the revised targets are estimated to total £3.8 million between 2005 and 2010, £4.4 million between 2010 and 2015 and £4.8 million between 2015 and 2020.
Adding a mark-up of 15% to cover administration of habitat management, restoration and expansion programmes, and a further 5% to cover the non-habitat management costs such as research, monitoring, communications, publicity and advice would raise the overall costs of delivering the HAP to £4.6 million between 2005 and 2010, £5.3 million between 2010 and 2015 and £5.8 million between 2015 and 2020.
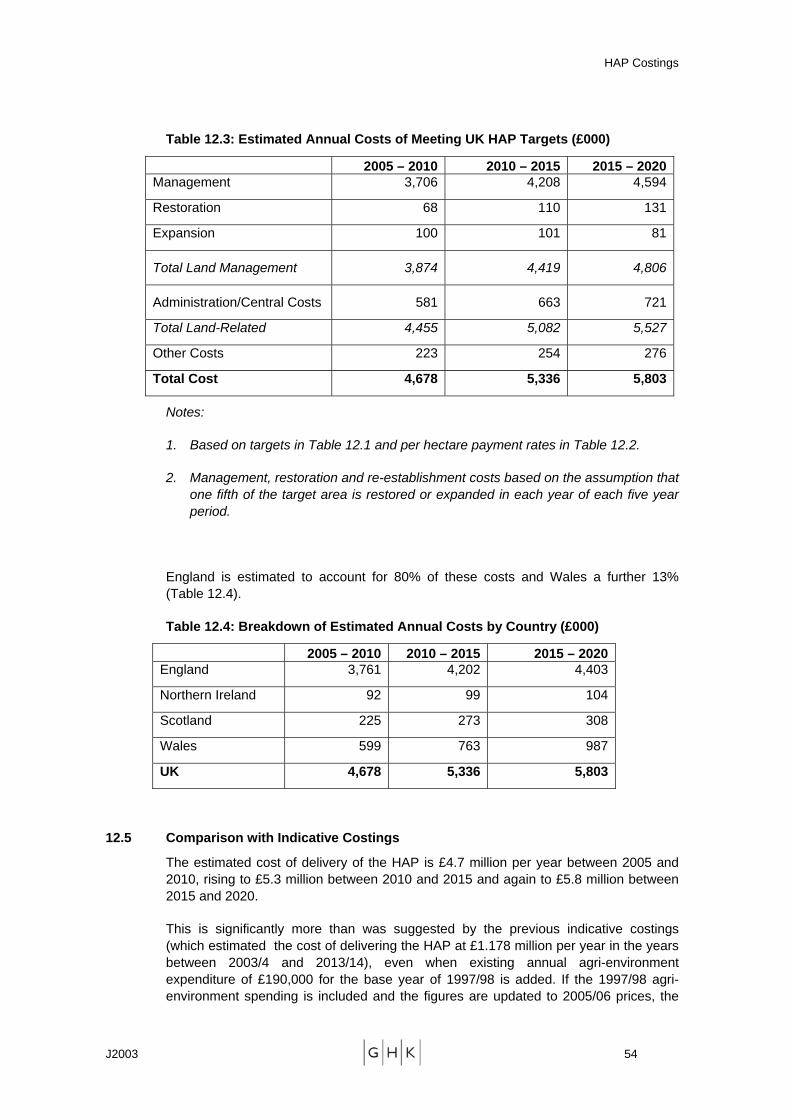
HAP Costings
J2003 54
Table 12.3: Estimated Annual Costs of Meeting UK HAP Targets (£000)
2005 – 2010 2010 – 2015 2015 – 2020Management 3,706 4,208 4,594
Restoration 68 110 131
Expansion 100 101 81
Total Land Management 3,874 4,419 4,806
Administration/Central Costs 581 663 721
Total Land-Related 4,455 5,082 5,527
Other Costs 223 254 276
Total Cost 4,678 5,336 5,803
Notes:
1. Based on targets in Table 12.1 and per hectare payment rates in Table 12.2.
2. Management, restoration and re-establishment costs based on the assumption that one fifth of the target area is restored or expanded in each year of each five year period.
England is estimated to account for 80% of these costs and Wales a further 13% (Table 12.4).
Table 12.4: Breakdown of Estimated Annual Costs by Country (£000)
2005 – 2010 2010 – 2015 2015 – 2020 England 3,761 4,202 4,403
Northern Ireland 92 99 104
Scotland 225 273 308
Wales 599 763 987
UK 4,678 5,336 5,803
12.5 Comparison with Indicative Costings
The estimated cost of delivery of the HAP is £4.7 million per year between 2005 and 2010, rising to £5.3 million between 2010 and 2015 and again to £5.8 million between 2015 and 2020.
This is significantly more than was suggested by the previous indicative costings (which estimated the cost of delivering the HAP at £1.178 million per year in the years between 2003/4 and 2013/14), even when existing annual agri-environment expenditure of £190,000 for the base year of 1997/98 is added. If the 1997/98 agri-environment spending is included and the figures are updated to 2005/06 prices, the
HAP Costings
J2003 55
indicative costings would only reach £1.7 million for 2005/06 and £1.8 million in 2009/10.
The main reasons for the difference are the inclusion of capital costs of restoration and re-establishment in the costing of the revised targets (the indicative costings only used annual payment rates), and the extent of the annual maintenance costs, which appear to have increased as a result either of an increase in payment rates and an increase in the extent of the habitat assumed to require management agreements.
12.6 Consultees
The consultants are grateful to the following consultees who provided helpful comments, advice and information:
Richard Jefferson, EN
Clare Pinches, EN
William Du Croz, EN
Dick Lambert, EN
Anne Humble, CCW
Carrie Rimes, CCW
Jane MacKintosh, SNH
Kay Pritchard, SNH
John Hood, Scottish Executive
Alastair Church, Department of the Environment for Northern Ireland
Gavin McNeill, Department of the Environment for Northern Ireland
Richard Weyl, Department of the Environment for Northern Ireland
Christine Butler, Countryside Management Branch, DARD
Rosalind Dempsey, DARD
Richard Brand-Hardy, Defra
Andrew Cooke, RDS
Belinda Gordon, Defra
Susan Glock, Coversands Tomorrow’s Heathland Heritage Project
Nigel Simes and Mel Kemp, RSPB
Dave Bromwich, Lincolnshire Wildlife Trust
HAP Costings
J2003 56
13 UPLAND CALCAREOUS GRASSLAND
13.1 Method
Delivering the HAP for upland calcareous grassland primarily requires habitat maintenance, restoration and re-establishment, but also some research and monitoring activities. The costs of delivering the HAP have been estimated by multiplying provisional targets for habitat maintenance, restoration and expansion by appropriate per hectare costs, in addition to which an allowance of 15% has been added to cover administration and other central costs concerned with land management. A further 5% has been added to this to cover the wider costs associated with delivery, including research and monitoring.
13.2 Revised targets
Some provisional targets are set out in Table 12.1. As the HAP partners have not yet set targets in most cases, the table is incomplete, and with figures derived from different sources. The English figure for maintaining favourable or recovering condition is for SSSIs only, as no figure is available for non-SSSI land. No targets have yet been set for restoration and re-establishment.
For Northern Ireland, the targets are based on targets set in the Northern Ireland Habitat Action Plan for Calcareous Grassland and information provided by a DoENI representative. In the case of figures for maintaining favourable or recovering condition we assume that 50% of ASSI and 17% of non-ASSI land is already in this condition, that by 2010 100% of ASSI and 46% of non-ASSI land should be, and that by 2015 75% of non-ASSI land should be. The Action Plan does not envisage any restoration to take place, but does include a target for re-establishment.
For Scotland, the extent of the habitat is currently being revised but an estimated figure has been provided by a representative of SNH. No figures are yet available for how much of the habitat is currently in favourable or recovering condition, but the original target of 75% to be in favourable condition by 2005 has been used as the target to aim towards by 2010 onwards. No targets have yet been set for restoration and re-establishment.
For Wales, the targets are based on the 2003 Lead Partner report on the extent of the habitat as well as information provided by a CCW representative. No figure is available for how much of the habitat is currently in a favourable or recovering condition, and no targets have yet been set for this or for restoration and re-establishment. As the targets for maintaining condition, restoring and re-creating upland calcareous grassland are so patchy, it does not make sense to calculate target totals across the different countries at this stage.
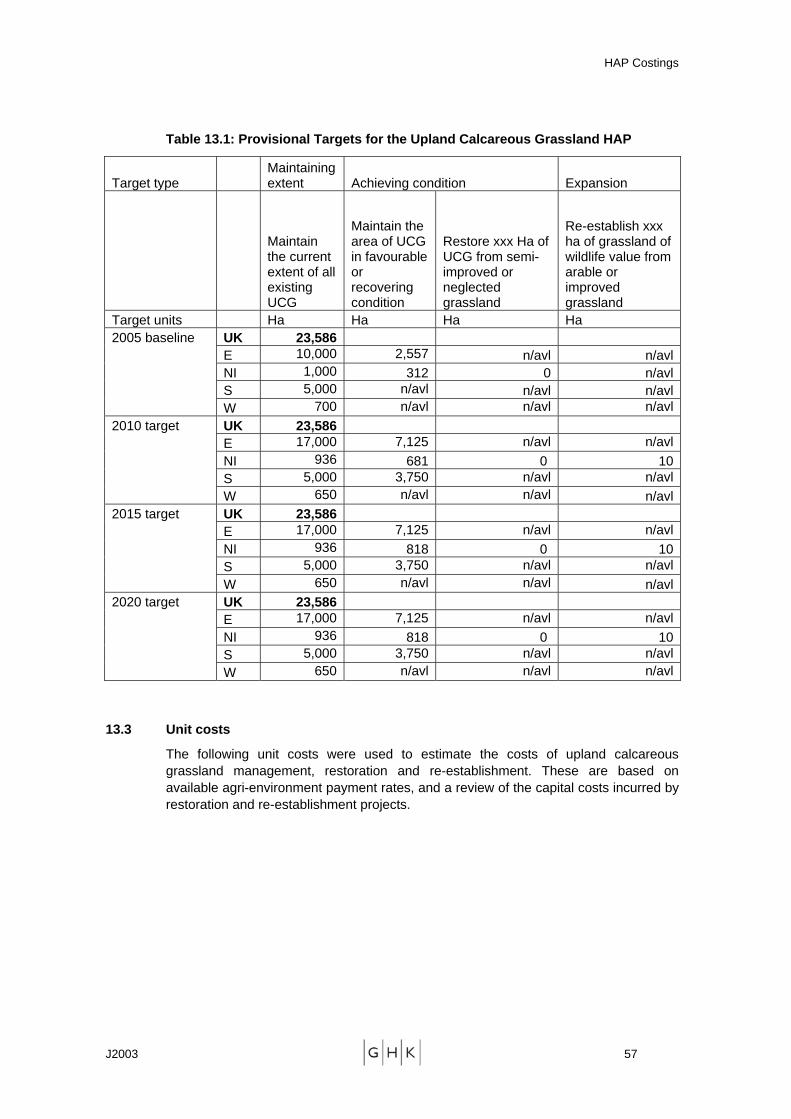
HAP Costings
J2003 57
Table 13.1: Provisional Targets for the Upland Calcareous Grassland HAP
Target type Maintaining extent Achieving condition Expansion
Maintain the current extent of all existing UCG
Maintain the area of UCG in favourable or recovering condition
Restore xxx Ha of UCG from semi-improved or neglected grassland
Re-establish xxx ha of grassland of wildlife value from arable or improved grassland
Target units Ha Ha Ha Ha 2005 baseline UK 23,586 E 10,000 2,557 n/avl n/avl NI 1,000 312 0 n/avl S 5,000 n/avl n/avl n/avl W 700 n/avl n/avl n/avl2010 target UK 23,586 E 17,000 7,125 n/avl n/avl NI 936 681 0 10 S 5,000 3,750 n/avl n/avl W 650 n/avl n/avl n/avl2015 target UK 23,586 E 17,000 7,125 n/avl n/avl NI 936 818 0 10 S 5,000 3,750 n/avl n/avl W 650 n/avl n/avl n/avl2020 target UK 23,586 E 17,000 7,125 n/avl n/avl NI 936 818 0 10 S 5,000 3,750 n/avl n/avl W 650 n/avl n/avl n/avl
13.3 Unit costs
The following unit costs were used to estimate the costs of upland calcareous grassland management, restoration and re-establishment. These are based on available agri-environment payment rates, and a review of the capital costs incurred by restoration and re-establishment projects.

HAP Costings
J2003 58
Table 13.2: Unit Costs per Hectare of Upland Calcareous Grassland Management, Restoration and Re-establishment
Management Restoration Re-establishment
England £200/ha/yr
£311 capital costs/ha + £200/ha/yr annual cost
£311 capital costs/ha + £280/ha/yr annual cost
Northern Ireland £147/ha/yr
£311 capital costs/ha + £147/ha/yr annual cost
£311 capital costs/ha + £147/ha/yr annual cost
Scotland £100/ha/yr
£311 capital costs/ha + £100/ha/yr annual cost
£311 capital costs/ha + £235/ha/yr annual cost
Wales £130/ha/yr
£311 capital costs/ha + £110/ha/yr annual cost
£311 capital costs/ha + £178/ha/yr annual cost
The Annex provides a review of the unit costs listed in this table.
13.4 Cost Estimates
Given the incompleteness of the revised targets we have based our cost estimates on the old targets, using the assumptions made in the original costing exercise.
Based on the average payment rates identified in Table 13.2 and using the old targets, annual costs of habitat management, restoration and re-establishment required to deliver the revised targets are estimated to total £1.2 million between 2005 and 2010, £1.9 million between 2010 and 2015 and £1.9 million between 2015 and 2020.
Adding a mark-up of 15% to cover administration of habitat management, restoration and expansion programmes, and a further 5% to cover the non-habitat management costs such as research, monitoring, communications, publicity and advice, would raise the overall costs of delivering the HAP to £1.4 million between 2005 and 2010, £2.3 million in 2010-2015 and £2.3 million in 2015-2020.
Table 13.3: Estimated Annual Costs of Meeting UK HAP Targets (£000)
2005 – 2010 2010 – 2015 2015 – 2020 Maintenance 1229 1911 1921Restoration 0 0 0Re-establishment 2 1 1Total Land Management 1,231 1,912 1,921Administration/Central costs @ 15% 185 287 288Total Land-Related 1,415 2,199 2,210Other costs @ 5% 71 110 110Total costs 1,486 2,309 2,320
HAP Costings
J2003 59
Notes:
1. Based on targets in Table 13.1 and per hectare payment rates in Table 13.2.
2. Management, restoration and re-establishment costs based on the assumption that one fifth of the target area is restored or expanded in each year of each five year period.
England accounts for 60% of the estimated costs and Scotland a further 30% (Table 13.4).
Table 13.4: Breakdown of Estimated Annual Costs by Country (£000)
2005 – 2010 2010 - 2015 2015 – 2020 England 1,169 1,721 1,721 Northern Ireland 91 135 147 Scotland 226 453 453 Wales 0 0 0 UK total 1,486 2,309 2,320
13.5 Comparison with Indicative Costings
The estimated costs of delivery of the HAP are £1.5 million per year between 2005 and 2010, £2.3 million between 2010 and 2015 and £2.3 million between 2015 and 2020.
This is slightly less than was estimated in the indicative costings, which estimated the extra cost of delivering the HAP at £454,200 per year in the years between 2003/4 and 2013/14, on top of existing annual agri-environment expenditure of £1.637 million for the base year of 1997/98. If the 1997/98 agri-environment spending is included and the figures are updated to 2005/06 prices, the indicative costings would reach £2.5 million in 2005/06 and £2.8 million 2009/10.
13.6 Consultees
The consultants are grateful to the following consultees who provided helpful comments, advice and information:
Barbara Jones, CCW
Alistair Crowle, EN
William Du Croz, EN
Dick Lambert, EN
Anne Humble, CCW
Dave Horsefield & Sally Johnson, SNH
John Hood, Scottish Executive
Martin Bradley, DoE NI

HAP Costings
J2003 60
Richard Brand-Hardy, Defra
Andrew Cooke, RDS
Belinda Gordon, Defra
Louise Williams, Limestone Country Project
Simon Webb, EN
HAP Costings
J2003 61
14 UPLAND HAY MEADOWS
14.1 Method
Delivering the HAP for upland hay meadows requires habitat maintenance, restoration and re-establishment, and some research and monitoring activities. The costs of delivering the HAP have been estimated by multiplying the new targets for habitat maintenance, restoration and expansion by appropriate per hectare costs, in addition to which an allowance of 15% has been added to cover administration and other central costs concerned with land management. A further 5% has been added to this to cover the wider costs associated with delivery, including research and monitoring.
14.2 Revised targets
Provisional targets are set out in Table 14.1. They indicate that the current extent of the habitat totals 897 hectares. The targets are to maintain the 679 hectares of the habitat currently in a favourable or recovering condition and to increase this area to 874 hectares by 2020. In addition, targets have been set for restoration of a total of 75 hectares of semi-improved or neglected grassland by 2020, and for expansion of the habitat based on re-establishment of a total of 77 hectares of grassland of wildlife value from previously arable or improved grassland by 2020.
Table 14.1: Provisional Targets for the Upland Hay Meadow HAP
Target type Maintaining extent Achieving condition Expansion
Upland Hay Meadows (UHM)
Maintain the current extent of all existing UHM
Maintain the area of UHM in favourable or recovering condition
Restore xxx Ha of UHM from semi-improved or neglected grassland
Re-establish xxx ha of grassland of wildlife value from arable or improved grassland
Target units Ha Ha Ha Ha 2005 baseline UK 897 679 0 n/avl E 870 667 n/avl n/avl S 27 12 n/avl n/avl2010 target UK 897 783 25 50 E 870 766 24 46 S 27 17 1 42015 target UK 897 848 51 77 E 870 830 48 72 S 27 18 3 52020 target UK 897 874 75 77 E 870 855 71 72 S 27 19 4 5
HAP Costings
J2003 62
14.3 Unit costs
The following unit costs were used to estimate the costs of upland hay meadow management, restoration and re-establishment. These are based on available agri-environment payment rates, and a review of the capital costs incurred by restoration and re-establishment projects.
Table 14.2: Unit Costs per Hectare of Upland Hay Meadow Management, restoration and re-establishment
Management Restoration Re-establishment
England £200/ha/yr £1,245 capital costs/ha + £200/ha/yr annual cost
£1,705 capital costs/ha + £280/ha/yr annual cost
Scotland £100/ha/yr £1,245 capital costs/ha + £100/ha/yr annual cost
£1,705 capital costs/ha + £235/ha/yr annual cost
The Annex provides a review of the unit costs listed in this table.
14.4 Cost Estimates
Based on the average unit costs identified in Table 14.2, annual costs of habitat management, restoration and re-establishment required to deliver the revised targets are estimated to total £177,000 between 2005 and 2010, £202,000 between 2010 and 2015 and £201,000 between 2015 and 2020.
Adding a mark-up of 15% to cover administration of habitat management, restoration and expansion programmes, and a further 5% to cover the non-habitat management costs such as research, monitoring, communications, publicity and advice, would raise the overall costs of delivering the HAP to £214,000 between 2005 and 2010, £244,000 in 2010-2015 and £242,000 in 2015-2020.
Table 14.3: Estimated Annual Costs of Meeting UK HAP Targets (£000)
2005 – 2010 2010 – 2015 2015 – 2020 Maintenance 145 161 170Restoration 9 14 16Re-establishment 24 27 14Total Land Management 177 202 201Administration/Central costs @ 15% 27 30 30Total Land-Related 204 232 231Other costs @ 5% 10 12 12Total costs 214 244 242
Notes:
1. Based on targets in Table 14.1 and per hectare unit costs in Table 14.2.
HAP Costings
J2003 63
2. Restoration and re-establishment costs are based on the assumption that one fifth of the target increase is implemented each year within the five year period. Management costs are based on targets for area being brought under favourable or recovering condition.
England accounts for 98% of the estimated costs (Table 14.4).
Table 14.4: Breakdown of Estimated Annual Costs by Country (£000)
2005 – 2010 2010 - 2015 2015 – 2020 England 210 239 238 Scotland 4 5 4 UK total 214 244 242
14.5 Comparison with Indicative Costings
The estimated costs of delivery of the HAP are £214,000 per year between 2005 and 2010, £244,000 between 2010 and 2015 and £242,000 between 2015 and 2020.
This is very similar to the estimates made in the indicative costings, which estimated the extra cost of delivering the HAP at £79,400 per year in the years between 2003/4 and 2013/14, on top of existing annual agri-environment expenditure of £108,000 for the base year of 1997/98. If the 1997/98 agri-environment spending is included and the figures are updated to 2005/06 prices, the indicative costings would reach £228,000 in 2005/06 and £247,000 in 2009/10.
Compared with the indicative costings there has been a significant reduction in both countries of the restoration target as well as a reduction in the target for re-establishment in the case of Scotland. This is offset by an increase in estimated management costs.
14.6 Consultees
The consultants are grateful to the following consultees who provided helpful comments, advice and information:
David Martin, RDS
William Du Croz, EN
Dick Lambert, EN
Anne Humble, CCW
Carrie Rimes, CCW
Jane MacKintosh, SNH
John Hood, Scottish Executive
Richard Brand-Hardy, Defra
Andrew Cooke, RDS
HAP Costings
J2003 64
Belinda Gordon, Defra
Wendy Nicholson, Black Bank Meadow’s Project
Tim Thom, Yorkshire Dales National Park
Louise Williams, Limestone Country Project
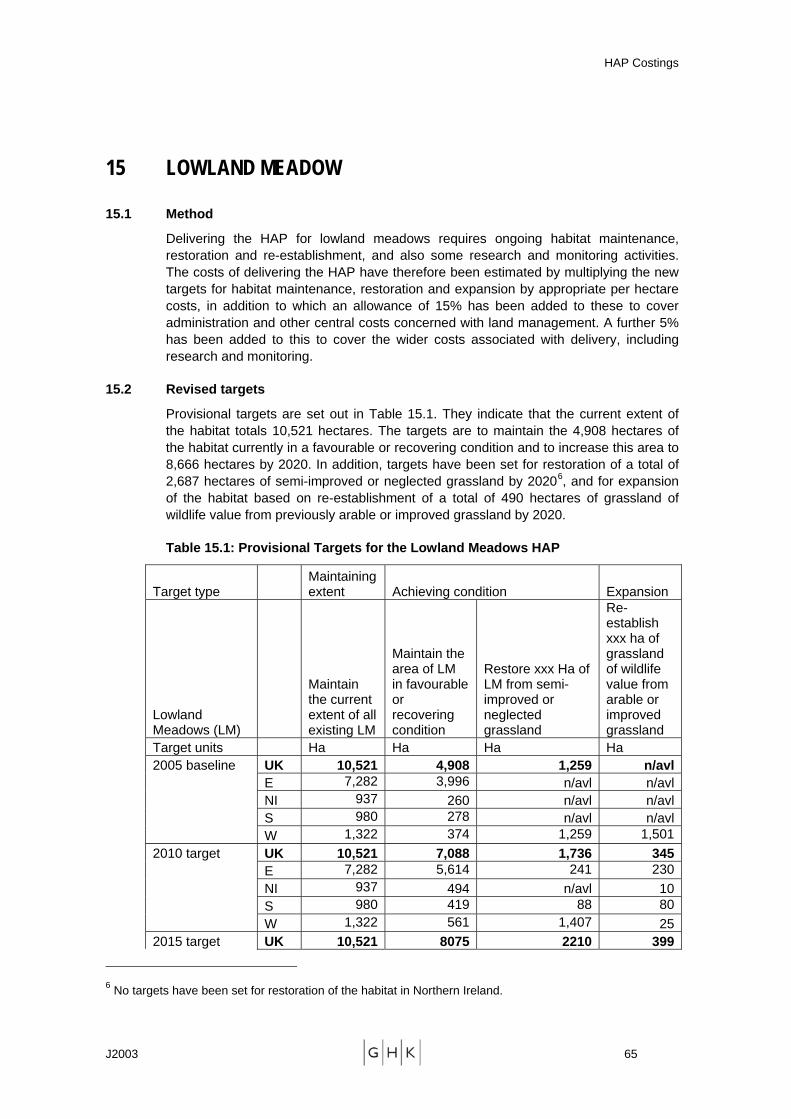
HAP Costings
J2003 65
15 LOWLAND MEADOW
15.1 Method
Delivering the HAP for lowland meadows requires ongoing habitat maintenance, restoration and re-establishment, and also some research and monitoring activities. The costs of delivering the HAP have therefore been estimated by multiplying the new targets for habitat maintenance, restoration and expansion by appropriate per hectare costs, in addition to which an allowance of 15% has been added to these to cover administration and other central costs concerned with land management. A further 5% has been added to this to cover the wider costs associated with delivery, including research and monitoring.
15.2 Revised targets
Provisional targets are set out in Table 15.1. They indicate that the current extent of the habitat totals 10,521 hectares. The targets are to maintain the 4,908 hectares of the habitat currently in a favourable or recovering condition and to increase this area to 8,666 hectares by 2020. In addition, targets have been set for restoration of a total of 2,687 hectares of semi-improved or neglected grassland by 20206, and for expansion of the habitat based on re-establishment of a total of 490 hectares of grassland of wildlife value from previously arable or improved grassland by 2020.
Table 15.1: Provisional Targets for the Lowland Meadows HAP
Target type Maintaining extent Achieving condition Expansion
Lowland Meadows (LM)
Maintain the current extent of all existing LM
Maintain the area of LM in favourable or recovering condition
Restore xxx Ha of LM from semi-improved or neglected grassland
Re-establish xxx ha of grassland of wildlife value from arable or improved grassland
Target units Ha Ha Ha Ha 2005 baseline UK 10,521 4,908 1,259 n/avl E 7,282 3,996 n/avl n/avl NI 937 260 n/avl n/avl S 980 278 n/avl n/avl W 1,322 374 1,259 1,5012010 target UK 10,521 7,088 1,736 345 E 7,282 5,614 241 230 NI 937 494 n/avl 10 S 980 419 88 80 W 1,322 561 1,407 252015 target UK 10,521 8075 2210 399
6 No targets have been set for restoration of the habitat in Northern Ireland.
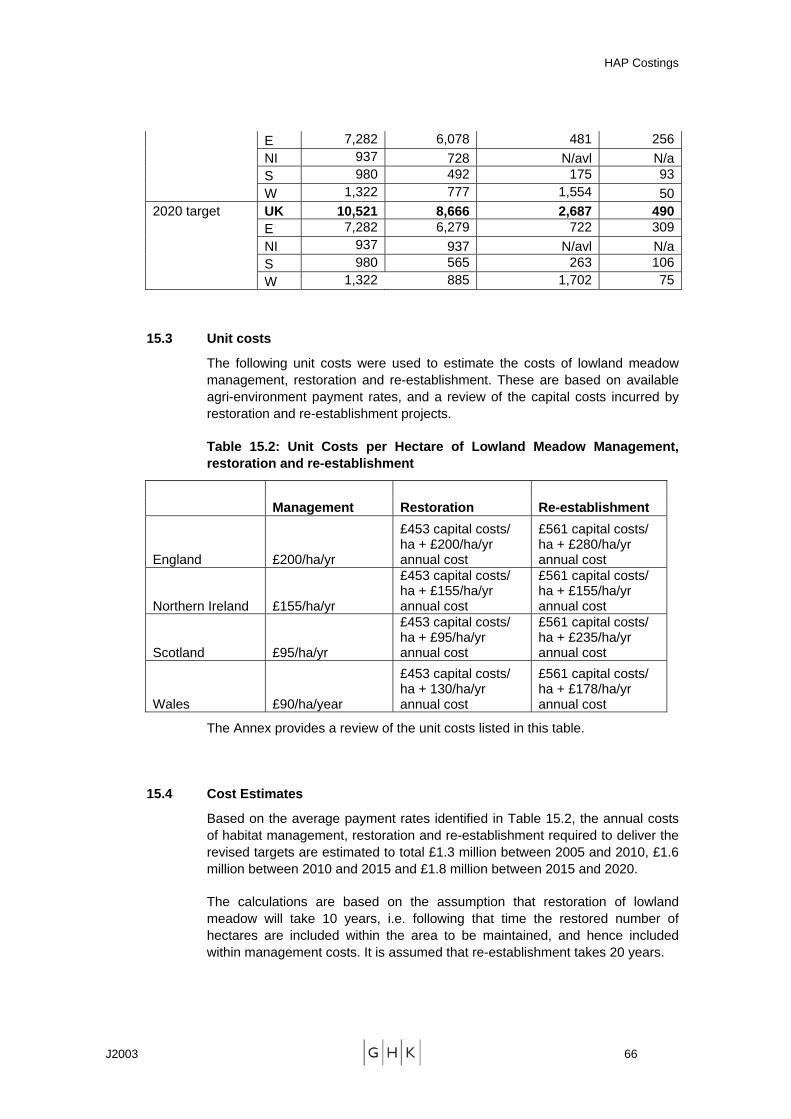
HAP Costings
J2003 66
E 7,282 6,078 481 256 NI 937 728 N/avl N/a S 980 492 175 93 W 1,322 777 1,554 502020 target UK 10,521 8,666 2,687 490 E 7,282 6,279 722 309 NI 937 937 N/avl N/a S 980 565 263 106 W 1,322 885 1,702 75
15.3 Unit costs
The following unit costs were used to estimate the costs of lowland meadow management, restoration and re-establishment. These are based on available agri-environment payment rates, and a review of the capital costs incurred by restoration and re-establishment projects.
Table 15.2: Unit Costs per Hectare of Lowland Meadow Management, restoration and re-establishment
Management Restoration Re-establishment
England £200/ha/yr
£453 capital costs/ ha + £200/ha/yr annual cost
£561 capital costs/ ha + £280/ha/yr annual cost
Northern Ireland £155/ha/yr
£453 capital costs/ ha + £155/ha/yr annual cost
£561 capital costs/ ha + £155/ha/yr annual cost
Scotland £95/ha/yr
£453 capital costs/ ha + £95/ha/yr annual cost
£561 capital costs/ ha + £235/ha/yr annual cost
Wales £90/ha/year
£453 capital costs/ ha + 130/ha/yr annual cost
£561 capital costs/ ha + £178/ha/yr annual cost
The Annex provides a review of the unit costs listed in this table.
15.4 Cost Estimates
Based on the average payment rates identified in Table 15.2, the annual costs of habitat management, restoration and re-establishment required to deliver the revised targets are estimated to total £1.3 million between 2005 and 2010, £1.6 million between 2010 and 2015 and £1.8 million between 2015 and 2020.
The calculations are based on the assumption that restoration of lowland meadow will take 10 years, i.e. following that time the restored number of hectares are included within the area to be maintained, and hence included within management costs. It is assumed that re-establishment takes 20 years.
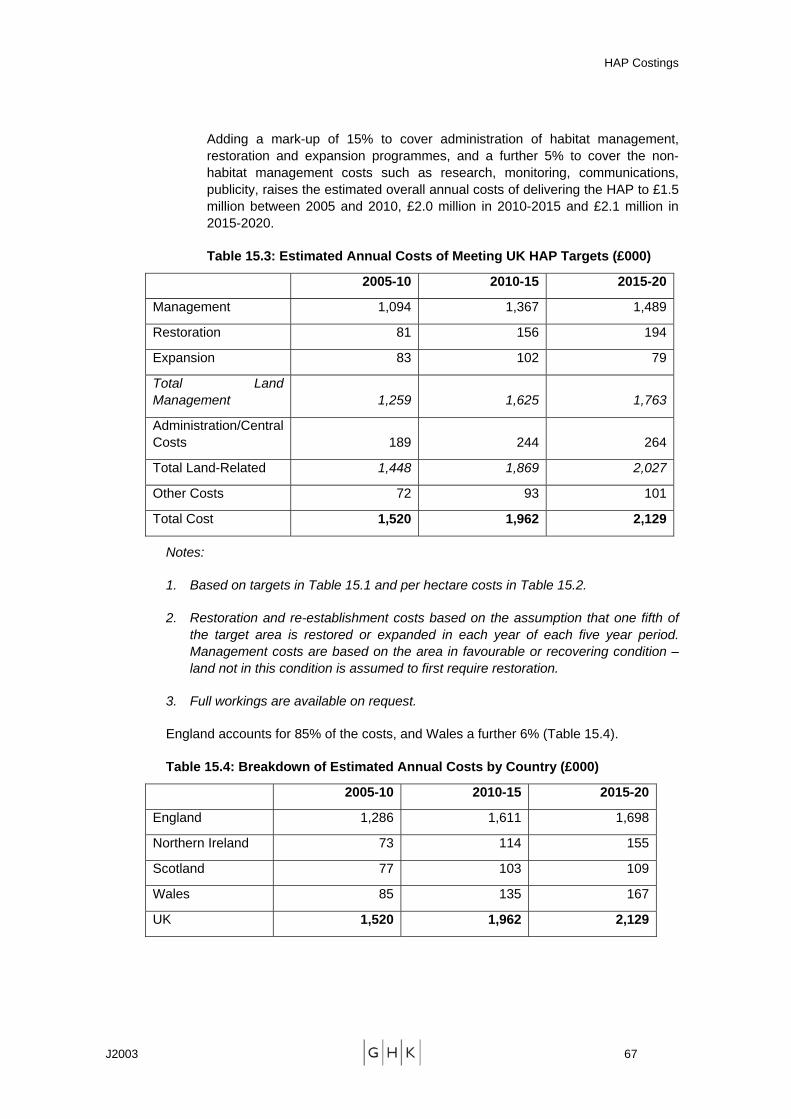
HAP Costings
J2003 67
Adding a mark-up of 15% to cover administration of habitat management, restoration and expansion programmes, and a further 5% to cover the non-habitat management costs such as research, monitoring, communications, publicity, raises the estimated overall annual costs of delivering the HAP to £1.5 million between 2005 and 2010, £2.0 million in 2010-2015 and £2.1 million in 2015-2020.
Table 15.3: Estimated Annual Costs of Meeting UK HAP Targets (£000)
2005-10 2010-15 2015-20
Management 1,094 1,367 1,489
Restoration 81 156 194
Expansion 83 102 79
Total Land Management 1,259 1,625 1,763
Administration/Central Costs 189 244 264
Total Land-Related 1,448 1,869 2,027
Other Costs 72 93 101
Total Cost 1,520 1,962 2,129
Notes:
1. Based on targets in Table 15.1 and per hectare costs in Table 15.2.
2. Restoration and re-establishment costs based on the assumption that one fifth of the target area is restored or expanded in each year of each five year period. Management costs are based on the area in favourable or recovering condition – land not in this condition is assumed to first require restoration.
3. Full workings are available on request.
England accounts for 85% of the costs, and Wales a further 6% (Table 15.4).
Table 15.4: Breakdown of Estimated Annual Costs by Country (£000)
2005-10 2010-15 2015-20
England 1,286 1,611 1,698
Northern Ireland 73 114 155
Scotland 77 103 109
Wales 85 135 167
UK 1,520 1,962 2,129
HAP Costings
J2003 68
15.5 Comparison with Indicative Costings
The estimated cost of delivery of the HAP is £1.5 million per year between 2005 and 2010, rising to £2.0 million between 2010 and 2015 and £2.1 million between 2015 and 2020.
This is less than was suggested by the indicative costings which estimated the costs of delivering the HAP at £655,800 per year in the years between 2003/4 and 2013/14, and £2.4 million when adding existing annual agri-environment expenditure of £1.8 million for the base year of 1997/98. If the 1997/98 agri-environment spending is included and the figures are updated to 2005/06 prices, the indicative costings would have reached £2.8 million for 2005/06 and £3.2 million in 2009/10.
The main reasons for the difference are the reduction in the targets for number of hectares to be maintained in favourable or recovering condition and restored, and the fact that the capital costs of creation were twice as high in the indicative costings as those used in the present costings, because the indicative costings assumed higher re-seeding costs.
15.6 Consultees
The consultants are grateful to the following consultees who provided helpful comments, advice and information:
Tim Blackstock, CCW
Claire Pinches, EN
William Du Croz, EN
Dick Lambert, EN
Anne Humble, CCW
Carrie Rimes, CCW
Jane MacKintosh, SNH
Kay Pritchard, SNH
John Hood, Scottish Executive
Alastair Church, Department of the Environment for Northern Ireland
Gavin McNeill, Department of the Environment for Northern Ireland
Christine Butler, Countryside Management Branch, DARD
Rosalind Dempsey, DARD
Richard Brand-Hardy, Defra
Andrew Cooke, RDS

HAP Costings
J2003 69
Belinda Gordon, Defra
Kerry Lock, the Chimney Meadows Project (BBOWT)
Jim Swanson, The Grazing Animals Project
Dawn Brickwood, The Weald Meadows Initiative
HAP Costings
J2003 70
16 HEDGEROWS
16.1 Method
Delivering the HAP for hedgerows requires habitat maintenance, restoration and re-establishment, as well as some research, monitoring and advisory activities. The costs of delivering the HAP have therefore been estimated by multiplying the new targets for habitat maintenance, restoration and expansion by appropriate unit costs, in addition to which an allowance of 15% has been added to these to cover administration and other central costs concerned with land management. A further 5% has been added to this to cover the wider costs associated with delivery, including research and monitoring.
The HAP has been extended to include not only ancient and species-rich hedgerows as in the previous one, but all hedgerows composed predominantly of native trees and shrubs.
16.2 Revised targets
Revised targets for hedgerows are presented in Table 16.1 below.
In assessing the costs of delivering the HAP, we assume that the figure in Target 4 for achieving favourable condition of 35% of hedgerows by 2010 will also enable achievement of Targets 2, 3, 5 and 67. Not all hedgerows in favourable condition currently benefit from agri-environment payments, with many currently managed favourably at the farmer’s expense. For the purposes of these costings, it is assumed that 50% of hedges currently in favourable condition are in receipt of agri-environment payments, but that all additional hedgerows requiring management, restoration or expansion in order to meet BAP targets receive grant aid. Since no restoration target is available, it is assumed that 5% of the additional area to be brought into favourable condition will need restoration, whereas the remainder will merely need sympathetic management.
Target 7 refers to improving the condition of the hedgerow tree population by increasing the number of young trees. This will incur capital costs through the agri-environment programme. The total number of young trees to be planted is 40,000 by 2010 and 80,000 by 2015, with an estimated 15,780 having been planted by 2005.
7 T2: maintaining overall number of isolated hedgerow trees; T3: maintaining species-richness; T5: reducing unfavourable condition by reducing trimming frequency; and T6: halting further decline in the condition of herbaceous hedgerow flora in Great Britain by 2010 (and improving their condition by 2015).
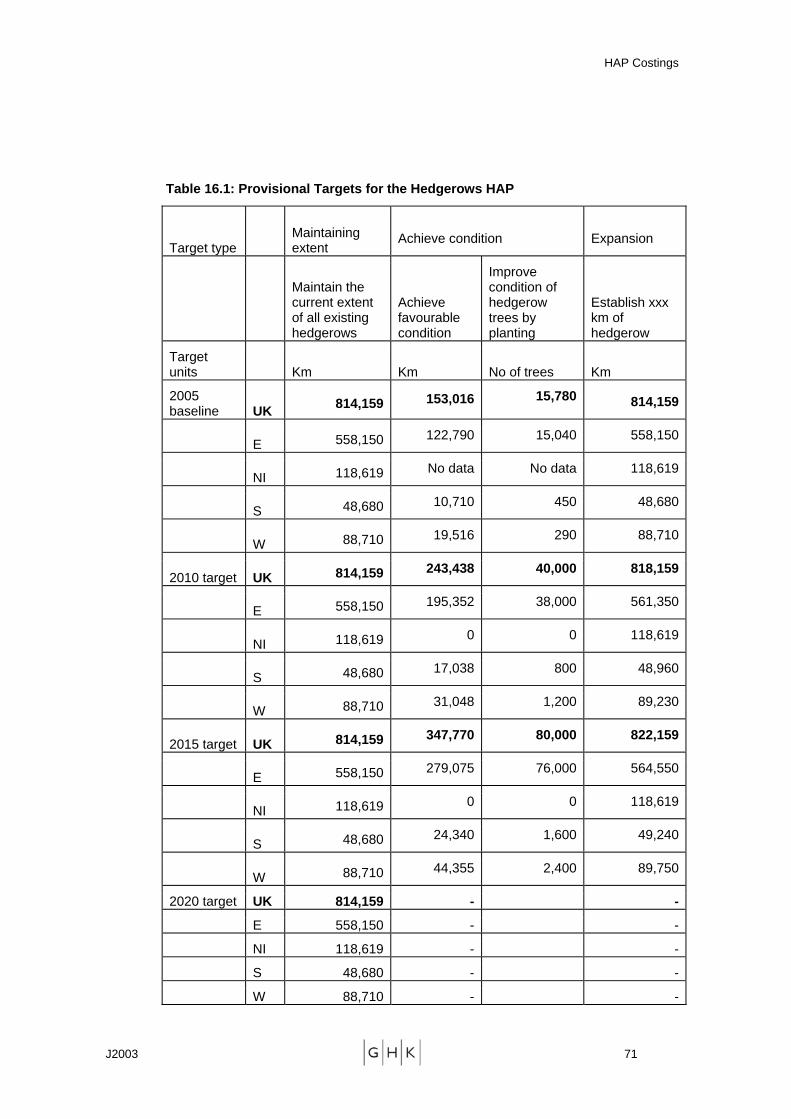
HAP Costings
J2003 71
Table 16.1: Provisional Targets for the Hedgerows HAP
Target type Maintaining extent
Achieve condition Expansion
Maintain the current extent of all existing hedgerows
Achieve favourable condition
Improve condition of hedgerow trees by planting
Establish xxx km of hedgerow
Target units Km Km
No of trees Km
2005 baseline UK 814,159 153,016 15,780 814,159
E 558,150 122,790 15,040 558,150
NI 118,619 No data No data 118,619
S 48,680 10,710 450 48,680
W 88,710 19,516 290 88,710
2010 target UK 814,159 243,438 40,000 818,159
E 558,150 195,352 38,000 561,350
NI 118,619 0 0 118,619
S 48,680 17,038 800 48,960
W 88,710 31,048 1,200 89,230
2015 target UK 814,159 347,770 80,000 822,159
E 558,150 279,075 76,000 564,550
NI 118,619 0 0 118,619
S 48,680 24,340 1,600 49,240
W 88,710 44,355 2,400 89,750
2020 target UK 814,159 - -
E 558,150 - -
NI 118,619 - -
S 48,680 - -
W 88,710 - -

HAP Costings
J2003 72
16.3 Unit costs
The following unit costs were used to estimate the costs of hedgerow management, restoration and re-establishment. These are based on available agri-environment payment rates and uptake figures for different annual and capital works payments.
Table 16.2: Unit Costs per Hectare of Hedgerow Management, Restoration and Re-establishment
Management Restoration Expansion
England £4.50 capital payment per new planted tree + £0.20/m/yr annual cost
£8 capital cost/m £5.30 capital cost/m + £0.20/m/yr annual cost
Northern Ireland £3 capital payment per new planted tree + £0.21/m/yr annual cost
£6 capital cost/m
£3.30 capital cost/m + £0.21/m/yr annual cost
Scotland £5 capital payment per new planted tree + £0.42/m/yr annual cost
£6 capital cost/m £5.50 capital cost/m + £0.42/m/yr annual cost
Wales £3.40 capital payment per new planted tree + £0.21/m/yr annual cost
£4.24 capital cost/m £2.26 capital cost/m + £0.21/m/yr annual cost
The Annex provides a review of the unit costs listed in this table.
16.4 Cost Estimates
Based on the unit costs identified in Table 16.2, the annual costs of habitat management, restoration and expansion required to deliver the revised targets are estimated to total £36.9 million between 2005 and 2010, £59.9 million between 2010 and 2015 and £60.0 million between 2015 and 2020.
Adding a mark-up of 15% to cover administration of habitat management, restoration and expansion programmes, and a further 5% to cover the non-habitat management costs such as research, monitoring, communications, publicity and advice, would raise the overall costs of delivering the HAP to £44.6 million between 2005 and 2010, £72.2 million between 2010 and 2015 and £72.5 million between 2015 and 2020.
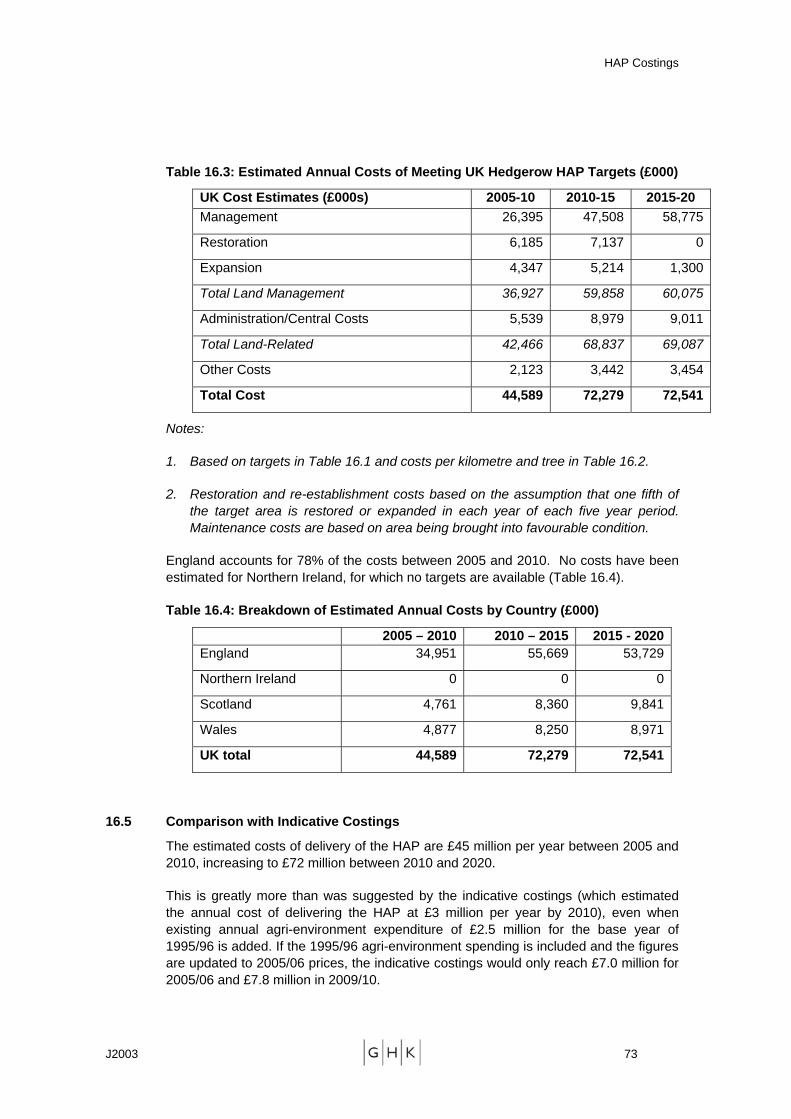
HAP Costings
J2003 73
Table 16.3: Estimated Annual Costs of Meeting UK Hedgerow HAP Targets (£000)
UK Cost Estimates (£000s) 2005-10 2010-15 2015-20 Management 26,395 47,508 58,775
Restoration 6,185 7,137 0
Expansion 4,347 5,214 1,300
Total Land Management 36,927 59,858 60,075
Administration/Central Costs 5,539 8,979 9,011
Total Land-Related 42,466 68,837 69,087
Other Costs 2,123 3,442 3,454
Total Cost 44,589 72,279 72,541
Notes:
1. Based on targets in Table 16.1 and costs per kilometre and tree in Table 16.2.
2. Restoration and re-establishment costs based on the assumption that one fifth of the target area is restored or expanded in each year of each five year period. Maintenance costs are based on area being brought into favourable condition.
England accounts for 78% of the costs between 2005 and 2010. No costs have been estimated for Northern Ireland, for which no targets are available (Table 16.4).
Table 16.4: Breakdown of Estimated Annual Costs by Country (£000)
2005 – 2010 2010 – 2015 2015 - 2020England 34,951 55,669 53,729
Northern Ireland 0 0 0
Scotland 4,761 8,360 9,841
Wales 4,877 8,250 8,971
UK total 44,589 72,279 72,541
16.5 Comparison with Indicative Costings
The estimated costs of delivery of the HAP are £45 million per year between 2005 and 2010, increasing to £72 million between 2010 and 2020.
This is greatly more than was suggested by the indicative costings (which estimated the annual cost of delivering the HAP at £3 million per year by 2010), even when existing annual agri-environment expenditure of £2.5 million for the base year of 1995/96 is added. If the 1995/96 agri-environment spending is included and the figures are updated to 2005/06 prices, the indicative costings would only reach £7.0 million for 2005/06 and £7.8 million in 2009/10.
HAP Costings
J2003 74
The main reason for this large difference is that the new targets apply to all hedgerows and not just ancient and species-rich hedgerows, greatly increasing the estimated costs. It is important to note, however, that, while not previously part of the BAP, non-ancient and non-species rich hedgerows have still been funded by the agri-environment programme, so that the increased estimate of BAP costs does not necessarily imply the need for additional government expenditure. Other reasons for the increased cost estimates are that the previous indicative costings do not appear to include restoration costs, and that no target was set in the original HAP for expansion.
16.6 Consultees
The consultants are grateful to the following consultees who provided helpful comments, advice and information:
Ann Davies, Defra
Tim Boulding, Defra
Emily Ledder, RDS
Heather Robertson, English Nature
Rick Stuart, Centre of Ecology and Hydrology
Terence Henry, Doeni
Rosalind Dempsey & Jill Sefton, DARD
Jane MacKintosh, SNH
Clare Burrows, CCW
Sarah Hetherington, CCW

HAP Costings
J2003 75
17 ARABLE FIELD MARGINS
17.1 Method
Delivering the HAP for arable field margins requires ongoing habitat maintenance and expansion, but also some research, monitoring and advisory activities. The costs of delivering the HAP have therefore been estimated by multiplying the new targets for habitat maintenance and expansion by appropriate per hectare costs, in addition to which an allowance of 15% has been added to these to cover administration and other central costs concerned with land management. A further 5% has been added to this to cover the wider costs associated with delivery, including research and monitoring.
The HAP has been extended from cereal to arable field margins.
17.2 Revised targets
A number of targets have been set for achieving condition through favourable management of different types of field margin as well as for expansion of such margins. For the purpose of displaying the targets in Table 17.1 below the different types of margins have been grouped together under the maintenance and expansion heading. Targets have only been set up to 2015, but for the purpose of costing the HAP up until 2020 we have continued the 2015 values to that year.
No baseline figures are available for extent of the habitat or the proportion currently in favourable or recovering condition. However, the area in favourable condition is targeted to increase to 44,621 hectares by 2020, with the total extent of arable field margins increasing to 83,056 hectares by 2015.
Table 17.1: Provisional Targets for the Arable Field Margins HAP
Target type Maintaining extent
Achieving condition
Expansion
Arable field margins
Maintain the current extent of all existing arable field margins
Achieve favourable condition
Establish xxx Ha of arable field margin
Target units Ha Ha Ha 2005 baseline UK 44,361 0 44,361 E 37,682 0 37,682 NI 684 0 684 S 4,200 0 4,200 W 1,795 0 1,795 2010 target UK 76,206 27,686 76,206 E 65,178 23,589 65,178 NI 1,368 317 1,368 S 5,000 1,750 5,000 W 4,660 2,030 4,660 2015 target UK 83,056 44,621 83,056
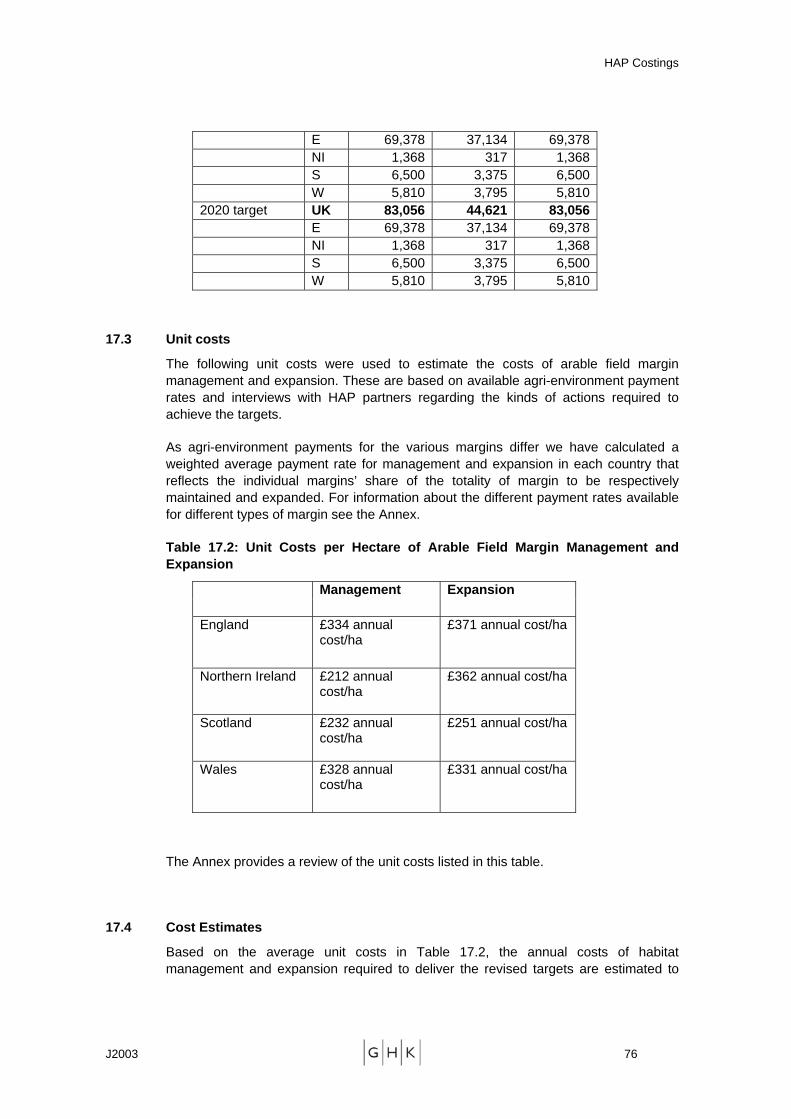
HAP Costings
J2003 76
E 69,378 37,134 69,378 NI 1,368 317 1,368 S 6,500 3,375 6,500 W 5,810 3,795 5,810 2020 target UK 83,056 44,621 83,056 E 69,378 37,134 69,378 NI 1,368 317 1,368 S 6,500 3,375 6,500 W 5,810 3,795 5,810
17.3 Unit costs
The following unit costs were used to estimate the costs of arable field margin management and expansion. These are based on available agri-environment payment rates and interviews with HAP partners regarding the kinds of actions required to achieve the targets.
As agri-environment payments for the various margins differ we have calculated a weighted average payment rate for management and expansion in each country that reflects the individual margins’ share of the totality of margin to be respectively maintained and expanded. For information about the different payment rates available for different types of margin see the Annex.
Table 17.2: Unit Costs per Hectare of Arable Field Margin Management and Expansion
Management Expansion
England £334 annual cost/ha
£371 annual cost/ha
Northern Ireland £212 annual cost/ha
£362 annual cost/ha
Scotland £232 annual cost/ha
£251 annual cost/ha
Wales £328 annual cost/ha
£331 annual cost/ha
The Annex provides a review of the unit costs listed in this table.
17.4 Cost Estimates
Based on the average unit costs in Table 17.2, the annual costs of habitat management and expansion required to deliver the revised targets are estimated to
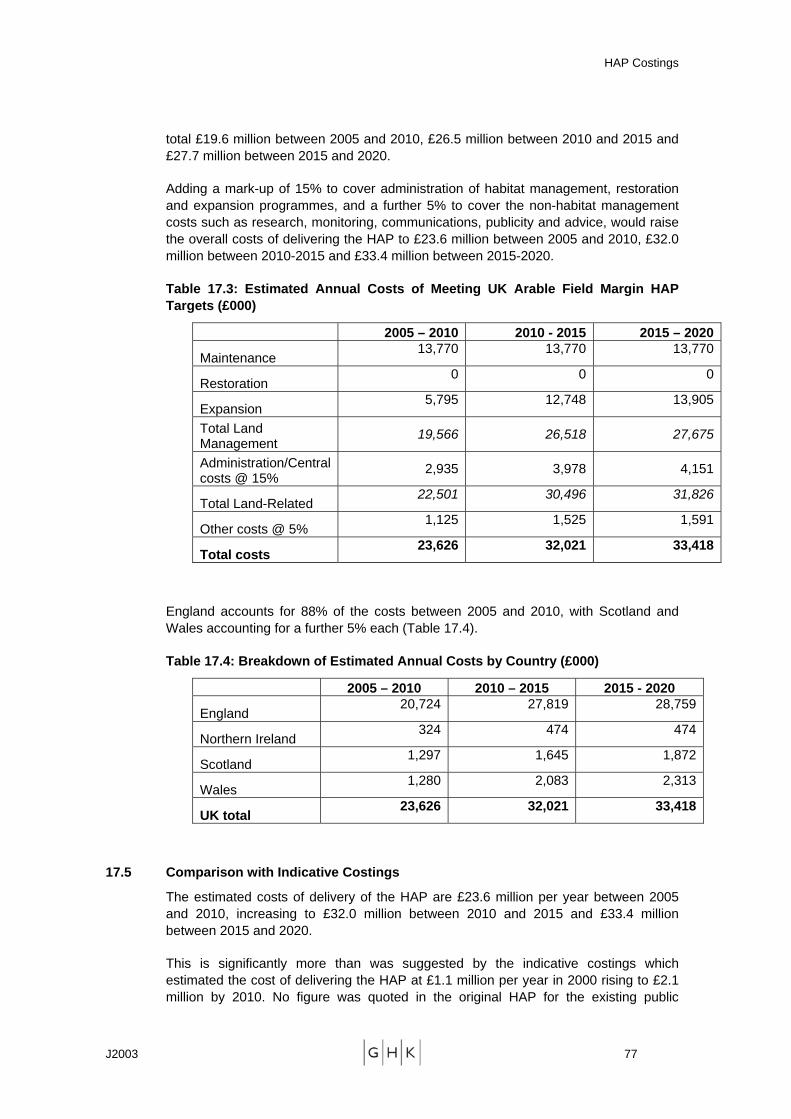
HAP Costings
J2003 77
total £19.6 million between 2005 and 2010, £26.5 million between 2010 and 2015 and £27.7 million between 2015 and 2020.
Adding a mark-up of 15% to cover administration of habitat management, restoration and expansion programmes, and a further 5% to cover the non-habitat management costs such as research, monitoring, communications, publicity and advice, would raise the overall costs of delivering the HAP to £23.6 million between 2005 and 2010, £32.0 million between 2010-2015 and £33.4 million between 2015-2020.
Table 17.3: Estimated Annual Costs of Meeting UK Arable Field Margin HAP Targets (£000)
2005 – 2010 2010 - 2015 2015 – 2020
Maintenance 13,770 13,770 13,770
Restoration 0 0 0
Expansion 5,795 12,748 13,905
Total Land Management
19,566 26,518 27,675
Administration/Central costs @ 15%
2,935 3,978 4,151
Total Land-Related 22,501 30,496 31,826
Other costs @ 5% 1,125 1,525 1,591
Total costs 23,626 32,021 33,418
England accounts for 88% of the costs between 2005 and 2010, with Scotland and Wales accounting for a further 5% each (Table 17.4).
Table 17.4: Breakdown of Estimated Annual Costs by Country (£000)
2005 – 2010 2010 – 2015 2015 - 2020
England 20,724 27,819 28,759
Northern Ireland 324 474 474
Scotland 1,297 1,645 1,872
Wales 1,280 2,083 2,313
UK total 23,626 32,021 33,418
17.5 Comparison with Indicative Costings
The estimated costs of delivery of the HAP are £23.6 million per year between 2005 and 2010, increasing to £32.0 million between 2010 and 2015 and £33.4 million between 2015 and 2020.
This is significantly more than was suggested by the indicative costings which estimated the cost of delivering the HAP at £1.1 million per year in 2000 rising to £2.1 million by 2010. No figure was quoted in the original HAP for the existing public

HAP Costings
J2003 78
expenditure commitments to the habitat in 1995, so it is hard to get a true picture of the cost difference. However, if the indicative costs are updated to 2005/06 prices, they would only reach £1.3 million in 2005/06 and £2.8 million in 2009/10.
The main reasons for the difference are the extension of the HAP from covering merely cereal to arable field margins, an increase in the number of hectares to be maintained, and the addition of targets for expansion of various types of margin. As no information was provided in the original HAP for the generic costs used when calculating the indicative costs we cannot assess the extent of any change in per hectare costs, but the increase in agri-environment payment rates since 1995 is likely to have increased the costs of delivering the HAP. Finally, the indicative costs did not include research and advisory costs which have been included within the current costings as part of the additional 5% ‘other costs’ category.
17.6 Consultees
The consultants are grateful to the following consultees who provided helpful comments, advice and information:
Ann Davies, Defra
Tim Boulding, Defra
Patrick Taggart, DARD
Daniel Gotts, SNH
Clare Burrows & Sarah Hetherington, CCW
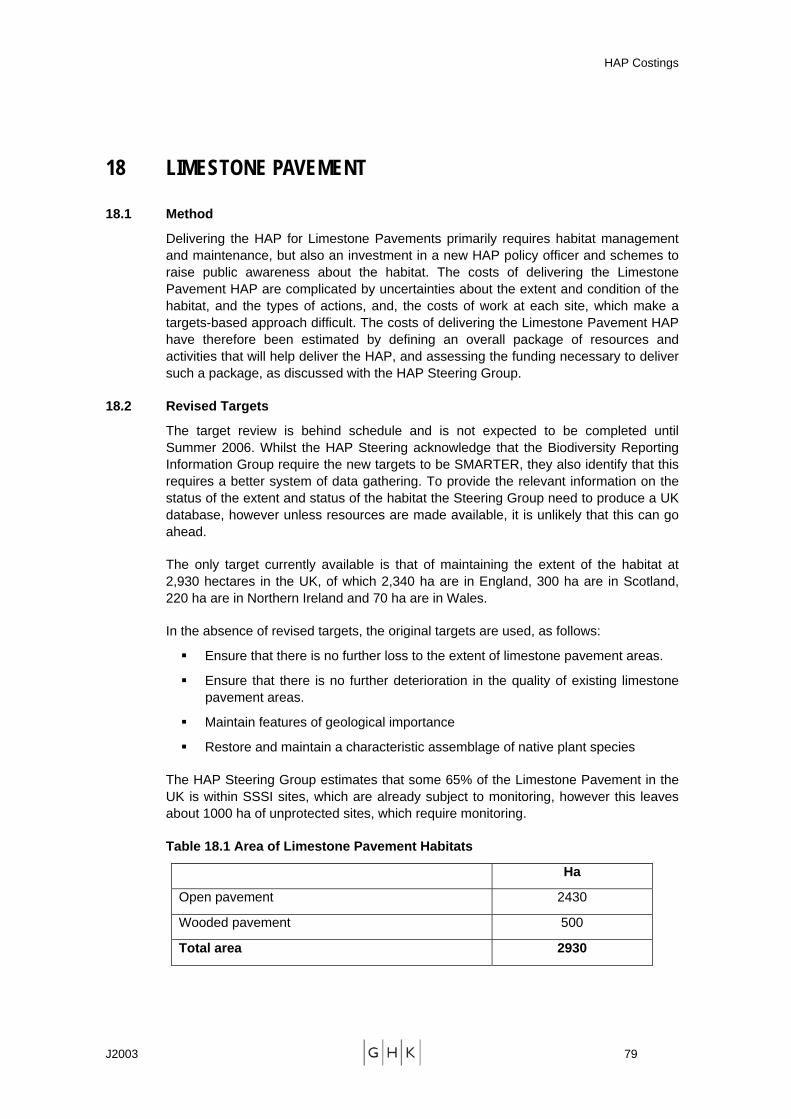
HAP Costings
J2003 79
18 LIMESTONE PAVEMENT
18.1 Method
Delivering the HAP for Limestone Pavements primarily requires habitat management and maintenance, but also an investment in a new HAP policy officer and schemes to raise public awareness about the habitat. The costs of delivering the Limestone Pavement HAP are complicated by uncertainties about the extent and condition of the habitat, and the types of actions, and, the costs of work at each site, which make a targets-based approach difficult. The costs of delivering the Limestone Pavement HAP have therefore been estimated by defining an overall package of resources and activities that will help deliver the HAP, and assessing the funding necessary to deliver such a package, as discussed with the HAP Steering Group.
18.2 Revised Targets
The target review is behind schedule and is not expected to be completed until Summer 2006. Whilst the HAP Steering acknowledge that the Biodiversity Reporting Information Group require the new targets to be SMARTER, they also identify that this requires a better system of data gathering. To provide the relevant information on the status of the extent and status of the habitat the Steering Group need to produce a UK database, however unless resources are made available, it is unlikely that this can go ahead.
The only target currently available is that of maintaining the extent of the habitat at 2,930 hectares in the UK, of which 2,340 ha are in England, 300 ha are in Scotland, 220 ha are in Northern Ireland and 70 ha are in Wales.
In the absence of revised targets, the original targets are used, as follows:
Ensure that there is no further loss to the extent of limestone pavement areas.
Ensure that there is no further deterioration in the quality of existing limestone pavement areas.
Maintain features of geological importance
Restore and maintain a characteristic assemblage of native plant species
The HAP Steering Group estimates that some 65% of the Limestone Pavement in the UK is within SSSI sites, which are already subject to monitoring, however this leaves about 1000 ha of unprotected sites, which require monitoring.
Table 18.1 Area of Limestone Pavement Habitats
Ha
Open pavement 2430
Wooded pavement 500
Total area 2930
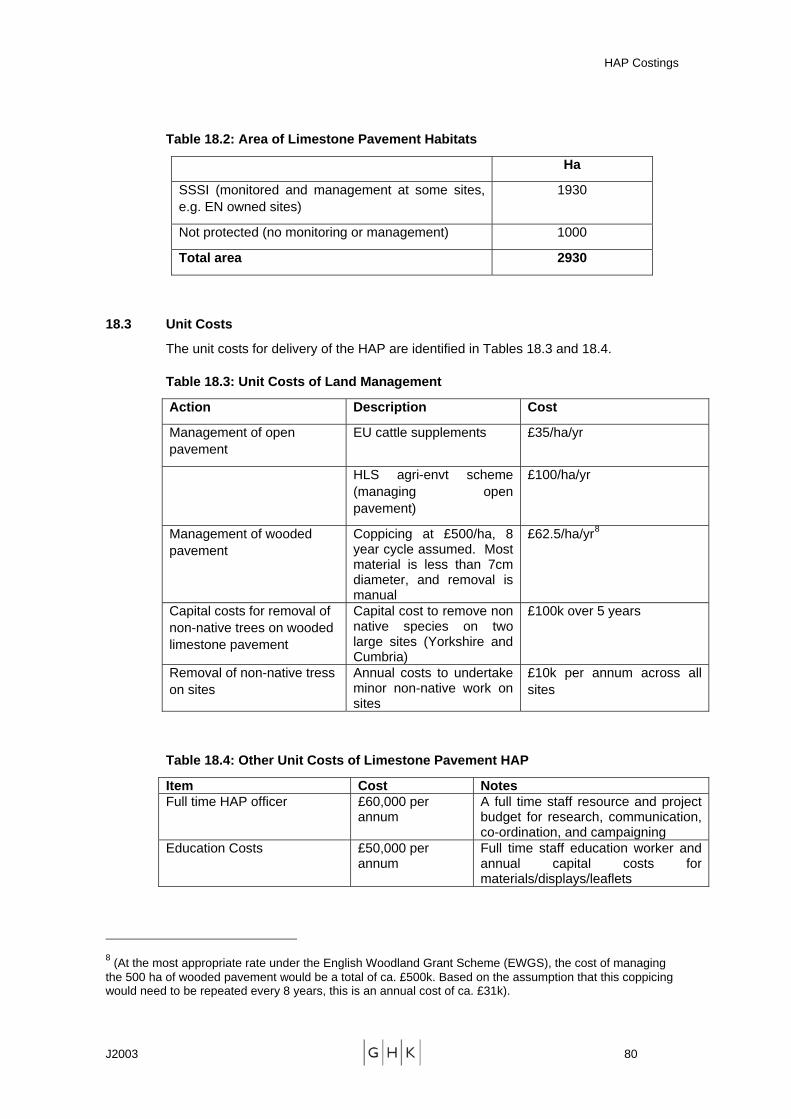
HAP Costings
J2003 80
Table 18.2: Area of Limestone Pavement Habitats
Ha
SSSI (monitored and management at some sites, e.g. EN owned sites)
1930
Not protected (no monitoring or management) 1000
Total area 2930
18.3 Unit Costs
The unit costs for delivery of the HAP are identified in Tables 18.3 and 18.4.
Table 18.3: Unit Costs of Land Management
Action Description Cost
Management of open pavement
EU cattle supplements £35/ha/yr
HLS agri-envt scheme (managing open pavement)
£100/ha/yr
Management of wooded pavement
Coppicing at £500/ha, 8 year cycle assumed. Most material is less than 7cm diameter, and removal is manual
£62.5/ha/yr8
Capital costs for removal of non-native trees on wooded limestone pavement
Capital cost to remove non native species on two large sites (Yorkshire and Cumbria)
£100k over 5 years
Removal of non-native tress on sites
Annual costs to undertake minor non-native work on sites
£10k per annum across all sites
Table 18.4: Other Unit Costs of Limestone Pavement HAP
Item Cost Notes Full time HAP officer £60,000 per
annum A full time staff resource and project budget for research, communication, co-ordination, and campaigning
Education Costs
£50,000 per annum
Full time staff education worker and annual capital costs for materials/displays/leaflets
8 (At the most appropriate rate under the English Woodland Grant Scheme (EWGS), the cost of managing the 500 ha of wooded pavement would be a total of ca. £500k. Based on the assumption that this coppicing would need to be repeated every 8 years, this is an annual cost of ca. £31k).
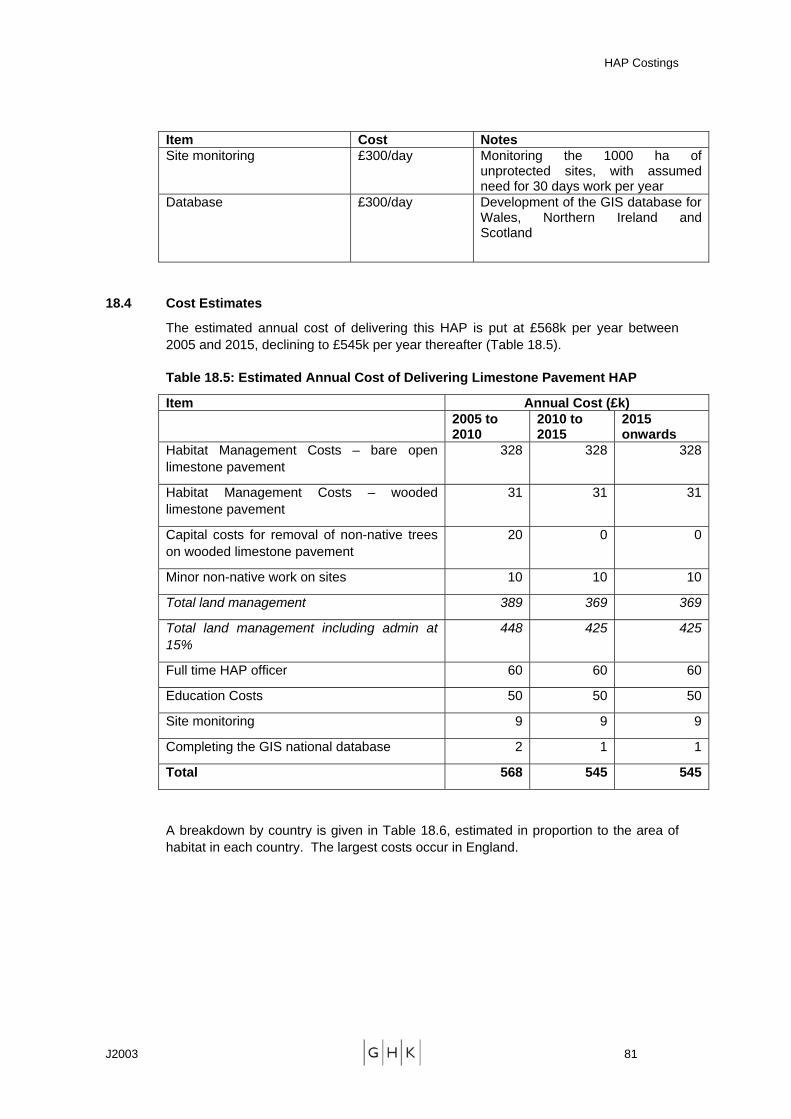
HAP Costings
J2003 81
Item Cost Notes Site monitoring £300/day Monitoring the 1000 ha of
unprotected sites, with assumed need for 30 days work per year
Database £300/day Development of the GIS database for Wales, Northern Ireland and Scotland
18.4 Cost Estimates
The estimated annual cost of delivering this HAP is put at £568k per year between 2005 and 2015, declining to £545k per year thereafter (Table 18.5).
Table 18.5: Estimated Annual Cost of Delivering Limestone Pavement HAP
Item Annual Cost (£k) 2005 to
2010 2010 to 2015
2015 onwards
Habitat Management Costs – bare open limestone pavement
328 328 328
Habitat Management Costs – wooded limestone pavement
31 31 31
Capital costs for removal of non-native trees on wooded limestone pavement
20 0 0
Minor non-native work on sites 10 10 10
Total land management 389 369 369
Total land management including admin at 15%
448 425 425
Full time HAP officer 60 60 60
Education Costs 50 50 50
Site monitoring 9 9 9
Completing the GIS national database 2 1 1
Total 568 545 545
A breakdown by country is given in Table 18.6, estimated in proportion to the area of habitat in each country. The largest costs occur in England.
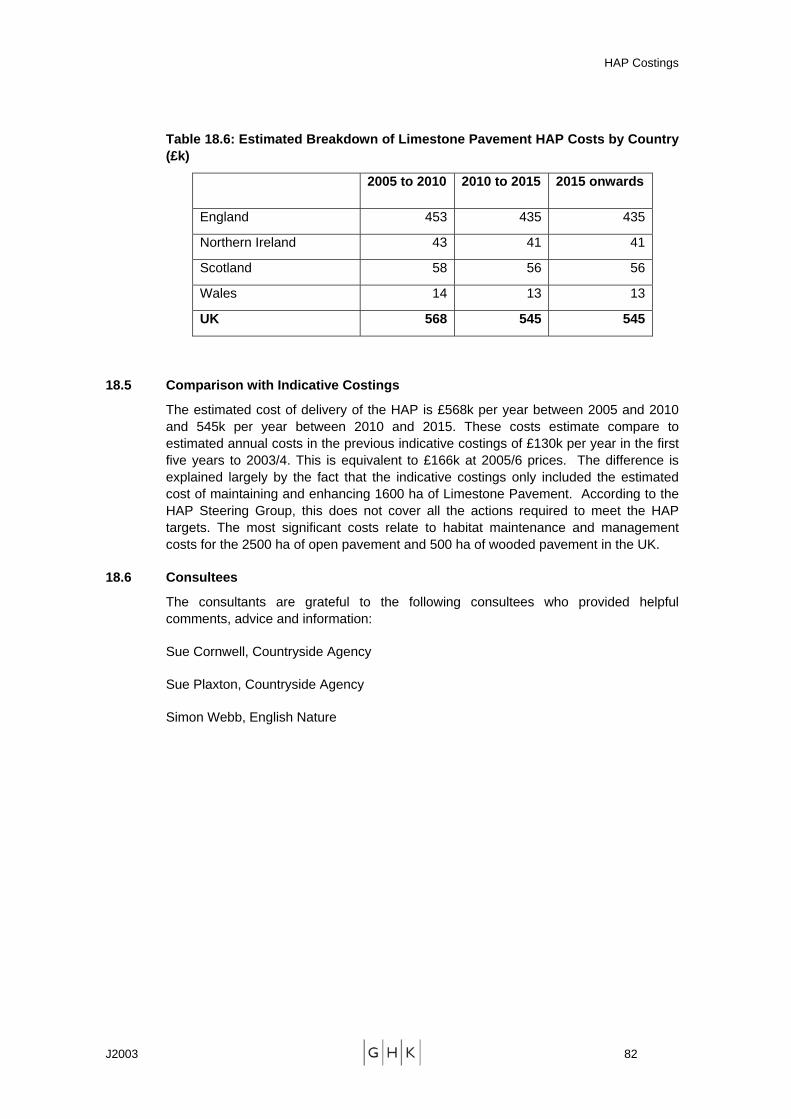
HAP Costings
J2003 82
Table 18.6: Estimated Breakdown of Limestone Pavement HAP Costs by Country (£k)
2005 to 2010 2010 to 2015 2015 onwards
England 453 435 435
Northern Ireland 43 41 41
Scotland 58 56 56
Wales 14 13 13
UK 568 545 545
18.5 Comparison with Indicative Costings
The estimated cost of delivery of the HAP is £568k per year between 2005 and 2010 and 545k per year between 2010 and 2015. These costs estimate compare to estimated annual costs in the previous indicative costings of £130k per year in the first five years to 2003/4. This is equivalent to £166k at 2005/6 prices. The difference is explained largely by the fact that the indicative costings only included the estimated cost of maintaining and enhancing 1600 ha of Limestone Pavement. According to the HAP Steering Group, this does not cover all the actions required to meet the HAP targets. The most significant costs relate to habitat maintenance and management costs for the 2500 ha of open pavement and 500 ha of wooded pavement in the UK.
18.6 Consultees
The consultants are grateful to the following consultees who provided helpful comments, advice and information:
Sue Cornwell, Countryside Agency
Sue Plaxton, Countryside Agency
Simon Webb, English Nature
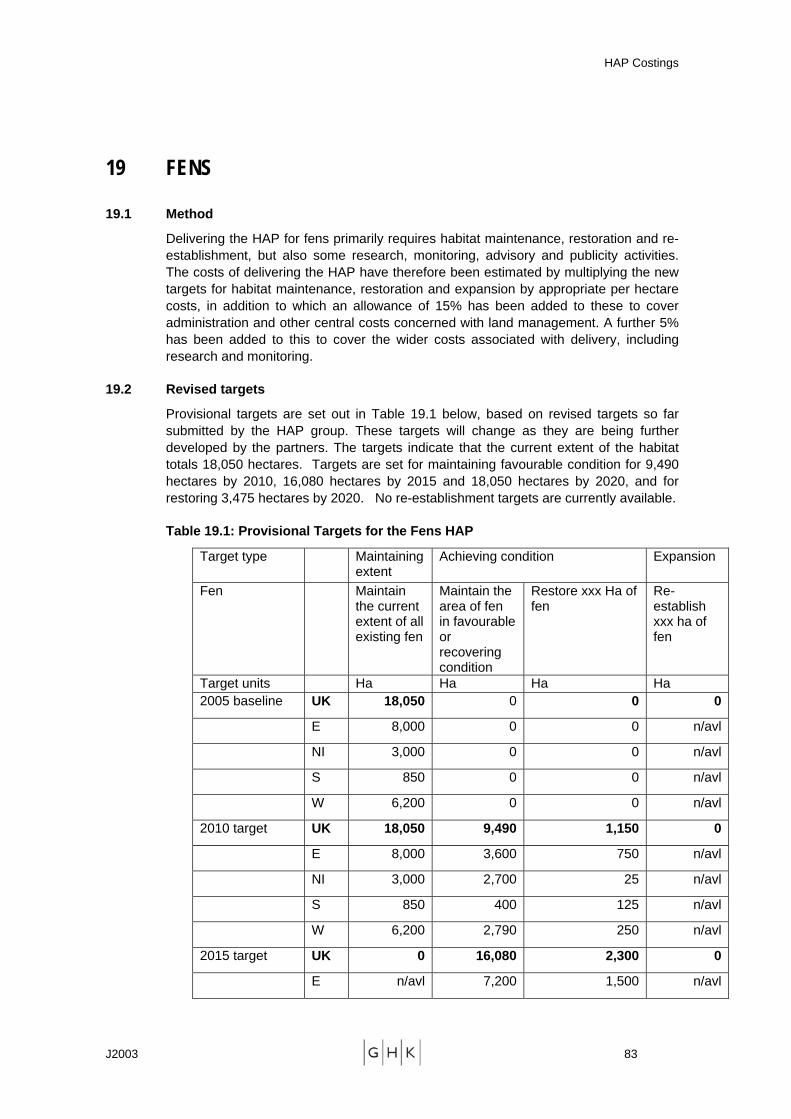
HAP Costings
J2003 83
19 FENS
19.1 Method
Delivering the HAP for fens primarily requires habitat maintenance, restoration and re-establishment, but also some research, monitoring, advisory and publicity activities. The costs of delivering the HAP have therefore been estimated by multiplying the new targets for habitat maintenance, restoration and expansion by appropriate per hectare costs, in addition to which an allowance of 15% has been added to these to cover administration and other central costs concerned with land management. A further 5% has been added to this to cover the wider costs associated with delivery, including research and monitoring.
19.2 Revised targets
Provisional targets are set out in Table 19.1 below, based on revised targets so far submitted by the HAP group. These targets will change as they are being further developed by the partners. The targets indicate that the current extent of the habitat totals 18,050 hectares. Targets are set for maintaining favourable condition for 9,490 hectares by 2010, 16,080 hectares by 2015 and 18,050 hectares by 2020, and for restoring 3,475 hectares by 2020. No re-establishment targets are currently available.
Table 19.1: Provisional Targets for the Fens HAP
Target type Maintaining extent
Achieving condition Expansion
Fen Maintain the current extent of all existing fen
Maintain the area of fen in favourable or recovering condition
Restore xxx Ha of fen
Re-establish xxx ha of fen
Target units Ha Ha Ha Ha 2005 baseline UK 18,050 0 0 0
E 8,000 0 0 n/avl
NI 3,000 0 0 n/avl
S 850 0 0 n/avl
W 6,200 0 0 n/avl
2010 target UK 18,050 9,490 1,150 0
E 8,000 3,600 750 n/avl
NI 3,000 2,700 25 n/avl
S 850 400 125 n/avl
W 6,200 2,790 250 n/avl
2015 target UK 0 16,080 2,300 0
E n/avl 7,200 1,500 n/avl

HAP Costings
J2003 84
NI n/avl 2,700 50 n/avl
S n/avl 600 250 n/avl
W n/avl 5,580 500 n/avl
2020 target UK 0 18,050 3,475 0
E n/avl 8,000 2,250 n/avl
NI n/avl 3,000 100 n/avl
S n/avl 850 375 n/avl
W n/avl 6,200 750 n/avl
19.3 Unit costs
The following unit costs were used to estimate the costs of fen management, restoration and re-establishment. These are based on available agri-environment payment rates, and a review of the capital costs incurred by restoration and re-establishment projects.
Table 19.2: Unit Costs per Hectare of Fen Management, Restoration and Re-establishment
Management Restoration Re-establishment
England £60/ha/yr annual cost
£575 capital costs/ha + £60/ha/yr annual cost
£815 capital costs/ha + £380/ha/yr annual cost
Northern Ireland £92/ha/yr annual cost
£575 capital costs/ha + £92/ha/yr of annual payment
£815 capital costs/ha + £92/ha/yr annual cost
Scotland £96/ha/yr annual cost
£575 capital costs/ha + £96/ha/yr of annual payment
£815 capital costs/ha + £250 annual cost
Wales £35/ha/year annual cost
£575 capital costs/ha + £35/ha/yr annual cost
£815 capitals costs/ha + £310/ha/yr annual cost
The Annex provides a review of the unit costs listed in this table.
19.4 Cost Estimates
Based on the average payment rates identified in Table 19.2, the annual costs of habitat management, restoration and re-establishment required to deliver the revised
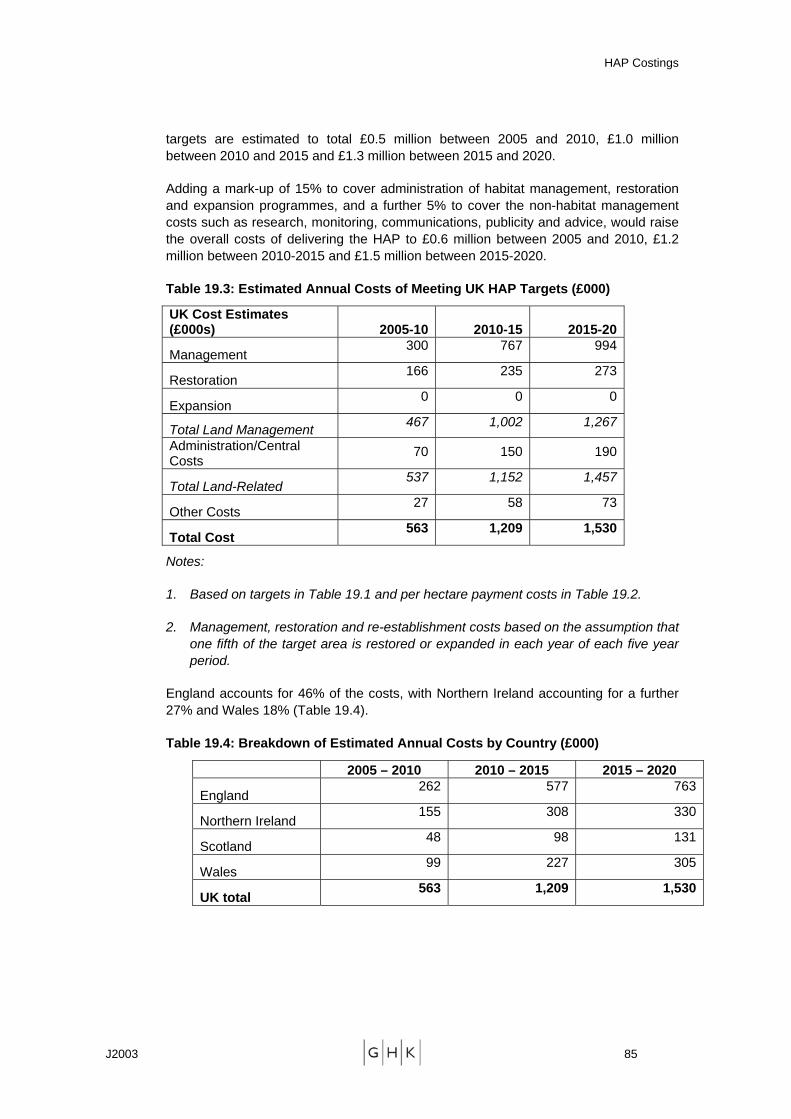
HAP Costings
J2003 85
targets are estimated to total £0.5 million between 2005 and 2010, £1.0 million between 2010 and 2015 and £1.3 million between 2015 and 2020.
Adding a mark-up of 15% to cover administration of habitat management, restoration and expansion programmes, and a further 5% to cover the non-habitat management costs such as research, monitoring, communications, publicity and advice, would raise the overall costs of delivering the HAP to £0.6 million between 2005 and 2010, £1.2 million between 2010-2015 and £1.5 million between 2015-2020.
Table 19.3: Estimated Annual Costs of Meeting UK HAP Targets (£000)
UK Cost Estimates (£000s) 2005-10 2010-15 2015-20
Management 300 767 994
Restoration 166 235 273
Expansion 0 0 0
Total Land Management 467 1,002 1,267
Administration/Central Costs
70 150 190
Total Land-Related 537 1,152 1,457
Other Costs 27 58 73
Total Cost 563 1,209 1,530
Notes:
1. Based on targets in Table 19.1 and per hectare payment costs in Table 19.2.
2. Management, restoration and re-establishment costs based on the assumption that one fifth of the target area is restored or expanded in each year of each five year period.
England accounts for 46% of the costs, with Northern Ireland accounting for a further 27% and Wales 18% (Table 19.4).
Table 19.4: Breakdown of Estimated Annual Costs by Country (£000)
2005 – 2010 2010 – 2015 2015 – 2020
England 262 577 763
Northern Ireland 155 308 330
Scotland 48 98 131
Wales 99 227 305
UK total 563 1,209 1,530
HAP Costings
J2003 86
19.5 Comparison with Indicative Costings
The estimated costs of delivery of the HAP are £0.6 million per year between 2005 and 2010, increasing to £1.2 million per year between 2010 and 2015 and £1.5 million per year between 2015 and 2020.
This is significantly more than was suggested by the earlier indicative costings which estimated the cost of delivering the HAP at £70,000 per year between 2000 and 2010. No information is available in the original HAP on the extent of existing annual agri-environment expenditure for the 1995 base year, so it is hard to get a true picture of the cost differential. However, after updating the indicative costings to 2005/06 prices they would only reach £84,000 for 2005/06 and £93,730 in 2009/10.
The main reasons for the difference is the significant increase in the area to be maintained and restored, inclusion of capital costs of maintenance, restoration and re-establishment in the costing of the revised targets (the indicative costings appear to only have used annual payment rates), and the increase since 1995 in levels of agri-environment payments available for the habitat.
19.6 Consultees
The consultants are grateful to the following consultees who provided helpful comments, advice and information:
Roger Meade, English Nature
Peter Jones, CCW
Martin Bradley and Gavin McNeill, DoE NI
Andrew McBride, SNH
Morag Milne, SNH
Mike Bailey, CCW, Warden for the Dwfi site
Les Colley, Warden for Anglesey site
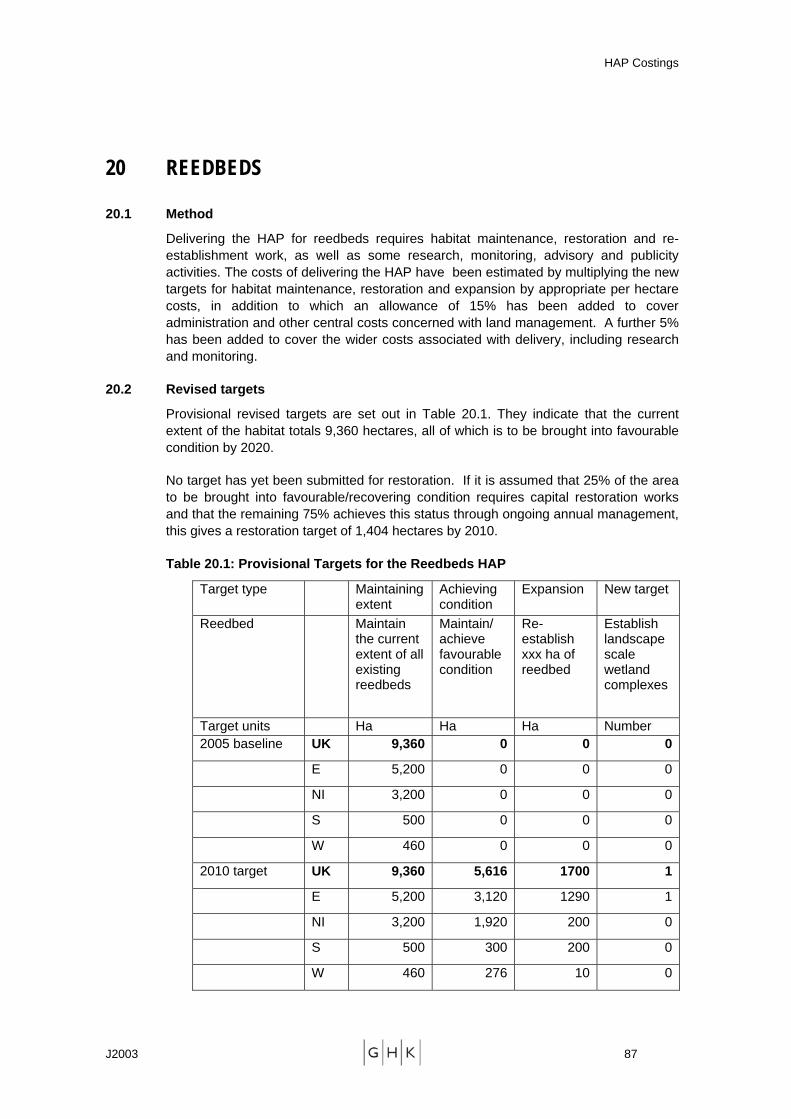
HAP Costings
J2003 87
20 REEDBEDS
20.1 Method
Delivering the HAP for reedbeds requires habitat maintenance, restoration and re-establishment work, as well as some research, monitoring, advisory and publicity activities. The costs of delivering the HAP have been estimated by multiplying the new targets for habitat maintenance, restoration and expansion by appropriate per hectare costs, in addition to which an allowance of 15% has been added to cover administration and other central costs concerned with land management. A further 5% has been added to cover the wider costs associated with delivery, including research and monitoring.
20.2 Revised targets
Provisional revised targets are set out in Table 20.1. They indicate that the current extent of the habitat totals 9,360 hectares, all of which is to be brought into favourable condition by 2020.
No target has yet been submitted for restoration. If it is assumed that 25% of the area to be brought into favourable/recovering condition requires capital restoration works and that the remaining 75% achieves this status through ongoing annual management, this gives a restoration target of 1,404 hectares by 2010.
Table 20.1: Provisional Targets for the Reedbeds HAP
Target type Maintaining extent
Achieving condition
Expansion New target
Reedbed Maintain the current extent of all existing reedbeds
Maintain/ achieve favourable condition
Re-establish xxx ha of reedbed
Establish landscape scale wetland complexes
Target units Ha Ha Ha Number 2005 baseline UK 9,360 0 0 0
E 5,200 0 0 0
NI 3,200 0 0 0
S 500 0 0 0
W 460 0 0 0
2010 target UK 9,360 5,616 1700 1
E 5,200 3,120 1290 1
NI 3,200 1,920 200 0
S 500 300 200 0
W 460 276 10 0
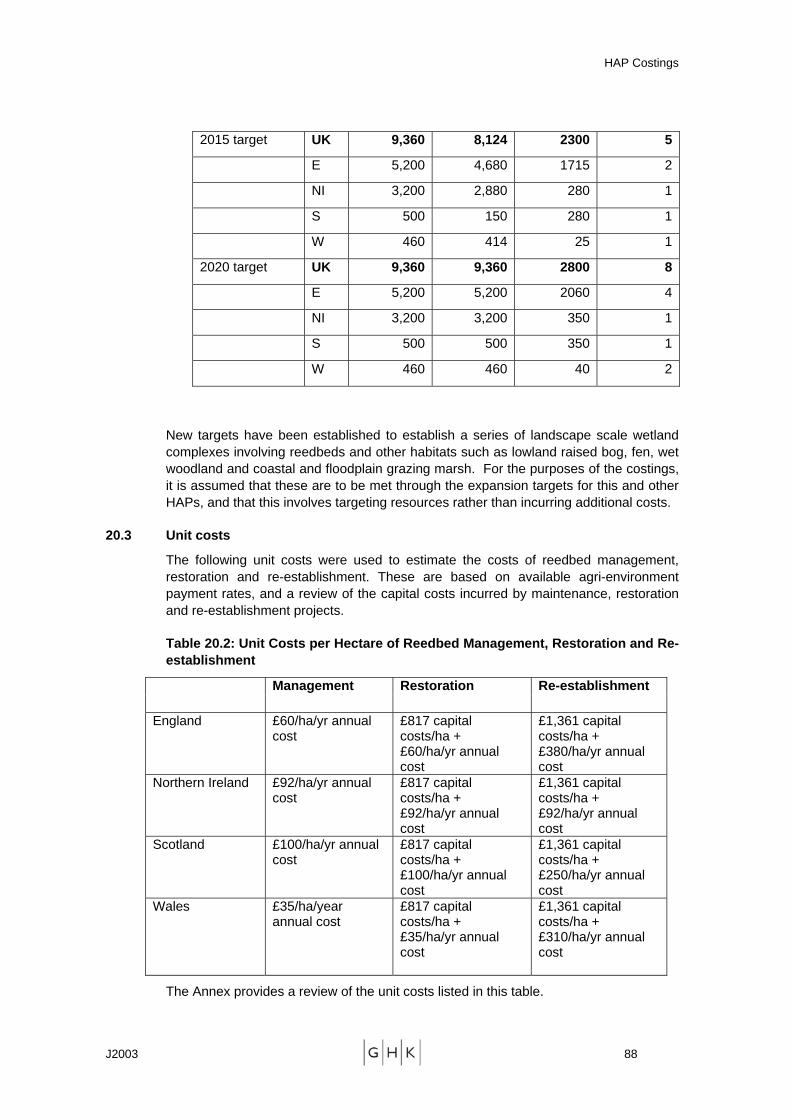
HAP Costings
J2003 88
2015 target UK 9,360 8,124 2300 5
E 5,200 4,680 1715 2
NI 3,200 2,880 280 1
S 500 150 280 1
W 460 414 25 1
2020 target UK 9,360 9,360 2800 8
E 5,200 5,200 2060 4
NI 3,200 3,200 350 1
S 500 500 350 1
W 460 460 40 2
New targets have been established to establish a series of landscape scale wetland complexes involving reedbeds and other habitats such as lowland raised bog, fen, wet woodland and coastal and floodplain grazing marsh. For the purposes of the costings, it is assumed that these are to be met through the expansion targets for this and other HAPs, and that this involves targeting resources rather than incurring additional costs.
20.3 Unit costs
The following unit costs were used to estimate the costs of reedbed management, restoration and re-establishment. These are based on available agri-environment payment rates, and a review of the capital costs incurred by maintenance, restoration and re-establishment projects.
Table 20.2: Unit Costs per Hectare of Reedbed Management, Restoration and Re-establishment
Management Restoration Re-establishment
England £60/ha/yr annual cost
£817 capital costs/ha + £60/ha/yr annual cost
£1,361 capital costs/ha + £380/ha/yr annual cost
Northern Ireland £92/ha/yr annual cost
£817 capital costs/ha + £92/ha/yr annual cost
£1,361 capital costs/ha + £92/ha/yr annual cost
Scotland £100/ha/yr annual cost
£817 capital costs/ha + £100/ha/yr annual cost
£1,361 capital costs/ha + £250/ha/yr annual cost
Wales £35/ha/year annual cost
£817 capital costs/ha + £35/ha/yr annual cost
£1,361 capital costs/ha + £310/ha/yr annual cost
The Annex provides a review of the unit costs listed in this table.
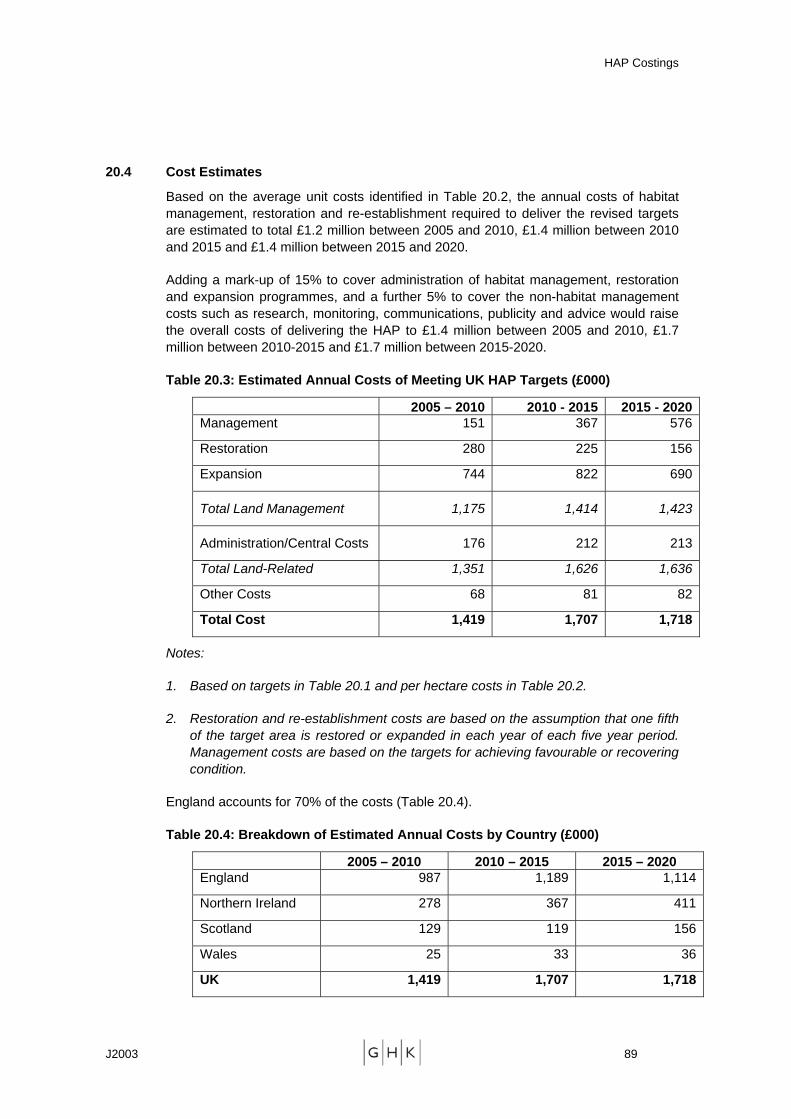
HAP Costings
J2003 89
20.4 Cost Estimates
Based on the average unit costs identified in Table 20.2, the annual costs of habitat management, restoration and re-establishment required to deliver the revised targets are estimated to total £1.2 million between 2005 and 2010, £1.4 million between 2010 and 2015 and £1.4 million between 2015 and 2020.
Adding a mark-up of 15% to cover administration of habitat management, restoration and expansion programmes, and a further 5% to cover the non-habitat management costs such as research, monitoring, communications, publicity and advice would raise the overall costs of delivering the HAP to £1.4 million between 2005 and 2010, £1.7 million between 2010-2015 and £1.7 million between 2015-2020.
Table 20.3: Estimated Annual Costs of Meeting UK HAP Targets (£000)
2005 – 2010 2010 - 2015 2015 - 2020Management 151 367 576
Restoration 280 225 156
Expansion 744 822 690
Total Land Management 1,175 1,414 1,423
Administration/Central Costs 176 212 213
Total Land-Related 1,351 1,626 1,636
Other Costs 68 81 82
Total Cost 1,419 1,707 1,718
Notes:
1. Based on targets in Table 20.1 and per hectare costs in Table 20.2.
2. Restoration and re-establishment costs are based on the assumption that one fifth of the target area is restored or expanded in each year of each five year period. Management costs are based on the targets for achieving favourable or recovering condition.
England accounts for 70% of the costs (Table 20.4).
Table 20.4: Breakdown of Estimated Annual Costs by Country (£000)
2005 – 2010 2010 – 2015 2015 – 2020 England 987 1,189 1,114
Northern Ireland 278 367 411
Scotland 129 119 156
Wales 25 33 36
UK 1,419 1,707 1,718
HAP Costings
J2003 90
20.5 Comparison with Indicative Costings
The estimated costs of delivery of the HAP are £1.4 million per year between 2005 and 2010, rising to £1.7 million per year between 2010 and 2020.
This is significantly more than was suggested by the earlier indicative costings, which estimated the cost of delivering the HAP at £380,000 per year in 2000 and £540,000 per year in 2010. No separate figure was quoted in the original HAP for the existing public expenditure commitments to the habitat in 1995, as these appear to have been included in the central per hectare estimate for maintenance and creation payments, so it is hard to get a true picture of the cost difference. However, if the indicative 2000 costs are updated to 2005/06 prices, they would only reach £456,000 in 2005/06 and £509,000 in 2009/10.
The main reasons for the difference is the increase in assumed unit costs based on a combination of annual and capital costs and the increase in agri-environment payment rates that has occurred since the indicative costings were produced. Furthermore, the earlier indicative costings do not appear to have included an allowance for scheme administration costs or costs relating to advice, research or monitoring.
20.6 Consultees
The consultants are grateful to the following consultees who provided helpful comments, advice and information:
Roger Meade, English Nature
Peter Jones, CCW
Martin Bradley and Gavin McNeill, Doeni
Andrew McBride, SNH
Morag Milne, SNH
Sarah Alsbury, RSPB, Project Manager for the LIFE Bittern Project
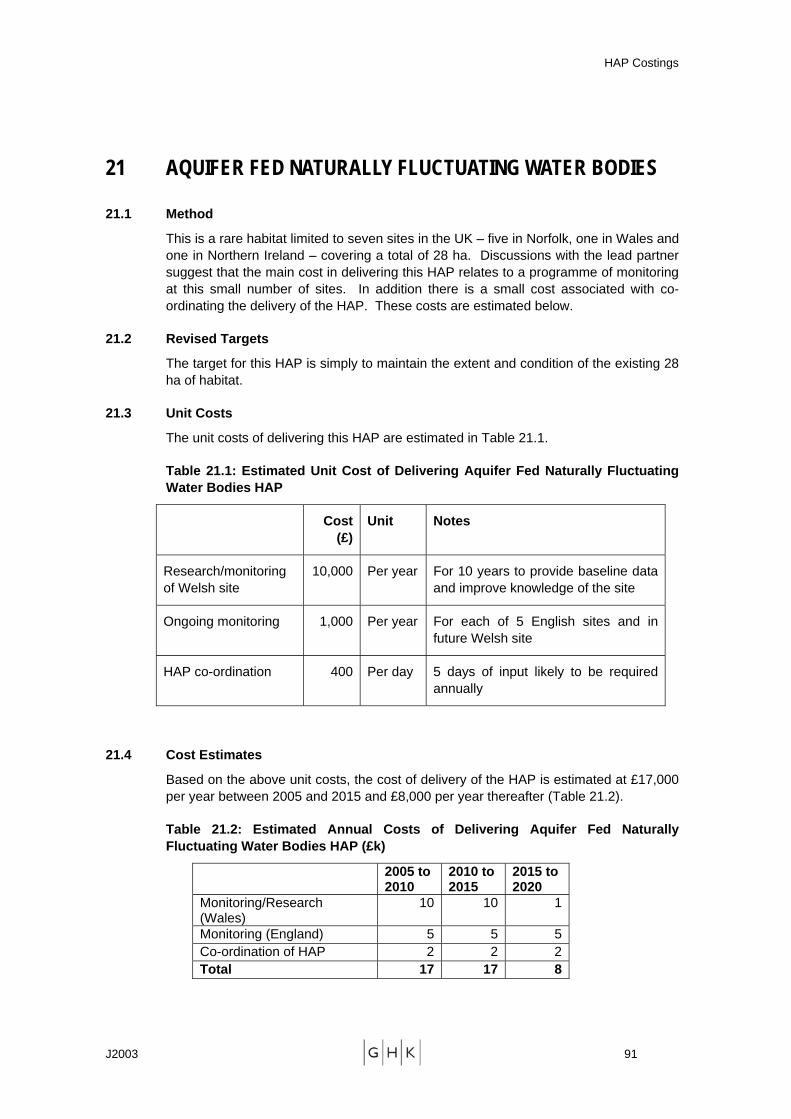
HAP Costings
J2003 91
21 AQUIFER FED NATURALLY FLUCTUATING WATER BODIES
21.1 Method
This is a rare habitat limited to seven sites in the UK – five in Norfolk, one in Wales and one in Northern Ireland – covering a total of 28 ha. Discussions with the lead partner suggest that the main cost in delivering this HAP relates to a programme of monitoring at this small number of sites. In addition there is a small cost associated with co-ordinating the delivery of the HAP. These costs are estimated below.
21.2 Revised Targets
The target for this HAP is simply to maintain the extent and condition of the existing 28 ha of habitat.
21.3 Unit Costs
The unit costs of delivering this HAP are estimated in Table 21.1.
Table 21.1: Estimated Unit Cost of Delivering Aquifer Fed Naturally Fluctuating Water Bodies HAP
Cost (£)
Unit Notes
Research/monitoring of Welsh site
10,000 Per year For 10 years to provide baseline data and improve knowledge of the site
Ongoing monitoring 1,000 Per year For each of 5 English sites and in future Welsh site
HAP co-ordination 400 Per day 5 days of input likely to be required annually
21.4 Cost Estimates
Based on the above unit costs, the cost of delivery of the HAP is estimated at £17,000 per year between 2005 and 2015 and £8,000 per year thereafter (Table 21.2).
Table 21.2: Estimated Annual Costs of Delivering Aquifer Fed Naturally Fluctuating Water Bodies HAP (£k)
2005 to 2010
2010 to 2015
2015 to 2020
Monitoring/Research (Wales)
10 10 1
Monitoring (England) 5 5 5 Co-ordination of HAP 2 2 2 Total 17 17 8

HAP Costings
J2003 92
The largest costs are in Wales between 2005 and 2015, where the need for annual monitoring and research expenditures of £10,000 has been identified. Thereafter most of the costs are assumed to occur in England (Table 21.3). In Northern Ireland, the only cost attributed to the HAP is a share of the overall co-ordination cost.
Table 21.3: Estimated Annual Costs of Delivering Aquifer Fed Naturally Fluctuating Water Bodies HAP, by Country (£k)
2005 to 2010
2010 to 2015
2015 to 2020
England 6.4 6.4 6.4 Northern Ireland 0.3 0.3 0.3 Scotland 0.0 0.0 0.0 Wales 10.3 10.3 1.3 UK 17.0 17.0 8.0
21.5 Comparison with Indicative Costings
The estimated annual costs of £17k for delivering this HAP between 2005 and 2010 compare with estimates in the original indicative costings of £40k per annum in the five years to 2003/04 and £8k per annum in the 10 years to 2013/14. The latter are equivalent to £47k and £9k respectively at 2005/06 prices. Both the original and revised costs therefore indicate that this is an inexpensive HAP to deliver.
21.6 Consultees
The consultants are grateful to the following consultees who provided helpful comments, advice and information:
Pat Sones, Environment Agency
Martin Bradley, EHS
Nigel Stringer, CCW
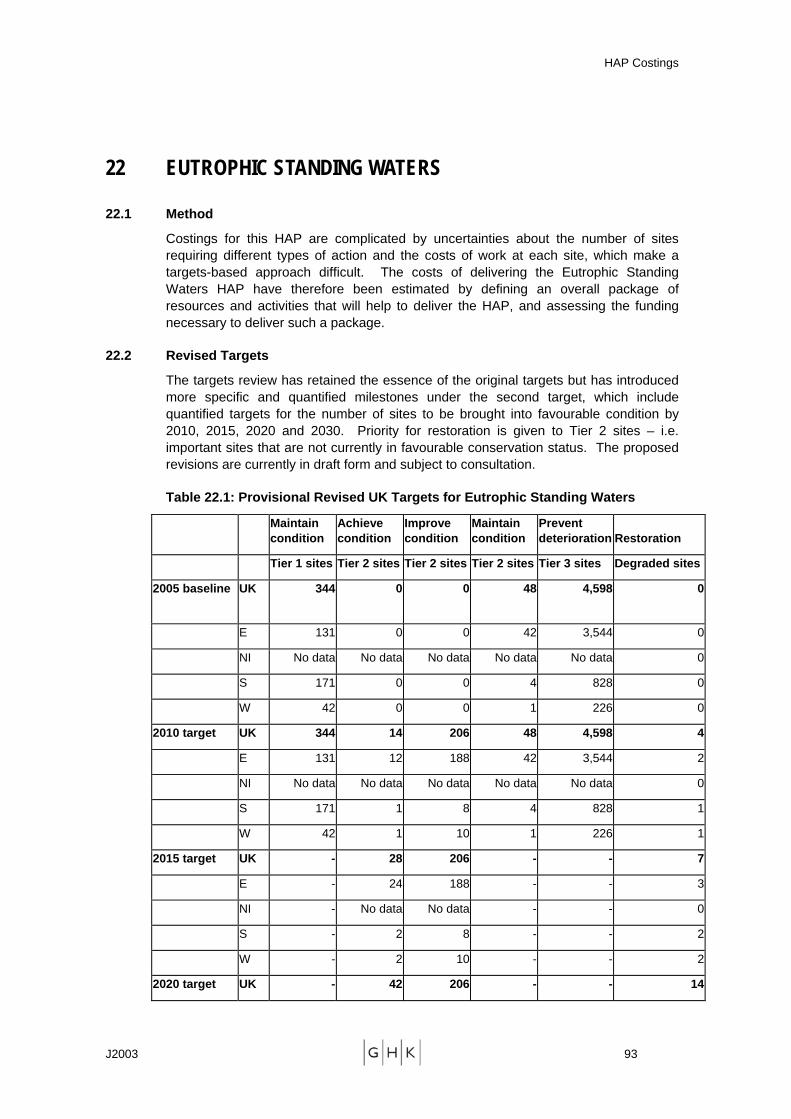
HAP Costings
J2003 93
22 EUTROPHIC STANDING WATERS
22.1 Method
Costings for this HAP are complicated by uncertainties about the number of sites requiring different types of action and the costs of work at each site, which make a targets-based approach difficult. The costs of delivering the Eutrophic Standing Waters HAP have therefore been estimated by defining an overall package of resources and activities that will help to deliver the HAP, and assessing the funding necessary to deliver such a package.
22.2 Revised Targets
The targets review has retained the essence of the original targets but has introduced more specific and quantified milestones under the second target, which include quantified targets for the number of sites to be brought into favourable condition by 2010, 2015, 2020 and 2030. Priority for restoration is given to Tier 2 sites – i.e. important sites that are not currently in favourable conservation status. The proposed revisions are currently in draft form and subject to consultation.
Table 22.1: Provisional Revised UK Targets for Eutrophic Standing Waters
Maintain condition
Achieve condition
Improve condition
Maintain condition
Prevent deterioration Restoration
Tier 1 sites Tier 2 sites Tier 2 sites Tier 2 sites Tier 3 sites Degraded sites
2005 baseline UK 344 0 0 48 4,598 0
E 131 0 0 42 3,544 0
NI No data No data No data No data No data 0
S 171 0 0 4 828 0
W 42 0 0 1 226 0
2010 target UK 344 14 206 48 4,598 4
E 131 12 188 42 3,544 2
NI No data No data No data No data No data 0
S 171 1 8 4 828 1
W 42 1 10 1 226 1
2015 target UK - 28 206 - - 7
E - 24 188 - - 3
NI - No data No data - - 0
S - 2 8 - - 2
W - 2 10 - - 2
2020 target UK - 42 206 - - 14
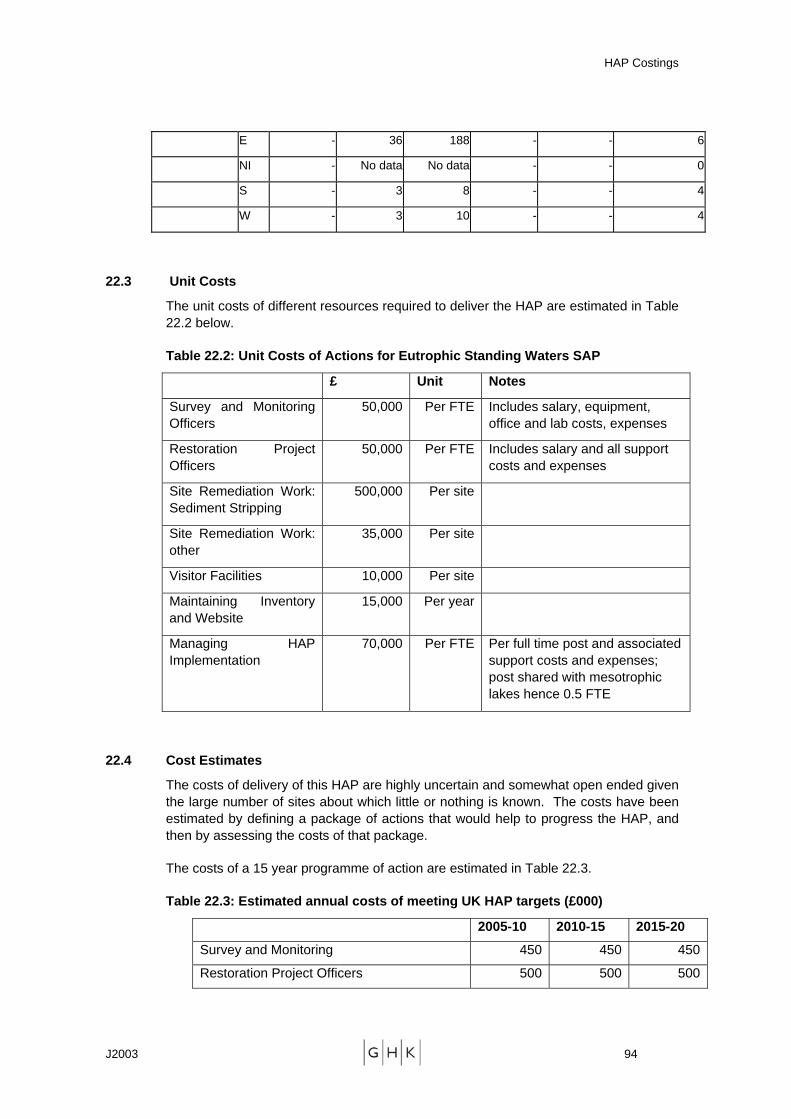
HAP Costings
J2003 94
E - 36 188 - - 6
NI - No data No data - - 0
S - 3 8 - - 4
W - 3 10 - - 4
22.3 Unit Costs
The unit costs of different resources required to deliver the HAP are estimated in Table 22.2 below.
Table 22.2: Unit Costs of Actions for Eutrophic Standing Waters SAP
£ Unit Notes
Survey and Monitoring Officers
50,000 Per FTE Includes salary, equipment, office and lab costs, expenses
Restoration Project Officers
50,000 Per FTE Includes salary and all support costs and expenses
Site Remediation Work: Sediment Stripping
500,000 Per site
Site Remediation Work: other
35,000 Per site
Visitor Facilities 10,000 Per site
Maintaining Inventory and Website
15,000 Per year
Managing HAP Implementation
70,000 Per FTE Per full time post and associated support costs and expenses; post shared with mesotrophic lakes hence 0.5 FTE
22.4 Cost Estimates
The costs of delivery of this HAP are highly uncertain and somewhat open ended given the large number of sites about which little or nothing is known. The costs have been estimated by defining a package of actions that would help to progress the HAP, and then by assessing the costs of that package.
The costs of a 15 year programme of action are estimated in Table 22.3.
Table 22.3: Estimated annual costs of meeting UK HAP targets (£000)
2005-10 2010-15 2015-20
Survey and Monitoring 450 450 450
Restoration Project Officers 500 500 500
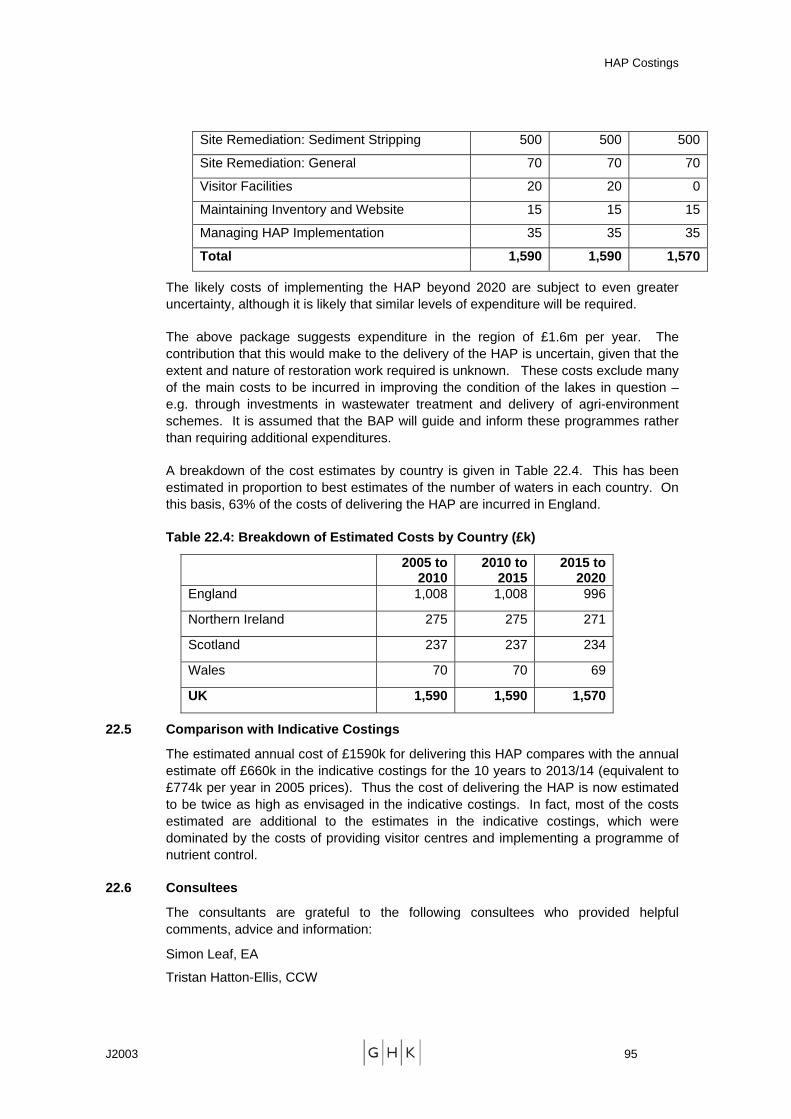
HAP Costings
J2003 95
Site Remediation: Sediment Stripping 500 500 500
Site Remediation: General 70 70 70
Visitor Facilities 20 20 0
Maintaining Inventory and Website 15 15 15
Managing HAP Implementation 35 35 35
Total 1,590 1,590 1,570
The likely costs of implementing the HAP beyond 2020 are subject to even greater uncertainty, although it is likely that similar levels of expenditure will be required.
The above package suggests expenditure in the region of £1.6m per year. The contribution that this would make to the delivery of the HAP is uncertain, given that the extent and nature of restoration work required is unknown. These costs exclude many of the main costs to be incurred in improving the condition of the lakes in question – e.g. through investments in wastewater treatment and delivery of agri-environment schemes. It is assumed that the BAP will guide and inform these programmes rather than requiring additional expenditures.
A breakdown of the cost estimates by country is given in Table 22.4. This has been estimated in proportion to best estimates of the number of waters in each country. On this basis, 63% of the costs of delivering the HAP are incurred in England.
Table 22.4: Breakdown of Estimated Costs by Country (£k)
2005 to 2010
2010 to 2015
2015 to 2020
England 1,008 1,008 996
Northern Ireland 275 275 271
Scotland 237 237 234
Wales 70 70 69
UK 1,590 1,590 1,570
22.5 Comparison with Indicative Costings
The estimated annual cost of £1590k for delivering this HAP compares with the annual estimate off £660k in the indicative costings for the 10 years to 2013/14 (equivalent to £774k per year in 2005 prices). Thus the cost of delivering the HAP is now estimated to be twice as high as envisaged in the indicative costings. In fact, most of the costs estimated are additional to the estimates in the indicative costings, which were dominated by the costs of providing visitor centres and implementing a programme of nutrient control.
22.6 Consultees
The consultants are grateful to the following consultees who provided helpful comments, advice and information:
Simon Leaf, EA
Tristan Hatton-Ellis, CCW
HAP Costings
J2003 96
Angus McRobert, DoE NI
Geoff Phillips – EA
Stewart Clarke, EN
Julia Stansfield, EA
Dave Griffiths, EA
Ian Fozzard, SEPA
Martin Janes, River Restoration Centre
Andrea Kelly, Broads Authority
Richard Weyl, EHS
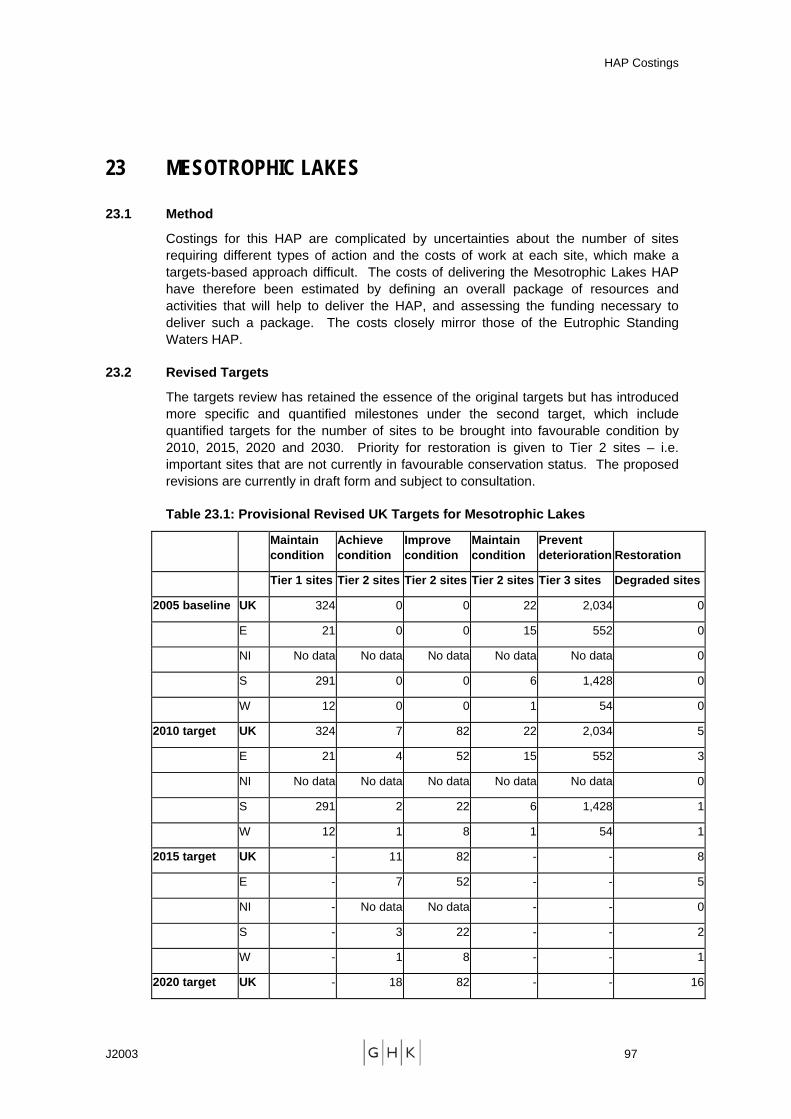
HAP Costings
J2003 97
23 MESOTROPHIC LAKES
23.1 Method
Costings for this HAP are complicated by uncertainties about the number of sites requiring different types of action and the costs of work at each site, which make a targets-based approach difficult. The costs of delivering the Mesotrophic Lakes HAP have therefore been estimated by defining an overall package of resources and activities that will help to deliver the HAP, and assessing the funding necessary to deliver such a package. The costs closely mirror those of the Eutrophic Standing Waters HAP.
23.2 Revised Targets
The targets review has retained the essence of the original targets but has introduced more specific and quantified milestones under the second target, which include quantified targets for the number of sites to be brought into favourable condition by 2010, 2015, 2020 and 2030. Priority for restoration is given to Tier 2 sites – i.e. important sites that are not currently in favourable conservation status. The proposed revisions are currently in draft form and subject to consultation.
Table 23.1: Provisional Revised UK Targets for Mesotrophic Lakes
Maintain condition
Achieve condition
Improve condition
Maintain condition
Prevent deterioration Restoration
Tier 1 sites Tier 2 sites Tier 2 sites Tier 2 sites Tier 3 sites Degraded sites
2005 baseline UK 324 0 0 22 2,034 0
E 21 0 0 15 552 0
NI No data No data No data No data No data 0
S 291 0 0 6 1,428 0
W 12 0 0 1 54 0
2010 target UK 324 7 82 22 2,034 5
E 21 4 52 15 552 3
NI No data No data No data No data No data 0
S 291 2 22 6 1,428 1
W 12 1 8 1 54 1
2015 target UK - 11 82 - - 8
E - 7 52 - - 5
NI - No data No data - - 0
S - 3 22 - - 2
W - 1 8 - - 1
2020 target UK - 18 82 - - 16
HAP Costings
J2003 98
E - 11 52 - - 10
NI - No data No data - - 0
S - 5 22 - - 4
W - 2 8 - - 2
23.3 Unit Costs
The unit costs of different resources required to deliver the HAP are estimated in Table 23.2 below. Further details are given in the Annex.
Table 23.2: Unit Costs of Actions for Mesotrophic Lakes HAP
Actions £ Unit Notes
Survey and Monitoring Officers
50,000 Per FTE Includes salary, equipment, office and lab costs, expenses
Restoration Project Officers
50,000 Per FTE Includes salary and all support costs and expenses
Site Remediation Work: Sediment Stripping
500,000 Per site
Site Remediation Work: other
35,000 Per site
Visitor Facilities 10,000 Per site
Maintaining Inventory and Website
7,000 Per year
Managing HAP Implementation
70,000 Per FTE For full time post and associated support costs and expenses; costs shared with eutrophic standing waters HAP hence 0.5 FTE
23.4 Cost Estimates
The costs of delivery of this HAP are highly uncertain and somewhat open ended given the large number of sites about which little or nothing is known. The costs have been estimated by defining a package of actions that would help to progress the HAP, and then by assessing the costs of that package.
The costs of a 15 year programme of action are estimated in Table 23.3.
Table 23.3: Estimated annual costs of meeting UK HAP targets (£000)
2005-10 2010-15 2015-20 Survey and Monitoring 250 250 250 Restoration Project Officers 500 500 500 Site Remediation: Sediment Stripping
500 500 500
Site Remediation: General 70 70 70
HAP Costings
J2003 99
Visitor Facilities 10 10 0 Maintaining Inventory and Website 7 7 7 Managing HAP Implementation 35 35 35 Total 1,372 1,372 1,362
The likely costs of implementing the HAP beyond 2015 are subject to even greater uncertainty, although it is likely that similar levels of expenditure will be required.
The above package suggests expenditure in the region of £1.4m per year. The contribution that this would make to the delivery of the HAP is uncertain, given that the extent and nature of restoration work required is unknown. These costs exclude many of the main costs to be incurred in improving the condition of the lakes in question – e.g. through investments in wastewater treatment and delivery of agri-environment schemes. It is assumed that the BAP will guide and inform these programmes rather than requiring additional expenditures.
A breakdown of the cost estimates by country is given in Table 23.4. This has been estimated in proportion to best estimates of the number of lakes each country. On this basis, 55% of the costs of delivering the HAP are incurred in Scotland.
Table 23.4: Breakdown of Estimated Costs by Country (£k)
Country Cost Estimates (£000) 2005-2010
2010-2015
2015-2020
England 333 333 330
Northern Ireland 237 237 236
Scotland 748 748 743
Wales 54 54 54
UK 1,372 1,372 1,362
23.5 Comparison with Indicative Costings
The estimated annual cost of £1372k for delivering this HAP compares with the annual estimate off £350k in the original indicative costings for 2010 (equivalent to £448k per year in 2005/06 prices). Thus the cost of delivering the HAP is now estimated to be approximately three times as high as envisaged in the indicative costings. No breakdown of the original indicative costings is available, but it is likely that the extra costs are explained by higher than envisaged monitoring and restoration costs.
23.6 Consultees
The consultants are grateful to the following consultees who provided helpful comments, advice and information:
Scot Mathieson, SEPA
Simon Leaf, EA
Ian Fozzard, SEPA
HAP Costings
J2003 100
Tristan Hatton-Ellis, CCW
Angus McRobert, DoE NI
Geoff Phillips – EA
Stewart Clarke, EN
Julia Stansfield, EA
Dave Griffiths, EA
Martin Janes, River Restoration Centre
Andrea Kelly, Broads Authority
Richard Weyl, EHS
HAP Costings
J2003 101
24 CHALK RIVERS
24.1 Method
The principal actions required to deliver the Chalk Rivers HAP are identified in a 2004 report by the Environment Agency and English Nature, “The State of England’s Chalk Rivers”, and in the draft submission to the targets review. The main actions with resource requirements have been identified from these documents, and the costs involved in implementing these have been assessed in conjunction with the lead partner.
It should be noted that the estimates below exclude the costs of capital investments designed to improve water quality and water flows, which are not currently quantifiable, but are assumed to be met through core water company and Environment Agency investment programmes, guided by the HAP. The costs of agri-environment payments are also excluded, on the assumption that these can be met through existing programmes, guided by the advisory and strategic actions recommended below.
24.2 Revised Targets
The HAP partners submitted draft revised targets to the HAPs review in March 2005. These have now been revised following the receipt of comments from the Targets Review team and discussion by the National Chalk Rivers Steering Group and its Chalk Rivers Technical Sub-Group. The targets were based on an ‘agenda for action’ that was set out in the recently published The State of England’s Chalk Rivers report (2004).
Table 24.1: Draft revised chalk rivers targets (March 2006)
Achieving condition
T1 - Achieve Favourable Condition (FC) for all Sites of Special Scientific Interest (562 kilometres) by 2030.
Achieving condition
T2 - Achieve at least Good Ecological Status or Good Ecological Potential for all chalk rivers (includes chalk river SSSIs) by 2030.
Restoration T3 - Restore 150 kms chalk river habitat to high quality physical status (RHS) (<30% graded poor) by 2010 .
Achieving condition
T4 - Ensure best practice environmental management guidelines are implemented on all chalk rivers by 2015.
Achieving condition
T5 - Achieve ecologically acceptable target flow regimes for all chalk rivers - 1000 km chalk rivers achieving ecological acceptable flows by 2010.
Achieving condition
T6 - Achieve high water quality objectives for all chalk rivers: GQA. - 2000 km achieve biological GQA class ‘a’ and chemical GQA grade ‘A’ by 2010.
Achieving condition
T7 - Achieve high water quality objectives for all chalk rivers: phosphorous (<0.06ug/l and 0.04 ug/l for headwaters) - 50% of chalk rivers achieve phosphorus targets by 2010.
Achieving condition
T8 - Achieve high water quality objectives for all chalk rivers: temperature, silt (suspended solids and insitu silt) and highly biologically active substances(e.g. oestrogenics& pesticides) - ?kms of chalk rivers achieved targets by 2010.
HAP Costings
J2003 102
Restoration T9 - Restore 3 chalk river wetland sites suffering from drying by 2010.
Achieving condition
T10 - Achieve environmentally sustainable characteristic fish communities - 20% of chalk rivers achieving target by 2010.
Achieving condition
T11 - Achieve control of key non-native species along X km of chalk rivers by 2010 (Signal crayfish, mink, Japanese knotweed & Himalyan balsam).
Appendix 2 of “The State of England’s Chalk Rivers” lists the chalk rivers in England and gives their lengths and designations. The Appendix identifies 161 chalk rivers with a total estimated length of 3915 km. Of these, 10 rivers (1224km) are river SSSI and 5 rivers (761km) are SAC. Therefore the large majority of chalk rivers are non designated sites. This is significant in that most of the work to date to improve the condition of the habitat has focused on designated sites.
24.3 Unit Costs
The estimated unit costs involved in delivering the HAP are set out in Table 24.2 below.
Table 24.2: Estimated Costs of Delivery of Chalk Rivers HAP
£ Unit Notes
Chalk River BAP Programme Co-ordinator
70,000 Per FTE per
year
Includes salary, expenses, office costs and overheads
Area Chalk River Restoration Strategies
20,000 Per EA area
Chalk rivers occur in 12 EA Areas
Chalk River habitat restoration costs
15,000 Per km Costs of physical works to be undertaken over 25 years; targets
require 30 km to be restored per year
Chalk rivers management guide
25,000 For project
One-off cost
Land Care Officers 50,000 Per post per
year
One in each of 12 EA Areas. To cover salary, support costs, office costs and
expenses
Ecological acceptable target flow regime research contract to develop national toolkit
60,000 Per year
Three year contract
Ecological acceptable target flow regime symposium and publication
40,000 Total One-off cost
Ecological acceptable target flow regime Area
60,000 Per EA Area
One-off cost for each of 12 EA Areas
HAP Costings
J2003 103
plans
Monitoring review 60,000 Total For one-year contract
Research budget 80,000 Annual To support PhD and research contracts
Control of non-native species
50,000 Annual budget
To support local action
24.4 Cost Estimates
The overall costs of delivering this HAP are estimated to average £1.4 million per year between 2005 and 2015, and £1.25 million per year thereafter (Table 24.3).
Table 24.3: Annual Costs of Delivery of Chalk Rivers HAP (£k)
2005-10 2010-15 2015-20 2020-30 Chalk River BAP Programme co-ordinator
70 70 70 70
Area Chalk River Restoration strategies
48 0 0 0
Chalk River habitat restoration works
450 450 450 450
Management guide 5 0 0 0 Land care officers 600 600 600 600 Ecological acceptable target flow regime - national toolkit
36 0 0 0
Ecological acceptable target flow regime – symposium and publication
8 0 0 0
Ecological acceptable target flow regime - area action plans
0 144 0 0
Monitoring review 12 0 0 0 Research programme 80 80 80 80 Control of non-native species
50 50 50 50
Total 1,359 1,394 1,250 1,250
The above estimates exclude the costs of investments designed to improve water quality and water flows, which are not currently quantifiable, but are assumed to be met through core water company and Environment Agency investment programmes, guided by the HAP. The costs of agri-environment payments are also excluded, on the assumption that these can be met through existing programmes, guided by the advisory and strategic actions above.
24.5 Comparison with Indicative Costings
The cost estimates in Table 24.3 compare to estimates of £1.0 million in 2000 and £1.1 million in 2010 in the previous indicative costings. The latter are equivalent to £1.28m and £1.41m respectively at 2005/06 prices. The revised costs are therefore similar in real terms to the estimates in the indicative costings. The Environment Agency reports
HAP Costings
J2003 104
involvement in chalk river projects incurring total expenditure of £2.0 million in 2004/05 (see Annex for details), suggesting that the estimated costs are covered by current spending.
24.6 Consultees
The consultants are grateful to the following consultees who provided helpful comments, advice and information:
Lawrence Talks, Environment Agency
Nigel Holmes, Environment Agency
Chalk Rivers Technical Sub-Group
Alastair Driver, Environment Agency
HAP Costings
J2003 105
25 MACHAIR
25.1 Method
Estimating the costs of delivering the Machair HAP has been complicated by the absence of revised targets for the habitat. As a result, it has been necessary to estimate the costs of land management based on the existing targets and estimates of existing habitat areas, applying appropriate payment rates from agri-environment schemes. Additional costs have been added for advisory posts, the appointment of a HAP co-ordinator, climate change planning and research, which are together estimated to account for one third of the cost of HAP delivery.
25.2 Revised Targets
The target review is behind schedule and is not expected to be completed until mid 2006, following completion of an official report of the Machair ESA scheme at the end of 2005. The targets review is expected to produce some completely new targets and have significant resource implications. As well as previous targets for habitat maintenance, restoration and enhancement, the targets review is expected to set new targets for the area of machair cultivated and for its management. The targets are likely to be linked to entry into agri-environment schemes with requirements relating to patch size (involving smaller cultivation areas), controls on pesticide and fertiliser use, and biodiversity friendly farming practices.
In the absence of revised targets, the original targets for the habitat are used, as follows:
Maintain existing extent of machair.
Restore improved machair grassland to traditional mixed management with no over-grazing. Aim to reduce improved grassland extent by 30% by 2010, with concomitant reductions in stocking levels to avoid over-grazing of machair.
Apply appropriate remedial methods to 50% of sites currently suffering severe over-grazing by 2005.
Apply appropriate remedial methods to 100% of sites currently suffering severe over-grazing by 2010.
Restore machair habitat and management to large sites degraded by sand extraction in the Western Isles and Orkney by 2010 (for sites with exhausted sand reserves or no further planning permission).
The existing extent of machair is estimated at 9833 ha (according to 2002 HAP progress report) and the arable area at 2014 ha (of which 1182 ha is fallow and 832 ha under crops, Stewart Angus, pers.comm.). The estimates of arable area are indicative, and based on figures from the 1980s and 1990s. In the UK, the habitat is entirely based in Scotland.
The indicative costings estimated that 3370 ha of machair is improved grassland, and thus the restoration target involves 1000 ha. They also estimated that 5% of grassland is severely overgrazed and that 100 ha are degraded by sand extraction and/or erosion.
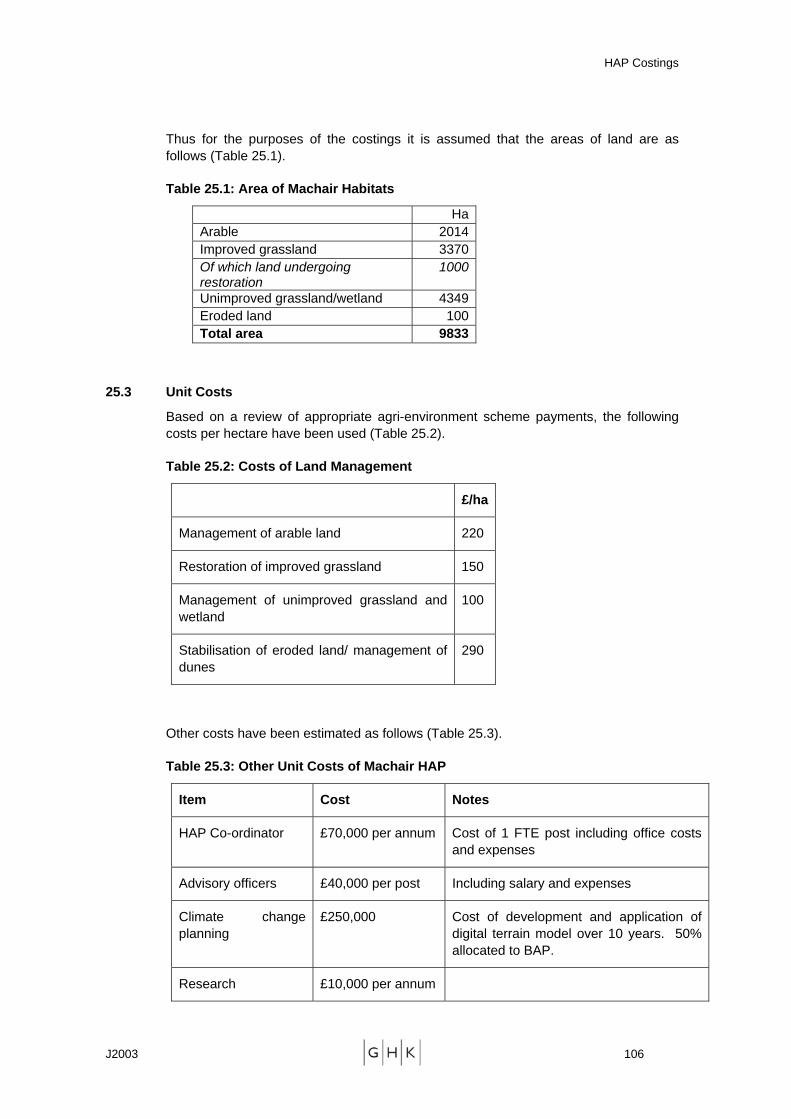
HAP Costings
J2003 106
Thus for the purposes of the costings it is assumed that the areas of land are as follows (Table 25.1).
Table 25.1: Area of Machair Habitats
HaArable 2014Improved grassland 3370Of which land undergoing restoration
1000
Unimproved grassland/wetland 4349Eroded land 100Total area 9833
25.3 Unit Costs
Based on a review of appropriate agri-environment scheme payments, the following costs per hectare have been used (Table 25.2).
Table 25.2: Costs of Land Management
£/ha
Management of arable land 220
Restoration of improved grassland 150
Management of unimproved grassland and wetland
100
Stabilisation of eroded land/ management of dunes
290
Other costs have been estimated as follows (Table 25.3).
Table 25.3: Other Unit Costs of Machair HAP
Item Cost Notes
HAP Co-ordinator £70,000 per annum Cost of 1 FTE post including office costs and expenses
Advisory officers £40,000 per post Including salary and expenses
Climate change planning
£250,000 Cost of development and application of digital terrain model over 10 years. 50% allocated to BAP.
Research £10,000 per annum
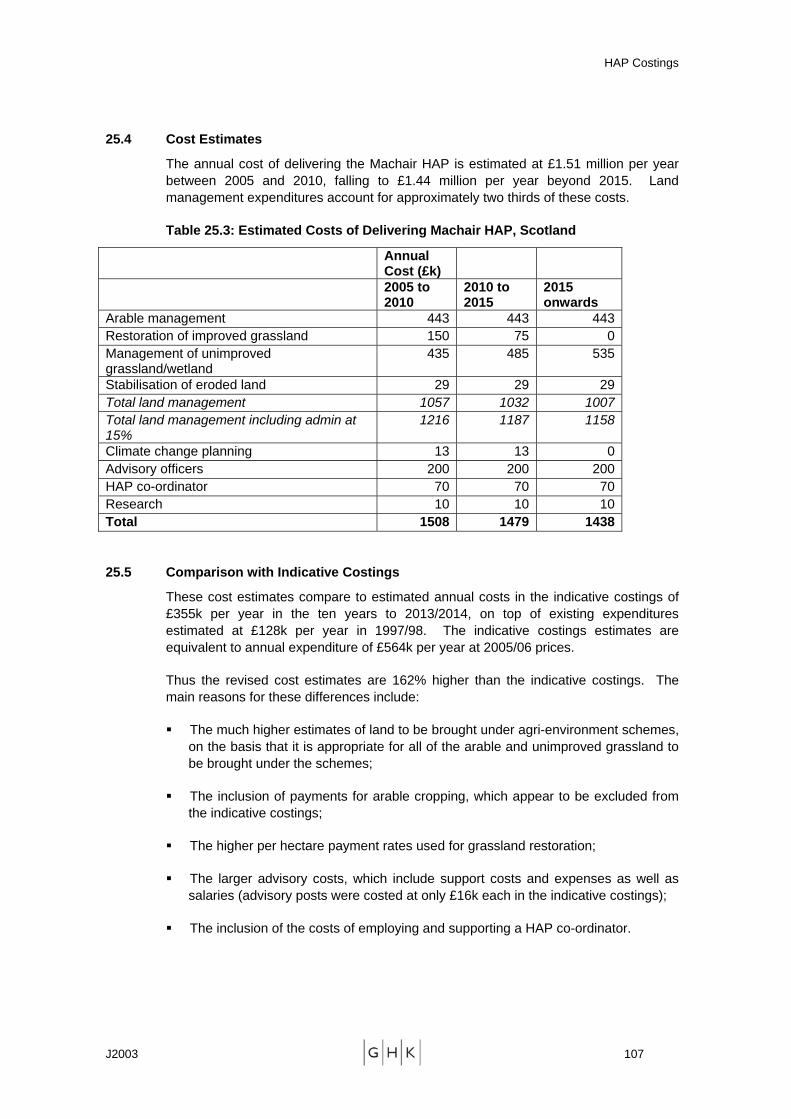
HAP Costings
J2003 107
25.4 Cost Estimates
The annual cost of delivering the Machair HAP is estimated at £1.51 million per year between 2005 and 2010, falling to £1.44 million per year beyond 2015. Land management expenditures account for approximately two thirds of these costs.
Table 25.3: Estimated Costs of Delivering Machair HAP, Scotland
Annual Cost (£k)
2005 to 2010
2010 to 2015
2015 onwards
Arable management 443 443 443 Restoration of improved grassland 150 75 0 Management of unimproved grassland/wetland
435 485 535
Stabilisation of eroded land 29 29 29 Total land management 1057 1032 1007 Total land management including admin at 15%
1216 1187 1158
Climate change planning 13 13 0 Advisory officers 200 200 200 HAP co-ordinator 70 70 70 Research 10 10 10 Total 1508 1479 1438
25.5 Comparison with Indicative Costings
These cost estimates compare to estimated annual costs in the indicative costings of £355k per year in the ten years to 2013/2014, on top of existing expenditures estimated at £128k per year in 1997/98. The indicative costings estimates are equivalent to annual expenditure of £564k per year at 2005/06 prices.
Thus the revised cost estimates are 162% higher than the indicative costings. The main reasons for these differences include:
The much higher estimates of land to be brought under agri-environment schemes, on the basis that it is appropriate for all of the arable and unimproved grassland to be brought under the schemes;
The inclusion of payments for arable cropping, which appear to be excluded from the indicative costings;
The higher per hectare payment rates used for grassland restoration;
The larger advisory costs, which include support costs and expenses as well as salaries (advisory posts were costed at only £16k each in the indicative costings);
The inclusion of the costs of employing and supporting a HAP co-ordinator.
HAP Costings
J2003 108
25.6 Consultees
The consultants are grateful to the following consultees who provided helpful comments, advice and information:
Stewart Angus, SNH
Bill Dundas, SEERAD
Ken Wilson, SEERAD
Uilleam Smith, Crofters Commission
Lloyd Austin, RSPB Scotland
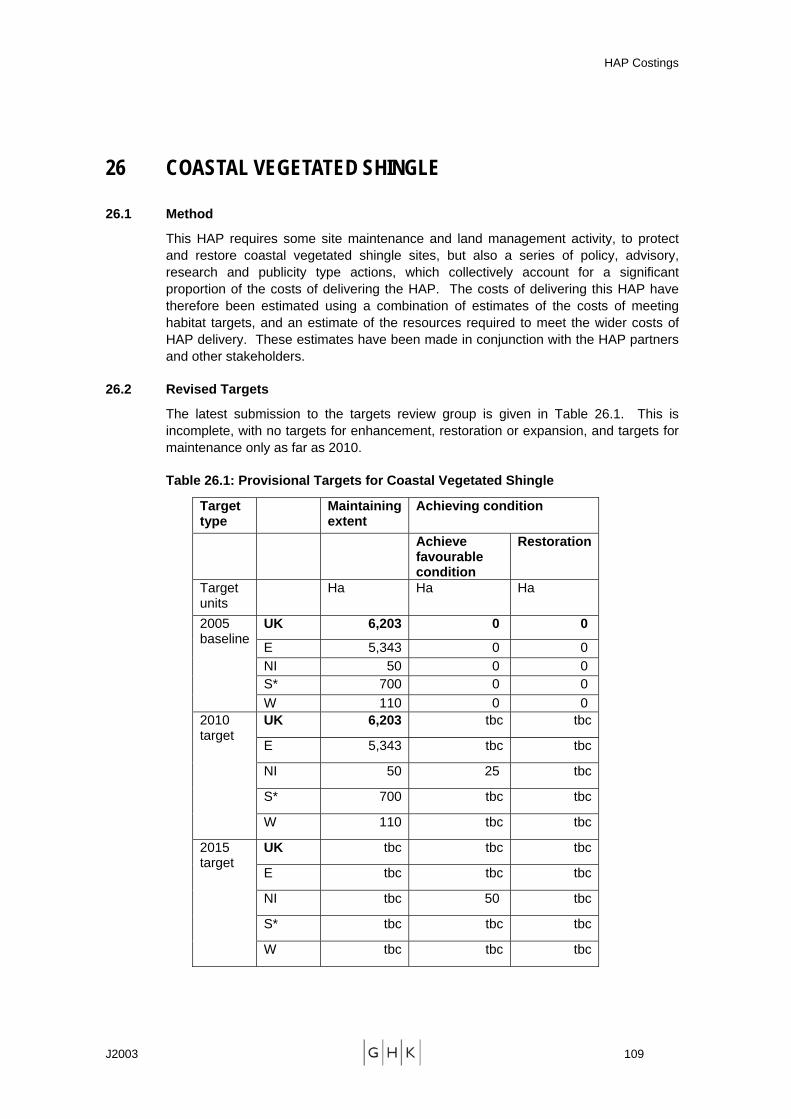
HAP Costings
J2003 109
26 COASTAL VEGETATED SHINGLE
26.1 Method
This HAP requires some site maintenance and land management activity, to protect and restore coastal vegetated shingle sites, but also a series of policy, advisory, research and publicity type actions, which collectively account for a significant proportion of the costs of delivering the HAP. The costs of delivering this HAP have therefore been estimated using a combination of estimates of the costs of meeting habitat targets, and an estimate of the resources required to meet the wider costs of HAP delivery. These estimates have been made in conjunction with the HAP partners and other stakeholders.
26.2 Revised Targets
The latest submission to the targets review group is given in Table 26.1. This is incomplete, with no targets for enhancement, restoration or expansion, and targets for maintenance only as far as 2010.
Table 26.1: Provisional Targets for Coastal Vegetated Shingle
Target type
Maintaining extent
Achieving condition
Achieve favourable condition
Restoration
Target units
Ha Ha Ha
UK 6,203 0 0
E 5,343 0 0 NI 50 0 0 S* 700 0 0
2005 baseline
W 110 0 0 UK 6,203 tbc tbc
E 5,343 tbc tbc
NI 50 25 tbc
S* 700 tbc tbc
2010 target
W 110 tbc tbc
UK tbc tbc tbc
E tbc tbc tbc
NI tbc 50 tbc
S* tbc tbc tbc
2015 target
W tbc tbc tbc
HAP Costings
J2003 110
* The estimate for extent in Scotland should be regarded as a minimum; the true extent is unknown but thought to be significantly larger.
26.3 Unit Costs
Based on a review of relevant land management expenditures, unit costs are estimated as follows (Table 26.2).
Table 26.2: Unit Costs for Shingle Management, Restoration and Expansion
Maintenance/enhancement £50/ha/yr
Restoration £3,100/ha capital cost followed by annual maintenance cost
Expansion £10,000/ha capital cost followed by £260/ha annual cost for 10 years
Other unit costs are as follows (Table 26.3).
Table 26.3: Other Unit Costs of Coastal Vegetated Shingle HAP
Item Cost Notes
HAP Co-ordinator £70,000 per annum
Cost of 1 FTE post including office costs, support costs and expenses
Regional project officers £50,000 per post Including salary, support costs and expenses
Shingle management handbook
£20,000 To be updated every 5 years
Advisory/communications literature
£5,000 Annual budget
26.4 Cost Estimates
The annual costs of delivering the Coastal Vegetated Shingle HAP are estimated in Table 26.4.
HAP Costings
J2003 111
Table 26.4: Estimated annual costs of meeting UK HAP targets (£000)
2005 to 2010
2010 to 2015
2015 to 2020
Maintenance 310 310 310Restoration* 0 0 0Expansion* 0 0 0Total land management 310 310 310Admin costs 47 47 47Total land based 357 357 357National HAP Co-ordinator
70 70 70
Regional project officers 200 200 200Advisory handbook 4 4 4Publications 5 5 5Total 636 636 636
*Habitat restoration and expansion costs are omitted in the absence of targets
Table 26.5 gives a breakdown of costs by country. England accounts for 90% of the total costs.
Table 26.5: Breakdown of Estimated Costs by Country (£k)
2005 to 2010
2010 to 2015
2015 to 2020
England 575 575 575
Northern Ireland
4 4 4
Scotland 49 49 49
Wales 8 8 8
UK 636 636 636
26.5 Comparison with Indicative Costings
The cost of delivering the coastal vegetated shingle HAP is estimated at £636,000 per year in each of the five year periods between 2005 and 2020. This is more than four times as high as the annual estimate of £129k per year in the indicative costings (the latter equivalent to £151k in 2005 prices). The main reasons for the difference are that higher per hectare management costs have been assumed, that the figures relate to total (rather than estimated additional) costs of implementing the HAP, and that greater staffing costs have been included (in particular the continuation of current local posts in key shingle areas).
26.6 Consultees
Sue Rees, English Nature
Kate Cole, East Sussex Coastal Biodiversity Officer
Dee Christensen, West Sussex Coastal Biodiversity Officer
HAP Costings
J2003 112
Bob Edgar, English Nature
Peter Rhind, CCW
Barry Yates, Rye Harbour LNR
Liz Rowan, MoD
Robert Harvey, Halcrow

HAP Costings
J2003 113
27 MARITIME CLIFF AND SLOPES
27.1 Method
The costs of delivering the Maritime Cliff and Slopes HAP have been estimated by estimating the costs of delivery of management, restoration and re-creation targets, using appropriate agri-environment payment rates, and by estimating the costs of additional survey, research, advisory and co-ordination activities.
27.2 Revised Targets
The submission to the targets review specifies the following targets for this habitat (Table 27.1).
Table 27.1: Draft Targets for MCS Habitat
2005 2010 2015Maintenance (km) England 1164 1164 1164Northern Ireland
500 500 500
Scotland 2373 2373 2373Wales 522 522 522UK 4559 4559 4559 Re-establishment (ha) England 0 80 200Northern Ireland
0 20 50
Scotland 0 80 200Wales 0 20 50UK 0 200 500
Based on an assumption that the average width of cliff-top habitat is 50m, this implies the areas to be maintained are as shown in Table 27.2.
Table 27.2: Estimated Area to be Maintained
Maintenance (ha) 2005 2010 2015England 5,820 5,820 5,820Northern Ireland tbc tbc TbcScotland 11,865 11,865 11,865Wales 2,610 2,610 2,610UK 20,295 20,295 20,295
HAP Costings
J2003 114
27.3 Unit Costs
Based on a review of appropriate agri-environment rates, and discussions with the partners in the HAP, the following unit costs for expansion and management have been identified (Table 27.3).
Table 27.3: Unit Costs for Expansion and Management of MCS Habitat
Creation Management/Enhancement
England Capital cost of £150/ha followed by annual cost
of £200/ha/yr
£150/ha/yr
Wales/Scotland/Northern Ireland
Capital cost of £150/ha followed by annual cost
of £100/ha/yr
£80/ha/yr
Other unit costs are set out in Table 27.4.
Table 27.4: Other Unit Costs
Item Cost Notes
National Survey of MCS Habitat
£50/ha To cover 50% of habitat area
Research study £50,000 To develop inventory and identify areas suitable for habitat re-creation
Advisory £60,000 Cost of supporting 1 FT post to provide specialist advice on coastal management, including salary and all support costs
HAP Co-ordinator £60,000 For 1 FT position including all support costs
27.4 Cost Estimates
The annual cost of delivering the Maritime Cliff and Slopes HAP is estimated at £2.6 million per year between 2005 and 2010, falling to £2.5 million per year beyond 2010. Land management expenditures account for between 80% and 95% of these costs.
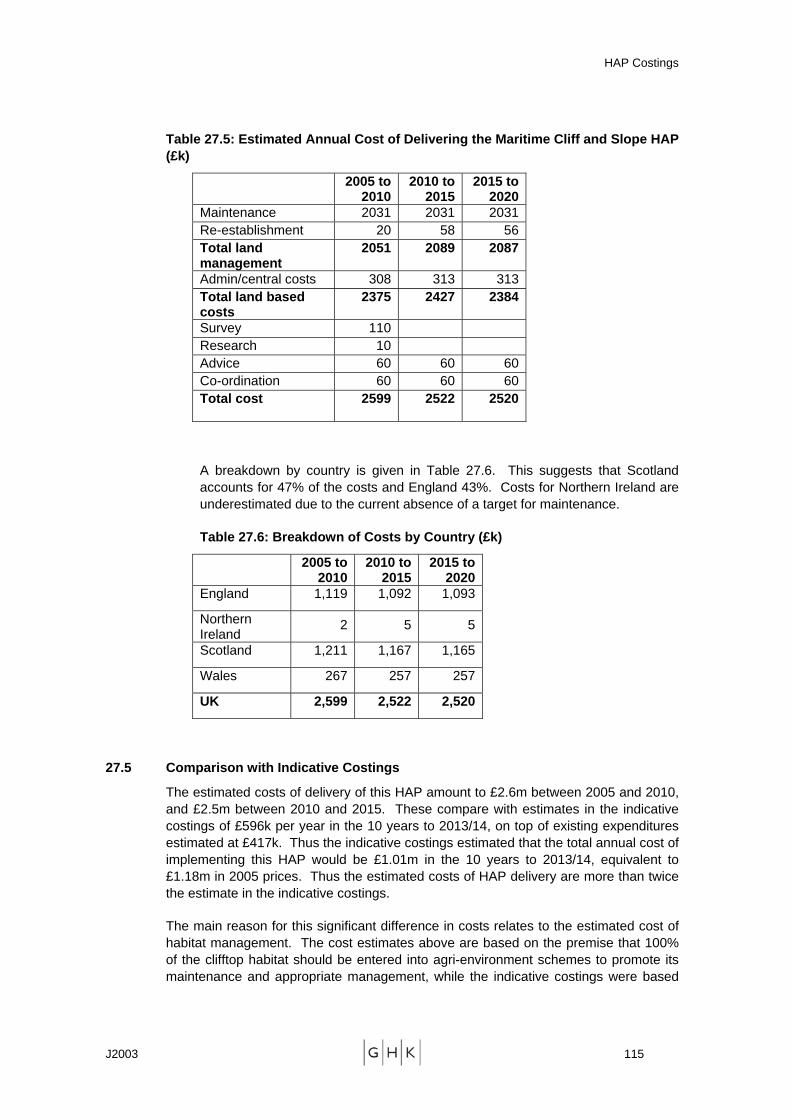
HAP Costings
J2003 115
Table 27.5: Estimated Annual Cost of Delivering the Maritime Cliff and Slope HAP (£k)
2005 to 2010
2010 to 2015
2015 to 2020
Maintenance 2031 2031 2031Re-establishment 20 58 56Total land management
2051 2089 2087
Admin/central costs 308 313 313Total land based costs
2375 2427 2384
Survey 110 Research 10 Advice 60 60 60Co-ordination 60 60 60Total cost 2599 2522 2520
A breakdown by country is given in Table 27.6. This suggests that Scotland accounts for 47% of the costs and England 43%. Costs for Northern Ireland are underestimated due to the current absence of a target for maintenance.
Table 27.6: Breakdown of Costs by Country (£k)
2005 to 2010
2010 to 2015
2015 to 2020
England 1,119 1,092 1,093
Northern Ireland
2 5 5
Scotland 1,211 1,167 1,165
Wales 267 257 257
UK 2,599 2,522 2,520
27.5 Comparison with Indicative Costings
The estimated costs of delivery of this HAP amount to £2.6m between 2005 and 2010, and £2.5m between 2010 and 2015. These compare with estimates in the indicative costings of £596k per year in the 10 years to 2013/14, on top of existing expenditures estimated at £417k. Thus the indicative costings estimated that the total annual cost of implementing this HAP would be £1.01m in the 10 years to 2013/14, equivalent to £1.18m in 2005 prices. Thus the estimated costs of HAP delivery are more than twice the estimate in the indicative costings.
The main reason for this significant difference in costs relates to the estimated cost of habitat management. The cost estimates above are based on the premise that 100% of the clifftop habitat should be entered into agri-environment schemes to promote its maintenance and appropriate management, while the indicative costings were based

HAP Costings
J2003 116
on an assumption that only an additional 25% of the resource should be entered into a management agreement.
27.6 Consultees
The consultants are grateful to the following consultees who provided helpful comments, advice and information:
Peter Rhind, CCW
Stewart Angus, SNH
Sue Rees, EN
Martin Bradley, EHS
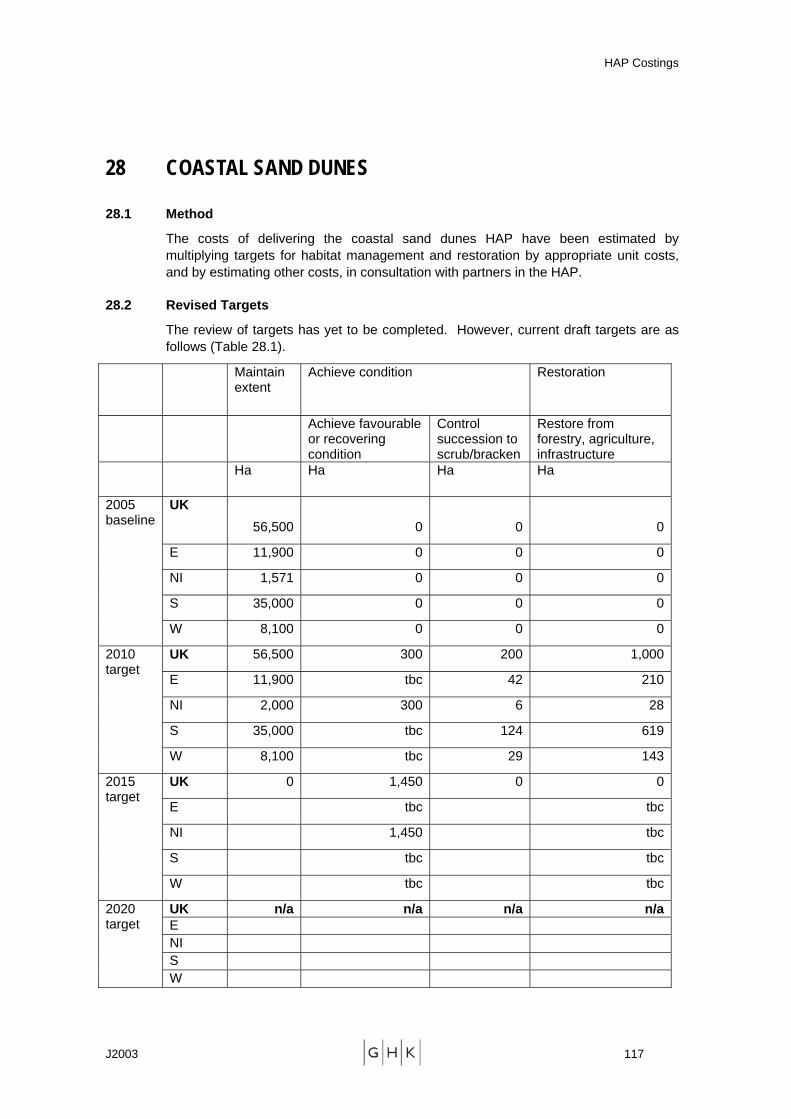
HAP Costings
J2003 117
28 COASTAL SAND DUNES
28.1 Method
The costs of delivering the coastal sand dunes HAP have been estimated by multiplying targets for habitat management and restoration by appropriate unit costs, and by estimating other costs, in consultation with partners in the HAP.
28.2 Revised Targets
The review of targets has yet to be completed. However, current draft targets are as follows (Table 28.1).
Maintain extent
Achieve condition Restoration
Achieve favourable or recovering condition
Control succession to scrub/bracken
Restore from forestry, agriculture, infrastructure
Ha Ha Ha Ha
UK 56,500 0 0 0
E 11,900 0 0 0
NI 1,571 0 0 0
S 35,000 0 0 0
2005 baseline
W 8,100 0 0 0
UK 56,500 300 200 1,000
E 11,900 tbc 42 210
NI 2,000 300 6 28
S 35,000 tbc 124 619
2010 target
W 8,100 tbc 29 143
UK 0 1,450 0 0
E tbc tbc
NI 1,450 tbc
S tbc tbc
2015 target
W tbc tbc
UK n/a n/a n/a n/aE NI S
2020 target
W
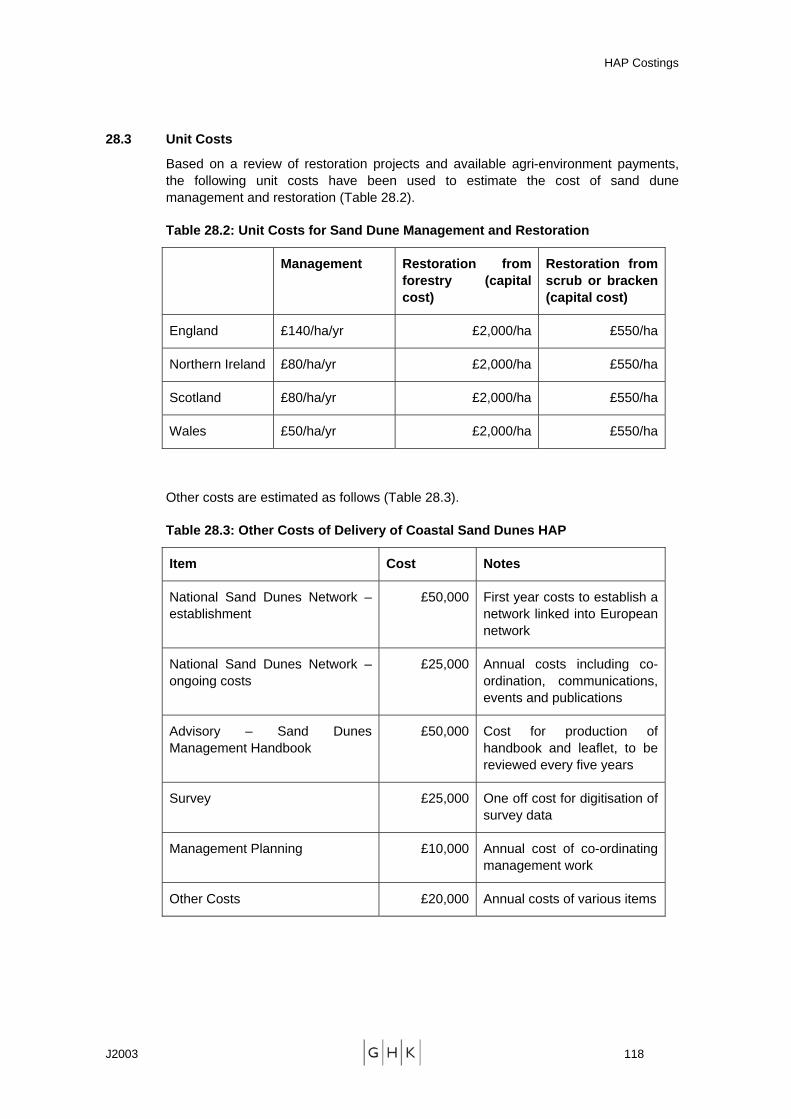
HAP Costings
J2003 118
28.3 Unit Costs
Based on a review of restoration projects and available agri-environment payments, the following unit costs have been used to estimate the cost of sand dune management and restoration (Table 28.2).
Table 28.2: Unit Costs for Sand Dune Management and Restoration
Management Restoration from forestry (capital cost)
Restoration from scrub or bracken (capital cost)
England £140/ha/yr £2,000/ha £550/ha
Northern Ireland £80/ha/yr £2,000/ha £550/ha
Scotland £80/ha/yr £2,000/ha £550/ha
Wales £50/ha/yr £2,000/ha £550/ha
Other costs are estimated as follows (Table 28.3).
Table 28.3: Other Costs of Delivery of Coastal Sand Dunes HAP
Item Cost Notes
National Sand Dunes Network – establishment
£50,000 First year costs to establish a network linked into European network
National Sand Dunes Network – ongoing costs
£25,000 Annual costs including co-ordination, communications, events and publications
Advisory – Sand Dunes Management Handbook
£50,000 Cost for production of handbook and leaflet, to be reviewed every five years
Survey £25,000 One off cost for digitisation of survey data
Management Planning £10,000 Annual cost of co-ordinating management work
Other Costs £20,000 Annual costs of various items
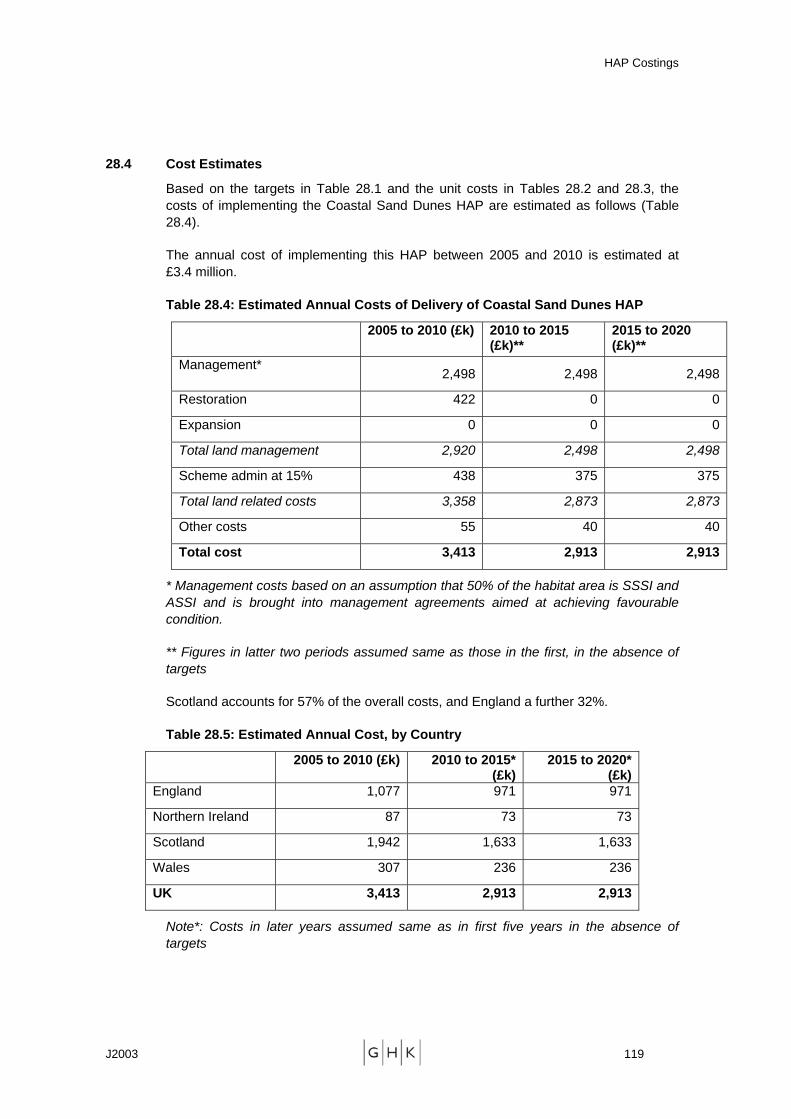
HAP Costings
J2003 119
28.4 Cost Estimates
Based on the targets in Table 28.1 and the unit costs in Tables 28.2 and 28.3, the costs of implementing the Coastal Sand Dunes HAP are estimated as follows (Table 28.4).
The annual cost of implementing this HAP between 2005 and 2010 is estimated at £3.4 million.
Table 28.4: Estimated Annual Costs of Delivery of Coastal Sand Dunes HAP
2005 to 2010 (£k) 2010 to 2015 (£k)**
2015 to 2020 (£k)**
Management* 2,498 2,498 2,498
Restoration 422 0 0
Expansion 0 0 0
Total land management 2,920 2,498 2,498
Scheme admin at 15% 438 375 375
Total land related costs 3,358 2,873 2,873
Other costs 55 40 40
Total cost 3,413 2,913 2,913
* Management costs based on an assumption that 50% of the habitat area is SSSI and ASSI and is brought into management agreements aimed at achieving favourable condition.
** Figures in latter two periods assumed same as those in the first, in the absence of targets
Scotland accounts for 57% of the overall costs, and England a further 32%.
Table 28.5: Estimated Annual Cost, by Country
2005 to 2010 (£k) 2010 to 2015* (£k)
2015 to 2020* (£k)
England 1,077 971 971
Northern Ireland 87 73 73
Scotland 1,942 1,633 1,633
Wales 307 236 236
UK 3,413 2,913 2,913
Note*: Costs in later years assumed same as in first five years in the absence of targets
HAP Costings
J2003 120
28.5 Comparison with Indicative Costings
The estimated cost of £3.4m per year compares with an annual estimate in the indicative costings of £410k per year in the ten years to 2013/14. The latter figure appears unreasonably low, on the grounds that it assumes that only 3,000 hectares (out of a total area of 56,500 ha) is brought under management agreements. The estimate for Northern Ireland of £87k compares to recent estimates commissioned by DoENI which put the annual cost of implementing the HAP at £107k per year in the five years to 2010.
28.6 Consultees
The consultants are grateful to the following consultees who provided helpful comments, advice and information:
Stewart Angus, SNH
Alice Kimpton, EN
Paul Raisbeck, Forestry Commission
Mick Canham, Forestry Commission
Peter Rhind, CCW
Sue Rees, EN
John Houston, Sefton Council
Martin Bradley, EHS
David Carrington, Kenfig NNR
HAP Costings
J2003 121
29 SALTMARSH
29.1 Method
The costs of delivering the saltmarsh HAP have been estimated by reviewing the typical costs of saltmarsh creation and management, and applying these to the revised targets. A review of other costs (research, survey, advisory and co-ordination costs) suggests that these are minor compared to the costs of habitat creation and management, and these have been estimated on the basis that they add 5% to habitat management costs.
29.2 Revised Targets
The targets review has retained the original targets, which were as follows:
Maintain extent and condition of existing habitat (45,500 ha in UK)
Restore nature conservation interest of existing habitat where necessary
Create new saltmarsh to offset existing losses (100ha/yr)
Create new saltmarsh to offset habitat lost between 1992 and 1998 (600ha, 40ha/yr between 2000 and 2015)
Annual targets are therefore as follows (Table 29.1).
Table 29.1: Revised Saltmarsh Targets
Maintenance Annual Creation (to offset current losses; ongoing)
Annual Creation 2005 to 2015 (to offset past losses)
England 32,500 90 36Northern Ireland
215 0 0
Scotland 6,685 0 0Wales 6,100 10 4UK 45,500 100 40
29.3 Unit Costs
Based on a review of habitat creation and management costs (see Annex), the following unit costs are proposed:
Creation - £15,000 per hectare
Management - £51 per hectare per year, for 50% of habitat area.
These figures include project management and administration costs.
In addition to these site related costs, delivery of this HAP will involve various other expenditures relating to research, monitoring, advisory work, communications and publicity, and co-ordination of the HAP. These have been found to be small compared
HAP Costings
J2003 122
to the costs of habitat creation and management, and are estimated to add a further 5% to the costs of HAP delivery.
29.4 Cost Estimates
Based on the unit costs in the previous section, and the revised HAP targets, the annual costs of this HAP are estimated at £3.4 million between 2005 and 2010, falling to £2.8 million between 2015 and 2020 (Table 29.2).
Table 29.2: Estimated Costs of Saltmarsh HAP (£k)
UK Cost Estimates (£000) 2005-10 2010-15 2015-20 Management 1,160 1,160 1,160
Restoration 0 0 0
Expansion 2,100 2,100 1,500
Total Land Management 3,260 3,260 2,660
Other Costs 163 163 133
Total Cost 3,423 3,423 2,793
More than 80% of these costs are incurred in England, which accounts for a large proportion of the targets for this habitat.
Table 29.3: Estimated Costs by Country (£k)
2005 to 2010
2010 to 2015
2015 to 2020
England 2,855 2,855 2,288
Northern Ireland 6 6 6
Scotland 179 179 179
Wales 384 384 321
UK 3,423 3,423 2,793
29.5 Comparison with Indicative Costings
The revised estimates above compare with the previous annual estimate of £882k per year during the 10 years to 2013/14 in the indicative costings, equivalent to £1.03 million in 2005/06 prices. Thus the revised cost estimate is more than three times as high as the previous estimate, in real terms. The difference is largely explained by the very low costs for creation used in the indicative costings (£400 per hectare, with no allowance made for land purchase costs, capital works or project costs). The Annex demonstrates that the true costs of saltmarsh creation have been much higher than this. In addition, the cost total is increased by higher creation targets (to reflect past and current losses) and the assumption that a greater proportion (50%) of the habitat will come under management schemes.
HAP Costings
J2003 123
29.6 Consultees
The consultants are grateful to the following consultees who provided helpful comments, advice and information:
Duncan Huggett, EA
Stewart Angus, SNH
Peter Rhind, CCW
Sue Rees, EN
Larissa Naylor, EA
Ian Dickie, RSPB
Bob Cunningham, RSPB
Phil Winn, EA
Paul Miller, EA
Alastair Driver, EA
HAP Costings
J2003 124
30 MUDFLAT
30.1 Method
The costs of delivering the mudflat HAP have been estimated by reviewing the costs of creation of new mudflat habitat and applying these to the revised targets. Other costs relating to research and co-ordination of the HAP have been estimated separately.
30.2 Revised Targets
The targets review has set the following targets:
Maintain extent of existing habitat (285,550 ha in UK)
Achieve condition of existing habitat
Create new mudflat to offset existing losses (500 ha per year)
Create new mudflat to offset past losses (200 ha per year to 2015).
Table 29.1: Revised Mudflat Targets
Maintenance Annual Creation (to offset current losses; ongoing)
Annual Creation 2005 to 2015 (to offset past losses)
England 206,900 450 180Northern Ireland
10,985 0 0
Scotland 45,500 0 0Wales 22,165 50 20UK 285,500 500 200
30.3 Unit Costs
Unit costs of activities involved in implementing this HAP are estimated in Table 30.2.
Table 30.2: Unit Costs of Mudflat HAP
Item Cost (£) Unit Notes
Habitat Creation 15,000 Per ha Based on review in Annex
Research 20,000 Per year Estimated annual budget
Co-ordination and implementation of HAP
400 Per day Estimated 10 days per year
HAP Costings
J2003 125
30.4 Cost Estimates
Based on the unit costs and targets above, the estimated cost of delivering this HAP is given in Table 30.3. The annual cost of implementing the HAP is £10.5 million to 2015 and £7.5 million thereafter, and is dominated by the cost of mudflat creation.
Table 30.3: Estimated Annual Cost of Mudflat HAP
2005 to 2010
2010 to 2015
2015 to 2020
2020 to 2030
Creation 10,500 10,500 7,500 7500
Research 20 20 20 20Co-ordination 4 4 4 4Total 10,524 10,524 7,524 7,524
England is estimated to account for 90% of the costs of delivering this HAP (Table 30.4).
Table 30.4: Estimated Annual Costs of Mudflat HAP, by Country
2005 to 2010
2010 to 2015
2015 to 2020
2020 to 2030
England 9,472 9,472 6,772 6,772
Northern Ireland 0 0 0 0
Scotland 0 0 0 0
Wales 1,052 1,052 752 752
UK 10,524 10,524 7,524 7,524
30.5 Comparison with Indicative Costings
The estimated annual cost of £10.5 million to 2015 compares with annual estimates of £131k in the five years to 2003/04 and £40k in the 10 years to 2013/14 in the previous indicative costings. The previous cost estimates excluded any costs of mudflat creation, which dominate the revised cost estimates.
30.6 Consultees
The consultants are grateful to the following consultees who provided helpful comments, advice and information:
Duncan Huggett, EA
Stewart Angus, SNH
Peter Rhind, CCW
Sue Rees, EN
HAP Costings
J2003 126
Larissa Naylor, EA
Ian Dickie, RSPB
Bob Cunningham, RSPB
Phil Winn, EA
Paul Miller, EA
Alastair Driver, EA
HAP Costings
J2003 127
31 SALINE LAGOONS
31.1 Method
The costs of delivering the saline lagoons HAP have been estimated by identifying appropriate unit costs for the management, restoration and creation of saline lagoons, and applying them to the revised HAP targets. Additional costs relating to research, survey and monitoring, interpretation, training, advice, and co-ordination and management of the HAP have also been estimated.
31.2 Revised Targets
The targets review has yet to be completed. Table 31.1 presents the latest draft for the revised targets.
Table 31.1: First Draft Revised Targets for Saline Lagoons HAP
2005 2010 2015 Baseline Target Target T1. Maintain Extent (ha) England 1,205 1,205 Northern Ireland 42 42 Scotland 3,900 3,900 Wales 37 37 UK 5,184 5,184 0 T2. Maintain Extent (sites) England 183 183 Northern Ireland 30 30 Scotland 143 143 Wales 9 9 UK 365 365 0 T3. Achieve Condition (ha) England 1,000 1,145 Northern Ireland ? 40 Scotland 3,650 3,705 Wales ? 35 UK 4,650 4,925 0 T4. Expansion (ha) England 15.75 76 100 Northern Ireland ? 1 2 Scotland 16 12 16 Wales 10 1 2 UK 41.75 90 120

HAP Costings
J2003 128
31.3 Unit Costs
The annex provides a summary of the costs of saline lagoon creation, restoration and management, based on a review of available evidence. This has identified unit costs per hectare for different operations in different countries (Table 31.2). Management costs are highest in England where a large proportion of sites are artificial and require ongoing management work. Elsewhere in the UK a large proportion of the area of saline lagoons is natural and does not require the same level of intervention.
Table 31.2: Unit Costs for Saline Lagoon Creation, Restoration and Management
Creation (£/ha) Restoration (£/ha)
Management (£/ha/yr)
England 26,250 1140 136
Northern Ireland 26,250 1140 34
Scotland 26,250 1140 34
Wales 26,250 1140 34
The figures include administration and project management costs. Other, non site-based costs of the HAP are summarised in Table 31.3.
Table 31.3: Summary of Other Costs
Unit cost (£k)
Notes
Research 75 Cost of 3 year PhD project Survey, monitoring, inventory work
45 Annual budget at UK level
Training 6 Cost of training scheme run every two years
Interpretation 4 Annual cost at UK level Advisory materials 20 Cost of management handbook
and materials every 5 years
Co-ordination and management of HAP
400 Daily cost of co-ordination and management work, assume 20 days per year
31.4 Cost Estimates
The costs of delivering this HAP are estimated at £676,000 per annum between 2005 and 2010, falling to £373,000 per annum between 2015 and 2020. A large proportion of the costs in the next five years relate to habitat expansion, with ongoing maintenance costs and other non site related costs accounting for the majority of costs after 2015.
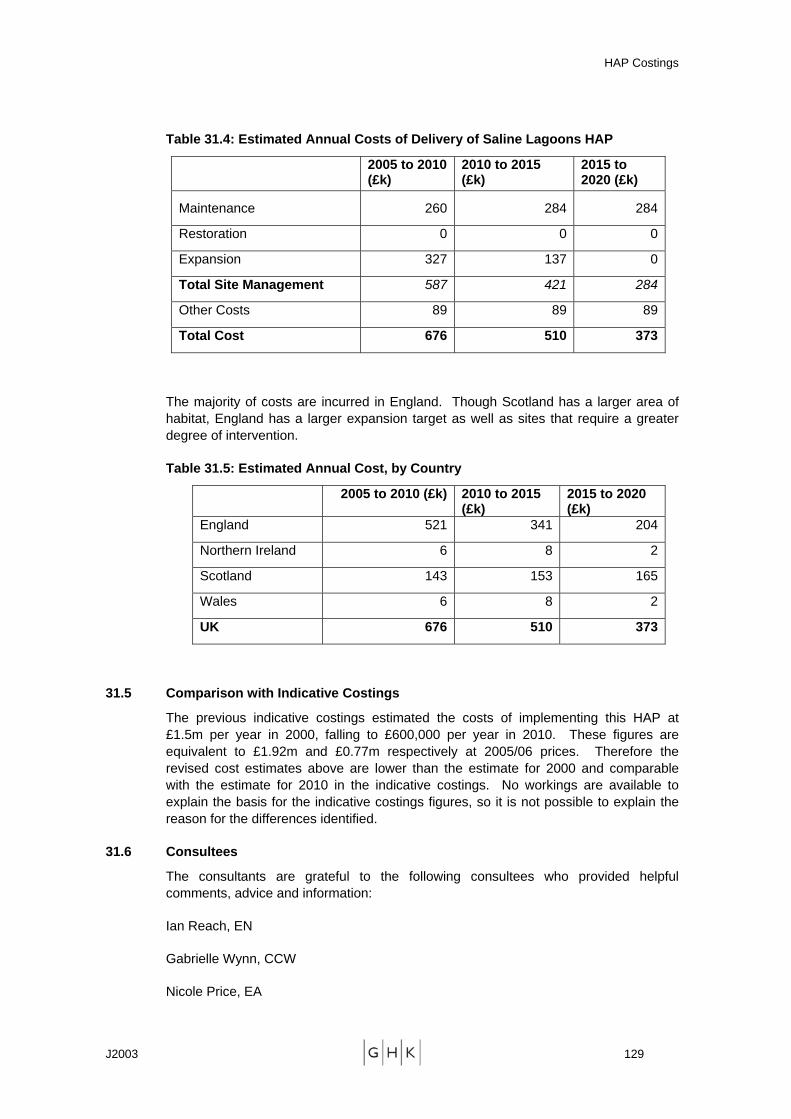
HAP Costings
J2003 129
Table 31.4: Estimated Annual Costs of Delivery of Saline Lagoons HAP
2005 to 2010 (£k)
2010 to 2015 (£k)
2015 to 2020 (£k)
Maintenance 260 284 284
Restoration 0 0 0
Expansion 327 137 0
Total Site Management 587 421 284
Other Costs 89 89 89
Total Cost 676 510 373
The majority of costs are incurred in England. Though Scotland has a larger area of habitat, England has a larger expansion target as well as sites that require a greater degree of intervention.
Table 31.5: Estimated Annual Cost, by Country
2005 to 2010 (£k) 2010 to 2015 (£k)
2015 to 2020 (£k)
England 521 341 204
Northern Ireland 6 8 2
Scotland 143 153 165
Wales 6 8 2
UK 676 510 373
31.5 Comparison with Indicative Costings
The previous indicative costings estimated the costs of implementing this HAP at £1.5m per year in 2000, falling to £600,000 per year in 2010. These figures are equivalent to £1.92m and £0.77m respectively at 2005/06 prices. Therefore the revised cost estimates above are lower than the estimate for 2000 and comparable with the estimate for 2010 in the indicative costings. No workings are available to explain the basis for the indicative costings figures, so it is not possible to explain the reason for the differences identified.
31.6 Consultees
The consultants are grateful to the following consultees who provided helpful comments, advice and information:
Ian Reach, EN
Gabrielle Wynn, CCW
Nicole Price, EA

HAP Costings
J2003 130
Ian Dickie, RSPB
Peter Robertson, RSPB
HAP Costings
J2003 131
32 MARINE HAPS
32.1 Method
This section refers to the costs of 12 marine HAPs:
Seagrass beds
Lophelia pertusa reefs
Modiolus modiolus beds
Sabellaria spinulosa reefs
Sabellaria alveolata reefs
Serpulid reefs
Maerl beds
Tidal rapids
Littoral and sublittoral chalk reefs
Sublittoral sands and gravels
Mud habitats of deep water
Sheltered muddy gravels
These have been costed collectively, because many of the actions required to deliver them will benefit more than one marine habitat. As a result they are most cost effectively delivered as a package for the marine HAPs as a whole.
The costs of delivering the marine HAPs have been assessed by identifying, in conjunction with lead partners, a package of measures necessary for the delivery of the HAPs, and assessing the overall costs of delivering that package. There is a considerable degree of uncertainty in assessing the costs, since the appropriate scale of action is often difficult to gauge and in some cases somewhat open-ended.9
9 The costings for these HAPs have been somewhat hindered by the fact that the relevant post at English Nature, the lead partner for four HAPs (sabellaria alveolata reefs, sabellaria spinulosa reefs, sublittoral sands and gravels and littoral and sub-littoral chalk) was vacant at the time of the costings work.

HAP Costings
J2003 132
32.2 Revised Targets
Revised targets for the marine HAPs are currently not available. This reflects the difficulty of setting targets for habitats for which the full extent and distribution are unknown.
32.3 Unit Costs
The unit costs of delivering the 12 marine HAPs are estimated in Table 32.1.
Table 32.1: Unit Costs of Marine HAP Delivery
Item Unit Cost Notes
Seabed Survey £100m Full seabed survey of UK waters, to be undertaken over 10 year period. Assume 50% of this is attributable to BAP.
Staff Resources £60k Per FTE job, including all costs, for policy/advisory/co-ordination work.
Research – PhD studies £100k Per PhD study (minimum)
Research £100k Annual budget for contract research
Monitoring £100k Annual budget for targeted monitoring of particular sites and habitats
Publications £5k Budget per HAP per five years
32.4 Cost Estimates
Based on the assumed unit costs above, and the levels of resourcing set out in the Annex, the annual costs of delivering the 12 marine HAPs are estimated as follows (Table 32.2).
Table 32.2: Estimated Annual Cost of Delivering Marine HAPs (£k)
2005 to 2010
2010 to 2015
2015 to 2020
2020 to 2030
Seabed survey 5000 5000 0 0 Policy and legislative 180 180 180 180 Advisory and communications
240 240 240 240
Research 300 200 200 200 Monitoring 100 100 100 100 Publications 12 12 12 12 Coordination 180 180 180 180 Total 6012 5912 912 912
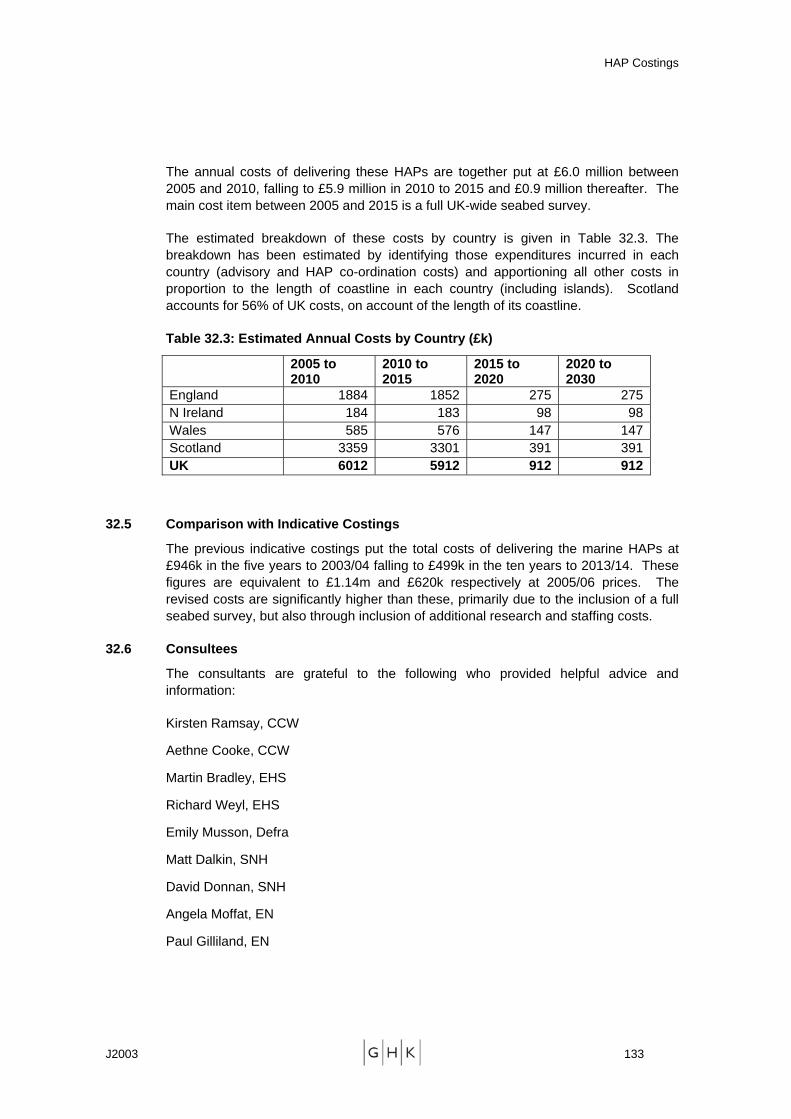
HAP Costings
J2003 133
The annual costs of delivering these HAPs are together put at £6.0 million between 2005 and 2010, falling to £5.9 million in 2010 to 2015 and £0.9 million thereafter. The main cost item between 2005 and 2015 is a full UK-wide seabed survey.
The estimated breakdown of these costs by country is given in Table 32.3. The breakdown has been estimated by identifying those expenditures incurred in each country (advisory and HAP co-ordination costs) and apportioning all other costs in proportion to the length of coastline in each country (including islands). Scotland accounts for 56% of UK costs, on account of the length of its coastline.
Table 32.3: Estimated Annual Costs by Country (£k)
2005 to 2010
2010 to 2015
2015 to 2020
2020 to 2030
England 1884 1852 275 275 N Ireland 184 183 98 98 Wales 585 576 147 147 Scotland 3359 3301 391 391 UK 6012 5912 912 912
32.5 Comparison with Indicative Costings
The previous indicative costings put the total costs of delivering the marine HAPs at £946k in the five years to 2003/04 falling to £499k in the ten years to 2013/14. These figures are equivalent to £1.14m and £620k respectively at 2005/06 prices. The revised costs are significantly higher than these, primarily due to the inclusion of a full seabed survey, but also through inclusion of additional research and staffing costs.
32.6 Consultees
The consultants are grateful to the following who provided helpful advice and information:
Kirsten Ramsay, CCW
Aethne Cooke, CCW
Martin Bradley, EHS
Richard Weyl, EHS
Emily Musson, Defra
Matt Dalkin, SNH
David Donnan, SNH
Angela Moffat, EN
Paul Gilliland, EN
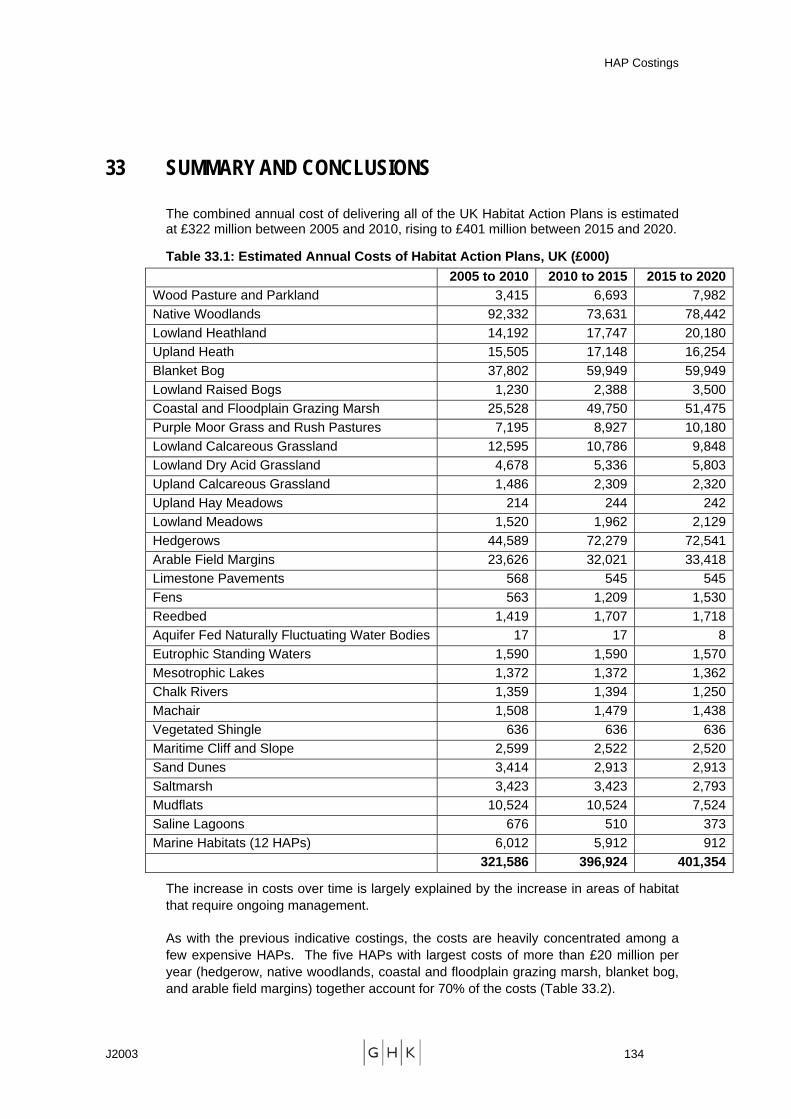
HAP Costings
J2003 134
33 SUMMARY AND CONCLUSIONS
The combined annual cost of delivering all of the UK Habitat Action Plans is estimated at £322 million between 2005 and 2010, rising to £401 million between 2015 and 2020.
Table 33.1: Estimated Annual Costs of Habitat Action Plans, UK (£000) 2005 to 2010 2010 to 2015 2015 to 2020Wood Pasture and Parkland 3,415 6,693 7,982Native Woodlands 92,332 73,631 78,442Lowland Heathland 14,192 17,747 20,180Upland Heath 15,505 17,148 16,254Blanket Bog 37,802 59,949 59,949Lowland Raised Bogs 1,230 2,388 3,500Coastal and Floodplain Grazing Marsh 25,528 49,750 51,475Purple Moor Grass and Rush Pastures 7,195 8,927 10,180Lowland Calcareous Grassland 12,595 10,786 9,848Lowland Dry Acid Grassland 4,678 5,336 5,803Upland Calcareous Grassland 1,486 2,309 2,320Upland Hay Meadows 214 244 242Lowland Meadows 1,520 1,962 2,129Hedgerows 44,589 72,279 72,541Arable Field Margins 23,626 32,021 33,418Limestone Pavements 568 545 545Fens 563 1,209 1,530Reedbed 1,419 1,707 1,718Aquifer Fed Naturally Fluctuating Water Bodies 17 17 8Eutrophic Standing Waters 1,590 1,590 1,570Mesotrophic Lakes 1,372 1,372 1,362Chalk Rivers 1,359 1,394 1,250Machair 1,508 1,479 1,438Vegetated Shingle 636 636 636Maritime Cliff and Slope 2,599 2,522 2,520Sand Dunes 3,414 2,913 2,913Saltmarsh 3,423 3,423 2,793Mudflats 10,524 10,524 7,524Saline Lagoons 676 510 373Marine Habitats (12 HAPs) 6,012 5,912 912 321,586 396,924 401,354
The increase in costs over time is largely explained by the increase in areas of habitat that require ongoing management.
As with the previous indicative costings, the costs are heavily concentrated among a few expensive HAPs. The five HAPs with largest costs of more than £20 million per year (hedgerow, native woodlands, coastal and floodplain grazing marsh, blanket bog, and arable field margins) together account for 70% of the costs (Table 33.2).
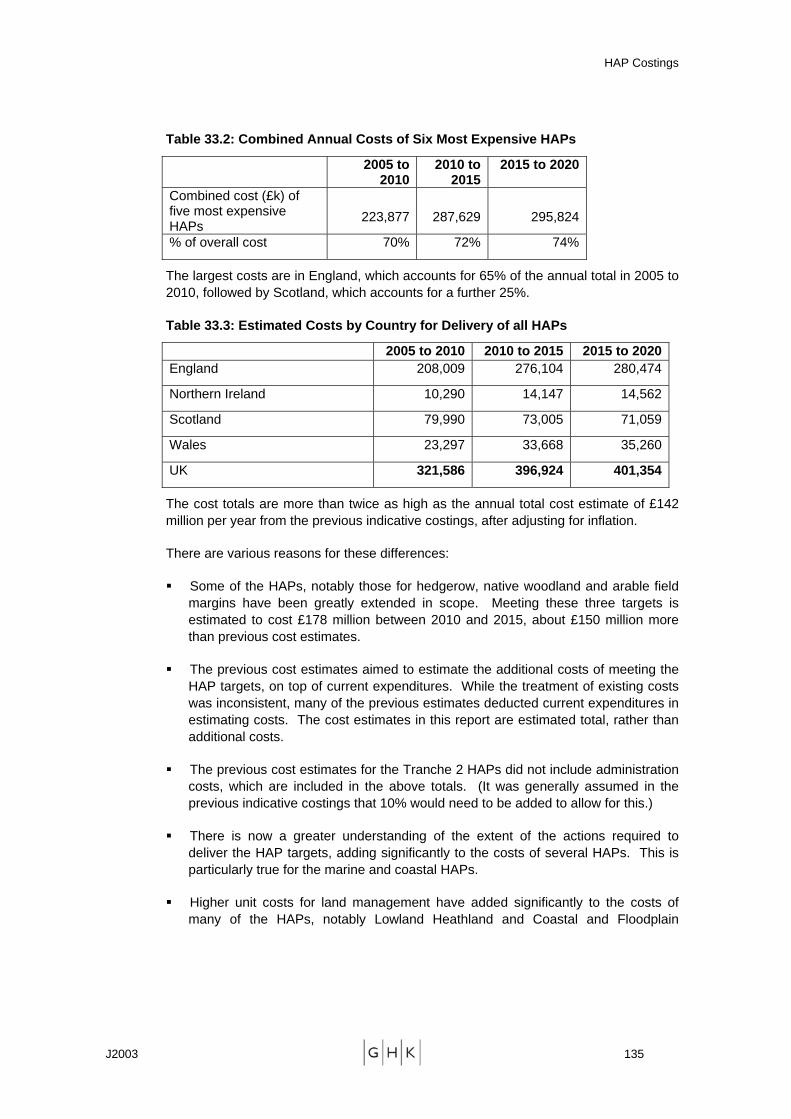
HAP Costings
J2003 135
Table 33.2: Combined Annual Costs of Six Most Expensive HAPs
2005 to 2010
2010 to 2015
2015 to 2020
Combined cost (£k) of five most expensive HAPs
223,877 287,629 295,824
% of overall cost 70% 72% 74%
The largest costs are in England, which accounts for 65% of the annual total in 2005 to 2010, followed by Scotland, which accounts for a further 25%.
Table 33.3: Estimated Costs by Country for Delivery of all HAPs
2005 to 2010 2010 to 2015 2015 to 2020England 208,009 276,104 280,474
Northern Ireland 10,290 14,147 14,562
Scotland 79,990 73,005 71,059
Wales 23,297 33,668 35,260
UK 321,586 396,924 401,354
The cost totals are more than twice as high as the annual total cost estimate of £142 million per year from the previous indicative costings, after adjusting for inflation.
There are various reasons for these differences:
Some of the HAPs, notably those for hedgerow, native woodland and arable field margins have been greatly extended in scope. Meeting these three targets is estimated to cost £178 million between 2010 and 2015, about £150 million more than previous cost estimates.
The previous cost estimates aimed to estimate the additional costs of meeting the HAP targets, on top of current expenditures. While the treatment of existing costs was inconsistent, many of the previous estimates deducted current expenditures in estimating costs. The cost estimates in this report are estimated total, rather than additional costs.
The previous cost estimates for the Tranche 2 HAPs did not include administration costs, which are included in the above totals. (It was generally assumed in the previous indicative costings that 10% would need to be added to allow for this.)
There is now a greater understanding of the extent of the actions required to deliver the HAP targets, adding significantly to the costs of several HAPs. This is particularly true for the marine and coastal HAPs.
Higher unit costs for land management have added significantly to the costs of many of the HAPs, notably Lowland Heathland and Coastal and Floodplain

HAP Costings
J2003 136
Grazing Marsh. These reflect higher agri-environment payment rates, notably under the English Higher Level Stewardship Scheme10.
The revised costings include some items not included in the previous cost estimates. For example, the costs of meeting the targets for mudflat creation were not included in the previous estimates but add an additional £10.5 million to the estimated annual costs between 2005 and 2015.
10 The previous work by Shepherd et al (2002) also found that the indicative costings had underestimated unit costs for various HAPs, including reedbed, hedgerows, cereal field margins and purple moor grass and rush pastures.
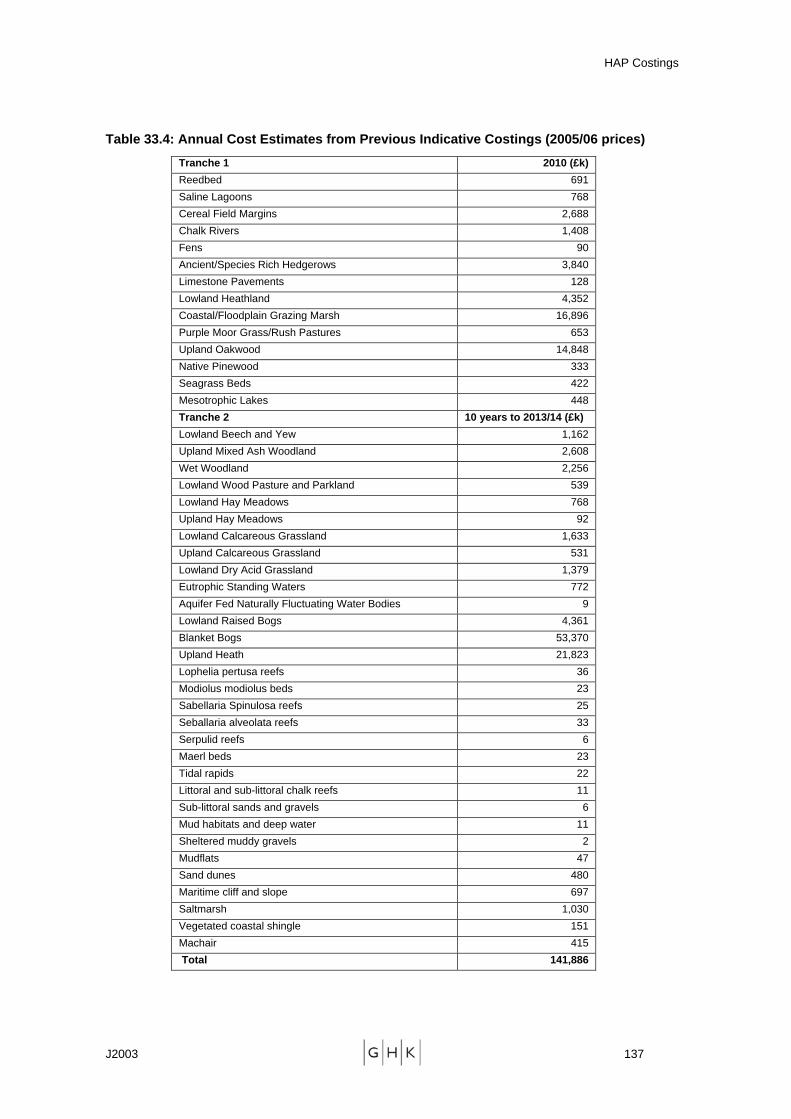
HAP Costings
J2003 137
Table 33.4: Annual Cost Estimates from Previous Indicative Costings (2005/06 prices) Tranche 1 2010 (£k) Reedbed 691 Saline Lagoons 768 Cereal Field Margins 2,688 Chalk Rivers 1,408 Fens 90 Ancient/Species Rich Hedgerows 3,840 Limestone Pavements 128 Lowland Heathland 4,352 Coastal/Floodplain Grazing Marsh 16,896 Purple Moor Grass/Rush Pastures 653 Upland Oakwood 14,848 Native Pinewood 333 Seagrass Beds 422 Mesotrophic Lakes 448 Tranche 2 10 years to 2013/14 (£k) Lowland Beech and Yew 1,162 Upland Mixed Ash Woodland 2,608 Wet Woodland 2,256 Lowland Wood Pasture and Parkland 539 Lowland Hay Meadows 768 Upland Hay Meadows 92 Lowland Calcareous Grassland 1,633 Upland Calcareous Grassland 531 Lowland Dry Acid Grassland 1,379 Eutrophic Standing Waters 772 Aquifer Fed Naturally Fluctuating Water Bodies 9 Lowland Raised Bogs 4,361 Blanket Bogs 53,370 Upland Heath 21,823 Lophelia pertusa reefs 36 Modiolus modiolus beds 23 Sabellaria Spinulosa reefs 25 Seballaria alveolata reefs 33 Serpulid reefs 6 Maerl beds 23 Tidal rapids 22 Littoral and sub-littoral chalk reefs 11 Sub-littoral sands and gravels 6 Mud habitats and deep water 11 Sheltered muddy gravels 2 Mudflats 47 Sand dunes 480 Maritime cliff and slope 697 Saltmarsh 1,030 Vegetated coastal shingle 151 Machair 415 Total 141,886
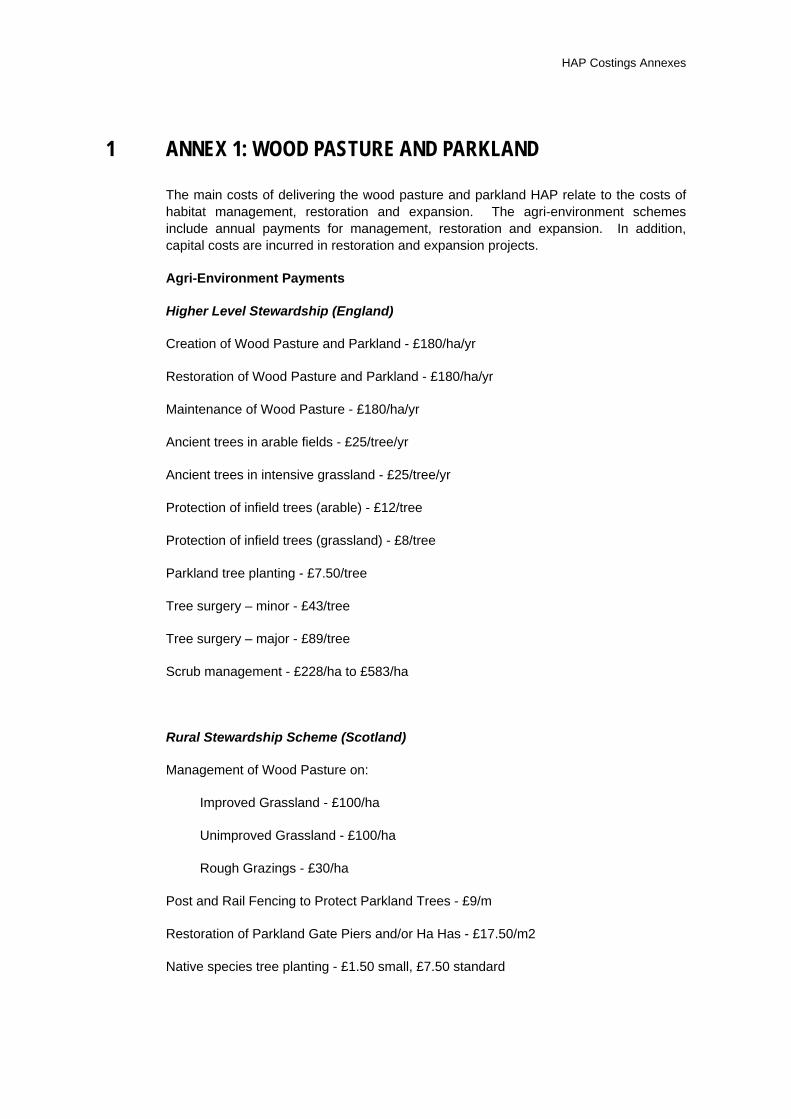
HAP Costings Annexes
1 ANNEX 1: WOOD PASTURE AND PARKLAND
The main costs of delivering the wood pasture and parkland HAP relate to the costs of habitat management, restoration and expansion. The agri-environment schemes include annual payments for management, restoration and expansion. In addition, capital costs are incurred in restoration and expansion projects.
Agri-Environment Payments
Higher Level Stewardship (England)
Creation of Wood Pasture and Parkland - £180/ha/yr
Restoration of Wood Pasture and Parkland - £180/ha/yr
Maintenance of Wood Pasture - £180/ha/yr
Ancient trees in arable fields - £25/tree/yr
Ancient trees in intensive grassland - £25/tree/yr
Protection of infield trees (arable) - £12/tree
Protection of infield trees (grassland) - £8/tree
Parkland tree planting - £7.50/tree
Tree surgery – minor - £43/tree
Tree surgery – major - £89/tree
Scrub management - £228/ha to £583/ha
Rural Stewardship Scheme (Scotland)
Management of Wood Pasture on:
Improved Grassland - £100/ha
Unimproved Grassland - £100/ha
Rough Grazings - £30/ha
Post and Rail Fencing to Protect Parkland Trees - £9/m
Restoration of Parkland Gate Piers and/or Ha Has - £17.50/m2
Native species tree planting - £1.50 small, £7.50 standard
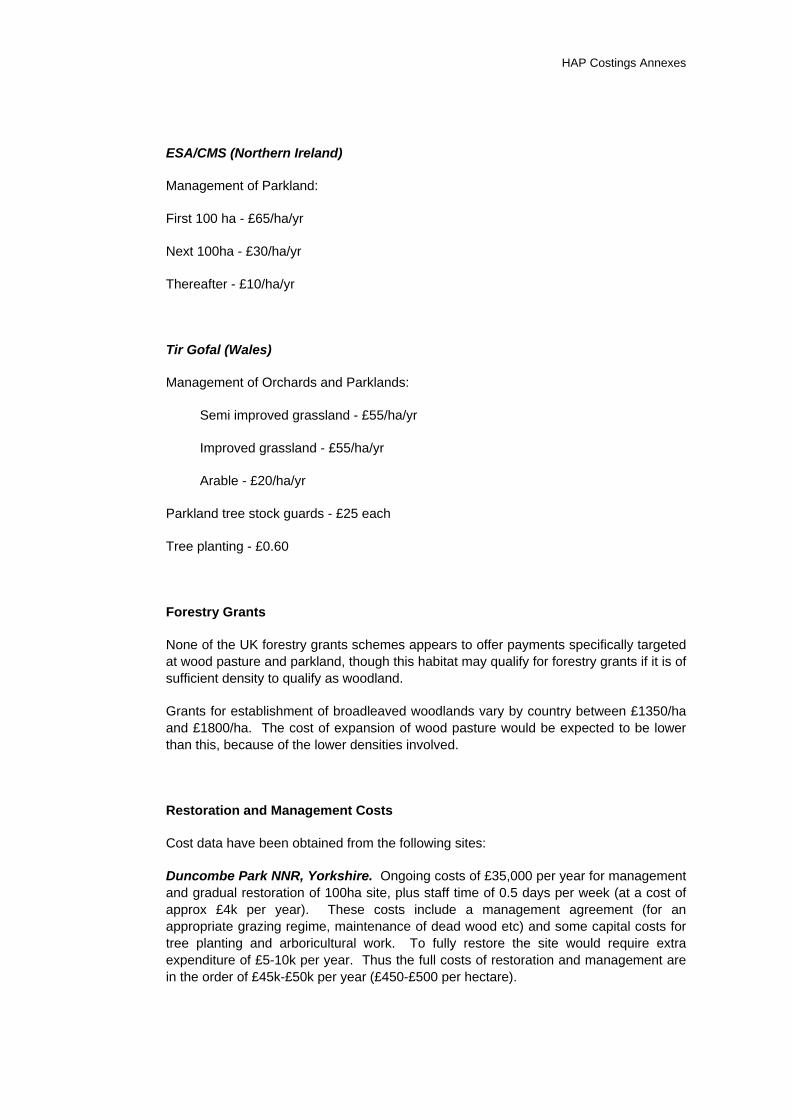
HAP Costings Annexes
ESA/CMS (Northern Ireland)
Management of Parkland:
First 100 ha - £65/ha/yr
Next 100ha - £30/ha/yr
Thereafter - £10/ha/yr
Tir Gofal (Wales)
Management of Orchards and Parklands:
Semi improved grassland - £55/ha/yr
Improved grassland - £55/ha/yr
Arable - £20/ha/yr
Parkland tree stock guards - £25 each
Tree planting - £0.60
Forestry Grants
None of the UK forestry grants schemes appears to offer payments specifically targeted at wood pasture and parkland, though this habitat may qualify for forestry grants if it is of sufficient density to qualify as woodland.
Grants for establishment of broadleaved woodlands vary by country between £1350/ha and £1800/ha. The cost of expansion of wood pasture would be expected to be lower than this, because of the lower densities involved.
Restoration and Management Costs
Cost data have been obtained from the following sites:
Duncombe Park NNR, Yorkshire. Ongoing costs of £35,000 per year for management and gradual restoration of 100ha site, plus staff time of 0.5 days per week (at a cost of approx £4k per year). These costs include a management agreement (for an appropriate grazing regime, maintenance of dead wood etc) and some capital costs for tree planting and arboricultural work. To fully restore the site would require extra expenditure of £5-10k per year. Thus the full costs of restoration and management are in the order of £45k-£50k per year (£450-£500 per hectare).

HAP Costings Annexes
Castle Hill – Yorkshire. Restoration at Castle Hill involves removal of conifers and restoration of wood pasture habitats. FE has estimated the costs of development of infrastructure, trails and rides, vegetation management and planting at £415,000 per year for 200 hectare site, at an average of £2075 per hectare – this excludes costs of staff time, grazing, fencing and arboriculture. The net cost will vary in response to changes in timber prices and revenues. Ongoing management will require grazing – costs are expected to be met largely from EN/HLS grants.
Hatch Park, Kent. This site has 1500 veteran hornbeam pollards, and covers an area of 27 hectares. Work has involved:
A detailed survey and categorisation of the trees (cost £12k)
A training programme in repollarding (cost £3k)
Repollarding work at a minimum cost of £200 per tree. £20k per year has been set aside to cover this cost, at a total cost of £300k over 15 years. After this period the pollarding process will recommence on a 15 year cycle. The cost also covers the cost of “haloing” each tree – i.e removing scrub from around it. The cost of removing all scrub from 16 hectares of the site has been put at £10k (the remaining 11 ha having already been cleared). Thus annual management costs are at least £833 per hectare and there are additional restoration costs (for scrub clearance) of £625 per hectare. There may also be additional costs in erecting deer fences and restoring deer grazing.
National Trust projects in East Anglia:
Hatfield Forest National Nature Reserve, Essex. This project involved restoration of wood pasture from scrub with creation of maiden pollards.
• Project covered an area of 10 hectares (1 ha/yr over 10 yrs, 2003-10). Whole site is 400ha, with 150 ha wood pasture.
• Countryside Stewardship Scheme, funds £550 per ha for scrub removal, plus £880 per year for creation of 40 maiden pollards/yr. Suggests grant payment of £1430 per year over 10 years, capital cost of £1430 per hectare.
• CSS does not cover full costs, for the staffing, fencing, livestock handling, tree management, estimated to be 2x the grant aid every year. The tree management is especially expensive involving tree climbing and skilled chainsaw work. This suggests actual capital costs in the order of £2860 per hectare.
Other NT projects at Felbrigg Estate, Norfolk (deer park restoration) and Ickworth Park, Suffolk (parkland re-creation) have also benefited from funding under Countryside Stewardship. Cost estimates are not available but the NT estimates that CS covered the costs of the Ickworth project, but that at Felbrigg costs were 50-100% higher than the grant received.
The above projects suggest an average capital cost of restoration of £1700/ha.
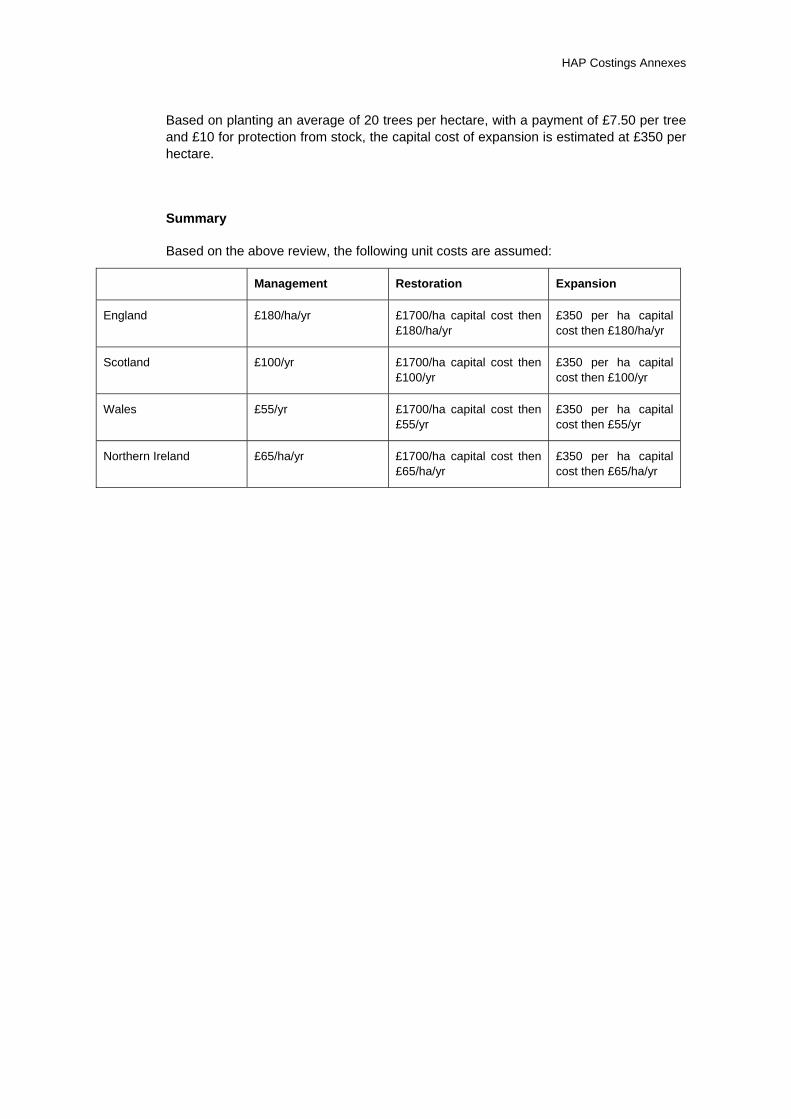
HAP Costings Annexes
Based on planting an average of 20 trees per hectare, with a payment of £7.50 per tree and £10 for protection from stock, the capital cost of expansion is estimated at £350 per hectare.
Summary
Based on the above review, the following unit costs are assumed:
Management Restoration Expansion
England £180/ha/yr £1700/ha capital cost then £180/ha/yr
£350 per ha capital cost then £180/ha/yr
Scotland £100/yr £1700/ha capital cost then £100/yr
£350 per ha capital cost then £100/yr
Wales £55/yr £1700/ha capital cost then £55/yr
£350 per ha capital cost then £55/yr
Northern Ireland £65/ha/yr £1700/ha capital cost then £65/ha/yr
£350 per ha capital cost then £65/ha/yr

HAP Costings Annexes
2 ANNEX 2: NATIVE WOODLANDS Assessing the Costs of Land Management
The indicative costings are based entirely on habitat management, enhancement and restoration costs. Woodland grant schemes provide the main vehicle for meeting these costs, and it follows that payment rates available under schemes in the different UK countries are one of the key variables affecting the costings. Other land management schemes, such as Tir Gofal in Wales, ESAs and the Countryside Management Scheme in Northern Ireland, and SSSI management agreements also contribute to HAP delivery. Also relevant are expenditures in the management of state forests. Since data on the latter are patchy, payment rates under woodland grant schemes can be used as a proxy for public sector as well as private sector costs.
Restoration Costs
Restoration costs which involve conversion of plantations are highly variable, and depend on the age of the plantations to be converted. Where trees are immature there is a significant opportunity cost associated with conversion, whereas for mature trees conversion is more akin to restocking. The costs of restoration of plantations on ancient woodland sites in Northern Ireland have been put at £5,000 per hectare.
For Scotland, figures provided by Highland Birchwoods for the EU Atlantic Oakwoods LIFE project indicate a cost of £333,000 for restoration of 712 ha of oakwood, an average cost of just under £470 per hectare. The latter covered a variety of operations including rhododendron control, removal of exotic conifers, bracken control and deer fencing. The costs of different operations were highly variable, being highest for conversion of conifer plantations, at up to £4300 per hectare.
For Wales, the Forestry Commission has provided standardised estimates of the costs of restoration, maintenance and expansion of ancient woodland sites in different conditions over a 15 year period. These suggest an annual maintenance cost of £124 per hectare per year. Restoration costs are highly variable, ranging from £2,100 to almost £6,900 over a 15 year period.
5
HAP Costings Annexes
A paper by Pryor and Jackson for the Woodland Trust estimated the cost of restoring plantations on woodland sites in the UK at £2,510/ha for commercial conifers, £3,790/ha for productive hardwoods, £1,680/ha for low cost broadleaves and £2,430/ha for shelterwood with natural regeneration, over a period of 5-9 years. The average across these woodland types was £2,602/ha.
Current Grant Rates
England
Proposed revisions to Woodland Grants in England are set out in the EWGS Consultation Document1 and include the following payments:
Woodland Planning Grant. One-off payment of £10/ha for first 100 ha and £5/ha thereafter for preparation of management plan, linked to UK Woodland Assurance Standard
Woodland Assessment Grant. One off grant to fund costs of an assessment to inform management plan, funded at 80% of cost. Includes ecological, landscape, historic/cultural heritage and stakeholder assessments, where appropriate.
Woodland Management Grant. Annual management payment designed to secure the existing environmental and social public benefits and creating the conditions under which the woodland can continue to deliver benefits into the future, by supporting generic, low key, sustainable practices, including a variety of practices that will benefit biodiversity. Payment rate is £30/ha.
Woodland Regeneration Grant. Grants for regeneration of woodlands at the restocking stage, payable at 50-80% of costs for native species on ancient woodland sites.
Woodland Improvement Grant. Grant contribution towards work to create, enhance and sustain the social, environmental and economic public benefits that woodlands provide. Payable initially at 50% of agreed capital costs.
Woodland Creation Grant. Payable at a rate of £1800 per hectare for creation of native broadleaved woodland, with additional supplements for public access and for woodland created close to centres of population and in national and community forest areas.
Farm Woodland Premium. Supplement to WCG to cover agricultural income foregone, payable at £60 per hectare for unimproved land, £140-£260/ha for improved land, and £160-£300/ha for arable land (depending on location within or outside less favoured areas).
EN estimates indicate an average of £75 per hectare for upland oakwoods in SSSI management agreements in 2003/4.
The new Higher Level Stewardship Scheme offers the following annual payments for woodlands, over a 10 year agreement:
1 Forestry Commission/Defra (2003) The English Woodland Grant Scheme. Consultation Document. www.forestry.gov.uk
6
HAP Costings Annexes
Maintenance of woodland - £100 ha
Restoration of woodland - £100 ha
Creation of woodland in the LFA - £200 ha
Creation of woodland outside of the LFA - £315 ha
Woodland livestock exclusion supplement - £100 ha
Scotland
The Scottish Forestry Grants Scheme offers payments as follows:
Expansion – payable at 90% of cost for native woodlands
Farmland Premium – supplement to expansion grant payable at £60 per hectare for unimproved land, £160/ha in Severely Disadvantaged Areas, £230/ha in Disadvantaged Areas, and £300/ha for farmland outside LFAs.
Restocking – payable at 90% of cost for native woodlands
Stewardship – payable at 90% of cost for native woodlands.
Forestry Commission records indicate that the average agreement for native woodland expansion in 2004/5 was £1539 per hectare. Unfortunately, no similar data are currently available for restoration and management.
The SFGS literature sets out standard costs for different operations as a basis for calculating grant payments. These data refer to a wide variety of operations, and it would be difficult to identify standardised per hectare costs without knowledge of the areas of land in need of different types of action.
The Rural Stewardship Scheme offers payments of £100 per hectare per year for management of native or semi-natural woodland. Capital payments are also available for tree planting (on a per tree basis), stock fencing, rhododendron control etc.
Wales
A new system of grants is due to be introduced. Payment rates under the old Woodland Grant Scheme are:
Planting - £1350 per hectare for planting broadleaves (<10ha) or £1050/ha for more than 10 ha. Supplements of £600 per ha are made for improved land and £900/ha for community woodlands.
Farm Woodland Premium Scheme – similar rates as in England.
Native Woodland Expansion Challenge – additional payment of £1500/ha for native woodland expansion for limited time period.
Annual management grant - £35/ha
Regeneration – payable at 50% of costs plus a fixed payment equivalent to the rate for restocking (£525/ha for broadleaves).
Woodland Improvement Grant – including grants for woodland biodiversity – 50% of costs.
7
HAP Costings Annexes
The Tir Gofal scheme offers the following management payments for broadleaved farm woodlands:
Stock excluded - £125/ha;
Light grazing - £95/ha;
Heavy grazing - £10/ha.
The payments are largely designed to compensate for the costs and income foregone in excluding livestock from woodlands.
Tir Gofal offers capital payments of £1600/ha for broadleaved woodland establishment, plus annual management payments over 10 years as follows:
Restoration of Plantations - £140/ha/yr
Plant New Woodland - £140/ha/yr
Natural Regeneration - £140/ha/yr.
Northern Ireland
Woodland grant rates are similar to those for Wales, above.
The ESA and CMS schemes offer payment rates of £95 per hectare for management of broadleaved farm woodlands.
Summary
A wide range of payments are available for expansion, restoration and management of native woodlands in different countries of the UK:
Management – typical payment rates are £95-£140 per hectare per year for farm woodlands and £30-£35 per hectare per year under woodland grant schemes. English Nature figures suggest average annual payments of £75/ha for upland oakwoods in SSSI management agreements.
Expansion – payment rates vary from £1000 to £1800 per hectare. Where natural regeneration is involved, payments are typically based on costs incurred. This is followed by an annual payment of £60-£315 per hectare to compensate for farm income foregone.
Restoration – costs are highly variable according to sites and the work required. Capital costs have been put at £5000 per hectare for plantations on ancient woodland sites in Northern Ireland; at an average of £470 per hectare in Scotland; at between £2,100 and £6,900 per hectare in Wales; and at £1680 to £3790/ha in the UK. On sites where timber is due to be harvested, costs will be similar to those for restocking.
Based on this review, appropriate per hectare cost rates for the UK as a whole might be as follows:
Establishment - £1500 per hectare followed by £200 per hectare annual payment for 10 years;
Restoration - £3,000 per hectare over 10 years;
8
HAP Costings Annexes
Management - £75 per hectare per year.
Other Costs
Apart from costs of habitat management, restoration and expansion, significant (but unquantified) costs include:
Research – FC is expecting to commission research into upland woodlands to inform the development of management strategies
Survey work – A native woodlands survey is planned for Scotland which is expected to provide more accurate estimates of the extent of the resource in 5-6 years time.
Management guidelines – FC is updating guidelines for management of private woodlands and these need to take account of needs of this and other HAPs
Monitoring – including ongoing management of FC forests and wider initiatives such as development and updating of the national inventory of woods and trees to provide better information about BAP habitats. Cost will be significant (tens of thousands of pounds).
Officer time – there have been substantial but unquantified time inputs in implementation, reporting, target reviews etc, involving both lead partner and country leads.
While the latter category relates specifically to this HAP, other elements are wider FC initiatives relevant to this and other HAPs, so HAP related costs are difficult to isolate.
While an assessment of the costs attributable to this HAP is not possible at this stage, they are expected to amount to less than 5% of land management costs.
Consultees noted that, while the costs of staff time in engaging in the BAP process are relatively small compared to the likely overall costs of the HAP, provision of adequate funding for core staff time is critical in overall plan delivery, and in the process of securing resources for the plan as a whole.
9
HAP Costings Annexes
3 ANNEX 3: LOWLAND HEATHLAND
Restoration and Management Costs
The indicative costings assumed management and enhancement costs of £95/ha/yr and re-establishment costs of £300/ha.
One consultee commented that costs of re-establishment used in the indicative costings are too low, underestimating costs of work that needs to be undertaken before heathland can be managed.
Figures from Tomorrow’s Heathland Heritage work in Pembrokeshire suggest an average cost of £10,000 of restoration work is required per site, with sites averaging 20-40 hectares in size. This suggests an average capital cost of £333 per hectare, for capital works such as fencing and scrub removal. The figures vary per site, and are particularly high where there is a need to install cattle grids (at an average cost of about £10,000 each). Site restoration works account for around 50% of the £500k cost of the project, with central costs including the employment of the project officer, machinery costs (£17,000) and other overheads amounting to £250,000. Inclusion of these central costs effectively doubles the cost of heathland restoration to £666 per hectare. Tir Gofal offers suitable payments for ongoing management of restored heathland, but is less suited to securing capital works as grants do not cover 100% of costs.
Figures used in the Northern Ireland BAP costings for management and improvement are much lower, at £37.50/ha/yr, but are taken from upland agri-environment scheme payments.
The costs of re-establishment are highly variable depending on the existing use of the land (forestry, agriculture or mineral sites), and on local conditions. The RSPB Heathland Management Handbook notes that work rates can be influenced by:
The density of the management issue; for example the number and size of trees
Working conditions; steep, boggy, or stony ground, ditches, slit trenches and other obstacles, and debris will all slow work rates
The ease of access to the management area; across steep, boggy, or stony ground
The sensitivity of the habitat which influences the care that needs to be taken, eg to preserve heather structure.
Table A3.1 below gives examples of the costs per hectare of selected heathland management operations, based on RSPB experience in Dorset, where a directly-employed labour force is used, which is trained and certified for the equipment used.
10
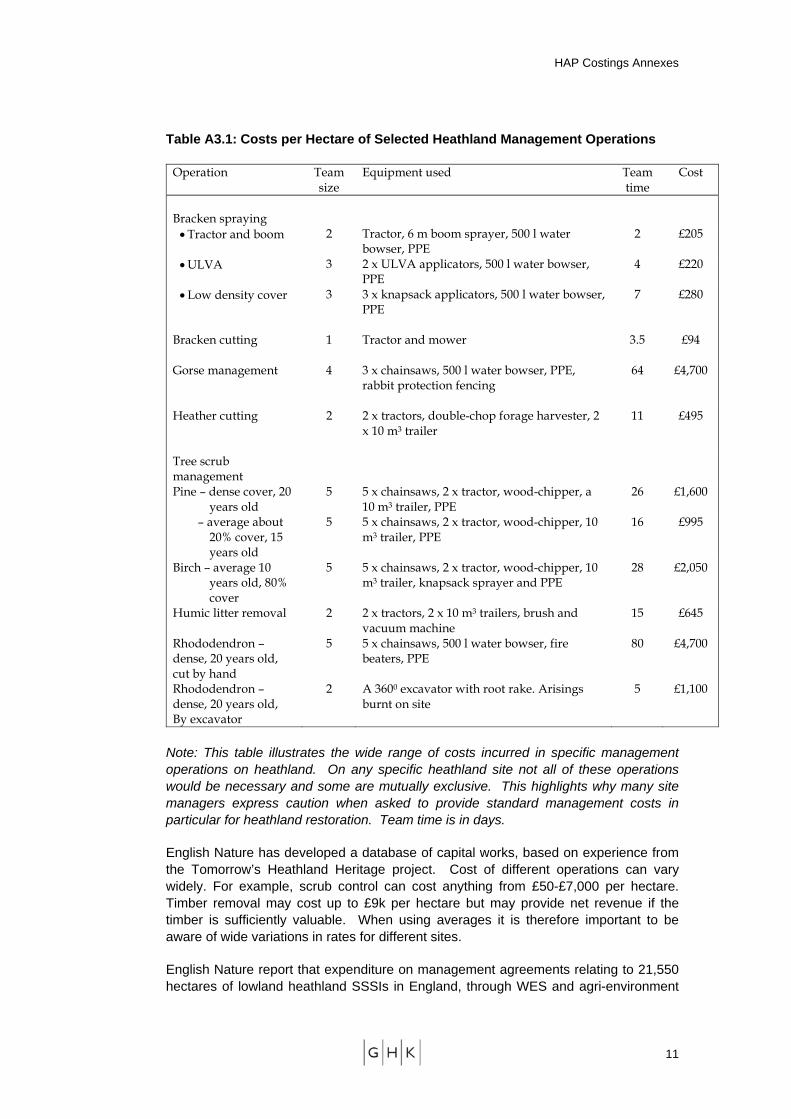
HAP Costings Annexes
Table A3.1: Costs per Hectare of Selected Heathland Management Operations
Operation Team size
Equipment used Team time
Cost
Bracken spraying
• Tractor and boom 2 Tractor, 6 m boom sprayer, 500 l water bowser, PPE
2 £205
• ULVA 3 2 x ULVA applicators, 500 l water bowser, PPE
4 £220
• Low density cover 3 3 x knapsack applicators, 500 l water bowser, PPE
7 £280
Bracken cutting 1 Tractor and mower
3.5 £94
Gorse management 4 3 x chainsaws, 500 l water bowser, PPE, rabbit protection fencing
64 £4,700
Heather cutting 2 2 x tractors, double-chop forage harvester, 2 x 10 m3 trailer
11 £495
Tree scrub management
Pine – dense cover, 20 years old
5 5 x chainsaws, 2 x tractor, wood-chipper, a 10 m3 trailer, PPE
26 £1,600
– average about 20% cover, 15 years old
5 5 x chainsaws, 2 x tractor, wood-chipper, 10 m3 trailer, PPE
16
£995
Birch – average 10 years old, 80% cover
5 5 x chainsaws, 2 x tractor, wood-chipper, 10 m3 trailer, knapsack sprayer and PPE
28 £2,050
Humic litter removal 2 2 x tractors, 2 x 10 m3 trailers, brush and vacuum machine
15 £645
Rhododendron – dense, 20 years old, cut by hand
5 5 x chainsaws, 500 l water bowser, fire beaters, PPE
80 £4,700
Rhododendron – dense, 20 years old, By excavator
2 A 3600 excavator with root rake. Arisings burnt on site
5 £1,100
Note: This table illustrates the wide range of costs incurred in specific management operations on heathland. On any specific heathland site not all of these operations would be necessary and some are mutually exclusive. This highlights why many site managers express caution when asked to provide standard management costs in particular for heathland restoration. Team time is in days.
English Nature has developed a database of capital works, based on experience from the Tomorrow’s Heathland Heritage project. Cost of different operations can vary widely. For example, scrub control can cost anything from £50-£7,000 per hectare. Timber removal may cost up to £9k per hectare but may provide net revenue if the timber is sufficiently valuable. When using averages it is therefore important to be aware of wide variations in rates for different sites.
English Nature report that expenditure on management agreements relating to 21,550 hectares of lowland heathland SSSIs in England, through WES and agri-environment
11
HAP Costings Annexes
schemes – totalled £1.56m in 2003/04 – at an average of £73 per hectare for management and restoration. The reported costs of maintenance and restoration were fairly even across sites in different condition, ranging from £61 to £77 per hectare.
Defra has estimated that current levels of expenditure on lowland heathland through agri-environment schemes in England amount to £3.0 million per year.
Agri-environment Payments
Since agri-environment schemes are a major vehicle for achieving heathland restoration and management, agri-environment payments form a useful basis for assessing unit costs. Relevant payments in different UK schemes are as follows.
In England, Higher Level Stewardship, payments are as follows (£ per ha per year for 10 year agreement):
Maintenance of lowland heathland £200
Restoration of heathland from neglected sites £200
Restoration of forestry areas to lowland heathland £200
Creation of lowland heathland from arable or improved grassland £450
Creation of lowland heathland on worked mineral sites £150.
The above are annual payments and provide compensation for ongoing management and opportunity costs, rather than the costs of restoration works themselves.
Additional capital payments are available for creation of the conditions to encourage heathland re-establishment (at 100% of costs). This may involve application of chemicals (such as sulphur), in order to create suitable soil conditions. Grants are also available at fixed payment rates for scrub and bracken clearance, as follows:
Scrub management – base payment £76.00 per agreement.
Scrub management – < 25% cover, £228.00 per ha
Scrub management – 25% -75% cover, £376.00 per ha
Scrub management – > 75% cover, £583.00 per ha
Mechanical bracken control – base payment £106.00 per agreement.
Mechanical bracken control – area payment £48.00 per ha.
Chemical bracken control – base payment £61.00 per agreement.
Chemical bracken control – area payment £112.00 per hectare.
Difficult site supplement £7.00.
In Scotland, lowland heathland receives an annual management payment of £115 per hectare under the Rural Stewardship Scheme. The rate for coastal heath is £80 per hectare. SNH has indicated that only a small proportion – say 20% - of the 18,888 ha of habitat would require management of this level – much is in low intensity management. In the west of Scotland there are large areas of habitat that are conditioned by winds and sea and low intensity grazing, and require no dedicated management regime. On the east coast, however, there is land in need of more
12
HAP Costings Annexes
intensive restoration and management – e.g. scrub and bracken control and management agreements involving a suitable grazing/cutting regime. In Orkney, a HLF funded heathland restoration project involves re-establishment on heath from improved grassland to join up lowland and upland heath – this involves significant opportunity cost plus nutrient stripping etc – at a cost of £1-2m for the project. Capital costs of heathland restoration can be higher than in England because of differences in topography, access etc.
In Wales, Tir Gofal offers a payment rate of £65 per hectare per year for management of lowland and coastal heath. Establishing new heathland on improved land attracts payments of £175/ha/yr. These payments are under review and may be decreased.
Tir Gofal also offers capital payments for specific works as follows:
Heather Burning £105/ha
Heather Restoration by Seed and Mulch £250/ha
Heather management (cutting) £60/ha
Establishing new heathland on acid grassland £70/ha
Establishing new heathland on coastal grassland and cliff £70/ha
Bracken control - £60/ha
Rhododendron control - £2000/ha
Invasive species control - £75/ha
Scrub clearance – mechanical cutting - £150/ha
Scrub-clearance – hand cutting - £600/ha
CCW comments that per hectare management costs are sufficient if farmers have stock and can be persuaded to use it on heathland, but the employment of staff to work with and advise them is as important as the payment rates themselves. Take up has been lower where no project officers are employed. Incentives to establish heathland on improved land are low and there is little take-up. Capital payments – including the cost of scrub clearance – are too low in many cases. A CCW project is examining the attitudes of farmers to heathland restoration.
In Northern Ireland, the ESA and CMS schemes do not offer standard payments for lowland heathland management. Heather moorland and lowland raised bog attract a rate of £50/ha for the first 100 ha, £25 per hectare for the next 100 ha, and £10 per ha thereafter. Lowland heathland in Northern Ireland is somewhat different to the lowland heathlands of southern England, and shares many similarities with upland moorland. The costs of heathland management are therefore likely to be similar to those for moorland.
13
HAP Costings Annexes
In all areas the difficulty of introducing the right management processes – such as the absence of suitable stock or difficulty of persuading farmers to introduce them – is a constraint.
Other Expenditures
Consultees indicate that habitat management represents a large proportion of overall costs. However, there are some potentially significant additional costs, including:
Costs of assessing condition of heathland outside SSSIs. Only 12% of the habitat is in SSSIs in Wales so these are major potential costs. EN is planning a sample survey to assess the condition of heathland outside SSSIs in England, and £50,000 has been allocated for this purpose.
Costs of a grazing experiment. The relative merits of different grazing regimes – using different types of stock at different times of year – are not known. EN has considered a grazing experiment but this has been shelved on cost grounds.
14
HAP Costings Annexes
4 ANNEX 4: UPLAND HEATH
Introduction
Delivery of the HAP for upland heathland involves site management work, aimed at maintaining sites in and restoring them to favourable condition, as well as expanding the habitat. Work is also required in the areas of research, monitoring, advice and dissemination of good practice in land management as well as general publicity about the habitat.
Scotland has the overwhelming majority of the habitat, and a significant presence of the habitat in the UK as a whole with ca. 1.7 million hectares. Even so, the habitat has undergone significant decline in the last 50 years, mainly due to agricultural intensification, heavy grazing by sheep (and in certain areas by red deer and cattle), and afforestation. Future decline is envisaged to derive from a transition to acid grassland if current grazing level and pressures continue. Other threats to the habitat include environmentally damaging (muir) burning regimes and bracken encroachment.
Maintenance
Maintenance of upland heathland requires establishment of an appropriate grazing and cutting regime, and the burning of heather on an 11-12 year cycle (although some, especially wetter, heath needs less or no burning at all). We assume that the costs of these activities can be met by annual agri-environment payments.
Annual agri-environment scheme payment rates available for maintenance of upland heathland are the following:
In England, the Higher Level Environmental Stewardship (HLES) Scheme pays £40 per hectare per year towards maintenance of upland heathland. A supplement is available for management of heather, gorse and grass by burning, cutting and swiping of £7 per hectare. Assuming 50% take-up of this option gives an estimated annual maintenance payment of £43.50 per hectare.
In Northern Ireland, the Countryside Management and the Environmentally Sensitive Areas Schemes (CMS/ESAS) pay £45/20/10 per hectare for management of upland heathland depending on the size of the heath. The majority of sites fall into the £45 payment band. The Management of Sensitive Sites (MOSS) scheme, which is designed to ensure the positive management of land within Areas of Special Scientific Interest, pays £50 per hectare. An average rate for the two schemes of £46 per hectare has been calculated based on the percentage of the habitat falling within ASSI land.
In Scotland, the Rural Stewardship Scheme offers £1 per hectare for moorland management. It also offers £11 for muirburn and heather swiping over a 10 year period. Assuming 50% take-up of this option gives an annual maintenance payment of £1.55/ha.
In Wales, Tir Gofal offers £50 per hectare for maintenance of upland heathland.
15
HAP Costings Annexes
Restoration
Restoration of upland heathland involves ensuring the right hydrology of the site by breaking up old drainage on wet heath, undertaking the appropriate heather burning, cutting and flailing, removal of trees and scrub, and adjusting the grazing regime to make it less intensive.
Under the overall heading of The Black Grouse Restoration Project a number of sites have been restored, and we base our costing of the operations and expenditure experienced by three of these. The type of restoration activities that the projects have involved are the following:
Bracken spraying
Reduction in conifer presence or felling of all trees on (a proportion of the) site
Re-spacing of conifers
Heaping of brash on certain parts of the site in order to suppress conifer re-growth
Gorse treatment involving cutting down and stump treating gorse bushes
Burning of heather
Mowing of heather
Wetting of parts of the heath
The costs of restoring the different sites vary depending on the extent of more expensive operations like tree and scrub removal. We have therefore chosen to use an average of £115 per hectare for the costs experienced at the three sites. As the sites were all dry upland heath the figure for wetting were comparatively small and we have therefore increased the average cost to £150 to reflect the costs of this practice on wet heath.
Agri-environment schemes offer capital payments towards some of the restoration activities listed above. In the case of Northern Ireland, we have not included payments available through the MOSS scheme as this does not operate fixed rates but offers a percentage of actual capital costs ranging from 60-100%. Some of the available capital payment options are listed in the maintenance section. Payment for hydrological management is as follows:
HLES (England) pays the following:
o Soil bund - £149/each
o Culvert - £153/each
o Timber sluice - £314/each
o Brick, stone or concrete sluice - £960/each
o Wind pump for water level measures – 80% of costs
o Construction of water penning structures – 80% of costs
o Grip blocking of drainage channels - £3.40/square meter
CMS/ESA (Northern Ireland) offers no payments towards water management
16
HAP Costings Annexes
Rural Stewardship Scheme (Scotland) the pays £100/dam for blocking ditches on lowland raised bogs and on created wetland
Tir Gofal (Wales), pays the following:
o Soil bunds - £35
o Timber sluices - £140
Payments for heather burning are:
CMS/ESA - £100/ha
Tir Gofal - £105/ha
Payments for heather cutting are:
Tir Gofal - £60/ha
Payments for scrub clearance are as follows:
HLES - £228-583/ha
ESGMS - £800-2,400/ha
Tir Gofal - £150-500/ha
Payments for bracken clearance are as follows:
HLES - £48-112/ha
CMS/ESAS - £140-260/ha
Rural stewardship Scheme - £120/ha
Tir Gofal - £50-120/ha
Following capital works the restored area become eligible for annual restoration payments. Annual agri-environment scheme payment rates available for restoration of upland heathland are the following:
In England, HLES pays £40 per hectare per year for restoration of moorland. There is a moorland re-wetting supplement of £10 per hectare. Assuming that this applies to 20% of the area and that a further 50% receives a burning supplement of £7/ha gives a weighted annual cost of £45.50/ha.
In Northern Ireland, no annual payment is available for restoration through either of the two schemes. However, we assume that to meet the restoration target it will be necessary to pay land managers some kind of annual management payment in addition to the capital costs. We have therefore used the annual rate of maintenance payment of £46 for the purpose of calculating the costs involved in restoration in Northern Ireland.
In Scotland, the annual costs of upland heath under restoration are assumed to equate to those for management, i.e. £1.55/ha/yr.
In Wales, the annual costs of upland heath under restoration are assumed to equate to those for management, i.e. £50 per hectare per year.
17
HAP Costings Annexes
Expansion
Creation of upland heath can involve an intensive process of applying pesticides to kill off previous grassland, ploughing up of the land to create seeding niches, and re-seeding using special seed mixes. It might be necessary to lime the site and/or plant a nurse crop prior to re-seeding. Following re-seeding follow-up weeding is necessary to remove invasive species. As this process is very costly, the new upland heath HAP targets will focus on restoration. As a result, we have not provided an estimate of the capital costs of re-creation.
However, the following annual agri-environment payments are available for creation of upland heath:
In England, HLES pays £60 per hectare for creation of upland heathland.
In Northern Ireland, no annual payment is available for creation through either of the two schemes. However, we assume that to meet the creation target it will be necessary to pay land managers some kind of annual management payment in addition to the capital costs. We have therefore used the annual rate of maintenance payment of £46 for the purpose of calculating the costs involved in restoration in Northern Ireland.
In Scotland, no annual payment is available for creation of upland heath. However, we assume that to meet the creation target it will be necessary to pay land managers some kind of annual management payment in addition to the capital costs. We have therefore used the annual rate of maintenance cost of £1.55 per hectare for the purpose of calculating the costs involved in creation in Scotland.
In Wales, Tir Gofal pays £110 per hectare for creation of upland heath.
Other Costs
While most costs of implementing the HAP for upland heathland relate to land management, other costs include:
Activities in the areas of policy and legislation have either been undertaken or are paid for as part of statutory bodies normal work programme.
Provision of advice for land managers and land management advisors on favourable management regimes. This is funded by the partner organisations internally. Defra and other organisations run demonstration sites already and have new sites under consideration. These sites are usually core funded and should not be included in the HAP costing.
Monitoring of and research into aspects of the habitat undertaken and/or funded by the main HAP partners internally or by Defra. A lot of the monitoring work is ongoing and should therefore not be put down to the HAP for that reason. Significant research projects in the area of air pollution are taking place with hundreds of thousands of pounds being spent across a range of habitats, which makes it difficult to apportion costs to this particular one. Priorities have been drawn up for research into burning techniques, most of which has so far been core funded. However, a lot of research has been postponed or put off as the
18

HAP Costings Annexes
costs could run into millions of pounds. It is not possible to estimate exactly how much is needed or indeed planned at present.
We estimate that these costs other than land management can be estimated by applying a 5% mark-up to the land-related costs.
19
HAP Costings Annexes
5 ANNEX 5: BLANKET BOG Restoration and Management Costs
A very large proportion of the indicative costings relate to habitat management, enhancement and restoration costs, with agri-environment schemes representing the main payment vehicle. However, a small proportion of the resource is not managed agriculturally, but as part of sporting estates. Though some of this land is SSSI and therefore eligible for management agreements, a small percentage may fall outside the scope of both agri-environment schemes and SSSI payments. This is likely to include some high altitude bogs in North and West Scotland.
Discussion with the Lead Partner suggests that some items within the original costings are in need of review. For example, the costings include an allowance for muirburn, which is now discouraged, especially in Wales and England. As well as habitat quality considerations, this reflects increased emphasis on the role of blanket bog in carbon sequestration.
Grazing of blanket bog by deer is an increasing problem in Scotland, and is more expensive to control than sheep grazing. The indicative costings do not appear to reflect these costs. The issue of deer control is currently being addressed by a liaison group involving SEERAD, Forestry Commission, SNH and the Deer Commission. Discussions with the Deer Commission and the Forestry Commission indicate that it is difficult to estimate the area of blanket bog that would need deer management, and suggest that given the potential for deer grazing to affect the whole habitat, it would not be unreasonable to apply deer management costs to the whole of the blanket bog HAP in Scotland. The Forestry Commission estimate that the average grant aid cost of deer management is on average £6/ha/yr. According to the Forestry Commission, current management practices state that if deer numbers exceed 8 deer per hectare, management is necessary to minimise grazing damage to the blanket bog habitat. However, the extent of damage to the HAP caused by deer grazing is still a matter of debate and is the subject of current research by various bodies, e.g. FC, SNH etc.
Consultees raised three main threats to the blanket bog HAP: (i) Moor burning (which has a knock on effects on other habitats e.g. water colouring of local streams etc); (ii) Overgrazing; and (iii) Drainage (gripping), which has affected the hydrology of substantial areas of blanket bog.. Although the effectiveness of maintaining grips is questionable, many farmers continue to do so. Given the large number of grips involved, restoration of blanket bog through grip blocking/removal over a large scale is a very expensive process.
The restoration of blanket bog depends on a combination of reducing erosion (from fires and grazing) and reversal of damage caused by moor gripping and drainage. The costs are therefore likely to involve a combination of capital costs (e.g. drain blocking) and annual management costs.
England
The Moors for the Future team are currently working with partners on restoring 440 hectares of blanket bog in the Peak District. The total expenditure in the Moors for the
20
HAP Costings Annexes
Future project on fire site restoration is £1.2 million on 400 hectares (£3,000 per hectare), of which £870500 will be on 180 hectares of Bleaklow, giving a per hectare cost of £4836, excluding the costs of fencing and excluding stock. This gives a per hectare cost of £1498 for the restoration of the remaining 220 hectares.
It should be noted that the Moors for the Future project is currently restoring the very worst areas of degraded moorland, which has been reduced to bare eroding peat. Detailed cost figures for each particular operation involved in this work are as follows (2005 costings):
Nurse crop £297/hectare
Lime and fertiliser £260/hectare/year (probably £780 in total)
Heather brash (spread/hectare of bare peat) £3020/ hectare
Geo-textiles (spread/hectare of bare peat) £7800/ hectare
Plant propagation = (1 plant per 4 m2) £2600/ hectare bare peat
Gully blocking = £100/ dam = £2500/ 100metres of gully.
This is obviously not applied to all of the areas and is dependent on the extent of bare and eroding peat per hectare. There are other potential restoration techniques, including application of Sphagnum to large areas. The cost of this work is increased on Bleaklow because of the length of carry required by helicopter.
Cost data for work by RSPB and United Utilities to improve the condition of habitats in two upland farms at Whitendale and Pikenaze contains costings to restore the hydrological condition of blanket bogs. At Whitendale Farm, the capital costs of grip blocking and hagg stabilisation to restore the hydrology of 455 ha of blanket bog (of which 434 ha are active) were put at £118,200 and £86,200 respectively, suggesting a total capital cost of £450 per hectare. At Pikenaze Farm grip blocking costs and hagg stabilisation costs were put at £1,477 and £9,000 respectively to restore the hydrology of 384 ha of blanket bog (52 ha active), an average cost of £27/ha.
Based on the cost of buying sheep rights in the Pennines, one consultee from English Nature suggested that the additional payments for less degraded bog of £35/ha/yr to reduce grazing pressure were appropriate. Payments available under the HLS scheme for moorland management and restoration are £40/ha/yr. However, the consultee suggested that the figure of £65/ha/yr used in the indicative costings might not be enough for the restoration of less readily restored blanket bog, not least as much of the Blanket Bog in England is in poor condition, compared to the other countries.
English Nature report that expenditure on management agreements relating to 98,901 hectares of Blanket Bog SSSIs in England, through WES and agri-environment schemes – totalled £3.4m in 2003/04 – at an average of £35 per hectare for management and restoration. The reported costs of maintenance and restoration were the same (£35 per hectare) across sites in different condition.
Scotland
Under the Border Mires LIFE project, the average cost of conifer clearance has been £950/ha over 200ha. The total project cost was 465,000 euro for the partial restoration of 500 ha of mire. This suggests costs of 930 euro (c£600) per hectare over 5 years,
21
HAP Costings Annexes
or £120/ha/yr. These figures include high cost expenditures such as conifer removal as well as ditch blocking and removal of naturally regenerating trees.
A report on the LIFE Peatlands Project2, which operated in Caithness and Sutherland between October 1994 and September 1998, indicates that costs for the restoration of drained peat land are essentially attributable to the costs of the materials required and the cost of the labour to install the dam. The total cost (including labour) associated with the different materials used to dam up drains in the peatlands of Caithness and Sutherland was as follows:
Peat (hand-built) £5 per dam
Peat (machine-built) £5 per dam
Corrugated plastic sheeting (large) £7.85 per dam
Plastic piling £24 per dam
Based on a range of trials conducted as part of the LIFE Peatlands Project, the report also gave the approximate costs of post-felling treatments3 for the restoration of afforested peat land as follows:
Leave whole trees lying on bog surface 8.5 ha at £451/ha
Chop up trees and leave lying on bog surface 3.8ha £648/ha
Put whole trees in underlying forestry furrows 177.7 at £313/ha
Put trees in selected forestry furrows (windrows) 3.3ha at £617/ha
Remove trees from bog surface 2.9ha at £1024/ha
The project demonstrates that the scale of the job can be a key cost factor, for example at the beginning of the LIFE Peatlands Project, the ‘put trees in furrow’ treatment cost around £500 per hectare, whereas towards the end, contractors were asked to submit tenders for larger pieces of work (up to 50 hectares in size). This resulted in prices coming down to nearer £300 per hectare.
Under the Scottish Forestry Grant Scheme* the grants and costs for blocking drains are:
Small drains (less 2m by 1m) £40 per dam
Large dams (more than 2m by 1m) £80 per dam
Under SNH's Grampian Lowland Bogs Natural Care Scheme dam-building has been costed at £175 per hectare.
Under the Scottish Forestry Grant Scheme* the grants and costs for conifer removal are:
Felling conifers to waste < 3m high (or ca. less than 12 years old) £450/ha
2 Wilkie, N.M. & Thompson, P.S. (1998) Identification and restoration of damaged blanket bog- A guide to restoring drained and afforested peatland, LIFE Peatlands Project, RSPB, Scotland. 3 All of the treatments were applied to trees of 10-16 years of age. Trees typically ranged from 2-6 metres in height. In many of the areas where restoration work was conducted, the Sitka spruce crop was mostly dead or in severe check.
22

HAP Costings Annexes
Felling conifers to waste and clearing site < 3m high £1000/ha
Felling conifers to waste 3-6m high (or ca. more than 12 years old) £750/ha**
Felling to waste and clearing site 3-6m high 1500/ha**
*Payment rates for grants are either given at a 60% or 90% rate. All sites adjacent to SSSI and Natura 2000 protected areas get a 90% grant. Most blanket bog sites are adjacent to Natura 2000 areas.
**It should be noted that most plantations on blanket bog will be more than 12 years old (> 3m high) as it is known that most conifer plantations were planted before 1991.
Agri-environment payments
In England, the Higher Level Stewardship scheme does not contain measures specific to blanket bog. The most appropriate prescriptions appear to be:
Maintenance of moorland £40 ha
Restoration of moorland £40 ha
Maintenance of rough grazing for birds £80 ha
Restoration of rough grazing for birds £80 ha
Shepherding supplement £5 ha
Seasonal livestock exclusion supplement £10 ha
Moorland re-wetting supplement £10 ha
Grip blocking drainage channels £3.40 m2
In Wales, Tir Gofal offers a payment of £25 per hectare per year for management of blanket bog.
In Northern Ireland, the ESA and CMS schemes do not offer standard payments for management of blanket bog. Heather moorland and lowland raised bog attract a rate of £50/ha for the first 100 ha, £25 per hectare for the next 100 ha, and £10 per ha thereafter. Rough moorland grazing attracts a rate of £20/ha for the first 20 ha, £10 per hectare for the next 80 ha, and £5 per ha thereafter.
In Scotland, no specific payment for blanket bog is made under the Rural Stewardship Scheme (RSS). Moorland management is rewarded at a rate of £1/ha. This does not appear to cover required expenditures. There was a general consensus amongst the consultees from Scotland that the RSS was not an appropriate mechanism to deliver the blanket bog HAP, for the following reasons:
Unsuitable point system – under the RSS system sufficient criteria points are needed to qualify. High scores are granted to areas which cover a diverse range of habitats. This raises two concerns, firstly, individual holdings are unlikely to qualify, and secondly, it encourages the management of small pockets of different types of habitats, rather than large areas of one habitat.
It encourages muirburn – incentive for people to maximise the area they burn, when in fact burning should be minimised on blanket bog
23

HAP Costings Annexes
Definition of habitat management is too general - the definition of the moorland habitat is too general and includes different types of habitats, which require specific management techniques
In contrast the SNH Peatland Management Schemes is a more appropriate management programme for blanket bog, as it is more focused and directed at specific management needs of the habitat. The main scheme in some areas is the Peatland Management Scheme e.g. in Caithness and Sutherland and the Western Isles.
SNH has payments under Peatland Management Schemes. These are area based payments in designated areas. For example, under the Caithness and Sutherland Peatland Management Schemes, for agricultural agreements, £1.40 per ha is paid for additional costs related to general stock management (modified shepherding, stock management, feeding practices, vehicle use), plus £0.40 per ha for appropriate levels of muirburn. For sporting agreements the muirburn payment of £0.40 per ha applies, plus £0.35 per ha for additional costs related to vehicle use, deer feeding practices, and general estate management. The Peatcutting supplement of £150/agreement/year (the areas range from 40ha to 6816ha) is based on additional costs in time for replacing turf evenly, vegetation side up, and without gaps in the bottom of the bank, and in additional handling, for an average of 5 banks per holding. The Common Grazings supplement of £10 per year per active shareholder is for additional communications costs. The original Caithness and Sutherland Peatland Management Schemes budget, for all costs including staff, for the 5 years between 2002-2007 was £1,250,544. This gave a total cost of £2.14 per ha of SSSI protected, and £1.29 per ha of Agreement area protected. This year payments under the scheme are anticipated to amount to £147000, with a total area under agreement of 120000ha gross, 95000 ha net. Size of Agreement area ranges from 38 ha to 8779 ha, with a mean size of 1773 ha and median of 904 ha.
Table A5.1 provides a summary of the costs of bog restoration from the above examples. The figures indicate that the costs of enhancing easily restorable bog (for example by reducing grazing or varying management practices) are low, and comparable to annual management costs. However, the costs of restoration of heavily degraded sites, involving tree removal, large scale grip blocking or rehabilitation of heavily burnt or eroded sites incur much larger capital costs.
A key point is that the costs of restoring more degraded sites are generally capital costs rather than annual costs, to cover the costs of grip blocking, tree removal or rehabilitation of eroded or burnt sites. For this reason, it is difficult to understand the annual cost of £65/ha/year used in the indicative costings.
Table A5.1: Summary of Restoration Costs Example Location Type of restoration Cost
English Nature, SSSI management agreements
England General restoration of SSSIs
£35/ha/year
Moors for the Future Peak District Fire site restoration (heavily degraded)
£3000/ha capital cost
RSPB/United Utilities Whitendale Farm, NW England
Grip blocking and hagg stabilisation
£450/ha capital cost
24
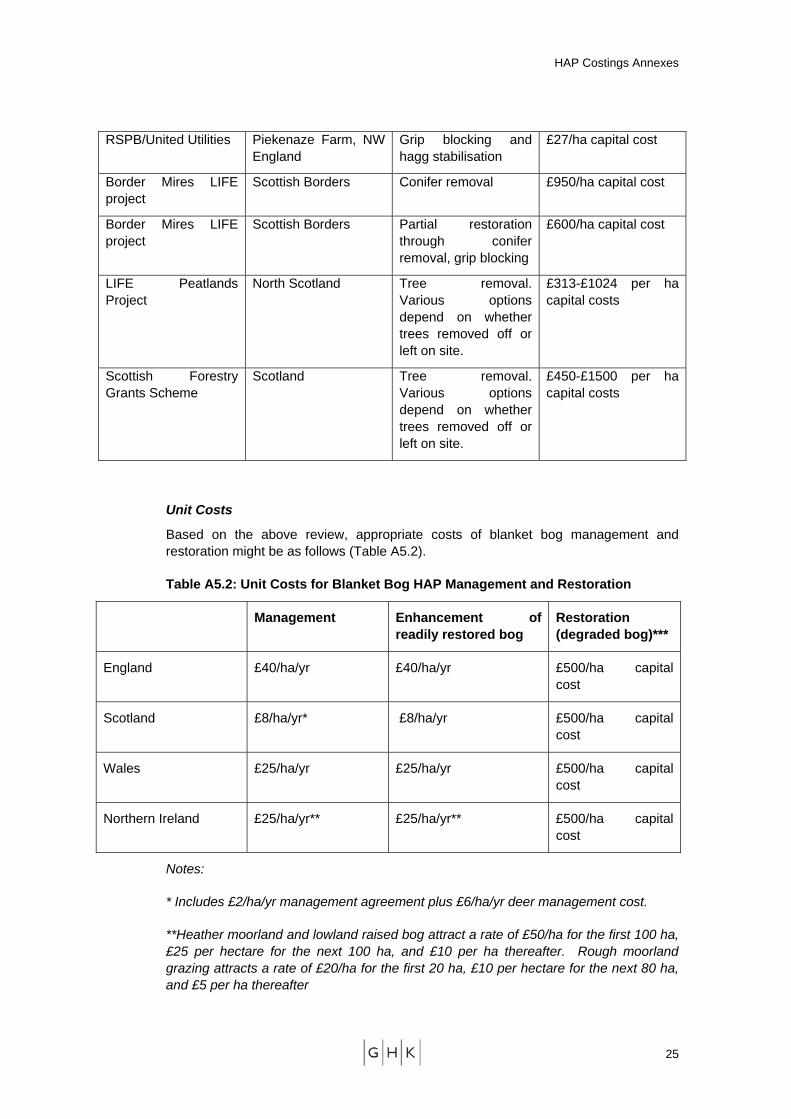
HAP Costings Annexes
RSPB/United Utilities Piekenaze Farm, NW England
Grip blocking and hagg stabilisation
£27/ha capital cost
Border Mires LIFE project
Scottish Borders Conifer removal £950/ha capital cost
Border Mires LIFE project
Scottish Borders Partial restoration through conifer removal, grip blocking
£600/ha capital cost
LIFE Peatlands Project
North Scotland Tree removal. Various options depend on whether trees removed off or left on site.
£313-£1024 per ha capital costs
Scottish Forestry Grants Scheme
Scotland Tree removal. Various options depend on whether trees removed off or left on site.
£450-£1500 per ha capital costs
Unit Costs
Based on the above review, appropriate costs of blanket bog management and restoration might be as follows (Table A5.2).
Table A5.2: Unit Costs for Blanket Bog HAP Management and Restoration
Management Enhancement of readily restored bog
Restoration (degraded bog)***
England £40/ha/yr £40/ha/yr £500/ha capital cost
Scotland £8/ha/yr* £8/ha/yr £500/ha capital cost
Wales £25/ha/yr £25/ha/yr £500/ha capital cost
Northern Ireland £25/ha/yr** £25/ha/yr** £500/ha capital cost
Notes:
* Includes £2/ha/yr management agreement plus £6/ha/yr deer management cost.
**Heather moorland and lowland raised bog attract a rate of £50/ha for the first 100 ha, £25 per hectare for the next 100 ha, and £10 per ha thereafter. Rough moorland grazing attracts a rate of £20/ha for the first 20 ha, £10 per hectare for the next 80 ha, and £5 per ha thereafter
25
HAP Costings Annexes
*** Costs vary widely and an accurate assessment is impossible without further information about the type and extent of work required. Many sites require much larger expenditures.
Other expenditure
Consultees indicate that habitat management represents a large proportion of overall costs. However, there are some potentially significant additional costs, including:
Costs of assessing the condition of blanket bog outside SSSIs - in the past much of the work on the HAP has focused on the protected areas e.g. the SSSI areas. The concern is that there are other issues outside these protected habitats that are also important. One consultee estimates that about a third of the HAP in England is outside SSSIs and identifies the need to assess the condition of the habitat in this area. Little is currently known about the quality of the habitat area outside the protected sites, and how much money is needed to restore the habitat.
One consultee suggested that research and monitoring should be separated in the costings as they are separate activities. Monitoring should be undertaken to support the plans and then research to assess what is happening e.g. carbon loss, erosion etc.
Research - more research is needed on the carbon storage capacity of blanket bog, and the potential impacts of climate change on the maintenance of the habitat area. It was also suggested that there should be research into the impact of vehicles and deer grazing on blanket bog i.e. what level causes damage?
Advice – there is a need for more communication of the importance of the HAP e.g. public awareness should be raised about the importance of using peat-free compost, the public should be advised about how to access blanket bog areas without causing damage, farmers should be advised how to manage blanket bog etc.
Most consultees felt that the cost of other actions had been underestimated in the indicative costings, particularly regarding research, monitoring and advice. Some consultees stressed that given the carbon storage capacity of blanket bog, more money is needed to be spent on research and in the communication of the importance of the HAP in the context of carbon sequestration. For example, public awareness should be raised about the importance of using peat-free compost etc. One consultee felt that there was a need for more flexibility in the spending plans, to allow for potential increases the amount of research.
It is estimated that these various cost items can be covered by the addition of a 5% allowance for “other costs” to the land management cost estimates.
26
HAP Costings Annexes
6 ANNEX 6: LOWLAND RAISED BOG
Introduction
Delivery of the HAP for lowland raised bogs involves site management work, aimed at maintaining sites in and restoring them to favourable condition, as well as expanding the habitat. Work is also required in the areas of research, monitoring, advice and dissemination of good practice in land management as well as general publicity about the habitat.
Scotland and England have the largest shares of the habitat, with lowland raised bogs being a particular feature of the cool, humid regions such as the north-west lowlands of England and the central and north-east lowlands of Scotland, Wales and Northern Ireland. The habitat has undergone significant decline since the start of the nineteenth century, mainly due to agricultural intensification, afforestation and commercial peat extraction. Future decline is envisaged to derive from desiccation of bogs damaged by a range of drainage activities and/or a general lowering of groundwater tables.
Maintenance
Maintenance of lowland raised bogs requires hydrological management to avoid water loss; some degree of tree, scrub and bracken clearance as most bogs have slightly degraded areas within them that need to be controlled, even when the bog is generally classed as in favourable condition; and, finally, grazing by livestock to control vegetation growth. While some of these activities occur irregularly, they can be averaged over time as an annual maintenance cost rather than being treated as capital expenditures.
Annual agri-environment scheme payment rates available for maintenance of lowland raised bogs are the following:
In England, the Higher Level Environmental Stewardship (HLES) Scheme pays £150 per hectare per year towards maintenance of lowland raised bogs.
In Northern Ireland, the Countryside Management and the Environmentally Sensitive Areas Schemes (CMS/ESAS) pay £45/20/10 per hectare for management of lowland raised bogs depending on the size of the bog, while the Management of Sensitive Sites (MOSS) scheme, which is designed to ensure the positive management of land within Areas of Special Scientific Interest (ASSI) pays £70 per hectare. As no data are currently available for the share of the habitat that falls into ASSIs we assume this to be 10%. An average weighted rate of £48 per hectare for maintenance has been calculated based on information about the average size of lowland raised bogs and the assumed ASSI share.
In Scotland, the Rural Stewardship Scheme offers £70 per hectare for management of lowland raised bogs, while the Grampian Lowland Bog Scheme pays £20 per hectare for the first 100 hectares entered into the Scheme and £12 per hectare thereafter, up to a maximum of 250 hectares. As the majority of bogs are 60 hectares or less, the £20/ha payment rate applies to most. Based
27
HAP Costings Annexes
on the relative share of lowland raised bog in and outside Grampian the weighted average payment rate is £60/ha.
In Wales, Tir Gofal offers £40 per hectare for maintenance of lowland raised bogs.
Restoration
Restoration of lowland raised bog involves gaining and securing access to the various parts of the bog, clearance of timber, scrub, bracken and bramble, and management of water levels through damming.
Restoration of the Fenn’s, Whixall & Bettisfield Mosses NNR started in 1991 and is still taking place. An area of 407 hectares has been restored to date, and an additional 129 hectares are half way through restoration. The restoration has involved:
Access work based on creating brash tracks along the edges of the bog on which to move machinery and people onto and biomass off the site, as well as building pipes to enable crossing of ditches.
Scrub clearance on virtually all of the restored area, stump treatment of deciduous scrub, and re-growth control in the case of taller scrub.
Clearance of pine forest on ca. 10% of the site cleared primarily by the technique of sky-lining, which makes for a much cleaner but also more expensive operation.
Clearance of bracken and bramble on large areas of the site by initial spraying and follow-on re-growth control.
Management of water level by initial damming up of water at every 40 metres of ditch using peat dams. As damming created surplus water that requires storm water control between the dammed up and surrounding area, this was also introduced in the form of a u-pipe installation.
The per hectare cost of the restoration programme to date is £3,200, which includes estate and habitat costs, staff time and purchase of machinery (as machinery will continue to be used only 50% of the cost has been ascribed to the 1991-2005 restoration period). On top of land and lease purchase, premiums and buying out of planning permissions come to £3, 550 per hectare. Hence, the total per hectare cost of the restoration process so far has been £6,750.
Purchase of land and associated permissions is likely to be needed for a proportion of sites, in order to safeguard against peat extraction and to facilitate the establishment of an appropriate hydrological regime. However, it is unlikely to be required for all sites. If it is assumed to be required in 50% of cases, this reduces the overall per hectare cost to £4,975.
Agri-environment schemes offer capital payments toward most of the restoration activities listed above. In the case of Northern Ireland, we have not included payments available through the MOSS scheme as this does not operate fixed rates but offers a percentage of actual capital costs ranging from 60-100%. Payments for hydrological management are as follows:
28
HAP Costings Annexes
HLES (England) pays the following:
o Soil bund - £149/each
o Culvert - £153/each
o Timber sluice - £314/each
o Brick, stone or concrete sluice - £960/each
o Wind pump for water level measures – 80% of costs
o Construction of water penning structures – 80% of costs
CMS/ESA (Northern Ireland) offers no payments towards water management
Rural Stewardship Scheme (Scotland) the pays £100/dam for blocking ditches on lowland raised bogs and on created wetland
Tir Gofal (Wales), pays the following:
o Soil bunds - £35
o Timber sluices - £140
Payments for scrub clearance are as follows:
HLES - £228-583/ha
ESGMS - £800-2,400/ha
Tir Gofal - £150-500/ha
Payments for bracken clearance are as follows:
HLES - £48-112/ha
CMS/ESAS - £140-260/ha
Rural stewardship Scheme - £120/ha
Tir Gofal - £50-120
Annual agri-environment scheme payment rates available for restoration of lowland raised bogs are the following:
In England, HLES pays £150 per hectare per year for restoration of lowland raised bogs.
In Northern Ireland bogs under restoration are assumed to be eligible for annual maintenance payments of £48/ha.
In Scotland, bogs under restoration are assumed to be eligible for annual maintenance payments of £60/ha.
In Wales, bogs under restoration are assumed to be eligible for annual maintenance payments of £40/ha.
Expansion
29

HAP Costings Annexes
The current agri-environment programme does not include specific payments for bog creation, as it is assumed that the habitat cannot be created from scratch. However, the new expansion target for lowland raised bogs envisages “re-creating the habitat and/or supporting wetland on archaic peat to ensure a sustainable hydrological regime for adjacent extant habitat”, and this is likely to involve a process of creation of transitional fen.
Based on information about a fen creation project, general information provided by land managers on fen creation, information provided by the RSPB on reedbed creation, and information about tree & scrub clearance, re-seeding and fencing costs used for costing a number of grassland HAPs, we assume the capital costs of fen creation to be the following:
Digging out of dried up areas is assumed to be needed in 50% of cases at a per hectare cost of £217 (based on figures for bed lowering used for costing reedbed restoration);
introduction of structures for controlling the water level (bunds and sluices) is assumed to be needed in 100% of cases at a per hectare cost of £160 based on figures used for costing reedbed creation;
tree and scrub clearance is assumed to be needed in 100% of cases at a per hectare cost of £253 based on figures for restoration of lowland dry acid grassland;
re-seeding is assumed to be needed in 10% of cases at a per hectare cost of £47 based on the costs of re-seeding/green hay spreading to create lowland meadow;
fen cutting is assumed to be needed in 25% of cases at a per hectare cost of £80 based on figures for reedbed creation;
introduction of fencing at a per hectare cost of £248 based on figures used for costing the lowland dry acid grassland HAP.
This gives capital cost of recreating fen of £815 per hectare.
The annual agri-environment payments for creation of fen are as follows:
In England, HLES pays £380 per hectare for creation of fen.
In Northern Ireland, annual maintenance payments are £92/ha for fen.
In Scotland, the Rural Stewardship Scheme pays £250 per hectare for creation and management of wetland.
In Wales, Tir Gofal pays £310 per hectare for creation of fen.
Other Costs
Whilst the majority of the cost of implementing the HAP for lowland raised bogs relates to land management, other costs do exist. Below are listed the most significant items.
The designation of two SAC sites is still outstanding, but if it goes ahead this will cost around £15-20 million. However, these costs are attributable to the Habitats Directive rather than the BAP.
30
HAP Costings Annexes
Advisory activities for land managers and HAP partner staff are ongoing and paid for through existing budgets.
Future monitoring of the habitat and the effectiveness of conservation management is seen to depend to some extent on the current development of remote sensing. To take this further an additional £50-60,000 needs to be spent on development
A research project on the potential of returning peat claimed by agriculture back to lowland raised bog is needed (among other things looking at whether it is necessary to go via transitional fen). This will cost around £100,000.
Undertaking and promoting research and development of sustainable alternatives to peat. However, this is held back by the fact that the government does not contribute to near market research, although there is a need for financial support for developing alternatives. The costs of this item could be anything between zero and a few million pounds, depending on the role of the public sector in funding this R&D.
Costs other than land management are estimated by applying a mark-up of 15% to land management costs to cover the costs of delivery and administration of land management schemes, and a further 5% to cover all other costs.
31

HAP Costings Annexes
7 ANNEX 7: COASTAL AND FLOODPLAIN GRAZING MARSH
Introduction
The indicative costings are based entirely on habitat maintenance, enhancement and restoration costs. Agri-environment schemes provide the main vehicle for meeting these costs, thus it follows that the payment rates available under the schemes in the different UK countries are the key variables affecting the costings.
The HAP itself states that the indicative costings assumed management and enhancement costs of £87 per hectare of land under restoration and management, which includes existing costs. More detailed workings are provided in an RSPB working paper (Harley, 1997), which gives the average cost as £150/ha/yr and revenues £35/ha/yr, giving net costs of land management of £115/ha/yr. Consultees commented that these costs are too low, underestimating the cost of income foregone by landowners, and that the relevant agri-environment payments form a more realistic basis for assessing unit costs.
Agri-Environment Schemes
In England, payments under Higher Level Stewardship are now as follows (£ per ha per year for 10 year agreement):
Maintenance of traditional water meadows £350
Restoration of traditional water meadows £350
Maintenance of wet grassland for breeding waders £335
Maintenance of wet grassland for wintering waders and wildfowl £255
Restoration of wet grassland for breeding waders £335
Restoration of wet grassland for wintering waders and wildfowl £255
Creation of wet grassland for breeding waders £355
Creation of wet grassland for wintering waders and wildfowl £285.
The above are annual payments and provide compensation for ongoing management and opportunity costs, rather than the costs of restoration works themselves.
In Northern Ireland, the BAP costings report identified the following relevant payment rates:
The breeding wader sites option for curlew and snipe (£80-£130/ha/yr)
The wetlands option (includes wet grassland) (£90/ha/yr)
The lapwing sites and fallow plot option could also be used as they breed on wet grassland (£150-£515/ha)
32
HAP Costings Annexes
The costings for Northern Ireland assumed that 80% of the resource would be managed at a rate of £90 per hectare, and 20% at £150 per hectare, giving an average payment rate of £102 per hectare.
The payment rates for management of lowland wet grassland in ESAs and CMS in Northern Ireland are £110 per hectare, or £150 per hectare under the enhanced breeding wader option.
In Scotland, the following annual payments are available under the Rural Stewardship Scheme:
Management of Wet Grassland for Waders £100 per hectare
Management of Wetland £100 per hectare
Creation and Management of Wetland £250 per hectare
Management of Flood Plain £25 per hectare (additional)
In Wales, Tir Gofal offers annual management payments for coastal and floodplain grassland of £85/ha/yr for moderate grazing, or £165/ha/yr for light grazing. Managing improved grassland for breeding lapwing attracts payments of £115/ha/yr and for overwintering wildfowl £40/ha/yr.
Payments for conversion of improved land to coastal grazing marsh are as follows:
Arable land - £220/ha/yr
Improved grassland to semi-improved coastal grazing marsh (lapwing)- £65/ha/yr
Improved grassland to semi-improved coastal grazing marsh (lapwing/wildfowl)- £85/ha/yr
Increasing water levels attracts additional payments of £35-£80 per hectare
Capital Costs
The indicative costings do not appear to include capital costs for investment in water management infrastructure. In practice, there are some potentially large capital costs involved in restoring and creating grazing marsh. Quite frequently habitat degradation has resulted from water levels being lowered in order to suit more intensive grass or arable farming adjacent to existing sites. To raise water levels on the existing site without flooding the intensive land requires new water control structures. This will include ditches, weirs and pumps. The Halvergate Marshes and the water supply feed to the RSPB Berney Marshes Reserve and West Sedgemoor north side / RSPB reserve are both examples of this. These costs are very site specific, frequently high and borne by the Environment Agency or IDB with grant aid from Defra.
To create wet grassland from arable land will always require capital sums - water control structures as above, local land forming (creating pools and 'foot drains') and grassland seeding. Past practice with agri-environment schemes appears to have been to expect the Environment Agency or IDB to put in infrastrucure with Defra grant aid, local land forming is often not carried out (RSPB Otmoor and the 'off-Wash' parcel of land leased by RSPB adjacent to the Ouse Washes are good examples of extensive
33
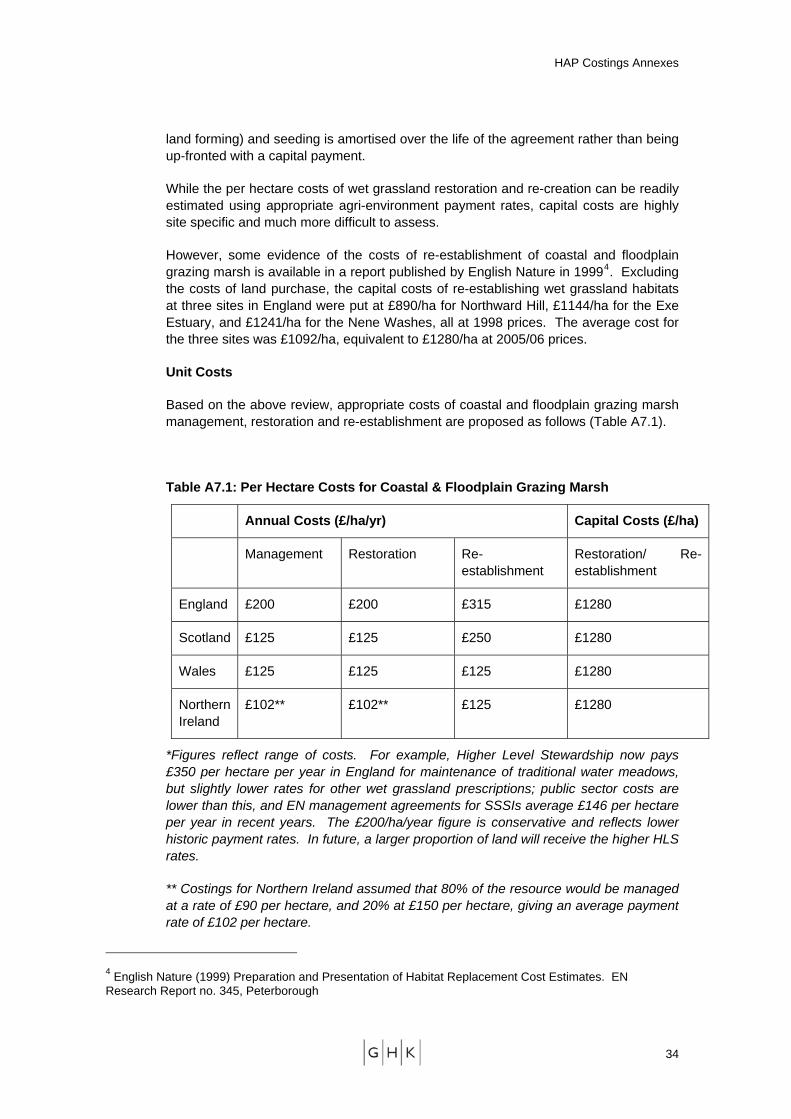
HAP Costings Annexes
land forming) and seeding is amortised over the life of the agreement rather than being up-fronted with a capital payment.
While the per hectare costs of wet grassland restoration and re-creation can be readily estimated using appropriate agri-environment payment rates, capital costs are highly site specific and much more difficult to assess.
However, some evidence of the costs of re-establishment of coastal and floodplain grazing marsh is available in a report published by English Nature in 19994. Excluding the costs of land purchase, the capital costs of re-establishing wet grassland habitats at three sites in England were put at £890/ha for Northward Hill, £1144/ha for the Exe Estuary, and £1241/ha for the Nene Washes, all at 1998 prices. The average cost for the three sites was £1092/ha, equivalent to £1280/ha at 2005/06 prices.
Unit Costs
Based on the above review, appropriate costs of coastal and floodplain grazing marsh management, restoration and re-establishment are proposed as follows (Table A7.1).
Table A7.1: Per Hectare Costs for Coastal & Floodplain Grazing Marsh
Annual Costs (£/ha/yr) Capital Costs (£/ha)
Management Restoration Re-establishment
Restoration/ Re-establishment
England £200 £200 £315 £1280
Scotland £125 £125 £250 £1280
Wales £125 £125 £125 £1280
Northern Ireland
£102** £102** £125 £1280
*Figures reflect range of costs. For example, Higher Level Stewardship now pays £350 per hectare per year in England for maintenance of traditional water meadows, but slightly lower rates for other wet grassland prescriptions; public sector costs are lower than this, and EN management agreements for SSSIs average £146 per hectare per year in recent years. The £200/ha/year figure is conservative and reflects lower historic payment rates. In future, a larger proportion of land will receive the higher HLS rates.
** Costings for Northern Ireland assumed that 80% of the resource would be managed at a rate of £90 per hectare, and 20% at £150 per hectare, giving an average payment rate of £102 per hectare.
4 English Nature (1999) Preparation and Presentation of Habitat Replacement Cost Estimates. EN Research Report no. 345, Peterborough
34
HAP Costings Annexes
Other Expenditures
Consultees indicate that habitat management represents a large proportion of overall costs. However, there are some potentially significant additional costs, including:
Survey work - costs of restoration vary according to the condition of the sites, and there is a need for survey work to assess the condition of the habitat. This is constrained by resources available, and one consultee was concerned that habitat planning is based on ‘guess work’ about the extent and condition of the habitat. A recent RSPB report, which assessed a sample of the HAP, indicates that approximately 60% is in favourable condition.
Continuous monitoring – the indicative costings excluded the cost of ongoing monitoring and research.
Information and advice – some consultees were concerned about the lack of evidence of an improvement in the condition of grazing marsh under previous agri-environment schemes, and suggested that this is linked to a lack of understanding of farmers and landowners about how to apply an appropriate management regime to maintain and enhance the habitat. Since the majority of UK grazing marsh is on agricultural land, partners identified the need to develop advisory information for farmers and landowners about how to manage these sites.
35
HAP Costings Annexes
8 ANNEX 8: PURPLE MOOR GRASS AND RUSH PASTURE
Introduction
Delivery of the HAP for purple moor grass and rush pastures involves site management work, aimed at maintaining sites in, or restoring them to favourable condition, as well as re-establishing areas of the habitat from arable or improved grassland. Work is also required in the areas of research, monitoring, advice and dissemination of good practice in land management as well as general publicity about the habitat. In addition, promotion of ASSI/SSSI management agreements and of creation of new National Nature Reserves (NNRs) is taking place under the HAP.
The largest share of the habitat is located in Wales, with England and Northern Ireland having significant concentrations too. The habitat has declined significantly due to agricultural modification achieved through drainage, cultivation and fertiliser application as well as inappropriate land management in the form of over- or under-grazing. At present, it is estimated that in England 79% of the habitat is in SSSIs, in Scotland just over 2%, and in Wales 8%, while in Northern Ireland 13% is in ASSIs.
Maintenance
Maintenance of purple moor grass and rush pastures does not generally require intensive management, but involves establishing an appropriate grazing regime that prevents loss of too many small plants through over-grazing, or the swamping of other smaller plants by the purple moor grass, rushes and scrub in the case of under-grazing. We assume that the right site hydrology has been established, and that ploughing, fertiliser application and re-seeding with rye-grass is avoided. We also assume that expenses involved in grazing such as for fencing and the introduction of water for animals will already have been met in most cases as part of a past project to restore the site or as part of the ongoing management of it by grazing. As a favourable grazing regime on rush pasture will not keep scrub down, some scrub control will be needed as part of maintenance. However, we assume that it will only be needed to a limited extent and over a small area, and that the costs of it should therefore be covered by the annual maintenance payments available through agri-environment schemes.
Annual agri-environment scheme payment rates available for maintenance of purple moor grass and rush pastures are the following:
In England, the Higher Level Environmental Stewardship (HLES) Scheme pays £200 per hectare per year towards maintenance of species-rich, semi-natural grassland. As the Wildlife Enhancement Scheme for SSSI land is being phased out, and in the interim will be using HLES payments on new agreements, we assume the same rates for SSSI and non-SSSI land. A number of annual supplementary payments are available through HLES, but as these might be more likely to be paid out where restoration is taking place, and in some cases are believed to be used only rarely, they have been disregarded for the purpose of the payment setting.
In Northern Ireland, the Countryside Management and the Environmentally Sensitive Areas Schemes (CMS/ESAS) pay £155 per hectare for species-rich
36
HAP Costings Annexes
wet grassland that is grazed and £170 for sites that are used for hay, while the Management of Sensitive Sites (MOSS) scheme, which is designed to ensure the positive management of land within Areas of Special Scientific Interest, pays £140 per hectare. An average rate of £160 has been calculated based on ASSI land making up 13% of the habitat and an assumed 50/50 split between statutory sites that are grazed and cut for hay (no data is available for the relative proportion of these two).
In Scotland, the Rural Stewardship Scheme offers £100 per hectare for management of wetland, with an additional annual maintenance payment of £55 per hectare for scrub management. It has not been possible to get a figure for take up of this supplement, which has therefore been disregarded for the purpose of the payment calculation. The East Scotland Grassland Management Scheme (ESGMS) specifically for SSSI land offers variable rates depending on the size of the site and whether it is cut or grazed. Based on officer information on the prevailing size and use of sites the average rate of payment through ESGMS is £89 per hectare. As only just over 2% of the habitat falls into SSSIs we have decided to base the maintenance payment rate solely on the Rural Stewardship Scheme payment of £100 per hectare.
In Wales, Tir Gofal offers £80 per hectare for maintenance of marshy grassland. Payment would also be available through Section 15 agreements for the 8% of the habitat that falls into SSSIs. However, as Section 15 agreements do not offer standardised and habitat specific payment rates, and because the proportion falling into SSSI is relatively small, we have decided to base the payment rate for maintenance on that available through Tir Gofal.
Based on the interviews undertaken it is clear that the habitat is under threat from inappropriate agricultural practices, which might suggest that the agri-environment maintenance payments are not a sufficient measure to ensure that sites stay in a favourable condition. This suggests that the costs identified above may be conservative, but also that there is a need for ongoing advisory and awareness raising activities, both in the delivery of schemes and more widely
Restoration
Restoration of purple moor grass and rush pastures takes place from semi-improved or neglected grassland. In the latter case, the sward is too rank and usually involves clearing of scrub either by cutting or possibly patch burning, after which cattle are introduced to clear the rest of the overgrowth. In rare cases semi-improved grassland might need to have nutrients removed from the soil by soil stripping, possibly followed by re-seeding. Where drainage has lowered the water table it is necessary to block drains. If the site has not been grazed before fencing and water supply for the animals will need to be introduced (where water is not naturally available). Agri-environment schemes offer capital payments towards most of the restoration activities listed above. Payments for scrub clearance are as follows:
HLES (England) - £228-583/ha
ESGMS (Scotland) - £800-2,400/ha
Tir Gofal (Wales) - £150-500/ha
Payments for soil stripping:
37
HAP Costings Annexes
Tir Gofal - £300/ha
Drainage blocking:
HLES - £3.40/square metre
Payments for re-seeding are as follows:
HLES – 100% of costs for native seed mixes
Rural Stewardship Scheme: £400/ha for sowing of species-rich grassland
Tir Gofal - £150/ha for the introduction of wild plants
Payments for fencing are as follows:
HLES - £2.25-4.00 per metre, with a £2.50 supplement for difficult sites and £220 for a bridle gate
Rural Stewardship Scheme - £3-6 per metre
ESGMS - £1.80-2.50 per metre, with £100 per gate
Tir Gofal - £1.25-1.75 per metre
Payments for introduction of water are as follows:
HLES - £2 per metre for water supply, £119 for cattle drinking bay and £85 for water trough
Rural Stewardship Scheme & ESGMS – £2 per metre for piping and £200 for water trough
Tir Gofal - £0.40 per metre for piping and £100 for water trough.
At Rhos Llaw Cwrt in Wales, 3 sites approximating 20 hectares of former rush pasture have been restored from semi-improved grassland by means of twice yearly mowing and removal of biomass to remove enriched grass from about half of the site and follow-on grazing. The mowing and removal have taken place in two out of the 17 years the diversification process has so far taken, and the aftermath grazing has included moving cattle between an existing unimproved rush pasture seed source and the restored site in order to enable the livestock to bring seeds onto the land, thus speeding up the restoration process and avoiding potentially expensive re-seeding operations. Unusual drainage arrangements using open ditches, and the existence of peaty soil with limited water flow, have meant that the project has not had to block up drains. The costs incurred for the mowing and biomass removal were £4,000, giving a per hectare cost of £200.
Based on general information about restoration of this habitat, the Rhos Llaw Cwrt project and information provided by the Shared Earth Trust (also Wales) which is assisting local farmers with restoring rush pasture we make the following assumptions regarding the costs of purple moor grass and rush pasture restoration:
scrub clearance is needed in 5% of cases at a cost of £60 per hectare based on costs experienced by a lowland dry acid grassland restoration project;
38
HAP Costings Annexes
blocking of drainage is needed in 50% of cases, at an average cost of £110 per hectare. No costs are available for drain blocking from purple moor grass and rush pasture restoration/re-creation projects, and it is assumed that the costs are 50% of those from two blanket bog restoration projects (£259 per hectare for grip blocking and £175 per hectare for damming respectively), on the grounds that fewer drains are likely to require blocking.;
mowing and removal of biomass will cost £100 per hectare based on the Rhos Llaw Cwrt project and an assumption that this is needed in 50% of cases;
fencing costs £248/ha based on the experience of a lowland dry acid grassland restoration project.
This give a total per hectare cost of restoration of £517.
Annual agri-environment scheme payment rates available for restoration of purple moor grass and rush pastures are the following:
In England, HLES pays £200 per hectare per year for restoration of species rich, semi-natural grassland
In Northern Ireland, annual payments for maintenance are £160 per ha.
In Scotland, annual maintenance payments are £100/ha.
In Wales, Tir Gofal pays £110 per hectare for conversion of semi-improved grassland to unimproved acid grassland and £130 for conversion to unimproved neutral grassland. An average rate of £120/ha is assumed.
Re-establishment
Annual agri-environment scheme payment rates available for re-establishment of purple moor grass and rush pastures are the following:
In England, HLES pays £280 per hectare for creation of species rich, semi-natural grassland
In Northern Ireland, annual payments are assumed to equate to the annual rate of maintenance payment of £160 for the purpose of calculating the costs involved in re-establishment in Northern Ireland
In Scotland, the Rural Stewardship Scheme pays £250 per hectare for creation and management of wetland.
In Wales, Tir Gofal pays £210 for conversion of arable land to semi-improved grazed pasture, and £160 for conversion of improved grassland to semi-improved pasture. As most sites are likely to be converted from improved grassland, the rate of £160 for conversion of improved grassland is used.
Re-establishment mostly happens from improved grassland rather than arable land, as the latter is not usually wet enough for this habitat to thrive. In the case of re-establishment from improved grassland the operations involved depend on whether an
39
HAP Costings Annexes
extensive or intensive approach is taken. If the former, the process might involve breaking up of drainage systems and filling in deep drainage ditches if such have been introduced in the past. If the latter, then top soil stripping might also happen where the soil is very enriched and there is a need to remove nutrients. Following this, green hay might be applied in both approaches, but mostly it is a question of possibly hay cutting and introducing an appropriate grazing regime. Re-establishment of purple moor grassland and rush pasture is generally challenging as it is hard to mimic the appropriate hydrology, and because there is still some way to go in obtaining a full understanding of the habitat.
The Shared Earth Trust at Denmark Farm in Wales has recreated rush pasture on fields that were drained and reseeded for intensive sheep grazing in the past. This was done by breaking up the drainage, refraining from use of fertiliser and switching from sheep to cattle and Welsh Mountain pony grazing and reducing the livestock units. No soil stripping or re-seeding was done, as the Trust thought there might be some remaining reservoirs of wetland plants in the soil that would be removed in the case of soil stripping, and because they wanted to see what might grow before contemplating re-seeding. As the Trust’s land was already grazed there was no need to put up additional fencing or introduce water supply. As the project has been going for decades it was not possible for staff to provide straightforward costings for it. However, it provides an insight into a cost efficient, albeit slow way of recreating purple moor grass and rush pasture with which there is not generally much experience around the country.
Based on general information about recreation of this habitat and information provided by the Shared Earth Trust we make the following assumptions regarding the costs of purple moor grass and rush pasture recreation: We assume that blocking of drainage is needed in 50% of cases at a cost of £109 (for assumptions behind this see the restoration section above); that soil stripping will cost £15 per hectare based on an estimated need in 5% of cases and the Tir Gofal payment rate for this activity5; that green hay spreading will cost £24 per hectare based on an estimated need in 5% of cases and the cost experienced by a project recreating lowland meadows; that mowing and removal of biomass will cost £100 per hectare based on the costs experienced by the Rhos Llaw Cwrt restoration project and an assumed need in 50% of cases; that erection of fencing will cost £248 per hectare based on the experience of a lowland dry acid grassland restoration project. This give a total per hectare capital cost of recreation of £495.
Other Costs
Whilst the majority of the cost of implementing the HAP for purple moor grass and rush pastures relate to land management, other costs also need to be considered. Below are listed the most significant items.
Review of the ASSI/SSSI series and possible notification of further sites. While this would still happen without the existence of the BAP, the latter has contributed to keeping up the momentum of this activity. As notification is very
5 No project contacted has done oil stripping so it has not been possible to obtain actual figures for the costs of this activity.
40
HAP Costings Annexes
resource demanding in terms of staff time, and because notification would usually result in financially supported management agreements there can be significant costs involved. However, it is not clear how much delivery of this HAP is contributing to notification..
Expansion of the network of Molinia-Juncus nature reserves involves costs of land acquisition that would not be covered by the annual NNR management payments. However, as no target has been set for the expansion, and because it is not clear how much delivery of this HAP is contributing to NNR expansion it has not been costed.
Research, of which Defra is the primary funder, involves a number of ongoing projects relevant to this habitat, with potential new projects emerging, e.g. in the area of hydrology. However, as the increased number of objectives of the new Higher Level Environmental Stewardship scheme might reduce the funding available for grassland research in the future to about £750,000, we estimate that the habitat will attract at the most 10% of the available Defra grassland research funding, i.e. around £75,000 per year. To this, the individual countries might add additional research projects, possibly in collaboration with other agencies, but these tend to be smaller contracts that do not add significantly to the existing figure.
Monitoring costs are hard to estimate as RDS monitoring is geared towards agri-environment scheme objectives rather than the Biodiversity Action Plan, even if particular habitats have been and will continue to be monitored. As the Higher Level Environmental Stewardship Scheme involves more objectives than past schemes funding might need to be spread more thinly in the future. Currently, a 10 year programme of monitoring is being put together by Defra that is still to be costed, as is the programme of HAP monitoring that RDS and English Nature will be looking to develop in the context of the creation of Natural England. Based on information received from RDS on the relevance of different monitoring exercises for individual habitats, we assume that monitoring for purple moor grass and rush pastures will attract approximately £50,000 funding for monitoring per year from this source. These are included as part of the costs of delivery of agri-environment schemes.
Other items like communications, publicity and advice on suitable habitat management practices and available financial support are often activities that are undertaken and paid for by organisations’ statutory work programme, although in some cases specific activities will require additional funding. It has not been possible to cost these activities separately.
These other costs are estimated to account for a small proportion of the costs of delivery of the HAP, and are assumed to be covered by adding an allowance of 15% to the costs of land management (to cover the costs of delivery and administration of land management schemes) and a further 5% to cover other costs (e.g. communications, publicity and research).
41
HAP Costings Annexes
9 ANNEX 9: LOWLAND CALCAREOUS GRASSLAND
Introduction
Delivery of the HAP for lowland calcareous grassland primarily involves land management work, aimed at maintaining sites or restoring them to favourable condition, as well as re-establishing areas of the habitat from arable or improved grassland. There are further costs in administering the creation of new lowland calcareous grassland NNRs. Work is also required in the areas of research, monitoring and dissemination of good practice in land management as well as general publicity about the habitat.
60-70 per cent of the habitat is estimated to be located within SSSIs, of which 28 per cent is thought to be in a favourable condition. The proportion on non-SSSI lowland calcareous grassland in a favourable condition is not known, but based on the SSSI figure a large amount of work is believed to be needed. There are major concentrations of the habitat in Wiltshire, Dorset and the South Downs.
Maintenance
Maintenance of lowland calcareous grassland involves cutting or grazing and some scrub and weed control. We assume that expenses involved in grazing such as for fencing and the introduction of water will already have been met in most cases as part of a past project to restore the site or as part of the ongoing management of it by grazing. In the case of scrub and weed control we assume that this is needed to a limited extent as part of maintenance of the site, but that the costs of it should be sufficiently small to be able to be covered by the annual management payments for maintenance available through agri-environment schemes. Hence, no additional capital costs have been added for maintenance of lowland calcareous grassland in a favourable condition.
Annual agri-environment scheme payment rates available for maintenance of lowland calcareous grassland are the following:
In England, the Higher Level Environmental Stewardship (HLES) Scheme pays £200 per hectare per year towards maintenance of species-rich, semi-natural grassland. As the Wildlife Enhancement Scheme for SSSI land is being phased out, and in the interim will be using HLES payments on new agreements, we assume the same rates for SSSI and non-SSSI land. A number of annual supplementary payments are available through HLES, but as these might be more likely to be paid out where restoration is taking place, and in some cases are believed to be used only rarely, they have been disregarded for the purpose of the payment setting.
In Scotland, the Rural Stewardship Scheme offers £100 per hectare for management of species-rich grassland, with an additional annual maintenance payment of £55 per hectare for scrub management. It has not been possible to get a figure for take up of this supplement, which has therefore been disregarded for the purpose of the payment calculation. The East Scotland Grassland Management Scheme (ESGMS) specifically for SSSI land offers variable rates depending on the size of the site and whether it is cut or grazed. Based on officer information on the prevailing size and use of sites the average
42
HAP Costings Annexes
rate of payment through ESGMS is £89 per hectare. This produces an overall average for the two schemes of £95 given that each scheme is believed to cover 50% of the habitat.
In Wales, Tir Gofal offers £130 per hectare for maintenance of unimproved limestone grassland.
Restoration
Annual agri-environment scheme payment rates available for restoration of lowland calcareous grassland are the following:
In England, HLES pays £200 per hectare per year for restoration of species rich, semi-natural grassland
In Scotland, no annual payment is available for restoration through either of the two schemes. However, we assume that to meet the restoration target it will be necessary to pay land managers some kind of annual management payment in addition to the capital costs. We have therefore used the annual rate of maintenance payment of £95 for the purpose of calculating the costs involved in restoration in Scotland.
In Wales, Tir Gofal pays £110 per hectare for conversion of semi-improved grassland to unimproved limestone grassland (classified as restoration by Tir Gofal officer).
Restoration of lowland calcareous grassland potentially involves a variety of different operation, the most common of which are:
Scrub clearance
Weed control
Re-seeding
Fencing
Introduction of water.
The extent as well as costs of these activities depend greatly on the nature of the site as well as past uses of it. Work on the Devil’s Dyke Project in Cambridgeshire was fairly challenging given that the project was restoring formerly species-rich chalk grassland which had become covered by dense scrub during the past 20-30 years on sites that tended to be steep sided hills or ancient earthworks rather than flat, more accessible sites. The project firstly removed up to 90% of the scrub and poisoned the remaining stumps (took place on ca. 25% of the site), applied an approved grass seed mix on areas of the site where this was needed (around 20 % of the site), and then mowed the vegetation several times a year for the first year or two. After that, sheep were introduced once the grasses were established and fences and a water supply had been installed. Fencing was erected on 200 meters per hectare, and the water supply was in the form of a bowser serving the whole of the 40 hectare site. The per hectare costs of the various interventions taken across the whole of the restored area were the following (figures include material and labour):
Scrub removal - £1,650
Mowing & weed control - £50
43
HAP Costings Annexes
Purchase of grass seeds - £175
Seed spraying - £375
Fencing, incl. gates – 1,000
Introduction of water - £75.
The Salisbury Plain LIFE project, on the other hand, operates on primarily flat or rolling terrain and has only experienced scrub clearance and stump treatment costs, as there has been no need for bracken clearance, livestock is kept in temporary, electric fenced pens due to the need for flexibility on a military site, and because local farmers have brought in water bowsers which the project has not had to pay for. Figures for scrub clearance on six sites within the Plain produce an average cost of £1,193 per hectare for scrub clearance, which is lower than for the Devil’s Dyke project even if one of the sites had a dense scrub cover and another was sited on steep terrain.
Agri-environment schemes offer capital payments toward all of the restoration activities listed above. Payments for scrub clearance are as follows:
HLES (England) - £228-583/ha
ESGMS (Scotland) - £800-2,400/ha
Tir Gofal (Wales) - £150-500/ha
Payments for re-seeding are as follows:
HLES – 100% of costs for native seed mixes
Rural Stewardship Scheme: £400/ha for sowing of species-rich grassland
Tir Gofal - £150 for the introduction of wild plants
Payments for fencing are as follows:
HLES - £2.25-4.00 per metre, with a £2.50 supplement for difficult sites and £220 for a bridle gate
Rural Stewardship Scheme - £3-6 per metre
ESGMS - £1.80-2.50 per metre, with £100 per gate
Tir Gofal - £1.25-1.75 per metre
Payments for introduction of water are as follows:
HLES - £2 per metre for water supply, £119 for cattle drinking bay and £85 for water trough
Rural Stewardship Scheme & ESGMS – £2 per metre for piping and £200 for water trough
Tir Gofal - £0.40 per metre for piping and £100 for water trough.
The figures for the two projects demonstrate that restoration costs can be substantial, and in the case of scrub clearance do not appear to be covered by agri-environment payments alone apart from in Scotland.
44
HAP Costings Annexes
Based on a combination of information from the two projects described above and comments from other interviewees, we estimate that restoration of lowland calcareous grassland costs a total of £2,063 per hectare. This includes £1,200 for scrub clearance based on the figures from the Salisbury Plain LIFE Project, as the higher figure for the Devil’s Dyke project may reflect particular challenges and may therefore not be representative of the majority of the habitat. It also includes mowing and weed control at £50, re-seeding at £137 (based on an assumption that generally only 5% of the area will need re-seeding), and introduction of water at £75, all of which are per hectare and based on the Devil’s Dyke Project figures. Finally, we estimate that fencing will cost £600 per hectare based on the assumption that fencing at £4 per metre is needed on a quarter of the restored area with an assumed field size of half a hectare. Again, the Devil’s Dyke figures might be higher than average given that some sites will already have fencing in place or be using temporary fencing.
Re-establishment
Annual agri-environment scheme payment rates available for re-establishment of lowland calcareous grassland are the following:
In England, HLES pays £280 per hectare for creation of species rich, semi-natural grassland
In Scotland, the Rural Stewardship Scheme pays £250 per hectare for creation and management of species-rich grassland on eligible arable land, and £150 per hectare for creation and management of species-rich grassland on improved grassland. We have used a weighted annual payment average based on the extent of recent take-up of the two options. As one of these options has only been available for a year, take-up of it is likely to increase in future as it becomes more familiar to land managers, hence, we assume that uptake will grow from the current 7% to 15% of the total re-established area, which produces a weighted average payment rate of £235 per hectare.
In Wales, Tir Gofal pays £165 per hectare for conversion of arable land to semi-improved hay meadow, £210 for conversion of arable land to semi-improved grazed pasture, and £160 for conversion of improved grassland to semi-improved grassland used for either hay cutting or grazing pasture. We have calculated an average rate of £178 per hectare as it is impossible to establish how much of the habitat about to be re-established is likely to fall within each of the payment categories, not least as there is no data available for current uptake by individual habitats on which to base such a prediction on.
We assume that re-establishment of lowland calcareous grassland requires the same weed control, fencing and water supply costs as restoration. However, we have increased the costs for re-seeding based on an interviewee comment that the majority of the grassland re-establishment projects funded by agri-environment schemes involve re-seeding. Hence, re-seeding costs have been increased to £1,375 per hectare, equal to a re-sowing rate of 50%. We have omitted costs relating to scrub clearance given that re-establishment will be from arable or improved grassland, neither of which are expected to be affected by this. As a result, the capital cost total for re-establishment are estimated to reach £2,100 per hectare.
45
HAP Costings Annexes
Other Costs
Implementation of the HAP for lowland calcareous grassland implies other costs than just those related to land management, the most substantial of which are expected to be research and monitoring. The extent of these has been estimated on the basis of previous years’ figures.
In the case of research, Defra as the primary funder of HAP related research is spending just under £935,000 on this in the 2005-06 financial year, largely on mesotrophic grassland. However, the increased number of objectives of the new Higher Level Environmental Stewardship scheme might reduce the funding available for grassland research in the future to about £750,000. Given this decline we assume that the habitat will attract at the most 10% of the available Defra grassland research funding, i.e. around £75,000 per year. To this, the individual countries might add additional research projects but these tend to be smaller contracts that do not add significantly to the existing figure.
Estimating the costs of monitoring is difficult, as RDS monitoring is geared towards agri-environment scheme objectives rather than the Biodiversity Action Plan, even if particular habitats have been and will continue to be monitored. Again, the fact that the Higher Level Environmental Stewardship Scheme involves more objectives than past schemes means that funding might need to be spread more thinly in the future. Currently, a 10 year programme of monitoring is being put together by Defra that is still to be costed, as is the programme of HAP monitoring that RDS and English Nature will be looking to develop in the context of the creation of Natural England. Based on information received from RDS on the relevance of different monitoring exercises for individual habitats, we assume that monitoring for lowland calcareous grassland will attract approximately £50,000 funding for monitoring per year from this source.
Other items like communications, publicity and advice on suitable habitat management practices and available financial support are often activities that are undertaken and paid for by organisations’ statutory work programmes, although in some cases specific activities will require additional funding. It has not been possible to cost these activities, but we estimate that these and the above mentioned other costs can all be accommodated within the 5% ‘other costs’ category added to the land-related costs.
46

HAP Costings Annexes
10 ANNEX 10: LOWLAND DRY ACID GRASSLAND
Introduction
Delivery of the HAP for lowland dry acid grassland primarily involves land management work, aimed at maintaining sites in, or restoring them to favourable condition, as well as re-establishing areas of the habitat from arable or improved grassland. This includes creation of new lowland dry acid grassland NNRs. Work is also required in the areas of research, monitoring and dissemination of good practice in land management as well as general publicity about the habitat.
It is not clear how much of the habitat is located within SSSIs, although 271 SSSIs have the habitat as a principal reason for notification. In Wales, approximately 700 hectares (about 2% of the habitat) is located within SSSIs, and in Scotland about half of the habitat is. In Northern Ireland it only occurs in very small pockets such as rocky outposts and is therefore hard to locate. A rough estimate of the share of the resource in SSSIs is 15,400 hectares.
Maintenance
Maintenance of lowland dry acid grassland requires cutting or grazing and some scrub, bracken and weed control. We assume that expenses involved in grazing such as for fencing and the introduction of water will already have been met in most cases as part of a past project to restore the site or as part of the ongoing management of it by grazing. In the case of scrub, bracken and weed control we assume that this is needed to a limited extent as part of maintenance of the site, but that the costs of it should be sufficiently small to be able to be covered by the annual management payments for maintenance available through agri-environment schemes. Hence, no additional capital costs have been added for maintenance of lowland dry acid grassland in a favourable condition.
Annual agri-environment scheme payment rates available for maintenance of lowland dry acid grassland are the following:
In England, the Higher Level Environmental Stewardship (HLES) Scheme pays £200 per hectare per year towards maintenance of species-rich, semi-natural grassland. As the Wildlife Enhancement Scheme for SSSI land is being phased out, and in the interim will be using HLES payments on new agreements, we assume the same rates for SSSI and non-SSSI land. A number of annual supplementary payments are available through HLES, but as these might be more likely to be paid out where restoration is taking place, and in some cases are believed to be used only rarely, they have been disregarded for the purpose of the payment setting.
In Northern Ireland, the Countryside Management and the Environmentally Sensitive Areas Schemes (CMS/ESAS) pay £155 per hectare for species-rich dry grassland, while the Management of Sensitive Sites (MOSS) scheme, which is designed to ensure the positive management of land within Areas of Special Scientific Interest, pays £140 per hectare. As figures for how much of the habitat
47
HAP Costings Annexes
falls under each of the schemes are not readily available we have decided to use an average payment rate of £147 per hectare.
In Scotland, the Rural Stewardship Scheme offers £100 per hectare for management of species-rich grassland, with an additional annual maintenance payment of £55 per hectare for scrub management. It has not been possible to get a figure for the extent of the take up of this supplement, which has therefore been disregarded for the purpose of the payment calculation. The East Scotland Grassland Management Scheme (ESGMS) specifically for SSSI land offers variable rates depending on the size of the site and whether it is cut or grazed. Based on information provided by interviewees on the prevailing size and use of sites the average rate of payment through ESGMS is £89 per hectare. This produces an overall average for the two schemes of £95 given that each scheme is believed to cover 50% of the habitat.
In Wales, Tir Gofal offers different rates of payment for maintenance of unimproved acid grassland, but the two most commonly used are for enclosed lowland and unenclosed lowland (200 ha or less) unimproved acid grassland, the average payment rate of which is £48 per hectare.
Restoration
Annual agri-environment scheme payment rates available for restoration of lowland dry acid grassland are the following:
In England, HLES pays £200 per hectare per year for restoration of species rich, semi-natural grassland.
In Northern Ireland, targets have not been set for restoration, which prevents a costing of this effort. Annual payments are not available for restoration from any of the schemes, as to be eligible grasslands have to meet the priority habitat definition, which they do not in the case of semi-improved or neglected grassland. However, we assume that to meet a possible future restoration target it will be necessary to pay land managers some kind of annual management payment in addition to the capital cost payment. We have used the annual maintenance payment rate of £147 for this purpose.
In Scotland, no annual payment is available for restoration through either of the two schemes. However, we assume that to meet the restoration target it will be necessary to pay land managers some kind of annual management payment in addition to the capital costs payment. We have therefore used the annual rate of maintenance payment of £95 for the purpose of calculating the costs involved in restoration in Scotland.
In Wales, Tir Gofal pays £110 per hectare for conversion of semi-improved grassland to unimproved acid grassland.
Restoration of lowland dry acid grassland potentially involves a variety of different operations, the most common of which are:
Scrub clearance
Bracken clearance
Weed control
Re-seeding
48

HAP Costings Annexes
Fencing
Introduction of water.
In the experience of the Coversands Tomorrow’s Heathland Heritage project, which on its sites has lowland dry acid grassland, restoration costs £646 per hectare plus additional costs for introduction of water. The project covers a total of 950 hectares of which 450 are receiving actual intervention and has therefore been classified as the restored area. The breakdown is as follows (rates are per hectare):
Scrub clearance – Varied between £595 and £2000 per hectare depending on the density and the nature of scrub. The top rate was paid for Rhododendron clearance from a patch with virtually 100% cover and Rhododendron above head height. The average scrub clearance cost was £1,140 per hectare for the 100 cleared hectares out of a total of 450 hectares of restored land. This produces an overall per hectare scrub clearance cost of £253 across the whole of the restored area.
Bracken spraying - Varied between £4-500. Bracken spraying took place on 10 per cent of the restored area of land, which means a per hectare cost of bracken control of approximately £50.
Pine clearance – Took place on 4% of the restored area at a per hectare cost of around the £1,000, which means £44 per hectare overall across the whole of the restored area.
Weed control of ragwort and willow herb - Took place on 15% of the restored land at a cost of £138-550 per hectare. Using an average cost of £344 this produces a per hectare cost of £51 across the totality of the restored area.
Stock fencing – 33,000 metres of stock fencing was put up at a price of £3-3.75/m. Where contractors have had to clear scrub by hand to lay the fence there was an additional cost (around £1/m). Assuming an average price of £3.38/m and no additional costs related to scrub clearance, as information on the extent of this was not available, this produces an average figure of £248 per hectare across the totality of the restored area.
Introduction of water supply – Water was only introduced on three sites, as in some cases it was agreed with land owners that they would pay for this and in others the sites contained natural water bodies like streams and ponds. On one of the three sites the project paid £1,000 for installation of pipes and trough, and on the other two sites it pays for the refilling of troughs and bowsers at a rate of £60-70 every 6 weeks. As this gives little basis on which to calculate an average figure for introduction of water supply across the restored area no such figure has been produced.
Agri-environment schemes offer capital payments toward most of the restoration activities listed above. In the case of Northern Ireland, we have only included payment rates available through CMS/ESA schemes as the MOSS scheme does not operate fixed rates but offers a percentage of actual capital costs ranging from 60-100%. Payments for scrub clearance are as follows:
HLES (England) - £228-583/ha
ESGMS (Scotland) - £800-2,400/ha
Tir Gofal (Wales) - £150-500/ha
49
HAP Costings Annexes
Payments for bracken clearance are as follows:
HLES - £48-112/ha
CMS/ESAS - £140-260/ha
Rural stewardship Scheme (Scotland) - £120/ha
Tir Gofal - £50-120
Payments for weed control:
ESGMS - £100-200/ha
Payments for re-seeding are as follows:
HLES – 100% of costs for native seed mixes
Rural Stewardship Scheme - £400/ha for sowing of species-rich grassland
Tir Gofal - £150/ha for the introduction of wild plants
Payments for fencing are as follows:
HLES - £2.25-4.00 per metre, with a £2.50 supplement for difficult sites and £220 for a bridle gate
CMS/ESAS (Northern Ireland) - £1.40-1.70 per metre
Rural Stewardship Scheme - £3-6 per metre
ESGMS - £1.80-2.50 per metre, with £100 per gate
Tir Gofal - £1.25-1.75 per metre
Payments for introduction of water are as follows:
HLES - £2 per metre for water supply, £119 for cattle drinking bay and £85 for water trough
CMS/ESAS - £0.90-1.00 per metre for water supply and £34 for water trough
Rural Stewardship Scheme & ESGMS – £2 per metre for piping and £200 for water trough
Tir Gofal - £0.40 per metre for piping and £100 for water trough.
The figures for the above mentioned projects demonstrate that restoration costs can be substantial, although in most cases they appear to be able to be covered by agri-environment payments. We have therefore decided to base our estimate of capital costs of restoration on the Coversands project’s costs for scrub, bracken and pine clearance, weed control and fencing, with figures added for re-seeding and the introduction of water supply.
The Coversands project did not do any grassland re-seeding given that it is primarily a heather site and an area that lends itself to natural regeneration through sympathetic grazing. Speaking to other people with experience of restoration and recreation it is clear that the need for re-seeding is site and approach dependent, but as one interviewee felt that re-seeding, for a variety of reasons, would only take place on a minority of sites we assume the extent of it to be 10% of the restored habitat as a whole. The costs of re-seeding are estimated to be £900 per hectare for the seeds
50
HAP Costings Annexes
(based on a recommended sowing rate of 20 kg/ha and an average price of £45/kg of seed mixture used for lowland dry acid grassland), and £200 per hectare for preparation of the site and actual sowing (based on generic cost calculations provided by an interviewee in connection with costing the lowland meadow HAP). This gives a total of £1,100/ha of re-seeded habitat. Based on the assumption of a re-seeding rate of 10% this produces an average per hectare cost of £110/ha across the whole of the restored area.
The figure for the introduction of water supply for grazing livestock is based on costs experienced by a project restoring lowland calcareous grassland, where the use of a water bowser over an area of 40 hectares resulted in a cost of £75 per hectare.
The total capital costs involved in restoring lowland dry acid grassland is therefore estimated to be £830 per hectare.
Re-establishment
Annual agri-environment scheme payment rates available for re-establishment of lowland dry acid grassland are the following:
In England, HLES pays £280 per hectare per year for creation of species rich, semi-natural grassland
In Northern Ireland, annual payments are not available for re-establishment from any of the schemes, as to be eligible grasslands have to meet the priority habitat definition, which they do not in the case of arable or improved grassland. However, we assume that to meet the target for re-establishment it will be necessary to pay land managers some kind of annual management payment in addition to the capital costs. We have therefore used the annual rate of maintenance payment of £147 for the purpose of calculating the costs involved in re-establishment in Northern Ireland.
In Scotland, the Rural Stewardship Scheme pays £250 per hectare for creation and management of species-rich grassland on eligible arable land, and £150 per hectare for creation and management of species-rich grassland on improved grassland. We have used a weighted annual payment average based on the extent of recent take-up of the two options. As one of these options has only been available for a year, take-up of it is likely to increase in future as it becomes more familiar to land managers, hence, we assume that uptake will grow from the current 7% to 15% of the total re-established area, which produces a weighted average payment rate of £235 per hectare.
In Wales, Tir Gofal pays £165 per hectare for conversion of arable land to semi-improved hay meadow, £210 for conversion of arable land to semi-improved grazed pasture, and £160 for conversion of improved grassland to semi-improved grassland used for either hay cutting or grazing pasture. We have calculated an average rate of £178 per hectare as it is impossible to establish how much of the habitat about to be re-established is likely to fall within each of the payment categories, not least as there is no data available for current uptake by individual habitats on which to base such a prediction on.
We assume that re-establishment of lowland dry acid grassland requires the same weed control, fencing and water supply costs as restoration. However, we have increased the costs for re-seeding based on an interviewee comment that the majority
51
HAP Costings Annexes
of the grassland re-establishment projects funded by agri-environment schemes involve re-seeding. Hence, re-seeding costs have been increased to £550 per hectare, equal to a re-sowing rate of 50%. We have omitted costs relating to scrub, bracken and pine clearance given that re-establishment will be from arable or improved grassland, neither of which are expected to be affected by this. This produces a capital cost total for re-establishment of £920 per hectare.
Other Costs
Implementation of the HAP for lowland dry acid grassland implies a number of other costs, the most substantial of which are expected to be research and monitoring. The extent of these has been estimated on the basis of previous years’ figures.
In the case of research, Defra as the primary funder of HAP related research is spending just under £935,000 on this in the 2005-06 financial year, largely on mesotrophic grassland. With the launch of the new Higher Level Environmental Stewardship Scheme it is likely that the introduction of new objectives under this scheme will reduce the funding available for grassland research. Hence, the total amount might drop to £750,000 in future years. Given this decline, we assume that the habitat will attract at the most 10% of the available mesotrophic grassland research funding, i.e. around £75,000 per year. To this, the individual countries might add additional research projects but these tend to be smaller contracts that do not add significantly to the existing figure.
Estimating the costs of monitoring is difficult, as RDS monitoring is geared towards agri-environment scheme objectives rather than the Biodiversity Action Plan, even if particular habitats have been and will continue to be monitored. Again, the fact that the Higher Level Environmental Stewardship Scheme involves more objectives than past schemes means that funding might need to be spread more thinly in the future. Currently, a 10 year programme of monitoring is being put together by Defra that is still to be costed, as is the programme of HAP monitoring that RDS and English Nature will be looking to develop in the context of the creation of Natural England. Based on information received from RDS on the relevance of different monitoring exercises for individual habitats, we assume that monitoring for lowland dry acid grassland will attract approximately £25,000-50,000 funding for monitoring per year from this source.
Other items like communications, publicity and advice on suitable habitat management practices are often activities that are undertaken and paid for via organisations’ statutory work programme, although in some cases specific activities will require additional funding. It has not been possible to cost these activities separately, and we estimate that these and the above mentioned other costs can all be accommodated within the 5% ‘other costs’ category added to the land-related costs.
52

HAP Costings Annexes
11 ANNEX 11: UPLAND CALCAREOUS GRASSLAND
Introduction
Delivery of the HAP for upland calcareous grassland involves site management work, aimed at maintaining sites in, or restoring them to favourable condition, as well as re-establishing areas of the habitat from arable or improved grassland. Work is also required in the areas of research, monitoring and dissemination of good practice in land management as well as general publicity about the habitat.
The habitat is well represented within the SSI/ASSI network and is found within a large number of NNRs. As figures for extent and condition of the habitat are not complete for all countries, due partly to ongoing survey work, it is too early to offer general statements as to the state of the habitat. However, it is under threat from intensive farming practices, including over-grazing, as well as from localised under-management and quarrying of limestone.
Maintenance
Maintenance of existing upland calcareous grassland depends mainly on maintaining appropriate cutting or grazing regimes, with some bracken and weed control. We assume that expenses involved in grazing such as for fencing and the introduction of water will already have been met in most cases as part of a past project to restore the site or as part of the ongoing management of it by grazing. In the case of bracken and weed control we assume that this forms an integral part of ordinary maintenance of the site, and that the costs of it are sufficiently small to be able to be covered by the annual management payments for maintenance available through agri-environment schemes. Hence, no additional capital costs have been added for maintenance of upland calcareous grassland in a favourable condition.
Annual agri-environment scheme payment rates available for maintenance of upland calcareous grassland are the following:
In England, the Higher Level Environmental Stewardship (HLES) Scheme pays £200 per hectare per year towards maintenance of species-rich, semi-natural grassland. As the Wildlife Enhancement Scheme for SSSI land is being phased out, and in the interim will be using HLES payments on new agreements, we assume the same rates for SSSI and non-SSSI land. A number of annual supplementary payments are available through HLES, but refer mostly to restoration rather than maintenance.
In Northern Ireland, the Countryside Management and the Environmentally Sensitive Areas Schemes (CMS/ESAs) pay £155 per hectare for species-rich dry grassland, whilst the Management of Sensitive Sites (MOSS) scheme, which is designed to ensure the positive management of land within Areas of Special Scientific Interest, pays £140 per hectare. As half of the habitat falls under each scheme we use an average payment rate of £147 per hectare.
In Scotland, the Rural Stewardship Scheme offers £100 per hectare for management of species-rich grassland, with an additional annual maintenance payment of £55 per hectare for scrub management. It has not been possible to
53

HAP Costings Annexes
get a figure for the extent of the take up of this supplement, which has therefore been discounted.
In Wales, Tir Gofal offers £130 per hectare for unimproved limestone grassland.
Restoration
Annual agri-environment scheme payment rates available for restoration of upland calcareous grassland are the following:
In England, HLES pays £200 per hectare per year for restoration of species rich, semi-natural grassland.
In Northern Ireland, there are no current plans to restore areas of the habitat, and annual payments are not available for restoration from any of the schemes, as to be eligible grasslands have to meet the priority habitat definition, which they do not in the case of semi-improved or neglected grassland. However, we assume that to meet any potential future restoration target it will be necessary to pay land managers some kind of annual management payment in addition to meeting capital costs. We have used the annual maintenance payment rate of £147 for this purpose.
In Scotland, no annual Rural Stewardship Scheme payment is available for restoration. However, we assume that to meet the restoration target it will be necessary to pay land managers some kind of annual management payment in addition to capital costs. We have therefore used the annual maintenance payment of £100 for the purpose of calculating the costs involved in restoration in Scotland.
In Wales, Tir Gofal pays £110 per hectare for conversion of semi-improved grassland to unimproved limestone grassland.
Restoration of upland calcareous grassland potentially involves a variety of different operations, the most common of which are:
Bracken clearance
Weed control
Fencing and other infrastructure related to keeping animals in the uplands
Introduction of water.
The extent of these activities depends on the nature of the site, e.g. remoteness, size of plot and steepness of the terrain. The Limestone Country Project in the Yorkshire Dales covers a total of 11,000 hectares, with existing work taking place on ca. 1,600 hectares. The project is trying to protect and improve sites by means of extensive grazing and some restoration activities. This has involved weed control and some bracken clearance, rabbit control, erection of handling pens and electric stock fencing, assistance with converting/building infrastructure (stabling) for livestock in the upland fields, introduction of electricity, introduction of water supply for grazing animals and payments towards purchase of straw and different livestock from those that had been grazing the sites in the past. The costs of these activities, excluding those relating to purchase of animals and straw, are as follows:
54
HAP Costings Annexes
Bracken control - £16,000 for a contractor to spray a 282 hectare site with limited bracken cover, i.e. £10 per hectare across the whole of the restored area.
Weed control – the project purchased a weed wiper to be borrowed by individual farmers who then pay for herbicide themselves. The cost is believed to be in the order of £2,000-3,000.
Rabbit control - £27,987 for two contractors to control rabbits by means of netting and some shooting. This amounts to £17 per hectare overall.
Pens - Each of the 16 participating farmers has been granted a pen, at a total cost of £5,683. The per hectare costs of this are £4 overall.
Fencing – No costs have been assigned to this as only electric fencing can be supported by the project as any other kind of fencing was believed to be covered by agri-environment schemes. No farmer has taken up the option of electric fencing.
Infrastructure – A total of £5,665 was spent on infrastructure improvements for four farmers. This produces a per hectare figure of £4 overall.
Introduction of electricity – Was only introduced for one farmer at the cost of £600, which amounts to £0.40 per hectare overall.
Introduction of water supply – A total of £8.896 has been spent on introducing water for five farmers. This produces a per hectare figure of £6 overall.
The project did not undertake any scrub control or re-seeding, so in total the costs included for the purpose of this exercise come to £41 per hectare.
Agri-environment schemes offer capital payments toward most of the restoration activities listed above. Payments for bracken clearance are as follows:
HLES (England) - £48-112/ha
CMS/ESAS (Northern Ireland) - £140-260/ha
Rural stewardship Scheme (Scotland) - £120/ha
Tir Gofal (Wales) - £50-120
Payments for fencing are as follows:
HLES - £2.25-4.00 per metre, with a £2.50 supplement for difficult sites and £220 for a bridle gate
CMS/ESAS - £1.40-1.70 per metre
Rural Stewardship Scheme - £3-6 per metre
Tir Gofal - £1.25-1.75 per metre
Payments for introduction of water are as follows:
HLES - £2 per metre for water supply, £119 for cattle drinking bay and £85 for water trough
CMS/ESAS - £0.90-1.00 per metre for water supply and £34 for water trough
55
HAP Costings Annexes
Rural Stewardship Scheme & ESGMS – £2 per metre for piping and £200 for water trough
Tir Gofal - £0.40 per metre for piping and £100 for water trough.
As the project costs above are well within the scope of agri-environment payment we have decided to base our cost estimate for restoration of upland calcareous grassland on those in combination with two additional cost items. Thus, we have added £30 per hectare for weed control based on costs experienced by an upland hay meadow project and the assumption that 10% of the area of restored upland calcareous grassland will need weed control. We have also added £240 for stock fencing based on the assumption that fencing at £4 per metre is needed on 10% of the restored area with an assumed field size of half a hectare. This produces a total capital cost figure of £311 per hectare. As scrub cover is not a problem on upland calcareous grassland in England and Scotland where the majority of the habitat is located we have not included a figure for it in these costings, although we are aware that some such costs might be incurred in Wales and Northern Ireland. Neither do we assume that re-seeding will take place in connection with restoration as most restoration is about adjustment of the grazing regime.
Re-establishment
Annual agri-environment scheme payment rates available for re-establishment of upland calcareous grassland are the following:
In England, HLES pays £280 per hectare per year for creation of species rich, semi-natural grassland
In Northern Ireland, annual payments are not available for re-establishment, but it is assumed that annual costs will equate to the annual maintenance payment of £147 per hectare.
In Scotland, the Rural Stewardship Scheme pays £250 per hectare for creation and management of species-rich grassland on eligible arable land, and £150 per hectare for creation and management of species-rich grassland on improved grassland. We have used a weighted annual payment rate of £235 per hectare.
In Wales, Tir Gofal pays £165 per hectare for conversion of arable land to semi-improved hay meadow, £210 for conversion of arable land to semi-improved grazed pasture, and £160 for conversion of improved grassland to semi-improved grassland used for either hay cutting or grazing pasture. This gives an average rate of £178 per hectare.
We assume that re-establishment of upland calcareous grassland requires the same activities and therefore costs as restoration, i.e. £311 per hectare. In the case of Northern Ireland and Wales, additional costs relating to scrub clearance and re-seeding might be encountered as some of the habitat will be at a lower altitude than in England and Scotland. However, as only the minority of the habitat is located in the former two countries we have not added any figures for these activities.
Other Costs
Implementation of the HAP for upland calcareous grassland implies a number of other costs, the most substantial of which are expected to be research and monitoring. The extent of these has been estimated on the basis of previous years’ figures.
56
HAP Costings Annexes
In the case of research, Defra as the primary funder of HAP related research is spending just under £935,000 on this in the 2005-06 financial year, largely on mesotrophic grassland. With the launch of the new Higher Level Environmental Stewardship Scheme it is likely that the introduction of new objectives under this scheme will reduce the funding available for grassland research. Hence, the total amount might drop to £750,000 in future years. Given this decline, we assume that the habitat will attract at the most 10% of the available mesotrophic grassland research funding, i.e. around £75,000 per year. To this, the individual countries might add additional research projects but these tend to be smaller contracts that do not add significantly to the existing figure.
Estimating the costs of monitoring is difficult, as RDS monitoring is geared towards agri-environment scheme objectives rather than the Biodiversity Action Plan, even if particular habitats have been and will continue to be monitored. Again, the fact that the Higher Level Environmental Stewardship Scheme involves more objectives than past schemes means that funding might need to be spread more thinly in the future. Currently, a 10 year programme of monitoring is being put together by Defra that is still to be costed, as is the programme of HAP monitoring that RDS and English Nature will be looking to develop in the context of the creation of Natural England. Based on information received from RDS on the relevance of different monitoring exercises for individual habitats, we assume that monitoring for upland calcareous grassland will attract approximately £25,000 funding for monitoring per year from this source.
Other items like communications, publicity and advice on suitable habitat management practices and available financial support are often activities that are undertaken and paid for by organisations’ statutory work programme, although in some cases specific activities will require additional funding. It has not been possible to cost these activities, but we believe that these and the above mentioned other costs can all be accommodated by adding a 5% mark-up to land-related costs.
57
HAP Costings Annexes
12 ANNEX 12: UPLAND HAY MEADOWS
Introduction
Delivery of the HAP for upland hay meadows involves site management work, aimed at maintaining sites in, or restoring them to favourable condition, as well as re-establishing areas of the habitat from arable or improved grassland. Work is also required in the areas of research, monitoring and dissemination of good practice in land management as well as general publicity about the habitat.
The habitat has undergone a significant decline and is expected to continue to do so due to a combination of under-management and intensification.
Maintenance
Maintenance of existing upland hay meadows depends mainly on maintaining appropriate cutting or grazing regimes, with some weed control. We assume that expenses involved in grazing such as for fencing and the introduction of water will already have been met in most cases as part of a past project to restore the site or as part of the ongoing management. In the case of weed control we assume that this forms an integral part of ordinary maintenance of the site, and that the costs of it are sufficiently small to be able to be covered by the annual management payments for maintenance available through agri-environment schemes. Hence, no additional capital costs have been added for maintenance of upland hay meadows in a favourable condition.
Annual agri-environment scheme payment rates available for maintenance of upland hay meadows are the following:
In England, the Higher Level Environmental Stewardship (HLES) Scheme pays £200 per hectare per year towards maintenance of species-rich, semi-natural grassland. As the Wildlife Enhancement Scheme for SSSI land is being phased out, and in the interim will be using HLES payments on new agreements, we assume the same rates for SSSI and non-SSSI land. A number of annual supplementary payments are available through HLES, but these refer mainly to restoration.
In Scotland, the Rural Stewardship Scheme offers £100 per hectare for management of species-rich grassland.
Restoration
Annual agri-environment scheme payment rates available for restoration of upland hay meadows are the following:
In England, HLES pays £200 per hectare per year for restoration of species rich, semi-natural grassland.
In Scotland, no annual Rural Stewardship Scheme payment is available for restoration. However, we assume that to meet the restoration target it will be necessary to pay land managers some kind of annual management payment in addition to capital costs. We have therefore used the annual rate of maintenance payment of £100.
58
HAP Costings Annexes
Restoration of upland hay meadows potentially involves a variety of different operations, the most common of which are:
Bracken clearance
Weed control
Re-seeding
Fencing
Introduction of water.
Agri-environment schemes offer capital payments towards most of the restoration activities listed above. Payments for bracken clearance are as follows:
HLES - £48-112/ha
Rural stewardship Scheme (Scotland) - £120/ha
Payments for re-seeding are as follows:
HLES – 100% of costs for native seed mixes
Rural Stewardship Scheme - £400/ha for sowing of species-rich grassland
Payments for fencing are as follows:
HLES - £2.25-4.00 per metre, with a £2.50 supplement for difficult sites and £220 for a bridle gate
Rural Stewardship Scheme - £3-6 per metre
Payments for introduction of water are as follows:
HLES - £2 per metre for water supply, £119 for cattle drinking bay and £85 for water trough
Rural Stewardship Scheme & ESGMS – £2 per metre for piping and £200 for water trough
We base our estimate of the capital costs of restoration on a combination of costs experienced by the Black Bank Meadows Project described in the section on re-establishment, as well as evidence relating to other grassland habitats. We assume that restoration of upland hay meadows requires the same liming, weed control, rabbit and stock fencing, and water supply costs as re-establishment. To these have been added £115/ha for the costs of re-seeding based on the Black Bank Meadows Project and a project to create lowland meadow but using a sowing rate of only 10% of the habitat, as re-seeding is believed to be needed on only a minority of the area in restoration projects. This produces a capital cost total for restoration of £1,245 per hectare.
Re-establishment
Annual agri-environment scheme payment rates available for re-establishment of upland hay meadows are the following:
In England, HLES pays £280 per hectare per year for creation of species rich, semi-natural grassland
In Scotland, the Rural Stewardship Scheme pays £250 per hectare for creation and management of species-rich grassland on eligible arable land, and £150 per hectare for creation and management of species-rich
59
HAP Costings Annexes
grassland on improved grassland. We have used a weighted annual payment rate of £235 per hectare.
The Black Bank Meadows Project undertook to re-establish upland hay meadow on half a hectare of species-poor and neglected land, which was also contaminated by heavy metals and fluoride. The process involved soil analyses, liming to increase the pH, cultivating and weed control, erection of rabbit fencing, re-seeding and rolling. All operations were undertaken by the project manager as part of a PhD project and by volunteers. Hence, the costs do not include payment for labour apart from in the case of application of herbicide, cultivation and rolling. The costs were as follows:
Liming to increase the pH – applied 2 tonnes of lime on half a hectare at a cost of £40.
Weed control - Application of herbicide at £150 for half a hectare. The site was extremely neglected and herbicide could therefore only be applied following some grazing by sheep to reduce the height of the growth. There was no need for scrub removal.
Cultivating by rotovator - £25 for half a hectare. Rotovator used as the contamination prevented ploughing.
Erection of rabbit fence - £700 for half a hectare. Stock fencing was not needed, as the site was already fenced.
Re-seeding - £1,088 for half a hectare applying 13 kg.
Rolling following sowing - £25 for half a hectare.
Total per hectare cost came to £4,056, but would have been higher if the majority of the work had not been done by the project manager and volunteers.
Estimates of the capital costs of re-establishment have been based on a combination of costs experienced by the Black Bank Meadows Project, as well as information provided by consultees about the costs of management of other grassland HAPs. Thus, for the re-establishment of upland hay meadows we assume per hectare liming costs of £20 (based on an assumed need in 25% of cases on upland grounds); weed control costs of £45 (based on use on 15% of the area); re-seeding and rolling costs of £575 (based on an assumption that re-seeding is needed on 50% of the area and that the cost is an average between the Black Bank Meadows project and a lowland meadows creation project where the cheaper method of green hay spreading was used); rabbit fencing costs of £700 (based on an assumed need to rabbit fence 50% of the area); stock fencing costs of £240 (based on the assumption that fencing at £4 per metre is needed on 10% of the restored area with an assumed field size of half a hectare); and water supply costs of £75 per hectare. Total capital costs of re-establishment are therefore £1,705 per hectare.
Other Costs
Implementation of the HAP for upland hay meadows involves a number of other costs, the most substantial of which are expected to be research and monitoring. The extent of these has been estimated on the basis of previous years’ figures.
In the case of research, Defra as the primary funder of HAP related research is spending just under £935,000 on this in the 2005-06 financial year, largely on mesotrophic grassland. With the launch of the new Higher Level Environmental Stewardship Scheme it is likely that the introduction of new objectives under this
60
HAP Costings Annexes
scheme will reduce the funding available for grassland research. Hence, the total amount might drop to £750,000 in future years. The habitat is likely to attract a very small proportion of the available mesotrophic grassland research funding. To this, the individual countries might add additional research projects but these tend to be smaller contracts that do not add significantly to the existing figure.
Estimating the costs of monitoring is difficult, as RDS monitoring is geared towards agri-environment scheme objectives rather than the Biodiversity Action Plan, even if particular habitats have been and will continue to be monitored. Again, the fact that the Higher Level Environmental Stewardship Scheme involves more objectives than past schemes means that funding might need to be spread more thinly in the future. Currently, a 10 year programme of monitoring is being put together by Defra that is still to be costed, as is the programme of HAP monitoring that RDS and English Nature will be looking to develop in the context of the creation of Natural England. Based on information received from RDS on the relevance of different monitoring exercises for individual habitats, we assume that monitoring for upland hay meadows will attract approximately £25,000 funding for monitoring per year from this source, as part of budgets for delivery of agri-environment schemes.
Other items like communications, publicity and advice on suitable habitat management practices and available financial support are often activities that are undertaken and paid for via organisations’ statutory work programme, although in some cases specific activities will require additional funding. It has not been possible to cost these activities, but we believe that these and the above mentioned other costs can all be accommodated within the 5% ‘other costs’ category added to the land-related costs.
61
HAP Costings Annexes
13 ANNEX 13: LOWLAND MEADOW
Introduction
Delivery of the HAP for lowland meadows mainly involves site management work, aimed at maintaining sites in, or restoring them to favourable condition, as well as re-establishing areas of the habitat from arable or improved grassland. Work is also required in the areas of research, monitoring and dissemination of good practice in land management as well as general publicity about the habitat.
The habitat has undergone a significant decline and is expected to continue to do so, due to a combination of under-management and intensification.
Maintenance
Maintenance of existing lowland meadows depends mainly on maintaining appropriate cutting or grazing regimes, with some weed control. We assume that expenses involved in grazing such as for fencing and the introduction of water will already have been met in most cases as part of a past project to restore the site or as part of the ongoing management of it by grazing. In the case of weed control we assume that this forms an integral part of ordinary maintenance of the site, and that the costs of it are sufficiently small to be able to be covered by the annual management payments for maintenance available through agri-environment schemes. Hence, no additional capital costs have been added for maintenance of lowland meadows in a favourable condition.
Annual agri-environment scheme payment rates available for maintenance of lowland meadows are the following:
In England, the Higher Level Environmental Stewardship (HLES) Scheme pays £200 per hectare per year towards maintenance of species-rich, semi-natural grassland. As the Wildlife Enhancement Scheme for SSSI land is being phased out, and in the interim will be using HLES payments on new agreements, we assume the same rates for SSSI and non-SSSI land.
In Northern Ireland, the Countryside Management and Environmentally Sensitive Areas Schemes (CMS/ESAs) pay £155 per hectare for grazed species-rich dry grassland and £170 when it is managed as hay meadow, while the Management of Sensitive Sites (MOSS) scheme, which is designed to ensure the positive management of land within Areas of Special Scientific Interest, pays £140 per hectare. An average figure of the three payment rates is £155 per hectare. A supplement of £240 is available for hay making under MOSS but is rarely taken up and has therefore been discounted.
In Scotland, the Rural Stewardship Scheme offers £100 per hectare for management of species-rich grassland. The East Scotland Grassland Management Scheme (ESGMS) specifically for SSSI land offers variable rates depending on the size of the site and whether it is cut or grazed. Based on information provided by interviewees on the prevailing size and use of sites the average rate of payment through ESGMS is £89 per hectare. This produces an overall average for the two schemes of £95 given that each scheme is believed to cover 50% of the habitat.
In Wales, Tir Gofal offers £90 per hectare for unimproved neutral grassland.
62
HAP Costings Annexes
Based on the interviews undertaken it is clear that the extent and quality of the habitat is declining, and that maintenance regimes are not always conducive to its preservation. In that situation, it might be argued that the agri-environment maintenance payments are not sufficient to ensure that sites stay in a favourable condition. This suggests that the costs identified above may be conservative, but also that there is a need for ongoing advisory and awareness raising activities, both in the delivery of schemes and more widely.
Restoration
Restoration of lowland meadows potentially involves a variety of different operations, the most common of which are:
Scrub clearance
Bracken clearance
Weed control
Re-seeding
Fencing
Introduction of other grazing infrastructure (e.g. water).
Agri-environment schemes offer capital payments towards all of the restoration activities listed above.
Payments for scrub clearance are as follows:
HLES (England) - £228-583/ha
ESGMS (Scotland) - £800-2,400/ha
Tir Gofal (Wales) - £150-500/ha
Payments for bracken clearance are as follows:
HLES - £48-112/ha
CMS/ESAs (Northern Ireland) - £140-260/ha
Rural Stewardship Scheme (Scotland) - £120/ha
Tir Gofal - £50-120/ha
Payments for weed control:
ESGMS - £100-200/ha
Payments for re-seeding are as follows:
HLES – 100% of costs for native seed mixes
Rural Stewardship Scheme - £400/ha for sowing of species-rich grassland
Tir Gofal - £150/ha for the introduction of wild plants
Payments for fencing are as follows:
HLES - £2.25-4.00 per metre, with a £2.50 supplement for difficult sites and £220 for a bridle gate
CMS/ESAs - £1.40-1.70 per metre
Rural Stewardship Scheme - £3-6 per metre
63
HAP Costings Annexes
ESGMS - £1.80-2.50 per metre, with £100 per gate
Tir Gofal - £1.25-1.75 per metre
Payments for introduction of water are as follows:
HLES - £2 per metre for water supply, £119 for cattle drinking bay and £85 for water trough
CMS/ESAs - £0.90-1.00 per metre for water supply and £34 for water trough
Rural Stewardship Scheme & ESGMS – £2 per metre for piping and £200 for water trough
Tir Gofal - £0.40 per metre for piping and £100 for water trough.
We base our estimate of the capital costs of restoration on a combination of costs experienced by the Chimney Meadows Project described in the section on re-establishment, as well as evidence relating to other grassland habitats. We assume that restoration of lowland meadows requires the same stock fencing and water supply costs as re-establishment. To these has been added £40 per hectare for the costs of re-seeding based on the Chimney Meadows Project but using a sowing rate of only 10% of the habitat, as re-seeding is believed to be needed on only a minority of the area in restoration projects. We have also added £60 per hectare for scrub clearance and £25 for bracken clearance based on costs experienced by a lowland dry acid grassland restoration project. This produces a capital cost total for restoration of ca. £450 per hectare.
Annual agri-environment scheme payment rates available for restoration of lowland meadows are the following:
In England, HLES pays £200 per hectare per year for restoration of species rich, semi-natural grassland.
In Northern Ireland, annual payments are assumed to equate to the annual maintenance payment rate of £155/ha.
In Scotland, annual payments are assumed to equate to the annual maintenance payment of £95.ha.
In Wales, Tir Gofal pays £130 per hectare for conversion of semi-improved grassland to neutral grassland.
Re-establishment
Annual agri-environment scheme payment rates available for re-establishment of lowland meadows are the following:
In England, HLES pays £280 per hectare per year for creation of species rich, semi-natural grassland
In Northern Ireland, annual payments are not available for re-establishment but we assume that the annual rate of maintenance payment of £155 per hectare applies.
In Scotland, the Rural Stewardship Scheme pays £250 per hectare for creation and management of species-rich grassland on eligible arable land, and £150 per hectare for creation and management of species-rich
64
HAP Costings Annexes
grassland on improved grassland. We have used a weighted average payment rate of £235 per hectare.
In Wales, Tir Gofal pays £165 per hectare for conversion of arable land to semi-improved hay meadow, £210 for conversion of arable land to semi-improved grazed pasture, and £160 for conversion of improved grassland to semi-improved grassland used for either hay cutting or grazing pasture. An average rate of £178 per hectare is assumed, as no data is available for current uptake of different options.
The Chimney Meadows Project is re-establishing 68 hectares of wildlife meadow from former arable fields. The processes involved are:
Ground preparation, including application of herbicide and disk harrowing.
Re-seeding by harvesting of green hay from the neighbouring NNR and spreading it on the Chimney Meadows site with a muck spreader
Topping in spring in order to cut back the early growth of competitive grasses to allow the smaller herbaceous plants such as yellow rattle to come through.
Hay cutting in July followed by aftermath grazing.
A breakdown of costs for the individual operations is not available. However, the total cost was £8,550 for ground preparation and hay harvest and spreading, which amounts to £125 per hectare. This figure does not include the initial expense relating to purchase of equipment for the operations. The topping was not costed as the Wildlife Trust owns its own tractor and topper. As the hay cutting and aftermath grazing is seen as ongoing management the costs of this have not been included. The project has not had to erect fencing and introduce water supply for the grazing animals, as the sheep grazier they are using has put up his own electric fencing and provided a water bowser. Also, the site was already fenced in some places.
According to the Weald Meadows Initiative, which delivers advice to local land owners on meadow restoration and recreation, green hay spreading can be more cost effective than ordinary re-seeding if the land manager has access to own good quality hay crop and machinery. However, where that is not the case, hay purchase, machine rental and contractor fees will increase the costs of the operation, and/or force land managers to re-seed instead. Costs are assumed to be an average of the hay spreading cost in the Chimney Meadows Project and the costs of re-seeding (typically around £825/ha, including £150 for ground preparation such as herbicide spraying, ploughing, disking, harrowing, rolling, the actual seed casting and eventual topping6, and £675 for seeds, assuming a price of £45 per kg and the use of 15 kg per hectare)7. As a result, an average per hectare cost of £475 for green hay spreading/re-seeding is assumed. Given the assumption that 50% of sites would need this, an amount of £240/ha is used. In addition to this, we assume £248/ha for fencing based on the experience of a lowland dry acid grassland restoration project, and £75 for water supply based on the experience of a lowland calcareous grassland restoration project. This produces a per hectare capital cost of re-establishing lowland meadow of £563.
6 Costs provided by Jim Swanson, the Grazing Animals Project. 7 Costs provided by the Weald Meadows Initiative.
65
HAP Costings Annexes
Other Costs
Implementation of the HAP for lowland meadows implies a number of other costs, the most substantial of which are expected to be research and monitoring. The extent of these has been estimated on the basis of previous years’ figures.
In the case of research, Defra as the primary funder of grassland HAP related research is spending just under £935,000 on this in the 2005-06 financial year, largely on mesotrophic grassland. With the launch of the new Higher Level Environmental Stewardship Scheme it is likely that the introduction of new objectives under this scheme will reduce the funding available for grassland research. Hence, the total amount might drop to £750,000 in future years. Given this decline, we assume that the habitat will attract at the most 10% of the available mesotrophic grassland research funding, i.e. around £75,000 per year. To this, the individual countries might add additional research projects but these tend to be smaller contracts that do not add significantly to the existing figure.
Estimating the costs of monitoring is difficult, as RDS monitoring is geared towards agri-environment scheme objectives rather than the Biodiversity Action Plan, even if particular habitats have been and will continue to be monitored. Again, the fact that the Higher Level Environmental Stewardship Scheme involves more objectives than past schemes means that funding might need to be spread more thinly in the future. Currently, a 10 year programme of monitoring is being put together by Defra that is still to be costed, as is the programme of HAP monitoring that RDS and English Nature will be looking to develop in the context of the creation of Natural England. Based on information received from RDS on the relevance of different monitoring exercises for individual habitats, we assume that monitoring for lowland meadows will attract approximately £50,000 funding per year from this source. These costs can be assumed to be included in the costs of delivery and administration of agri-environment schemes.
Other items including communications, publicity and advice on suitable habitat management practices and available financial support are often activities that are undertaken and paid for by organisations’ statutory work programme, although in some cases specific activities will require additional funding. It has not been possible to cost these activities, but it is assumed that they are covered by adding a 5% mark-up to land management costs to cover all other costs.
66
HAP Costings Annexes
14 ANNEX 14: HEDGEROWS
Introduction
Delivery of the HAP for hedgerows involves management work to maintain hedges in or restore them to favourable condition, as well as expanding the net length of hedgerow. Work is also required in the areas of research, monitoring, advice and dissemination of good practice in land management as well as general publicity about hedgerows.
The largest share of the habitat is located in England and Northern Ireland, although all countries have experienced a significant decline in hedgerows since 1945. The main threats have been too frequent and badly timed cutting; neglect through no cutting and laying; use of herbicides, pesticides and fertilisers too closely to the hedge; and loss of hedgerow tress that have not been replaced.
Maintenance
Maintenance of hedgerows does not generally require intensive management, but involves an appropriate cutting regime (frequency, timing and degree of trimming) as well as refraining from the use of herbicides, pesticides and fertilisers in a zone close to the hedge.
Based on interviewee information, a buffer strip of 2 metres has been considered sufficient to meet Target 6. To avoid double counting agri-environment support for margins around hedges and cereal field margins, we have only assumed grant support for hedge buffer zones around grassland. Based on data provided by the Centre of Ecology & Hydrology the share of hedgerows around grasslands of the total extent of hedge in Great Britain is 62%, and we therefore assume that the buffer zone payment for hedgerows included in this HAP should also equal 62% of the total available rate of payment.
Improving the condition of the hedgerow tree population by increasing the number of young trees we also see as part of good management rather than as expansion, as it is not meant to lead to a net increase in the length of hedgerow. Hence, capital costs for tree planting need to be added to the annual management payments available for maintaining hedgerows in a favourable condition.
Annual agri-environment scheme payment rates available for maintenance of hedgerows are the following:
In England, the Entry Level Stewardship (ELS) Scheme provides the following options that should ensure favourable management:
o Three options for hedgerow management offering between 11-42 points (equal to £11-42) per hundred metres of hedgerow, and three options offering 26-56 points (equal to £26-56) per hundred metres of combined hedge and ditch management. ELS take-up data show that the vast majority use two of the six options so an average figure of £16 per hundred metres, equal to £0.16 per metre, for those two options, is assumed to be an appropriate unit cost.
o Three options providing support for buffer strips on intensive grassland that offer 300-400 points (equal to £300-400) per
67
HAP Costings Annexes
hectare. For a buffer strip of 2 metres the payment is £300 per hectare, equal to £0.03 per square metre, which amounts to £0.06 per metre of hedge involved in meeting Target 6. Assuming that buffer strips are grant aided on 62% of hedges gives an estimated of £0.04 per metre.
The combined maintenance cost is therefore £0.20 per metre or £200 per km.
In Northern Ireland, there is no annual payment available for hedgerow maintenance at present, but there should be in 2008 when a new Entry Level Scheme is introduced. For the purpose of these costings we are therefore using the annual English maintenance payment of £0.16 per metre. Payments are, however, available for grass margins/field corners on improved and unimproved grassland, of which the relevant option for ungrazed margins/corners offers £420 per hectare, equal to £0.04 per square metre. This amounts to £0.08 per metre of hedge involved in meeting Target 6. If applied to 62% of hedges this gives an estimate of £0.05 per metre. The total maintenance cost is therefore assumed to be £0.21 per metre or £210 per km.
In Scotland, the Rural Stewardship Scheme provides the following options that should ensure favourable management:
o £5,000 per hectare (equal to £0.50 per square metre) for management of hedgerows, and £500 per hectare (equal to £0.05 per square metre) for management of extended (taller and wider) hedgerows. We assume that 50% of hedgerows fall into each category, which gives an average rate of £0.28 per square metre or metre of hedgerow (assuming an average width of 1m).
o £70 and £150 per hectare for management of conservation headlands where herbicides, pesticides and fertilisers are not applied close to the hedge. We assume an average payment of £110 per hectare, equal to £0.01 per square metre, and thus £0.02 per metre of hedge involved in meeting Target 6. Assuming this applied to 62% of hedgerow gives an average cost of £0.01 per metre.
The combined maintenance payment is therefore £0.29 per metre or £290 per km.
In Wales, maintenance of hedgerows is covered by the Whole Farm Scheme of Tir Gofal. The payment rates are:
o £0.02 per metre for hedgerow maintenance.
o £0.02 per metre for buffer zones; £450 per hectare, equal to £0.04 per square metre, for uncropped fallow margins alongside cereal and root crops; and £350 per hectare, equal to £0.03 per square metre, for rough grass margins alongside arable and root crops. As we do not have any uptake figures for each of these options, we assume they each count for one third which gives an average payment rate of £0.03 per metre involved in meeting Target 6.
These costs look unusually low compared to the payment rates available in the other countries, and it is assumed that to meet the Welsh target an increase in payment would be needed. We therefore apply the rate of payment available for Northern Ireland of £0.21 per metre and £210 per km.
68
HAP Costings Annexes
The following capital payments are available for tree planting:
In England, the Higher Level Environmental Stewardship Scheme (HLES) offers £1.60 for Tree and shrub/whips and transplants plus planting and £7.50 for Standard parkland tree/hedgerow tree and planting. Between 1998-2004 mostly the first payment was used, as it was not implicitly clear that the latter was available for hedgerows. Now that this is the case, we assume an increase in its use, and have therefore used an average rate of £4.50 per tree.
In Northern Ireland, planting of new trees is included within the Countryside Management Scheme/Environmentally Sensitive Areas Scheme (CMS/ESA) payments for laying/restoring a hedge which range from £6-10 per metre. In this case we do not see the planting of new trees as restoration given that the target aims merely at maintaining a balanced age structure through new planting. We have therefore decided to use a rate of £3 (half the lower hedgerow restoration payment) per tree for the purpose of our calculations.
In Scotland, the Rural Stewardship Scheme offers the following payments relating to tree planting: £1.50 per small tree and £7.50 per standard size tree, giving an average payment of £4.50; £1.10 per tree guard and stake; and £0.50 per self-supporting guard for hedge plants. We assume that the latter two payments will only be taken up in 25% of cases, which adds another £0.50 to the tree planting rate. Hence, we are assuming a capital cost for tree planting in Scotland of £5 per tree.
In Wales, planting of new trees is included in Tir Gofal, which offers payment for restoring hedgerows of £2 per metre. In this case we do not see the planting of new trees as restoration given that the target aims merely at maintaining a balanced age structure through new planting. We have therefore decided to use a rate of £1 (half the hedgerow restoration payment) per tree for the purpose of our calculations. To that is added £2.4 per metre for rabbit fencing around trees. This gives a total for tree planting of £3.40 per tree.
Restoration
Restoration of hedgerows generally involves laying, coppicing and gapping up of hedgerows, and might also involve top binding and staking, removal of old fence lines and erection of new fencing to protect the hedge from grazing animals. According to 2004 uptake figures for Countryside Stewardship and Environmentally Sensitive Areas Schemes (England), new fencing has been erected in ca. 25% of hedgerow restoration cases, and we assume this rate can be applied across the UK.
As we assume that the share of the habitat under restoration should be included within the increase in the maintenance target from the 2005 baseline to the 2010 target we have not listed annual agri-environment payments for restoration, but merely refer to the annual maintenance payments.
However, restoration does require capital works and these have been costed based on the agri-environment payments available. Most agri-environment schemes offer capital cost payments for hedge restoration. These are:
69
HAP Costings Annexes
In England, HLES pays £5 per metre for hedgerow restoration, including laying, coppicing and gapping up. In addition, supplements can be granted for removal of old fence lines (£0.60/m), substantial pre-work before restoration (£2.40/m), and top binding and staking (£2.40/m). We make the following assumptions regarding need for these supplements: removal of old fence lines will happen in 50% of cases, equal to £0.30 per metre of the total restored area; substantial pre-work will happen in 20% of cases, equal to £0.50 per metre of the total restored area; and top binding and staking will happen in 75% of cases, equal to £1.80 per metre of the total restored area. We assume restoration costs relating to fencing to be £0.45 per metre based on an HLES payment rate for sheep fencing of £1.80/metre and a need to erect fencing in 25% of restoration cases. This produces an average per metre capital cost of restoration of £8.
In Northern Ireland, CMS/ESA offers a number of options for laying/restoring a hedge as well as erecting fencing along it. As fencing is included within some of the options it has not been necessary to cost the fencing separately. The figures suggest a combined average rate of £6 per metre for hedge restoration and fencing in Northern Ireland.
In Scotland, the annual Rural Stewardship Scheme payments for management of ordinary and extended hedgerows are supposed to cover restoration activities such as coppicing, laying and planting to fill in gaps, for which no capital payments therefore exist. In addition to which costs for erection of fencing can receive payment. However, the capital costs of restoration works are significantly higher than the annual management payments available, and an average restoration cost similar to that of Northern Ireland is assumed, i.e. £6 per metre for capital works of restoration and fencing.
In Wales, Tir Gofal pays £2 per metre for hedgerow restoration, including laying and coppicing, and £11 per metre for restoration of stone faced earth banks, many of which have hedges on top. We are assuming that 20% of hedges are on top of earth banks, which gives an average rate for the two payments of £3.80 per metre for restoration of hedgerows. In addition, Tir Gofal pays £1.75 per metre for post & wire fencing with stock netting supplement, and assuming a need to fence in 25% of cases this amounts to a capital cost of fencing of £0.44 per metre of restored hedge. This gives a total capital cost for restoration of £4.24 per metre.
Following the required capital cost activities involved in restoration we assume that the length of hedgerow under restoration is offered an annual agri-environment maintenance or restoration payment. Following a 10 year restoration period the length of restored hedgerow is added to the length of hedgerow under favourable management for the purpose of the cost calculation.
Expansion
Achieving an increase in net length of hedgerows in the UK requires planting of new hedges as well as erection of fencing where this is needed to protect the hedge from grazing animals. According to 2004 uptake figures for Countryside Stewardship and Environmentally Sensitive Areas Schemes (England), new fencing has been erected in ca. 15% of hedgerow creation cases, and we assume this rate can be applied across the UK.
Agri-environment schemes in the UK offer capital payments for hedge planting. Hedges are then eligible for annual maintenance payments, as reviewed above.
70

HAP Costings Annexes
Agri-environment schemes offer the following payments for the costs of hedge creation:
In England, HLES pays £5.00 per metre for new planted hedges. Costs relating to fencing are assumed to be £0.27 per metre based on an HLES payment rate for sheep fencing of £1.80/metre and a need to erect fencing in 15% of creation cases. This produces an average per metre capital cost of hedgerow creation of ca. £5.30.
In Northern Ireland, planting of new trees is included within the Countryside Management Scheme/Environmentally Sensitive Areas Scheme (CMS/ESA) payments for laying/restoring a hedge ranging from £6-10 per metre of hedge. We have decided to use a rate of £3 (half the lower hedgerow restoration payment) per tree for the purpose of calculating the costs of creating new hedge by means of tree planting. Costs relating to fencing are assumed to be £0.23 per metre based on an average CMS/ESA payment rate for different fencing options of £1.50/metre and a need to erect fencing in 15% of creation cases. This produces an average per metre capital cost of hedgerow creation of ca. £3.30.
In Scotland, the Rural Stewardship Scheme offers the following payments relating to tree planting: £1.50 per small tree and £7.50 per standard size tree, giving an average payment of £4.50; £1.10 per tree guard and stake; and £0.50 per self-supporting guard for hedge plants. We assume that the latter two payments will only be taken up in 25% of cases, which adds another £0.50 to the tree planting rate. This gives a capital cost for tree planting in Scotland of £5 per tree. We assume the need to plant one tree per metre giving a per metre cost of £5. Costs relating to fencing are assumed to be £0.45 per metre based on the Rural Stewardship payment rate for stock fencing of £3/metre and a need to erect fencing in 15% of creation cases. This produces a total per metre capital cost of hedgerow creation of ca. £5.50.
In Wales, Tir Gofal pays £2 per metre for hedgerow restoration, which also covers planting of new hedges. In addition, Tir Gofal pays £1.75 per metre for post & wire fencing with stock netting supplement, and assuming a need to fence in 15% of cases this amounts to a capital cost of fencing of £0.26 per metre of restored hedge. This gives a total per metre capital cost of hedgerow creation of £2.26.
Other Costs
While the majority of costs of implementing the HAP for hedgerows relate to land management, other costs include:
Advice and guidance to land manager on land management practices that would help achieve the targets set out in the HAP, including information on the financial incentives available for implementing such practices offered by agri-environment schemes. The advice and guidance will be provided through existing channels such as the Defra demonstration farms programme as well as new publications.
Monitoring and surveying of hedgerows to assess the quality (including new attributes such as species-richness) and quantity of the resource across the country, as well as to raise awareness of hedgerow conservation issues locally. The survey programmes believed to achieve this are Countryside Survey, Farm Practices Survey and ADAS’ Farmers Voice questionnaire, as
71
HAP Costings Annexes
well as Defra grant-aided local surveys and an updated version of the hedgerow survey handbook.
A number of topics for research have been outlined, including research into new hedgerow management techniques, the attributes of healthy hedgerows, biodiversity benefits of isolated hedgerow trees and the effect of hedgerows of climate change.
These items have not been costed by the HAP group, but it is estimated that they can be covered by adding a 5% mark-up to land management costs.
72
HAP Costings Annexes
15 ANNEX 15: ARABLE FIELD MARGINS
Introduction
Delivery of the HAP for arable field margins involves management of margins to maintain them in favourable condition as well as expanding the net length of arable field margins. Work is also required in the areas of research, monitoring, advice and dissemination of good practice in land management as well as general publicity about arable field margins.
The largest share of the habitat is in England. The main threats to the wildlife value of margins are intensification of agricultural production, including the use of fertiliser, herbicides and insecticides, the shift to winter cropping and the associated loss of winter stubbles, the reduction in rotation of cereal crops with other land covers (including grass leys and fallows), and the reduction in undersown area associated with the shift to winter cropping.
Maintenance
Annual agri-environment scheme payment rates available for maintenance of arable field margins are the following:
Options that contribute to favourable condition of cultivated unsprayed margins (Target 2):
England:
ELS:
o Conservation headlands in cereal fields pay 100 points (equal to £100) per hectare.
o Conservation headlands in cereal fields with no fertilisers or manure pay 330 points (equal to £330) per hectare.
o Uncropped cultivated field margins on arable land pay 400 points (equal to £400) per hectare.
HLES:
o Cultivated fallow plots or margins for arable flora pay £80 per hectare
o Fallow plots for ground-nesting birds pay £80 per hectare.
o Unharvested, fertiliser-free conservation headlands pay £400
The average rate of payment in England across all options is £230 per hectare.
Northern Ireland: CMS/ESA: Conservation crop margin pays £115 per hectare.
Scotland: Rural Stewardship Scheme:
Management of grass margin or beetlebank in arable fields pays £736 per hectare
Management of conservation headlands pays £70 per hectare
73
HAP Costings Annexes
Management of conservation headlands where nitrogenous fertiliser is not applied pays £150 per hectare
This gives an average rate of payment for the three options of £320 per hectare.
Wales
Tir Gofal:
o Unsprayed cereal margin on existing arable land pays £120 per hectare
o Unsprayed cereal margin on grassland converted from improved grassland pays £390 per hectare
o Uncropped fallow margin alongside arable and root crops pays £450 per hectare
o Rough grass margin alongside cereal and root crops pays £350 per hectare
This gives and average rate of payment across all options of £328 per hectare.
Options that contribute to favourable condition of flower-rich field margins (Target 5):
England:
ELS:
o Pollen & nectar flower mixture pays £450 per hectare
o Pollen & nectar flower mixture on set-aside land pays £85 per hectare
HLES: Floristically enhanced grass margins pays £485 per hectare.
This gives an average rate of payment for the three options of £340 per hectare.
Northern Ireland: Target 5 does not apply to Northern Ireland
Scotland: Rural Stewardship Scheme:
Management of conservation headlands pays £70 per hectare
Management of conservation headlands where nitrogenous fertiliser is not applied pays £150 per hectare
This gives an average rate of payment of £110 per hectare.
Wales: Target 5 does not apply to Wales.
Options that contribute to favourable condition of permanent grass margins (Target 7):
England: ELS:
Buffer strips of 2/4/6 meters on cultivated land pay 300-400 points (equal to £300-400) per hectare.
74
HAP Costings Annexes
Field corner management pays 400 points (equal to £400) per hectare.
This gives an average rate of payment of £375 per hectare.
Northern Ireland: CMS/ESA: Rough grass field margins pay £330 per hectare
Scotland: Rural Stewardship Scheme:
Management of grass margin or beetlebank in arable fields pays £736 per hectare
Management of conservation headlands pays £70 per hectare
Management of conservation headlands where nitrogenous fertiliser is not applied pays £150 per hectare
This gives an average rate of payment for the three options of £320 per hectare.
Wales:
Tir Gofal: Rough grass margin alongside cereal and root crops pays £350 per hectare
Tir Cynnal: Grass margins in arable fields pay £7.70 per hectare
This gives an average payment rate of £180 per hectare
Weighted average payment rates
As agri-environment payments for the various margins differ we have calculated a weighted average payment rate that reflects the individual margins’ share of the totality of margin to be respectively maintained and expanded. The weighted average maintenance payments per hectare are £334 for England, £212 for Northern Ireland, £232 for Scotland and £264 for Wales.
Expansion
Options that contribute to expansion of cultivated unsprayed margins (Target 1):
England:
ELS:
o Conservation headlands in cereal fields pay 100 points (equal to £100) per hectare.
o Conservation headlands in cereal fields with no fertilisers or manure pay 330 points (equal to £330) per hectare.
o Uncropped cultivated field margins on arable land pay 400 points (equal to £400) per hectare.
HLES:
o Cultivated fallow plots or margins for arable flora pays £80 per hectare
o Fallow plots for ground-nesting birds pays £80 per hectare.
75
HAP Costings Annexes
o Unharvested, fertilizer-free conservation headlands pays £400
The average rate of payment in England across all options is £230 per hectare.
Northern Ireland: CMS/ESA: Conservation crop margin pays £115 per hectare.
Scotland: Rural Stewardship Scheme:
Management of grass margin or beetlebank in arable fields pays £736 per hectare
Management of conservation headlands pays £70 per hectare
Management of conservation headlands where nitrogenous fertiliser is not applied pays £150 per hectare
This gives an average rate of payment for the three options of £320 per hectare.
Wales
Tir Gofal:
o Unsprayed cereal margin on existing arable land pays £120 per hectare
o Unsprayed cereal margin on grassland converted from improved grassland pays £390 per hectare
o Uncropped fallow margin alongside arable and root crops pays £450 per hectare
o Rough grass margin alongside cereal and root crops pays £350 per hectare
This gives and average rate of payment across all options of £328 per hectare.
Options contribute to expansion of margins providing wild bird seed (Target 3):
England:
ELS: Wild bird seed mixture pays 450 points (equal to £450) per hectare.
HLES: Enhanced wild bird seed mix plots pays £475 per hectare
This gives an average payment rate of £460 per hectare
Northern Ireland: CMS/ESA: Wild bird cover crop pays £510 per hectare
Scotland:
Management of grass margin or beetlebank in arable fields pays £736 per hectare
Management of conservation headlands pays £70 per hectare
Management of conservation headlands where nitrogenous fertiliser is not applied pays £150 per hectare
This gives an average rate of payment for the three options of £320 per hectare.
Wales:
76
HAP Costings Annexes
Tir Gofal: Establishment of wildlife cover crops pays £350 per hectare
Options that contribute to expansion of flower-rich field margins (Target 4):
England:
ELS:
o Pollen & nectar flower mixture pays 450 points (equal to £450) per hectare
o Pollen & nectar flower mixture on set-aside land pays 450 points (equal to £85) per hectare
HLES: Floristically enhanced grass margins pays £485 per hectare.
This gives an average rate of payment for the three options of £340 per hectare.
Northern Ireland: Target 4 does not apply to Northern Ireland.
Scotland:
Management of conservation headlands pays £70 per hectare
Management of conservation headlands where nitrogenous fertiliser is not applied pays £150 per hectare
This gives an average rate of payment for the three options of £110 per hectare.
Wales: Target 4 does not apply to Wales.
Options that contribute to expansion of permanent grass margins (Target 6):
England: ELS:
Buffer strips of 2/4/6 meters on cultivated land pay 300-400 points (equal to £300-400) per hectare.
Field corner management pays 400 points (equal to £400) per hectare.
This gives an average rate of payment of £375 per hectare.
Northern Ireland: CMS/ESA: Rough grass field margins pay £330 per hectare
Scotland: Rural Stewardship Scheme:
Management of grass margin or beetlebank in arable fields pays £736 per hectare
Management of conservation headlands pays £70 per hectare
Management of conservation headlands where nitrogenous fertiliser is not applied pays £150 per hectare
This gives an average rate of payment for the three options of £320 per hectare.
Wales:
Tir Gofal: Rough grass margin alongside cereal and root crops pays £350 per hectare
77
HAP Costings Annexes
Weighted average payment rates
As agri-environment payments for the various margins differ we have calculated a weighted average payment rate that reflects the individual margins’ share of the totality of margin to be respectively maintained and expanded. The weighted average expansion payments per hectare are £371 for England, £362 for Northern Ireland, £251 for Scotland and £331 for Wales.
Other Costs
While the majority of costs of implementing the HAP for arable field margins relate to land management, other costs do exist. As the HAP group is in the process of developing a new action plan there is still uncertainty as to what it will include. However, like the current one, it will focus on monitoring of the habitat and of how agri-environment prescriptions affect the management of it, advice & guidance for land managers and agency staff on the issues of conservation management and agri-environment prescriptions, as well as research & development to inform this advice and guidance.
It is estimated that the cost of these activities can be covered by adding a 5% mark-up to land management costs.
78
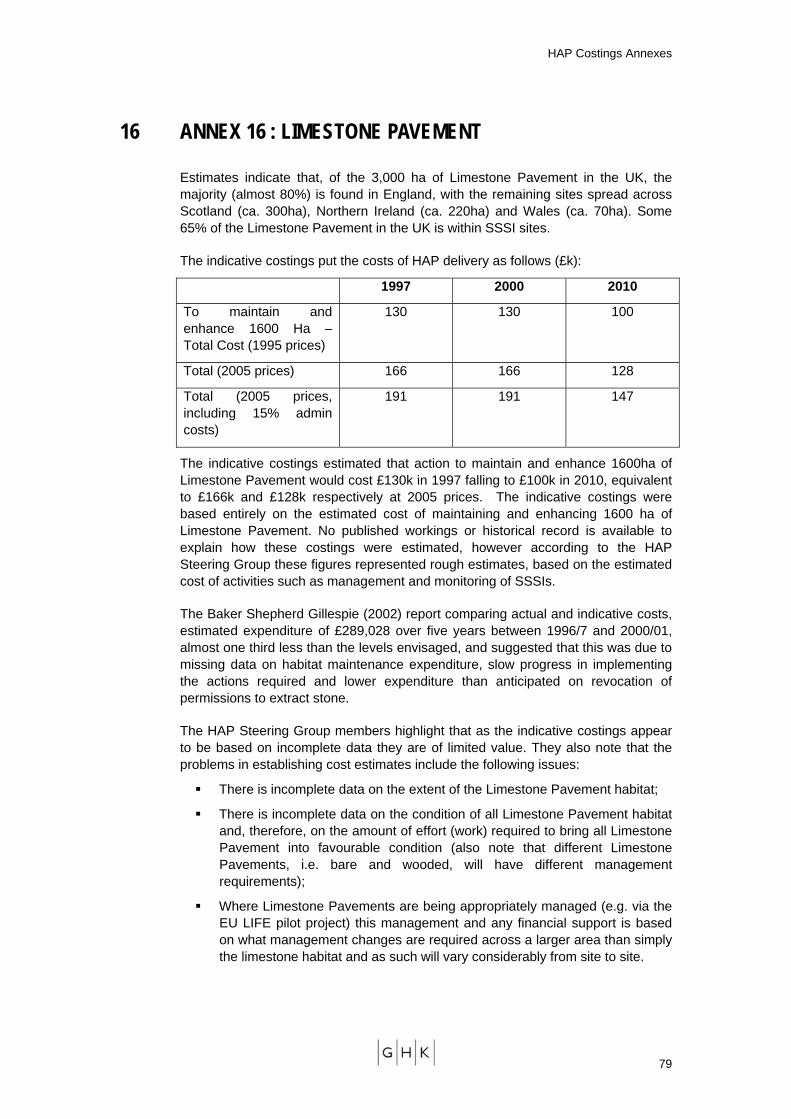
HAP Costings Annexes
16 ANNEX 16 : LIMESTONE PAVEMENT
Estimates indicate that, of the 3,000 ha of Limestone Pavement in the UK, the majority (almost 80%) is found in England, with the remaining sites spread across Scotland (ca. 300ha), Northern Ireland (ca. 220ha) and Wales (ca. 70ha). Some 65% of the Limestone Pavement in the UK is within SSSI sites.
The indicative costings put the costs of HAP delivery as follows (£k):
1997 2000 2010
To maintain and enhance 1600 Ha – Total Cost (1995 prices)
130 130 100
Total (2005 prices) 166 166 128
Total (2005 prices, including 15% admin costs)
191 191 147
The indicative costings estimated that action to maintain and enhance 1600ha of Limestone Pavement would cost £130k in 1997 falling to £100k in 2010, equivalent to £166k and £128k respectively at 2005 prices. The indicative costings were based entirely on the estimated cost of maintaining and enhancing 1600 ha of Limestone Pavement. No published workings or historical record is available to explain how these costings were estimated, however according to the HAP Steering Group these figures represented rough estimates, based on the estimated cost of activities such as management and monitoring of SSSIs.
The Baker Shepherd Gillespie (2002) report comparing actual and indicative costs, estimated expenditure of £289,028 over five years between 1996/7 and 2000/01, almost one third less than the levels envisaged, and suggested that this was due to missing data on habitat maintenance expenditure, slow progress in implementing the actions required and lower expenditure than anticipated on revocation of permissions to extract stone.
The HAP Steering Group members highlight that as the indicative costings appear to be based on incomplete data they are of limited value. They also note that the problems in establishing cost estimates include the following issues:
There is incomplete data on the extent of the Limestone Pavement habitat;
There is incomplete data on the condition of all Limestone Pavement habitat and, therefore, on the amount of effort (work) required to bring all Limestone Pavement into favourable condition (also note that different Limestone Pavements, i.e. bare and wooded, will have different management requirements);
Where Limestone Pavements are being appropriately managed (e.g. via the EU LIFE pilot project) this management and any financial support is based on what management changes are required across a larger area than simply the limestone habitat and as such will vary considerably from site to site.
79
HAP Costings Annexes
Progress with the HAP targets
Delivery of the HAP was not resourced in accordance with the planned profiles of 1997-2010. In the absence of funding, only slow and limited progress has been achieved towards the targets. The following action has been taken to date:
Target 1. Ensure that there is no loss to the extent of Limestone Pavement areas.
Research has been undertaken assessing the supply of stone from Limestone Pavement into garden centres and stone merchants, used for campaigning and raising awareness. The retail survey into the extent of the sale of water-worn limestone by garden centres and stone merchants, cost £15k.
Aggregates industry support (through Ready Mixed Concrete and the Landfill Tax) part funding a Project Officer post for campaigning and education. This is a 3 year short term post and ends in Feb 2006, cost £15k/yr.
Welsh pavements receiving RIGS status (i.e. they are acknowledged as important because of their geodiversity), will help Wales raise the profile in terms of achieving Limestone Protection Orders (LPO) for their pavements8.
Proposed legislation (the NERC Bill) will provide Wales with more powers to implement LPOs in the future.
Target 2. Ensure that there is no further deterioration in the quality of existing Limestone Pavement areas.
Grazing regimes and improved woodland management on some sites have benefited from the EU LIFE Limestone Pavement project. This is a £1.4 million pilot project based in the Yorkshire Dales and Cumbria. In the Yorkshire Dales, appropriate grazing methods on open habitats were demonstrated. In Cumbria, a wooded site was managed by removing large numbers of conifers and by scrub clearance in more sensitive areas of the habitat. This project is a temporary project ending in 2006 and is restricted to these two sites in England.
Unfortunately, a proposal to include a payment within the Environmental Stewardship scheme to provide support for cattle grazing (often necessary to improve Limestone Pavement condition) was rejected.
Target 3. Maintain features of geological importance.
According to the HAP Steering Group no specific achievements have been made.
Target 4. Restore and maintain a characteristic assemblage of native plant species
According to the HAP Steering Group no specific achievements have been made.
A general current cost is £10k/yr (approx) for staff resources (provided by lead partner) for the Chair, Secretariat and administration of the HAP meetings.
8 Under section 34 of the Wildlife and Countryside Act 1981 Limestone Pavement of special interest (for wildlife, geology or physiography) can be notified to the local authority, who may then make a Limestone Pavement Order (LPO) to protect the pavement. Once an LPO is in place, removal of rock becomes a criminal offence under the Wildlife and Countryside Act. More than half the Limestone Pavement sites in the UK are subject to LPOs.
80
HAP Costings Annexes
Limitations of current expenditure
According to the HAP Steering Group, the current expenditure is substantially lower than the required expenditure. This is largely attributed to the following issues:
Whilst the conservation agencies have resources for monitoring the best sites (i.e. those that are designated), there are no Government schemes that support maintenance and enhancement.
There are no resources available for monitoring or supporting management of non- designated sites. This could be addressed if the new Agri-Environment scheme would review its options and include at least two specifically for Limestone Pavements relating to woodland management and overgrazing respectively. However, to date Limestone Pavement habitats are not included in the Environmental Stewardship scheme
There is also no provision for non-designated sites and this needs to be addressed
There is a need for a full time dedicated Project Officer to oversee the HAP delivery (at a cost of ca. £60k/yr which includes all overheads, administrative costs, travel and subsistence expenses and support costs).
There are gaps in information on the condition of protected sites. Each country has its own information (in the absence of a UK database). To date, England has the most comprehensive results, although the database is not complete. Other countries are still in the process of developing and updating their databases. Some sites are recorded as being in unfavourable condition, due to the content of the site appraisal system. This needs to be reviewed. There are plans to fund a PhD Student for 3 years to carry out research in order to improve Common Standards Monitoring (CSM) for Limestone Pavements.
If specific options existed in UK grant schemes to support of land management for Limestone Pavements, this would reduce the amount of additional funding required to meet the HAP targets. However, restoration and maintenance targets will not be achieved without the support of management schemes. The management costs will vary from farm to farm, area to area, and country to country.
With adequate resourcing the Steering Group could:
Undertake further research into what is driving the demand for Limestone Pavements as a commercial product;
Develop a communications strategy including campaigning, educating, awareness-raising along the lines of the Peat-free campaigns and increase involvement of country level partners;
Produce better data for informing the National Review and delivering SMARTER targets;
Publication of Annual Progress Report on HAP;
The Biodiversity Reporting Information Group requires the new targets to be SMARTER, which in turn will require a better system of data gathering. The Steering Group needs to produce a UK database as there are gaps in the information, particularly in relation to the extent and condition of the habitat. However, all of this needs to be resourced and without adequate funding, it is likely that this may not go ahead.
81
HAP Costings Annexes
The habitat could improve and be better protected.
Future costs
The costs of delivering the Limestone Pavement HAP are complicated by uncertainties about the extent and condition of the habitat, and the types of actions, and, the costs of work at each site, which make a targets-based approach difficult. The costs of delivering the Limestone Pavement HAP have therefore been estimated by defining an overall package of resources and activities that will help deliver the HAP, and assessing the funding necessary to deliver such a package as discussed with the HAP Steering Group.
Based on discussions with the HAP Steering Group, the following main costs have been identified for the future management of the HAP:
Habitat Maintenance and Management Costs
Estimating the cost of habitat management for Limestone Pavements is complicated as there are different management requirements, and thus costs for different types of habitats. In general, Limestone Pavements are either open (ca. 2500 ha) or wooded (ca. 500 ha); each requires different management and maintenance routines.
Firstly in terms of managing the bare open pavement areas, which include about 2500 ha of the Limestone Pavement area in the UK, the preference is to manage the sites through grazing rare cattle breeds rather than sheep. The appropriateness of using rare breed cattle as grazers of limestone pavement has been demonstrated in the EU LIFE project in Ingleborough (Yorkshire Dales), where farmers have been paid to use rare breed cattle. The advantage of using these cattle, rather than sheep or traditional cattle, is that they are light footed and fussy eaters. However, the project is only 3 years and ends in 2006. The cattle supplements, which had been removed by the EU have now been reinstated, and are £35 a hectare. Based on the basic costs for managing open pavement of £100/ha, i.e. the most appropriate rate under the HLS agri-environment scheme, the cost of managing the 2500 ha of open pavement would be £337k per year (£135/ha). It is important to note that this cost includes some significant areas owned or managed by English Nature, which will not be entered into agri-environment schemes, but whose management is assumed to involve similar unit costs. The Steering Group estimate that ca. £300k/yr would be a good indication of the additional costs to manage the open pavement sites. Where cattle are not agriculturally available there may be further capital costs to buy in the infrastructure and animals. This is what the LIFE project in the Dales is paying for.
Secondly, in terms of managing the wooded pavement, which covers about 500 ha, there is a need to control invasive trees/non-native shrubs due to a lack of traditional coppicing. Coppicing and scrub clearance is needed regularly. There are some grants available under the Woodland Grant Scheme. However, it is limited in scope. A solution would be to include a woodland option specifically for limestone pavements in the Environmental Stewardship scheme, however as noted previously Limestone Pavements are currently not covered in these management schemes, thus at the moment this presents an additional cost to the delivery of the HAP. Based on the basic costs for the coppicing and scrub clearance payment of £500/ha (where most material is less than 7cm diameter, and removal is manual), i.e. the most appropriate rate under the English Woodland Grant Scheme (EWGS), the cost of managing the 500 ha of wooded pavement would be a total of ca.
82
HAP Costings Annexes
£250k. Based on the assumption that this coppicing would need to be repeated every 8 years, this is an annual cost of ca. £31k.
There are additional capital costs for removal of non-natives. Most of this work is now done, paid for by EU LIFE and Landfill Tax scheme and will not need to be repeated. However, two large sites remain. One is in Yorkshire and one is in Cumbria. Estimated costs are £50k each, i.e. a total cost of £100k. Additionally, there is a need for minor non-native work on sites, which will cost between £10-15k/yr.
Full time HAP officer
There is a need for a full time dedicated Project Officer to oversee the HAP delivery (at a cost of ca. £60k/yr which includes all administrative, office costs, support costs and expenses.
Education Costs
Part of the BAP is about education. To meet the HAP target to ‘ensure that there is no loss to the extent of Limestone Pavement areas’, it is important to stop people removing the Limestone Pavements with diggers to use as garden rockery stone. Part of this can be achieved through strong protective legislation, however this needs to be done in parallel with an education programme to raise public awareness about the threats this removal causes to the habitat and encourage a change in behaviour (including a website, media awareness etc). Funding for this work has just run out but it has been funded through a Landfill Tax project over the past 3 years. Costs have been £20k pa (inc. salary and on-cost). There are also capital costs for materials/displays/leaflets. This budget has been £10k pa. There are questions about whether running this as a part time post is effective and there may be a need for a full time staff member. This would increase salary costs and on costs to £40k. Including the costs of the website and campaigning materials the overall cost is estimated at £50,000 per annum over the life of the HAP.
Site Monitoring Costs
The costs of monitoring protected sites (e.g. SSSIs and SACs) are covered by existing expenditure of the relevant agencies, but there is a need for additional resources to monitor non-protected sites. The Steering Group highlights that this is a difficult estimate to make. However, based on current knowledge the group estimates that of the 3000 ha of pavement in the UK, some 65% is within the SSSI series. This means that there are about 1000 further hectares to monitor. More significantly the sites outwith the SSSI series tend to be small and geographically scattered. Assuming the need to contact the owners for access permission this could amount to about 30 days work. This calculation is based on surveying 40-50ha per day (possible) and sorting travel, access and reporting. At present consultancy costs are estimated at £5,250, based on £175/day. Additional costs will be required for staff time to let and manage the contract.
Development of a national database
There is a need for a complete national GIS database for Limestone Pavements. At present there is good GIS data for the Yorkshire Dales and English Nature is currently managing a contract to digitise the Lancashire and Cumbria information. By March 2006 the majority of the Limestone Pavement in England should be available digitally. There would still be a need to add in Scotland, Wales and
83
HAP Costings Annexes
Northern Ireland, although these areas are significantly smaller than in England. This additional work is envisaged to involve about a week of work for one officer, at a cost of about £1500. The additional costs here are in staff time as this is quite intensive to produce information in a state that it can be digitised. In some cases there may be the need for field survey. There is also a need to add a few days per year for ongoing updates. In total this equates to about 4 days per year at £300 per day (including support costs).
Legislation
Extraction of the resource can be deterred through legislation, which involves heavy fines where limestone pavements have been extracted or damaged. England has sufficient measures in place through Limestone Pavement Orders (LPOs). Most sites in England are covered. Recent legislation in the NERC Bill will provide Wales with more powers to implement LPOs in the future. However, Scotland has moved in the opposite direction as S 34 of the Wildlife and Countryside Act, (the section that provides scope for legal protection), was repealed in 2004 by the Nature Conservation Act. Scotland is the least protected. Northern Ireland is catching up by producing a recent Action Plan for Limestone Pavements. However, more information is needed on legislation/protection in that country which can be addressed via the steering group.
84
HAP Costings Annexes
17 ANNEX 17: FENS
Introduction
Delivery of the HAP for fens primarily involves site management work, aimed at restoring sites and ensuring the right water quality and quantity for the continued existence of all SSS/ASSI fens. Although the latter activity was supposed to have been achieved by 2005 according to the original HAP actions it cannot be assumed to have been achieved for all fens. A recent EN study of basin fens (English Nature Research Report 610) shows that most basin fens are still failing to meet condition requirements because of excessive N and P inputs. As remedying this basically involves applying less fertiliser and/or shifting to the production of less demanding animals and plants, we assume that there are no additional land management costs associated with this operation and have therefore not costed this in the sections below. Work is also required in the areas of research, monitoring, advice and dissemination of good practice in land management as well as general publicity about the habitat.
The largest share of the habitat is located in England and Wales, with a significant area also in Northern Ireland. The habitat is under threat from a range of factors, including habitat loss due to drainage and conversion to intensive agriculture, lack of or inappropriate management leading to drying out, scrub encroachment and succession to woodland, enrichment or hypertrophication resulting in changing plant communities. The majority of fens are notified as SSSI/ASSI sites and several of the larger fens are managed as NNRs by English Nature and CCW, or as reserves of the RSPB and Wildlife Trusts.
Maintenance
Maintenance of fens requires establishment of an appropriate cutting and grazing regime to ensure that the site does not scrub over. The right hydrology needs to be maintained, but it is assumed that capital work such as blockage of former agricultural drains, etc. will have happened already as part of a prior restoration project.
Annual agri-environment scheme payment rates available for maintenance of fens are the following:
In England, the Higher Level Environmental Stewardship (HLES) Scheme pays £60 per hectare per year towards maintenance of fens.
In Northern Ireland, the Countryside Management and the Environmentally Sensitive Areas Schemes (CMS/ESAs) pay £90 per hectare for management of fens, while the Management of Sensitive Sites (MOSS) scheme, which is designed to ensure the positive management of land within Areas of Special Scientific Interest, pays £110 per hectare. An average rate of £92 has been calculated based on ASSI land making up ca 10% of the habitat (based on data for extent currently available).
In Scotland, the Rural Stewardship Scheme offers £100 per hectare for management of wetland. The East Scotland Grassland Management Scheme (ESGMS) specifically for SSSI land offers variable rates depending on the size of the site and whether it is cut or grazed. Based on officer information on the prevailing size and use of sites the average rate of payment through ESGMS is £89 per hectare. Based on an assumption that
85
HAP Costings Annexes
non-SSSI sites make up 60% and SSSI sites 40% of the resource, the weighted average payment rate for maintenance is £96 per hectare.
In Wales, Tir Gofal offers £35 per hectare for maintenance of fens.
For agri-environment capital payments towards some of the maintenance activities mentioned above, see the section of fen restoration.
Restoration
Restoration of fens generally involves an increase in water levels by digging out where the site has been drained or allowed to scrub over and therefore dry out, restoration of the water management system to ensure continuation of an appropriate hydrology for the site, scrub clearance, sward cutting and aftermath grazing. Fencing for grazing animals might need to be introduced.
Annual agri-environment scheme payment rates available for restoration of fens are the following:
In England, HLES pays £60 per hectare per year for restoration of fens.
In Northern Ireland annual costs of habitat under restoration are assumed to be equivalent to the annual maintenance payment rate of £92/ha.
In Scotland, annual costs of habitat under restoration are assumed to be equivalent to the annual maintenance payment rate of £95/ha.
In Wales, annual costs of habitat under restoration are assumed to be equivalent to the annual maintenance payment rate of £35/ha
The Dwfi restoration project is restoring estuarine raised mire along whose margins is poor fen that is also undergoing restoration. The fen restoration has involved the following operations:
Introduction of water management measures to increase and control the wetness of the area. This was initially done by means of damming with large peat dams and bunds, but has more recently involved blocking of smaller ditches with plastic piling. Control of the water level to avoid flooding surrounding land is being done by means of simple pipe structures rather than sluices, as the former is a cheaper method.
Scrub clearance has been undertaken on previously abandoned areas. It has mainly involved removal of rhododendron, but also some birch and willow. Round-up was stem injected after which dead scrub was left to rot in some cases, but in others had to be cut down and chipped as the remains were too dense and visually intrusive. Cutting down dead scrub was difficult due to the wetness of the site, which added to the costs of the operation.
Management of the sward by cutting in the first few years after wetting the site in order to control the soft rush and molinia growth. Following that it has been managed by grazing, which has involved an extensification of the grazing regime from all-year round sheep grazing to summer grazing by cattle and ponies and Winter grazing by sheep due to a significant winter growth caused by the mild climate.
Introduction of water supply for grazing animals has been needed in some places.
Fencing has had to be erected in some parts of the site to prevent animals from falling into steep sided deep ditches.
86
HAP Costings Annexes
While the operations involved in the restoration were as above it was not possible to get disaggregated cost data for the fen part of the site, and we have therefore had to cost the operation based on costs quoted by a re-establishment project described below as well as costings provided for restoration of a number of RSPB reedbed sites.
We base the costing of fen restoration on information about the Dwfi restoration project above and the Anglesey creation project in the section below, as well as on information provided by land managers on fen restoration in general, information provided by the RSPB on reedbed restoration/creation (for which some operations are similar) and information about fencing and water supply costs used for costing grassland HAPs. We assume the capital costs of fen restoration are the following: Digging out of dried up areas is assumed to be needed in 25% of cases at a per hectare cost of £433 (based on figures for bed lowering used for costing reedbed restoration given that the excavation cost quoted for the Anglesey project below is too high to be representative); introduction of structures for controlling the water level (bunds and sluices) is assumed to be needed in 50% of cases at a per hectare cost of £150 based on figures used for costing reedbed restoration; tree and scrub clearance is assumed to be needed in 25% of cases at a per hectare cost of £253 based on figures used for costing reedbed restoration; fen cutting is assumed to be needed in 25% of cases at a per hectare cost of £320, based on figures for reedbed creation; introduction of fencing at a per hectare cost of £248 based on figures used for costing the lowland dry acid grassland HAP. This gives capital cost of restoring fen of £575 per hectare.
Agri-environment schemes offer capital payments towards most of the restoration activities listed above. In the case of Northern Ireland, we have not included payments available through the MOSS scheme as this does not operate fixed rates but offers a percentage of actual capital costs ranging from 60-100%. Payments for hydrological management are as follows:
HLES (England) pays the following:
o Soil bund - £149/each
o Culvert - £153/each
o Timber sluice - £314/each
o Brick, stone or concrete sluice - £960/each
o Wind pump for water level measures – 80% of costs
o Construction of water penning structures – 80% of costs
CMS/ESA (Northern Ireland) offers no payments towards water management
Rural Stewardship Scheme (Scotland) pays £100/dam for blocking ditches on lowland raised bogs and on created wetland
Tir Gofal (Wales), pays the following:
o Soil bunds - £35
o Timber sluices - £140
Payments for scrub clearance are as follows:
HLES - £228-583/ha
ESGMS - £800-2,400/ha
87
HAP Costings Annexes
Tir Gofal - £150-500/ha
Payments for fencing are as follows:
HLES - £2.25-4.00 per metre, with a £2.50 supplement for difficult sites and £220 for a bridle gate
CMS/ESAS - £1.40-1.70 per metre
Rural Stewardship Scheme - £3-6 per metre
ESGMS - £1.80-2.50 per metre, with £100 per gate
Tir Gofal - £1.25-1.75 per metre
While agri-environment schemes offer capital payments towards the above mentioned water management works they do not offer capital payments for digging out dried out wetland habitats.
Expansion
While the revised targets do not currently include a target for expansion we provide an account of this activity and agri-environment payment rates to be used when such a target is available.
Creation of fen generally involves some of the same operations as restoration, including digging out of dried up areas, introduction of water level management, scrub clearance, cutting and grazing. However, it might also involve a degree of re-seeding, although there is usually scope for natural regeneration depending on the soil composition.
Annual agri-environment scheme payment rates available for creation of fens are the following:
In England, HLES pays £380 per hectare for creation of fens.
In Northern Ireland, annual payments are not available for re-establishment, though there is an annual maintenance payment of £92/ha.
In Scotland, the Rural Stewardship Scheme pays £250 per hectare for creation and management of wetland.
In Wales, Tir Gofal pays £310 for creation of new fens.
One project has re-established fen on a 4.5 ha former landfill site in Anglesey, which had been used as semi-improved grassland for a number of years. The project has involved the following operations:
Digging out and removal of the top 30 cm of peat. This was done at a wet time of the year (November-December) and involved laying down of mats for machinery and lorries to drive across ditches. The costs of matting and the fact that the work was also undertaken by contractors made it extremely expensive at a cost of £111,000 per hectare.
The water table was restored by diverting a natural spring to enable flushing of the site and blocking of ditches by means of peat bunds. No costs were available for this operation.
As this site had been used for grazing already there was no need for tree and scrub clearance, or for introduction of fencing and water supply for future grazing animals.
88
HAP Costings Annexes
Following the removal of the top layer of semi-improved grassland the fen vegetation has regenerated without the need for re-seeding as the soil was still sufficiently rich in peat.
Based on information about the above project, general information provided by land managers on fen creation, information provided by the RSPB on reedbed creation (for which some operations are similar) and information about fencing and water supply costs used for costing grassland HAPs, we assume the capital costs of fen creation to be the following: Digging out of dried up areas is assumed to be needed in 50% of cases at a per hectare cost of £433 (based on figures for bed lowering used for costing reedbed restoration given that the excavation cost quoted for the Anglesey project above is too high to be representative); introduction of structures for controlling the water level (bunds and sluices) is assumed to be needed in 100% of cases at a per hectare cost of £160 based on figures used for costing reedbed creation; tree and scrub clearance is assumed to be needed in 25% of cases at a per hectare cost of £253 based on figures used for costing reedbed creation; re-seeding is assumed to be needed in 10% of cases at a per hectare cost of £475 based on figures used for costing reedbed creation; cutting of vegetation is assumed to be needed in 25% of cases at a per hectare cost of £320 based on figures for reedbed creation; and introduction of fencing at a per hectare cost of £248 based on figures used for costing the lowland dry acid grassland HAP. This gives capital cost of recreating fen of £815 per hectare.
Other Costs
While the majority of costs of implementing the HAP for fens relate to land management, other costs include:
Provision of advice for land managers and land management advisors on favourable management regimes and fen creation techniques. This is funded by the partner organisations internally.
Monitoring of and research into aspects of the habitat undertaken and/or funded by the main HAP partners or by Defra. The most expensive research project on the Wetland Framework for England and Wales will soon come to an end, and it is not certain how much is happening in this area in Northern Ireland and Scotland.
The preparation and implementation of water level management plans which Defra is driving forward at the moment will be expensive. However, funding will be made available by Defra so should not be attributed to the HAP.
It is estimated that these costs can be accommodated by adding a 5% mark-up to land management costs.
89
HAP Costings Annexes
18 ANNEX 18: REEDBEDS
Introduction
Delivery of the HAP for reedbeds involves site management work, aimed at maintaining sites in, or restoring them to favourable condition, as well as creating areas of reedbed. Work is also required in the areas of research, monitoring, advice and dissemination of good practice in land management as well as general publicity about the habitat.
The largest share of the habitat is located in England, with the most important reedbeds found on the coast of Eastern England. The habitat is under threat from a range of factors, including a lack of or inappropriate management leading to drying out and scrub encroachment, loss of habitat due to a rise in sea levels, land drainage and conversion to intensive agriculture. Most of the significant reedbeds are notified as SSSI/ASSIs and several of the larger reedbeds are managed as NNRs by English Nature and CCW, or as reserves of the RSPB and Wildlife Trusts.
Maintenance
Maintenance of reedbeds requires establishment of an appropriate cutting regime that prevents build up of litter and hence slows down the drying process, whilst not being too frequent. This would imply cutting every 5-6 years. Water tables and quality need to be maintained, and coastal reedbeds require the right mix of coastal water and reedbed as well as efforts to prevent possible silting up. For the benefit of bittern, the shoreline should be wavy rather than straight.
Annual agri-environment scheme payment rates available for maintenance of reedbeds are the following:
In England, the Higher Level Environmental Stewardship (HLES) Scheme pays £60 per hectare per year towards maintenance of reedbeds.
In Northern Ireland, the Countryside Management and the Environmentally Sensitive Areas Schemes (CMS/ESAS) pay £90 for management of reedbeds, while the Management of Sensitive Sites (MOSS) scheme, which is designed to ensure the positive management of land within Areas of Special Scientific Interest (ASSI), pays £110 per hectare. As no figures are currently available for the share of the total habitat that is located in ASSIs, we assume this share to be 10%. As a result, the average weighted payment rate for maintenance of reedbeds in Northern Ireland is £92 per hectare.
In Scotland, the Rural Stewardship Scheme offers £100 per hectare for management of wetland. The East Scotland Grassland Management Scheme (ESGMS) specifically for SSSI land offers variable rates depending on the size of the site and whether it is cut or grazed. Based on officer information on the prevailing size and use of sites the average rate of payment through ESGMS is £89 per hectare. As only a couple of small sites receive ESGMS funding we have decided to use only the Rural Stewardship Scheme payment rate of £100 for the purpose of these costings.
In Wales, Tir Gofal offers £35 per hectare for maintenance of reedbeds.
Based on information received from the RSPB on four different cutting techniques and price ranges, and an assumption that cutting is needed every 5-6 years, the
90

HAP Costings Annexes
costs of cutting for maintenance purposes are £522 per hectare, roughly equivalent to £100/ha/yr. No agri-environment capital payments are available for reed cutting specifically, as it is assumed to be done as part of ongoing site management.
Restoration
According to information received from the RSPB, restoration of reedbeds involves bed lowering through digging out of old litter where build-up of this has led to drying up, re-profiling of ditches and water margins and creation of new ditches. Some scrub clearance might also be required.
Figures from two RSPB reedbed restoration projects have been used for estimating the costs of bed lowering, re-profiling of ditches and open water margins, and creation of new ditches, while figures from a reedbed creation project have been used for estimating the costs of scrub clearance. The costs include purchase of machinery, staff costs at the RSPB and fees paid to contractors where the work was out-sourced. The costs were the following:
Bed lowering was completed on respectively 0.5 and 1.2 hectares out of total site sizes of 190 and 18 hectares. The average cost for the two projects of this operation was £433 per hectare.
Re-profiling of ditches and open water margins was completed on respectively 4,000 and 750 metres at an average cost per hectare of £116 for the two projects.
The projects created 500 and 180 metres of new ditches respectively at an average cost of £119 per hectare (over the whole sites)
One of the projects had to install water control structures consisting of 8 pipes and 3 sluices at a cost of £150 per hectare. Since we assume that this kind of operation is only needed in 50% of restoration projects we use a rate of £75 per hectare for the purpose of estimating reedbed restoration costs.
Tree and scrub removal (as part of a creation project) took place on 4.5 out of 271 hectares, at a per hectare cost of £74 (averaged over the whole sites).
Based on the above RSPB figures and the assumptions we have made we estimate the capital costs of reedbed restoration to be £817 per hectare.
Agri-environment schemes offer capital payments towards most of the restoration activities listed above. In the case of Northern Ireland, we have not included payments available through the MOSS scheme as this does not operate fixed rates but offers a percentage of actual capital costs ranging from 60-100%. Payments for hydrological management are as follows:
HLES (England) pays the following:
o Soil bund - £149/each
o Culvert - £153/each
o Timber sluice - £314/each
o Brick, stone or concrete sluice - £960/each
o Wind pump for water level measures – 80% of costs
o Construction of water penning structures – 80% of costs
91
HAP Costings Annexes
CMS/ESA (Northern Ireland) offers no payments towards water management
Rural Stewardship Scheme (Scotland) the pays £100/dam for blocking ditches on lowland raised bogs and on created wetland
Tir Gofal (Wales), pays the following:
o Soil bunds - £35
o Timber sluices - £140
Payments for scrub clearance are as follows:
HLES - £228-583/ha
ESGMS - £800-2,400/ha
Tir Gofal - £150-500/ha
While agri-environment schemes offer capital payments towards the above mentioned water management works they do not offer capital payments for digging out dried out wetland habitats.
Annual agri-environment scheme payment rates available for restoration of reedbeds are the following:
In England, HLES pays £60 per hectare per year for restoration of reedbeds.
In Northern Ireland, Scotland and Wales, there are no specific annual restoration payments and annual maintenance payment rates of £92, £100 and £35 per hectare respectively are assumed to be available after restoration.
Expansion
Creation of reedbeds involves creation of lagoons of variable water depth depending on the desired site typography, maintenance of water fluctuation in these lagoons, planting of reedbed seedlings, cutting of reed as it grows and weed control on newly planted areas.
Annual agri-environment scheme payment rates available for re-establishment of reedbeds are the following:
In England, HLES pays £380 per hectare for creation of reedbeds.
In Northern Ireland, there are no specific annual payments for re-establishment but the annual maintenance payment of £92/ha is assumed to apply.
In Scotland, the Rural Stewardship Scheme pays £250 per hectare per year for creation and management of wetland.
In Wales, Tir Gofal pays £310/ha/yr for creation of new reedbeds.
With regard to capital costs, figures from two RSPB reedbed creation projects have been used for estimating the costs of creating the desired landform, installing water control structures, tree and scrub removal, reed planting and cutting, weed control and management of water levels. The costs include purchase of machinery, staff costs at the RSPB and fees paid to contractors where the work was out-sourced. The costs were the following:
92
HAP Costings Annexes
Creation of landform for new reedbed took place on respectively 40 and 4.5 hectares out of total site sizes of 43 and 271 hectares. The average cost for the two projects of this operation was £670 per hectare.
Introduction of water control structures (bunds and sluices) at an average cost for the two projects of £160 per hectare.
Tree and scrub removal took place as part of one of the two creation projects and took place on 4.5 out of 271 hectares, which gives a per hectare cost of £74.
Reed planting and protection of new reeds took place as part of one of the two creation projects and took place on 4.5 out of 271 hectares at a per hectare cost of £45.
Reed cutting was undertaken in one of the two creation projects at a cost of £320 per hectare. We assume that cutting is needed in 50% of cases and therefore use a cost of £160 per hectare for this operation.
Weed control on newly planted created areas was undertaken on 10 and 1.5 hectares respectively at an average per hectare cost of £211 for the two projects.
Management of water levels by RSPB staff was undertaken in one of the two projects at a cost of £82 per hectare. We assume that this is needed in 50% of cases and therefore use a rate of £41 for the purpose of these costings.
Based on the above RSPB figures and the assumptions we have made we estimate the capital costs of reedbed creation to be £1,361 per hectare.
Other Costs
Whilst the majority of the costs of implementing the HAP for reedbeds relate to land management, other costs include:
Activities in the areas of policy and legislation, which have either been completed or are paid for as part of the statutory bodies’ normal work programme.
Provision of advice for land managers and land management advisors on favourable management regimes and reedbed creation techniques. This is funded by the partner organisations internally. Other advisory activities are either taking place already as part of support for designated sites or are built into designs of effluent treatment installations and should therefore not be put down to delivery of this HAP.
Monitoring and research into aspects of the habitat undertaken and/or funded by the main HAP partners internally or by Defra.
It is estimated that these additional costs can be captured by applying a 15% mark-up to land management costs to cover the cost of administration of land management schemes, plus a further 5% mark-up to cover additional costs such as research, advisory and publicity activities.
93
HAP Costings Annexes
19 ANNEX 19: AQUIFER FED NATURALLY FLUCTUATING WATER BODIES
Delivering this HAP involves protecting seven sites in the UK and maintaining their condition. This principally involves avoiding negative pressures on the sites through development, water abstraction or pollution. Considerable progress has already been made to date, for example through the non-renewal of water abstraction licences at some sites.
England
The 5 sites are generally believed to be in good condition at present and no restoration or management work is envisaged.
The main cost therefore relates to ongoing ecological monitoring at the existing sites. This is estimated to involve regular monitoring of water quality, vegetation and presence of invasive species. The annual cost is estimated at £1,000 per site.
Northern Ireland
The site in Northern Ireland is an SAC. There are currently some issues relating to its protection and the effects of nearby quarrying operations on water levels. However, unlike for other HAPs there is no country level HAP for this habitat in Northern Ireland, and any effort involved in protecting the site is deemed to be driven by its SAC status rather than the BAP. As a result, costs of implementing the HAP in Northern Ireland are considered to be zero.
Wales
For the turlough in Wales, monitoring is required to increase the knowledge base so that the relationship between the aquifer [carboniferous limestone] and the response in the turlough can be determined. The requirement is for 10 years of monitoring to provide a baseline of information for the future; 10 years is needed so that a range of hydrological circumstances (high rainfall years and dry or drought years) can be picked up.
There has been some hydrological monitoring in recent years, which has proved useful. Therefore extended monitoring for 10 years is justified.
The costs of this monitoring are put at £10k per year for 10 years, 2006 to 2015. After that a lower level of monitoring will be required at an estimated cost of £1,000 per year.
HAP Co-ordination
The time spent in co-ordinating the HAP is currently constrained by other commitments. A minimum of five days work per year is estimated to be required. At £400 per day (including support costs, overheads and expenses) this implies an annual cost of £2,000 in co-ordination of the HAP.
94

HAP Costings Annexes
20 ANNEX 20: EUTROPHIC STANDING WATERS
Expenditures to Date
It is clear that current activity has been very much constrained by the availability of resources. The main costs incurred to date have included:
i. Inputs from partners. Annual inputs amount to 0.55 FTE. Compilation of the lakes inventory involved an estimated 0.75 job years of work by steering group members (with approximately two thirds of this effort attributable to this HAP).
ii. Costs of engaging contractors to develop lakes inventory – initial cost of c£25k followed by £15k per year to update and maintain the database. This level is likely to continue into the future. Approximately two thirds (£10k p.a. can be allocated to eutrophic standing waters HAP)
iii. Costs of developing website. £15k to date, will require £5k per year maintenance costs
iv. Site specific restoration works through an English Nature project funded by the Capital Modernisation Fund. This included capital works of £317k at various eutrophic and mesotrophic lakes, including:
£182k at three eutrophic waters in the Norfolk Broads including goose exclusion, fish barriers, planting of marginal vegetation, visitor facilities
£5k at Littlesea, Dorset (mesotrophic lake) for tree clearance and reprofiling
£50k at the West Midland Meres (eutrophic) for tree and scrub removal
£80k to control invasive species at three sites (the eutrophic standing waters of Brown Moss, Shropshire and Hatchet Pond, New Forest; and the mesotrophic Swanholme Lakes, Lincolnshire)
These figures suggest an average capital cost of around £35k per lake for the work completed.
The Environment Agency and Broads Authority have also incurred expenditures in the restoration of sites in the Norfolk Broads. Some of the costs of work at Barton Broad are set out in a report by Posford Haskoning9, and include:
a. Biomanipulation - £80,000 between 1996 and 2000 and a further £77,000 between 2002 and 2004;
b. Dredging and disposal of sediment removal - £1.5 million – at a cost of £10/m3
c. Bathymetric survey (£12k, over 5 days).
In Northern Ireland no accurate estimate is available of the extent of the habitat. There are 1600 lakes of more than 0.1ha and 700 of more than 1ha but it is not known how many of these are eutrophic rather than mesotrophic, maerl lakes or oligotrophic lakes. The main onus is therefore on classification and survey before the need for remedial work can be established. Consultees suggested that the
9 Posford Haskoning (2003) Review of Lake Restoration Techniques and Resource Costs. Report for English Nature, Peterborough
95
HAP Costings Annexes
requirements of the Water Framework Directive are likely to meet or go beyond those of the HAP, requiring all lakes to be in good ecological status by 2015. As a result, the extra costs of delivering the HAP are considered to be small. Meeting the requirements of the WFD will involve 3 person years of work to collect together existing information, and recruitment of a lakes team comprising 5 full time employees charged with ongoing monitoring. There will also be work on standardising classification systems with the Irish Republic and other parts of the UK, through a 7.5m euro cross border project of which approx 5-10% relates to lakes. Education and publicity efforts are considered important but nothing is planned specifically for ESW. There are general educational programmes relating to lakes and rivers, and more effort is currently devoted to mesotrophic lakes which are considered to be under greater threat.
Assessment of Resource Requirements
An assessment of the costs of delivering the HAP depends on the specification and costing of a package of actions to survey, monitor and restore eutrophic standing waters, which are required by the BAP and will not be delivered by other drivers.
Consultations with partners suggest that key potential actions that would take place if adequate resources were available fall into the following principal categories:
1. Site Survey and Monitoring
Implementation of the HAP depends on the delivery of a major programme of site surveys and monitoring, to assess the condition of waters, identify impacts and pressures on them, and identify restoration needs. There is currently no data on 50% of Tier 1 and Tier 2 and all Tier 3 lakes10.
The programme is likely to involve:
a. Sampling and chemical analysis
b. Hydrological survey
c. Ecological survey
d. Survey of catchment pressures.
A survey team of 3 people might cover 10-20 lakes in a year. The revised target of surveying 244 Tier 3 lakes by 2010 would suggest that 49 lakes per year need to be surveyed, implying the need for a survey team of nine.
Ongoing monitoring would also be required for a sample of sites.
2. Restoration
Restorative actions need to be assessed on a site-by-site basis, but are likely to include:
10 The HAP proposes that waters can be classified in three tiers: Tier 1 – important sites (designated sites and sites supporting BAP priority species) in favourable condition; Tier 2- important sites in unfavourable condition; Tier 3 – all other sites.
96
HAP Costings Annexes
Control of diffuse pollution. Defra is consulting on plans for catchment sensitive farming which could involve a variety of regulatory, voluntary and incentive measures. There is a role for re-creation of fringe/buffer habitats as well as influencing management practices. Advisory measures may be sufficient in some areas where there is bad farming practice. In England, Environmental Stewardship now offers appropriate incentives through the options available under the Entry Level and Higher Level Schemes, but a significant challenge is to deliver these in appropriate catchments by employing local advisers.
Control of point sources. The requirement relates particularly to small point sources discharging to lakes, which are not necessarily picked up by other key drivers, such as the Urban Wastewater Directive, Water Framework Directive and AMP process. For example, in the Anglesey area, a number of septic tanks cause problems, and would be resolved by the provision of a new sewage treatment works, or off-site treatment solutions. An issue is whether such costs are assigned to the BAP or considered to be part of the general remit of the water companies. Some consultees suggested that water company programmes and tightening existing discharge consents can substantially address the issue, but that there is a need to inform the process by identifying where future work is needed. Incomplete knowledge about contribution of small point sources and diffuse sources to nutrient pollution in particular lakes is a problem.
Site specific restoration work. Operations such as sediment removal may be necessary for some sites and incur significant capital costs. Work by English Nature suggests that costs of sediment removal could average £0.5m-£1m per site and be needed at 10 sites; caution is needed to avoid problems of suspension but there are sites with no water depth where remedial work is necessary.
The focus would be on Tier 2 lakes that are priorities for restoration, targeting those that are not addressed by other drivers, especially the Water Framework Directive. Restoration might be overseen by a team of project officers operating at a local or regional basis and charged with assessing the requirements of individual lakes and facilitating the activity required to achieve restoration – e.g. promoting uptake of agri-environment schemes, lobbying for water industry investment programmes to fund improvements in target sites, and overseeing site management investments e.g. sediment stripping, restoration of bankside vegetation, control of invasive species. Thus while some dedicated funding would be required to fund site specific restoration works, the emphasis of HAP delivery could be on identifying restoration work required for other programmes to fund, and guiding other programmes. For example, a team of 10 staff dealing with an average of 3 lakes over a 3 year period, and supported by an appropriate fund for capital restoration works, could implement restorative action for 10 lakes per year.
Development and operation of a Lake Restoration Centre. One consultee suggested that the restoration programme would be facilitated by a national information and advisory centre covering all aspects of lake restoration and enhancement, performing a similar role to the national River Restoration Centre. It would provide technical advice and training, raise awareness about lake restoration, monitor the condition of lakes and maintain the inventory, and formulate, monitor and implement restoration plans. The RRC has 5.5 FTE staff and an annual budget of £250k, funded from a combination of membership fees and project fees.
97
HAP Costings Annexes
3. Communications and Publicity
The HAP also identified the need for promotional activities, including operation of promotional events, publication of a leaflet and development of interpretative facilities. While the indicative costings included the costs of providing visitor facilities at 20 sites, progress has been on a much smaller scale. Consultees suggest that – rather than the provision of visitor centres at £200k each as suggested by the indicative costings – the provision of smaller scale interpretation facilities (displays, hides and boardwalks) would be more appropriate for most sites. An average cost might be in the order of £10k per site.
A possible vehicle for financing some of this work would be the development of a LIFE or HLF bid. This would take 6 months to formulate and would aim to provide funding for restoration and promotional work.
Assessing the Costs of HAP Delivery
The costs of delivery of this HAP are highly uncertain and somewhat open ended given the large number of sites about which little or nothing is known. The best means of assessing the costs would be to convene the different partners in the HAP to define and agree a package of actions that would help to progress the HAP, and then to assess the costs of that package.
The costs of a 10 year programme of action might, however, be expected to include:
1. Site survey and monitoring. Employing a team of nine survey and monitoring staff might cost in the order of £450k per year, including support costs. It might enable 30-60 waters to be surveyed per year, or 300-600 over 10 years, and their management/restoration needs assessed.
2. Restoration project officers. A team of 10 project officers aiming to secure improvements in individual Tier 2 waters, by promoting uptake of agri-environment schemes and advising on the need to address point source pollution issues, would cost in the region of £500k per year.
3. Site specific remediation work. Sediment stripping at £0.5m per site for 10 sites, plus other remediation works £35k per site at 20 sites, capital cost of £5.7m over 10 years or £570k per year.
4. Visitor facilities – boardwalks, hides, interpretation boards – average say £10k per site at 20 sites - £200k capital cost or £20k per year for 10 years;
5. Maintaining inventory and website - £15k per year;
6. Managing implementation of the HAP – at least 1 FTE at £70k including costs, shared between this and mesotrophic lakes HAP.
The above package suggests expenditure in the region of £1.6m per year. The contribution that this would make to the delivery of the HAP is uncertain, given that the extent and nature of restoration work required is unknown. These costs exclude many of the main costs to be incurred in improving the condition of the lakes in question – e.g. through investments in wastewater treatment and delivery of agri-environment schemes. It is assumed that the BAP will guide and inform these programmes rather than requiring additional expenditures.
98
HAP Costings Annexes
21 ANNEX 21: MESOTROPHIC LAKES
Expenditures to Date
It is clear that current activity has been very much constrained by the availability of resources. The main costs incurred to date have included:
i. Inputs from partners. Annual inputs amount to 0.5 FTE. Compilation of the lakes inventory involved an estimated 0.75 job years of work by steering group members (of which approximately one third is attributable to this HAP).
ii. Costs of engaging contractors to develop the lakes inventory – initial cost of c£25k followed by £15k per year to update and maintain the database. This level is likely to continue into the future. Approximately one third (£5k p.a.) can be allocated to mesotrophic lakes HAP.
iii. Costs of developing website. £15k to date, will require £5k per year maintenance costs. Approximately one third of this cost is attributable to mesotrophic lakes.
iv. Site specific restoration works through an English Nature project funded by the Capital Modernisation Fund. This included capital works of £317k at various eutrophic and mesotrophic lakes, including:
£182k at three eutrophic waters in the Norfolk Broads including goose exclusion, fish barriers, planting of marginal vegetation, visitor facilities
£5k at Littlesea, Dorset (mesotrophic lake) for tree clearance and reprofiling
£50k at the West Midland Meres (eutrophic) for tree and scrub removal
£80k to control invasive species at three sites (the eutrophic standing waters of Brown Moss, Shropshire and Hatchet Pond, New Forest; and the mesotrophic Swanholme Lakes, Lincolnshire)
These figures suggest an average capital cost of around £35k per lake for the work completed.
The Environment Agency and Broads Authority have also incurred expenditures in the restoration of sites in the Norfolk Broads. Some of the costs of work at Barton Broad are set out in a report by Posford Haskoning11, and include:
d. Biomanipulation - £80,000 between 1996 and 2000 and a further £77,000 between 2002 and 2004;
e. Dredging and disposal of sediment - £1.5 million – at a cost of £10/m3
f. Bathymetric survey (£12k, over 5 days).
11 Posford Haskoning (2003) Review of Lake Restoration Techniques and Resource Costs. Report for English Nature, Peterborough
99
HAP Costings Annexes
In Northern Ireland no accurate estimate is available of the extent of the habitat. There are 1600 lakes of more than 0.1ha and 700 of more than 1ha but it is not known how many of these eutrophic, mesotrophic, maerl lakes or oligotrophic lakes. The main onus is therefore on classification and survey before the need for remedial work can be established. Consultees suggested that the requirements of the Water Framework Directive are likely to meet or go beyond those of the HAP, requiring all lakes to be in good ecological status by 2015. As a result, the extra costs of delivering the HAP are considered to be small. Meeting the requirements of the WFD will involve 3 person years of work to collect together existing information, and recruitment of a lakes team comprising 5 full time employees charged with ongoing monitoring. There will also be work on standardising classification systems with the Irish Republic and other parts of the UK, through a 7.5m euro cross border project of which approx 5-10% relates to lakes. Education and publicity efforts are considered important but nothing is planned specifically for ESW. There are general educational programmes relating to lakes and rivers, and more effort is currently devoted to mesotrophic lakes which are considered to be under greater threat.
Assessment of Resource Requirements
An assessment of the costs of delivering the HAP depends on the specification and costing of a package of actions to survey, monitor and restore mesotrophic lakes, which are required by the BAP and will not be delivered by other drivers.
Consultations with partners suggest that key potential actions that would take place if adequate resources were available fall into the following principal categories:
1. Site Survey and Monitoring
Implementation of the HAP depends on the delivery of a major programme of site surveys and monitoring, to assess the condition of waters, identify impacts and pressures on them, and identify restoration needs. There is currently no data on 50% of T1 and T2 and all T3 lakes.
The programme is likely to involve:
a. Sampling and chemical analysis
b. Hydrological survey
c. Ecological survey
d. Survey of catchment pressures.
A survey team of 3 people might cover 10-20 lakes in a year. The revised target of surveying 103 Tier 3 lakes by 2010 would suggest that 25 lakes per year need to be surveyed, implying the need for a survey team of five.
Ongoing monitoring would also be required for a sample of sites.
2. Restoration
Restorative actions need to be assessed on a site-by-site basis, but are likely to include:
Control of diffuse pollution. Defra is consulting on plans for catchment sensitive farming which could involve a variety of regulatory, voluntary and incentive measures. There is a role for re-creation of fringe/buffer habitats
100
HAP Costings Annexes
as well as influencing management practices. Advisory measures may be sufficient in some areas where there is bad farming practice. In England, Environmental Stewardship now offers appropriate incentives through the options available under the Entry Level and Higher Level Schemes, but a significant challenge is to deliver these in appropriate catchments by employing local advisers.
Control of point sources. The requirement relates particularly to small point sources discharging to lakes, which are not necessarily picked up by other key drivers, such as the Urban Wastewater Directive, Water Framework Directive and AMP process (or the Water Industry Commissioner’s Quality and Standards process in Scotland). An issue is whether such costs are assigned to the BAP or considered to be part of the general remit of the water companies (or Scottish Water in Scotland). Some consultees suggested that water company programmes and tightening existing discharge consents can substantially address the issue, but that there is a need to inform the process by identifying where future work is needed. Incomplete knowledge about contribution of small point sources and diffuse sources to nutrient pollution in particular lakes is a problem.
Site specific restoration work. Operations such as sediment removal may be necessary for some sites and incur significant capital costs. Work by English Nature suggests that costs of sediment removal could average £0.5m-£1m per site and be needed at 10 sites; caution is needed to avoid problems of suspension but there are sites with limited water depth where remedial work is necessary.
The focus would be on Tier 2 lakes that are priorities for restoration, targeting those that are not addressed by other drivers, especially the Water Framework Directive. Restoration might be overseen by a team of project officers operating at a local or regional basis and charged with assessing the requirements of individual lakes and facilitating the activity required to achieve restoration – e.g. promoting uptake of agri-environment schemes, lobbying for water industry investment programmes to fund improvements in target sites, and overseeing site management investments e.g. sediment stripping, restoration of bankside vegetation, control of invasive species. Thus while some dedicated funding would be required to fund site specific restoration works, the emphasis of HAP delivery could be on identifying restoration work required for other programmes to fund, and guiding other programmes. For example, a team of 10 staff dealing with an average of 3 lakes over a 3 year period, and supported by an appropriate fund for capital restoration works, could implement restorative action for 10 lakes per year.
Development and operation of a Lake Restoration Centre. One consultee suggested that the restoration programme would be facilitated by a national information and advisory centre covering all aspects of lake restoration and enhancement, performing a similar role to the national River Restoration Centre. It would provide technical advice and training, raise awareness about lake restoration, monitor the condition of lakes and maintain the inventory, and formulate, monitor and implement restoration plans. The RRC has 5.5 FTE staff and an annual budget of £250k, funded from a combination of membership fees and project fees.
3. Communications and Publicity
The HAP also identified the need for promotional activities, including operation of promotional events, publication of a leaflet and development of interpretative
101

HAP Costings Annexes
facilities. The provision of smaller scale interpretation facilities (displays, hides and boardwalks) would be more appropriate for most sites. An average cost might be in the order of £10k per site.
A possible vehicle for financing some of this work would be the development of a LIFE or HLF bid. This would take 6 months to formulate and would aim to provide funding for restoration and promotional work.
Assessing the Costs of HAP Delivery
The costs of delivery of this HAP are highly uncertain and somewhat open ended given the large number of sites about which little or nothing is known. The best means of assessing the costs is to define a package of actions that would help to progress the HAP, and then to assess the costs of that package.
The costs of a 10 year programme of action might be expected to include:
1. Site survey and monitoring. Employing a team of five survey and monitoring staff might cost in the order of £250k per year, including support costs. It might enable 20-30 waters to be surveyed per year, or 200-300 over 10 years, and their management/restoration needs assessed.
2. Restoration project officers. A team of 10 project officers aiming to secure improvements in individual Tier 2 waters, by promoting uptake of agri-environment schemes and advising on the need to address point source pollution issues, would cost in the region of £500k per year.
3. Site specific remediation work. Sediment stripping at £0.5m per site for 10 sites, plus other remediation works £35k per site at 20 sites, capital cost of £5.7m over 10 years or £570k per year.
4. Visitor facilities – boardwalks, hides, interpretation boards – average say £10k per site at 10 sites - £100k capital cost or £10k per year for 10 years;
5. Maintaining inventory and website - £7k per year;
6. Managing implementation of the HAP – at least 1 FTE at £70k including costs, shared between this and the Eutrophic Lakes HAP.
The above package suggests expenditure in the region of £1.4m per year. This figure is subject to significant uncertainty. The contribution that it would make to the delivery of the HAP is uncertain, given that the extent and nature of restoration work required is unknown. These costs exclude many of the main costs to be incurred in improving the condition of the lakes in question – e.g. through investments in wastewater treatment and delivery of agri-environment schemes. It is assumed that the BAP will guide and inform these programmes rather than requiring additional expenditures.
102

HAP Costings Annexes
22 ANNEX 22: CHALK RIVERS Costing the Habitat Action Plan for Chalk Rivers
Chalk rivers are restricted to England, and occur in the following 12 Environment Agency areas:
Thames - SE
Thames - W
Thames - NE
Southern - Hampshire and Isle of Wight
Southern – Sussex
Southern – Kent
South West – S Wessex
Anglian – Central
Anglian – Eastern
Anglian – Northern
North East – Dales
North East – Ridings.
Appendix 2 of “The State of England’s Chalk Rivers” lists the chalk rivers in England and gives their lengths and designations. The Appendix identifies 161 chalk rivers with a total estimated length of 3915 km. Of these, 10 rivers (1224km) are river SSSI and 5 rivers (761km) are SAC. Therefore the large majority of chalk rivers are non designated sites. This is significant in that most of the work to date to improve the condition of the habitat has focused on designated sites.
From the submission to the targets review, and the “Agenda for Action” set out in the report “The State of England’s Chalk Rivers”, it is clear that action needs to take place in the following areas:
1. Strategy for River Restoration.
There is a need to establish a strategic programme of river restoration, within which rehabilitation of chalk rivers can be undertaken. This will involve restoration plans at the catchment level, within which the actions below will be undertaken. These will need to be developed and their implementation co-ordinated over time.
This action and indeed the overall delivery of the Chalk HAP would benefit from a full time programme co-ordinator that reports to the National Chalk Rivers Steering Group. For river restoration such a post is needed to co-ordinate the development and implementation of restoration strategies, at an annual cost of £70,000 (including salary and all support costs, overheads and expenses).
The cost of developing 12 strategies, one for each EA area, is estimated at £20,000 per EA Area, through a combination of staff time and consultancy fees, a total one-off cost of £240,000.
103
HAP Costings Annexes
2. River Restoration Costs
It is estimated that 25% of the length of chalk rivers in England (estimated at 1000km) is in need of restoration work, because it has been degraded or adversely modified. The cost of restoration is estimated at an average of £15,000 per kilometre, suggesting a total cost of £15 million. Undertaking this work over a 25 year period between 2005 and 2030 would suggest an annual cost of £0.6 million.
3. Advisory Programme
Advisory work includes:
a. Development and promotion of a chalk rivers management guide, aimed at planners and land managers, at an estimated one-off cost of £25,000.
b. Employment of a team of Land Care Officers, one in each of the 12 EA chalk river areas, to provide advice to land managers in chalk river catchments. Estimated total costs of £50,000 per officer (including salary, overheads and support costs), a total of £600,000 per year.
4. Measures to Tackle Low Flows and Promote Sustainable Water Use.
A programme of work is needed to:
a. Identify, agree and set practical ecologically acceptable target flow regimes for all chalk rivers
b. Identify solutions to unsustainable abstraction
c. Promote more efficient water use in chalk river catchments
d. Adopt more holistic approach to catchment management to reduce rapid runoff and peak flood flows, enhance aquifer recharge and restore natural functions of rivers/floodplains.
This can be achieved through a two stage process, as follows:
1. Development of a national toolkit to assist in the assessment of river flows at the local level and the promotion of ecologically acceptable target flow regimes through sustainable water management. This will involve a three year contract to: review the current state of knowledge on chalk river flows; convene an expert symposium bringing together leading academics and practitioners to provide an up-to-date review of current knowledge; and develop a toolkit summarising key evidence on the assessment of river flows and development and application of appropriate solutions. Estimated cost of £220,000 over three years (£60k per year for the research contract and £40k for the symposium and publication).
2. Application of this knowledge in each chalk river area, to determine ecologically acceptable target flow regimes and advise on appropriate remedial actions. This is estimated to involve a one year contract in each EA Area, at a cost of £60k each including salary and all costs. Total cost of £720,000 during the 2010 to 2015 period.
Achieving the target flow rates is likely to require capital investment to develop alternative water abstraction and storage infrastructure, through water company and Environment Agency investment programmes. The cost of this is likely to be substantial, but cannot be estimated at this stage. The extent to which expenditures of this nature are attributable to the BAP, rather than to core
104
HAP Costings Annexes
programmes of investment, is also somewhat debateable. It may be assumed that the BAP helps to guide and drive these investments.
5. Measures to Improve Water Quality
The HAP requires establishment of targets for water quality standards and co-ordination of actions to achieve these. This will include appropriate measures to control diffuse pollution (through agri-environment schemes and advisory measures) as well as advising on the need to tackle point source pollution. The latter costs will be met through water company investment programmes and other discharge consents, guided by the restoration strategies costed above. The overall costs of these investments cannot be estimated at this stage, and cannot all be attributed to the BAP, but are likely to be substantial.
Agri-environment schemes have an important role to play in reducing diffuse pollution and achieving sympathetic management of adjacent land. Appropriate incentives are already in place through Entry Level and Higher Level Stewardship, though higher levels of uptake would be beneficial, especially in sensitive locations. One of the roles of the Land Care officers would be to work with the Rural Development Service and farmers to promote uptake of Environmental Stewardship in chalk river catchments. It is recommended having a Land Care officer in each of the 12 EA Areas (see above).
6. Monitoring Programme.
There is a need for a programme of ecological monitoring to detect any adverse change and to validate the effectiveness of management actions. The Environment Agency’s existing monitoring programme is well equipped to fulfil this role. However, commissioning a year long review of chalk river monitoring and analysis of existing data, at a cost of £60,000, would provide important information on the current state of chalk rivers and on recent trends, and would help to maximise the effectiveness of the use of monitoring data and guide future monitoring work.
7. Research Programme.
There is a need for a budget to fund research into various aspects of chalk rivers, their ecology and management. An estimated annual budget of £80,000 would fund an ongoing programme of PhD research as well as providing a small annual budget for research contracts.
8. Control of Non Native Species.
A national programme is needed to address the threat caused by non native species, supporting local action to control or eradicate these species in particular rivers. These species include plants such as Japanese Knotweed and Himalayan Balsam, and animals such as mink and North American crayfish. The costs of controlling mink to protect water voles have been estimated as part of the costings for the Water Vole SAP. The costs of work to control other species in and beside chalk rivers could be met by an annual budget of £50,000 to co-ordinate and fund local action.
105
HAP Costings Annexes
Summary of Unit Costs
Chalk River BAP Programme Co-ordinator
70,000 Per FTE per year
Includes salary, expenses, office costs and overheads
Area Chalk River Restoration Strategies
20,000 Per EA area
Chalk rivers occur in 12 EA Areas
Chalk River habitat restoration costs
15,000 Per km Costs of physical works to be undertaken over 25 years; estimated to be required on 25% of length, 1000km
Chalk rivers management guide
25,000 For project
One-off cost
Land Care Officers 50,000 Per post per year
One in each of 12 EA Areas. To cover salary, support costs, office costs and expenses
Ecological acceptable target flow regime research contract to develop national toolkit
60,000 Per year Three year contract
Ecological acceptable target flow regime symposium and publication
40,000 Total One-off cost
Ecological acceptable target flow regime Area plans
60,000 Per EA Area
One-off cost for each of 12 EA Areas
Monitoring review 60,000 Total For one-year contract
Research budget 80,000 Annual To support PhD and research contracts
Control of non-native species
50,000 Annual budget
To support local action
Overall Costs of HAP Delivery
It should be noted that the estimates below exclude the costs of investments designed to improve water quality and water flows, which are not currently quantifiable, but are assumed to be met through core water company and Environment Agency investment programmes, guided by the HAP. The costs of agri-environment payments are also excluded, on the assumption that these can be met through existing programmes, guided by the advisory and strategic actions recommended below.
The overall costs of delivering this HAP are estimated to average £1.5 million per year between 2005 and 2015, and £1.4 million per year thereafter. Details are as follows (Table A22.1).
106
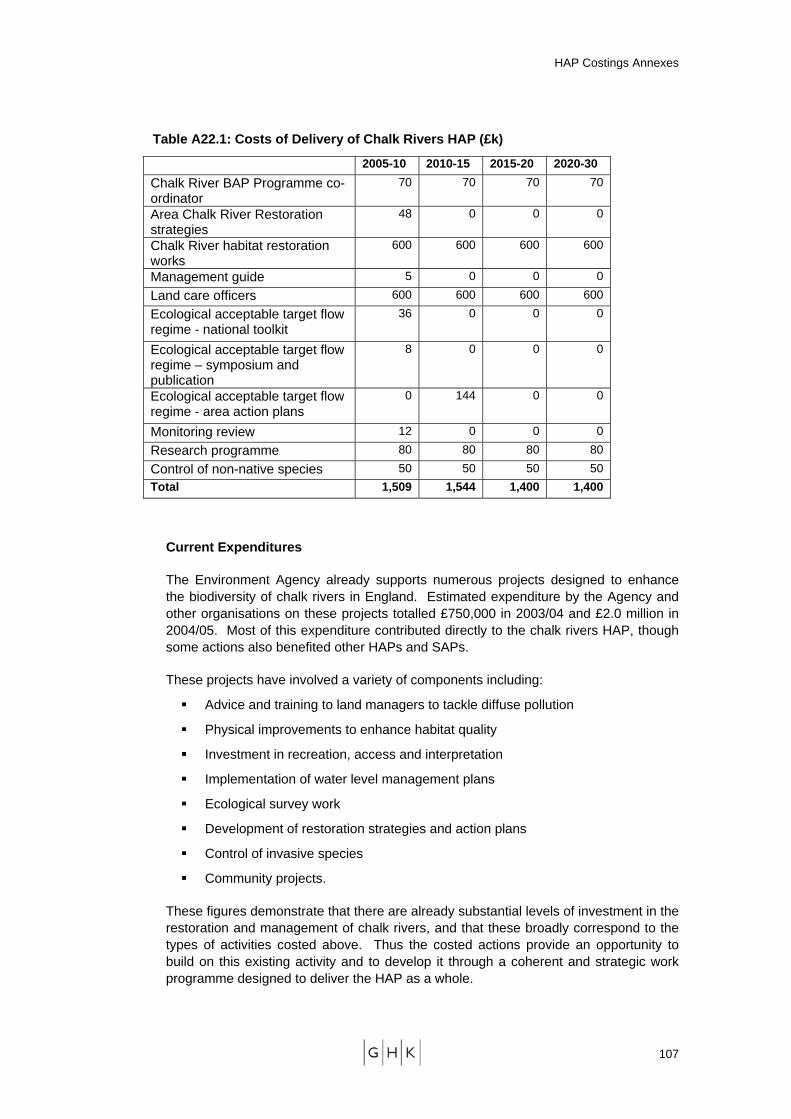
HAP Costings Annexes
Table A22.1: Costs of Delivery of Chalk Rivers HAP (£k)
2005-10 2010-15 2015-20 2020-30 Chalk River BAP Programme co-ordinator
70 70 70 70
Area Chalk River Restoration strategies
48 0 0 0
Chalk River habitat restoration works
600 600 600 600
Management guide 5 0 0 0 Land care officers 600 600 600 600 Ecological acceptable target flow regime - national toolkit
36 0 0 0
Ecological acceptable target flow regime – symposium and publication
8 0 0 0
Ecological acceptable target flow regime - area action plans
0 144 0 0
Monitoring review 12 0 0 0 Research programme 80 80 80 80 Control of non-native species 50 50 50 50 Total 1,509 1,544 1,400 1,400
Current Expenditures
The Environment Agency already supports numerous projects designed to enhance the biodiversity of chalk rivers in England. Estimated expenditure by the Agency and other organisations on these projects totalled £750,000 in 2003/04 and £2.0 million in 2004/05. Most of this expenditure contributed directly to the chalk rivers HAP, though some actions also benefited other HAPs and SAPs.
These projects have involved a variety of components including:
Advice and training to land managers to tackle diffuse pollution
Physical improvements to enhance habitat quality
Investment in recreation, access and interpretation
Implementation of water level management plans
Ecological survey work
Development of restoration strategies and action plans
Control of invasive species
Community projects.
These figures demonstrate that there are already substantial levels of investment in the restoration and management of chalk rivers, and that these broadly correspond to the types of activities costed above. Thus the costed actions provide an opportunity to build on this existing activity and to develop it through a coherent and strategic work programme designed to deliver the HAP as a whole.
107

HAP Costings Annexes
23 ANNEX 23: MACHAIR
Principal costs of HAP Delivery
A research project funded by SNH, Western Isles and Argyll and Bute Councils, Historic Scotland and MoD/Qinetiq is currently assessing the extent and condition of the machair resource, at a cost of £70,000. This excludes costs of analysis, which will be additional.
The principal costs of delivering this HAP are:
Grassland management and restoration. Machair grassland needs to be managed through appropriate grazing regimes, to avoid over-grazing. Grazing by cattle is preferred to sheep. The original HAP targets are to maintain the existing extent of machair, to apply remedial measures to 50% of overgrazed land by 2005 and 100% by 2010, and to restore improved grassland to traditional mixed management with no overgrazing, reducing the extent of improved grassland by 30% by 2010. The indicative costings estimated that the latter area was equivalent to 1000 hectares (30% of 3370ha).
Arable management – the arable area is currently estimated at 2014 ha of which 1182 ha is fallow and 832 ha under crops. These estimates are indicative and based on figures from the 1980s and 1990s.
Stabilise erosion – erosion of the habitat is of concern to landowners though this needs to be balanced with a recognition that the habitat is dynamic. Some measures to prevent erosion are considered appropriate. The indicative costings suggested the need for expenditures of £290/ha (based on ESA payments for sand dunes).
Climate change planning – the habitat is sensitive to climate change and liable to flooding, which threatens both the future of the habitat as well as neighbouring communities. There is a need to develop a digital terrain model and to use it to plan flooding and mitigation measures. This would cost around £250,000 over a period of ten years. As well as informing management of the habitat it would also have benefits in terms of flood risk management. Attributing 50% of the cost of this work to the HAP and 50% to wider objectives would imply an annual cost of £12,500 over ten years from BAP budgets.
HAP co-ordinator – 1 FTE officer with a remit for co-ordinating delivery of the HAP as a whole and overseeing the delivery of a variety of actions (policy and legislative, site safeguard, research and monitoring, communications and publicity etc) – cost £70k per year including salary, support costs and all expenses – note the high cost of travel around the machair areas – with T&S costs estimated at 60% of salary.
Advisory/project officers – the indicative costings estimated the need for 5 advisory officers and this is considered an appropriate level of staffing for the future. This is broadly in line with current staffing levels, though these are divided between different organisations and initiatives. The total cost is estimated at £40k per post per year (including support costs and expenses) or £200k per year in total.
108
HAP Costings Annexes
Research – an annual research budget of £10k is considered sufficient to fund the research needed to aid the delivery of the HAP.
Agri-Environment Payments
Current payment rates under Rural Stewardship Scheme:
Management of cropped machair - £200/ha, or £240/ha with traditional application of seaweed and/or dung
Extensive management of mown grassland for birds - £150/ha
Management of open grazed grassland for birds - £100/ha
Extensive management of mown grassland for corncrakes - £190/ha
Management of early/late cover for corncrakes - £160/ha
Management of wet grassland for waders - £100/ha
Management of species rich grassland - £100/ha
Creation and management of species rich grassland on improved grassland - £150/ha
Conservation management plan with special measures for small units - £50/ha (in-bye)
Introduction of herd of cattle of Scottish native/traditional breeds with equivalent reduction in sheep - £340/ha (in conjunction with conservation plan)
SEERAD reports four principal habitat management payments under the ESA for the Uists, which is being incorporated into the RSS.
1. arable cropping. £240/ha with seaweed or £200/ha without. Must apply to 15% of land.
2. species rich areas – management of hay meadows either intensive or extensive. £100/ha
3. wetland - £100/ha
4. measures to prevent dune erosion. £290/ha
The payments are mostly made for habitat management rather than restoration work.
The following agri-environment payments will be used as a basis for the costings:
Arable management - £220/ha/yr
Restoration of improved grassland - £150/ha/yr
Management of unimproved grassland/wetland - £100/ha/yr
109
HAP Costings Annexes
Management of dunes/eroded land - £290/ha/yr.
The above costs should be treated as minimum costs. With regard to arable management, measures to reduce the amount of chemical fertiliser, reduce patch size and discourage herbicide may add significantly to costs. SNH has commented that the employment of a substantial advisory resource may allow the development of more flexible schemes that are more results based and less prescription based – this may enhance the effectiveness of the programme and make it less socially intrusive.
110
HAP Costings Annexes
24 ANNEX 24: COASTAL VEGETATED SHINGLE
Introduction
Delivery of the Coastal Vegetated Shingle HAP involves a certain amount of site management work, aimed at the management, restoration and re-establishment of shingle habitats, but also a significant amount of work to alleviate human pressures on shingle habitats. This involves employment of staff to deal with casework affecting shingle sites, raise awareness of shingle habitats, provide advice to landowners, and train and manage volunteers. This activity is concentrated in South East England and East Anglia, where the majority of shingle habitats are located.
Maintenance
Most CVS habitat is SSSI. Maintenance of shingle habitats does not generally require intensive management, but depends on protection of sites and species from disturbance or damage from human activities. Thus the principal cost involves protection of sites and alleviation of human pressure through installation and maintenance of fencing, and/or through wardening of shingle sites. Some sites may require low level grazing to prevent the invasion of scrub.
Rye Harbour LNR has recently spent £50,000 on fencing 65 ha of habitat, at a cost of £769/ha, for visitor management and prevention of disturbance. The fencing is expected to last 20 years, suggesting an average depreciation cost of £38/ha/yr. In addition, maintenance of fencing incurs expenditure of £1k per year or £15/ha/yr, suggesting an overall annual cost of £53/ha/yr.
Rabbit fencing for two rare plant species has involved expenditure of £300 over 0.25ha, or £1200/ha.
MoD land at Lydd Ranges has required only low level of intervention with a small area of fencing and some work to encourage revegetation.
There are no specific payments for shingle management in any of the UK agri-environment schemes.
These examples suggest an annual management cost of £50 per hectare for shingle habitats.
Restoration
Restoration of shingle habitats potentially involves a variety of different operations, including:
Scrub removal at some sites
Revegetation of sites damaged by erosion or extractive activities, by planting appropriate plant species
111
HAP Costings Annexes
Physical restoration work, such as restoration of the landform and removal of imported material.
At Rye Harbour LNR capital works to restore and enhance the landform involved expenditures of £8664 in 2003 over an area of 0.7 ha, an average of £12,400 per hectare.
Work at Rye Harbour Farm has involved restoration of shingle habitats through stripping of imported soil and washing and replacement of shingle. The cost is put at £10-15k per hectare for 1-2 hectares, an average of £8,330/ha.
The costs of planting shingle habitats mostly relate to the labour involved in maintaining nurseries and planting suitable species. Planting 1000 plants per hectare at a cost of £1 per plant would suggest an overall cost of £1,000 per hectare.
Agri-environment scheme payments for scrub removal are as follows:
Higher Level Stewardship (England) - £228-£583/ha
Tir Gofal (Wales) - £150 - £600/ha
These figures demonstrate that restoration costs can be substantial but are often restricted to relatively small areas.
Based on an assumption that 25% of the area to be restored requires scrub removal at an average cost of £400/ha, 50% requires re-vegetation work at £1,000 per hectare, and 25% requires restoration of the land form at £10,000 per hectare, it is assumed that the average regeneration cost is £3,100/ha.
Expansion
Expansion of this habitat can be achieved by the re-conversion of agricultural land with a shingle substrate. This will require physical restoration work such as soil removal, as well as an annual payment to compensate farmers for agricultural income foregone. The capital cost is assumed to be £10,000 per hectare, followed by an annual management payment of £200/ha (grassland) or £320/ha (arable land), an average of £260/ha/yr.
Other Costs
Recent expenditures
Recent expenditures in the delivery of this HAP have included:
Admin and central co-ordination role – 20% of Lead Partner’s time
Guidance document - £20,000 in 2003. Providing advice to local authorities, land managers, contractors, public regarding needs of habitat.
Coastal Biodiversity Officers – 2, one in each of East and West Sussex, initially focusing on CVS but now with broader coastal biodiversity role. Joint policy, advisory, research and communications function. This work is vital to protect
112
HAP Costings Annexes
habitat from built development and human disturbance. It is currently estimated that East Sussex officer spends two thirds of her time on this habitat and West Sussex officer 20% of her time on this habitat. Overall cost = £50k per officer per year including all support costs. Thus current annual cost of approx £43k per year for the two Sussex project officers can be attributed to the habitat.
Beach Wardens scheme, West Sussex. BTCV obtained £72k funding from the Landfill Tax Credit Scheme for a 3 year project to recruit and train volunteers to look after shingle habitats. Role includes visitor management, awareness raising, and public projects e.g. to raise and introduce new plants, in a heavily populated coastal area. 25 wardens have been trained and cover an area of 38.5ha.
Understanding distribution of resource - £10k GIS project.
Interreg project – Beaches at Risk – Sussex with France.
Smaller projects through national funds – EN has committed £4k funding to local projects.
EN/EA joint post to look at shoreline management issues - £18k EN funding for coastal habitats including shingle.
Biodiversity issues in shoreline management – another project designed to inform shoreline management plans, receiving £30-40k funding over 3 years from EN.
Defra – Future Coast study – providing information for shoreline management, focusing especially on geomorphology rather than ecology.
Coastal recharge – extraction of shingle offshore to boost shingle sediments – has been used in flood defence schemes in Brighton and Hastings. Some CVS sites could benefit. Cost could be many £ millions.
Future expenditure needs
Delivery of the HAP is dependent on resourcing a package of activity including the following:
National HAP co-ordinator – working at a UK level to co-ordinate policy, advisory, communication, research activity, working with existing research programmes and universities to promote research into the habitat. Estimated cost £70k per year including salary and all support costs.
Regional project officers – Responsible for local casework, policy, advisory and communications activities. Officers will promote understanding of CVS sites, raise awareness amongst decision makers, and promote favourable management of the coast. They will also be responsible for managing volunteer beach wardens and community nurseries. Employment of four full time project officers, two each in Sussex/Kent and East Anglia, would incur annual expenditure of £200,000, including support costs.
113

HAP Costings Annexes
Research – a better understanding of both the physical and ecological processes affecting the habitat is needed – but may be achieved through existing research programmes with the right networking/co-ordination.
Advice – The shingle management handbook needs to be updated and developed at an estimated cost of £20k every five years.
Publications – An annual budget of £5k is required to fund advisory and communications literature.
Annual cost - £279,000
With the exception of the regional project officers, these costs are allocated to countries in proportion to the area of habitat in each country. Thus the estimated annual cost breakdown is as follows:
England - £281k
Wales - £1.7k
Scotland - £10.7k
Northern Ireland - £0.8k.
114
HAP Costings Annexes
25 ANNEX 25: MARITIME CLIFF AND SLOPES
Principal Costs
The principal costs of delivering this HAP are:
Survey work. A national survey of maritime cliffs is required to establish their vegetation structure and condition. It is estimated that 50% of the national area of 22,000 hectares will need to be surveyed, at an average cost of £50/ha. This unit cost was used in the indicative costings and is considered by the lead partner to remain the best available estimate. This gives a total cost of £550,000. If this is spread over a five year period it gives an annual cost of £110,000. Surveying the cliff slopes themselves – rather than the clifftops – is more difficult and involves sending people down cliffs on ropes – in Scotland the cost of this has been estimated at £20k per site for 15 sites – a total of £300k – but the value of doing so could be questioned as it is unclear how the knowledge would be used.
Research Study. A research study is needed to identify areas suitable for habitat re-creation. This will involve a combination of desk research, drawing on the survey work above, and compiling inventories of MCS habitats, and visits to shortlisted sites. The estimated cost would be £50,000.
Advisory. Advice on coastal management strategies is needed, especially with regard to erosion of soft cliffs in England. This requires specialist expertise on geological, engineering and planning aspects, and input into coastal management plans. English Nature employs a geologist/geomorphologist who is able to provide advice on sea defence issues. There is a need for an additional officer who would help to take a more proactive role in planning and management of the coast, particularly in England where soft cliffs are under threat from coastal erosion. The estimated cost would be £60,000 per year including salary, office and support costs, and expenses.
Habitat Re-creation. The plan has a target to increase the area of clifftop habitat by at least 500 hectares over 20 years. This work is still yet to commence. This largely involves conversion of improved grassland or arable land into extensive grassland habitats. Though agri-environment schemes have a role to play in this respect, much of this land will require intensive works including turf stripping to reduce nutrient levels.
Habitat Management/Enhancement/Restoration. The plan sets a target to improve the quality of 30% of the resource by appropriate management by 2010, and as much as possible of the resource by 2015. There is also a target to maintain the overall extent of the habitat (4000km). Habitat management and enhancement requires management of a mosaic of grassland, heath and scrub habitats and will typically involve implementation of appropriate grazing regimes, including introduction of grazing in some areas and reduction of grazing pressure in others. In some areas grazing is inappropriate and exclusion of livestock will be required. This is likely to require all of the habitat to come under some form of management agreement, through agri-environment schemes, SSSI and NNR management agreements.
HAP Co-ordinator. The lead partner officer currently spends 5-10% of his time on the delivery of this HAP. Delivery of the remaining policy, site safeguard, advisory,
115

HAP Costings Annexes
research and communications activities requires increased input and would be facilitated by the appointment of a dedicated full time co-ordinator for this HAP. The cost of this is estimated at £60,000 to include a full time salary and all support costs and expenses. Such a co-ordinator would have a UK wide role, and SNH considered that no case could be made for a dedicated co-ordinator in Scotland.
Agri-Environment Payments
Appropriate payment rates under agri-environment schemes would appear to be as follows:
Higher Level Stewardship (England):
Maintenance of species rich semi-natural grassland - £200/ha/yr
Restoration of species-rich semi-natural grassland - £200/ha/yr
Creation of species-rich semi-natural grassland - £280/ha/yr
Maintenance of semi-improved or rough grassland for target species - £130/ha/yr
Restoration of semi-improved or rough grassland for target species - £130/ha/yr
Creation of semi-improved or rough grassland for target species - £210/ha/yr
Creation/restoration/maintenance of successional areas and scrub - £100/ha/yr
Supplements:
Control of invasive plant species - £60/ha/yr
Bracken control - £35/ha/yr
Difficult sites - £50/ha/yr
Capital payments:
Scrub management - £228-583/ha
Bracken control - £48 - £112/ha
Rural Stewardship Scheme (Scotland):
Management of species rich grassland - £100/ha/yr
Bracken eradication - £25/ha/yr
Creation of species rich grassland on arable land - £250/ha/yr
Creation of species rich grassland on improved grassland - £150/ha/yr
Management of coastal heath - £80/ha/yr
Management of scrub - £55/ha
116
HAP Costings Annexes
Bracken control (capital payment) - £120/ha
Sowing of species rich grassland - £400/ha capital payment
Tir Gofal (Wales):
Lowland and coastal heath - £65/ha/yr
Coastal cliff slope – grazed - £80/ha/yr
Coastal cliff slope – ungrazed - £5/ha/yr
Convert arable to semi-improved grazed pasture - £115/ha/yr
Convert improved grassland to semi-improved pasture - £90/ha/yr
Convert semi-improved to unimproved grassland - £60-95/ha/yr
Bracken control - £60/ha/yr
Scrub clearance – mechanical - £150/ha
Scrub clearance – hand cutting - £600/ha
Turf stripping for creating new habitats - £300/ha
Countryside Management Scheme and ESAs (Northern Ireland):
Unimproved grassland – first 100ha - £50/ha
Species rich grassland – grazing - £155/ha
Scrub – light grazing – first 10 ha - £80/ha
Chough - £50/ha
Bracken control - £140-260/ha
Based on the above payment rates, and averaging the costs of appropriate prescriptions in each country, the following costs for creation and management are proposed:
Creation Management/
Enhancement
England Capital cost of £150/ha followed by annual cost
of £200/ha/yr
£150/ha/yr
117
HAP Costings Annexes
Wales/Scotland/Northern Ireland
Capital cost of £150/ha followed by annual cost
of £100/ha/yr
£80/ha/yr
The capital cost for creation is based on the assumption that a proportion of the land undergoing habitat re-creation will require capital works such as turf stripping at a one-off capital cost of £300/ha. It is assumed that these costs are incurred on 50% of the area undergoing re-creation work.
118
HAP Costings Annexes
26 ANNEX 26: COASTAL SAND DUNES
Introduction
The main costs of delivering this HAP relate to habitat management and restoration. In addition, a series of costs relate to various activities such as networking, advice, survey work, management planning, research and administration.
Habitat restoration, from woodland, scrub and bracken is problematic and difficult to achieve. The situation is complicated by the fragmentation of funding and the difficulty of persuading landowners to fund restoration work. In Scotland most of the land is public sector owned (especially MoD, to a lesser extent FC). Costs vary by site depending on the works to be undertaken. Sites are often not agricultural so agri-environment funding may not apply. Need for tree removal is localised, scrub removal widespread.
Habitat management depends on maintaining appropriate grazing regimes. In practice sites are often under-grazed or over-grazed.
Restoration Costs
Habitat Restoration at Ainsdale NNR
The total cost of restoring 44.5 ha of sand dune through clearance of scrub and pine is estimated at £158,600 over a 7 year period between 2003 and 2010, an average cost of £3,564 per hectare. This involved clearance of pines and scrub, clearance of stumps, brash and needles, fencing, and reintroduction of grazing.
Per hectare rates are as follows:
Scrub clearance / ha £900
Pine clearance/ ha: Harvesting Stump clearance Follow up brash clearance Total
£300 £250
£1200 £2,750
Bury firesites/ha £150
Slack scraping/ha £2,000
Stock fencing £180
Sand dune restoration at Lossiemouth Forest
Forestry Commission felled approximately 34 ha of plantation woodland in 2001/02 and 22 ha of this was left to revert to sand dune. The tree crop was a mixture of 50 year old Scots, lodgepole and Corsican pine. 80% of the crop was Corsican pine yield class 8 the remaining being 10% Scots and 10% Lodgepole both yield class 10.
119
HAP Costings Annexes
The average weight of timber was 316 tonnes per ha over 22ha, giving a total of 6952 tonnes of timber. The cost of harvesting this timber was put at £7.00 per tonne, or a total cost of £48,664. This equates to a cost of £2212 per hectare. An estimated 50% of the timber was sold as saw logs at £28/tonne (£97,328) a further 10% was sold as pallet wood at £17.00 per tonne (£5899) and the remaining 40% as pulpwood at £14.50 per tonne (£45,370). This gave an estimated net income of £99,933, or £4500 per hectare.
FC has estimated that the net revenue forgone from not replanting is therefore £99,933 (in 50 years time). Applying a discount rate of 3.5% to this figure over 50 years gives a present value of £17,893. This compares to establishment costs of £680 per hectare over 22 ha, or £14,960. Thus the net income foregone from not planting the forest is estimated at £2933, or £133 per hectare, over the 50 year cycle. This is equivalent to an annualised figure of £5.70/ha/yr.
This example suggests that the costs of restoration, both in terms of additional harvesting and foregone revenue, are negligible. This is dependent on the harvesting of mature trees, since if immature trees were harvested income would be foregone. The figures suggest that the cost of restoration through conifer removal would range from zero (in this case where there is no net loss of timber income) to £2,200 per hectare (in a worst case scenario where no income is received for the timber harvested). However, it should be noted that, while delaying clearance of forestry from sand dunes might reduce the timber income foregone, it can be expected to result in a deterioration of habitat quality and hence reduce the effectiveness of habitat restoration work.
Agri-Environment Payments
Relevant payments are as follows:
Higher Level Stewardship (England):
Maintenance of sand dunes £140/ha/yr
Restoration of sand dunes £140/ha/yr
Tir Gofal (Wales)
Management of sand dune - £50/ha/yr
Establish new sand dune - £180/ha/yr
Marram grass planting - £200/ha
In Northern Ireland, recent costings commissioned by EHS suggested an appropriate payment rate of £80 per hectare per year for management agreements for this habitat.
Capital payments for scrub removal vary from £228 to £583 per hectare in England, and £150 to £600 per hectare in Wales.
Payments for bracken control vary from £48/ha to £112/ha in England, £60/ha in Wales, £120/ha in Scotland and £140-£260/ha in Northern Ireland.
120

HAP Costings Annexes
Proposed Unit Costs for Sand Dune Management and Restoration
Based on the above, the following unit costs are proposed for sand dune management and restoration.
Management Restoration from forestry* (capital cost)
Restoration from scrub or bracken* (capital cost)
England £140/ha/yr £2,000/ha £550/ha
Northern Ireland £80/ha/yr £2,000/ha £550/ha
Scotland £80/ha/yr £2,000/ha £550/ha
Wales £50/ha/yr £2,000/ha £550/ha
* Figures include an allowance for stock fencing
Other Costs
Networking – Delivery of the HAP would benefit from the operation of an EU network of experts in sand dunes and their management, to share experience, disseminate research and promote best practice. Proposals are under development. Establishing and maintaining a UK network would provide a national focus, would support the work of the UK agencies in delivering the HAP, while also supporting the development of a wider network for NW Europe. The initial set-up cost of such a network is put at £50k with an ongoing annual cost estimated at £25k, to include co-ordination, administration, communications (development and maintenance of a website, publications etc), research links, and organisation of events (workshops, study tours, field meetings etc.)
Advice – development of a Sand Dune Management Handbook through a research contract at a one-off cost of £50k. This needs to include advice on beach cleaning for local authorities, to raise awareness of its potential impacts on sand dune habitats. Thereafter £10k every five years to update.
Survey. Digitisation of English survey data for sand dunes is required, at an estimated one-off cost of £25k.
Management Planning. – CCW has devoted approximately 50 days work to the development of a sand dunes management framework for Wales at a cost of £15k (based on £300/day including all costs). A budget of £10k per year would help to co-ordinate the delivery of the HAP in all of the UK countries.
Research. Sand dunes are a relatively well known and resourced habitat. Research takes place in universities in the UK and other parts of Europe. No additional expenditure is considered necessary for the BAP.
Other Costs. Recent BAP costings for Northern Ireland suggest the need for a series of small scale expenditures on items such as leaflets, small research
121

HAP Costings Annexes
projects, training courses etc. A budget of £20,000 at the UK level is likely to be sufficient to cover these items.
122
HAP Costings Annexes
27 ANNEX 27: SALTMARSH
The main costs of delivering this HAP relate to:
Creation. The HAP sets targets to replace saltmarsh lost between 1992 and 1998 and to replace continuing losses between 1999 and 2015, through managed retreat. These targets amount to a total of 140 ha per year over 15 years (2000 to 2015).
Maintenance/restoration. There is a target to maintain the current extent of saltmarsh (45,500 ha in the UK), maintaining its condition and restoring it where necessary. This is likely to involve management agreements and appropriate incentives for a proportion of the habitat, e.g. through use of agri-environment schemes to maintain appropriate grazing regimes.
Other costs. These include research, survey and advisory work.
Saltmarsh Creation
Two main options exist for saltmarsh creation:
1. Land purchase. Land (usually farmland) is purchased and used to create saltmarsh through a process of managed realignment.
2. Agri-environment schemes. Farmers are compensated for the creation of saltmarsh on their land. Much of the cost covers the income foregone from agricultural production.
In either case, there are additional capital costs relating to the dismantling of existing flood defences and the construction or restoration of new ones.
There is also a need for specialist expertise to guide delivery of schemes, including advice and liaison with landowners. In England, a team of 3 from the main agencies (EN, EA and RDS) is likely to be a minimum requirement. Currently many English Nature staff are involved in managed retreat issues (around 4 centrally and at least 10 from area teams, comprising several full time equivalent jobs).
Environment Agency estimates of the costs of creation average £15,000 per hectare. This includes an average of £10,000 per hectare for land purchase costs and capital works, with a further 50% added for overheads, advisory, project management and administration costs. The EA has a corporate target to create 200 ha of BAP habitat per year at a cost of £3.0m, of which at least 100 ha must be saltmarsh or mudflat.
By way of comparison, saltmarsh creation through Higher Level Stewardship in England would involve grant payments of £500-£700 per hectare per year for 10 years, a total of £5,000 to £7,000 per hectare, on top of which would be added capital works, advisory and administration costs.
Relevant agri-environment costs are as follows.
123

HAP Costings Annexes
Higher Level Stewardship (England):
Creation of inter-tidal and saline habitat on arable land £700/ha
Creation of inter-tidal and saline habitat on grassland £500/ha
Creation of inter-tidal and saline habitats by unmanaged breach or regular inundation/£150 ha
Tir Gofal (Wales):
Establish new saltmarsh - £220/ha/yr. This payment rate is too low and has never been taken up. A higher payment rate would be needed to achieve saltmarsh re-creation.
Managed Retreat Projects
The following data are based on case studies provided by the RSPB:
Paull Holme Strays, Humber Estuary. Realignment of 2.5km of sea defences to create 75 ha of intertidal habitat. Land purchase costs of £1.1m (80 ha at £13.75k/ha, well above market rates). Capital costs of £4m were similar to the costs of renewing existing sea defences. This suggests a net capital cost of zero. If existing defences did not require renewal the gross capital cost would amount to £4m or £53,333 per ha of intertidal habitat created, in addition to land purchase costs of £13,750 per hectare. The scheme is believed to have reduced annual maintenance costs and brought a net annual saving of £155k in CAP payments (RSPB figures).
Freiston Shore, The Wash. Realignment of 1.75km of sea defences to create 66ha of intertidal habitat. The initial capital cost of the scheme was £1.98m, with a total cost of £2.47m estimated over 50 years, including maintenance costs. This compared with an estimated cost of £2.06m over 50 years for maintenance of the existing flood defence, but was preferred on the grounds of its incremental cost benefit ratio, net present value and environmental benefits. The figures suggest a maximum net cost of realignment of £0.41m, or £6,200 per ha, over 50 years. The gross capital cost equates to £37,400 per hectare of intertidal habitat. The land itself was previously owned by HM Prison service and was acquired by the RSPB. The price was reduced by 75% to reflect the fact that the sea defences were no longer sustainable. It is subject to a Countryside Stewardship agreement paying £525/ha over 20 years. An agreement with local graziers yields an annual income of £500 per year. A local fishermen is being compensated for a deterioration in the oyster fishery, at an expected cost of several hundreds of thousand pounds.
Glasson, Lancashire. Creation of 6.4ha of intertidal habitat, including a saline lagoon, has involved capital costs of £94,000 for a new landward bank, plus net land purchase costs of £40,000. These combined costs represent a net overall cost saving of £32,800 compared to the estimated cost of £167,600 of renewing the original line of defences. The gross costs average around £20,900 per hectare of intertidal habitat created.
Nigg Bay, Cromarty Firth. Scotland’s first managed realignment project, moving 800m of flood defences and creating 17ha of intertidal habitat. The total cost has been estimated at £48,500, which included major expenditures on a design and impact study, surveys and monitoring, and fencing, in addition to the capital works themselves. The total cost of building a new wall was put at £9,000, compared to the estimated cost of £37,500 of maintaining the existing defences. The scheme
124
HAP Costings Annexes
therefore brought a significant reduction in capital costs but had a net overall cost of £11,000 (some £650/ha), and gross cost of £2,850 per hectare, in addition to land purchase costs.
Brancaster, Norfolk. 10ha of intertidal habitat created through managed realignment. The options considered included a total realignment (involving loss of freshwater habitats), partial realignment (moving the sea wall inland by 300m) and maintenance of the existing sea defences. The total cost of the partial realignment was estimated at £389k including construction, land purchase, design and supervision, monitoring and maintenance. The cost of holding the existing line was estimated at £508k. The preferred solution was also cheaper than do nothing (£468k) and total realignment (£568k), both of which include the costs of provision of replacement habitat for the freshwater habitats lost. The actual cost has so far been £700k due to various unforeseen costs. The cost of land purchase was £5,300 per hectare. The figures suggest a per hectare cost of between zero (net) and £70k per hectare (gross).
Uphill Sluice and Walborough, Somerset. A realignment scheme on the Severn Estuary creating 5ha of intertidal habitat. Capital cost of £140k including earthworks (£70k), footpath and gates (£15k), other environmental and archaeological works (£15k), land and legal issues and permits (£15k) and design and consultation costs (£25k). The land is owned by Avon Wildlife Trust and no land purchase cost was involved. The new, shorter flood defences were estimated to result in a net saving in maintenance costs of £1050 per year, or £15,000 over 25 years (discounted at 3.5%). The figures therefore suggest a gross cost of £28k per hectare and net cost of £25k per hectare, excluding any land purchase or opportunity costs.
Goosemoor, Exe Estuary. Creation of 5.75 ha of saltmarsh, saline lagoon and mudflat habitat through regulated tidal exchange (maintaining existing defences and installing a self-regulating tidegate). The cost has been estimated at £100,000, including direct costs of £70,000 (construction and installation of tidegate, works to floodbank and new seconday bank), and indirect costs of £30,000 (staff costs and loss of land value). This suggests a total cost of £17,400 per hectare of habitat created, including land costs and cost of works.
Summary of Expansion Costs
The above examples demonstrate that the costs of managed realignment vary widely according to the individual circumstances of the scheme involved. Net costs were negative in some cases, as the costs of reconstruction of existing sea defences exceeded the costs of realignment. In other cases creation of intertidal habitat through managed realignment had a net cost of up to £25,000 per hectare. Clearly by focusing on cases where there is a need for significant investment in existing defences, the net costs of managed realignment can be significantly reduced. However, the marginal costs of creation of intertidal habitat can be expected to increase significantly if larger areas of habitat re-creation are to be achieved. Including land purchase costs, and treating projects with net benefits as having zero costs, implies a net average cost of £11,570 per hectare for the above projects.
125
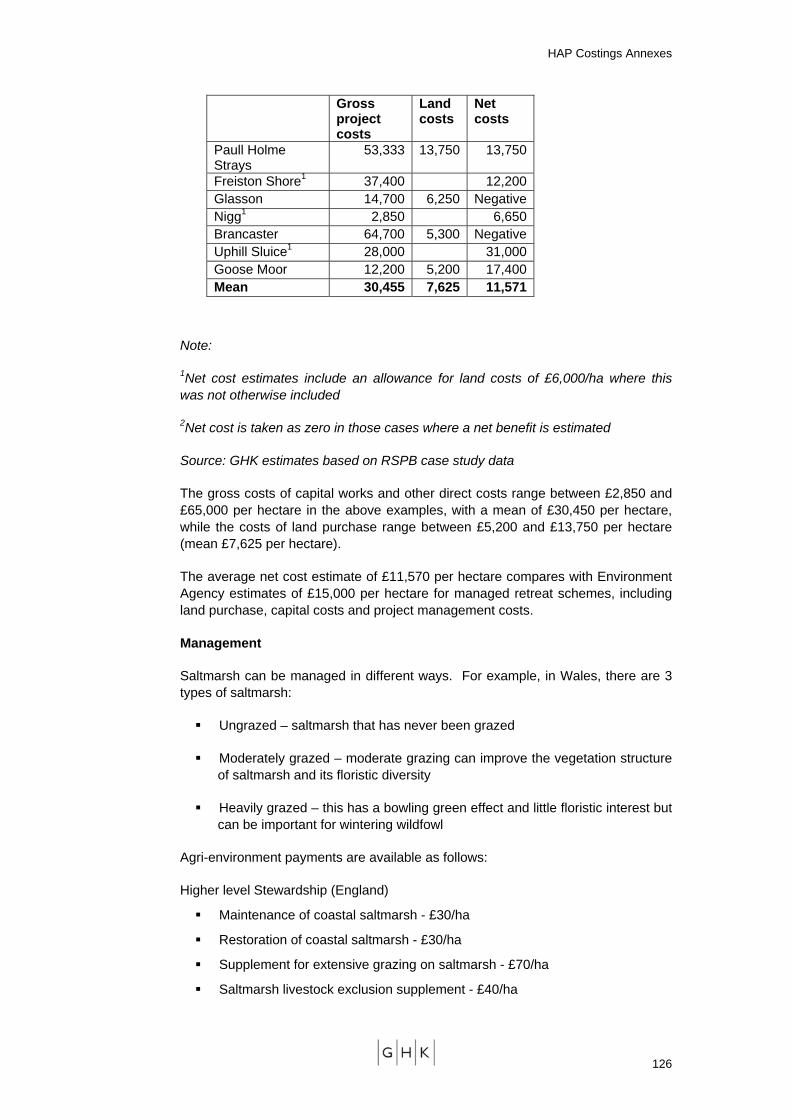
HAP Costings Annexes
Gross project costs
Land costs
Net costs
Paull Holme Strays
53,333 13,750 13,750
Freiston Shore1 37,400 12,200Glasson 14,700 6,250 NegativeNigg1 2,850 6,650Brancaster 64,700 5,300 NegativeUphill Sluice1 28,000 31,000Goose Moor 12,200 5,200 17,400Mean 30,455 7,625 11,571
Note:
1Net cost estimates include an allowance for land costs of £6,000/ha where this was not otherwise included
2Net cost is taken as zero in those cases where a net benefit is estimated
Source: GHK estimates based on RSPB case study data
The gross costs of capital works and other direct costs range between £2,850 and £65,000 per hectare in the above examples, with a mean of £30,450 per hectare, while the costs of land purchase range between £5,200 and £13,750 per hectare (mean £7,625 per hectare).
The average net cost estimate of £11,570 per hectare compares with Environment Agency estimates of £15,000 per hectare for managed retreat schemes, including land purchase, capital costs and project management costs.
Management
Saltmarsh can be managed in different ways. For example, in Wales, there are 3 types of saltmarsh:
Ungrazed – saltmarsh that has never been grazed
Moderately grazed – moderate grazing can improve the vegetation structure of saltmarsh and its floristic diversity
Heavily grazed – this has a bowling green effect and little floristic interest but can be important for wintering wildfowl
Agri-environment payments are available as follows:
Higher level Stewardship (England)
Maintenance of coastal saltmarsh - £30/ha
Restoration of coastal saltmarsh - £30/ha
Supplement for extensive grazing on saltmarsh - £70/ha
Saltmarsh livestock exclusion supplement - £40/ha
126
HAP Costings Annexes
Tir Gofal (Wales)
Saltmarsh short turf - £70/ha/yr
Saltmarsh breeding birds - £125/ha/yr
Saltmarsh ungrazed - £30/ha/yr
The above figures suggest that £30 per hectare is a typical payment for basic maintenance of saltmarsh, while smaller areas of saltmarsh are likely to incur higher costs of around £100 per hectare. It is unlikely that all saltmarsh will incur costs in this way. If could be assumed that 50% of saltmarsh in the UK requires some form of management payment, of which four fifths receives a basic payment of £30 per hectare and one fifth a payment of £100 per hectare. This suggests an average cost of £44 per hectare over the 50% of the habitat under management agreements.
Inclusion of a 15% mark-up to cover the costs of administering land management schemes increases this estimate to £51 per hectare.
Summary of Habitat Costs
The following habitat creation and management costs are proposed:
Creation - £15,000 per hectare
Management - £51 per hectare per year, for 50% of habitat area.
These figures include administration and project management costs.
Other Costs
Survey
Better information about the extent and distribution of saltmarsh habitat is required. The Environment Agency has plans to develop a database detailing the extent and condition of the habitat. This need results from a combination of drivers, especially Water Framework Directive, as well as the BAP. Initially this is likely to involve review, verification and calibration of existing survey data. It is being undertaken in-house initially, with a £10k budget for purchase of photographs and data as required. Depending on need, this might be followed in future by an aerial survey, involving several days of flying, taking aerial photographs, digitising and ground truthing.
The cost of a survey in Scotland has been estimated at £120k, through remote sensing. The last survey was in 1980s and was quite superficial; survey evidence is therefore less detailed and less up-to-date than in England and Wales. 6000 ha = 60 sq km at £1k per sq km = £60k for survey and £120k to include analysis.
In Wales, a comprehensive on-the-ground saltmarsh survey has recently been completed, taking a team of two people five years. Further survey work is planned.
Co-ordination
The lead partner currently spends 15 days per year on this and the Mudflat HAP.
Advice
127
HAP Costings Annexes
A Saltmarsh Management Guide has recently been produced by Defra at an estimated cost of £50,000.
Strategy
In Wales, a need has been identified for a strategic management framework, with an estimated development cost of approximately £12,000.
Research
Research is ongoing into the ecology and needs of saltmarsh habitats by the Environment Agency and others. This is driven partly by the BAP and partly by other drivers such as the Water Framework Directive.
Total
The above are various examples of different costs incurred in delivery of the saltmarsh HAP. These costs are small compared to the habitat creation and management costs identified above, and are assumed to add an additional 5% to the overall costs of HAP delivery.
128
HAP Costings Annexes
28 ANNEX 28: MUDFLAT
The main costs of delivering this HAP relate to:
Creation. The HAP sets targets to retain the current extent of mudflat in the UK. This involves creating new intertidal habitat to replace losses due to sea level rise, through managed realignment.
Other costs. These include research, survey and advisory work.
Mudflat Creation
Two main options exist for mudflat creation:
1. Land purchase. Land (usually farmland) is purchased and used to create mudflat through a process of managed realignment.
2. Agri-environment schemes. Farmers are compensated for the creation of intertidal habitat on their land. Much of the cost covers the income foregone from agricultural production.
In either case, there are additional capital costs relating to the dismantling of existing flood defences and the construction or restoration of new ones.
There is also a need for specialist expertise to guide delivery of schemes, including advice and liaison with landowners. In England, a team of 3 from the main agencies (EN, EA and RDS) is likely to be a minimum requirement. Currently many English Nature staff are involved in managed retreat issues (around 4 centrally and at least 10 from area teams, comprising several full time equivalent jobs).
Environment Agency estimates of the costs of creation average £15,000 per hectare. This includes an average of £10,000 per hectare for land purchase costs and capital works, with a further 50% added for overheads, advisory, project management and administration costs. The EA has a corporate target to create 200 ha of BAP habitat per year at a cost of £3.0m, of which at least 100 ha must be saltmarsh or mudflat.
By way of comparison, mudflat creation through Higher Level Stewardship in England would involve grant payments of £500-£700 per hectare per year for 10 years, a total of £5,000 to £7,000 per hectare, on top of which would be added capital works, advisory and administration costs.
Relevant agri-environment costs are as follows.
Higher Level Stewardship (England):
Creation of inter-tidal and saline habitat on arable land £700/ha
Creation of inter-tidal and saline habitat on grassland £500/ha
Creation of inter-tidal and saline habitats by unmanaged breach or regular inundation/£150 ha
129
HAP Costings Annexes
Managed Retreat Projects
A review of the costs of creating intertidal habitat through managed realignment is provided in the Annex to the Saltmarsh HAP costings. The costs are expected to be similar for both habitats. Indeed, there is often some uncertainty in such projects about whether and to what extent mudflat or saltmarsh habitat will result.
Based on this review, it is proposed to use a figure of £15,000 per hectare of mudflat created, to include land costs or agri-environment payments as appropriate, the costs of capital works, and project management, advisory costs and professional fees.
Other Costs
Co-ordination
The lead partner spends approximately 15 days per year in co-ordinating this and the Saltmarsh HAP. Allowing for inputs from country leads suggests a total time input of approximately 10 days for the mudflat HAP. At a cost of £400 per day (to include overheads and support costs), this implies a total annual cost of £4,000 in administration of the HAP.
Research
The Environment Agency and others undertake ongoing research into the ecology and needs of mudflat habitats, driven by the BAP and other drivers such as the Water Framework Directive. Research costs driven by the mudflat HAP are estimated at £20,000 per annum.
Total
The above suggests annual costs in the order of £24,000 in delivering this HAP, in addition to habitat creation costs.
130
HAP Costings Annexes
29 ANNEX 29: SALINE LAGOONS
The main costs of delivering this HAP relate to:
Creation
The HAP sets targets to create saline lagoons to replace historic losses. 31.75 ha are estimated to have been created to date and the target is to create a further 90ha by 2010 and 120ha by 2015. Some creation to offset continuing losses is likely to be required, though this is likely to be met to some extent by natural processes, and no targets have been set.
Creation of saline lagoons is usually met through managed realignment projects that are intended to secure the ongoing functioning of coastal processes, and normally have a lifespan of 100 years.
The main costs of creation of lagoons involve:
Land costs. Lagoons are usually created on agricultural land or sites currently supporting freshwater habitats. Land costs are likely to be met either through purchase of the site or through an agri-environment agreement.
Capital works. These typically involve the removal of existing flood defence structures, rebuilding new sea defences, installation of sluices and culverts and landscaping work.
Compensatory habitat creation. Where realignment projects impact on other habitats, such as reedbeds and other freshwater habitats, there is a need for compensatory habitat creation work.
Project management expenditures. There are significant costs involved in site survey, scheme design and project management work associated with habitat creation schemes.
Much of this work is focused on England, where sea level rise is greatest and most managed realignment work is taking place. In Wales, no creation work is planned except on sites with existing lagoons which require limited works to create saline lagoon habitat.
Capital Costs
English Nature estimates based on two schemes involving 20 hectares of lagoon creation on the Humber coast and 12 hectares on the Suffolk coast put the average cost at £5,000 to £6,000 per hectare.
Land Costs
Higher Level Stewardship pays farmers £500/ha/yr for creation of saline habitat on grassland and £700/ha/yr on arable land, a total cost of £5,000 to £7,000 per hectare over 10 years. Land purchase would involve similar levels of cost (a one-off payment of £5,000 to £7,000 per hectare depending on the quality of land involved). It is estimated that 2 hectares of land would need to be acquired or entered into an agreement per hectare of saline lagoon created, including to make
131
HAP Costings Annexes
provision for future coastal change, suggesting a land cost or agri-environment cost of £10,000 to £14,000 per hectare of lagoon created.
Project Costs
There is also a need for specialist expertise to guide delivery of schemes, including advice and liaison with landowners. A team of 3 from the main agencies is likely to be a minimum requirement (EN, EA, RDS). There are currently many staff from each of these agencies involved in managed retreat issues.
The Environment Agency estimates that a further 50% needs to be added to capital and land costs for overheads, advisory, project management and administration costs associated with habitat creation schemes involving managed realignment.
Total Costs
The above figures suggest a total cost averaging £26,250 per hectare for saline lagoon creation, including land acquisition or agri-environment costs, capital works and project costs.
By comparison, figures provided by the RSPB estimate the costs of managed realignment schemes at Goosemoor, Exe Estuary, and Glasson, Lancashire, which have created saline lagoons as well as intertidal habitats. The Goosemoor scheme had a total cost of £17,400 per hectare of habitat created and the Glasson scheme an estimated gross cost of £20,900 per hectare. Both of these figures relate to all habitats created, not just saline lagoons. More details are provided in the annex to the saltmarsh HAP costings. The Glasson scheme was found to yield net benefits since the costs were lower than maintaining existing sea defences. The Environment Agency estimates that the cost of creation of coastal BAP habitats averages £15,000 per hectare, including land, capital and project costs. The figures are remarkably similar to the estimates above, when it is considered that the latter make an extra allowance for land acquisition or agri-environment agreements over a greater area than the actual area of lagoon created.
Data in Shepherd and Harley (1999)12 examine saline lagoon creation costs for schemes of 1.5ha at Salthouse (Norfolk) and 1.4ha at Teesmouth. These give average costs of £6,700 per hectare and £59,600 per hectare respectively, including land purchase, planning, water management, lagoon construction, supervisory, monitoring, aftercare and project management costs. Data provided by RSPB for a site at Fawley (Hampshire) provide figures in a similar format and suggest average costs of £16,500 per hectare for a 10 ha site.
Maintenance
The HAP requires the extent and condition of saline lagoons to be maintained. The management required varies considerably by site. Some natural lagoons require no intervention; some require regular wardening; artificial lagoons require low level maintenance of water management infrastructure such as sluices and culverts and management of water levels and salinity; some sites benefit from vegetation management; some depend on maintenance of sea defences that may involve substantial levels of capital investment. Other costs may include fencing, people
12 Shepherd P and Harley D (1999) Preparation and Presentation of Habitat Replacement Cost Estimates. Report for English Nature, Peterborough.
132

HAP Costings Annexes
management and predator control13. In general a higher proportion of saline lagoons tend to be managed in England than in other countries of the UK, and it is in England that the pressures of sea level rise are greatest, giving rise to higher capital investment costs.
An RSPB-led project supported by the LIFE programme included a budget of £307,155 for the management of 220 hectares of saline lagoons over 4 years. However, this figure includes “one-off” expenditures and not just ongoing management costs. Figures provided by the RSPB suggest that just over 50% of management costs on their sites were non-recurring expenditures and just under 50% were recurring expenditures – this suggests that ongoing management costs are likely to average £170 per hectare on each of these sites.
Not all saline lagoon sites require management. In general artificial lagoons in England tend to involve greatest levels of management whereas natural lagoons in other parts of the UK benefit from non-intervention. Three quarters of the UK saline lagoon resource is in Scotland, and tends to require only low levels of management. If an annual management cost of £170 per hectare is used, and it is assumed that 80% of the English resource but only 20% of the Scottish resource is managed in this way, this implies an annual management cost of £136/ha/yr in England and £34/ha/yr in Scotland.
Restoration
It is estimated that 450 hectares of saline lagoon require restoration work to restore favourable condition. This usually involves small scale works, for example to reinstate an appropriate water management regime through replacement of sluices, desilting feeder creeks and lagoons, rebuilding banks and managing vegetation. This is often achieved through acquisition of the site by RSPB or one of the statutory nature conservation agencies.
Data provided by the RSPB-led LIFE project suggest non-recurring capital costs of approximately £160,000 for the restoration of 10 sites. This suggests an average capital cost of £16,000 per site.
The lead partner has suggested an average restoration cost of £15,000 per site.
Given that the average size of a saline lagoon site is estimated at 14 hectares in the UK, an average cost of £16,000 per site suggests an average restoration cost of £1140 per hectare.
This estimate may be conservative, on the grounds that restoration of smaller sites may involve significant fixed capital costs, resulting in a high per hectare cost.
Summary of Site-Related Costs
Based on the above review, the following unit costs have been used to produce the cost estimates (Table A29.1).
13 RSPB (2004) A Practical Guide to the Management of Saline Lagoons. RSPB, Sandy
133
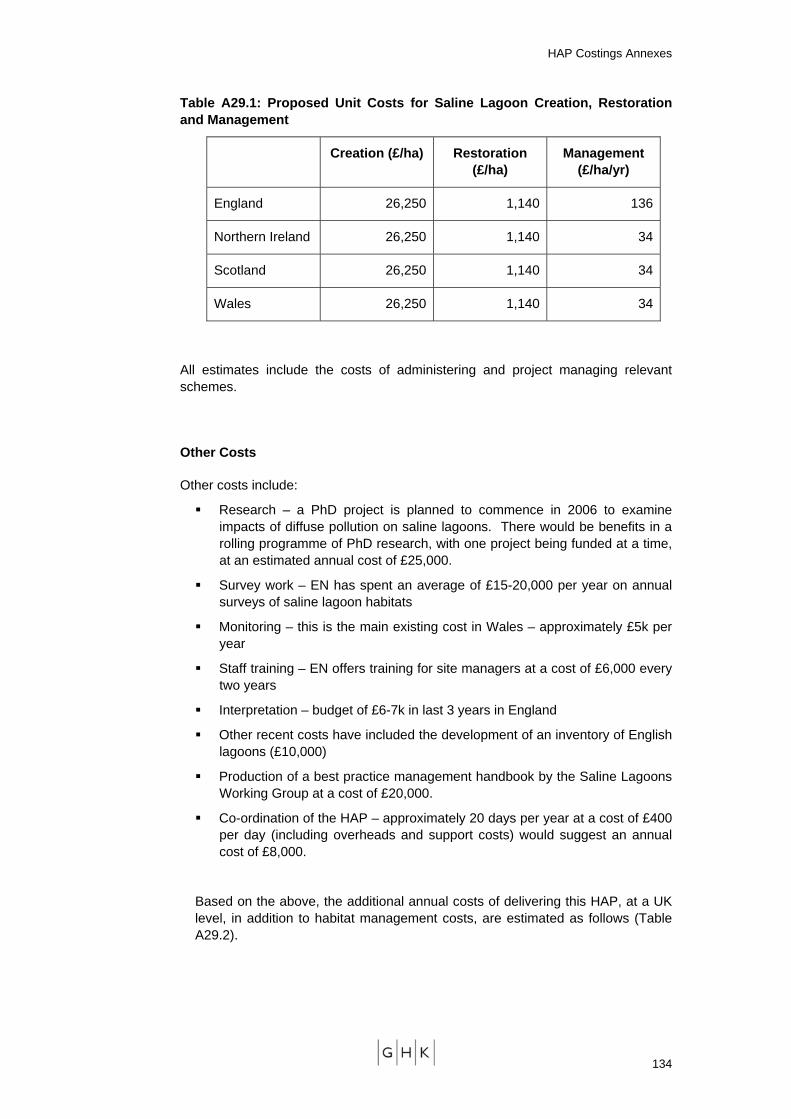
HAP Costings Annexes
Table A29.1: Proposed Unit Costs for Saline Lagoon Creation, Restoration and Management
Creation (£/ha) Restoration (£/ha)
Management (£/ha/yr)
England 26,250 1,140 136
Northern Ireland 26,250 1,140 34
Scotland 26,250 1,140 34
Wales 26,250 1,140 34
All estimates include the costs of administering and project managing relevant schemes.
Other Costs
Other costs include:
Research – a PhD project is planned to commence in 2006 to examine impacts of diffuse pollution on saline lagoons. There would be benefits in a rolling programme of PhD research, with one project being funded at a time, at an estimated annual cost of £25,000.
Survey work – EN has spent an average of £15-20,000 per year on annual surveys of saline lagoon habitats
Monitoring – this is the main existing cost in Wales – approximately £5k per year
Staff training – EN offers training for site managers at a cost of £6,000 every two years
Interpretation – budget of £6-7k in last 3 years in England
Other recent costs have included the development of an inventory of English lagoons (£10,000)
Production of a best practice management handbook by the Saline Lagoons Working Group at a cost of £20,000.
Co-ordination of the HAP – approximately 20 days per year at a cost of £400 per day (including overheads and support costs) would suggest an annual cost of £8,000.
Based on the above, the additional annual costs of delivering this HAP, at a UK level, in addition to habitat management costs, are estimated as follows (Table A29.2).
134
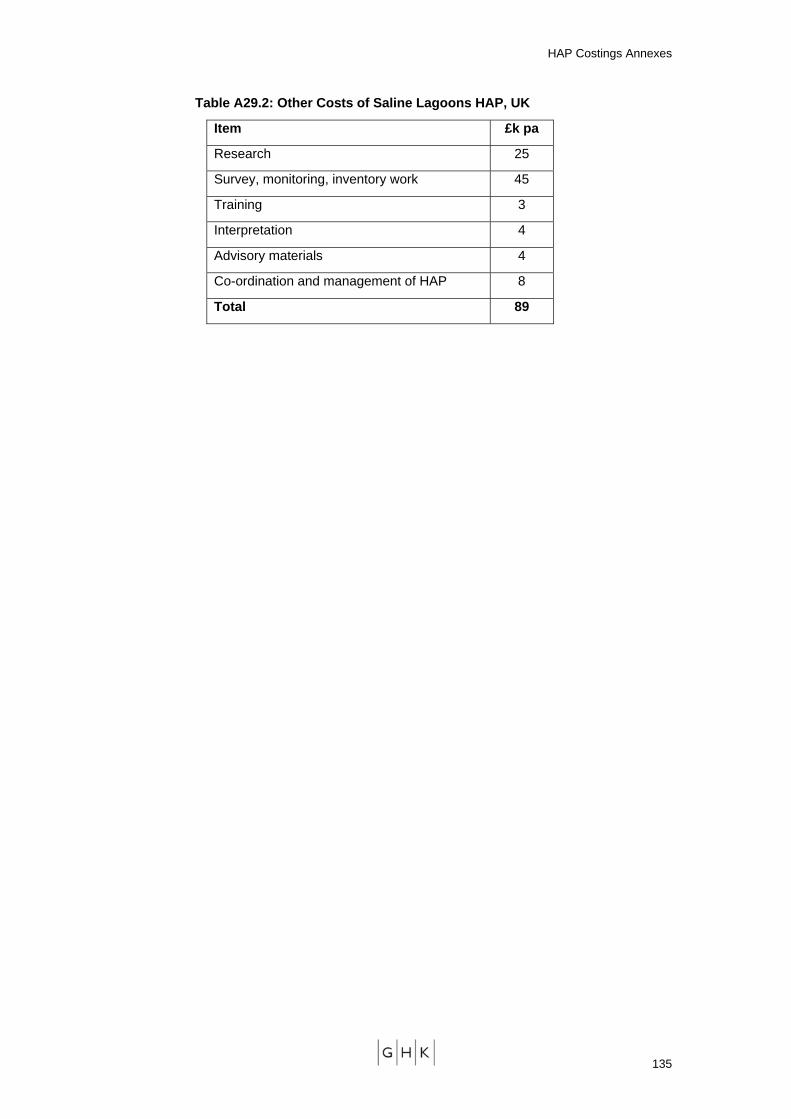
HAP Costings Annexes
Table A29.2: Other Costs of Saline Lagoons HAP, UK
Item £k pa
Research 25
Survey, monitoring, inventory work 45
Training 3
Interpretation 4
Advisory materials 4
Co-ordination and management of HAP 8
Total 89
135
HAP Costings Annexes
30 ANNEX 30: MARINE HAPS
Main Costs of HAP Delivery
Discussion with lead partners has identified the following issues concerning the costs of delivery of individual marine HAPs:
Lophelia pertusa reefs. The lead partner considers that the targets for this habitat should be met through the Habitats Directive and OSPAR. As this work is being carried out through, and funded by, these other mechanisms, it is estimated that there is no additional cost in meeting the BAP targets.
Maerl beds. Three main types of actions have cost implications. Firstly, there is an ongoing programme of research into factors affecting maerl beds, including particular pressures such as aquaculture. Four PhD studies have been completed in Scotland and Northern Ireland, and there is an ongoing need for research through PhDs and research contracts. Secondly, an inventory survey has been undertaken to establish the extent and distribution of the habitat, with some further work expected in future, on an opportunistic basis. Thirdly, there is a need for ongoing monitoring of the habitat but most of this is likely to be funded under the Habitats Directive, and it is considered unlikely that additional monitoring will take place under the BAP. There is also a need for additional small scale expenditures, for example on leaflets.
Modiolus modiolus beds. The full extent and distribution of the habitat is not known. The HAP would therefore benefit from a wider seabed survey. Furthermore, a more detailed survey of one of the two areas off the coast of Wales known to contain this habitat is required. Ongoing monitoring of the condition of individual Modiolus beds is also needed. A series of research requirements have been identified, in relation to natural dynamics, the effects of sediment loads, the potential for damage by eutrophication, the potential for recovery after cessation of damaging activities, and the feasibility of restoration. The lead partner considers that these research issues are best addressed by a PhD study into each of the areas concerned.
Mud habitats of deep water. The extent, distribution and condition of the habitat is not known. The HAP would therefore benefit from a wider seabed survey. Research is needed to establish the status and ecological requirements of S. gelatinosa and confirm Loch Goil as the only location for this species in the UK, and to investigate the biology and ecological requirements of the three seapen species. This is estimated to require 2-4 PhD studies.
Sheltered muddy gravels. Research is needed into the habitat and different pressures affecting it in different areas, including intensive bait digging, aquaculture and pollution. The lead partner estimates that 2-3 PhD studies would help to address this need.
Seagrass beds. A task plan for this habitat commissioned by the lead partner, DoE NI, has identified a wide variety of actions. Key areas of activity with significant resource implications include the development of an inventory of seagrass beds, targeted surveys of known sites, PhD research into factors affecting the habitat and potential restoration techniques, and a programme of advisory and communications activities. The HAP would also benefit from
136

HAP Costings Annexes
wider seabed survey work to improve information about the extent and distribution of the resource.
Serpulid reefs. The only known site is Loch Creran which is an SAC. A management plan has been developed for this site and needs to be updated over time. An officer is employed to oversee the management of the SAC. These costs are met from existing budgets and the BAP itself does not impose additional costs.
Sublittoral sands and gravels. The extent, distribution and condition of the habitat is not known. The HAP would therefore benefit from a wider seabed survey.
Tidal rapids. A task plan for this habitat commissioned by the lead partner, DoE NI, has identified a wide variety of actions. The main actions with resource implications include the development of an inventory, through a desk based research exercise, and a series of smaller scale policy, advisory and communications activities.
Cross-cutting activities that would help to deliver the marine HAPs collectively include:
Seabed Survey. Knowledge of the extent and distribution of marine habitats would be improved by a full seabed survey of UK waters. Setting and delivering targets for marine habitats is difficult without this knowledge.
Policy and Legislative activity. Each of the marine HAPs sets out a series of actions to influence key policies affecting the habitat, including fisheries, development, and site and species protection policies.
Communications and Advisory Work. The HAPs include actions to raise awareness of marine habitats among decision makers, marine interests and the general public, in order to facilitate habitat protection and mitigate potentially damaging activities.
HAP Co-ordination. Delivery of the HAPs also involves staff time in coordinating activity and reporting on progress.
Based on the above review, the following package of resources has been identified as being required for the delivery of the 12 UK marine HAPs:
A seabed survey
Staff resources, to cover
o Co-ordination of marine HAPs
o Policy and Legislative activities
o Advisory and Communications activity.
A research programme.
A monitoring budget, to cover the costs of monitoring particular marine habitats.
137
HAP Costings Annexes
A publications budget, to cover the costs of publishing leaflets and other advisory material.
Seabed Survey
The cost of a full seabed survey has been put at £50m in Scotland by SNH and £15m in Wales by CCW. CEFAS is currently (autumn 2005) putting together the business case for a UK wide seabed survey and estimates that a survey involving acoustic mapping and targeted follow-up ground proofing would cost around £100 million and take ten years to complete. Such a survey would allow mapping of marine habitats as well as marine archaeology, geology, hydrography etc. As well as meeting the needs of the BAP it would fit other purposes such as the requirements of the Habitats Directive and OSPAR, and would help to inform marine spatial planning and other policy developments.
Given the multiple benefits of such a survey, it would seem inappropriate to assign all of its costs to the BAP. However, the BAP could be regarded as a major driver for such an investment. If 50% of the costs of completing a survey were to be found from budgets for biodiversity conservation, this would involve expenditure of £50 million over 10 years, or £5 million per annum.
Staff Resources
Staff time is involved in co-ordinating the delivery of the HAPs, in undertaking or advising on policy and legislative actions, and in advisory and communications activities. It is estimated that most of these costs can be met through existing staff resources.
Co-ordination of HAPs
Staff resources are required to co-ordinate the delivery of the marine HAPs, monitor implementation and oversee reporting. It is estimated that this involves an average of 0.25 full time equivalent posts per HAP per year, or 3 FTE jobs across the 12 marine HAPs.
Policy and Legislative
Policy and legislative actions can be met by employing dedicated marine biodiversity policy officers at a country level, or by assigning a proportion of the time of policy staff to BAP related issues. It is estimated that policy and legislative actions require staff inputs averaging 0.25 FTE per HAP, and therefore amount to 3 FTE jobs across the 12 marine HAPs.
Advisory/Communications
Communications and advisory activities need to be delivered at the country or regional level, and are estimated to require staff time averaging 1 FTE job per country, or 4 FTE jobs across the UK.
Total
The above implies that core staff resources amounting to 10 FTE jobs are required to deliver the marine HAPs. At an average cost of £60,000 per FTE job, to include all office costs, support costs and expenses, this suggests annual expenditure of £600,000 across the marine HAPs.
138
HAP Costings Annexes
Research
Research into the needs of individual marine habitats is expected to be completed through a series of PhD studies and more targeted short term research contracts.
English Nature has committed £35k per year for three years to fund a PhD project on Sabellaria Spinulosa reefs, a total of £105k.
For Modiolus modiolus beds, the lead partner has indicated that progress in five research actions could be achieved through PhD studentships, with the following costs:
o Investigating natural dynamics - £192k
o Assess the potential effects of chronically high sediment loads - £72k
o Assess the potential for damage by eutrophication or organic enrichment in enclosed systems - £192k
o Assess the potential for recovery of beds after cessation of damaging activities - £192k
o Assess the feasibility of restoring beds by relaying M. modiolus - £192k.
For sheltered muddy gravels, research is needed into the habitat and different pressures affecting it in different areas, including intensive bait digging, aquaculture and pollution. 2-3 PhD studies would help to address this need.
For mud habitats in deep water, one PhD study is required to establish the status and ecological requirements of S. gelatinosa and confirm Loch Goil as the only location for this species in the UK, while 1-3 PhD studies are required to investigate the biology and ecological requirements of the three seapen species.
For maerl beds, four PhD studies have been completed to date, two each in Scotland and Northern Ireland, and an ongoing need for further research is envisaged.
Other HAPs, such as those for seagrass beds and Sabellaria alveolata reefs, also require research into a variety of different issues, which might be addressed through PhD studies.
The high average cost of supporting a PhD study, indicated by the figures above, can be explained by the high costs of undertaking fieldwork using boats and dive equipment.
Based on the above review, it is estimated that a total of at least 10 PhD studies will be required across the 12 marine HAPs during the period 2005 to 2010. This requirement is likely to decrease to perhaps 5 studies per 5 year period thereafter. The average cost per PhD study supported is expected to be at least £100,000.
In addition, there is a need for more targeted short term research contracts to address specific issues. An annual budget of £100,000 would help to meet this need.
Monitoring
There is a need for ongoing monitoring of the condition of particular habitats, such as Modiolus modiolus beds, seagrass beds and Sabellaria spinulosa reefs.
139
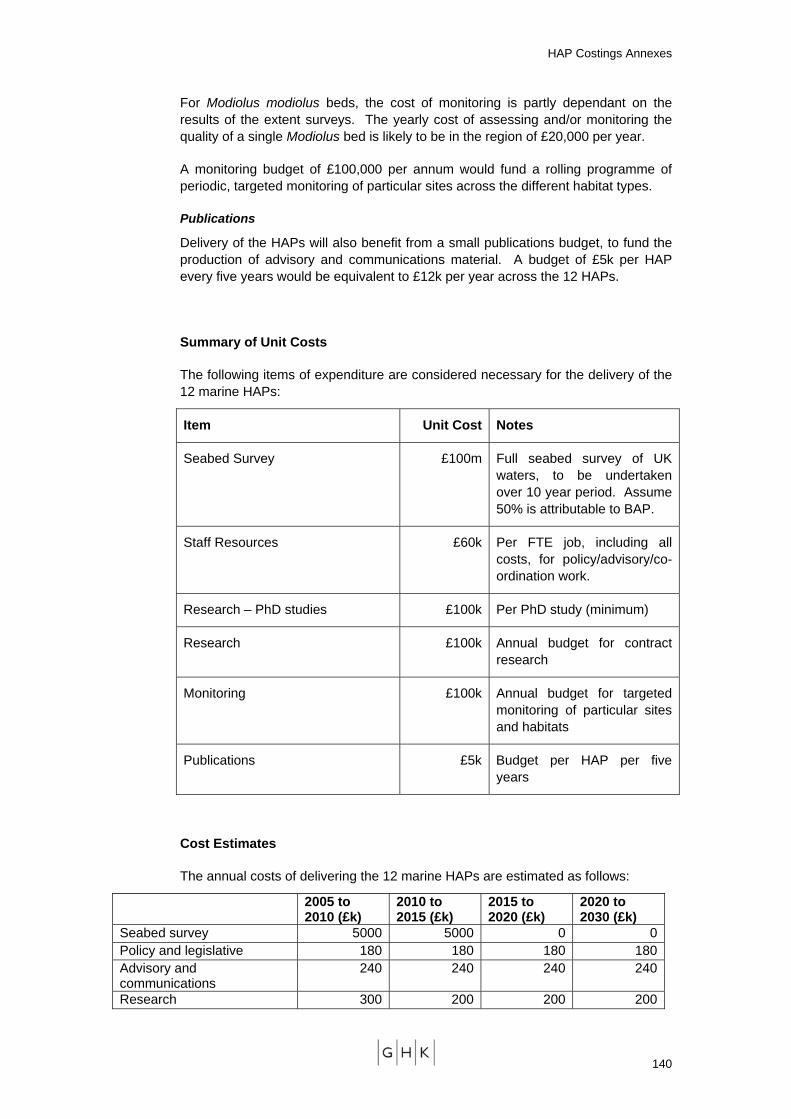
HAP Costings Annexes
For Modiolus modiolus beds, the cost of monitoring is partly dependant on the results of the extent surveys. The yearly cost of assessing and/or monitoring the quality of a single Modiolus bed is likely to be in the region of £20,000 per year.
A monitoring budget of £100,000 per annum would fund a rolling programme of periodic, targeted monitoring of particular sites across the different habitat types.
Publications
Delivery of the HAPs will also benefit from a small publications budget, to fund the production of advisory and communications material. A budget of £5k per HAP every five years would be equivalent to £12k per year across the 12 HAPs.
Summary of Unit Costs
The following items of expenditure are considered necessary for the delivery of the 12 marine HAPs:
Item Unit Cost Notes
Seabed Survey £100m Full seabed survey of UK waters, to be undertaken over 10 year period. Assume 50% is attributable to BAP.
Staff Resources £60k Per FTE job, including all costs, for policy/advisory/co-ordination work.
Research – PhD studies £100k Per PhD study (minimum)
Research £100k Annual budget for contract research
Monitoring £100k Annual budget for targeted monitoring of particular sites and habitats
Publications £5k Budget per HAP per five years
Cost Estimates
The annual costs of delivering the 12 marine HAPs are estimated as follows:
2005 to 2010 (£k)
2010 to 2015 (£k)
2015 to 2020 (£k)
2020 to 2030 (£k)
Seabed survey 5000 5000 0 0Policy and legislative 180 180 180 180Advisory and communications
240 240 240 240
Research 300 200 200 200
140
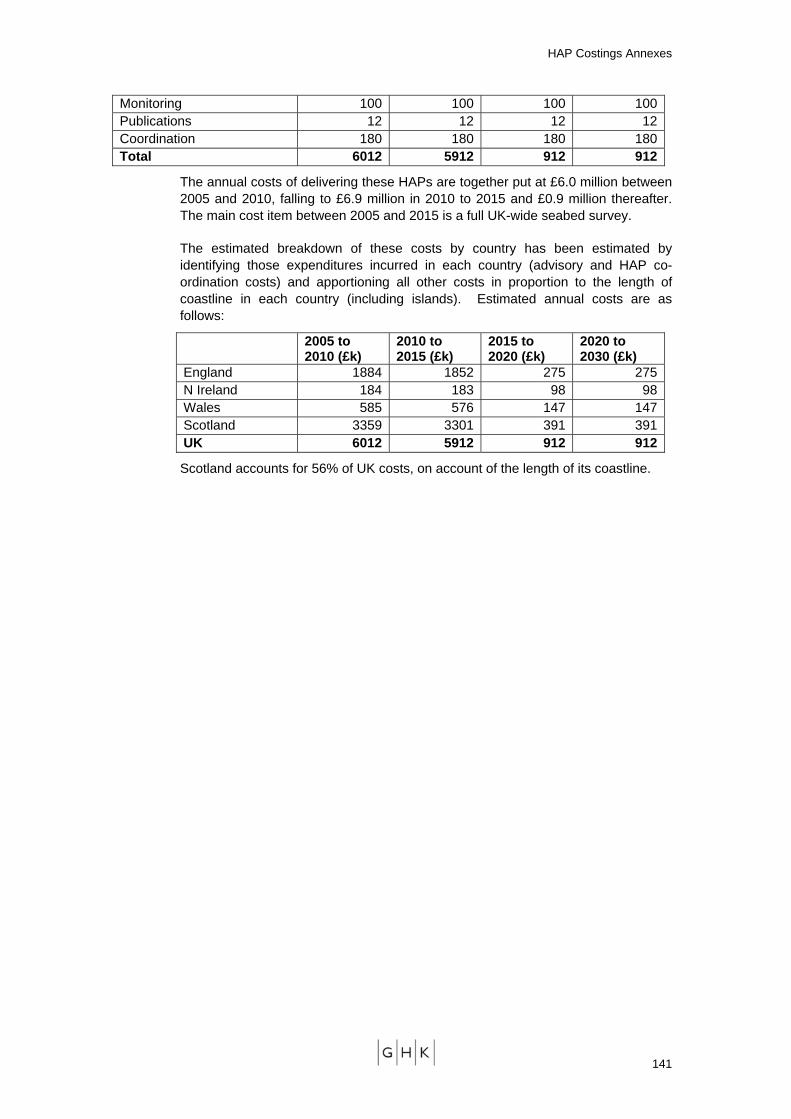
HAP Costings Annexes
Monitoring 100 100 100 100Publications 12 12 12 12Coordination 180 180 180 180Total 6012 5912 912 912
The annual costs of delivering these HAPs are together put at £6.0 million between 2005 and 2010, falling to £6.9 million in 2010 to 2015 and £0.9 million thereafter. The main cost item between 2005 and 2015 is a full UK-wide seabed survey.
The estimated breakdown of these costs by country has been estimated by identifying those expenditures incurred in each country (advisory and HAP co-ordination costs) and apportioning all other costs in proportion to the length of coastline in each country (including islands). Estimated annual costs are as follows:
2005 to 2010 (£k)
2010 to 2015 (£k)
2015 to 2020 (£k)
2020 to 2030 (£k)
England 1884 1852 275 275N Ireland 184 183 98 98Wales 585 576 147 147Scotland 3359 3301 391 391UK 6012 5912 912 912
Scotland accounts for 56% of UK costs, on account of the length of its coastline.
141