Embed Size (px)
Citation preview
1
Survey options and costings
1.1 Purpose of this document
The aim of this report is to provide ICCAN with a range of options for survey designs,
based on the different methods proposed as part of Work Package 2. At the request of
ICCAN, we have provided estimates of the rough market-price for the different options,
so that cost can be considered alongside the other trade-offs.
In this document, four different options for survey design are presented, together with a
summary of the pros and cons of each approach. The options being presented are:
1. A repeated cross-sectional survey using face-to-face methods (CAPI);
2. A repeated cross-sectional survey combining first web and then face-to-face
methods (web-CAPI);
3. A repeated cross-sectional web survey;
4. A longitudinal survey with a face-to-face first wave, and subsequent surveys
being conducted online.
For each of the four options we provide rough costs depending on how many people
take part. We present costs for ‘small’ ‘medium’ and ‘large’ achieved sample sizes. The
sample sizes are based on the following figures:
Table 1.1: Target achieved sample-sizes used in the costings
‘Small’ ‘Medium’ ‘Large’
Approx. 2,500 Approx. 4,000 Approx. 6,500
Section 1.6 provides information on why we have selected these three sizes and
includes power calculations for the different size options. Section 1.6 also includes
more information on the sampling strategy used to generate the costings, including
power calculations depending on the number of airports included in the survey.
The costs provided in this document are indicative and exclude VAT. The purpose of
showing cost estimates is so that ICCAN can see the general scale of costs for surveys
of different methods and sizes. The costs do not present a formal and binding quote
from NatCen. It should also be noted that survey costs are for fieldwork only and
2
dependent on a wide range of factors including: length of interview, the specific airports
selected and sampling strategy around each one, what pre-testing takes place, what
engagement strategies are used to encourage response (mailings, incentives), the
response rate assumptions used, what outputs are required, and so on. Costs may
need to be adjusted dependent on when the survey was done i.e. to take account of
inflation. There will be variation in price between different fieldwork agencies. They are
outlined in order to provide ICCAN with an overall indication of the broad scale of the
budget required for the various design options. Therefore, as with all surveys, we would
recommend that the new survey is commissioned via a competitive tendering process
rather than by approaching a single agency.
1.2 Option one: A repeated cross-sectional
survey using face-to-face methods
The first option presented for consideration is a face-to-face survey administered by
means of Computer Assisted Personal Interviews (CAPI).
A random sample of addresses would be approached to take part in the survey. The
Postcode Address File (PAF) database would be used as the sample frame. Selected
addresses would all be in the vicinity of a selected airport and would be stratified by
aviation noise exposure variables. This will help ensure households that experience a
range of different exposure levels are included in the survey. Further details on airport
selection and the stratifiers used for the costings are given in Section 1.6.
As suggested in the WP2a&b report, we advocate using multiple aviation noise
exposure variables as stratifiers (such as LAeq,16h, LAeq,8h, N65day, N60night,
measures of change in exposure, etc). The choice and order of stratification variables
will depend on the analytic priorities of the survey.
In order to collect information on changes in community attitudes over time, the same
survey would need to be repeated at regular intervals, with a random selection of the
sample being repeated at each wave (i.e. different people being interviewed at each
wave). This is what is known as a ‘repeated cross-sectional’ design. Based on input
from stakeholders, we recommend the period between waves should be three to five
years.
1.2.1 Pros and cons
Face-to-face methods are generally considered to be the ‘gold-standard’ when
conducting surveys that investigate prevalence.
The main advantage of using face-to-face interviewing methods are the consistently
higher response rates achieved. Higher response rates reduce the risk of non-
response biases occurring (i.e. where non-responders are substantially different from
responders across the key factors you wish to measure which would mean the survey
results are not representative of the actual population of interest). When measuring
attitudes towards aviation noise there is a concern that those who are most annoyed

3
are more likely to take part, thus skewing the data collected. The higher the non-
response the greater the potential for collecting biased data, especially if some groups
are more likely to take part than others and if there are differences between these
groups in terms of the measures of interest.
Non-response bias can partially be corrected for by survey weighting. Survey weights
use information on respondents and non-respondents to try to ensure that the
population of respondents represents the target population.
There are typically two types of non-mutually exclusive weighting approaches: non-
response modelling and calibration. Non-response modelling uses variables where
information is present on both respondents and non-respondents to predict response.
This approach is limited to using variables available on the sampling frame – in this
case the post-code address file – which include things like region, urban/rural status,
deprivation, etc. A modelling approach can help reduce non-response bias but does
not eliminate it.
Calibration is an approach that adjusts the survey respondents to known target
population totals by key demographic variables, often age, sex, region, etc. There is
potentially some difficulty in using a calibration approach in this study, where the target
population (i.e. residents currently exposed to aviation noise) does not fall neatly within
administrative boundaries normally used to calculate population totals. Population
totals can be estimated for the selected areas, but this could introduce some post hoc
correction bias, e.g. if any assumptions about the demographic profile of people living
in the sampled area prove incorrect. In summary, a weighting scheme can go some
way towards addressing non-response bias, but it is likely some bias will remain after
weighting.
There are some additional advantages to using face-to-face methods beyond the
higher response rates. Other advantages of using face-to-face interviews are that
interviews can be longer (often up to an hour in length) and more complex data can be
collected. This would mean that the survey could cover more secondary research
objectives as well as the primary objective. Having a face-to-face interaction is useful if
participants are to be encouraged to do more burdensome tasks (e.g. to wear
actigraphs or complete sleep diaries). These features are not essential for the new
survey, but the general point is that more options will be open to ICCAN if they opt for
face-to-face methods.
The main disadvantage of face-to-face interviewing is that the cost per interview is
higher in face-to-face modes compared to other modes of administration. Another
disadvantage is fieldwork length. It takes much longer to collect data using face-to-face
modes, and this is particularly true in the case of aviation noise surveys where data
collection is highly clustered around specific locations, i.e. the selected airports.
Longer fieldwork periods make summer-only data collection problematic. Summer-only
data collection would be advantageous in that it would allow us to measure ‘peak
annoyance’ without any recall bias. As part of the stakeholder engagement process
there was a relatively high degree of consensus that quantifying levels of average
summer-time community annoyance should be the priority for the new survey (and that
it is less of a priority to see how annoyance varies over the year). This suggests that
fieldwork for the new survey should also be seasonal, with fieldwork being
concentrated in the summer period, e.g. from mid-June through to mid-September.
4
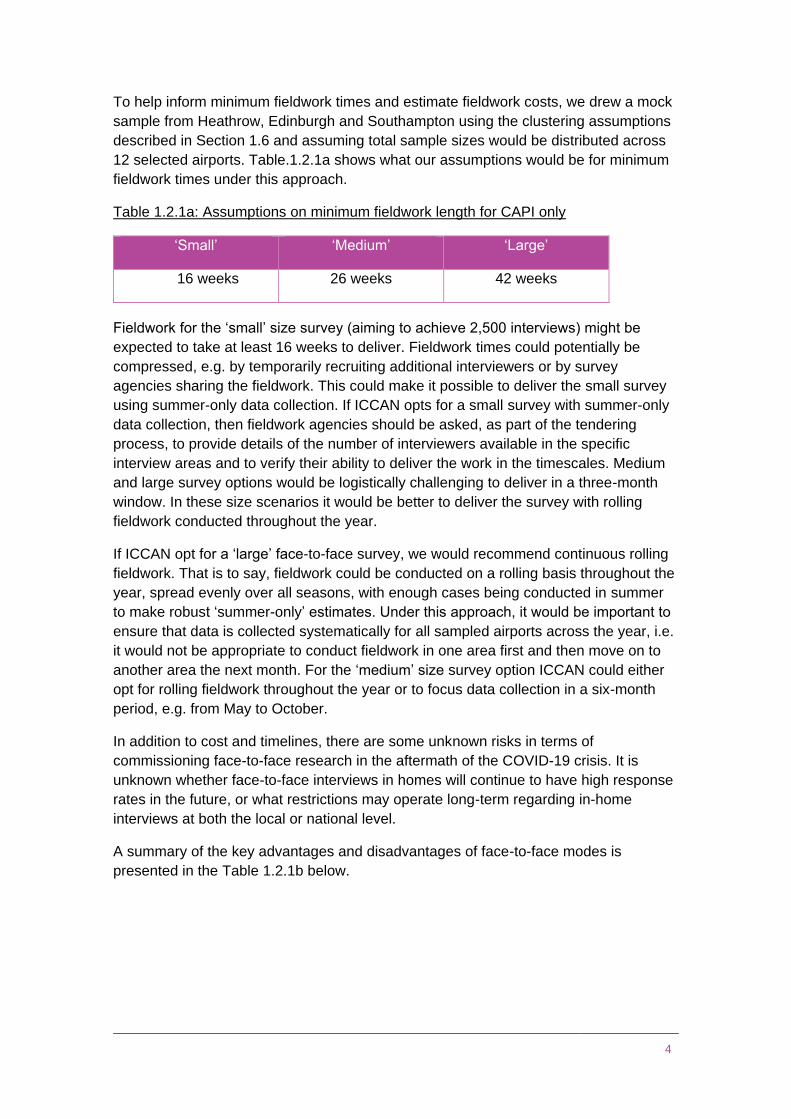
To help inform minimum fieldwork times and estimate fieldwork costs, we drew a mock
sample from Heathrow, Edinburgh and Southampton using the clustering assumptions
described in Section 1.6 and assuming total sample sizes would be distributed across
12 selected airports. Table.1.2.1a shows what our assumptions would be for minimum
fieldwork times under this approach.
Table 1.2.1a: Assumptions on minimum fieldwork length for CAPI only
‘Small’ ‘Medium’ ‘Large’
16 weeks 26 weeks 42 weeks
Fieldwork for the ‘small’ size survey (aiming to achieve 2,500 interviews) might be
expected to take at least 16 weeks to deliver. Fieldwork times could potentially be
compressed, e.g. by temporarily recruiting additional interviewers or by survey
agencies sharing the fieldwork. This could make it possible to deliver the small survey
using summer-only data collection. If ICCAN opts for a small survey with summer-only
data collection, then fieldwork agencies should be asked, as part of the tendering
process, to provide details of the number of interviewers available in the specific
interview areas and to verify their ability to deliver the work in the timescales. Medium
and large survey options would be logistically challenging to deliver in a three-month
window. In these size scenarios it would be better to deliver the survey with rolling
fieldwork conducted throughout the year.
If ICCAN opt for a ‘large’ face-to-face survey, we would recommend continuous rolling
fieldwork. That is to say, fieldwork could be conducted on a rolling basis throughout the
year, spread evenly over all seasons, with enough cases being conducted in summer
to make robust ‘summer-only’ estimates. Under this approach, it would be important to
ensure that data is collected systematically for all sampled airports across the year, i.e.
it would not be appropriate to conduct fieldwork in one area first and then move on to
another area the next month. For the ‘medium’ size survey option ICCAN could either
opt for rolling fieldwork throughout the year or to focus data collection in a six-month
period, e.g. from May to October.
In addition to cost and timelines, there are some unknown risks in terms of
commissioning face-to-face research in the aftermath of the COVID-19 crisis. It is
unknown whether face-to-face interviews in homes will continue to have high response
rates in the future, or what restrictions may operate long-term regarding in-home
interviews at both the local or national level.
A summary of the key advantages and disadvantages of face-to-face modes is
presented in the Table 1.2.1b below.

5
Table 1.2.1b: Advantages and disadvantages of option one
Advantages Disadvantages
● Highest response rates.
● Less response bias (e.g. interviewers
can persuade less interested groups
to take part).
● Does not rely on reading ability or
internet access.
● Allows a longer interview length,
meaning that the survey could cover
more of the secondary research
objectives as well as the primary
objective.
● Existing SoNA questions could be
administered with minimal
adaptation.
● Improved data quality. Interviewer is
aware of participant engagement
levels and participants are less likely
to ‘straight-line’ as on web surveys.
This is where a participant repeatedly
selects the same answer in a battery.
of questions arranged in a grid
format.
● Participants can seek clarification if
needs be.
● Flexibility to add on additional
elements of data collection e.g.
administering noise detection
equipment, sleep measurement
devices, diaries, etc. Please note
these elements are not included in
the costs provided. Equipment costs
(and extra interviewer trips to retrieve
equipment) would add significantly to
costs depending on what is used.
● The most expensive mode of data
collection.
● This is a slower method of data
collection. If a high volume of
interviews is required in specific
locations in a short time period there
may be logistical issues for fieldwork
agencies.
● Potential for interviewer effects
(although most sensitive questions
could be asked as self-completion
within a CAPI interview).
● Clustering is often applied in face-to-
face surveys to make interviewing
more cost efficient. The clustering
strategy used in SoNA was criticised
as some stakeholders felt highly
impacted areas were excluded from
interview area clusters. We have tried
to address these concerns with new
clustering strategies, as described in
the WP2a&b report.
● COVID-19 related concerns: no face-
to-face interviewing in homes at the
time of writing (September 2020). It is
unknown how response to face-to-
face interviews may be affected
going forward.
1.2.2 Costs for option one
The costs for option one are presented in Table 1.2.2. There are different cost options
for small, medium and large sample sizes. All costs are based on the 12 airport
sampling model given in Section 1.6.2. They break down as follows:
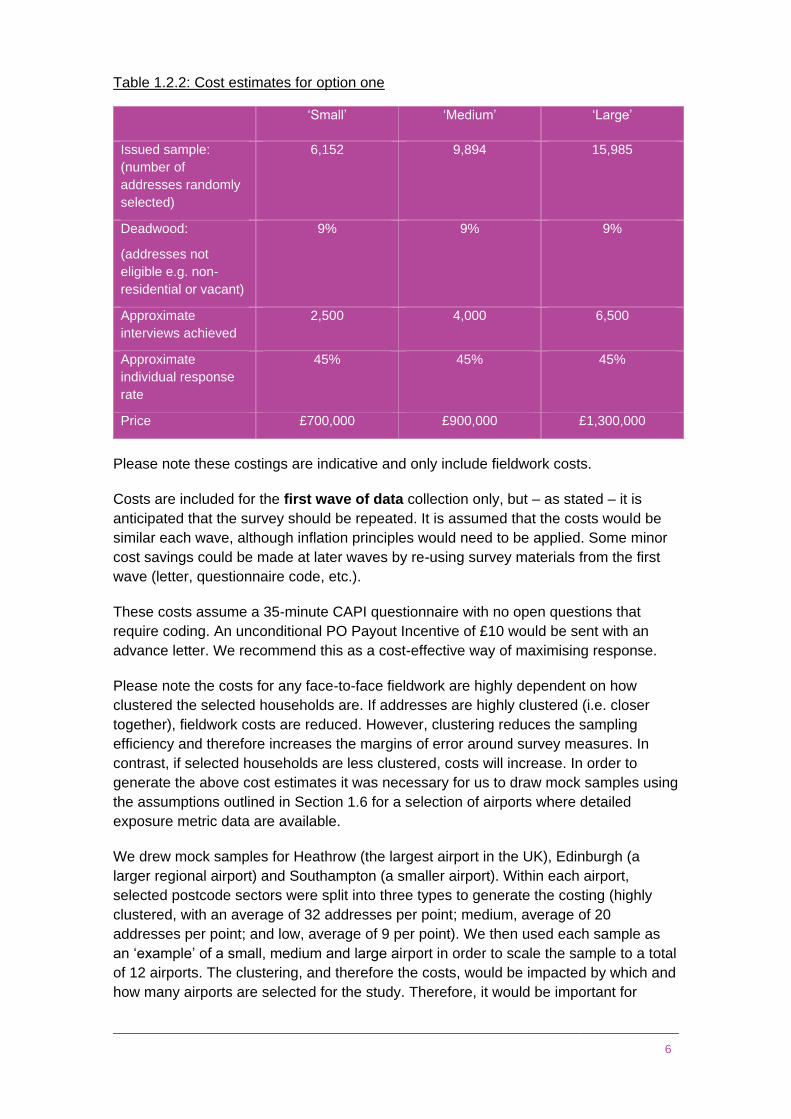
6
Table 1.2.2: Cost estimates for option one
‘Small’ ‘Medium’ ‘Large’
Issued sample:
(number of
addresses randomly
selected)
6,152 9,894 15,985
Deadwood:
(addresses not
eligible e.g. non-
residential or vacant)
9% 9% 9%
Approximate
interviews achieved
2,500 4,000 6,500
Approximate
individual response
rate
45% 45% 45%
Price £700,000 £900,000 £1,300,000
Please note these costings are indicative and only include fieldwork costs.
Costs are included for the first wave of data collection only, but – as stated – it is
anticipated that the survey should be repeated. It is assumed that the costs would be
similar each wave, although inflation principles would need to be applied. Some minor
cost savings could be made at later waves by re-using survey materials from the first
wave (letter, questionnaire code, etc.).
These costs assume a 35-minute CAPI questionnaire with no open questions that
require coding. An unconditional PO Payout Incentive of £10 would be sent with an
advance letter. We recommend this as a cost-effective way of maximising response.
Please note the costs for any face-to-face fieldwork are highly dependent on how
clustered the selected households are. If addresses are highly clustered (i.e. closer
together), fieldwork costs are reduced. However, clustering reduces the sampling
efficiency and therefore increases the margins of error around survey measures. In
contrast, if selected households are less clustered, costs will increase. In order to
generate the above cost estimates it was necessary for us to draw mock samples using
the assumptions outlined in Section 1.6 for a selection of airports where detailed
exposure metric data are available.
We drew mock samples for Heathrow (the largest airport in the UK), Edinburgh (a
larger regional airport) and Southampton (a smaller airport). Within each airport,
selected postcode sectors were split into three types to generate the costing (highly
clustered, with an average of 32 addresses per point; medium, average of 20
addresses per point; and low, average of 9 per point). We then used each sample as
an ‘example’ of a small, medium and large airport in order to scale the sample to a total
of 12 airports. The clustering, and therefore the costs, would be impacted by which and
how many airports are selected for the study. Therefore, it would be important for

7
ICCAN to make decisions on airport selection prior to the survey being commercially
tendered in order to receive accurate quotes. Decisions made on airport selection will
also have an impact on agencies’ ability to deliver fieldwork in a summer-only period,
as high levels of clustering will reduce fieldwork costs but increase delivery times.
1.2.3 Discussion of option one at the options workshop with
ICCAN
At the options workshop with representatives from ICCAN, it was stated that ICCAN’s
main priority is to design a survey that will produce robust data. It was stated that cost
would be a secondary concern to a robust survey design. Therefore, despite cost being
the main disadvantage of option one, it was asserted that option one is not to be ruled
out on this basis. Indeed, option one was held in high regard due to being a robust
approach offering high data quality.
During the workshop, a concern was raised about whether purely face-to-face surveys
could be considered somewhat old-fashioned and not sustainable in the long term.
However, it was highlighted that face-to-face surveys are still very much the ‘gold
standard’ approach in survey design, chiefly due to the high response rates they
achieve. It was noted that the concern that face-to-face surveys will soon be perceived
as old-fashioned has been around for over five to ten years already. If this change is
happening, then it is happening a lot more slowly than predicted. It was emphasized
that nearly all major national studies still use a face-to-face approach.
A further concern with a purely face-to-face approach was raised in light of the COVID-
19 pandemic. It was stated that this is the biggest unknown in terms of the future of
survey design. It is not yet known whether or not face-to-face surveys will continue to
be affected at the time the new survey will be run. With that in mind, it was discussed
whether a mixed approach in the form of option two (a web CAPI) would provide some
contingency, in the event that face-to-face response rates are affected in the wake of
the pandemic. However, during the workshop it was stated that a mixed-mode design
would potentially offer a less robust approach than a purely face-to-face survey. It was
stated that there are more unknowns with a sequential mixed-mode design as they are
not used across the board. Face-to-face surveys still remain the most widely used for
large national studies.
During the workshop it was also stated that a purely face-to-face design would avoid
the potential selection effects and measurement effects that may arise in a sequential
mixed-mode approach. It was discussed how, in mixed-mode designs, it is difficult to
determine whether any changes observed in the data are authentic or whether they are
a result of selection or measurement effects. Nevertheless, it was stated that steps can
be taken in order to minimise the likelihood of measurement effects through considered
questionnaire design. For instance, interviewer effects can be mitigated against by
using self-completion elements.
1.3 Option two: A repeated cross-sectional
web-CAPI survey

8
The second design presented is a web-CAPI survey. In this scenario, participants
would be invited (via a letter) to complete an online survey, with non-responders being
followed up by interviewers to boost response rates to a higher level. The sampling
strategy would be the same as described for option one (a random selection of
addresses around selected airports, with addresses stratified by noise exposure
variables). The same survey process would be repeated every two to three years to
look at changes in annoyance over time.
1.3.1 Pros and cons of option two
The main advantage of the web-CAPI approach is that some cost saving can be made
compared to the CAPI approach, assuming uptake to the web component is
reasonable. The CAPI component is used to boost overall response rates and to
reduce the risk of non-response bias. Web and CAPI combinations are relatively
straightforward to implement in terms of questionnaire design. If a web-CAPI approach
is adopted, we recommend that key metrics (for example annoyance items and
wellbeing items) are always asked as a self-completion regardless of mode. This will
reduce the risk of mode effects occurring. We would also recommend that the overall
questionnaire length is kept to around 20-25 minutes to minimize the risk of break-off
online.
Another advantage of a web-CAPI approach is that it would allow ICCAN to gain an
understanding of how well a web-only approach would work in future waves of the
survey, as it would be possible to compare data collected from the web component with
data collected overall from the web-CAPI. Response rates between the web element
and the web-CAPI could be compared to see how they vary across different
demographic groups of interest. Data could be examined to see if key statistics vary
between the web data and the combined web-CAPI data. If there are only limited
differences across the key metrics (e.g. annoyance) after survey weights have been
applied, this would be evidence that a web-only approach would be suitable for future
waves of data collection. However, if there are significant differences in key metrics
once face-to-face data are added this would be evidence to suggest that the
investment in a CAPI component remains important for data quality reasons.
The disadvantage of a web-CAPI mode is cost; this approach is still more expensive
than a web-only method. Cost savings compared to CAPI only are minimal and are
dependent on the uptake to the web completion option, which is difficult to predict.
Another disadvantage relates to the timescale. Web-CAPI modes may be quicker to
implement than CAPI-only methods (as each interviewer has a smaller number of
respondents to interview as some will take part online). However, it would still be
logistically challenging to deliver summer-only fieldwork. Table 1.3.1a shows our
assumptions regarding minimum fieldwork times.
Table 1.3.1a: Assumptions on minimum fieldwork length for web-CAPI

9
‘Small’ ‘Medium’ ‘Large’
15 weeks 20 weeks 30 weeks
As with option one, if ICCAN commission a smaller survey we would recommend that
fieldwork is conducted with a ‘summer-only’ fieldwork window. If ICCAN opt for a ‘large’
face-to-face survey, we would recommend continuous rolling fieldwork. For the middle-
size survey option ICCAN could either opt for rolling fieldwork throughout the year or to
focus data collection in a six-month period, e.g. from May to October.
The advantages and disadvantages of a web-CAPI approach are summarised in Table
1.3.1b below.
10
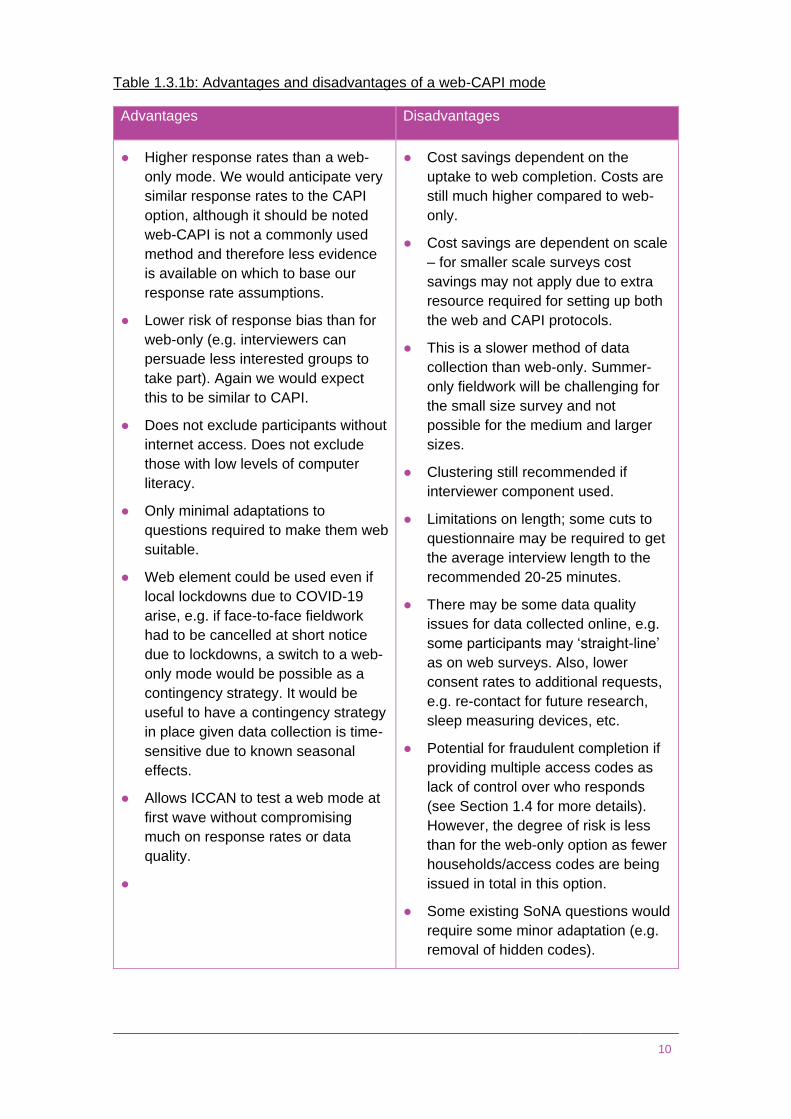
Table 1.3.1b: Advantages and disadvantages of a web-CAPI mode
Advantages Disadvantages
● Higher response rates than a web-
only mode. We would anticipate very
similar response rates to the CAPI
option, although it should be noted
web-CAPI is not a commonly used
method and therefore less evidence
is available on which to base our
response rate assumptions.
● Lower risk of response bias than for
web-only (e.g. interviewers can
persuade less interested groups to
take part). Again we would expect
this to be similar to CAPI.
● Does not exclude participants without
internet access. Does not exclude
those with low levels of computer
literacy.
● Only minimal adaptations to
questions required to make them web
suitable.
● Web element could be used even if
local lockdowns due to COVID-19
arise, e.g. if face-to-face fieldwork
had to be cancelled at short notice
due to lockdowns, a switch to a web-
only mode would be possible as a
contingency strategy. It would be
useful to have a contingency strategy
in place given data collection is time-
sensitive due to known seasonal
effects.
● Allows ICCAN to test a web mode at
first wave without compromising
much on response rates or data
quality.
●
● Cost savings dependent on the
uptake to web completion. Costs are
still much higher compared to web-
only.
● Cost savings are dependent on scale
– for smaller scale surveys cost
savings may not apply due to extra
resource required for setting up both
the web and CAPI protocols.
● This is a slower method of data
collection than web-only. Summer-
only fieldwork will be challenging for
the small size survey and not
possible for the medium and larger
sizes.
● Clustering still recommended if
interviewer component used.
● Limitations on length; some cuts to
questionnaire may be required to get
the average interview length to the
recommended 20-25 minutes.
● There may be some data quality
issues for data collected online, e.g.
some participants may ‘straight-line’
as on web surveys. Also, lower
consent rates to additional requests,
e.g. re-contact for future research,
sleep measuring devices, etc.
● Potential for fraudulent completion if
providing multiple access codes as
lack of control over who responds
(see Section 1.4 for more details).
However, the degree of risk is less
than for the web-only option as fewer
households/access codes are being
issued in total in this option.
● Some existing SoNA questions would
require some minor adaptation (e.g.
removal of hidden codes).

11
1.3.2 Costs for option two
The costs for option two are presented in Table 1.3.2. Again, there are three different
cost options, for small, medium and large sample sizes.
The cost estimates presented use similar assumptions to those made at option one.
These costs assume a slightly shorter (e.g. 25-minute) questionnaire with no coding of
open-ended questions. The sampling assumptions for the costing of option two are the
same as the sampling assumptions made for the costing of option one.
Costs are included for the first wave of data collection only. In practice, if the first wave
shows little difference between web and web-CAPI responses, later waves of fieldwork
could use web-only modes (costs for these are shown in Section 1.4.2)
Table 1.3.2: Cost estimates for option two
Small Medium Large
Issued sample:
(number of
addresses randomly
selected)
6,152 9,894 15,985
Approximate
household response
rate for push-to-web
10% 10% 10%
Deadwood:
(addresses not
eligible e.g. non-
residential or
vacant)
9% 9% 9%
Approximate
interviews achieved
2,500 4,000 6,500
Approximate
individual response
rate for CAPI
34% 34% 34%
Price £675,000 £800,000 £1,100,000
Please note these costings are indicative and only include fieldwork costs.
For the web CAPI option we have assumed we would first send out an invitation letter
to all selected addresses, and one further reminder letter to selected addresses to try
and maximise responses to the web element. Here we would recommend the use of a
£10 conditional incentive at both stages.
We would assume that approximately 10% of selected households would respond to
the web element with an average of 1.3 adults responding per household, if we issued
multiple access codes per household. The remaining 90% of addresses would be
issued to an interviewer with the same breakdown of points/levels of clustering as
discussed in option one. If we assume 9% of deadwood and 34% response to the
12
CAPI, this gets you to the same achieved sample size as for option one (note we would
expect response rates to the CAPI element to be lower than in the CAPI-only mode, as
the most willing respondents will have already taken part in the initial web call-out). It
should also be noted that response rates for web-CAPI designs are difficult to predict
since they remain currently a relatively unusual design. There is evidence to suggest
that mixed mode designs incorporating face-to-face can deliver lower response than
face-to-face only modes, although the current trial of the new Labour Market Survey
has achieved high response using a web-CAPI approach. For the purposes of
estimating costs, we have assumed the mixed mode approach would deliver
comparable response to the CAPI-only design. For this reason, there is greater
uncertainty around the web-CAPI costs than for the CAPI-only ones.
1.3.3 Discussion of option two at the options workshop with
ICCAN
The first aspect of option two discussed at the workshop was cost. It was asserted that,
overall, the predicted difference in cost between options one and two is minimal.
Therefore, in terms of cost alone, there is no significant advantage to one option over
the other. However, it was highlighted that there is more potential for cost savings with
option two if in subsequent waves of the survey there is a greater uptake to the online
mode. There would be no real cost savings predicted in the first wave, although it was
stated that there are generally more unknowns in the costing of option two. This is
because it is a less commonly used approach and that the costs are heavily dependent
on the uptake to the web component.
Concerns around overall lower response rates in option two were also raised, as well
as the fact that there are more uncertainties with option two in general. This is because
it is a less common approach and consists of more than one element. There was a
concern that this could lead to a greater potential for loss in robustness.
Among the main advantages of option two discussed in the workshop, the flexibility of
option two was viewed very favourably, alongside the fact that it could help to future-
proof the survey in the wake of the COVID-19 pandemic. It was stated that option two
seemed like a good opportunity to test out a web approach for the survey. However, it
was also highlighted that this could also be explored via a separate web pilot or a web
experiment. ICCAN would not necessarily need to commit to option two to explore this.
It was noted in the workshop that option two might be advantageous if the effects on
face-to-face interviewing due to the pandemic are still being felt at the time this new
survey is due to be run. It is potentially a ‘safer’ option in this regard.
A query was raised during the workshop as to whether it would be feasible to adopt
option one at wave one of the survey, and then transition to option two for future
waves. It was stated that in terms of sampling and questionnaire design, this would be
relatively unproblematic. The sampling approach would be largely the same, and the
questions could be designed with this approach in mind so that the risk of mode effects
is minimal. However, there were some concerns raised about the comparability of the
data collected, in that it would be difficult to determine whether any change in attitudes
13
observed were genuine or due to the switch in method. It was suggested that a parallel
run could be conducted to understand the impact of the method switch.
Also discussed during the workshop was the potential issue of fraudulent completion of
the web questionnaire due to the possibility of access codes being shared. However, it
was stated that this was only a minor concern, and that checks could be built into the
survey to mitigate against this. It was highlighted that the same criticism could well
apply to a face-to-face approach if participation from certain groups is encouraged by a
small set of participants.
A further item for discussion during the workshop was the fact that additional elements
that may want to be added on to the survey, such as the administration of sleep diaries
or monitoring equipment, would be best placed in option one rather than in option two.
This is because the likelihood of uptake of these additional elements by participants is
far lower if the questionnaire is completed via web.
Additionally, it was discussed that option two would require a slightly shorter
questionnaire length than option one, which means there is less scope for more
granular questions to be included. A query was raised about whether a shorter
questionnaire length could be advantageous in terms of response rates, but it was
stated that response rates are unlikely to be impacted if the two lengths in question are,
for example, 35 minutes and 25 minutes, as the difference between them is too small.
Response rates would only be expected to be impacted if the questionnaire length
were considerably shorter, e.g. a 10-minute questionnaire.
In sum, it was stated that – if cost is not the main factor – option one is potentially a
cleaner and less complicated approach. The main advantage of option two would be
seen if face-to-face interviewing continues to be affected in years to come in the wake
of the COVID-19 pandemic. The likelihood of this is currently completely unknown.
1.4 Option three: A repeated cross-sectional
web survey The third option for ICCAN to consider is an online self-completion questionnaire, with
people recruited using a ‘push-to-web’ approach. In this scenario, selected addresses
would be invited to take part in the survey via a letter. The same basic approach for
random sampling would be used as discussed in the other options (i.e. using the
postcode address file as a sampling frame and stratifying a selection of addresses by
aviation noise exposure variables), however a greater number of households would
need to be approached to allow us to achieve the same overall number of responses
as the face-to-face option because there would be a decreased response rate by
household.
Recipients of the letter would be assigned an access code for a web questionnaire.
The web questionnaire would be access restricted (i.e. only people who are using an
access code given in the letter will be able to complete the questions, and each access
code can be used only once). We do not recommend issuing a single code per
household because this creates a risk of differential non-response, as some groups are
more likely to open the mailing and respond first. With face-to-face methods,
interviewers can establish who lives in the household before selecting a person at

14
random to take part in the survey. Random selection within household is not
recommended for push-to-web surveys as instructions on randomisation are not
always understood or adhered to. We would normally issue two codes as this is the
most common number of adults per household. It is common practice to issue two or
three access codes per household, but the exact number of codes to use would be
agreed with ICCAN given the risks discussed below.
The web survey would be repeated cross-sectionally every two to three years.
1.4.1 Pros and cons of option three
The main advantage of using an online mode is price. It is significantly cheaper to run a
survey online than in an interviewer-administered mode. Therefore, more web
interviews can be conducted for the same amount of capital invested. Assuming that
only a fixed amount of funding will be available (regardless of what the size of that
investment is) there are trade-offs to be made in terms of whether funding is best
invested in obtaining higher response rates (with less associated bias but less granular
detail) or a higher numbers of interviews achieved (which would allow for more granular
analyses but with the risk data are biased). Higher numbers of interviews achieved
means that data could be collected from more airports, there can be more people
interviewed per airport and/or there is more sample size to power comparisons of more
narrow acoustic bands.
Online modes also allow for relatively fast data collection. Regardless of the size of the
survey, it would be possible for all data to be collected in the summer period.
The main disadvantage of using an online mode is that response rates would be
expected to be much lower than in an interviewer-administered mode. This comes with
the risk of non-response bias as discussed in Section 1.2. Lower response rates
increase the risk of non-response biases occurring (i.e. where non-responders are
substantially different from responders across the key factors you wish to measure
which would mean the survey results are not representative of the actual population of
interest). People without internet access, or people with lower levels of digital literacy,
are also excluded from such surveys which results in a further type of bias. In 2018
approximately 10% of the UK population were classified as non-internet users,
meaning they had not used the internet in the past three months [Ref 1]. This could
potentially lead to some under-representation of the following groups in the survey:
● The elderly (e.g. 55% of non-internet users in the UK are aged 75 or older)
● People with a disability (56% of non-internet users in the UK have a disability)
● Lower income groups and the economically inactive
● People with lower levels of qualifications, particularly people with lower levels of
literacy
One expert panel attendee during Work Package 2C raised the possible issue of
fraudulent completion of online surveys. If more than one access code is issued per
household (as is often the case and is assumed here), it is possible that one person
could respond to the survey multiple times, usually to gain additional completion
15
incentives. The panel attendee gave anecdotal evidence of respondents from affected
community groups asking for and sharing access codes on online forums and on social
media. This has the potential to skew the results if non-sampled interested parties find
ways of taking part. However, the extent to which this type of behaviour occurs in
practice is unknown and relatively large number of fraudulent responses would be
required to meaningfully influence statistics. Furthermore, the practice of a survey
being ‘hijacked’ by special interest groups in this way is of greater concern in
completely open surveys where there are no access codes used. The design
discussed here, as noted above, would provide access codes only to randomly-
selected households so such partisan interference would be very limited in scope (they
could only share codes if they themselves had been sampled and would only be able to
share one or two codes). Nonetheless, if web approaches are adopted, survey
suppliers should be asked to provide details of what steps they would take to minimise
the risk or check for fraudulent responses.
As with the web-CAPI option we would recommend that the overall questionnaire
length is kept to around 20-25 minutes to minimize the risk of break-off (i.e. partial
completion) online. We would recommend key questions, e.g. on annoyance and
wellbeing, are asked early in the questionnaire so data on this is always collected even
if break-off occurs later in the questionnaire.
Some existing SoNA questions would require minor adaptation in order to make them
suitable for a self-completion mode. For instance, any substantive interviewer-coded
items would need to cut or converted, as would any interviewer help screens,
definitions and probes which are intended to assist the participant as necessary.
However, the changes made on this basis would be relatively minor.
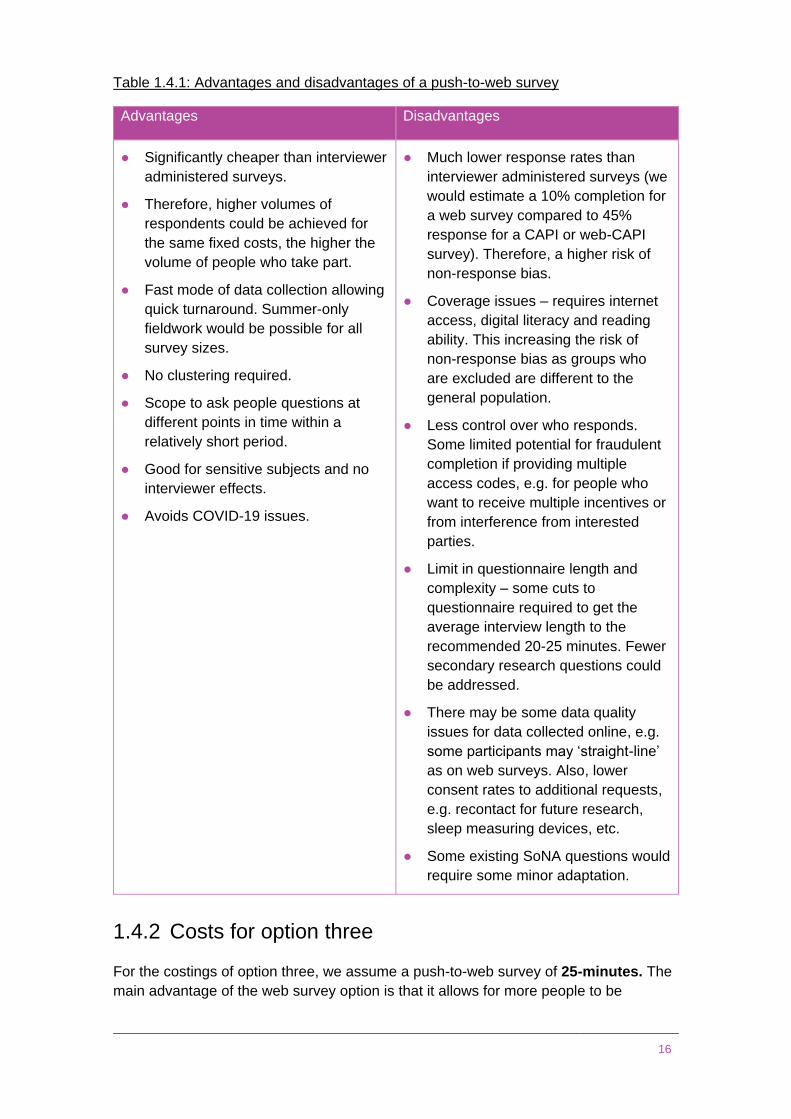
The main advantages and disadvantages of a push-to-web option are summarised in
Table 1.4.1.
16
Table 1.4.1: Advantages and disadvantages of a push-to-web survey
Advantages Disadvantages
● Significantly cheaper than interviewer
administered surveys.
● Therefore, higher volumes of
respondents could be achieved for
the same fixed costs, the higher the
volume of people who take part.
● Fast mode of data collection allowing
quick turnaround. Summer-only
fieldwork would be possible for all
survey sizes.
● No clustering required.
● Scope to ask people questions at
different points in time within a
relatively short period.
● Good for sensitive subjects and no
interviewer effects.
● Avoids COVID-19 issues.
● Much lower response rates than
interviewer administered surveys (we
would estimate a 10% completion for
a web survey compared to 45%
response for a CAPI or web-CAPI
survey). Therefore, a higher risk of
non-response bias.
● Coverage issues – requires internet
access, digital literacy and reading
ability. This increasing the risk of
non-response bias as groups who
are excluded are different to the
general population.
● Less control over who responds.
Some limited potential for fraudulent
completion if providing multiple
access codes, e.g. for people who
want to receive multiple incentives or
from interference from interested
parties.
● Limit in questionnaire length and
complexity – some cuts to
questionnaire required to get the
average interview length to the
recommended 20-25 minutes. Fewer
secondary research questions could
be addressed.
● There may be some data quality
issues for data collected online, e.g.
some participants may ‘straight-line’
as on web surveys. Also, lower
consent rates to additional requests,
e.g. recontact for future research,
sleep measuring devices, etc.
● Some existing SoNA questions would
require some minor adaptation.
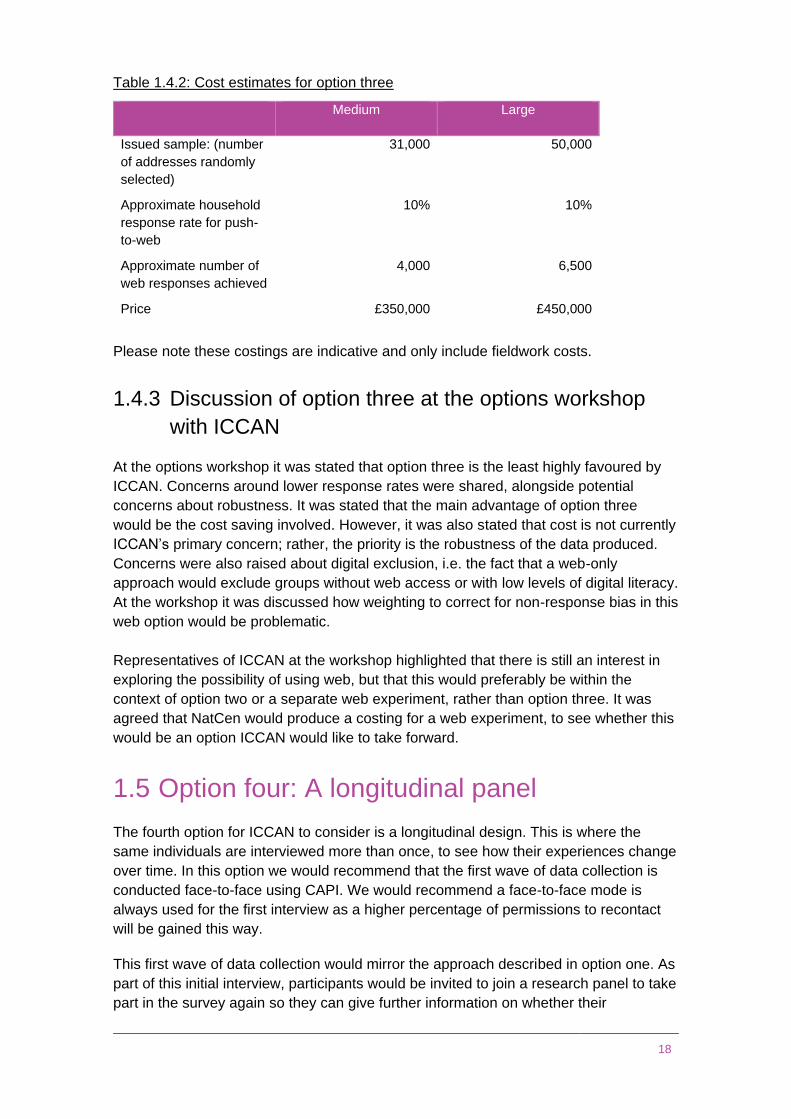
1.4.2 Costs for option three
For the costings of option three, we assume a push-to-web survey of 25-minutes. The
main advantage of the web survey option is that it allows for more people to be
17
included in the survey within a lower budget (albeit with lower response rates). In this
scenario, costs would not be influenced by geographical area or clustering. On this
basis, we would recommend that only the ‘medium’ and the ‘large’ survey sizes are
considered if a web option is introduced to allow for the inclusion of a broader range of
airports.
For this option we would invite people to take part in a survey via mailing selected
addresses. We would issue two reminder letters to attempt to encourage response. A
£10 conditional incentive would also be offered to increase response rates. We would
assume that approximately 10% of selected households would respond with an
average of 1.3 adults responding per household, if we issued multiple access codes
per household.
Cost estimates are displayed in Table 1.4.2 below. Please note costs are only
displayed for the first wave of data collection.
18
Table 1.4.2: Cost estimates for option three
Medium Large
Issued sample: (number
of addresses randomly
selected)
31,000 50,000
Approximate household
response rate for push-
to-web
10% 10%
Approximate number of
web responses achieved
4,000 6,500
Price £350,000 £450,000
Please note these costings are indicative and only include fieldwork costs.
1.4.3 Discussion of option three at the options workshop
with ICCAN
At the options workshop it was stated that option three is the least highly favoured by
ICCAN. Concerns around lower response rates were shared, alongside potential
concerns about robustness. It was stated that the main advantage of option three
would be the cost saving involved. However, it was also stated that cost is not currently
ICCAN’s primary concern; rather, the priority is the robustness of the data produced.
Concerns were also raised about digital exclusion, i.e. the fact that a web-only
approach would exclude groups without web access or with low levels of digital literacy.
At the workshop it was discussed how weighting to correct for non-response bias in this
web option would be problematic.
Representatives of ICCAN at the workshop highlighted that there is still an interest in
exploring the possibility of using web, but that this would preferably be within the
context of option two or a separate web experiment, rather than option three. It was
agreed that NatCen would produce a costing for a web experiment, to see whether this
would be an option ICCAN would like to take forward.
1.5 Option four: A longitudinal panel
The fourth option for ICCAN to consider is a longitudinal design. This is where the
same individuals are interviewed more than once, to see how their experiences change
over time. In this option we would recommend that the first wave of data collection is
conducted face-to-face using CAPI. We would recommend a face-to-face mode is
always used for the first interview as a higher percentage of permissions to recontact
will be gained this way.
This first wave of data collection would mirror the approach described in option one. As
part of this initial interview, participants would be invited to join a research panel to take
part in the survey again so they can give further information on whether their
19
experiences have changed. Subsequent waves of data collection would be carried out
online or by telephone, after names and contact details have been collected.
1.5.1 Pros and cons of option four
One benefit of longitudinal data collection is in relation to cost effectiveness. If a panel
of research participants is set up, after the initial investment in the first wave, any
subsequent waves of data collection can be conducted more cost-effectively. For the
first wave of data collection, optimum face-to-face modes would be utilised. For
subsequent waves, data can be collected using more cost-effective modes, as higher
quality online and telephone surveys are possible once a sample frame (that includes
contact details) has been set up. The more waves of data collection, the greater the
potential for cost savings there would be. However, more investment would be
recommended for the first wave of data collection, in order to recruit enough sample for
future waves once panel attrition is considered.
If ICCAN developed and maintained a longitudinal panel it would allow them more
flexibility in addressing research questions that may arise in the future. With a panel, it
would be possible to conduct rapid-turnaround surveys based on current research
priorities. This could include local surveys (that look at specific airport-level issues) or
surveying of sub-groups who may be of interest. Investment in a panel infrastructure
could also potentially help ICCAN conduct pre and post surveys to test specific
interventions or changes. However, there is no way to guarantee the panel sample
composition will be optimal for all future research projects. Whether or not a panel is
appropriate will depend on the specifics of the intervention being assessed, particularly
how many panel participants are exposed to the intervention under investigation.
A panel design would potentially allow ICCAN to conduct research with ‘movers’, i.e.
people who move out of an area impacted by aviation noise. One criticism of the cross-
sectional approach is that it does not capture any information on people who have
moved out of an area because of the noise, as they would no longer be included in the
sample frame. It is unclear the extent to which a panel could collect data regarding
movers, as the prevalence of this behaviour is unknown. However, a panel
methodology would at least have the potential to conduct follow-up research with this
group.
The main disadvantage of the longitudinal panel approach is that once participants
have taken part in one wave of the survey, they will know the study is about attitudes
towards aviation noise and its impacts. This potentially goes against ICBEN
recommendations that state the specific focus of data collection on noise should not be
known to respondents in advance of data collection (instead the stated purpose should
be something along the lines of ‘informing policy on environmental issues’ or similar).
Over time, attrition may be higher amongst groups who are not impacted and so are
less engaged with the survey subject. This can partially be corrected for in the analysis
(e.g. by weighting data based on annoyance reported at wave one). However, such
adjustments would add complexity to analyses and may be misinterpreted by non-
technical audiences who are interested in the data collected. A repeated cross-
sectional design would provide more robust evidence on how community annoyance
levels are changing over time.
20
A key consideration for ICCAN is whether research on change should focus on
community level change or individual level change. If community level change is key, a
repeated cross-sectional would be better. This is because over time longitudinal
studies become potentially less representative of the communities they are meant to
represent, due to selective attrition.
It is also worth noting that participants who take part in a cross-sectional study can be
re-contacted to take part in future research (if their permission has been granted) even
if a formal longitudinal panel is not set up. Sub-studies will be possible off the back of
cross-sectional research without ICCAN committing to a full longitudinal design.
The main advantages of longitudinal designs vs. repeated cross-sectional designs are
summarised in Table 1.4.1.
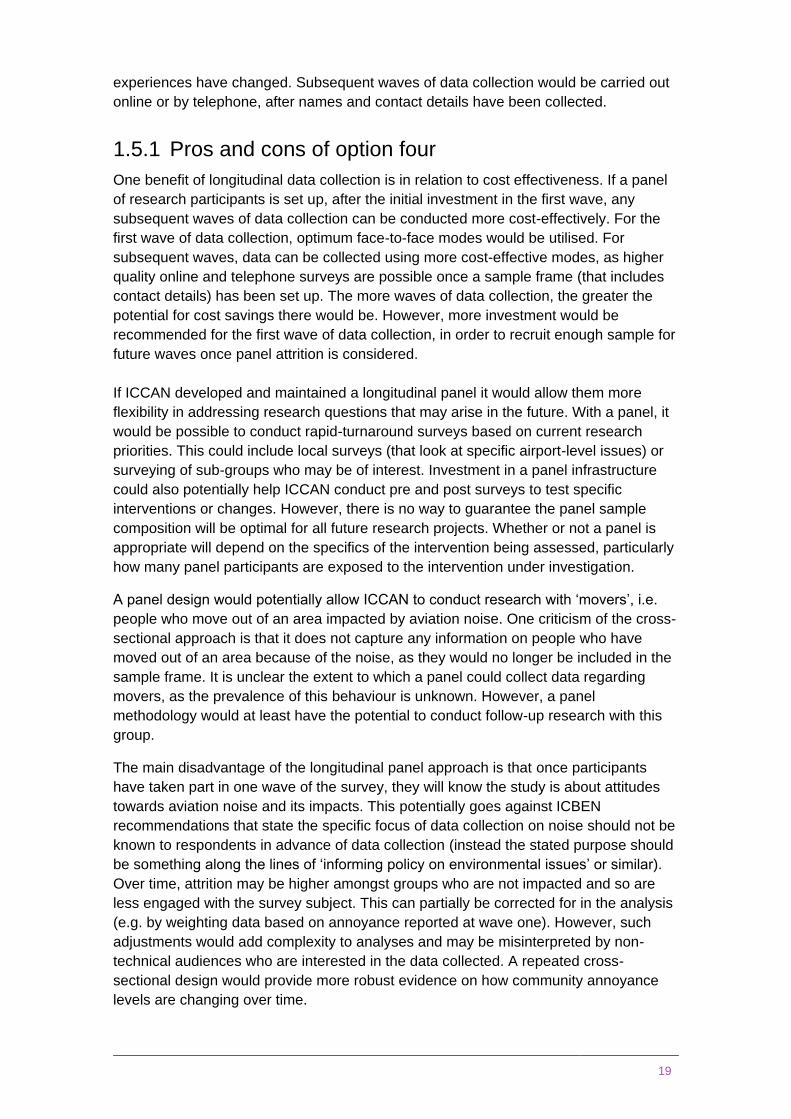
Table 1.4.1: Advantages of longitudinal and cross-sectional designs
Advantages of a longitudinal panel
design
Advantages of a repeated cross-
sectional design
● If a panel of research participants is
set up, after the initial investment
subsequent waves of research can
be conducted more cost-effectively.
● Allows for web surveys from wave
two onwards to be completed online
without the concerns raised of
fraudulent completion.
● Can collect data on how annoyance
within individuals changes over time.
● Can also collect data on wellbeing
and sleep vary within individuals over
time. This may be of particular
relevance when looking at groups
who have experienced a change in
noise exposure.
● It is possible to collect annoyance
data from movers.
● Offers more flexibility to conduct
rapid-turnaround surveys in the future
in new areas identified as being of
interest.
● All the main research questions
raised by stakeholders can be
measured using a cross-sectional
survey design rather than a
longitudinal survey design.
● Repeated cross-sectional research
would be more appropriate for
looking at how community level
exposure-annoyance curves change
over time. This is because, over time,
longitudinal studies become
potentially less representative of the
communities they are meant to
represent due to selective attrition.
● Participants who take part in a cross-
sectional study can be re-contacted
to take part in future research if
permission has been granted. Such
recontact research could be
conducted on an ad hoc basis
without the need of a panel
infrastructure (sample size
permitting).
1.5.2 Costs for option four
For the costing of option four, we have assumed a 35-minute first wave interview (by
means of CAPI) and have then estimated a cost for two waves of web follow-up (25

21
minutes of similar content). For the first wave of data collection we have assumed the
same methods as described in the CAPI methods section (including the use of an
unconditional £10 incentive). For subsequent waves of data collection, we would
recommend a £10 conditional incentive for each online questionnaire completed.
We have assumed the sample size achieved at wave one is the same as for the cross-
sectional CAPI design. However, we would anticipate the sample sizes would decrease
at each wave of data collection. In practice, this means the ‘small’ sample size may not
be appropriate using the longitudinal method in later waves unless the panel is topped
up with ‘fresh’ cross sectional sample over time as attrition increases. This sample top-
up has not been included in the current costing. Our costing assumes that 80% of
people who take part at wave 1 will agree to be re-contacted, 50% of whom will
respond to a wave 2 survey. We have assumed 75% of people who take part at wave 2
will take part again at wave 3. These rates are likely to vary significantly depending on
the gap between successive waves of fieldwork, with higher responses being achieved
with shorter gaps between waves.
Table 1.5.2: Cost estimates for option four
Issued sample:
(number of
addresses randomly
selected)
6,152 9,894 15,985
Issued sample at
wave 1: (number of
addresses randomly
selected)
6,152 9,894 15,985
Deadwood:
(addresses not
eligible e.g. non-
residential or vacant)
9% 9% 9%
Approximate
interviews achieved
at wave 1
2,500 4,000 6,500
Approximate
individual response
rate at wave 1
45% 45% 45%
Approximate wave 3
sample size post
attrition
750 1,250 2,000
Price at wave 1 £675,000 £900,000 £1,300,000
Price for two follow
up web surveys
(wave 2 and wave 3)
after attrition, with no
top-up sample
£275,000 £300,000 £325,000
Total price for all
waves (1-3)
£950,000 £1,200,000 £1,625,000
22
Please note these costings are indicative and only include fieldwork costs.
Due to attrition we would recommend that a medium or large design would be more
appropriate for a longitudinal exercise, in order to have sufficient sample at later waves
of data collection.
One of the main advantages of the longitudinal design, as described above, is the
possibility of conducting additional ad hoc surveys once the panel has been set up.
These exercises have not been costed for as they would comprise an additional activity
that is not included in the existing methods review.
1.5.3 Discussion of option four at the options workshop with
ICCAN
At the workshop there were mixed views on option four. On the one hand, a
longitudinal element seemed appealing due to the perception that it would be better
able to answer certain research questions than a cross-sectional approach. Research
areas mentioned were looking at changes in attitudes over time and changes in
circumstances over time. However, it was highlighted that the research questions of
interest could in fact also be answered using a repeated cross-sectional approach.
Concerns were also raised about potential complications arising from a longitudinal
approach. It was stated that maintaining robustness – which is the chief priority for
ICCAN – becomes increasingly difficult in a longitudinal approach after the first wave of
the study, due to attrition. This could allow bias to emerge if, for instance, more highly
annoyed participants stay on for future waves whereas less annoyed participants drop
out. Due to attrition it may be necessary to top up the sample to make it more
representative, but concerns were raised about the complexity this adds to the
analysis. During the workshop it was clarified that the estimates for attrition used in this
report are based on NatCen’s experience with previously run surveys. However, it was
stated that these estimates are dependent on the length of the gaps between waves.
Additional concerns were raised about the compatibility of a longitudinal approach with
ICBEN standards. It was noted that in future waves, participants will already be aware
that the survey is about aviation noise, which is not compliant with ICBEN standards.
There were also concerns about the ability of a longitudinal design to handle changes
in noise contours.
It was discussed that some held the view that a longitudinal design would be more
appropriate for investigating questions related to health and wellbeing. However, it was
also raised that these questions could be looked at in a repeated cross-sectional study.
Moreover, it was stated that a longitudinal approach could add an element of ‘noise’ to
the data which would not be an issue in a cross-sectional approach. It was stated that
specific questions related to health and wellbeing are more appropriately addressed
using epidemiological studies.

23
One of the main advantages of a longitudinal panel raised was the cost-savings in
future waves of the study, given that most of the costs are tied up in the set-up of the
initial wave. However, as previously stated, cost was a secondary concern for ICCAN.
A case was also made for a longitudinal approach based on its facilitation of smaller,
follow-up studies on specific groups of individuals. However, it was highlighted that
these could be relatively easily built into a cross-sectional approach by asking for
participants’ consent to recontact (which is more likely to be successful if this is done
face-to-face by an interviewer). It was therefore concluded that ICCAN do not
necessarily need to invest in a longitudinal panel to achieve this.
It was ultimately stated that a cross-sectional approach may well meet the objectives of
the project better than a longitudinal design, but that a clear explanation of this will be
given in the final report.
1.6 Sample size and composition
Throughout this document we have provided costs for conducting surveys of different
sizes using the following target achieved sample-sizes:
Table 1.6: Target achieved sample-sizes used in the costings
‘Small’ ‘Medium’ ‘Large’
Approx. 2,500 Approx. 4,000 Approx. 6,500
The following chapter describes our rationale for these sample sizes, and the relative
benefits of using the different sizes of survey. In this section we also describe the
approach we used for sampling in order to generate these costings.
1.6.1 Sample size
We chose 2,500 as the target sample size of a ‘small’ survey as this is roughly
equivalent to the achieved sample sizes in previous SoNA surveys. We chose 6,500 as
the ‘large’ target sample size as power calculations in Work Package 2A and B suggest
that this sample size is large enough to detect granular differences in annoyance
between residents exposed to different levels of aviation noise (see Table 1.6.1A). The
‘medium’ target sample size of 4,000 provides a halfway point between a small and
large survey.
Table 1.6.1A displays some power calculations of the different survey scenarios. They
can be interpreted as how large of a difference each survey scenario would be able to
detect in the proportion of residents who report being highly or extremely annoyed by
level of aviation noise exposure, after accounting for any potential clustering of
annoyance within airport. These calculations assume 80% power and a 5% type 1 error
rate. They also assume that the percentage of residents highly or extremely annoyed in
51-54 dB areas is 11% (based on calculations of SoNA 2014 data – see Work Package
2A and B report). We can be reasonably confident that differences found in the survey

24
that are this size or larger are the result of real differences in annoyance in the
population, rather than chance.
These calculations suggest that a small survey, for instance, would be able to detect a
difference of 5% points or more in the proportion of residents highly or extremely
annoyed by aviation noise who live in areas with less than 51 dB LAeq,16h compared to
residents who live in areas with 51-54 dB LAeq,16h. A large survey would be able to
detect a difference of 3% points or more in the proportion of residents highly or
extremely annoyed by aviation noise who live in areas with less than 51 dB LAeq,16h
compared to residents who live in areas with 51-54 dB LAeq,16h. For more information on
power calculations, see Work Package 2A and B report.
Table 1.6.1A: Power calculations of survey scenarios: across all airports
Survey
Scenario
Achieved
Sample
Size
Able to detect a difference of
x% points in annoyance
between <51 dB residents
and 51-54 dB residents
Able to detect a difference of x%
points in annoyance between 51-
53 dB residents and 54-56 dB
residents
Small 2,500 5% points 6% points
Medium 4,000 4% points 5% points
Large 6,500 3% points 4% points
To cost a face-to-face survey, we need to make some assumptions on sampling
design. Following the options laid out in Work Package 2A and B, we assume the
following sampling strategy for costing purposes only.
There will be a two-stage sampling design:
● 1st stage: select airports to include in the survey;
● 2nd stage: use an address-based sampling frame to select a stratified random
sample of addresses.
The Work Package 2A and B report highlighted that ICCAN will need to make some
key decisions before an optimal sampling strategy can be designed. However, we
needed to make some assumptions on these decision in order to produce costs. Table
1.6.1B outlines the decisions ICCAN will need to make and the assumptions used in
this costing exercise. For the most part, a change in assumptions will have little impact
on cost. A notable exception is the choice of number of airports, which will have cost
implications.
25
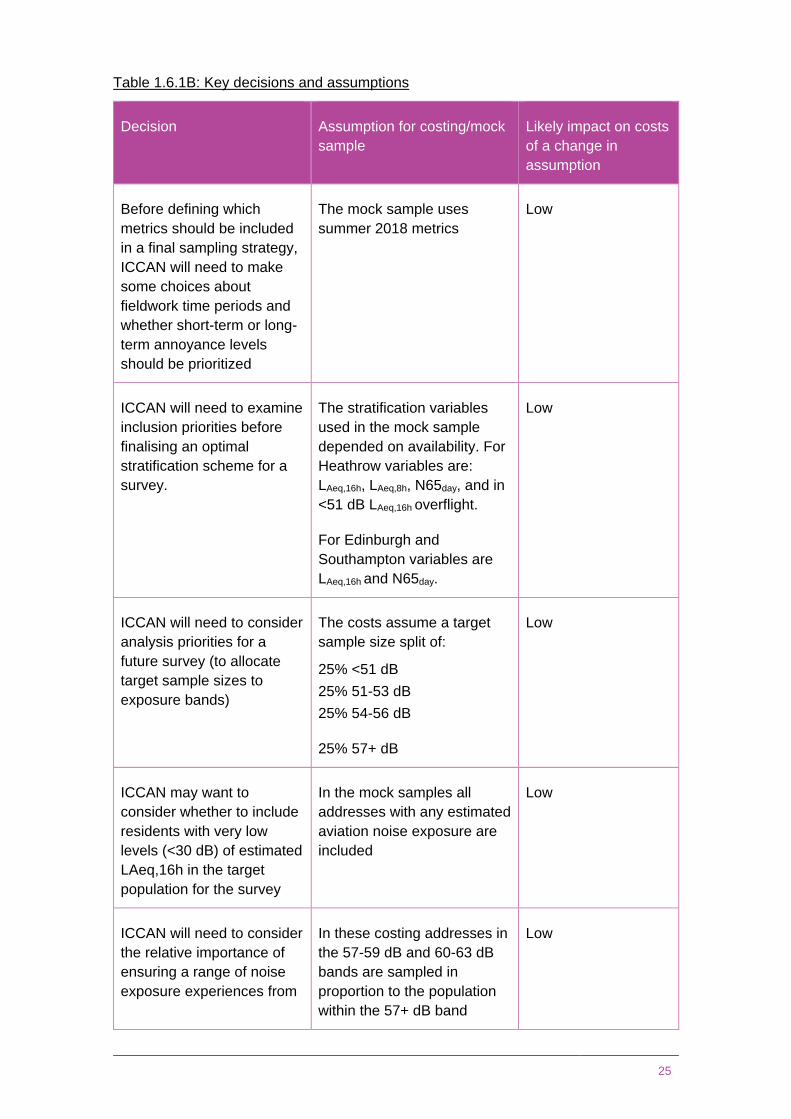
Table 1.6.1B: Key decisions and assumptions
Decision Assumption for costing/mock
sample
Likely impact on costs
of a change in
assumption
Before defining which
metrics should be included
in a final sampling strategy,
ICCAN will need to make
some choices about
fieldwork time periods and
whether short-term or long-
term annoyance levels
should be prioritized
The mock sample uses
summer 2018 metrics
Low
ICCAN will need to examine
inclusion priorities before
finalising an optimal
stratification scheme for a
survey.
The stratification variables
used in the mock sample
depended on availability. For
Heathrow variables are:
LAeq,16h, LAeq,8h, N65day, and in
<51 dB LAeq,16h overflight.
For Edinburgh and
Southampton variables are
LAeq,16h and N65day.
Low
ICCAN will need to consider
analysis priorities for a
future survey (to allocate
target sample sizes to
exposure bands)
The costs assume a target
sample size split of:
25% <51 dB
25% 51-53 dB
25% 54-56 dB
25% 57+ dB
Low
ICCAN may want to
consider whether to include
residents with very low
levels (<30 dB) of estimated
LAeq,16h in the target
population for the survey
In the mock samples all
addresses with any estimated
aviation noise exposure are
included
Low
ICCAN will need to consider
the relative importance of
ensuring a range of noise
exposure experiences from
In these costing addresses in
the 57-59 dB and 60-63 dB
bands are sampled in
proportion to the population
within the 57+ dB band
Low
26
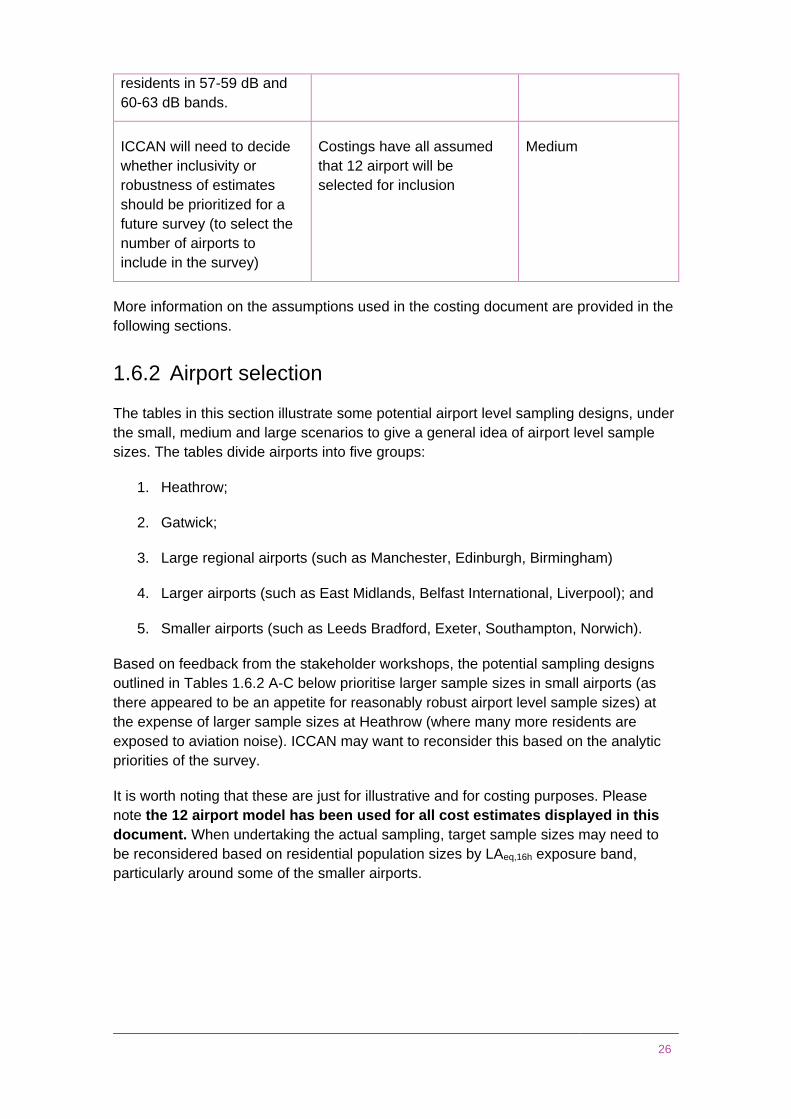
residents in 57-59 dB and
60-63 dB bands.
ICCAN will need to decide
whether inclusivity or
robustness of estimates
should be prioritized for a
future survey (to select the
number of airports to
include in the survey)
Costings have all assumed
that 12 airport will be
selected for inclusion
Medium
More information on the assumptions used in the costing document are provided in the
following sections.
1.6.2 Airport selection
The tables in this section illustrate some potential airport level sampling designs, under
the small, medium and large scenarios to give a general idea of airport level sample
sizes. The tables divide airports into five groups:
1. Heathrow;
2. Gatwick;
3. Large regional airports (such as Manchester, Edinburgh, Birmingham)
4. Larger airports (such as East Midlands, Belfast International, Liverpool); and
5. Smaller airports (such as Leeds Bradford, Exeter, Southampton, Norwich).
Based on feedback from the stakeholder workshops, the potential sampling designs
outlined in Tables 1.6.2 A-C below prioritise larger sample sizes in small airports (as
there appeared to be an appetite for reasonably robust airport level sample sizes) at
the expense of larger sample sizes at Heathrow (where many more residents are
exposed to aviation noise). ICCAN may want to reconsider this based on the analytic
priorities of the survey.
It is worth noting that these are just for illustrative and for costing purposes. Please
note the 12 airport model has been used for all cost estimates displayed in this
document. When undertaking the actual sampling, target sample sizes may need to
be reconsidered based on residential population sizes by LAeq,16h exposure band,
particularly around some of the smaller airports.

27
Table 1.6.2 A: Example sample size allocation: 12 airports
Airport # of airports % of sample ‘Small’ ‘Medium’ ‘Large’
Heathrow 1 20.5% 513 820 1,333
Gatwick 1 14.0% 350 560 910
Large regional airports 3 10.0% 250 400 650
Large airports 3 6.5% 163 260 423
Small airports 4 4.0% 100 160 260
Total 12 100% 2,500 4,000 6,500
Table 1.6.2 B: Example sample size allocation: 9 airports
Airport # of airports % of sample ‘Small’ ‘Medium’ ‘Large’
Heathrow 1 23.0% 575 920 1,495
Gatwick 1 16.0% 400 640 1,040
Large regional airports 2 12.5% 313 500 813
Large airports 2 9.0% 225 360 585
Small airports 3 6.0% 150 240 390
Total 9 100% 2,500 4,000 6,500
Table 1.6.2 C: Example sample size allocation: 6 airports
Airport # of airports % of sample ‘Small’ ‘Medium’ ‘Large’
Heathrow 1 30.0% 750 1200 1,950
Gatwick 1 21.0% 525 840 1,365
Large regional airports 1 17.0% 425 680 1,105
Large airports 1 14.0% 350 560 910
Small airports 2 9.0% 225 360 585
Total 6 100% 2,500 4,000 6,500
Data from SoNA 2014 suggest that across all levels of aviation noise exposure, on
average 20% of the sampled population was highly or extremely annoyed by aviation
noise during the summer period.

28
Table 1.6.2 D (below) displays power calculations of the minimum sample sizes
needed to detect airport level differences in the average (across all levels of aviation
noise exposure) proportion of the population highly or extremely annoyed by aviation
noise between airports with a similar or larger sample size. For more information on
power calculations, see the Work Package 2A and B report.
Table 1.6.2 D: Minimum sample sizes needed to detect airport level differences in
annoyance
Detect difference of +
% points
n needed in each
airport
Detect difference of -
% points
n needed in each
airport
15% points (20%-35%) 135 15% points (20%-5%) 73
10% points (20%-30%) 290 10% points (20%-10%) 196
5% points (20%-25%) 1,089 5% points (20%-15%) 901
3% points (20%-23%) 2,934 3% points (20%-17%) 2,621
Table D above can be compared to the airport level sampling design options outlined in
tables A-C to determine which airport level differences would be detectable under
different scenarios. For instance, 100 achieved interviews in small airports (small
survey scenario, 12 airport design) would be enough to detect a 15% point difference
(from 20% to 5%) in the proportion of residents highly or extremely annoyed by aviation
noise between small airports (or a small versus larger airport). A sample size of 260
(large survey scenario, 12 airport design) would be enough to detect a 10% difference
(20%-10%) in the proportion of residents highly or extremely annoyed by aviation noise
between small airports.
Sample sizes of 1,365 in Gatwick and 1,950 in Heathrow (large survey scenario, 6
airport design) would be able to detect a 5% point difference (either from 20%-25% or
20%-15%) in annoyance between airports. None of the sampling design options in the
tables would be powered to detect a 3% point difference in average annoyance
between airports.
1.6.3 Address selection
As suggested in the Work Package 2A and B report, the costings assume the second
stage will be random sample of addresses stratified by aviation noise exposure
variables. The mock samples drawn for this exercise are based on 2018 summer noise
metrics. In particular, the costings assume sample will be stratified by 3 dB bands of
2018 summer LAeq,16h and (where there is variation) other exposure variables such as:
LAeq,8h and N65day. The key decision here is choosing LAeq,16h as the first stratification
variable. The choice of further stratification variables will not have a large impact on the
costings.
In practice the mock Heathrow sample was stratified by LAeq,16h, LAeq,8h and N65day. We
did not have any information on LAeq,8h for Edinburgh and Southampton. Therefore,
addresses around these airports were stratified by LAeq,16h and N65day.
29
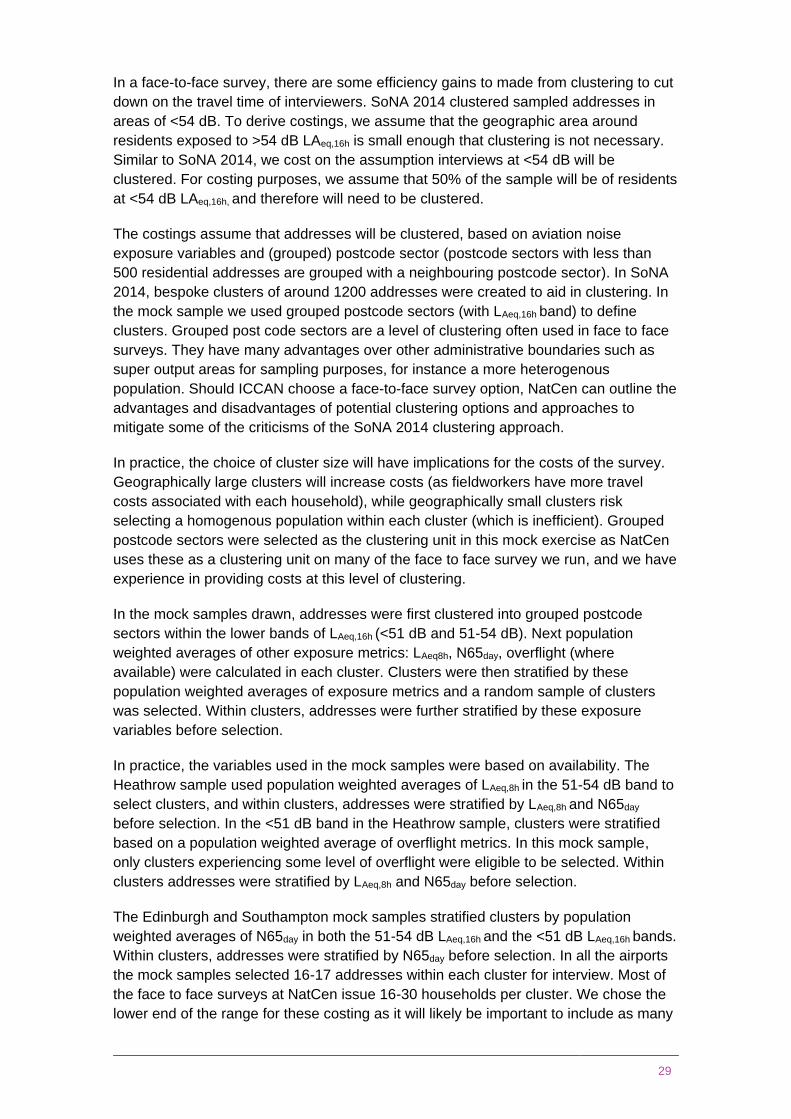
In a face-to-face survey, there are some efficiency gains to made from clustering to cut
down on the travel time of interviewers. SoNA 2014 clustered sampled addresses in
areas of <54 dB. To derive costings, we assume that the geographic area around
residents exposed to >54 dB LAeq,16h is small enough that clustering is not necessary.
Similar to SoNA 2014, we cost on the assumption interviews at <54 dB will be
clustered. For costing purposes, we assume that 50% of the sample will be of residents
at <54 dB LAeq,16h, and therefore will need to be clustered.
The costings assume that addresses will be clustered, based on aviation noise
exposure variables and (grouped) postcode sector (postcode sectors with less than
500 residential addresses are grouped with a neighbouring postcode sector). In SoNA
2014, bespoke clusters of around 1200 addresses were created to aid in clustering. In
the mock sample we used grouped postcode sectors (with LAeq,16h band) to define
clusters. Grouped post code sectors are a level of clustering often used in face to face
surveys. They have many advantages over other administrative boundaries such as
super output areas for sampling purposes, for instance a more heterogenous
population. Should ICCAN choose a face-to-face survey option, NatCen can outline the
advantages and disadvantages of potential clustering options and approaches to
mitigate some of the criticisms of the SoNA 2014 clustering approach.
In practice, the choice of cluster size will have implications for the costs of the survey.
Geographically large clusters will increase costs (as fieldworkers have more travel
costs associated with each household), while geographically small clusters risk
selecting a homogenous population within each cluster (which is inefficient). Grouped
postcode sectors were selected as the clustering unit in this mock exercise as NatCen
uses these as a clustering unit on many of the face to face survey we run, and we have
experience in providing costs at this level of clustering.
In the mock samples drawn, addresses were first clustered into grouped postcode
sectors within the lower bands of LAeq,16h (<51 dB and 51-54 dB). Next population
weighted averages of other exposure metrics: LAeq8h, N65day, overflight (where
available) were calculated in each cluster. Clusters were then stratified by these
population weighted averages of exposure metrics and a random sample of clusters
was selected. Within clusters, addresses were further stratified by these exposure
variables before selection.
In practice, the variables used in the mock samples were based on availability. The
Heathrow sample used population weighted averages of LAeq,8h in the 51-54 dB band to
select clusters, and within clusters, addresses were stratified by LAeq,8h and N65day
before selection. In the <51 dB band in the Heathrow sample, clusters were stratified
based on a population weighted average of overflight metrics. In this mock sample,
only clusters experiencing some level of overflight were eligible to be selected. Within
clusters addresses were stratified by LAeq,8h and N65day before selection.
The Edinburgh and Southampton mock samples stratified clusters by population
weighted averages of N65day in both the 51-54 dB LAeq,16h and the <51 dB LAeq,16h bands.
Within clusters, addresses were stratified by N65day before selection. In all the airports
the mock samples selected 16-17 addresses within each cluster for interview. Most of
the face to face surveys at NatCen issue 16-30 households per cluster. We chose the
lower end of the range for these costing as it will likely be important to include as many

30
different areas as possible. Note that using the deadwood (9%) and response rate
(45%) assumptions listed in Table 1.2.2, we would expect to achieve between 6 and 7
interviews in a cluster of 16 issued households.
It is important to note that none of the assumptions on which stratification variables
were included, the order of the stratification variables, or the use of overflight metrics
will have an impact on costs. Assumptions on the geographic size of clusters (i.e. using
grouped postcode sectors), and the number of addresses per cluster (16-17) will
influence costs.
1.7 Final conclusions from the options
workshop with ICCAN In the concluding stages of the workshop with ICCAN, it was agreed that the most
favoured of the options are options one and two, with an overall preference for option
one. It was unanimously agreed that the robustness of the data obtained is the ultimate
priority for the survey design, rather than considerations relating to cost.
It was made clear that ICCAN would still like to investigate the possibility of using a
web approach. The main attraction of this is due to the flexibility it would offer if a web
option were available in some form. It was agreed that this could possibly take the form
of a web pilot or a web experiment in the first instance. NatCen agreed to produce a
costing for a web experiment to see whether ICCAN would like to pursue this further.

31
References
1. ONS (2018). Internet users, UK: 2018.
https://www.ons.gov.uk/businessindustryandtrade/itandinternetindustry/bulletins
/internetusers/2018