Embed Size (px)
Citation preview

00 UII tJL ,.
4AFWAL-TR-88-2034Volume II
44
DYNAMIC COMBUSTION STUDIES USING ADVANCED OPTICAL DIAGNOSTICS
VOLUME II : Tabulated Data
D. R. Ballal, T. H. Chen, A. J. Lightman, W. J. Schmoll, andP. P. YaneyUniversity of DaytonResearch InstituteDayton, Ohio 45469-0001
July 1988
FINAL REPORT FOR THE PERIOD FEBRUARY 21, 1983 TO OCTOBER 20, 1987
Approved for Public Release, Distribution is Unlimited
6DTICELECTE
AUG 18 1988AERO PROPULSION LABORATORYAIR FORCE WRIGHT AERONAUTICAL LABORATORIESAIR FORCE SYSTEMS COMMAND EWRIGHT-PATTERSON AIR FORCE BASE, OH 45433-6563
* 88 8 17 uJ2

NOTICE
"When Government drawings, specifications, or other data areused for any purpose other than in connection with a definitely Irelated government procurement operation, the United StatesGovernment thereby incurs no responsibility nor any obligationwhatsoever; and the fact that the Government may have formulated,furnished, or in any other way supplied the said drawings,spe,.ifications, or other data, is not to be regarded byimplication or otherwise as in any manner licensing the holder orany other person or corporation, or conveying any rights orpermission to manufacture, use or sell any patented inventionthat may in any way be related thereto." 0
This report has been reviewed by the Office of PublicAffairs (ASD/PA) and is releasable to the National TechnicalInformation Service (NTIS). At NTIS, it will be available to thegeneral public, including foreign nations.
This technical report h;as been reviewed and is approved forpublication.
C
W. U. f<OUF! RE- CHARLES L. DELANEY, Chief .Fuels Branch Fuels BranchFuels and Lubrication Division Fuels and Lubrication Division(,,ro P:'opulsion laboratory Aero Propulsion Laboratory
FOR ThE COMMANDER
-Bp -0P. BOT7ER-- Asst Che t,-j;els _ anos Ljtr'icat' r - -, ,r.1,
"If your address has changed, if you wish to be removed from
our mailing list, or if the addressee is no longer employed byyour organization, please notify AFWAL/POSF, W-PAFB, OH 45433-6563 to help us maintain a current mailing list.
Copies of this report should not be returned unless return isrequired by security considerations, contractual obligations, ornotice of a specific document.
'I'

0
unclassifiedSECURITY CLASSIFICATION OF THIS PAGE
REPORT DOCUMENTATION PAGE
1s REPORT SECURITY CLASSIFICAI ION lb. RESTRICTIVE MARKINGS
Unclassified N/A2. SECURITY CLASSIFICATION AUTHORITY 3. DISTRIBUTION/AVAILABILITY OF REPORT
N/A Approved for Public Release, Distribution2b, DECLASSIFICATION/OOWNGRAOING SCHEDULE is Unl imi ted
N/AA PERFORMING ORGANIZATION REPORT NUMBER(S) 5. MONITORING ORGANIZATION REPORT NUMBER(S)
UDR-TR-88-02 AFWAL-TR-88-2034 Volume II
6a. NAME OF PERFORMING ORGANIZATION 6b. OFFICE SYMBOL 7a. NAME OF MONITORING ORGANIZATION
University of Dayton (Itappicable) Aero Propulsion Laboratory (AFSC), (AFWAL/Research Institute UDRI POSF), Wright Aeronautical Laboratories
6c. ADDRESS (City. State and ZIP Code) 7b. ADDRESS (City. State and ZIP Code)
300 College Park Wright-Patterson Air Force Base, OHDayton, OH 45469-0001 45433-6563
s. NAME OF FUNDING/SPONSORING 8b. OFFICE SYMBOL 9. PROCUREMENT INSTRUMENT IDENTIFICATION NUMBER
ORGANIZATION I or,' plicabe)
AFWAL/0SF F33615-82-C-2255
* Bc ADDRESS (City. State anid ZIP Code) 10. SOURCE OF FUNDING NOS.
PROGRAM PROJECT TASK WORK UNIT
ELEMENT NO . NO. NO. NO.
I I TI TLE 'Inciude Securit:. Classificatlon)
See reverse? side 62203F 3048 05 22
12. PERSONAL AUTHOf,(S)
D. R. Ballal, T. H. Chen, A. J. Lightman, W. J. Schmoll, & P. P. Yaney13&. TYPE OF REPORT 13b. TIME'COVERED 14. DATE OF REPORT (Yr., Mo., Day) 15. PAGE COUNT
Final Report FROM 2.LZI/BL TO1.OI2fl2EJ July 1988 7016. SUPPLEMENTARY NOTATION
N/A
17 COSATI CODES 14SUBJECT TERMS iContsnue on reverse if necessary and ident;fy by block number)
2IELD GROUP SUB GR Turbulent Combuston, Jet Flows, Recirculatory Combustion,20 06 onr acting Flo s, Bluff-B d , ar Wa ke, (.- ,rko
19. ABSTRACT (Continue on reuerce if necessary and identify by block numberl
-Computer models of turbulent mixing and combustion suffer from many limitations,* deficiencies, and errors. To evaluate and refine them, an experimental research program
was started E) to develop a combustion test facility and optical diagnostics, b) toperform turbulent mixing and combustion experiments, and c) to provide a data base formodeling needs.
In Volume I of this fin~l report, experimental studies on turbulent mixing andcombustion were described.Vn Volume II, bench-mark quality data recorded in theseexperiments are documented for modeling needs. Specifically, data are tabulated forthree variable-density, non-reactive turbulent mixing experiments: fl) 2-D Mixing Layer,
(See reverse side)
20 OISTRIBI'TIf)N'8VAILABIL'Y OF' ;n TqACT 21 ABSTRACT SECURITY CLASSIFICATION
UNCLASSIFIED/UNLIMITED X SAME AS RPT. E OTIC USERS C1 Unclassified
% 22a. NAME OF RESPONSIBLE INDIVIDUAL 22b TELEPHONE NUMBER 22c. OFFICE SYMBOL
% (Include Area Code)
.W. M. Roquemore (513) 255-6813 AFWAL/POSF
DD FORM 1473,83 APR EDITION OF 1 JAN 73 IS OBSOLETE. UnclassifiedSECURITY CLASSIFICATION OF THIS PAGE
M. ONO..

UnclassifiedSECURITY CLASSIFICATION OF THIS PAGE
11. Title: Dynamic Combustion Studies Using Advanced Optical Diagnostics Vol II:
Tabulated Data
19. Abstract (Continued).2) 2-D Slot Jet/Centerbody, and f3) Round Jet, and for two turbulent combustion
experiments: (1) Scalar Fluctuations Tn Premixed Flames, (2) Conical Flame Stabilizer.
These data may be used to evaluate and refine modeling codes of turbulent mixingand combustion processes. / ,
I\
I
ii. Unclassified1 1 SECURITY CLASSIFICATION OF THIS PAGE

PREFACE
This final report was submitted by the University of Daytou'esearch Institute (UDRI) under Contract No. F33615-82-C-2255,,ponsored by the U.S. Air Force Wright Aeronautical LaboratoriesAero Propulsion Laboratory, Wright-Patterson Air Force Base,Ohio. Dr. W. M. Roquemore of AFWAL/POSF was the Air ForceTechnical Monitor, and Dr. D. R. Ballal of Applied PhysicsDivision, UDRI was the Principal Investigator of this researchprogram. This report covers work performed during the period-ebruary 21, 1983 through October 20, 1987.
The tabulated data were compiled by D. R. Ballal, T. H.Chen, and W. J. Schmoll. We wish to express our gratitude andappreciation to
W. M. Roquemore for his help, advice, and encouragement;
J. Stutrud (AFWAL/POSF) for his assistance with computersoftware;
* E. H. Gerber, Project Supervisor, Applied Physics Division,UDRI for his encouragement and support;
/2. Ms. E. Bordewisch, UDRI, for report preparation, and Ms. A.Cochran, UDRI, for technical editing.
Aooeusion ForNTIS GIA&I
-" DTIC TAB
Unannounoed 0Justifioation
Distribution/Availability Codes
Ava A and/or
Dist Special.. W,
s ..
,o • "I
?* iii

TABLE OF CONTENTS
SECTION PAGE NO.
1 INTRODUCTION 1
2 TURBULENT MIXING EXPERIMENTS 4
2.1 2-D Mixing Layer Experiment 42.2 2-D Slot Jet/Centerbody Experiment 152.3 Round Jet Experiment 24
3 TURBULENT COMBUSTION EXPERIMENTS 40
3.1 Scalar Fluctuations in a Premixed Flame 403.2 Conical Flame Stabilizer Experiment 48
* 4 CONCLUDING REMARKS 55
REFERENCES 56
NOMENCLATURE 57
*1v
'&
4

LIST OF ILLUSTRATIONS
FIGURE PAGE NO.
1 wevelopment of a 2-D Mixing Layer 4Downstream of a Splitter Plate.
2 Sketch Illustrating (a) Flow Structure 15of a 2-D Slot Jet/Centerbody Configuration(b) 2-D Slot Jet/Centerbody Configuration
3 Turbulent Flow Structure of an Axisymmetric 24Round Jet.
4 Turbulent Premixed Flame Illustrating the 40Various Regions and the Locations forMeasuring Scalar and Velocity Fluctuations.
5 Structure of the Recirculation Zone Downstream 48of a Conical Flame Stabilizer Without and WithCombustion.
a."
2
iS

LIST OF TABLES
TABLE PAGE NO.
1 Inlet Boundary Conditions: (a) Mean 6-8Quantities, (b) Turbulence Quantities,(c) Mean Values Along the Edge of theSplitter Plate.
2 Concentration Fluctuations in Axial Direction. 9
3 Mixing Layer Thickness in Axial Direction. 10
4 Eddy Spacing in Axial Direction. 11
5 Pdf of Concentration in Axial Direction. 12
I6 Pdf of Velocity in Region 2. 13
7 Mixedness M(x) in Axial Direction. 14
8 Inlet Boundary Conditions: (a) Mean Quantities, 17-18(b) Turbulence Quantities.
9 (a) Axial Variation of Mean Quantities, 19-20(b) Axial Variation of Turbulence Quantities.
10 (a) Radial Variation of Mean Quantities, 21-22(b) Radial Variation of Turbulence Quantities.
11 Radial Variation of Complex Turbulence 23Quantities.
12 Inlet Boundary Conditions: (a) Mean 26-27Quantities, (b) Turbulence Quantities.
13 Axial Variation of Jet Spreading Rate. 28
I vii
LIST OF TABLES(Continued)
TABLE PAGE NO.
14 (a) Radial Variation of Mean Quantities, 29- 0(b) Radial Variation of Turbulence Quantities.
15 Radial Variation of Complex Turbulence 31Quantities.
16 Correlations of Joint Radial Velocity- 32Concentration Pdfs.
17 Inlet Boundary Conditions in the Presence 33-34of Freestream Turbulence: (a) Mean Quantities,(b) Turbulence Quantities.
18 Radial Variation of Turbulence Quantities. 35
19 Axial Variation of Turbulent Scalar Flux vc. 36
20 Radial Variation of Complex Turbulence 37~Quantities.
21 Correlations of Joint Radial Velocity- 38Concentration Pdfs.
22 Spectral Development of the Round Jet in an 39Axial Direction.
23 Temperature Profile Through the Flame in 42Axial Direction.
24 Radial Profile of Mean Velocity and 43Temperature.
viii

LIST OF TABLES(Concluded)
TABLE PAGE NO.
25 Axial Profile of Turbulence Quantities. 44
26 Radial Profile of Turbulence Quantities. 45
27 Variation of Scalar Fluctuations and 46Dissipation Through the Flame.
28 Pdf of Temperature Through the Flame. 47
29 Inlet Boundary Conditions: (a) Mean 50-51Quantities, (b) Turbulence Quantities.
30 Centerline of Mean and Turbulence Quantities 52Along the Axis.
31 Radial Profiles of Mean and Turbulence 53Quantities in the Vicinity of the StagnationPoint.
32 Radial Profiles of Reynolds Shear Stress, 54Skewness, and Kurtosis in the Vicinity ofthe Stagnation Point.
.Jix

SECTION 1
INTRODUCTION
Computer models that predict turbulent mixing and combustion
processes in practical combustion systems suffer from numerous
limitations, deficiencies, and errors. This has created an urgent
need for a bench-mark quality data base to validate and refine
these models. With that broad goal in mind, the U. S. Air Force
Wright Aeronautical Laboratories, Aero Propulsion Laboratory
(AFWAL/PO) in early 1983 initiated a five-year program of
research with the University of Dayton Research Institute (UDRI).
This program had three principal objectives: (1) to develop a
combustion test facility and optical diagnostics; (2) to perform
turbulent mixing and combustion experiments; and (3) to provide a
data base for modeling needs.
.In I of this final report, experimental studies on
turbulent mixing and combustion were described. VolumeI
contains bench-mark quality data recorded in these experiments.
Specifically, data are t-bulated for three variable-density, non-
reactive turbulent mixing experiments: (1) 2-D Mixing Layer, (2)
2-D Slot Jet/Centerbody, and (3) Round Jet; and two turbulent
combustion experiments: (1) Scalar Fluctuations in Premixed
Flames, and (2) Conical Flame Stabilizer Experiment.
All data were obtained in the Fundamental Combustion
* Laboratory Facility located in Building 490, Room 153 of
AFWAL/PO, Wright-Patterson Air Force Base, Ohio. Most of the data
were interpreted and published in a total of 22 papers in the
open literature. The Appendix to Volume I of this final report
* lists all the publications.
Our format for data base documentation was developed as per
the recommendations laid out in a report AFOSR-TR-85-0880 by
1

Strahle and Lekoudis [1]. Briefly, this report suggested the
following requirements for data tabulation:
(1) Specify the test configuration and test conditions,
(2) Provide a set of inlet boundary conditions which include
both mean and turbulence quantities,
(3) Provide a set of axial profiles of mean and turbulence
quantities,
(4) Provide one or more sets of radial profiles of mean and
turbulence quantities,
(5) Provide a set of data on complex turbulence parameters,
viz turbulent scalar fluxes and joint velocity-scalar
pdfs.
Accordingly, the experimental test configuration for each
set of tabulated data is sketched on a page immediately preceding
the respective data set. Test conditions and relevant references
are also specified. This information is followed by the
tabulation of inlet boundary conditions, axial profiles, radial
profiles, and finally complex turbulence quantities. The measured
turbulence quantities appear in the columns of individual tables.
In our experiments, axial and radial (or transverse)
components of velocity were obtained with a two-component LDA.
The principal dimensions of the LDA control volume were 30 pm x
200 pm, and the data sampling rates were as high as 8 kHz in cold
* flows and 3 kHz in flames. Scalar fluctuations were detected
using a LRS system. Here, the measurement volume was made as
small as 30 pm x 200 pm x 1000 pm. Sampling rates up to 5 kHz in
cold flows and 1 kHz in low-temperature flames were possible.
Measurements of turbulent scalar fluxes and joint pdfs of
2
Sa &7

velocity und scalar werp made by optically and electronically
integrating the LDA-LRS systems. Finally, a reactive Mie
scattering (RMS) and a schlieren system were used for flow
visualization in these experiments. No special or unusual
methods, in addition to those described above, were employed.
The tabulated measurements spanned a period from 1984
through 1987. During these experiments, data were checked both
for reproducibility and accuracy. The long-term repeatability of
measurements at selected locations was within 3 percent for LDA,
within 5 percent for LRS, and within 7 percent for the integrated
LDA-LRS measurements. As for accuracy, both mass and momentum
conservation tests were run, and these demonstrated that the
calculations, mass flowmeter readings, and optical measurements
agreed to within 4 percent to 7 percent, respectively.
These data tables may be used to evaluate and refine the
various computer modeling codes of turbulent mixing and
combustion.
3
A.

SECTION 2TURBULENT MIXING EXPERIMENTS
2.1 2-D Mixing Layer Experiment
A I TURBULINCr
,OREGION
LAMINAR - UNSTABLE .. '*P ~ GO
I FLOW 1ROLL -UP INTERFACE ITHICKENED BY GRIDITURBULENCE
~REGION __I
2-D LARGE SCALE COHEF4-ENT STRUCTURES
Figure 1. Development of a 2-D Mixing Layer Downstream of aSplitter Plate.
4
0 v

Test Conditions
(a) Flow parameters:
(1) U1 = 1.8 m/s, U2 = 1.2 m/s, U = 1.5 m/s, U/ U = 0.4,5 0 = 0.25 cm, Xt= 4.2 cm, Rex= 1605, 6t= 0.76 cm,
Re 305
(2) U1 = 2.1 m/s, U2 - 0.9 m/s, U = 1.5 m/s, U/ U = 0.8,60 = 0.25 cm, Xt = 2.2 cm, Rext = 1681, 6t = 0.4 cm,
Re =290
* (b) Specifications of turbulence grids:
Coarse grid(CG) Fine grid(FG)
Mesh, (mm) 2.54 16/in.
Diameter, (mm) 1.9 0.4
Open area, (%) 51 56
u / U, (%) 8 2.2L, (mm) 6 2.3
A, (mm) 1.8 1.3
Laminar flow existed with no grid present.
5
;I0

Table 1
Inlet Boundary Conditions.
(a) Mean Quantities
D = 1 cm, x/D = 0.15, z/D = 0, (1) air, (2) CO2 , No grid
y/D AUIU = 0.40 AU/U = 0.80U/U1 U/U C/Cl U/U U/U2 C/C2
0 0.180 0.220 0.85 0.201 0.241 0.870
0.1 0.830 0.874 0.88 0.950 0.88 0.920
0.2 0.975 0.963 0.98 1.047 1.100 0.975
0.3 1.045 0.980 1.0 1.101 1.150 1.0
0.4 1.120 1.100 1.0 1.190 1.20 1.0
0.5 1.100 1.120 1.0 1.108 1.273 1.0
0.6 1.053 1.040 1.0 1.001 1.105 1.0
0.7 1.010 1.010 1.0 0.925 1.087 1.0
0.8 0.980 1.003 1.0 0.915 1.010 1.0
0.9 0.880 0.950 1.0 0.873 0.665 1.0
1.0 0.301 0.416 1.0 0.373 0.330 1.0
,4

Table 1(Continued)
(b) Turbulence Quantities
D = 1 cm, x/D = 0.15, zID = 0, AU/U 0.80
(1) - air (2)-C0 2 1 All values are in percent
NG - No grid, FIG - Fine Grid, CGS - Coarse Grid
y/D NoGi Fine Grid Coars .__Grid
1U'1 u'/ 1U' ItJ u'/ I u'/ u'Ivi
0 0.18 0.22 1.02 8.21 0.41 0.96
0.1 0.23 0.31 1.83 8.11 0.31 1.18
0.25 0.47 0.55 2.23 7.6 0.55 0.97
0.37 0.58 0.48 2.81 6.85 0.48 1.10
0.50 0.60 0.65 2.32 8.33 0.65 1.12
0.63 0.52 0.43 2.43 8.76 0.42 1.24
0.75 0.48 0.33 1.90 6.75 0.33 1.07
0.87 0.62 0.38 2.25 7.32 0.38 1.18
1.00 0.41 0.40 2.72 7.81 0.40 1.21
7
-~EMU&

I
Table 1(Concluded)
(c) Mean Values Along the Edge of the Splitter Platex/D = 0.15, y/D = 0.0, AU/U = 0.40
z/D U/U0 C/C0 u'/u6 c'/cl
-0.5 0.33 0.25 1.14 1.21-0.4 0.91 0.78 1.12 1.07-0.3 0.98 0.98 1.0 1.0-0.2 1.0 1.02 1.04 1.05-0.1 1.04 1.02 1.07 1.100 1.00 1.00 1.0 1.00.1 1.07 1.00 1.03 1.070.2 1.03 1.00 1.04 1.0
0.3 0.90 0.97 1.0 1.040.4 0.85 0.78 1.07 1.130.50 0.25 0.28 1.17 1.23
8

Table 2
Concentration Fluctuations in Axial Direction.
y/D = z/D =0
All values of (c'/C are in percent)
x/D AU/U = 04 AU/U. = 0.8NG FG CG NG FG CG
0.15 7.5 - - 8.2 - -
0.50 10.2 10.8 11 13.1 12.0 18.0
1.0 16.2 16.3 16 15.0 15.5 22.5
1.5 18.1 19.1 20.1 21.0 20 25.5
2.0 25.3 23.2 21.2 26.2 28 28.5
2.5 26.2 24.5 22.1 28.1 30 28
3.0 27.5 26.7 23.2 30.2 31.2 27.3
3.5 28.0 26.5 24.2 28.3 27 26.1
4.0 28.5 27.0 25.7 27.0 26.5 25.5
4.5 28.5 27.0 25.2 27.5 25.3 24.2
5.0 28.0 27.5 24.0 25.0 24.2 23.2
5.5 27.3 27.0 24.0 24.3 24.1 21.5
6.0 26.8 26.5 23.5 23.3 23.5 20.3
a,
9
...6
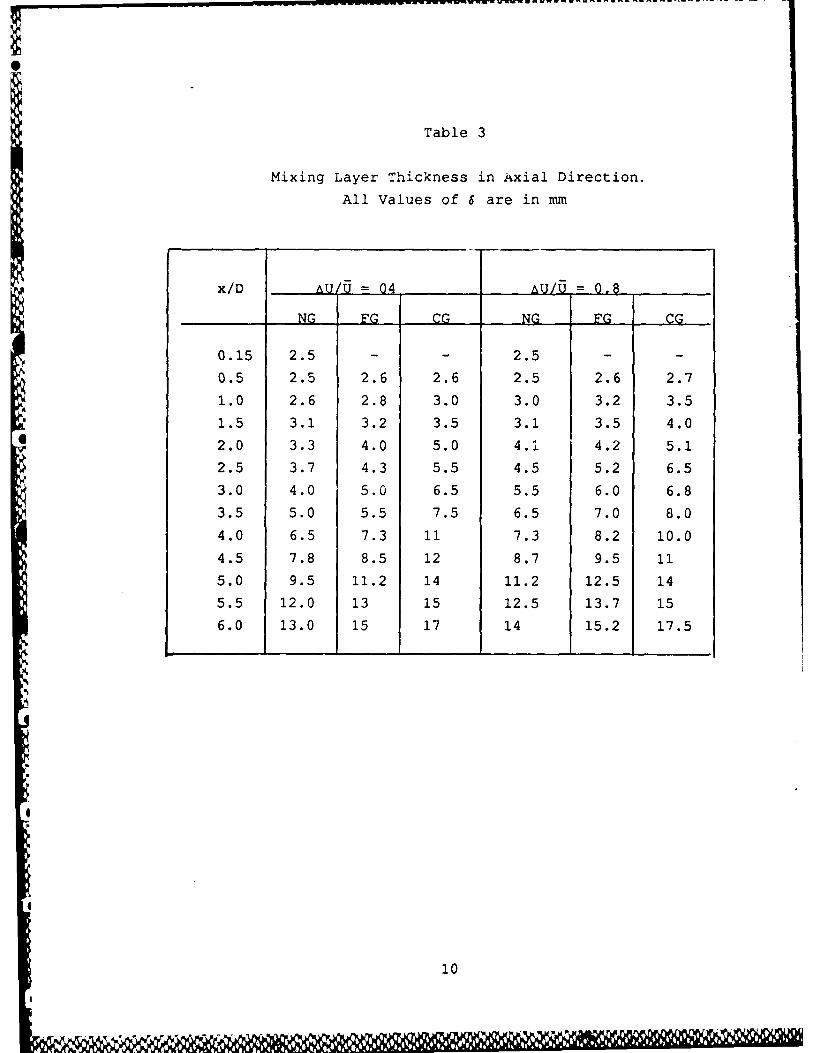
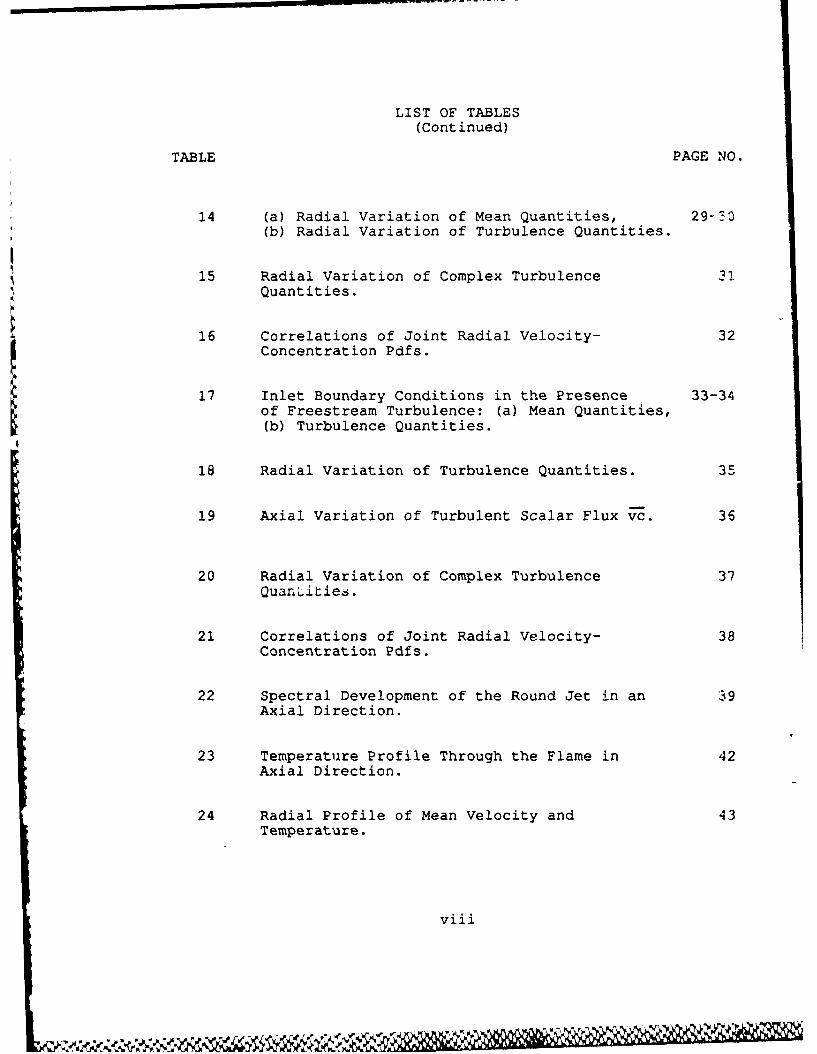
Table 3
Mixing Layer Thickness in Axial Direction.
All Values of 6 are in mm
x/D AU/U = 04 U/U =0.8
N ZG CG NG FG CG
0.15 2.5 - - 2.5 - -
0.5 2.5 2.6 2.6 2.5 2.6 2.7
1.0 2.6 2.8 3.0 3.0 3.2 3.5
1.5 3.1 3.2 3.5 3.1 3.5 4.0
2.0 3.3 4.0 5.0 4.1 4.2 5.1
2.5 3.7 4.3 5.5 4.5 5.2 6.5
3.0 4.0 5.0 6.5 5.5 6.0 6.8
3.5 5.0 5.5 7.5 6.5 7.0 8.0
4.0 6.5 7.3 11 7.3 8.2 10.0
4.5 7.8 8.5 12 8.7 9.5 11
5.0 9.5 11.2 14 11.2 12.5 14
5.5 12.0 13 15 12.5 13.7 15
6.0 13.0 15 17 14 15.2 17.5
1
t1

Table 4
Eddy Spacing in Axial Direction.
Eddy spacing time scale in msec.
x/D AU/U = 04 nlu/= 0.8
NG FG CG NG FG CG
0.15 - - - - -
0.5 7.0 8.2 8.5 7.1 7.5 8.1
1.0 7.0 8.1 8.6 8.1 8.0 8.0
1.5 7.5 8.0 8.0 8.0 7.9 7.8
2.0 7.4 8.0 9.0 8.3 8.0 7.9
2.5 8.0 8.1 7.9 9.1 8.0 8.0
3.0 8.0 8.1 8.2 8.5 8.0 8.1
3.5 8.1 8.2 8.5 8.0 8.5 8.5
4.0 8.0 7.8 8.1 8.0 8.7 9.3
4.5 7.9 7.9 8.0 7.8 8.0 8.8
5.0 7.8 8.3 8.0 7.7 7.9 8.3
5.5 8.0 8.1 8.1 9.0 7.8 8.1
6.0 8.0 8.2 7.8 8.3 8.0 8.5
Table 5
Pdf of Concentration in Axial Direction.
Values of P(c) at AU/U = 0.8, y/D = z/D = 0
/D 0.5 2.5 4.5 5.5 6.0 7.0
¢
0 - 2.2 3.3 4.3 1.20 1.3
0.1 0.12 2.0 2.7 0.5 0.75 1.1
0.2 0.21 1.7 3.5 1.5 2.1 3.0
0.3 0.25 1.0 2.4 2.3 3.0 4.2
0.4 0.80 1.0 1.0 3.0 3.8 3.2
0.5 4.0 2.0 0.35 2.7 4.2 2.5
0.6 3.5 2.7 0.25 2.0 3.7 2.2
0.7 1.5 3.0 0.20 1.0 2.8 1.9
0.8 0.5 2.5 2.8 1.0 1.75 1.5
0.9 0.25 1.4 3.3 1.7 0.70 0.83
1.0 0.0 0.50 3.8 2.0 0.41 0.50
12
P0 'l1119 11 1 1111 11 1

Table 6
Pdf of Velocity in Region 2.
AU/U = 0.8, x/D = 4.5
P(c) is expressed in fraction of samples/AU
u P(c) U P(c) u P(c)
0.6 0 0.85 4.5 1.1 0.50
0.65 0.1 0.90 5.5 1.15 0.25
0.70 0.25 0.95 3.5 1.20 0.20
0.75 0.75 1.00 2.5 1.25 0.10
0.80 2.5 1.05 1.20
13
.0 .. ..

Table 7
Mixedness M(x) in Axial Direction.y/D = z/D 0
x/D AUU = 04 AU/U 8 QNG FG CG NG F"G CG
0.15 0.90 - - 0.88 - -
0.50 0.80 0.78 0.75 0.85 0.67 0.68
1.0 0.72 0.70 0.70 0.75 0.65 0.65
1.5 0.67 0.65 0.63 0.67 0.62 0.62
2.0 0.63 0.62 0.62 0.60 0.55 0.55
2.5 0.55 0.58 0.62 0.55 0.52 0.52
3.0 0.52 0.53 0.60 0.50 0.50 0.50
3.5 0.50 0.52 0.62 0.50 0.52 0.55
4.0 0.50 0.53 0.63 0.50 0.55 0.57
4.5 0.50 0.53 0.65 0.48 0.55 0.60
5.0 0.52 0.55 0.65 0.52 0.50 0.62
5.5 0.55 0.57 0.66 0.53 0.57 0.65
6.0 0.57 0.60 0.67 0.50 0.57 0.67
14

2.2 2-D Slot Jet/Centerbody Experiment
FAR FIELD (3)
IL
46 ( JETA t FLAPING
"U IELo (2)
2~~ *sYWTuIC "ITEXPAT TEN
VIOLDI VQIMTITNIG
SPAfTTEN
, POTM IALCOE(1
SHtM Vol
MY~g To AU
~Figure 2. Sketch Illustrating (a) Flow Structure of a 2-D
, Slot Jet/Centerbody Configuration (b) 2-D Slot0. Jet/Centerbody Configuration.
015T CL

0
N
I~S
* Test Conditions
Slot wiIth =3 mm, Slot aspect ratio =50, U. =3 mIs,V JRe. = 1200, U = 0.3 m/s, Density ratio = 1.5, x/D up toj a
30.
4-
4-4.
0
Ja.
V
S
4/
a'
4--p
.4.0
16-~ai
0
~**I.4 p

Table 8
Inlet Boundary Conditions.
(a) Mean Quantities at x/D = 1.0, z/D = 0
U-U V/U y/D C/C
y/Dj jU -Uj a
0 1.0 -0.01 0 1.0
0.5 0.8 -0.01 0.1 0.98
1.0 -0.2 -0.007 0.2 0.95
* 1.5 -0.25 -0.008 0.3 0.90
2.0 -0.175 -0.007 0.4 0.85
2.5 -0.10 -0.005 0.5 0.80
3.0 -0.05 -0.002 0.6 0.50
3.5 -0.025 0.0 0.7 0.30
4.0 -0.01 0.0 0.8 -
4.5 -0.005 0.0 0.9
5.0 0.0 0.0 1.0
~~1'
SI.
I
4.

Table 8(Concluded)
(b) Turbulence Quantities at x/D = 1, z/D = 0
All values are in percent.
y/D u'IUj v'/Uj c'/Cj uv/U2
0 2.5 1 2.5 0.5
0.2 5 2.5 5.3 1.50.4 7.2 5.0 7.5 4.1
0 0.6 12.5 7.4 12.8 6.1
0.8 18 14 16.2 4.4
1.0 12.8 5.0 2.8 3.1
1.2 5.0 3.3 2.1 2.1
1.4 3.2 2.8 1.8 1.6
1.6 2.5 1.5 - 1.3
1.8 2.0 1.0 1.1
2.0 1.8 1.0 0.72
18

Table 9
(a) Axial Variation of Mean Quantities.
y/D = z/D = 0
x/D (U-U a/Uj-U a ) C/C. r u/D r c/D
0 0.82 0.65 0.55 1.5
5 0.75 0.60 0.80 1.7
10 0.65 0.55 1.7 2.5
15. 0.60 0.48 2.2 3.4
20 0.55 0.40 3.4 3.8
25 0.50 0.37 4.2 4.5
30 0.40 0.33 4.5 5.2
35 0.37 0.30 4.8 5.5
40 0.33 0.30 5.1 6.0
45 0.31 0.28 5.5 6.8
50 0.30 0.25 6.3 7.6
55 0.28 0.25 7.0 8.5
60 0.25 0.23 7.6 -
1._,5

Table 9(Concluded)
(b) Axial Variation of Turbulence Quantities.
y/D = z/D = 0
x/D S K Sct
0 -1.0 2.5 0.405 -2.5 8.7 0.45
10 -1.7 5.5 0.6515 -0.08 5.0 0.68
20 -0.05 3.7 0.70* 25 -0.08 4.0 0.70
30 -1.0 4.0 0.70
35 - - 0.72
40 - - 0.70
45 - - -
50 - - -
55 - - -
60 - - -
I
20
LI g- v

Table 10
(a) Radial Variation of Mean Quantities.
x/D = 8 x/D 30
y/D U-U V/U. C/Cj U-Ua S K C/C.
U j-U a Uj-U a
0 0.8 0.35 0.60 0.37 -0.2 5.0 0.33
0.5 0.20 0.25 0.61 0.35 -0.5 3.3 0.30
1.0 0.0 0.10 0.60 0.33 -0.8 3.0 0.28
1.5 -0.1 0.50 0.55 0.25 -0.8 2.9 0.25
2.0 -0.1 0.02 0.40 0.22 -0.6 2.8 0.22
2.5 -0.08 0.10 0.30 0.15 -0.5 3.2 0.20
3.0 -0.08 0.15 0.20 0.10 -0.35 4.0 0.15
3.5 -0.05 0.20 0.15 0.08 0.15 4.5 0.10
4.0 -. 0.02 0.22 0.10 0.05 0.0 5.0 0.08
4.5 -0.01 0.25 0.08 0.02 0 4.8 0.07
5.0 0.00 0.26 0.075 0.0 0 5.2 0.05
2
4
12
42

Table 10(conlcluded)
(b) Radial Variation of Turbulence
Quantities.
AlI v'alues are in percent-
DD =2
/D u /Tj v/U c I/C T-u IU r/Ui C/
016 16 17.5 4.1 11.2 '75 7.1 2.5
00. 1i20
1 6.2 1.5 8.1 6.5 4.1
0.0 197 23.0 2. 8.5 10.1 8.2 6.2 5.1
9.1 592.
01 . . .5 6.1
1.5 18 25 21.'9. 9.5 9.8 .5 6.15.
2.0 16.5 13 20.5 8.5 9 . .1 '7.0
2.5 10.2 5 16.3 6.2 8.2 .8 .1 7.0
3.0 4.1 2 12.2 2.8 7 . 7 .4 .7 6.0
3.3 3.3 1.7 '. 156.5 6.5.1
5.3
4.0 2.2 1.0 5.3 1.1 3.5 6.3. .1
15 10 2.5 0.81 2.4 6.0 1.5 3.
450 .5 1. .0 0.72 2.0 5.1 1.0 2.1
or rk, qS4
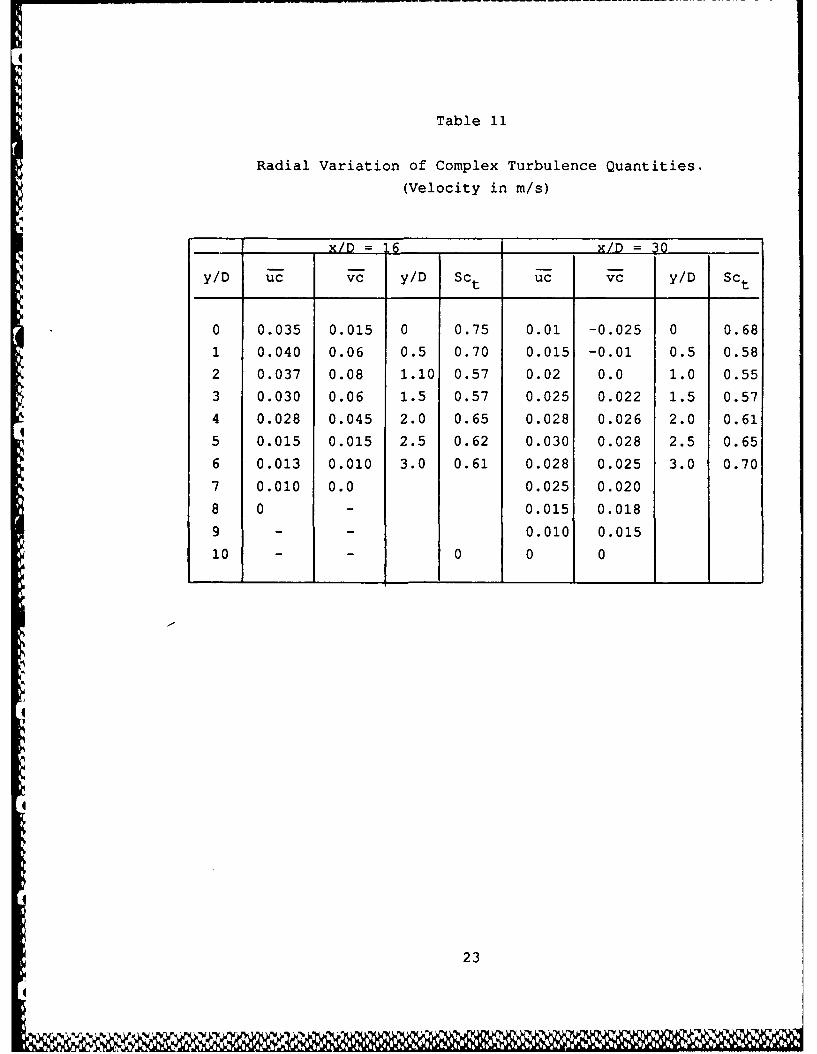
Table 11
Radial Variation of Complex Turbulence Quantities.
(Velocity in m/s)
x/D = 16 X/D) = 30
y/D uc vc y/D SC uc vc y/D Sct
0 0.035 0.015 0 0.75 0.01 -0.025 0 0.68
1 0.040 0.06 0.5 0.70 0.015 -0.01 0.5 0.58
2 0.037 0.08 1.10 0.57 0.02 0.0 1.0 0.55
3 0.030 0.06 1.5 0.57 0.025 0.022 1.5 0.57
4 0.028 0.045 2.0 0.65 0.028 0.026 2.0 0.61
5 0.015 0.015 2.5 0.62 0.030 0.028 2.5 0.65
6 0.013 0.010 3.0 0.61 0.028 0.025 3.0 0.70
7 0.010 0.0 0.025 0.020
8 0 - 0.015 0.018
9 - 0.010 0.015
10 - 0 0
23
I/
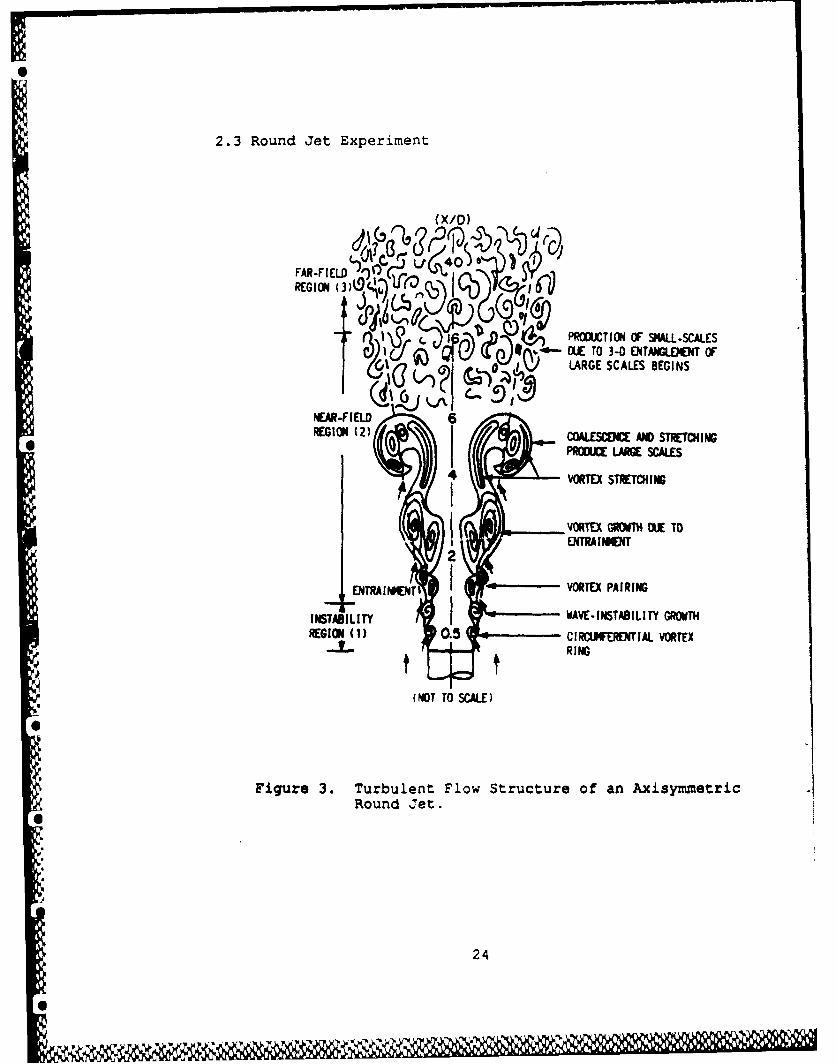
2.3 Round Jet Experiment
(X/D)
FAR-FE O~L44 'SREGION ADi ro 10
f - PROUIJCTION OF SIALL-SCALES1.- OUE TO 3-0 ENTA .GWOT OF
LIM LARGE SCALES BEGINS
NEAR-FIELD6REGION (2) COALESCEJCC AND STRETCHING6 PRODUCE LARGE SCALES
VORTEX STRETCHING
I VORTEX MROM~ MIE TO
ENTRAINIENT - VORTEX PAIRING
INSTABILITY I WAVE-INSTABILITY GROWTHREGION (1) 0.5 CIR NFERENTIAL VORTEX
RING
(NOT TO SCALE)
Figure 3. Turbulent Flow Structure of an AxisymmetricRound Jet.
24
6

Test Conditions
(a) Low-turbulence coflowing airstream:
Nozzle diameter = 1 cm, U = 8 m/s, Ua= 2 m/s, Re= 7600,
U/U = 1.2, U = 5 m/s, Jet and coflowing air turbulence at
the nozzle exit are 0.75 percent and 0.5 percent respectively.
(b) High-turbulence coflowing airstream:
Specifications of turbulence grid: Mesh size = 4.75 mm, Hole
diameter = 3.55 mm, Open area = 51%, turbulence intensity =
6%, turbulence integral scale = 5 mm.
25

Table 12
Inlet Boundary Conditions.
(a) Mean Quantities
xlD = 0.3 X/_ = 4
r/D (U-U a/Uj-U a ) V/Uj C/C. (U-U a/Uj-U ) V/U C/Cj
0 1.0 0.25 1.0 1.0 0.27 0.80
0.25 1.0 0.20 0.90 0.90 0.25 0.72
0.50 0.0 0 0.10 0.50 0.20 0.51
0.75 -0.15 -0.1 0.05 0.10 0 0.221.0 -0.10 -0.05 0 -0.05 0.05 0.03
1.25 -0.05 0 0 -0.025 0.025 0
1.50 -0.03 -0.01 - -0.01 0.01 0
1.75 -0.01 -0.01 - 0 0 0
2.0 0 0 - 0 0
2.25 0 0 -- -
2.50 0 0 -
26
o - r4 W.
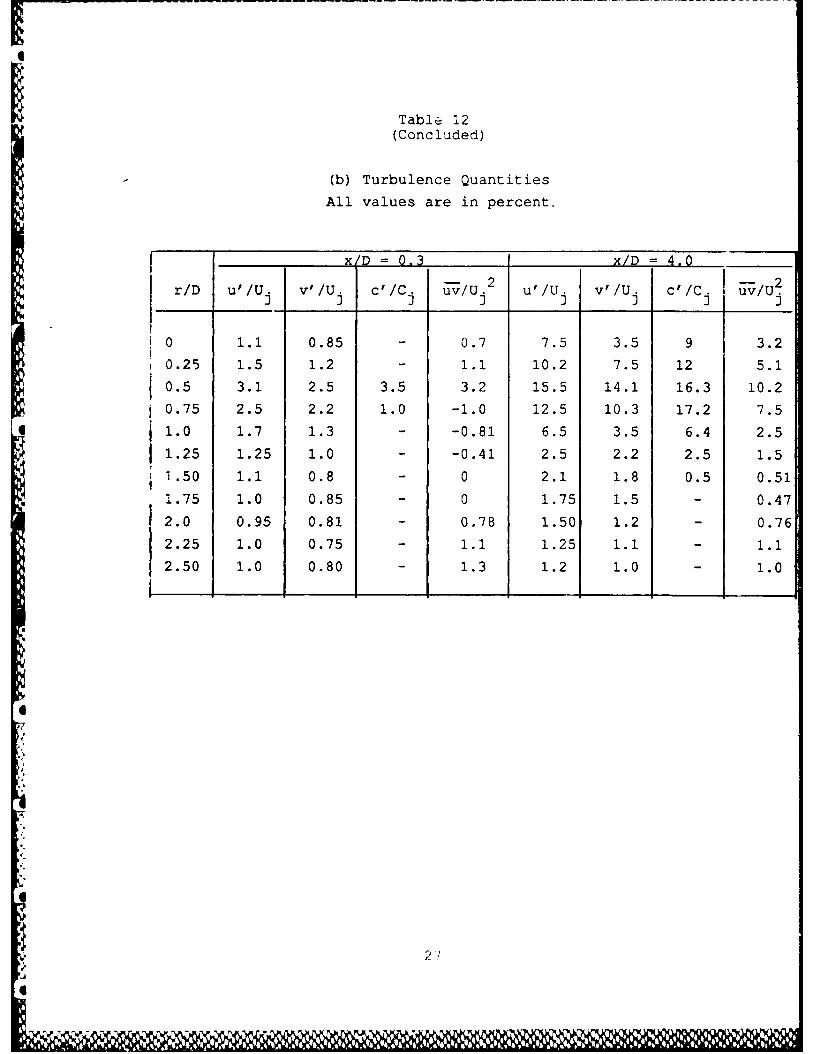
Table 12(Concluded)
(b) Turbulence Quantities
All values are in percent.
x/ /D =0.3 x/D =4,0
f/ f U2 ,/ I c ' C 1/U2r/D u'/Uj v'/Uj c'/C uv/Uj u'U v'U /C /
0 1.1 0.85 - 0.7 7.5 3.5 9 3.2
0.25 1.5 1.2 - 1.1 10.2 7.5 12 5.1
0.5 3.1 2.5 3.5 3.2 15.5 14.1 16.3 10.2
0.75 2.5 2.2 1.0 -1.0 12.5 10.3 17.2 7.5
4 1.0 1.7 1.3 - -0.81 6.5 3.5 6.4 2.5
1.25 1.25 1.0 - -0.41 2.5 2.2 2.5 1.5
1 .50 1.1 0.8 - 0 2.1 1.8 0.5 0.511.75 1.0 0.85 - 0 1.75 1.5 - 0.47
2.0 0.95 0.81 - 0.78 1.50 1.2 - 0.76
2.25 1.0 0.75 - 1.1 1.25 1.1 - 1.12.50 1.0 0.80 - 1.3 1.2 1.0 - 1.0
62
'6%P

Table 13
Axial Variation of Jet Spreading Rate.
(FST: Freestream Turbulence)
Low FST Hia FST
x/D ru/D rc/D (U-Ua/Uj-Ua) C/C. ru/D rc/L
0 0.5 0.55 1.0 1.0 0.40 0.61
2 0.51 0.60 1.0 0.95 0.53 0.65
4 0.52 0.65 0.95 0.80 0.55 0.67
6 0.55 0.70 0.90 0.67 0.60 0.70
8 0.60 0.75 0.80 0.60 0.64 0.82
1 10 0.71 0.92 0.75 0.53 0.71 0.93
12 0.85 1.0 0.61 0.42 0.80 1.0
14 0.90 1.1 0.54 0.35 0.91 1.12
16 1.0 1.15 0.50 0.32 0.95 1.15
_ 18 1.1 1.20 0.44 0.30 1.10 1.20
20 1.20 1.30 0.40 0.28 1.15 1.25
II
i
28
4
a-

Table 14
(a) Radial Variation of Mean Quantities.
xlD = 8 xlD = 16
rID U-U a/Uj-U ) C/C S K (U-U a/Uj-U ) C/Cj S K
0 0.90 0.65 0.10 3.1 0.55 0.375 0.22 3.2
0.25 0.82 0.50 0.15 3.0 0.51 0.33 0.21 3.3
0.50 0.55 0.40 0.22 3.2 0.45 0.31 0.25 3.3
0.75 0.30 0.32 0.31 4.75 0.33 0.27 0.24 3.1
1.0 0.12 0.15 0.15 3.3 0.27 0.22 0.28 3.01.25 0.0 0.10 0.10 3.5 0.22 0.14 0.21 3.1
1.50 0.0 0.05 0.05 3.1 0.13 0.12 0.22 3.3
Jq 1.75 - 0.0 0.05 3.3 0.05 0.14 3.00
2.0 - - 0.04 3.2 0.02 0.0 0.13 3.0
2.25 - 0.04 3.2 0.0 0.0 0.10 3.2
2.50 - 0.03 3.1 0.0 - 0.10 3.1
*2;,.
S.
'.
S,

W. Table 14
(b) Radial Variation of Turbulence Quantities.
All values are in percent.
__ _ _ _ __ _ x/D 8 _ _ _ - _ _ _ x/D = 16 _ __ _
rID u'/U. v'I/U c'/C. uv/u. u'/U. v'/tJ c'/C. uv/U
0 9.1 7.5 11.2 2.5 8.6 7.2 7.1 2.5
0.25 11 10.2 10.5 7.2 9.2 7.5 7.5 3.3
0.50 12.5 10.5 10.8 7.5 9.5 7.0 7.8 5.2
0.75 11.5 7.4 10.3 6.2 9.3 7.8 8.2 6.4
1.0 10.2 6.2 8.3 4.1 8.2 6.2 8.2 5.0
1.25 8.5 3.5 5.2 1.0 7.5 3.5 8.0 4.3
1.50 5.1 2.7 2.5 0 6.2 2.7 7.5 2.5
1.75 3.5 2.1 2.0 1.1 4.3 2.1 5.2 2.1
2.0 2.5 1.8 0.53 1.5 2.6 1.75 2.5 1.3
2.25 2.1 1.75 0.25 1.5 2.4 1.75 2.0 1.0
2.50 2.0 1.8 0.0
1.7 2.2 1.5 1.0 1.0
0V
03
*/K

Table 15
Radial Variation of Complex Turbulence Quantities.
(Velocity in m/s)
__.___D 8I = 16
r/D uc vc Sct uc vc Sct
0 0.05 0.11 0.55 0.09 0.02 0.70
0.25 0.08 0.11 0.60 0.13 0.075 0.74
0.50 0.12 0.13 0.62 0.14 0.083 0.80
0.75 0.14 0.12 0.67 0.15 0.090 0.82
1.0 0.13 0.09 0.72 0.15 0.05 0.85
6 1.25 0.075 0.05 0.71 0.125 0.026 0.85
1.50 0.042 0.022 0.72 0.075 0.020 0.80
1.75 0.025 0.015 0.73 0.025 0.010 0.8252.0 0.013 0.013 0.75 0.010 0.075 0.82
2.25 0.012 0.010 0.75 0.015 0.070 0.83
2.50 0.010 0.010 0.83 0.010 0.075 0.80
. 31
Id.'. . ," • ,- ,"," ." -' , ,: , . . " 5, p" "., "",%" "'% '%' , % * " " '° "' ' '

Table 16
Correlations of Joint Radial Velocity-Concentration Pdf-,
x/D = 4, rID = 5
V(m/s) C I C 2 C 3 C4
-2.4 0.22 ---
*-1.8 0.44 ---
-1.8 0.0 0.17 --
V-1.2 0.50 0.37 0.27 -
-1.2. 0.0 0.0 0.05 0.11
-0.6 0.50 0.40 0.33 0.23
-0.06 0.0 0.0 0.048 0.08
0 0.55 0.44 0.32 0.22
0 0.0 0.03 0.050 0.11
0.6 0.58 0.38 0.22 -
0.6 0.0 0.05 --
1.2 0.60 - --
1.2 0.11 - --
1.8 0.60 - --
1.8 0.22 - --
2.4 0.58 - --
2.~4 0.40 - -
32

Table 17
Inlet Boundary Conditions in the Presence ofFree-Stream Turbulence.
(a) Mean Quantities
x/D = 0,3 x/D 4.0
r/D (U-Ua /U.j-U a ) V/Uj C/C. S K
0 1.0 0.30 1.0 0 3.00.25 0.95 0.25 0.90 0.05 3.20.50 0.20 0.10 0.25 0.10 3.3
* 0.75 -0.05 -0.10 0.07 0.10 3.01.0 -0.025 -0.05 0 0 3.01.25 -0.01 -0.025 0 0 3.01.50 0 0 0 0 3.21.75 0 - 0 0.10 3.32.0 - - 0.50 3.02.25 - 0 3.0
2.50 - 0 3.0
U 33

Table 17(Concluded)
(b) Turbulence Quantities
All values are in percent
x/D = 0,3 x/D 4.0 4r/D u'/U i v'/UU uv/& u'/Uj v'/Uj c'/C. -u2/Uj
0 2.2 1.3 0 0 7.5 3.4 13.2 2.20.25 3.2 2.1 1.2 2.1 13.3 10.2 14.5 7.10.50 7.5 5.3 6.1 0 15.2 13.5 15.3 10.30.75 6.1 5.1 2.2 0 12.5 12.3 12.6 8.41.0 6.2 5.0 0.5 - 9.2 8.2 7.7 4.31.25 5.1 4.5 0 - 7.5 7.1 3.3 10.3
1.50 5.1 4.5 0 1.2 6.2 5.5 2.6 10.01.75 5.0 4.1 - 1.1 4.5 4.1 2.2 8.1
2.0 5.3 4.2 - 1.0 4.1 3.5 1.7 1.3
2.25 5.1 4.1 - 1.0 3.7 2.4 1.2 1.0
2.50 5.0 4.1 - 10 3.5 2.5 1.0 1.0
34

I
Table 18
Radial Variation of Turbulence Quantities.
x/D = 80
All values except those for S and K are in percent.
r/D v'/Uj c'/C. u/U S K
0 9.5 12.3 5.2 0 3.1
0.25 10.7 12.0 6.3 0.10 3.3
0.50 11.4 12.7 7.5 0.15 3.00.75 10.2 12.5 6.1 0.10 3.01.0 6.5 9.2 5.2 0.10 3.2
1.25 5.3 7.5 2.5 0.13 3.31.50 4.2 5.3 2.2 0.14 3.0
1.75 3.3 3.5 2.3 0.10 3.22.0 3.0 2.3 2.1 0.10 3.1
2.25 3.0 2.0 2.1 0 3.2
2.50 - 2.0 2.0 0 3.0
35
I
"f ft -

Table 19
Axial Variation of Turbulent Scalar Flux v-c.
x/D vc
0 0
2 0.15
4 0.13
6 0.122
8 0.105
10 0.09
12 0.085
14 0.08216 0.08
18
20
36
0~~~%W.;)r i"

Table 20
Radial. VNariation of Complex Turbulence Quantities.
x/D = 4.0 x/D = 8.0
/ u v uc vc
0 -0.04 0.0 0.005 0.003 -
0.2; -0.03 0.015 0.010 0.005 0.65
0.50 -0.015 0.03 0.017 0.015 0.70
0.75 -0.03 -0.01 0.021 0.017 0.75
1.0 -0.01 0.0 0.015 0.0125 0.78
1.25 0 0 0.005 0.010 0.79
1.50 0 0 0.004 0.013 0.78
1.75 - - - - 0.80
2.0 - - 0.80
2.25 - - 0.82
2.50 j - - 0.85
37

Table 21
Correlations of Joint Radial Velocity-Concentration Pdfs
x/D = 4, r/D = 0.5
v(m/s) C1 C2 C3
-2.10 0.22 - -
-1.80 0.40 - -
-1.80 0.05 - -
-1.50 0.44 - -
-1.50 0.0 0.20 -
-1.20 0.42 0.30 -
-1.20 -0.10 0.08 -
-09.0 0.50 0.32 -
-0.90 -0.10 0.0 0.11
-0.60 0.53 0.33 0.15
-0.60 -0.17 0.0 0.12-0.30 0.50 0.31 0.17
-0.30 -0.17 0.01 0.110.0 0.50 0.30 0.20
0.0 -0.15 0.05 -
0.3 0.50 0.20 -
0.3 0.0 - -
0.6 0.48 --
0 0.6 -0.10 -
0.9 0.48 --
0.9 0.11 -
1.2 0.33 -
1.2 - --
38

Table 22
Spectral Development of the Round Jet
in an Axial Direction.
(ao and as are the normalized amplitudes of fundamental
and sub-harmonic frequencies respectively)
x/D 0 s St0 StD Comments
0 - - 0.01 0.55 Nozzle exit
0.5 0.50 0.10 0.015 0.51
1.0 1.1 0.125 0.021 0.50 Vortex roll-up
1.5 0.75 0.37 0.032 0.45
2.0 0.52 0.50 0.040 0.42 Vortex pairing
2.5 0.37 0.62 0.042 0.38
3.0 0.25 0.81 0.050 0.35 Non-linear region
3.5 0.18 0.95 0.060 0.33 (x/D > 2)
4.0 0.10 1.0 0.072 0.32 Vortex merging
4.5 0.10 0.95 0.085 0.31
5.0 0.08 0.90 0.12 0.30 Axisymmetric instability
5.5 0.077 0.84 0.13 0.30 mode dominant
6.0 0.075 0.80 0.152 0.30
6.5 0.075 0.75 0.15 0.33
7.0 0.075 0.70 0.17 0.30
7.5 0.075 0.60 0.17 0.30
8.0 0.075 0.45 0.18 0.31
8.5 - 0.37 0.18 0.32
9.0 - 0.13 0.18 0.30 Helical instability
9.5 - - 0.18 - mode dominant
1 10.0 - - -
39
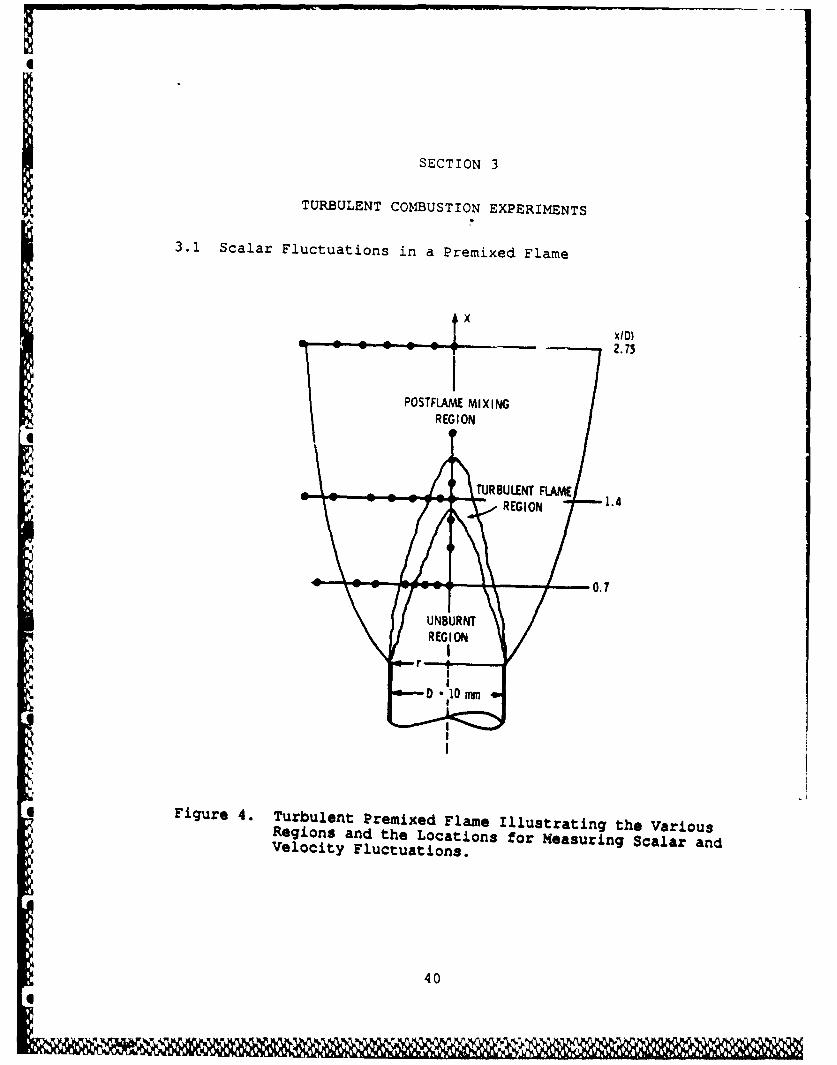
SECTION 3
TURBULENT COMBUSTION EXPERIMENTS
3.1 Scalar Fluctuations in a Premixed Flame
xID
2.75
POSTFLAME MIXINGREGION
M TURBULENT FLAME
REEINI1N
* Figure 4. Turbulent Premixced Flame Illustrating the VariousRegions and the Locations for Measuring Scalar andVelocity Fluctuations.
40

Test Conditions
Premixed methane-air flame
Nozzle Diameter = 1 cm, U - 2 m/s, u'/ U = 18%, L = 4 mm,Equivalence ratio, 0 = 1.4, T f =1880 K, S L =20 cm/s,
=6.5, u S SL =2, LI 'r >>1
44
I
= M= Illill41

Table 23
Temperature Profile Through the Flame in Axial Direction.
r/D = 0
x/D T/Tf
0.0 -
0.5 0.21
0.75 0.25
1.0 0.311.25 0.63
1.50 0.82
1.75 1.00
2.0 1.002.25 0.97
2.50 0.982.75 0.95
3.0 0.84
..44
a. 42
4
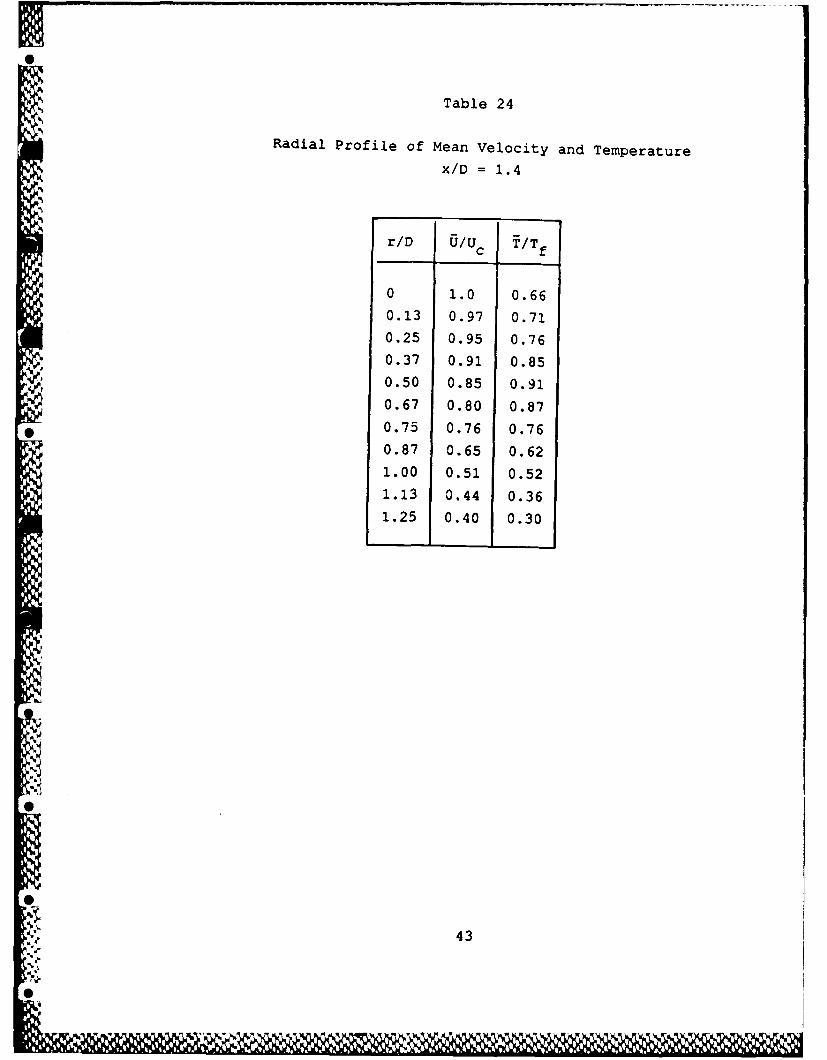
Table 24
Radial Profile of Mean Velocity and Temperature
x/D = 1.4
r/D U/Uc T/Tf
0 1.0 0.66
0.13 0.97 0.71
0.25 0.95 0.76
0.37 0.91 0.85
0.50 0.85 0.910.67 0.80 0.87
0.75 0.76 0.760.87 0.65 0.62
1.00 0.51 0.52
1.13 0.44 0.36
1.25 0.40 0.30
4

Table 25
Axial Profile of Turbulence Quantities.
r/D = 0, D = 1 cm
x/D u'/U(%) T'/Tf(%) L/D LT/D
0.25 - - -
0.50 17.5 2.5 - 0.31
0.75 18.2 5.4 0.15 0.38
1.0 18.3 10.0 0.27 0.40
1.25 18.5 13.5 0.41 0.45
1.50 19.3 34.7 0.44 0.51
1.75 18.5 16.2 0.52 0.44
2.0 18.0 153 0.55 0.41
2.25 17.5 14.2 0.53 0.36
2.50 17.2 13.7 0.55 0.33
2.75 16.8 13.2 0.54 0.34
3.0 17.0 13.5 0.53 0.35
44
B,
.1*.'

Table 26
Radial Profile of Turbulence Quantities.
x/D = 1.4
r/D u'/U(%) T'/Tf (%) AT/D
0 18.3 24.1 0.31
0.13 17.2 23.4 0.320.25 17.0 20.2 0.32
0.37 15.3 15.3 0.30
0.50 16.1 16.5 0.310.67 15.8 17.3 0.29
* 0.75 15.8 15.5 0.28
0.87 16.0 17.6 0.271.00 17.5 18.5 0.261.13 17.2 18.2 0.261.25 15.3 18.0 0.26
~45

Table 27
Variation of Scalar Fluctuations and Dissipation
Through the Flame.
c T'I/Tf xu Xuc Xu/Xt
0--
0.1 0.130 0.10 0
0.15 0.21 0.18 0.075
0.20 0.32 0.22 0.11
0.25 0.33 0.30 0.130.30 0.30 0.42 0.22
0.35 0.33 -0.45 0.27
0.40 0.29 0.62 0.42
0.45 0.275 0.63 0.45
0.50 0.28 0.66 0.55
0.55 0.25 0.67 0.63
0.60 0.23 0.71 0.60
0.65 0.21 0.71 0.620.70 0.18 0.70 0.63
0.75 0.17 0.70 0.60
0.80 0.15 0.73 0.62
0.85 0.10 0.67 0.58
0.90 0.10 0.60 0.460.95 0.050 0.50 0.38
* 1.00 - 0.45 0.30
46
0

Table 28
Pdf of Temperature Through the Flame.
r/D = 0 P(T) is given in 10- 2 /K
x/D = 0.7 x/D = 1.4 x/D = 2.0
T(K) P(T) T(K) P(T) T P(T) T(K) P(T)
250 0.05 350 1450 4.3 x 10- 2 1300 0
275 0.20 400 5 x 10⁻² 1500 3.0 1350 4 x 10⁻²
300 0.72 450 5.5 1550 3.2 1400 5.5
325 0.85 500 6.2 1600 3.2 1450 7.8
350 0.42 550 6.5 1650 3.5 1500 9.0
375 0.15 600 8.2 1700 4.0 1550 12.2
400 0.10 650 7.5 1750 6.5 1600 14.2
425 0.05 700 8.1 1800 10.5 1650 18.3
450 0.001 750 9.2 1850 11.3 1700 14.5
800 9.5 1900 10.5 1750 12.0
850 10 1950 4.2 1800 10.50
900 10.5 2000 3.3 1850 9.5
950 11.3 2050 2.2 1900 10.1
1000 9.7 2100 1.2 1950 10.5
1050 9.5 2150 1.2 2000 9.3
1100 8.2 2200 - 2050 -
1150 7.5 2100 -
1200 6.0 2150 -
1250 6.5 2200 -
1300 7.7
1350 8.6
1400 6.5
47

3.2 Conical Flame Stabilizer Experiment
FLAME4 SPREADINGSTAGNATION
WAKE PONN*NDR ELONGATED
RECIRCULATION
RECIRCULATION IT jZNREGIONCONICAL
STAWLIZER(a) COLD FLOWFIRLD (b) CON$SlTING PLOWPIELD.
Figure 5. Structure of the Recirculation Zone Downstream of aConical Flame Stabilizer Without and With Combustion.
48
P6d
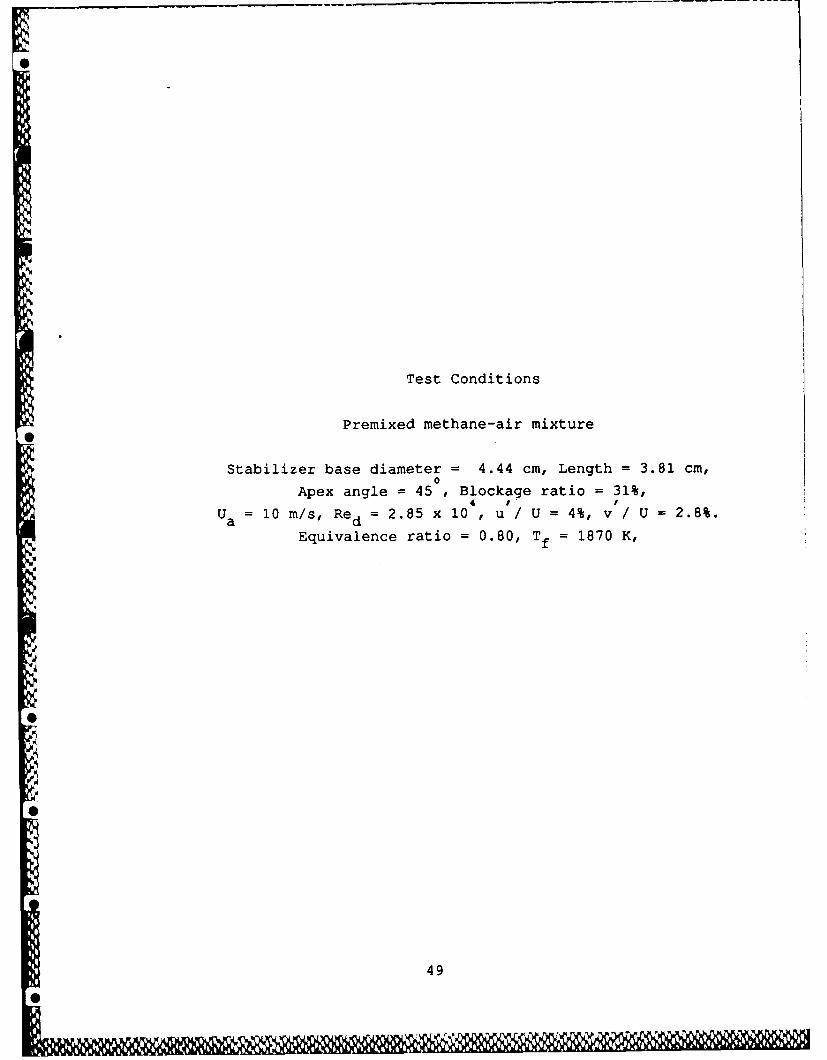
Test Conditions
Premixed methane-air mixture
Stabilizer base diameter = 4.44 cm, Length = 3.81 cm,o
Apex angle = 45 , Blockage ratio = 31%,
Ua = 10 m/s, Red = 2.85 x 10 , u / U = 4%, v / U = 2.8%.
Equivalence ratio = 0.80, Tf = 1870 K,
!49

Table 29
Inlet Boundary conditions.
(a) Mean Quantities
x/D = 0.05, z/D = 0
Cold Flow Combustion
r/D U/Ua V/Ua U/Ua V/Ua S K
0 -0.051 0 -0.10 0 0.03 3.1
0.11 -0.025 0.07 -0.075 0.10 0 3.0
0.22 -0.025 0.10 -0.075 0.15 0 3.3
0 0.33 0.0 0.12 -0.050 0.21 -0.05 2.9
0.44 0.05 0.14 0 0.22 -0.25 3.4
0.55 0.90 0.14 0.90 0.15 0.75 3.6
0.66 0.95 0.12 1.0 0.20 0 2.8
0.77 0.975 0.12 1.0 0.10 0.03 3.2
0.85 - - 1.0 0.10 0.03 3.1
1.00 - - 1.0 -
05
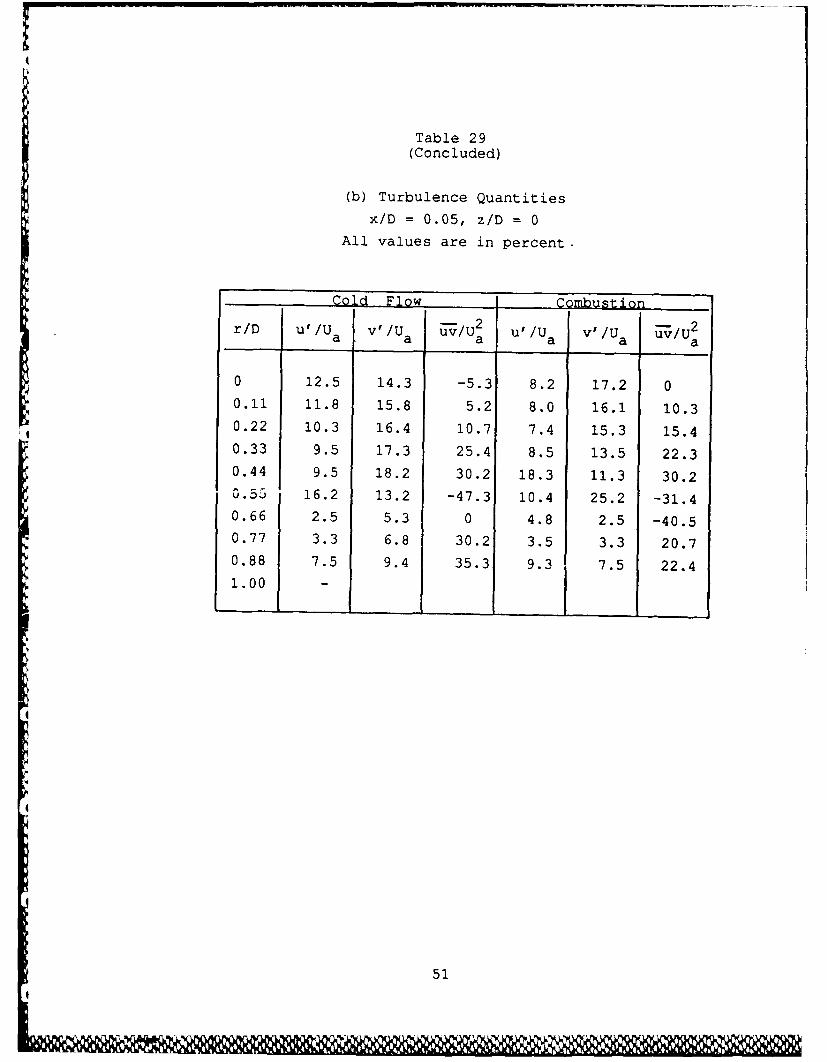
Table 29(Concluded)
(b) Turbulence Quantities
x/D = 0.05, z/D = 0All values are in percent.
r/D u'/U v'/U T/U 2 u'/U v'/U a 7/U2
a a a a a a
0 12.5 14.3 -5.3 8.2 17.2 00.11 11.8 15.8 5.2 8.0 16.1 10.30.22 10.3 16.4 10.7 7.4 15.3 15.40.33 9.5 17.3 25.4 8.5 13.5 22.30.44 9.5 18.2 30.2 18.3 11.3 30.2
0.5 16.2 13.2 -47.3 10.4 25.2 -31.40.66 2.5 5.3 0 4.8 2.5 -40.50.77 3.3 6.8 30.2 3.5 3.3 20.70.88 7.5 9.4 35.3 9.3 7.5 22.4
1.00
51

Table 30
Centerline of Mean and Turbulence Quantities
Along the Axis.
All turbulence quantities are given in percent.
Cold Flow .Combustion
2 I / 2x/D U/Ua u'/U a v'/Ua uv/Ua U/Ua u'/Ua v'/Ua v/U 2
0 0 10.5 - -5.3 0 10.2 16.5 -2.3
0.25 -0.3 12.4 10.0 -3.2 -0.40 14.5 10.4 -1.2
0.50 -0.42 15.3 17.5 0 -0.44 14.4 10.5 0
0.75 -0.32 13.5 20.3 0 -0.60 12.4 11.2 0
1.0 -0.11 13.3 25.2 0 -0.62 10.3 12.5 0
1.25 0.20 12.7 24.5 2.5 -0.65 10.0 12.4 1.3
1.50 0.50 12.2 21.2 1.4 -0.45 10.2 12.5 2.2
1.75 0.60 12.0 18.3 2.2 -0.20 10.2 13.2 0
2.0 0.65 12.2 17.5 0 -0.10 10.5 14.5 0
2.25 0.70 11.4 15.5 0 0 11.5 14.0 1.4
2.50 0.72 11.5 14.3 2.2 0.20 12.3 13.2 2.2
2.75 0.75 11.2 12.5 1.3 0.35 11.4 12.4 0
3.0 0.775 11.2 11.4 0 0.42 12.2 12.5 0
3.25 0.780 11 11.7 0 0.45 12.4 12.0 0
3.50 0.80 10.6 10.5 0 0.60 13.3 11.3 0
52
0!
! 52
0

Table 31
Radial Profiles of Mean and Turbulence Quantities
in the Vicinity of the Stagnation Point. (x/D = 2.0)All turbulence parameters are in percent.
rIDol Flow u' I '/a /UuU v'rD UUa Ua VIUa Ua UONa VNa
0 0.45 13.2 22.6 -0.25 11.3 13.30.11 0.52 14.1 21.3 -0.21 11.0 14.10.22 0.55 15.5 19.5 -0.22 15.4 15.0
*0.33 0.70 16.3 13.3 0 20.0 15.30.44 0.74 12.5 9.5 0.30 22.3 13.50.55 0.8 11.3 7.4 0.50 17.5 10.20.66 0.85 7.4 8.3 0.82 11.4 9.30.77 0.70 14.3 10.5 1.0 7.5 8.50.88 0.50 15.5 10.0 0.95 10.2 10.21.00 -
53
NII

Table 32
Radial Profiles of Reynolds Shear Stress, Skewness, and
Kurtosis in the Vicinity of the Stagnation Point (x/D 2.0)
Cold Flow Combustion
r/D uv/U (%) S K 7/U (%) S K
0 0 0 3.2 0.0 0.25 3.0
0.11 -20.3 0.05 3.1 -30.5 0.22 2.9
0.22 -45.2 -0.25 3.0 -55.5 0.23 2.8
0.33 -50.0 -0.70 3.3 -60.2 0.10 2.8
0.44 -30.5 -0.90 3.0 -53.2 -0.25 3.1
0.55 0 -0.94 3.9 -50.2 -0.40 3.1
0.66 20.5 -0.85 3.8 -25.3 -0.53 3.2
0.77 30.2 -0.25 3.0 20.2 -0.24 3.5
0.88 35.3 0.10 3.0 35.3 0.10 3.4
1.0 - - -
i
54
!, , A I

SECTION 4
CONCLUDING REMARKS
Developing a bench-mark quality data base for evaluating
and refining modeling codes of turbulent mixing and combustion
represents a significant experimental challenge. Clearly, this
work was a multifaceted effort involving fluid mechanics,
combustion, spectroscopy, computer software development, and data
interpretation. Skills and interests of several individuals were
brought together, and a series of experiments were completed over
an extended period of time and as per the recommendations of
AFOSR report number TR-85-0880.
Our work complements the experiments of Dibble and
*coworkers (2-4] at the Combustion Research Facility, Sandia
National Taboratories, Livermore, CA. First, we tested a variety
of flow configurations (e.g., mixing layer, slot jet, and a
conical flame stabilizer) in addition to the round jet. Second,we employed unique test conditions (grid-generated turbulence,
centerbody surrounding the slot jet, thick flame fronts, etc.) in
our experiments. Third, to simplify the development of computer
modeling codes, the axial pressure gradients in our flowfields
were negligible. Finally, to assist the development of direct
numerical simulation type of modeling codes [5,6] our experiments
were performed in the range of Reynolds number lower than those
* of Dibble and coworkers (2-4]. Thus, our measurements together
with those of Dibble and coworkers now provide a complete
spectrum of data sets of interest to modelers.
* We hope that these data sets will find widespread use in
evaluating, refining, and developing modeling codes of turbulent
'- mixing and combustion.
55..

REFERENCES
I] Strahle, W. C. and Lekoudis, S. G., "Evaluation of Dataon Simple Turbulent Reacting Flows," Technical ReportNo. AFOSR TR-85-0880, Air Force Office of ScientificResearch, Bolling Air Force Base, Washington, DCSeptember i985.
(21 Dibble, R. W., Hartmann, V., Schefer, R. W., andKollmann, W., "An Investigation of Temperature andVelocity Correlations in Turbulent Flames," SandiaReport No. SAND84-8860, Sandia National Laboratories,Livermore, CA, 1984.
[31 Dibble, R. W., Schefer, R. W., Johnston, S. C., Gouldin,F. C., and Kollmann, W., "Nonreacting Turbulent MixingFlows: A Literature Survey and Data Base," Sandia ReportNo. SAND86-8217, Sandia National Laboratories, Livermore,CA, April 1986.
[4] Dibble, R. W., Schefer, R. W., Hartman, V., and Kollman,W., "Simultaneous Velocity and Concentration Measurementsin a Turbulent Nonpremixed Flame," Sandia Report No.SAND85-8234, Sandia National Laboratories, Livermore, CA,July 1985.
[5] McMurty, P. A., Jou, W. H., Riley, J. J., and Metcalfe,R. W., "Direct Numerical Simulation of a Reacting MixingLayer with Chemical Heat Release," AIAA Journal, Vol. 24,pp. 962-970, 1986.
[6) Oran, E. S. and Boris, J. P., "Detailed Modeling ofCombustion Systems," Progress in Energy and CombustionScience, Vol. 7, pp.1-72, 1981.
56

NOMENCLATURE
BR Blockage ratio
C Concentration of CO2 (c-fluctuating value)
c Progress variable
D Jet/Burner diameter, slot width, base diameter
d Hole diameter
E Energy
f Frequency
* K Kurtosis
L integral length scale
M(x) Mixedness parameter
* P Probability density function
Re Reynolds number
r Radius, radial direction
S Burning velocity, Skewness
Sct Turbulent Schmidt number
St Strouhal number
T Temperature
t Time
U, V, W Mean velocities, (u, v, w - fluctuating values)
A Mean velocity defect
uv Reynolds shear stress
uc, vc Turbulent scalar fluxes
x, y, z Axial, transverse, and azimuthal directions
aSpectral amplitude
S Mixing layer, Flame front thickness
Equivalence ratio
A Turbulence microscale
1 0 Momentum thickness
* 57
I

Heat release rate parameter
p Density
Kinematic viscosity
Superscript
*" Mean value
Rms value
Favre-averaged value
Subscript
1, 2 Air, CO2 streams respectively
a Outer, Annulus airstream
f Flame
i, o Initial, fundamental value
j Jet exit value
L,t Laminar, turbulent value
r Reaction zone
s Subharmonic value
T Temperature
u, v Velocities
9 Momentum thickness
Abbreviations
* LDA Laser Doppler Anemometer
LRS Laser Raman/Rayleigh Spectroscopy
58
0

CG Coarse gridFG Fine grid
FST Freest ream Turbulence
Pdf Pobablitydensity functionPsdf owerspectral density function
0,
9.59
%V