Embed Size (px)
Citation preview

A series of potential measures published by the International Union of RailwaysJuly 2020
First estimation of the global economic impact of Covid-19 on Rail Transport
UIC COVID-19 TASK FORCE
MANAGEMENT OF COVID-19
3
MANAGEMENT OF COVID-19
978-2-7461-2961-0
Warning
All intellectual property rights related to the original English version of this document and the subsequent translations shall remain the exclusive property of UIC, these documents bearing the mention of UIC copyright.© International Union of Railways (UIC) - Paris, 2020
UIC hereby authorizes natural persons and companies to copy, reproduce and distribute by any means whatsoever, including electronic, this document, provided that these actions are made on a non-profitable basis. © International Union of Railways (UIC) - Paris, 2020
1.1.1 Contents
1. INTRODUCTION ................................................................................................................5
1.1 UIC Covid-19 Task Force .......................................................................................................5
1.2 Economic impacts of Covid-19 on rail transport ................................................... 6
1.3 Method ......................................................................................................................................... 6
2. RAIL PASSENGER SECTOR ............................................................................................ 8
2.1 Slow recovery scenario ........................................................................................................ 8
2.1.1 Year 2020 .................................................................................................................................................10
2.1.2 Year 2021 ................................................................................................................................................... 12
2.2 Quick recovery ........................................................................................................................ 13
2.2.1 Year 2020 ................................................................................................................................................. 13
2.2.2 Year 2021 ...................................................................................................................................................14
2.3 Summary of passenger losses ....................................................................................... 15
3. FREIGHT SECTOR ............................................................................................................ 17
3.1 Slow recovery scenario .......................................................................................................17
3.1.1 Year 2020 ................................................................................................................................................. 17
3.1.2 Year 2021 ...................................................................................................................................................19
3.2 Quick recovery scenario ...................................................................................................21
3.2.1 Year 2020 ................................................................................................................................................. 21
3.2.2 Year 2021 .................................................................................................................................................. 23
3.3 Summary of freight losses ............................................................................................. 25
4. ECONOMIC SUPPORT MEASURES ......................................................................... 26
4.1 Short-medium term ............................................................................................................27
4.2 Long-term .................................................................................................................................28
4.3 Summary of economic support measures ............................................................29
5. CONCLUSION ................................................................................................................... 30
4 5
MANAGEMENT OF COVID-19
EXECUTIVE SUMMARY
The UIC Covid-19 task force conducted a revenue impact analysis concerning the impact of the Covid-19 pandemic on the rail sector. The analysis is based on data provided by the UIC Covid-19 task force members, which were collected in May 2020 via questionnaires, and also from desk research carried out by the task force working group.
Owing to the severity of the lockdowns and other government-imposed restrictions, the travel limitations and the expected global recession associated with this historical and unprecedented economic crisis, and based on a slow recovery model, UIC estimates that passenger and freight revenues could lose up to $125 billion total for both 2020 and 2021. For a quick recovery model, i.e. a strong recovery in 2021, UIC estimates that passenger and freight revenues could lose up to $78 billion.
Whilst it is not clear whether the virus will develop further, whether a second or even a third wave will occur and involve additional losses, almost all rail undertakers have taken immediate measures to adapt their operations to maintain the minimum required capacity and to reduce all costs. UIC members have expressed their best practices in this regard, shared their expertise and experience in UIC Covid-19 dedicated workspace on UIC extranet https://extranet.uic.org/index.php where the six guidance documents published between February and August 2020 are made available online.
The rail sector is undergoing a historical, unprecedented crisis calling for governmental economic measures. Members have expressed a preference for direct financial contributions, although several other options could be contemplated: decreased access charge, decrease/elimination of VAT and other taxes, guarantee loans, fair level play field between all transport modes. Several governmental authorities have already expressed appropriate economic measures to be taken to support the rail sector, in line with the priority given to a rail sector competitive with other transport modes.
1. INTRODUCTION
1.1 UIC COVID-19 TASK FORCEIn February 2020, UIC set up a task force to work with its members, experts and rail transport associations to share and provide information in relation to the current crisis caused by the coronavirus (Covid-19) and its consequences for the rail transport sector. Shortly thereafter, the need for guidance led the task force to produce several operational documents.
In March, the first guidance document, “Management of Covid-19 - Guidance for railway stakeholders” was published, bringing together potential measures with the aim to assist railway stakeholders and provide reliable information about the specific challenges for rail when it comes to this communicable disease.
In April, a second guidance document, “Potential measures to restore confidence in rail travel following the Covid-19 pandemic,” was published, listing different measures that rail stakeholders could undertake in order to increase passengers’ feeling of security. In May, a third guidance document, “RAILsilience - How the rail sector fought Covid-19 during lockdowns,” was published, showing the situation during the lockdowns and the measures put in place by the rail sector during the epidemic control phase.
Management of Covid-19 A series of potential measures (March 2020)
Management of Covid-19 Potential measures to restore confidence in rail travel following the Covid-19 pandemic (April 2020
Management of Covid-19 RAILsilience - How the rail sector fought Co-vid-19 during lockdown (May 2020)
Management of Covid-19 RAILsilience - Back on the track (June 2020)
In June, a fourth document was published: “Management of Covid-19: RAILsilience, back on the track”, as the UIC Covid-19 Task Force members mobilized themselves envisioning how they could continue to be RAILsilient post-lockdowns, i.e. being prepared for the resumption in countries where governments required service restrictions, and if not, for an increase of passengers using trains. Another document covering the topics of “masks, ventilation and social distancing” clarifies the landscape of masks and their use, addresses the benefit of appropriate ventilation and their impact on social distancing, will be available soon.
All these guidance documents are made available online at: https://uic.org/covid-19.
6 7
MANAGEMENT OF COVID-19
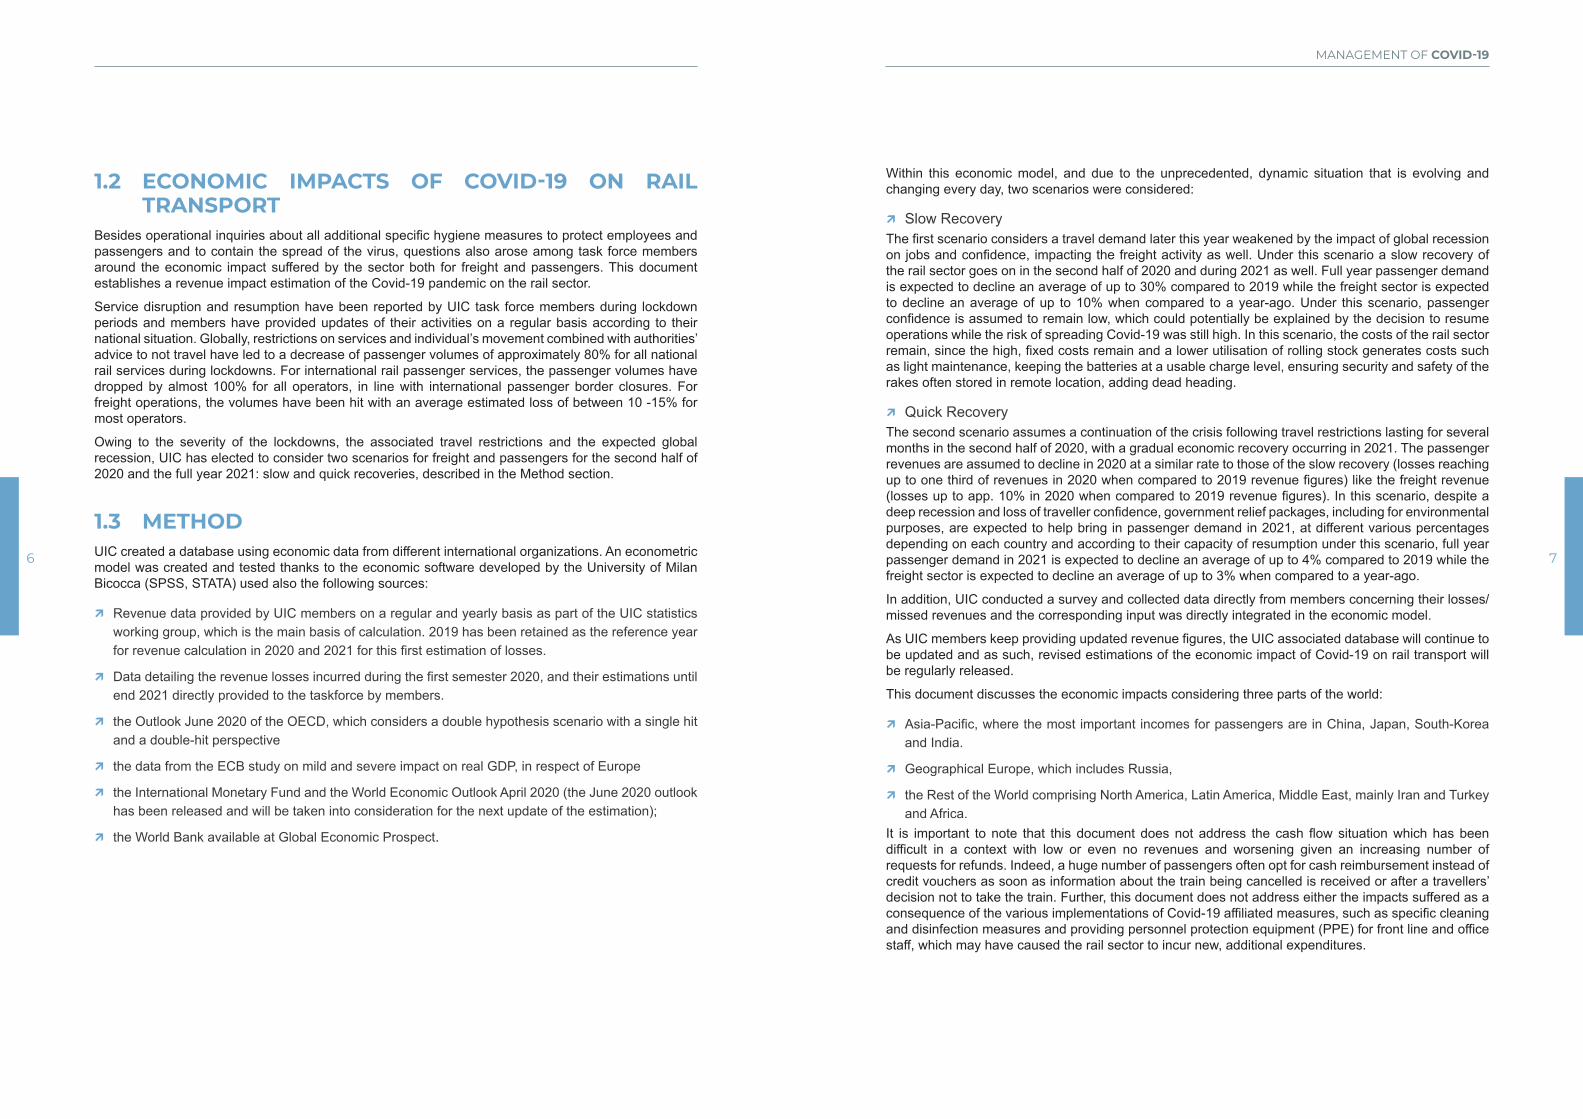
1.2 ECONOMIC IMPACTS OF COVID-19 ON RAIL TRANSPORT
Besides operational inquiries about all additional specific hygiene measures to protect employees and passengers and to contain the spread of the virus, questions also arose among task force members around the economic impact suffered by the sector both for freight and passengers. This document establishes a revenue impact estimation of the Covid-19 pandemic on the rail sector.
Service disruption and resumption have been reported by UIC task force members during lockdown periods and members have provided updates of their activities on a regular basis according to their national situation. Globally, restrictions on services and individual’s movement combined with authorities’ advice to not travel have led to a decrease of passenger volumes of approximately 80% for all national rail services during lockdowns. For international rail passenger services, the passenger volumes have dropped by almost 100% for all operators, in line with international passenger border closures. For freight operations, the volumes have been hit with an average estimated loss of between 10 -15% for most operators.
Owing to the severity of the lockdowns, the associated travel restrictions and the expected global recession, UIC has elected to consider two scenarios for freight and passengers for the second half of 2020 and the full year 2021: slow and quick recoveries, described in the Method section.
1.3 METHODUIC created a database using economic data from different international organizations. An econometric model was created and tested thanks to the economic software developed by the University of Milan Bicocca (SPSS, STATA) used also the following sources:
À Revenue data provided by UIC members on a regular and yearly basis as part of the UIC statistics working group, which is the main basis of calculation. 2019 has been retained as the reference year for revenue calculation in 2020 and 2021 for this first estimation of losses.
À Data detailing the revenue losses incurred during the first semester 2020, and their estimations until end 2021 directly provided to the taskforce by members.
À the Outlook June 2020 of the OECD, which considers a double hypothesis scenario with a single hit and a double-hit perspective
À the data from the ECB study on mild and severe impact on real GDP, in respect of Europe
À the International Monetary Fund and the World Economic Outlook April 2020 (the June 2020 outlook has been released and will be taken into consideration for the next update of the estimation);
À the World Bank available at Global Economic Prospect.
Within this economic model, and due to the unprecedented, dynamic situation that is evolving and changing every day, two scenarios were considered:
À Slow RecoveryThe first scenario considers a travel demand later this year weakened by the impact of global recession on jobs and confidence, impacting the freight activity as well. Under this scenario a slow recovery of the rail sector goes on in the second half of 2020 and during 2021 as well. Full year passenger demand is expected to decline an average of up to 30% compared to 2019 while the freight sector is expected to decline an average of up to 10% when compared to a year-ago. Under this scenario, passenger confidence is assumed to remain low, which could potentially be explained by the decision to resume operations while the risk of spreading Covid-19 was still high. In this scenario, the costs of the rail sector remain, since the high, fixed costs remain and a lower utilisation of rolling stock generates costs such as light maintenance, keeping the batteries at a usable charge level, ensuring security and safety of the rakes often stored in remote location, adding dead heading.
À Quick RecoveryThe second scenario assumes a continuation of the crisis following travel restrictions lasting for several months in the second half of 2020, with a gradual economic recovery occurring in 2021. The passenger revenues are assumed to decline in 2020 at a similar rate to those of the slow recovery (losses reaching up to one third of revenues in 2020 when compared to 2019 revenue figures) like the freight revenue (losses up to app. 10% in 2020 when compared to 2019 revenue figures). In this scenario, despite a deep recession and loss of traveller confidence, government relief packages, including for environmental purposes, are expected to help bring in passenger demand in 2021, at different various percentages depending on each country and according to their capacity of resumption under this scenario, full year passenger demand in 2021 is expected to decline an average of up to 4% compared to 2019 while the freight sector is expected to decline an average of up to 3% when compared to a year-ago.
In addition, UIC conducted a survey and collected data directly from members concerning their losses/missed revenues and the corresponding input was directly integrated in the economic model.
As UIC members keep providing updated revenue figures, the UIC associated database will continue to be updated and as such, revised estimations of the economic impact of Covid-19 on rail transport will be regularly released.
This document discusses the economic impacts considering three parts of the world:
À Asia-Pacific, where the most important incomes for passengers are in China, Japan, South-Korea and India.
À Geographical Europe, which includes Russia,
À the Rest of the World comprising North America, Latin America, Middle East, mainly Iran and Turkey and Africa.
It is important to note that this document does not address the cash flow situation which has been difficult in a context with low or even no revenues and worsening given an increasing number of requests for refunds. Indeed, a huge number of passengers often opt for cash reimbursement instead of credit vouchers as soon as information about the train being cancelled is received or after a travellers’ decision not to take the train. Further, this document does not address either the impacts suffered as a consequence of the various implementations of Covid-19 affiliated measures, such as specific cleaning and disinfection measures and providing personnel protection equipment (PPE) for front line and office staff, which may have caused the rail sector to incur new, additional expenditures.
8 9
MANAGEMENT OF COVID-19
2. RAIL PASSENGER SECTOR
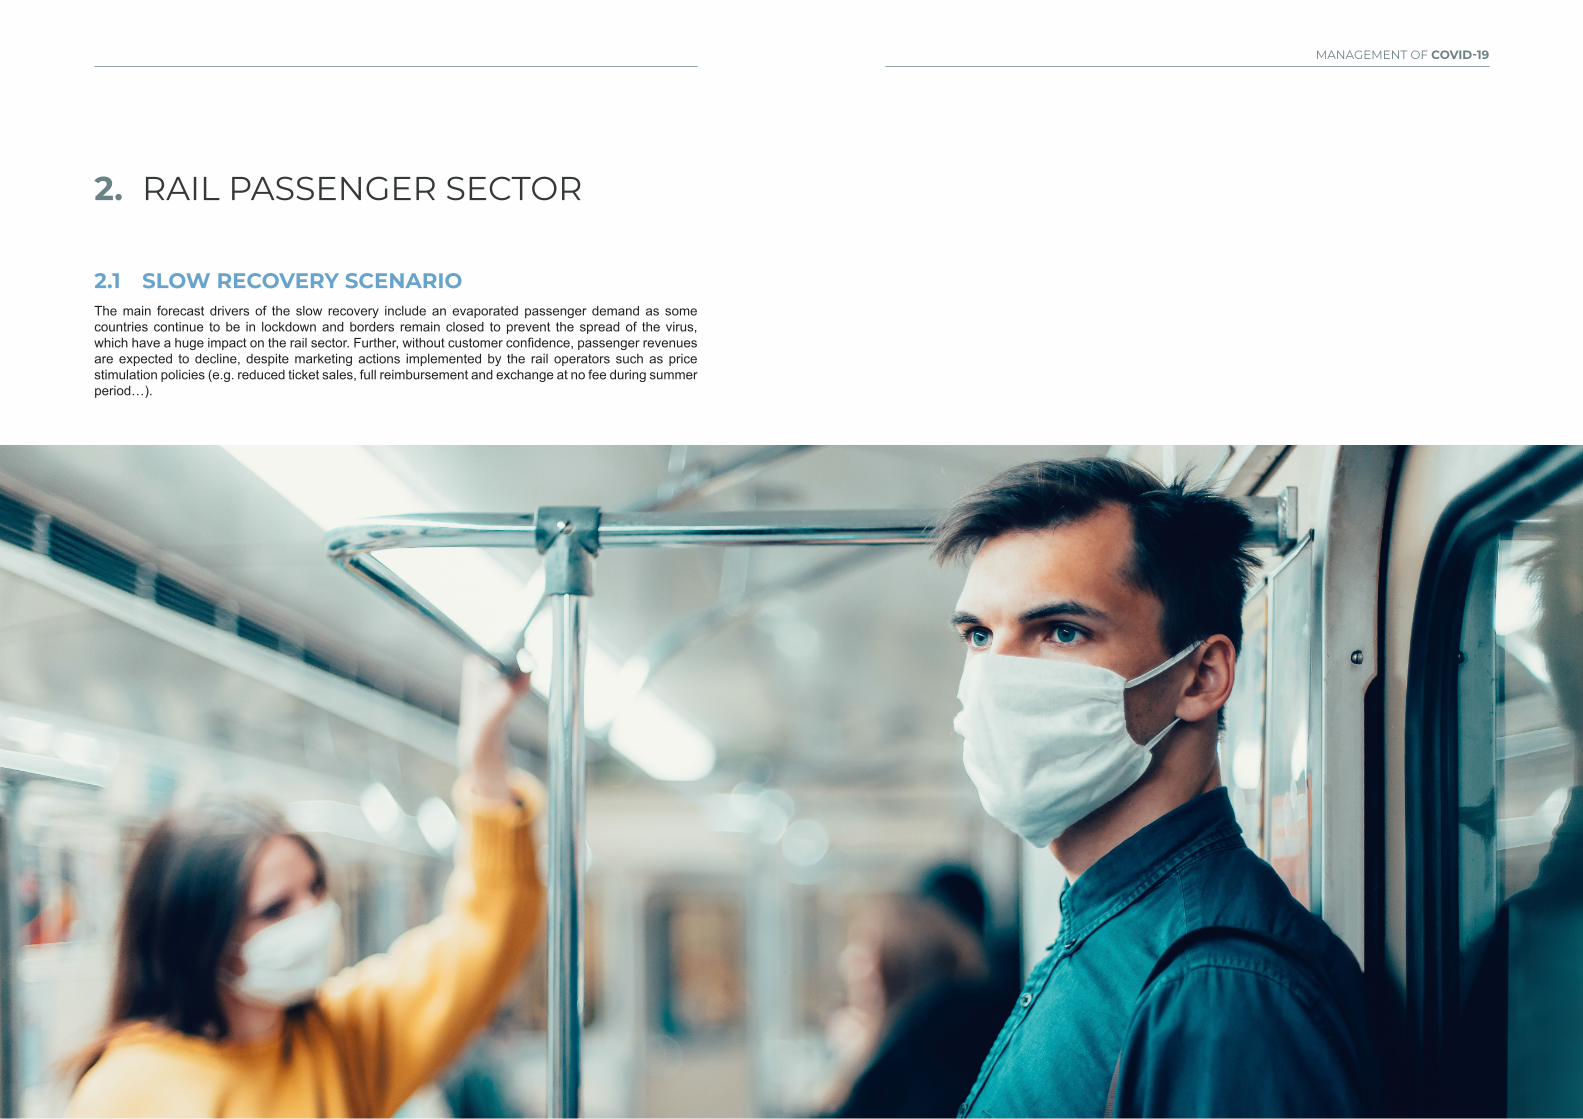
2.1 SLOW RECOVERY SCENARIOThe main forecast drivers of the slow recovery include an evaporated passenger demand as some countries continue to be in lockdown and borders remain closed to prevent the spread of the virus, which have a huge impact on the rail sector. Further, without customer confidence, passenger revenues are expected to decline, despite marketing actions implemented by the rail operators such as price stimulation policies (e.g. reduced ticket sales, full reimbursement and exchange at no fee during summer period…).

10 11
MANAGEMENT OF COVID-19
As seen above, while all regions will have losses in this scenario, the major part of missed revenues comes from Asia and Europe, where there is an already existing active passenger rail market. Indeed, Figure 3 demonstrates that 53 per cent of the losses are located in Asia, while 44 per cent are in Europe. Elsewhere in the world, losses are less significant as passenger rail does not play such a big role in the rail market.
Europe44%
Asia53%
Rest of the World
3%
Losses in passenger revenues in 2020
Figure 3: Percent of missed passenger revenues in 2020 by region, slow recovery scenario
Globally, the total passenger losses are estimated at $60 billion in 2020, and this slow recovery will continue to impact the business of passenger operators in 2021.
2.1.1 Year 2020Looking at the revenues, the estimate shows more than $36 billion of losses in the first semester 2020, and the decrease continues into the second semester, while having a lower impact, i.e. approximately $23 billion of missed revenues in the second part of the year, i.e. almost $60 billion in 2020 (Figure 1).
$ 36,10
$ 22,75
- €
10 €
20 €
30 €
40 €
50 €
1st Semester 2nd Semester
in b
illion
s
Losses in passenger revenues in 2020
Figure 1 Passenger missed revenues 2020 all regions combined
When the lost revenues are broken down by region, some differences can be noted (Figure 2). Asia being the first region to feel the impact of the Covid-19 crisis, the losses were immediate in the first half of 2020, more than $20 billion, but so is the recovery. The faster decrease of the losses in Asia is driven by the quicker recovery of China, an important player in the passenger sector in terms of revenues as reflected in the recent data communicated by China. The progressive re-opening of travel within Europe manages to boost the recovery in the second half of the year with losses down to $11 billion from $15 billion of the first part of the year.
$ 15,35
$ 19,83
$ 0,92
$ 10,79 $ 11,28
$ 0,68 $-
$ 5,00
$ 10,00
$ 15,00
$ 20,00
$ 25,00
Europe Asia Rest of the World
in b
illion
s
Losses in passenger revenues in 2020
1st Semester 2nd Semester
Figure 2: Passenger missed revenues 2020 per region, slow recovery scenario
12 13
MANAGEMENT OF COVID-19
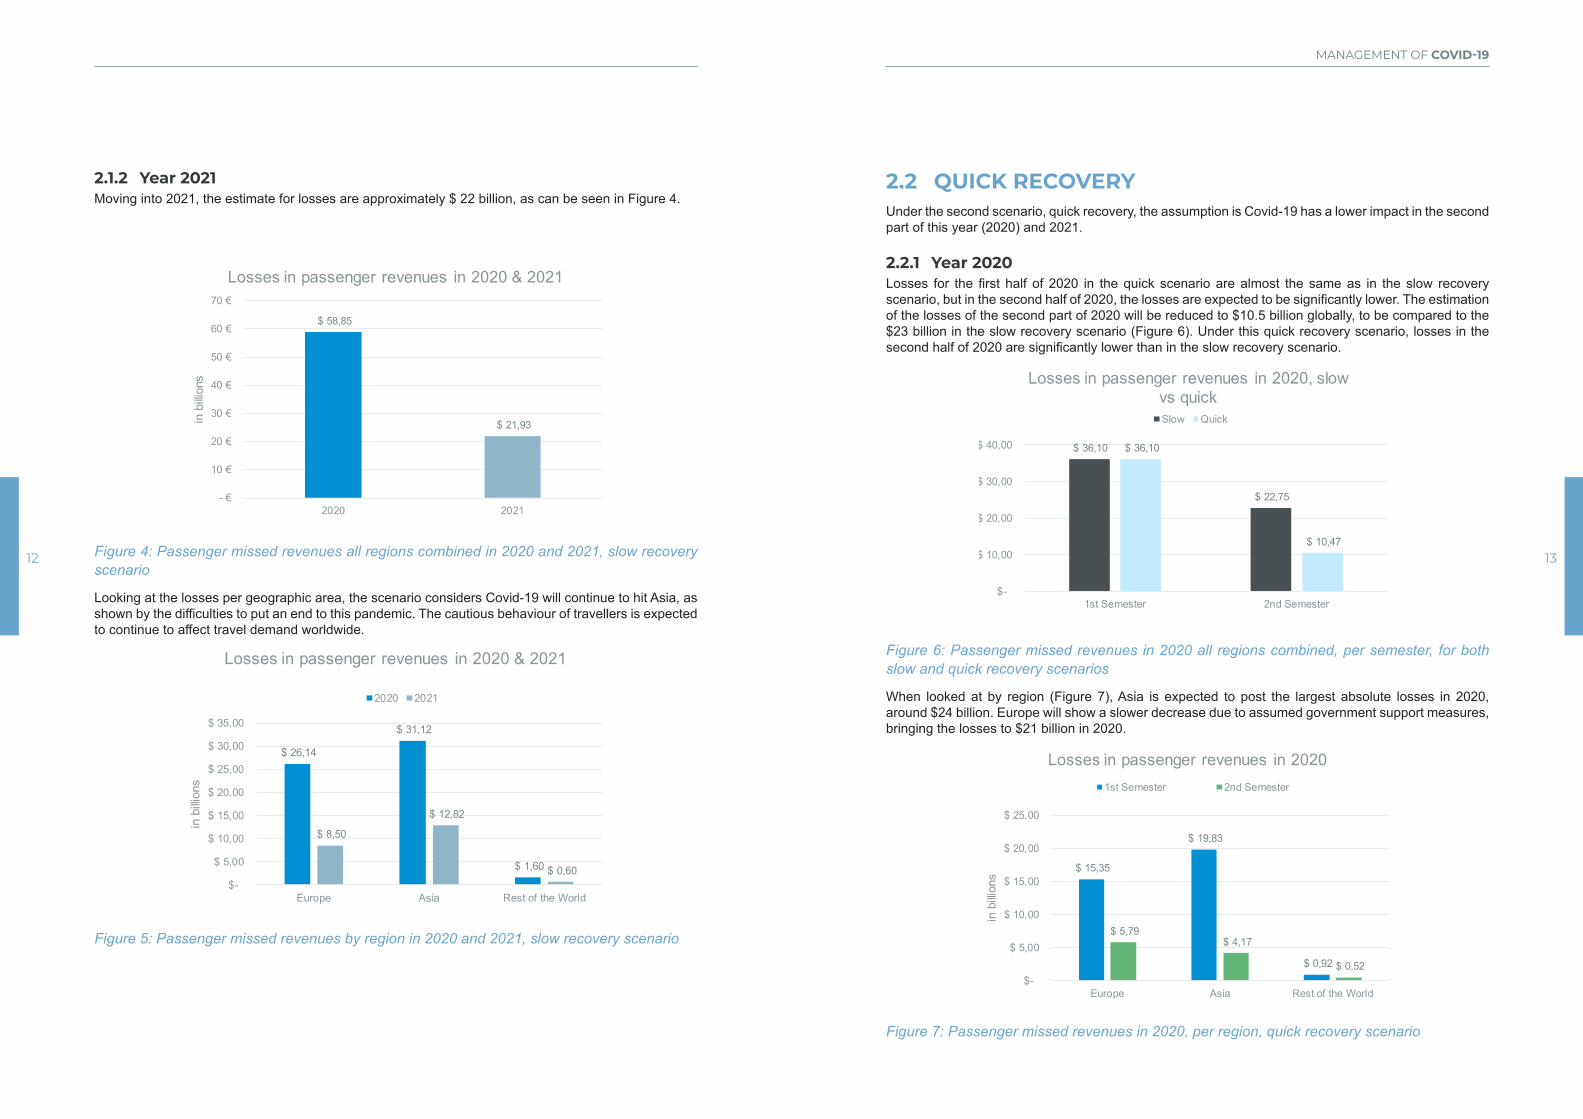
2.1.2 Year 2021Moving into 2021, the estimate for losses are approximately $ 22 billion, as can be seen in Figure 4.
$ 58,85
$ 21,93
- €
10 €
20 €
30 €
40 €
50 €
60 €
70 €
2020 2021
in b
illion
s
Losses in passenger revenues in 2020 & 2021
Figure 4: Passenger missed revenues all regions combined in 2020 and 2021, slow recovery scenario
Looking at the losses per geographic area, the scenario considers Covid-19 will continue to hit Asia, as shown by the difficulties to put an end to this pandemic. The cautious behaviour of travellers is expected to continue to affect travel demand worldwide.
$ 26,14
$ 31,12
$ 1,60
$ 8,50
$ 12,82
$ 0,60 $-
$ 5,00
$ 10,00
$ 15,00
$ 20,00
$ 25,00
$ 30,00
$ 35,00
Europe Asia Rest of the World
in b
illion
s
Losses in passenger revenues in 2020 & 2021
2020 2021
Figure 5: Passenger missed revenues by region in 2020 and 2021, slow recovery scenario
2.2 QUICK RECOVERYUnder the second scenario, quick recovery, the assumption is Covid-19 has a lower impact in the second part of this year (2020) and 2021.
2.2.1 Year 2020Losses for the first half of 2020 in the quick scenario are almost the same as in the slow recovery scenario, but in the second half of 2020, the losses are expected to be significantly lower. The estimation of the losses of the second part of 2020 will be reduced to $10.5 billion globally, to be compared to the $23 billion in the slow recovery scenario (Figure 6). Under this quick recovery scenario, losses in the second half of 2020 are significantly lower than in the slow recovery scenario.
$ 36,10
$ 22,75
$ 36,10
$ 10,47
$-
$ 10,00
$ 20,00
$ 30,00
$ 40,00
1st Semester 2nd Semester
Losses in passenger revenues in 2020, slow vs quickSlow Quick
Figure 6: Passenger missed revenues in 2020 all regions combined, per semester, for both slow and quick recovery scenarios
When looked at by region (Figure 7), Asia is expected to post the largest absolute losses in 2020, around $24 billion. Europe will show a slower decrease due to assumed government support measures, bringing the losses to $21 billion in 2020.
$ 15,35
$ 19,83
$ 0,92
$ 5,79 $ 4,17
$ 0,52 $-
$ 5,00
$ 10,00
$ 15,00
$ 20,00
$ 25,00
Europe Asia Rest of the Worldin
billi
ons
Losses in passenger revenues in 2020 1st Semester 2nd Semester
Figure 7: Passenger missed revenues in 2020, per region, quick recovery scenario

14 15
MANAGEMENT OF COVID-19
2.2.2 Year 2021Under this scenario, losses remain in 2021 as the pandemic is gradually but not totally contained. Losses are estimated at a minimum of $6.2 billion for 2021 (Figure 8).
$ 46,57
$ 6,19
- €
10 €
20 €
30 €
40 €
50 €
2020 2021
in b
illion
s
Losses in passenger revenues in 2020 & 2021
Figure 8: Passenger missed revenues in 2020 both semesters combined and 2021, all regions combined, quick recovery scenario
When looked at by region, it can again be seen that Asia and Europe are the most affected. For Asia, the expected recovery reduces the losses to $2 billion in 2021, and for Europe, to nearly $4 billion in 2021.
$ 21,14 $ 24,00
$ 1,44 $ 3,90
$ 2,09 $ 0,21
$-
$ 5,00
$ 10,00
$ 15,00
$ 20,00
$ 25,00
$ 30,00
Europe Asia Rest of the World
in b
illion
s
Losses in passenger revenues in 2020 & 2021
2020 2021
Figure 9: Passenger missed revenues in 2020 both semesters combined and 2021, per region, quick recovery scenario
2.3 SUMMARY OF PASSENGER LOSSESClearly a slow recovery scenario translates into major losses in passenger activities in 2020, remaining significantly high in the medium term: these are twice as high in 2021 compared to 2020 in the quick recovery scenario for Europe and the rest of the world, but the ratio is 6 times between 2020 and 2021 for Asia. Looking at the percent breakdown, the losses of passenger revenues compared to year 2019 can be seen in Table 1 under each scenario.
$ 60,93
$ 89,17
$ 3,00
$ 60,93
$ 89,17
$ 3,00
$ 34,79
$ 58,05
$ 1,40
$ 39,79
$ 65,17
$ 1,56
$ 52,43
$ 76,35
$ 2,39
$ 57,03
$ 87,08
$ 2,79
$-
$ 10,00
$ 20,00
$ 30,00
$ 40,00
$ 50,00
$ 60,00
$ 70,00
$ 80,00
$ 90,00
$ 100,00
Europe Asia Rest of the World Europe Asia Rest of the World
Slow quick
in b
illion
s
Passenger revenues 2019, 2020 & 2021
2019 2020 2021 Table 1 Passenger revenues when compared to 2019
16 17
MANAGEMENT OF COVID-19
3. FREIGHT SECTOR
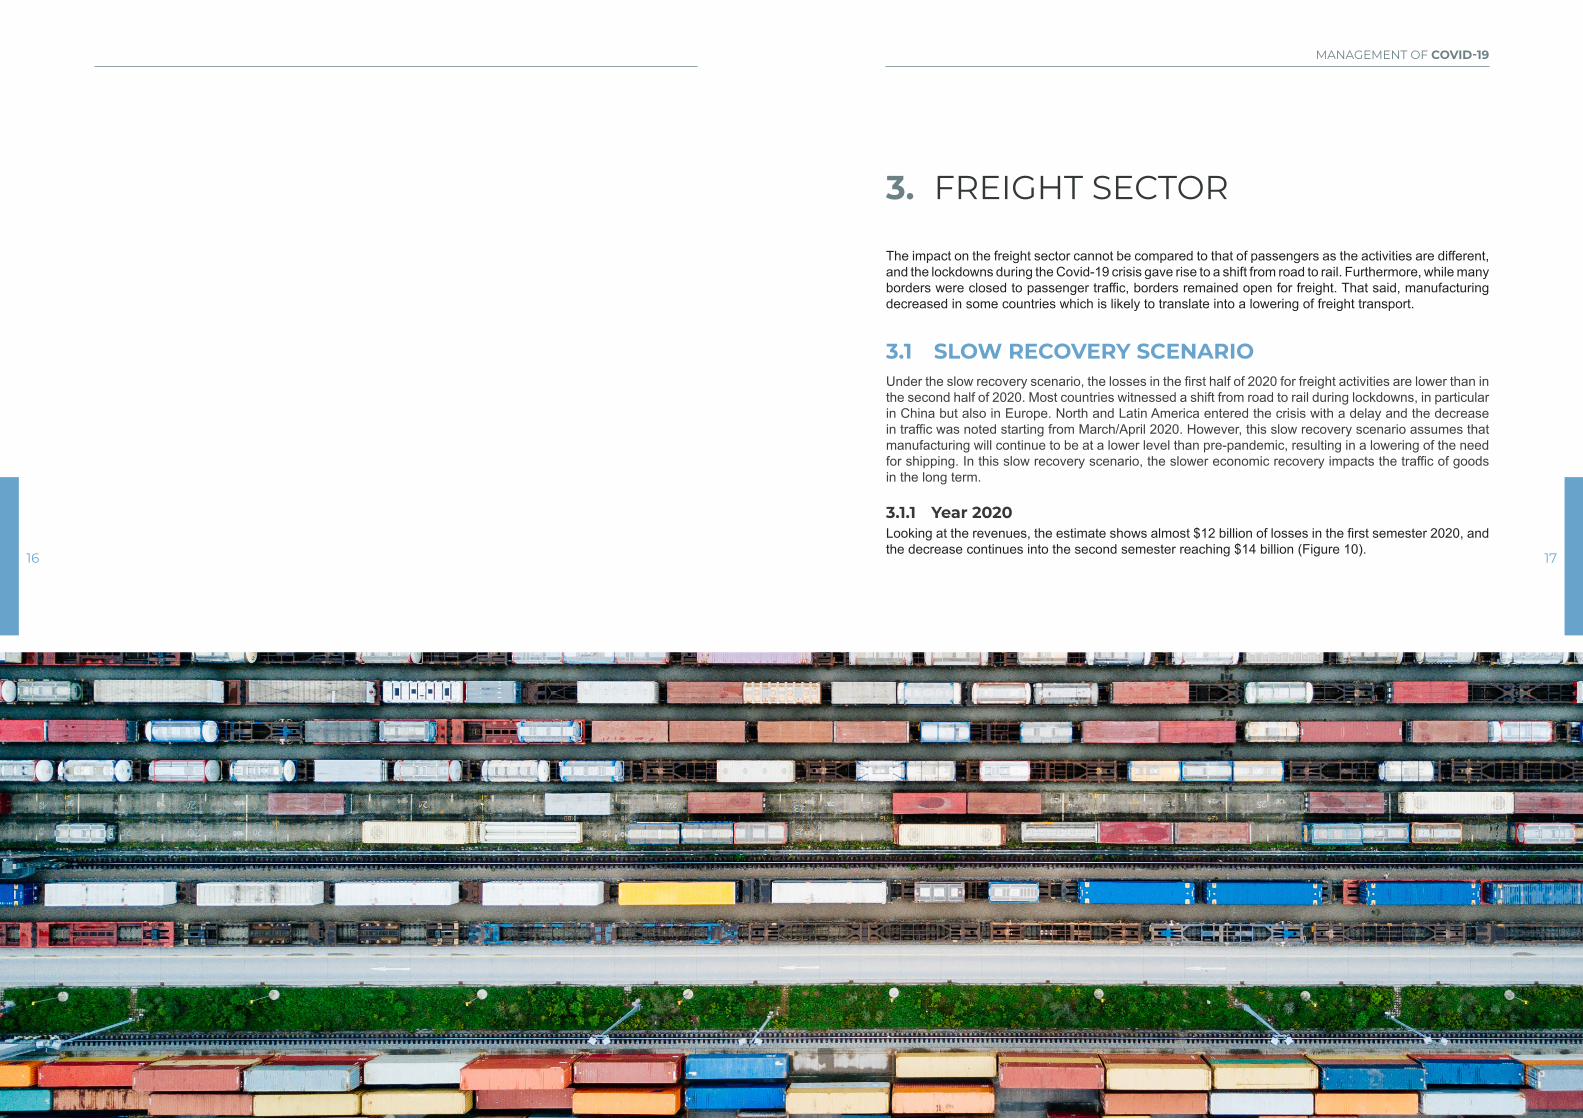
The impact on the freight sector cannot be compared to that of passengers as the activities are different, and the lockdowns during the Covid-19 crisis gave rise to a shift from road to rail. Furthermore, while many borders were closed to passenger traffic, borders remained open for freight. That said, manufacturing decreased in some countries which is likely to translate into a lowering of freight transport.
3.1 SLOW RECOVERY SCENARIOUnder the slow recovery scenario, the losses in the first half of 2020 for freight activities are lower than in the second half of 2020. Most countries witnessed a shift from road to rail during lockdowns, in particular in China but also in Europe. North and Latin America entered the crisis with a delay and the decrease in traffic was noted starting from March/April 2020. However, this slow recovery scenario assumes that manufacturing will continue to be at a lower level than pre-pandemic, resulting in a lowering of the need for shipping. In this slow recovery scenario, the slower economic recovery impacts the traffic of goods in the long term.
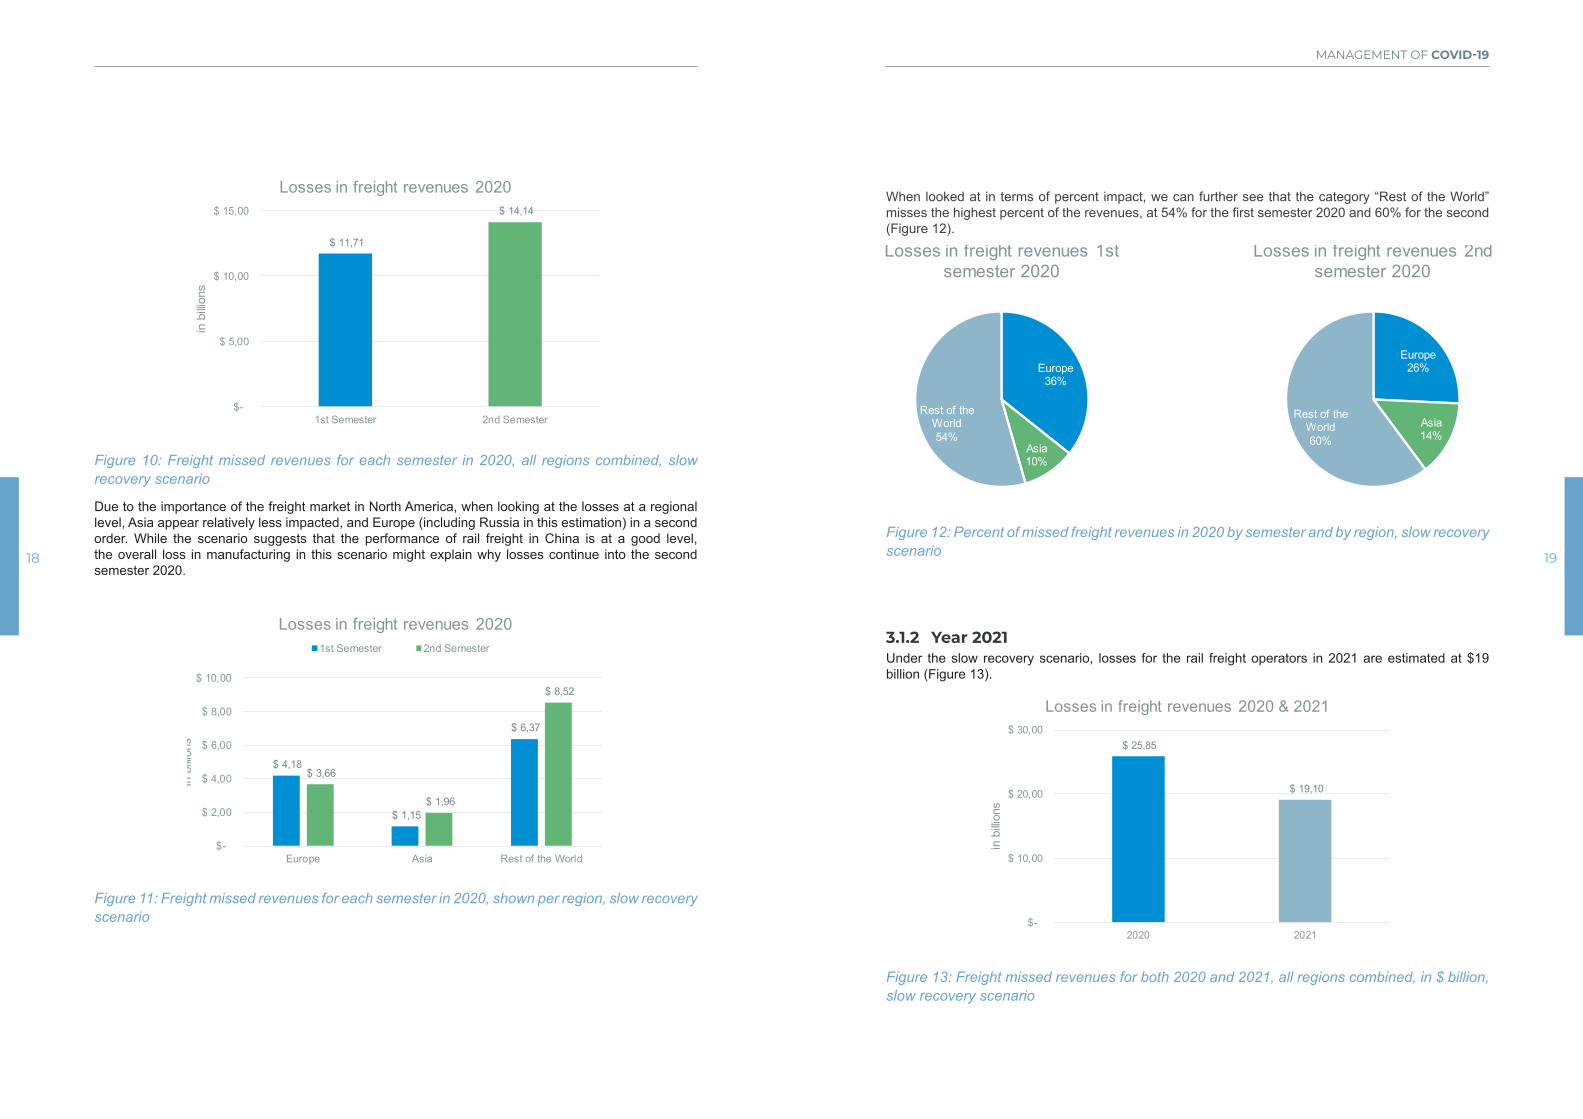
3.1.1 Year 2020Looking at the revenues, the estimate shows almost $12 billion of losses in the first semester 2020, and the decrease continues into the second semester reaching $14 billion (Figure 10).
18 19
MANAGEMENT OF COVID-19
$ 11,71
$ 14,14
$-
$ 5,00
$ 10,00
$ 15,00
1st Semester 2nd Semester
in b
illion
sLosses in freight revenues 2020
Figure 10: Freight missed revenues for each semester in 2020, all regions combined, slow recovery scenario
Due to the importance of the freight market in North America, when looking at the losses at a regional level, Asia appear relatively less impacted, and Europe (including Russia in this estimation) in a second order. While the scenario suggests that the performance of rail freight in China is at a good level, the overall loss in manufacturing in this scenario might explain why losses continue into the second semester 2020.
$ 4,18
$ 1,15
$ 6,37
$ 3,66
$ 1,96
$ 8,52
$-
$ 2,00
$ 4,00
$ 6,00
$ 8,00
$ 10,00
Europe Asia Rest of the World
in b
illion
s
Losses in freight revenues 20201st Semester 2nd Semester
Figure 11: Freight missed revenues for each semester in 2020, shown per region, slow recovery scenario
When looked at in terms of percent impact, we can further see that the category “Rest of the World” misses the highest percent of the revenues, at 54% for the first semester 2020 and 60% for the second (Figure 12).
Europe36%
Asia10%
Rest of the World54%
Losses in freight revenues 1st semester 2020
Europe26%
Asia14%
Rest of the World60%
Losses in freight revenues 2nd semester 2020
Figure 12: Percent of missed freight revenues in 2020 by semester and by region, slow recovery scenario
3.1.2 Year 2021Under the slow recovery scenario, losses for the rail freight operators in 2021 are estimated at $19 billion (Figure 13).
$ 25,85
$ 19,10
$-
$ 10,00
$ 20,00
$ 30,00
2020 2021
in b
illion
s
Losses in freight revenues 2020 & 2021
Figure 13: Freight missed revenues for both 2020 and 2021, all regions combined, in $ billion, slow recovery scenario
20 21
MANAGEMENT OF COVID-19
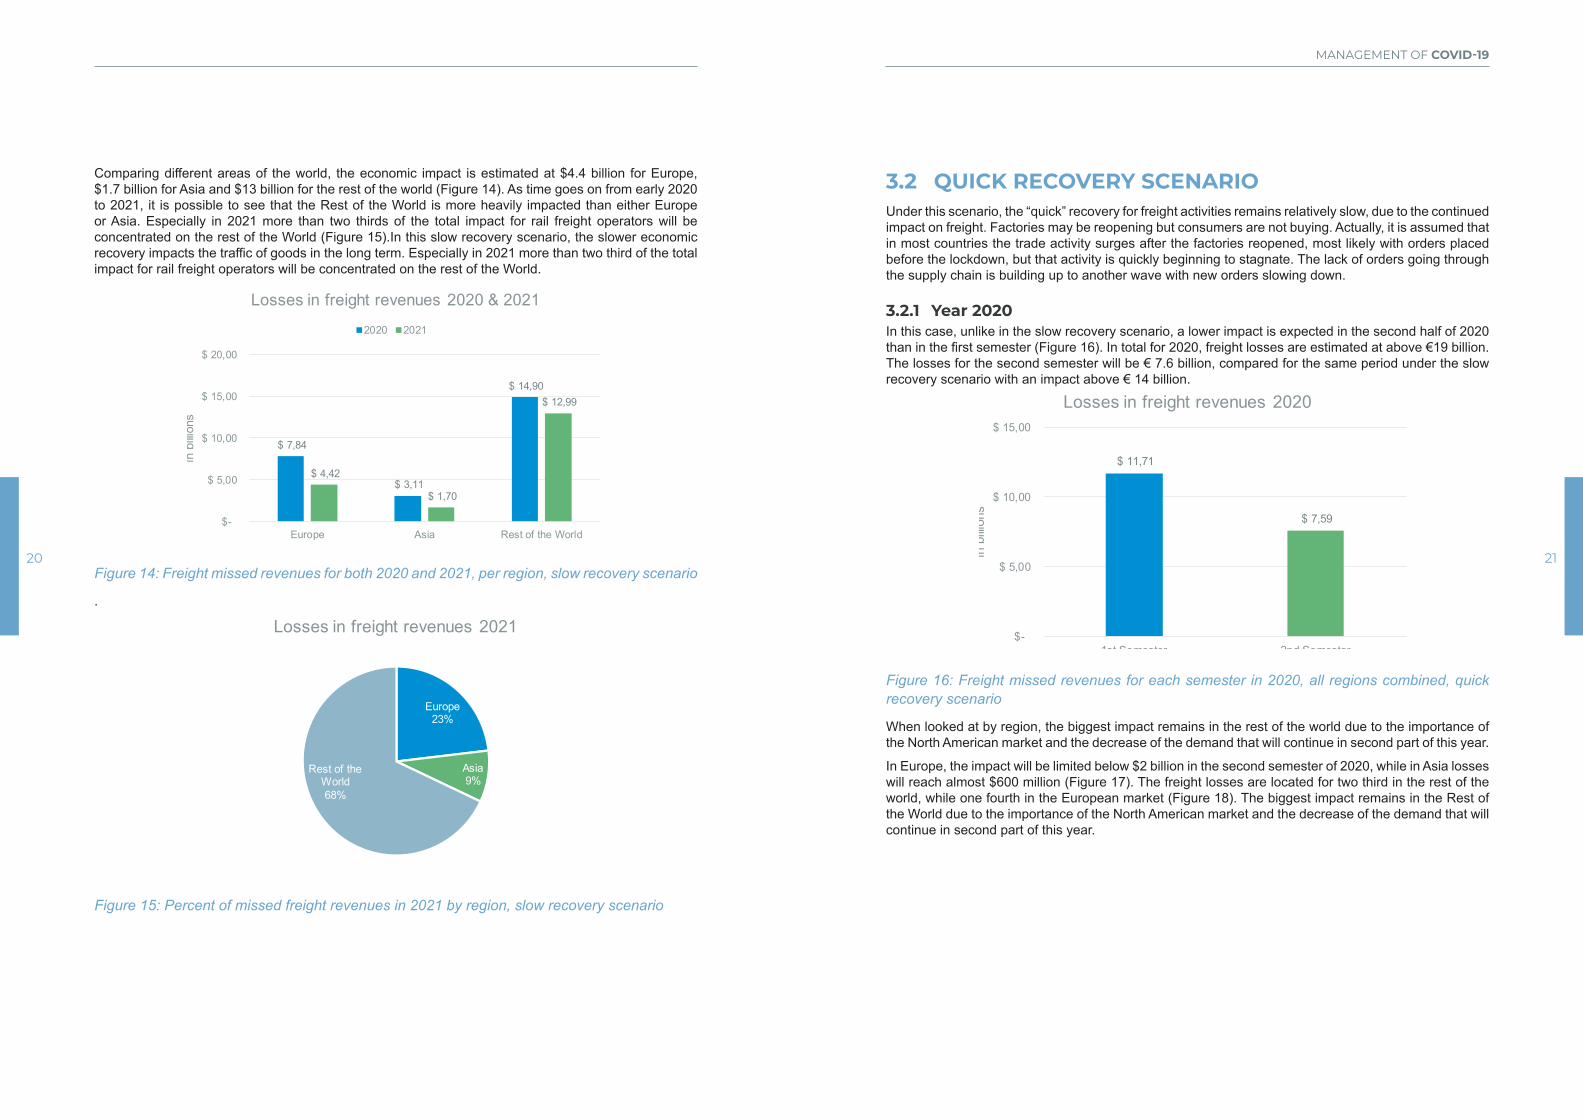
Comparing different areas of the world, the economic impact is estimated at $4.4 billion for Europe, $1.7 billion for Asia and $13 billion for the rest of the world (Figure 14). As time goes on from early 2020 to 2021, it is possible to see that the Rest of the World is more heavily impacted than either Europe or Asia. Especially in 2021 more than two thirds of the total impact for rail freight operators will be concentrated on the rest of the World (Figure 15).In this slow recovery scenario, the slower economic recovery impacts the traffic of goods in the long term. Especially in 2021 more than two third of the total impact for rail freight operators will be concentrated on the rest of the World.
$ 7,84
$ 3,11
$ 14,90
$ 4,42
$ 1,70
$ 12,99
$-
$ 5,00
$ 10,00
$ 15,00
$ 20,00
Europe Asia Rest of the World
in b
illion
s
Losses in freight revenues 2020 & 2021
2020 2021
Figure 14: Freight missed revenues for both 2020 and 2021, per region, slow recovery scenario
.
Europe23%
Asia9%
Rest of the World68%
Losses in freight revenues 2021
Figure 15: Percent of missed freight revenues in 2021 by region, slow recovery scenario
3.2 QUICK RECOVERY SCENARIO Under this scenario, the “quick” recovery for freight activities remains relatively slow, due to the continued impact on freight. Factories may be reopening but consumers are not buying. Actually, it is assumed that in most countries the trade activity surges after the factories reopened, most likely with orders placed before the lockdown, but that activity is quickly beginning to stagnate. The lack of orders going through the supply chain is building up to another wave with new orders slowing down.
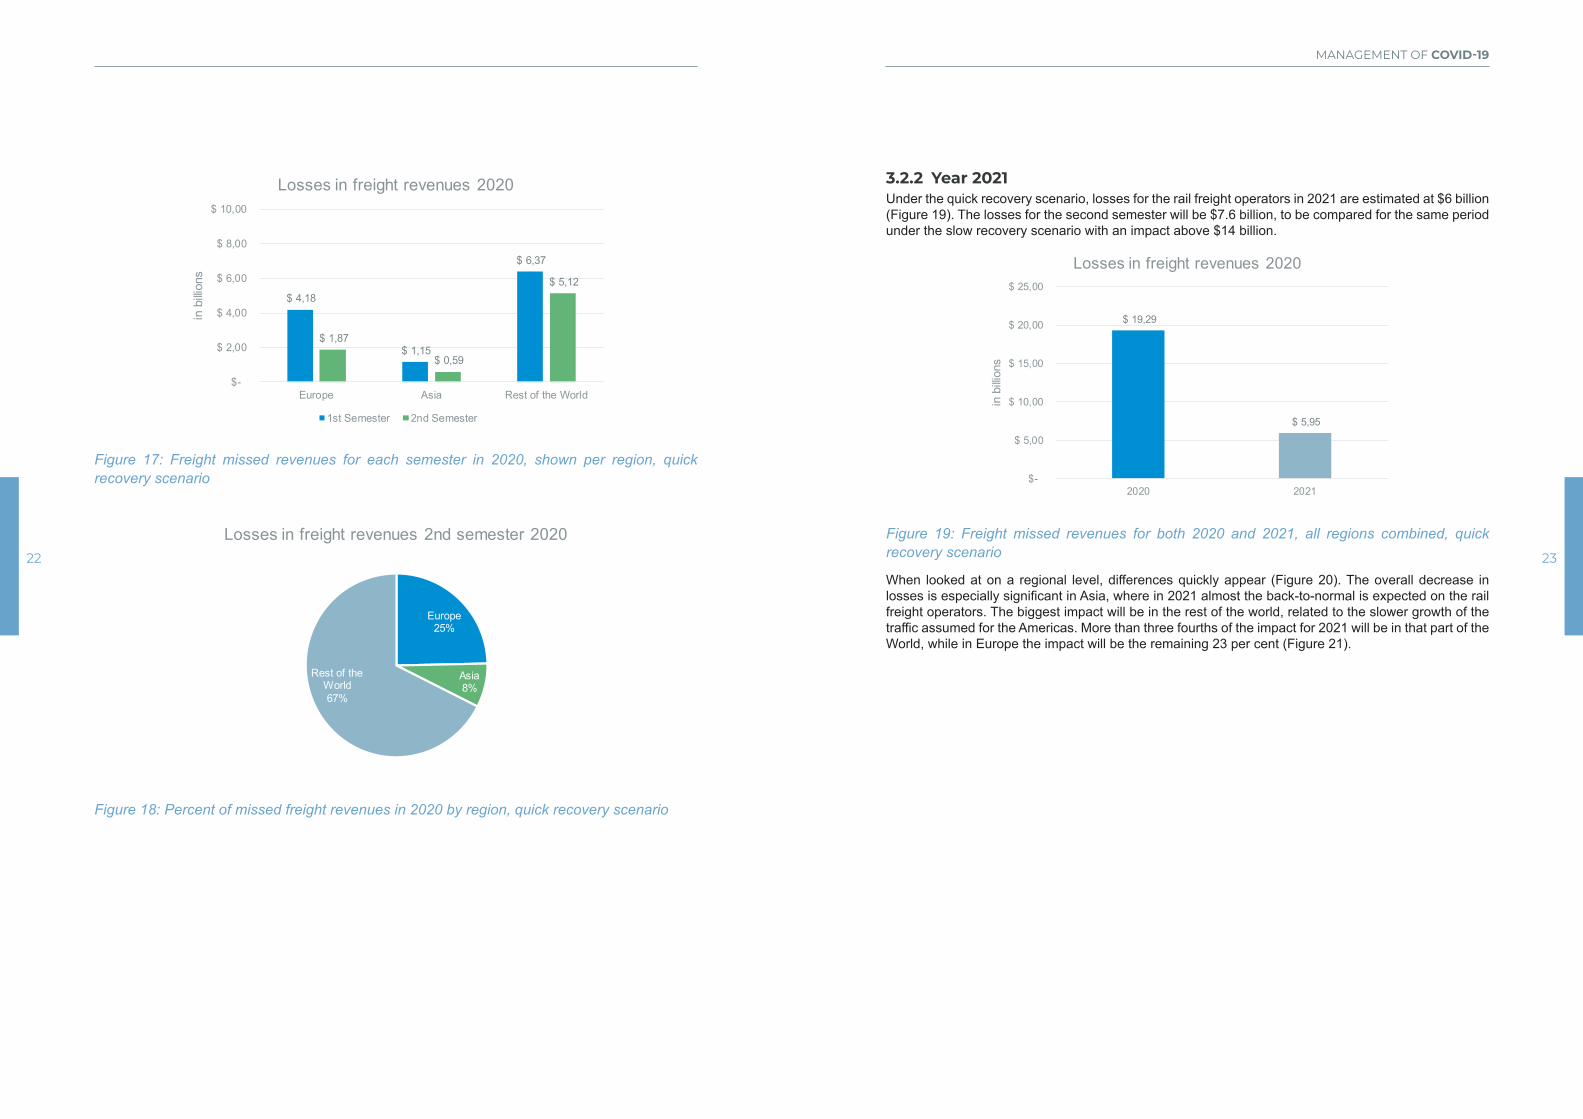
3.2.1 Year 2020In this case, unlike in the slow recovery scenario, a lower impact is expected in the second half of 2020 than in the first semester (Figure 16). In total for 2020, freight losses are estimated at above €19 billion. The losses for the second semester will be € 7.6 billion, compared for the same period under the slow recovery scenario with an impact above € 14 billion.
$ 11,71
$ 7,59
$-
$ 5,00
$ 10,00
$ 15,00
1st Semester 2nd Semester
in b
illion
s
Losses in freight revenues 2020
Figure 16: Freight missed revenues for each semester in 2020, all regions combined, quick recovery scenario
When looked at by region, the biggest impact remains in the rest of the world due to the importance of the North American market and the decrease of the demand that will continue in second part of this year.
In Europe, the impact will be limited below $2 billion in the second semester of 2020, while in Asia losses will reach almost $600 million (Figure 17). The freight losses are located for two third in the rest of the world, while one fourth in the European market (Figure 18). The biggest impact remains in the Rest of the World due to the importance of the North American market and the decrease of the demand that will continue in second part of this year.
22 23
MANAGEMENT OF COVID-19
$ 4,18
$ 1,15
$ 6,37
$ 1,87
$ 0,59
$ 5,12
$-
$ 2,00
$ 4,00
$ 6,00
$ 8,00
$ 10,00
Europe Asia Rest of the World
in b
illion
sLosses in freight revenues 2020
1st Semester 2nd Semester
Figure 17: Freight missed revenues for each semester in 2020, shown per region, quick recovery scenario
Europe25%
Asia8%
Rest of the World67%
Losses in freight revenues 2nd semester 2020
Figure 18: Percent of missed freight revenues in 2020 by region, quick recovery scenario
3.2.2 Year 2021Under the quick recovery scenario, losses for the rail freight operators in 2021 are estimated at $6 billion (Figure 19). The losses for the second semester will be $7.6 billion, to be compared for the same period under the slow recovery scenario with an impact above $14 billion.
$ 19,29
$ 5,95
$-
$ 5,00
$ 10,00
$ 15,00
$ 20,00
$ 25,00
2020 2021
in b
illion
s
Losses in freight revenues 2020
Figure 19: Freight missed revenues for both 2020 and 2021, all regions combined, quick recovery scenario
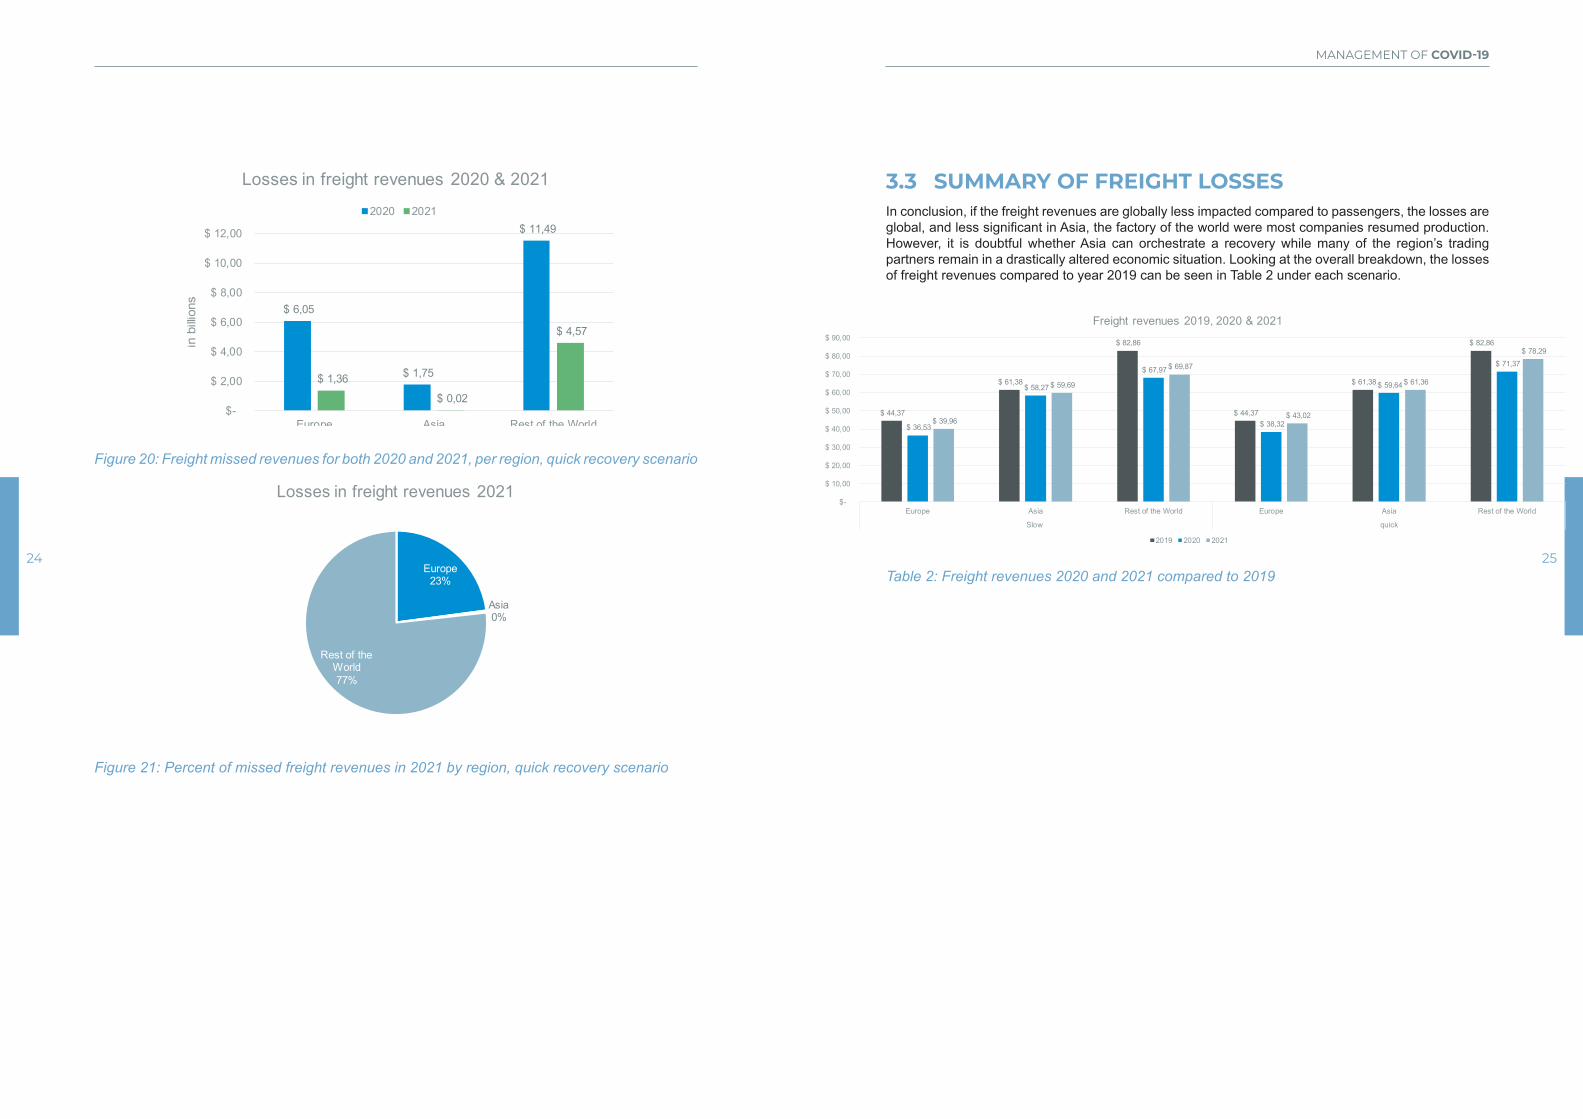
When looked at on a regional level, differences quickly appear (Figure 20). The overall decrease in losses is especially significant in Asia, where in 2021 almost the back-to-normal is expected on the rail freight operators. The biggest impact will be in the rest of the world, related to the slower growth of the traffic assumed for the Americas. More than three fourths of the impact for 2021 will be in that part of the World, while in Europe the impact will be the remaining 23 per cent (Figure 21).
24 25
MANAGEMENT OF COVID-19
$ 6,05
$ 1,75
$ 11,49
$ 1,36
$ 0,02
$ 4,57
$-
$ 2,00
$ 4,00
$ 6,00
$ 8,00
$ 10,00
$ 12,00
Europe Asia Rest of the World
in b
illion
sLosses in freight revenues 2020 & 2021
2020 2021
Figure 20: Freight missed revenues for both 2020 and 2021, per region, quick recovery scenario
Europe23%
Asia0%
Rest of the World77%
Losses in freight revenues 2021
Figure 21: Percent of missed freight revenues in 2021 by region, quick recovery scenario
3.3 SUMMARY OF FREIGHT LOSSES In conclusion, if the freight revenues are globally less impacted compared to passengers, the losses are global, and less significant in Asia, the factory of the world were most companies resumed production. However, it is doubtful whether Asia can orchestrate a recovery while many of the region’s trading partners remain in a drastically altered economic situation. Looking at the overall breakdown, the losses of freight revenues compared to year 2019 can be seen in Table 2 under each scenario.
$ 44,37
$ 61,38
$ 82,86
$ 44,37
$ 61,38
$ 82,86
$ 36,53
$ 58,27
$ 67,97
$ 38,32
$ 59,64
$ 71,37
$ 39,96
$ 59,69
$ 69,87
$ 43,02
$ 61,36
$ 78,29
$-
$ 10,00
$ 20,00
$ 30,00
$ 40,00
$ 50,00
$ 60,00
$ 70,00
$ 80,00
$ 90,00
Europe Asia Rest of the World Europe Asia Rest of the World
Slow quick
in b
illion
s
Freight revenues 2019, 2020 & 2021
2019 2020 2021
Table 2: Freight revenues 2020 and 2021 compared to 2019

26 27
MANAGEMENT OF COVID-19
4. ECONOMIC SUPPORT MEASURES
Part of the analysis is dedicated to the economic measures that rail operators believe could help them through these difficult times. Indeed, as was seen in the first part of the study, the economic impact for rail is estimated to reach up to $125 billion.
Due to the fact that different stakeholders may have different priorities and the way the rail market functions, the results of this part of the questionnaire returned by the UIC Task Force members were examined twice: once with all members, and once with only the Railway Undertakings without the Infrastructure Managers.
For this question, respondents were presented with five possible ways in which they could receive support, as well as a fill-in-the-blank option:
À Direct Financial Contribution
À Decrease Access Charge
À Decrease/Elimination VAT & Other Taxes
À Guarantee Loans
À Fair level play field between all transport modeDirect financial contribution would mean that the respondent would like to get immediate financial support as strongly impacted in their cash management.
Decreasing the access charge would mean that no single player in the sector would lose out on revenues. In this measure, which was approved in Italy, the economic contribution is given to the infrastructure manager by the State that then decreases the access charge to the railway undertakings.
Decreasing or eliminating VAT & other taxes would also mean that no single player in the sector would lose out on revenues.
Guarantee loans would enable to absorb some of the economic shock for privately owned companies as introduced by the French Government for new money loans to be granted to French entities facing business interruption.
Fair level playing field between all transport modes would mean the extraordinary measures announced for some sectors (air, road transport to name but a few) be announced for the rail sector as well.
For the fill in the blank option, respondents mentioned measures such as wage compensation during the Covid-19 crises for the short/medium term and the reduction of the debt for the long term. At the time of closing of this first estimation, no fill-in-the-blank option was written by enough respondents yet to make an analysis of the importance of these measures globally.
Respondents were asked to rank the propositions from 1 to 6, where 1 is the most important economic measure for them, and 6 is the least. Therefore, having a value close to one means that the economic measure is strongly favoured by respondents.
As with the first part of this study, here respondents were also asked to think about things in the short-medium term vs. the long term.
4.1 SHORT-MEDIUM TERMFor the short-medium term (Figure 22) including infrastructure managers, it is clear that the most important priority is linked to recovering the economic losses, as direct financial contribution is the most favoured response (with a value of 1.6).
1,57
3,143,36 3,50
3,93
0,00
1,00
2,00
3,00
4,00
5,00
Direct FinancialContribution
Decrease AccessCharge
Guarantee Loans Decrease/EliminationVAT & Other Taxes
Fair level play fieldbetween all transports
mode
Economic Support Measures - priorities for short term
Figure 22: Priorities for the economic support measures in the short-medium term
NB: having a value close to one means that the economic measure is strongly favoured by respondents
For the other possible economic measures proposed, all appear to be of medium priority to respondents. Coming up second with a value of 3.2 is the decreasing of access charge rates. The third priority is the possibility to have some guarantee loans with a value of 3.4, while the fourth priority is the decrease or elimination of VAT or other taxes. The last priority in the short-medium term is linked to having a faire level play field between all transport mode.
If we consider the analysis without the answers of infrastructure managers, we can see that priority values change only minorly. Here, the priority for decreasing the access charge decreases very slightly (going from 3.2 to 3.1), whereas a fair level playing field gains in priority, but again, not by much (Figure 23).
1,50
3,083,42 3,50
4,08
0,00
1,00
2,00
3,00
4,00
5,00
Direct FinancialContribution
Decrease AccessCharge
Guarantee Loans Decrease/EliminationVAT & Other Taxes
Fair level play fieldbetween all transports
mode
Economic Support Measures - priorities for short term without infrastructure managers
Figure 23: Priorities for the economic support measures in the short-medium term without infrastructure managers
NB: having a value close to one means that the economic measure is strongly favoured by respondents
28 29
MANAGEMENT OF COVID-19
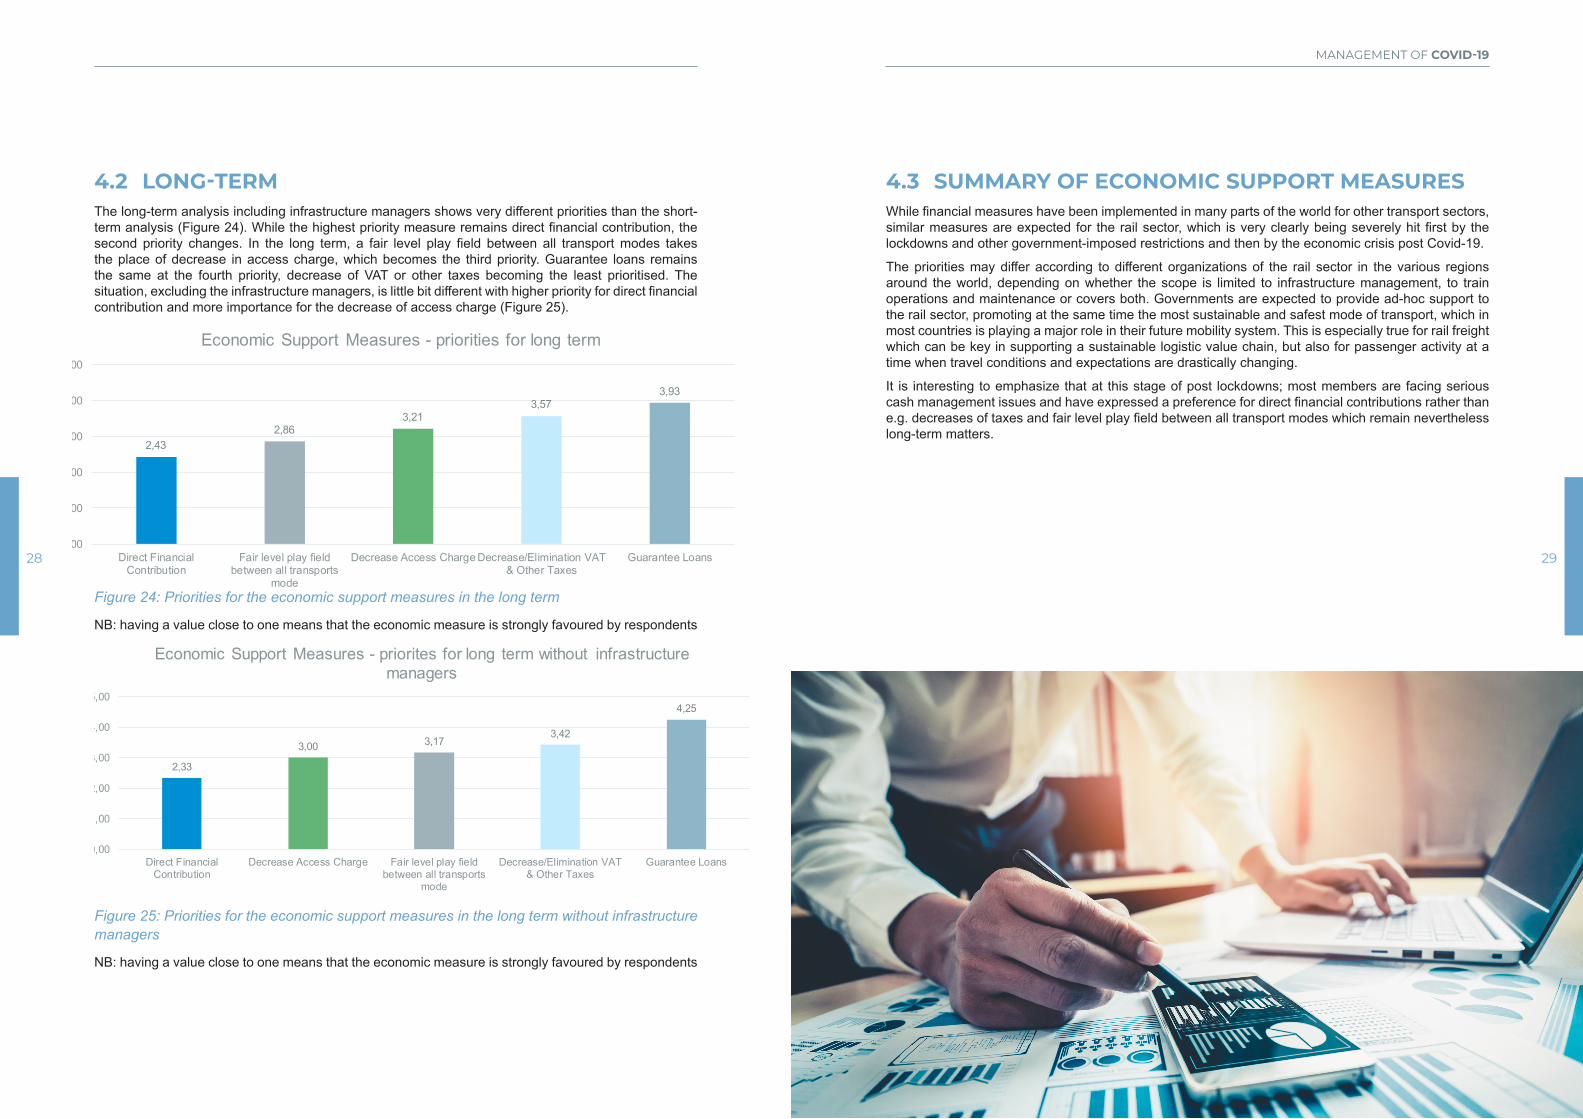
4.2 LONG-TERMThe long-term analysis including infrastructure managers shows very different priorities than the short-term analysis (Figure 24). While the highest priority measure remains direct financial contribution, the second priority changes. In the long term, a fair level play field between all transport modes takes the place of decrease in access charge, which becomes the third priority. Guarantee loans remains the same at the fourth priority, decrease of VAT or other taxes becoming the least prioritised. The situation, excluding the infrastructure managers, is little bit different with higher priority for direct financial contribution and more importance for the decrease of access charge (Figure 25).
2,432,86
3,213,57
3,93
0,00
1,00
2,00
3,00
4,00
5,00
Direct FinancialContribution
Fair level play fieldbetween all transports
mode
Decrease Access Charge Decrease/Elimination VAT& Other Taxes
Guarantee Loans
Economic Support Measures - priorities for long term
Figure 24: Priorities for the economic support measures in the long term
NB: having a value close to one means that the economic measure is strongly favoured by respondents
2,33
3,00 3,173,42
4,25
0,00
1,00
2,00
3,00
4,00
5,00
Direct FinancialContribution
Decrease Access Charge Fair level play fieldbetween all transports
mode
Decrease/Elimination VAT& Other Taxes
Guarantee Loans
Economic Support Measures - priorites for long term without infrastructure managers
Figure 25: Priorities for the economic support measures in the long term without infrastructure managers
NB: having a value close to one means that the economic measure is strongly favoured by respondents
4.3 SUMMARY OF ECONOMIC SUPPORT MEASURESWhile financial measures have been implemented in many parts of the world for other transport sectors, similar measures are expected for the rail sector, which is very clearly being severely hit first by the lockdowns and other government-imposed restrictions and then by the economic crisis post Covid-19.
The priorities may differ according to different organizations of the rail sector in the various regions around the world, depending on whether the scope is limited to infrastructure management, to train operations and maintenance or covers both. Governments are expected to provide ad-hoc support to the rail sector, promoting at the same time the most sustainable and safest mode of transport, which in most countries is playing a major role in their future mobility system. This is especially true for rail freight which can be key in supporting a sustainable logistic value chain, but also for passenger activity at a time when travel conditions and expectations are drastically changing.
It is interesting to emphasize that at this stage of post lockdowns; most members are facing serious cash management issues and have expressed a preference for direct financial contributions rather than e.g. decreases of taxes and fair level play field between all transport modes which remain nevertheless long-term matters.
30 31
MANAGEMENT OF COVID-19
Contact: [email protected] #RAILsilience
INTERNATIONAL UNION OF RAILWAYS 16, rue Jean Rey - 75015 Paris - France Tel. +33 (0)1 44 49 20 20 Fax +33 (0)1 44 49 20 29 E-mail: [email protected]
Published by: The UIC Communications Department, on behalf of the UIC Covid-19 Task Force (L. Petersen, A. Saadaoui, V. Perez, M-H. Bonneau, P. Lorand) led by M. GuigonDirector of publication: M. Plaud-Lombard Design: C. Filippini Layout: M. de CossartPhoto credit: Adobe Stock
ISBN: 978-2-7461-2954-2Copyright deposit: June 2020
L’UIC est une association professionnelle certifiée pour engagement de qualité de services par AFNOR.UIC is a professional association certified by AFNOR for its commitment to service quality.
5. CONCLUSION
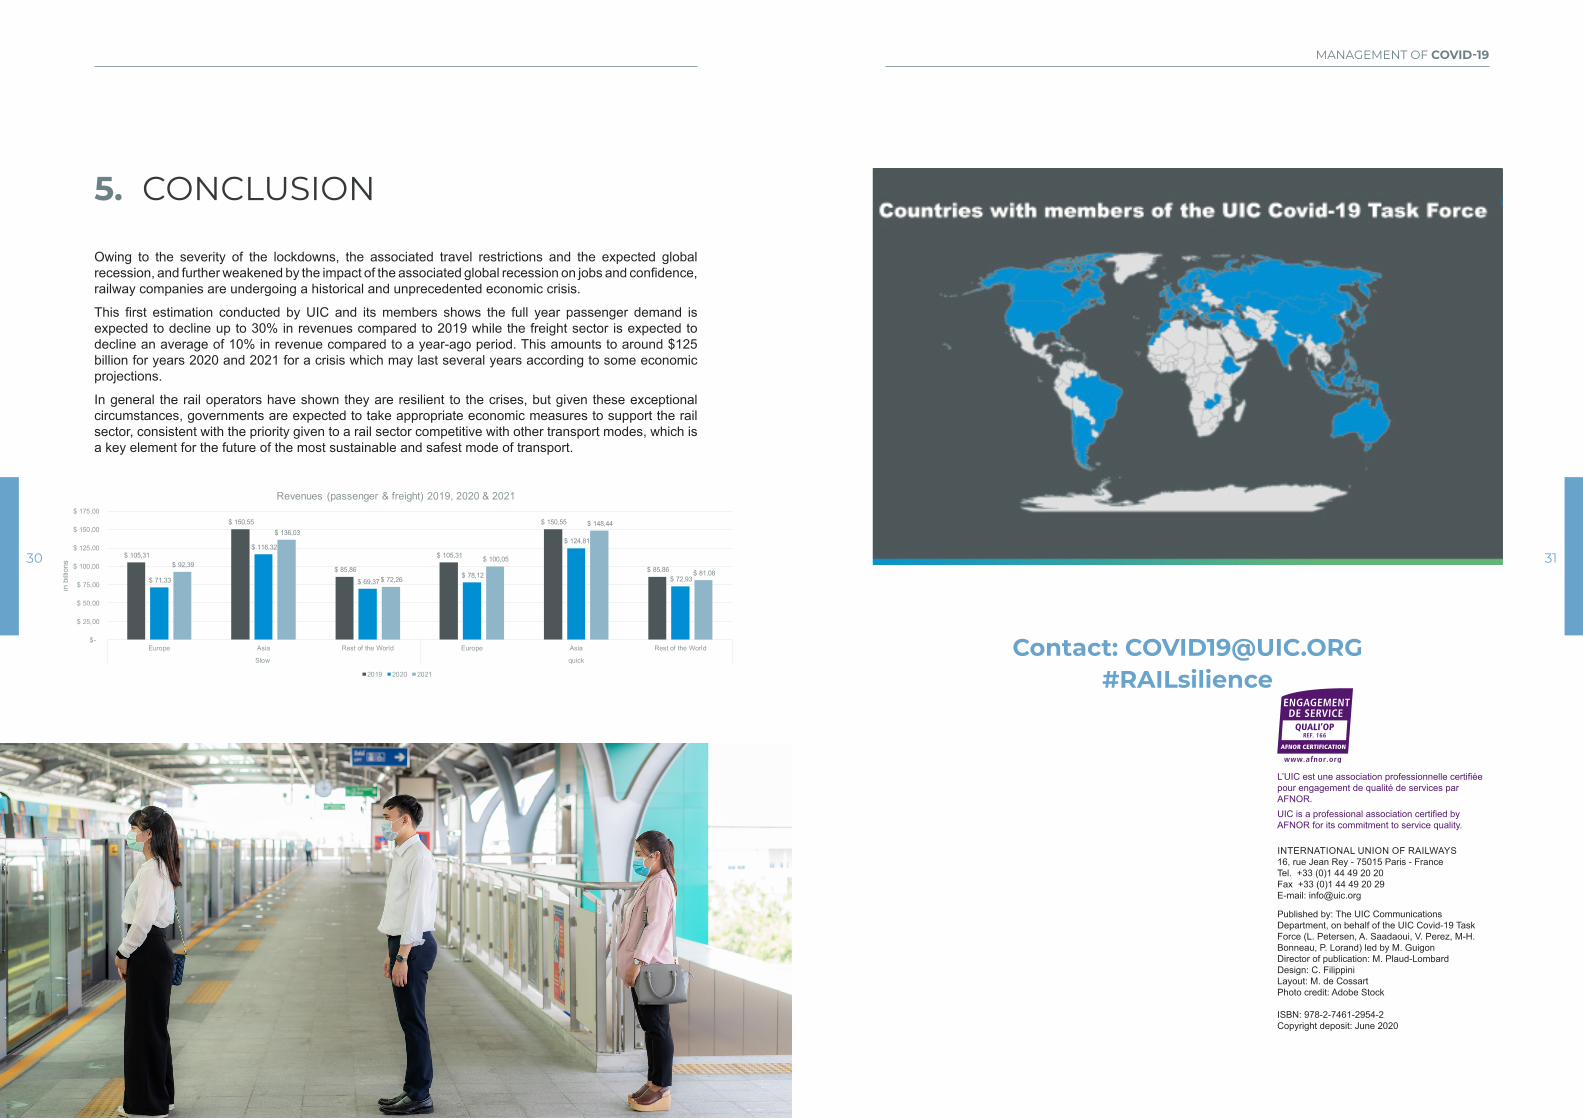
Owing to the severity of the lockdowns, the associated travel restrictions and the expected global recession, and further weakened by the impact of the associated global recession on jobs and confidence, railway companies are undergoing a historical and unprecedented economic crisis.
This first estimation conducted by UIC and its members shows the full year passenger demand is expected to decline up to 30% in revenues compared to 2019 while the freight sector is expected to decline an average of 10% in revenue compared to a year-ago period. This amounts to around $125 billion for years 2020 and 2021 for a crisis which may last several years according to some economic projections.
In general the rail operators have shown they are resilient to the crises, but given these exceptional circumstances, governments are expected to take appropriate economic measures to support the rail sector, consistent with the priority given to a rail sector competitive with other transport modes, which is a key element for the future of the most sustainable and safest mode of transport.
$ 105,31
$ 150,55
$ 85,86
$ 105,31
$ 150,55
$ 85,86 $ 71,33
$ 116,32
$ 69,37 $ 78,12
$ 124,81
$ 72,93
$ 92,39
$ 136,03
$ 72,26
$ 100,05
$ 148,44
$ 81,08
$-
$ 25,00
$ 50,00
$ 75,00
$ 100,00
$ 125,00
$ 150,00
$ 175,00
Europe Asia Rest of the World Europe Asia Rest of the World
Slow quick
in b
illion
s
Revenues (passenger & freight) 2019, 2020 & 2021
2019 2020 2021