Embed Size (px)
Citation preview
L/O/G/O
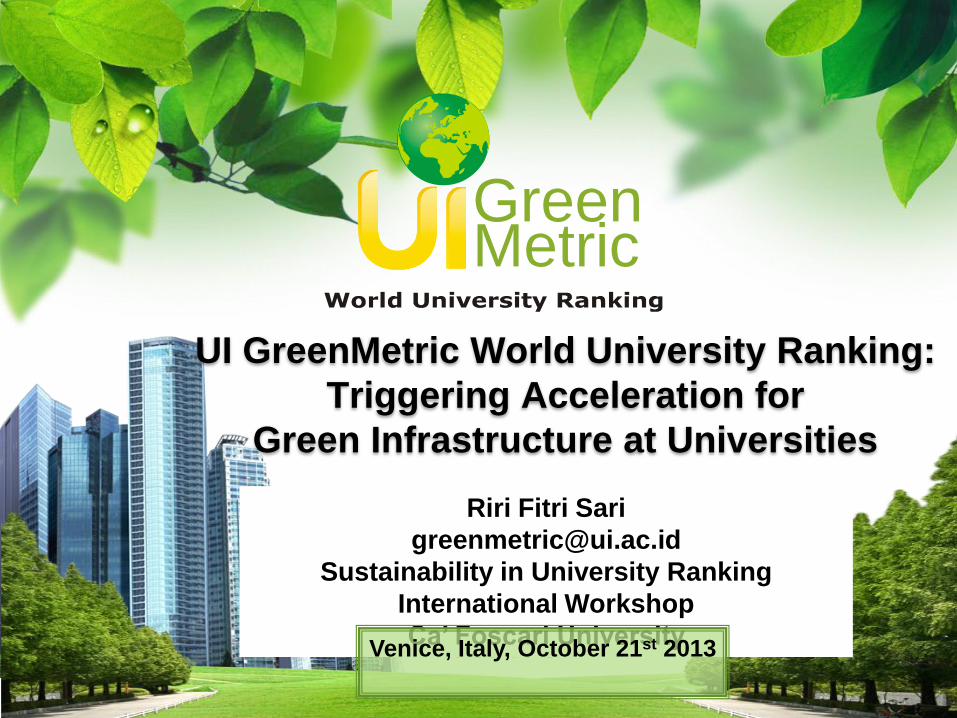
UI GreenMetric World University Ranking:
Triggering Acceleration for
Green Infrastructure at Universities
GreenMetric
Riri Fitri Sari
Sustainability in University Ranking
International Workshop
Ca’ Foscari University Venice, Italy, October 21st 2013
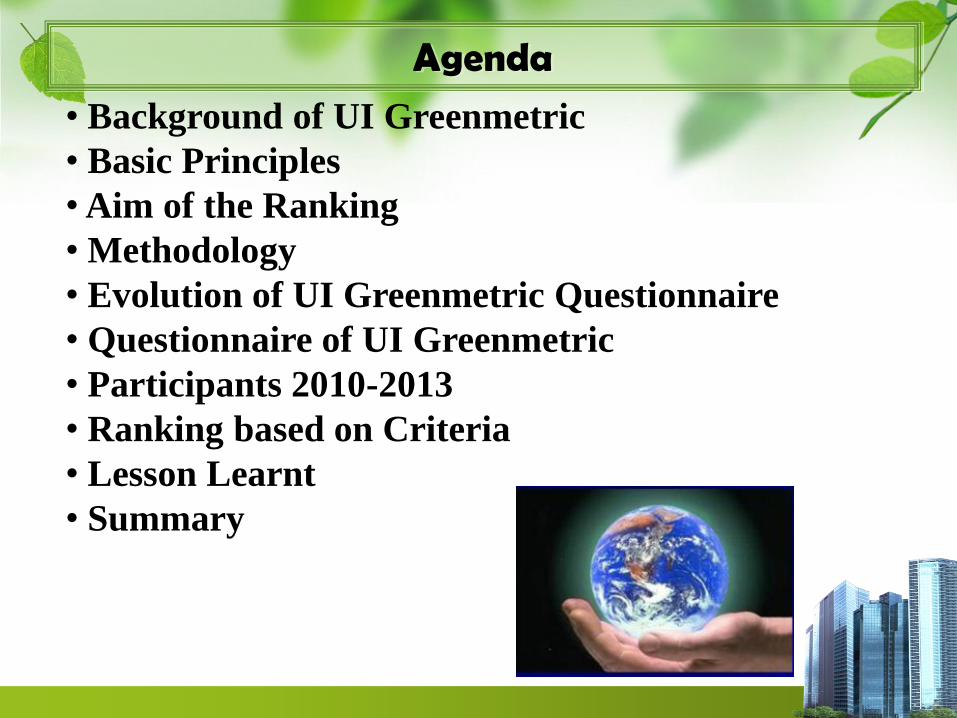
Agenda
• Background of UI Greenmetric
• Basic Principles
• Aim of the Ranking
• Methodology
• Evolution of UI Greenmetric Questionnaire
• Questionnaire of UI Greenmetric
• Participants 2010-2013
• Ranking based on Criteria
• Lesson Learnt
• Summary
Background of the Ranking
World University Ranking Conference at UI April
200 16th 2009
Speakers: Isidro Aguillo (Webometrics), Angela
Yung-Chi Hou (HEEACT), and Alex Usher
(Educational Policy Canada)
Initiative of the Previous UI’s Rector Prof. Dr. Der
Soz. Gumilar Rusliwa Soemantri (February 2010)
Economy, Social, Environment (Triple bottom line
of Sustainability) + Culture
Background of UI Greenmetric
It is open to global participation
It is accessible to HEIs in both the developed
and developing world
It should contribute to academic discourse on
sustainability in education and the greening
of campuses
It should encourage university-led social
change with regard to sustainability goals.
Policy and Procedure for Climate Change
mitigation
Basic Principles
Aim of the Ranking
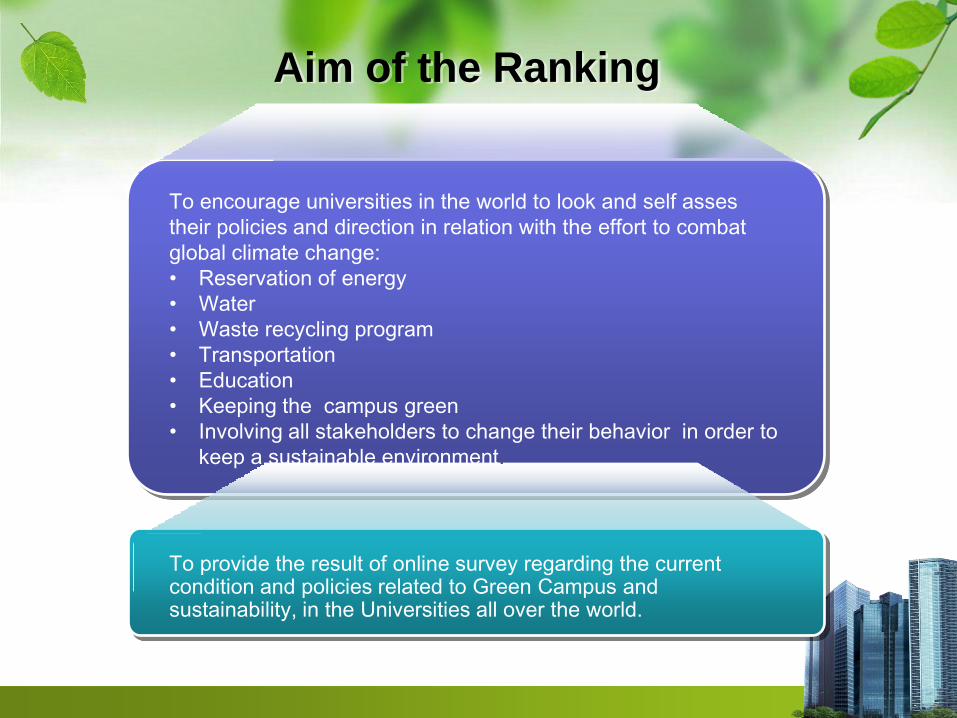
To encourage universities in the world to look and self asses
their policies and direction in relation with the effort to combat
global climate change:
• Reservation of energy
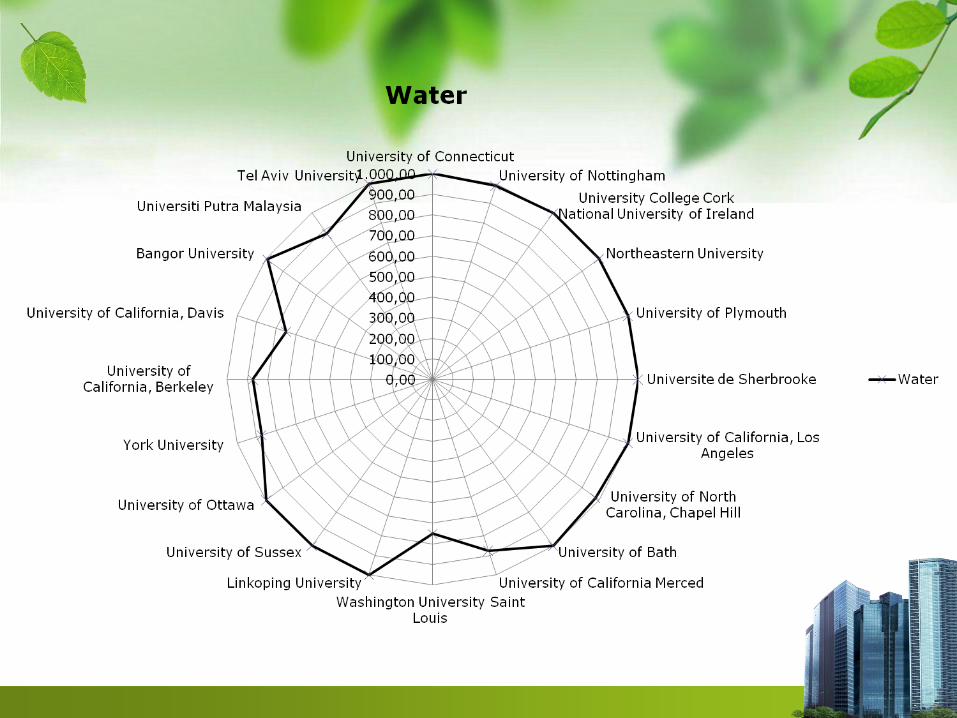
• Water
• Waste recycling program
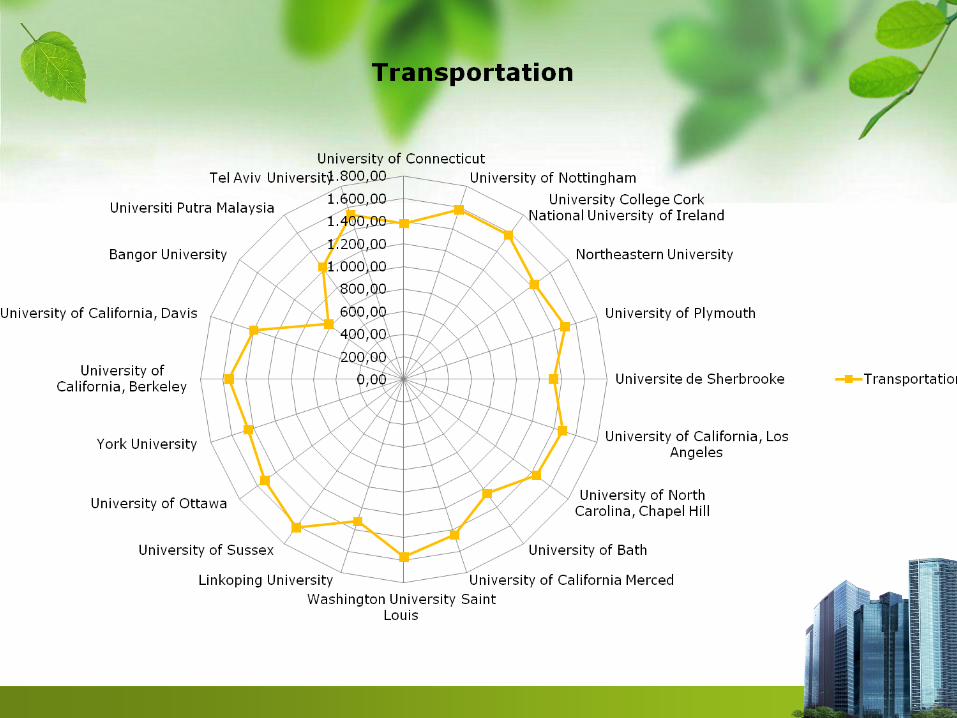
• Transportation
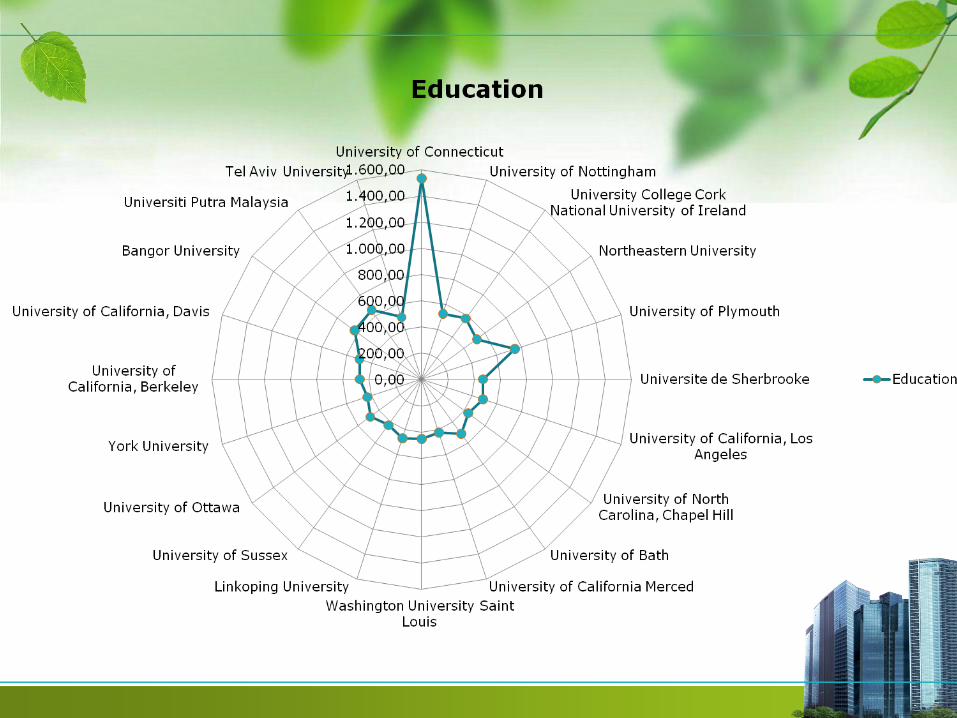
• Education
• Keeping the campus green
• Involving all stakeholders to change their behavior in order to
keep a sustainable environment.
To provide the result of online survey regarding the current condition and policies related to Green Campus and sustainability, in the Universities all over the world.
Methodology UI GreenMetric 2013
Content Title
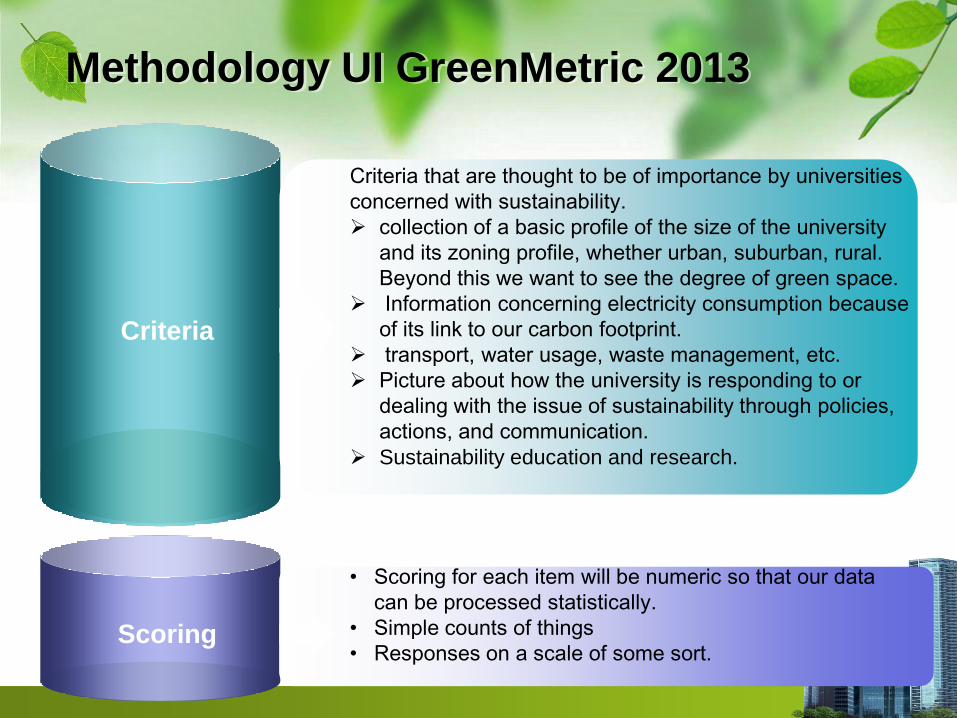
Scoring
• Scoring for each item will be numeric so that our data
can be processed statistically.
• Simple counts of things
• Responses on a scale of some sort.
Criteria
Criteria that are thought to be of importance by universities
concerned with sustainability.
collection of a basic profile of the size of the university
and its zoning profile, whether urban, suburban, rural.
Beyond this we want to see the degree of green space.
Information concerning electricity consumption because
of its link to our carbon footprint.
transport, water usage, waste management, etc.
Picture about how the university is responding to or
dealing with the issue of sustainability through policies,
actions, and communication.
Sustainability education and research.
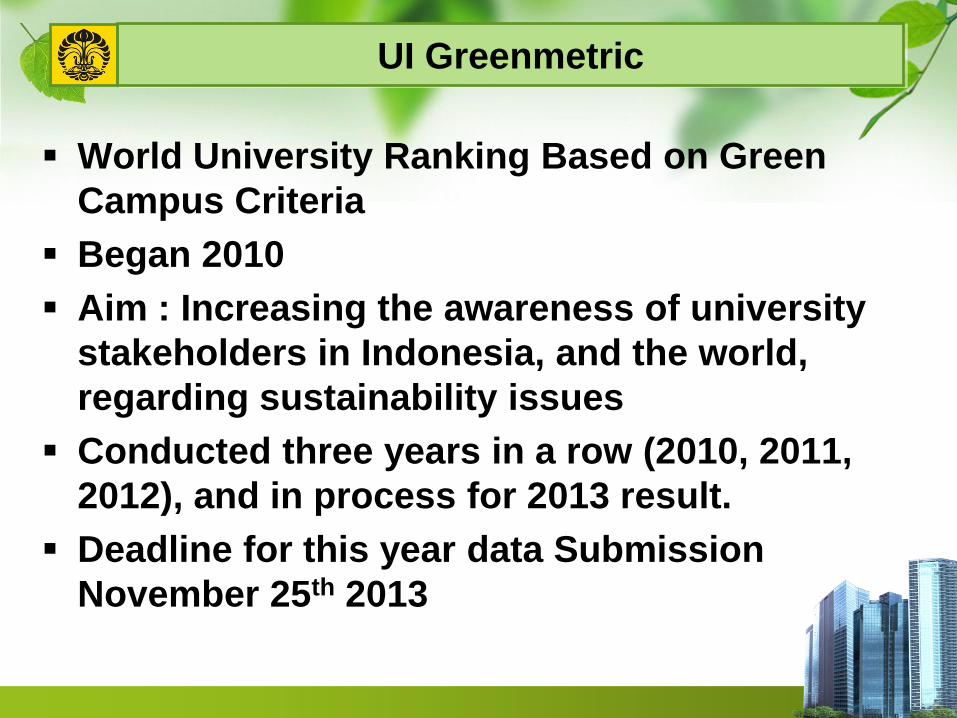
World University Ranking Based on Green
Campus Criteria
Began 2010
Aim : Increasing the awareness of university
stakeholders in Indonesia, and the world,
regarding sustainability issues
Conducted three years in a row (2010, 2011,
2012), and in process for 2013 result.
Deadline for this year data Submission
November 25th 2013
UI Greenmetric
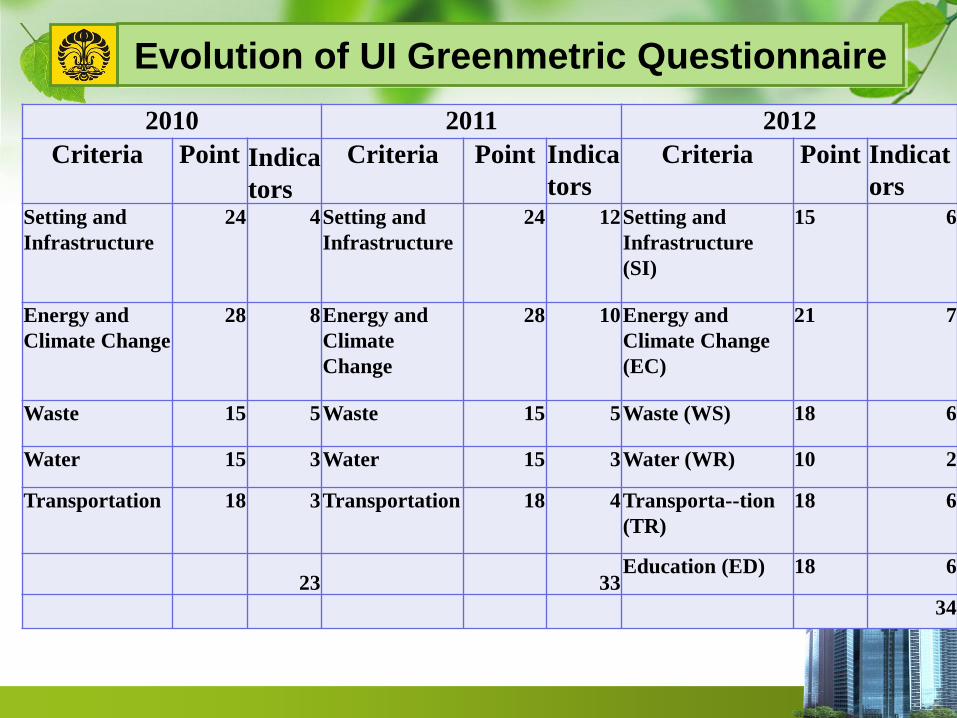
Evolution of UI Greenmetric Questionnaire
2010 2011 2012
Criteria Point Indica
tors
Criteria Point Indica
tors
Criteria Point Indicat
ors Setting and
Infrastructure
24 4 Setting and
Infrastructure
24 12 Setting and
Infrastructure
(SI)
15 6
Energy and
Climate Change
28 8 Energy and
Climate
Change
28 10 Energy and
Climate Change
(EC)
21 7
Waste 15 5 Waste 15 5 Waste (WS) 18 6
Water 15 3 Water 15 3 Water (WR) 10 2
Transportation 18 3 Transportation 18 4 Transporta--tion
(TR)
18 6
23
33
Education (ED) 18 6
34
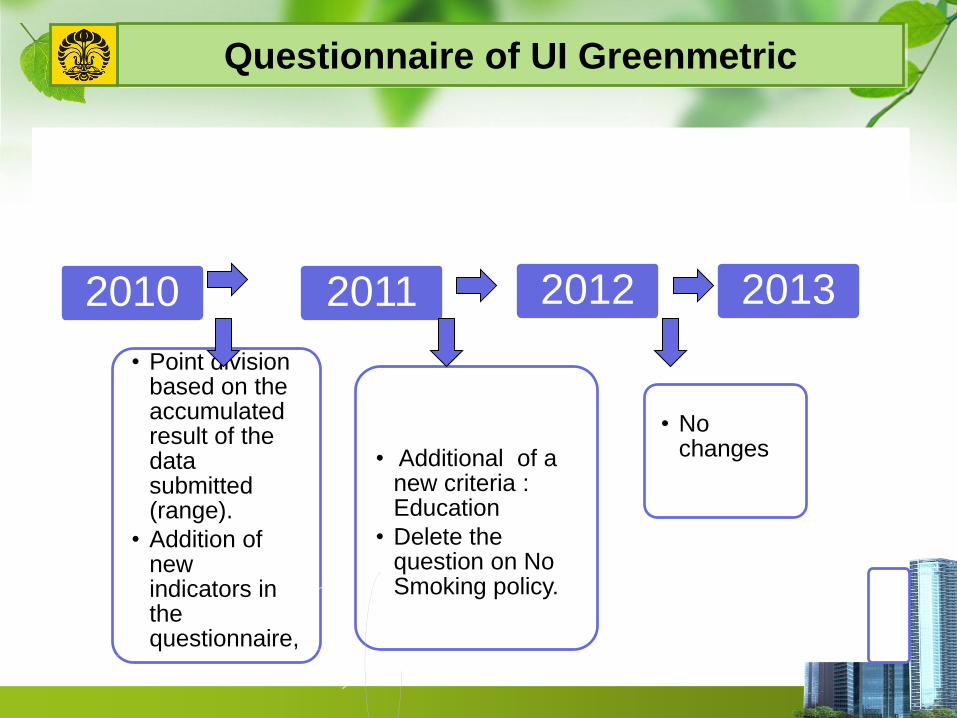
• Point division based on the accumulated result of the data submitted (range).
• Addition of new indicators in the questionnaire,
2010
• Additional of a new criteria : Education
• Delete the question on No Smoking policy.
2011
• No changes
2012 2013
Questionnaire of UI Greenmetric
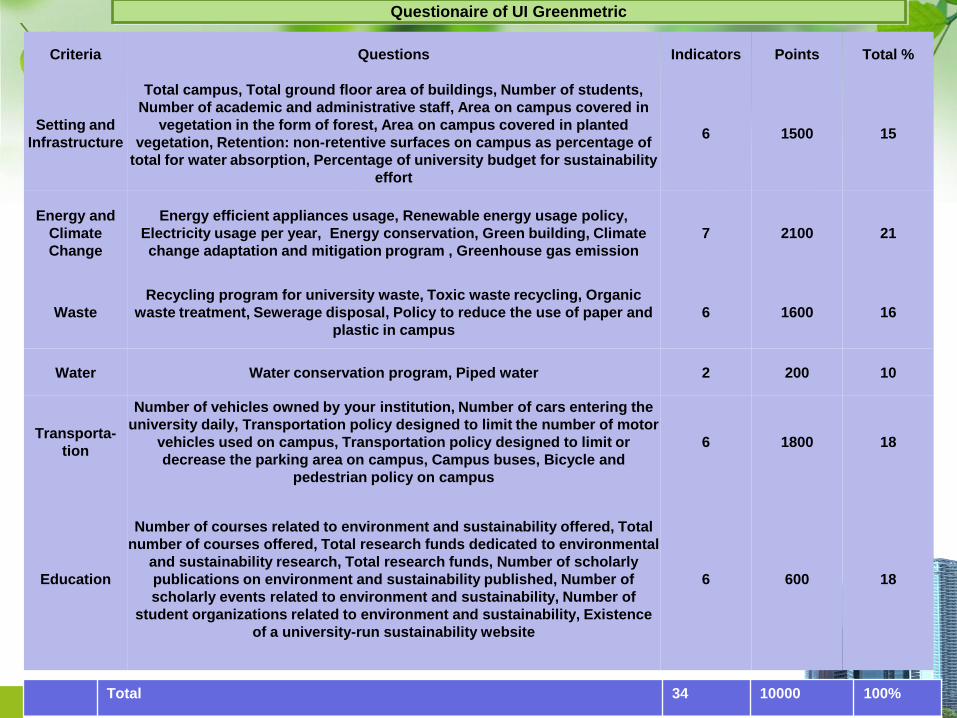
Criteria Questions Indicators Points Total %
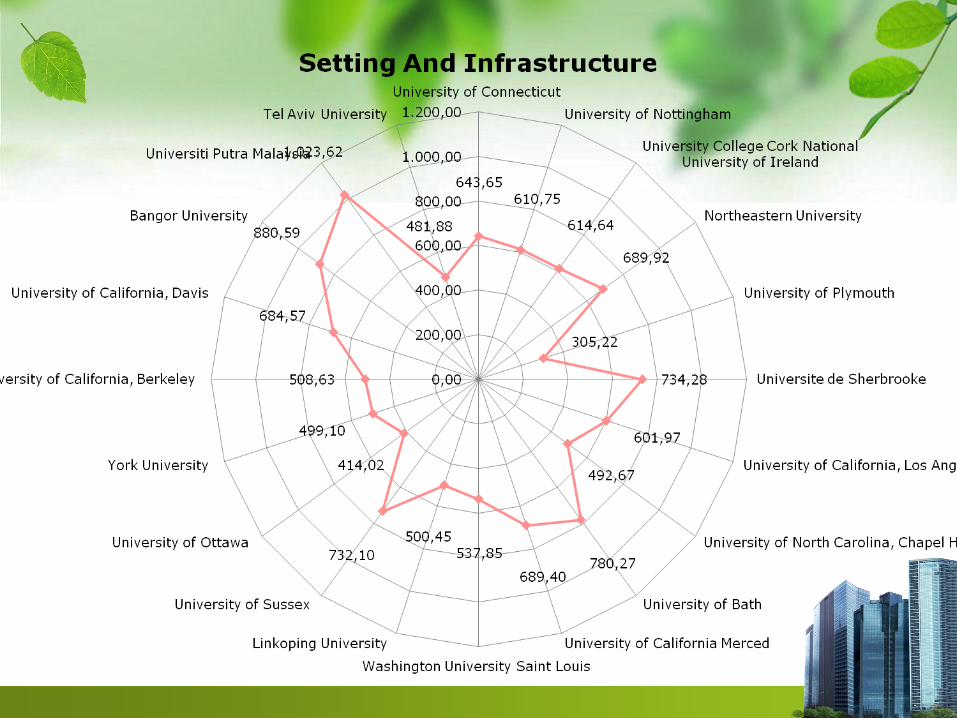
Setting and
Infrastructure
Total campus, Total ground floor area of buildings, Number of students,
Number of academic and administrative staff, Area on campus covered in
vegetation in the form of forest, Area on campus covered in planted
vegetation, Retention: non-retentive surfaces on campus as percentage of
total for water absorption, Percentage of university budget for sustainability
effort
6 1500 15
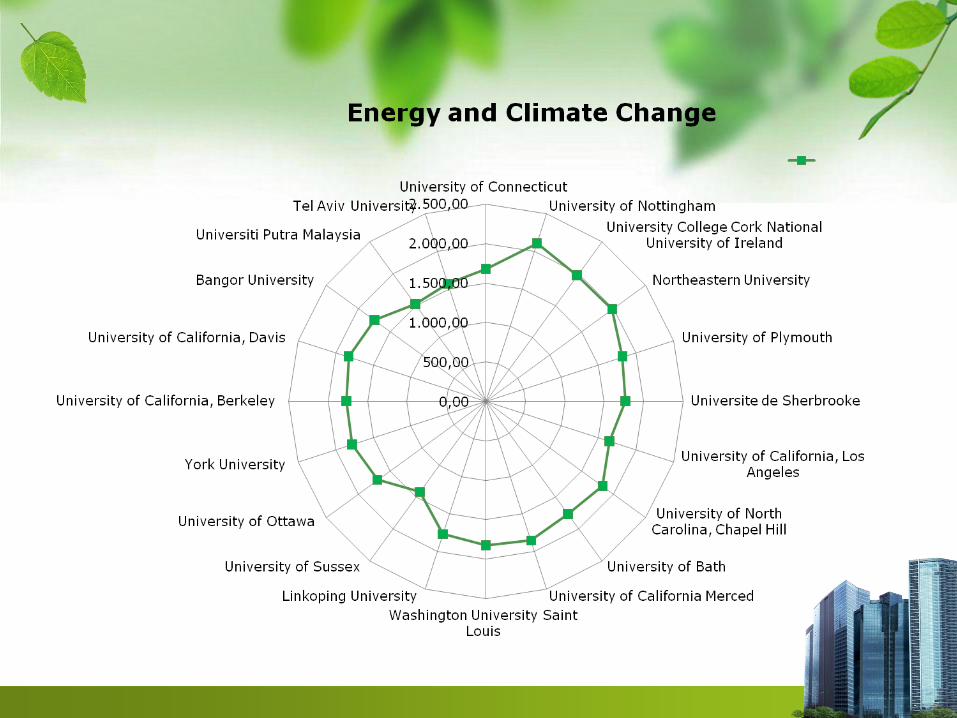
Energy and
Climate
Change
Energy efficient appliances usage, Renewable energy usage policy,
Electricity usage per year, Energy conservation, Green building, Climate
change adaptation and mitigation program , Greenhouse gas emission
7 2100 21
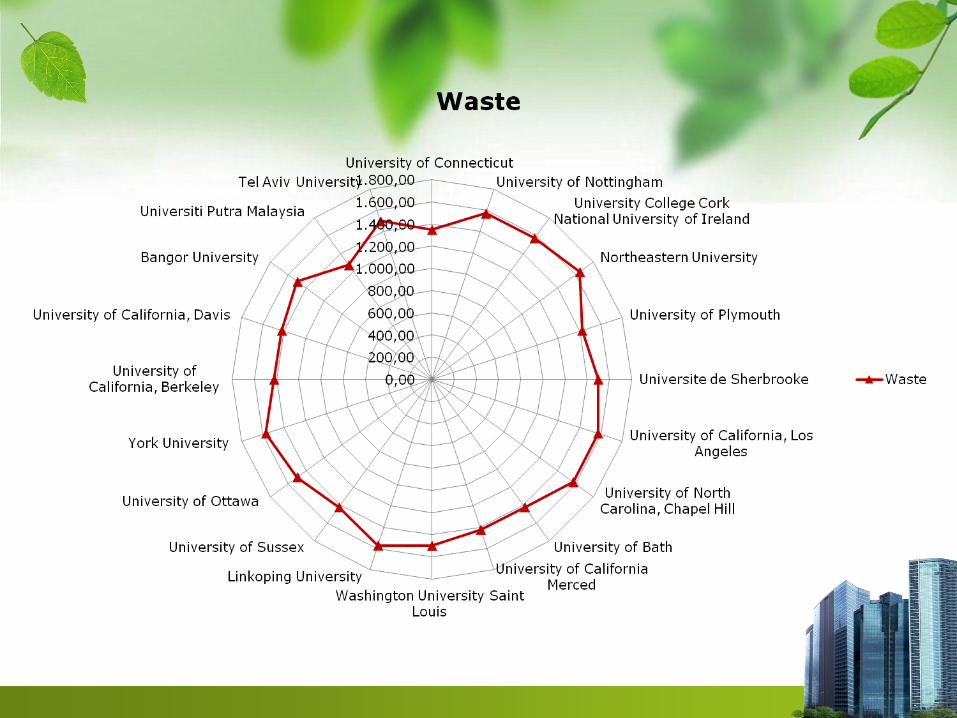
Waste
Recycling program for university waste, Toxic waste recycling, Organic
waste treatment, Sewerage disposal, Policy to reduce the use of paper and
plastic in campus
6 1600 16
Water Water conservation program, Piped water 2 200 10
Transporta-
tion
Number of vehicles owned by your institution, Number of cars entering the
university daily, Transportation policy designed to limit the number of motor
vehicles used on campus, Transportation policy designed to limit or
decrease the parking area on campus, Campus buses, Bicycle and
pedestrian policy on campus
6 1800 18
Education
Number of courses related to environment and sustainability offered, Total
number of courses offered, Total research funds dedicated to environmental
and sustainability research, Total research funds, Number of scholarly
publications on environment and sustainability published, Number of
scholarly events related to environment and sustainability, Number of
student organizations related to environment and sustainability, Existence
of a university-run sustainability website
6 600 18
Total 34 10000 100%
Questionaire of UI Greenmetric
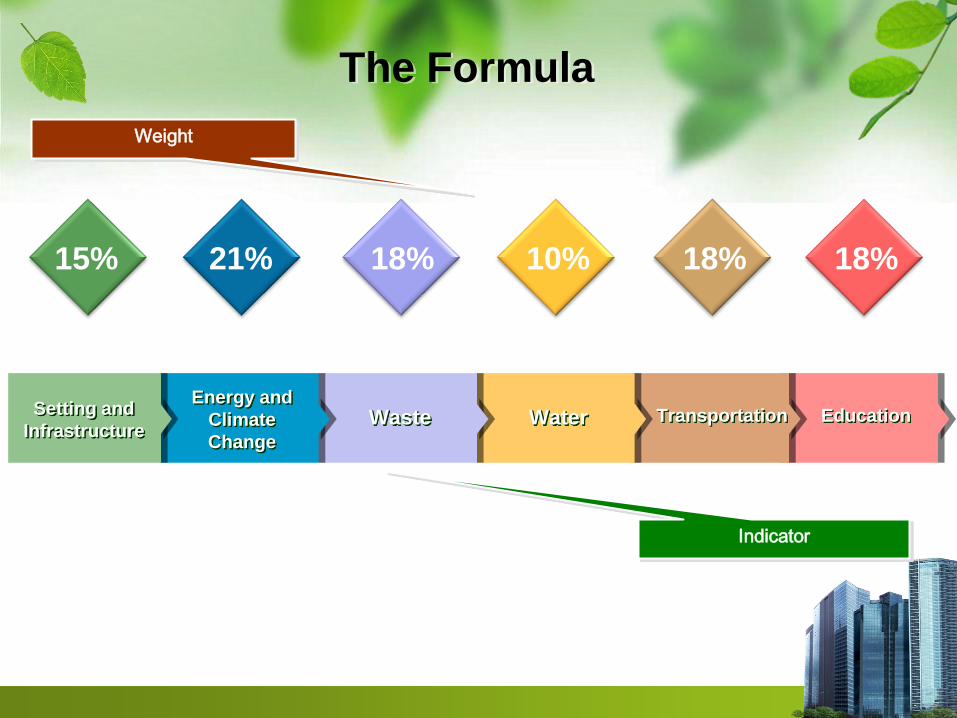
The Formula
Setting and
Infrastructure
Energy and
Climate
Change
Waste Water Transportation Education
15% 21% 18% 10% 18% 18%
Weight
Indicator
Participant (All Region)
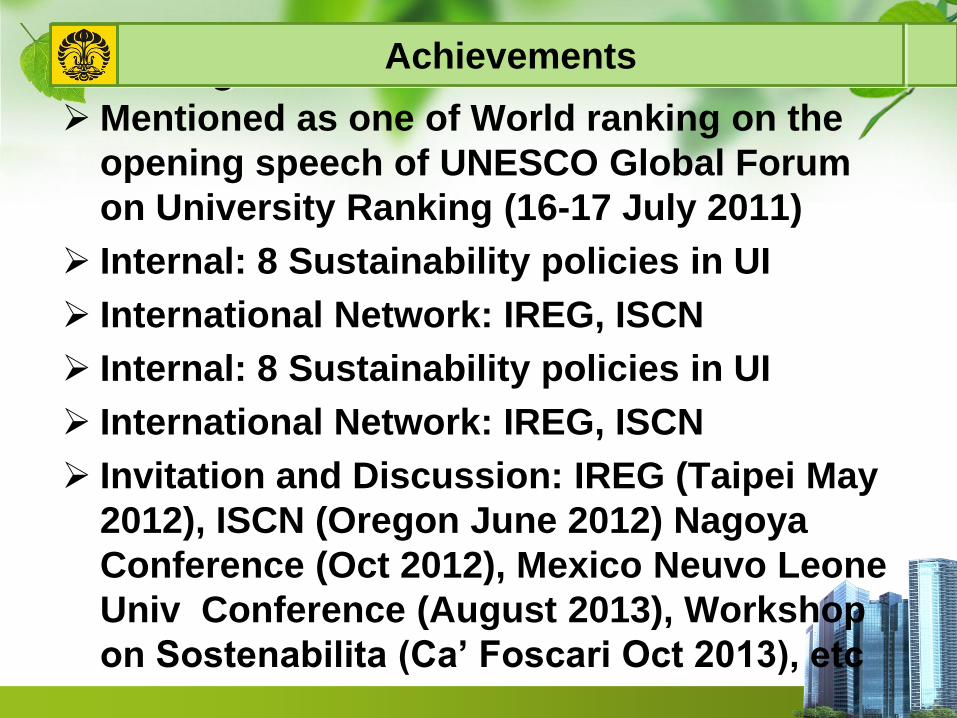
Berbagai Prestasi Mentioned as one of World ranking on the
opening speech of UNESCO Global Forum
on University Ranking (16-17 July 2011)
Internal: 8 Sustainability policies in UI
International Network: IREG, ISCN
Internal: 8 Sustainability policies in UI
International Network: IREG, ISCN
Invitation and Discussion: IREG (Taipei May
2012), ISCN (Oregon June 2012) Nagoya
Conference (Oct 2012), Mexico Neuvo Leone
Univ Conference (August 2013), Workshop
on Sostenabilita (Ca’ Foscari Oct 2013), etc
Achievements Achievements
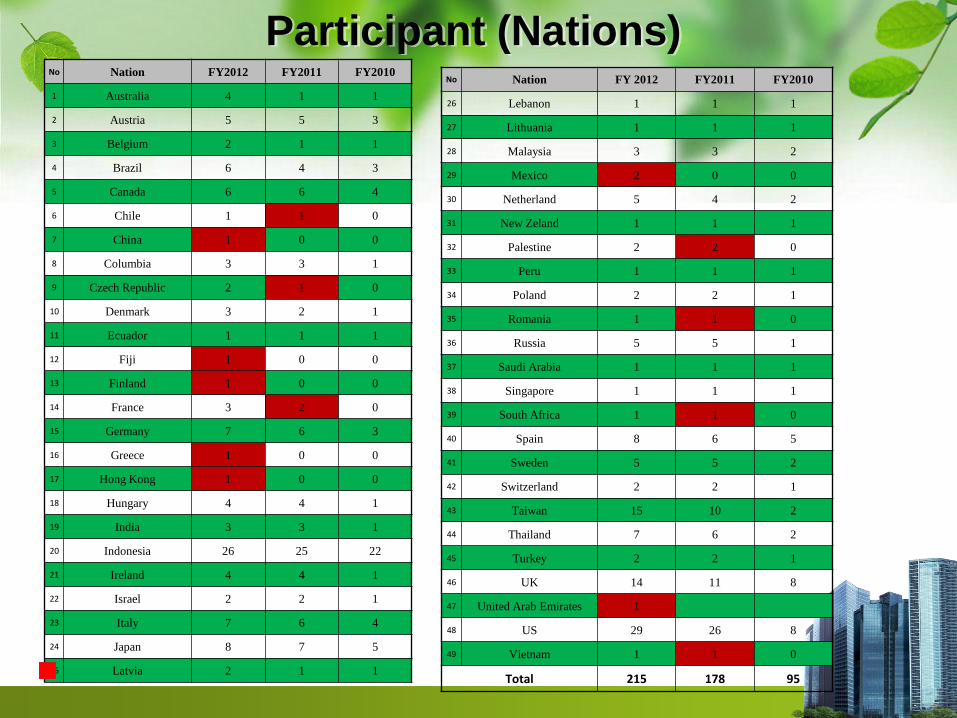
Participant (Nations) No Nation FY2012 FY2011 FY2010
1 Australia 4 1 1
2 Austria 5 5 3
3 Belgium 2 1 1
4 Brazil 6 4 3
5 Canada 6 6 4
6 Chile 1 1 0
7 China 1 0 0
8 Columbia 3 3 1
9 Czech Republic 2 1 0
10 Denmark 3 2 1
11 Ecuador 1 1 1
12 Fiji 1 0 0
13 Finland 1 0 0
14 France 3 2 0
15 Germany 7 6 3
16 Greece 1 0 0
17 Hong Kong 1 0 0
18 Hungary 4 4 1
19 India 3 3 1
20 Indonesia 26 25 22
21 Ireland 4 4 1
22 Israel 2 2 1
23 Italy 7 6 4
24 Japan 8 7 5
25 Latvia 2 1 1
No Nation FY 2012 FY2011 FY2010
26 Lebanon 1 1 1
27 Lithuania 1 1 1
28 Malaysia 3 3 2
29 Mexico 2 0 0
30 Netherland 5 4 2
31 New Zeland 1 1 1
32 Palestine 2 2 0
33 Peru 1 1 1
34 Poland 2 2 1
35 Romania 1 1 0
36 Russia 5 5 1
37 Saudi Arabia 1 1 1
38 Singapore 1 1 1
39 South Africa 1 1 0
40 Spain 8 6 5
41 Sweden 5 5 2
42 Switzerland 2 2 1
43 Taiwan 15 10 2
44 Thailand 7 6 2
45 Turkey 2 2 1
46 UK 14 11 8
47 United Arab Emirates 1
48 US 29 26 8
49 Vietnam 1 1 0
Total 215 178 95
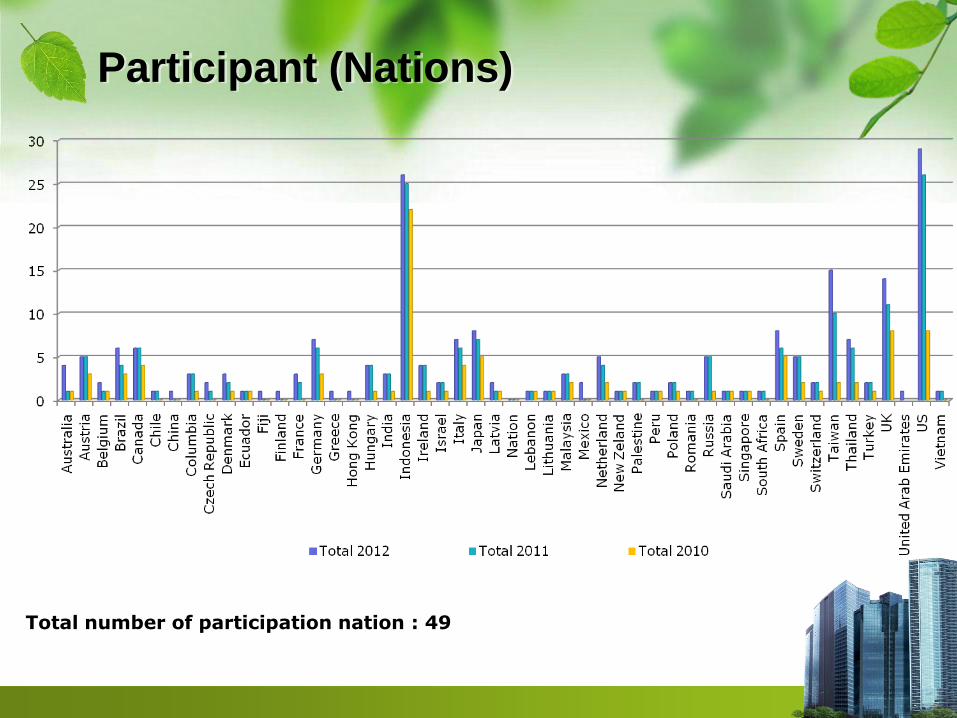
Participant (Nations)
Total number of participation nation : 49
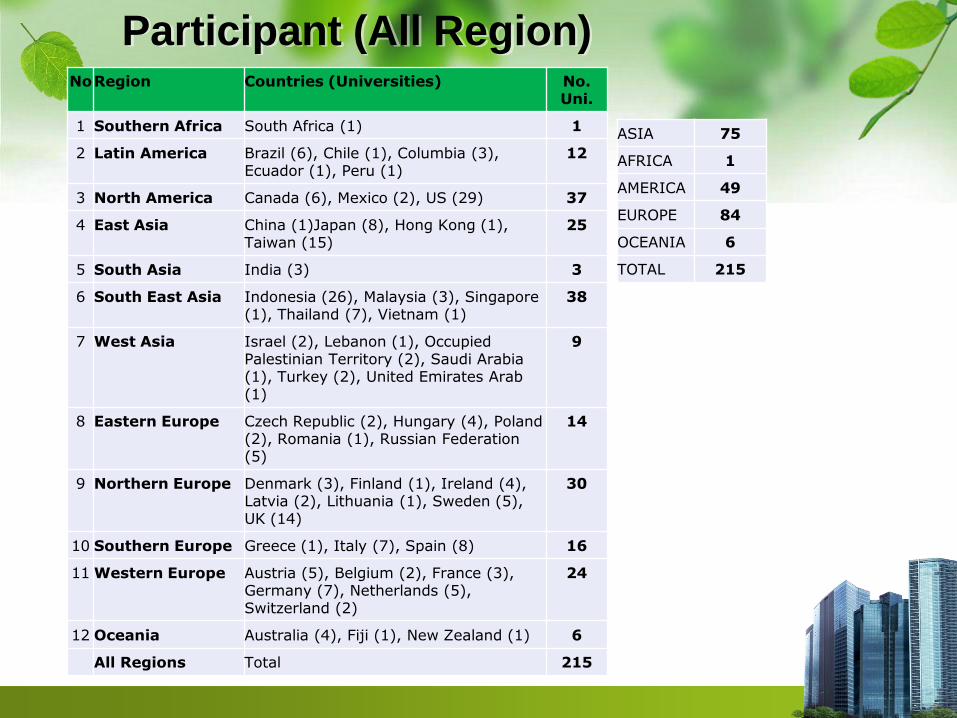
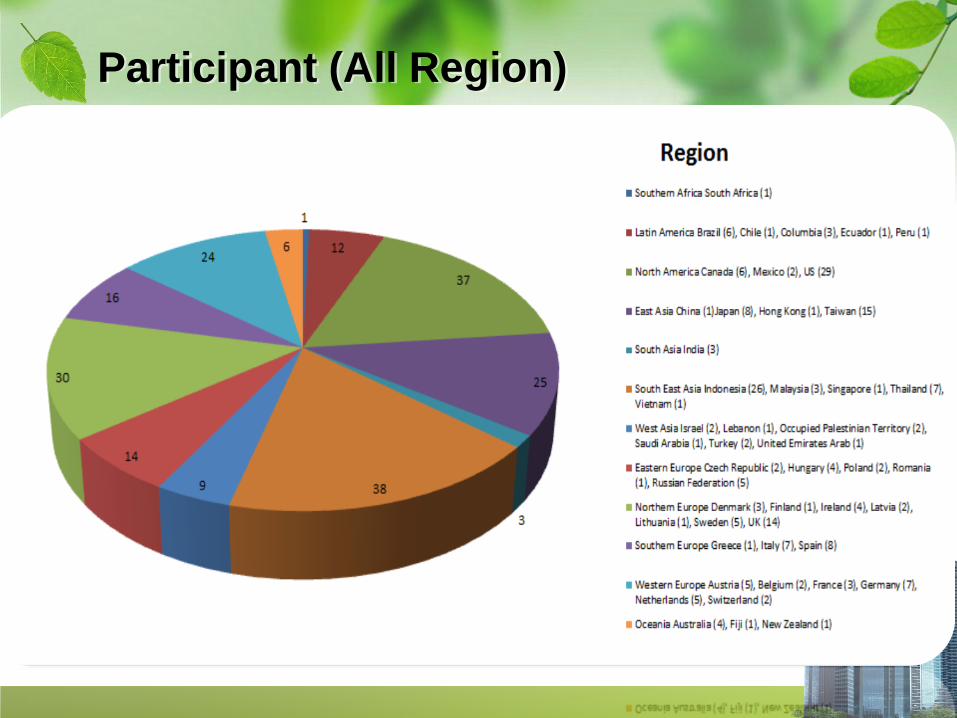
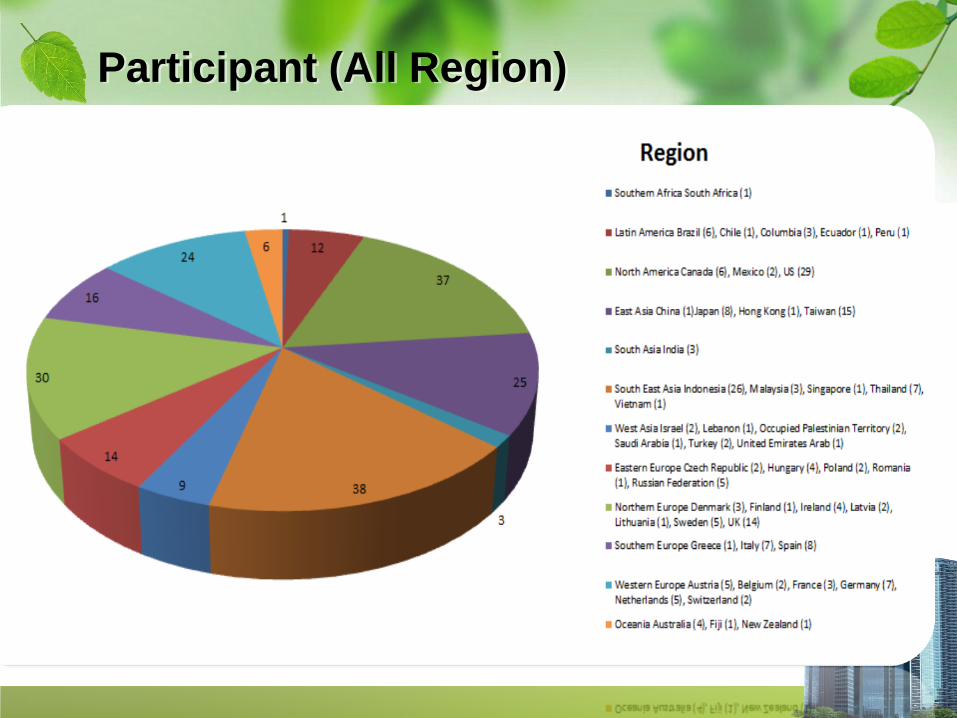
Participant (All Region) No Region Countries (Universities) No.
Uni.
1 Southern Africa South Africa (1) 1
2 Latin America Brazil (6), Chile (1), Columbia (3), Ecuador (1), Peru (1)
12
3 North America Canada (6), Mexico (2), US (29) 37
4 East Asia China (1)Japan (8), Hong Kong (1), Taiwan (15)
25
5 South Asia India (3) 3
6 South East Asia Indonesia (26), Malaysia (3), Singapore (1), Thailand (7), Vietnam (1)
38
7 West Asia Israel (2), Lebanon (1), Occupied Palestinian Territory (2), Saudi Arabia (1), Turkey (2), United Emirates Arab (1)
9
8 Eastern Europe Czech Republic (2), Hungary (4), Poland (2), Romania (1), Russian Federation (5)
14
9 Northern Europe Denmark (3), Finland (1), Ireland (4), Latvia (2), Lithuania (1), Sweden (5), UK (14)
30
10 Southern Europe Greece (1), Italy (7), Spain (8) 16
11 Western Europe Austria (5), Belgium (2), France (3), Germany (7), Netherlands (5), Switzerland (2)
24
12 Oceania Australia (4), Fiji (1), New Zealand (1) 6
All Regions Total 215
ASIA 75
AFRICA 1
AMERICA 49
EUROPE 84
OCEANIA 6
TOTAL 215
Participant (All Region)
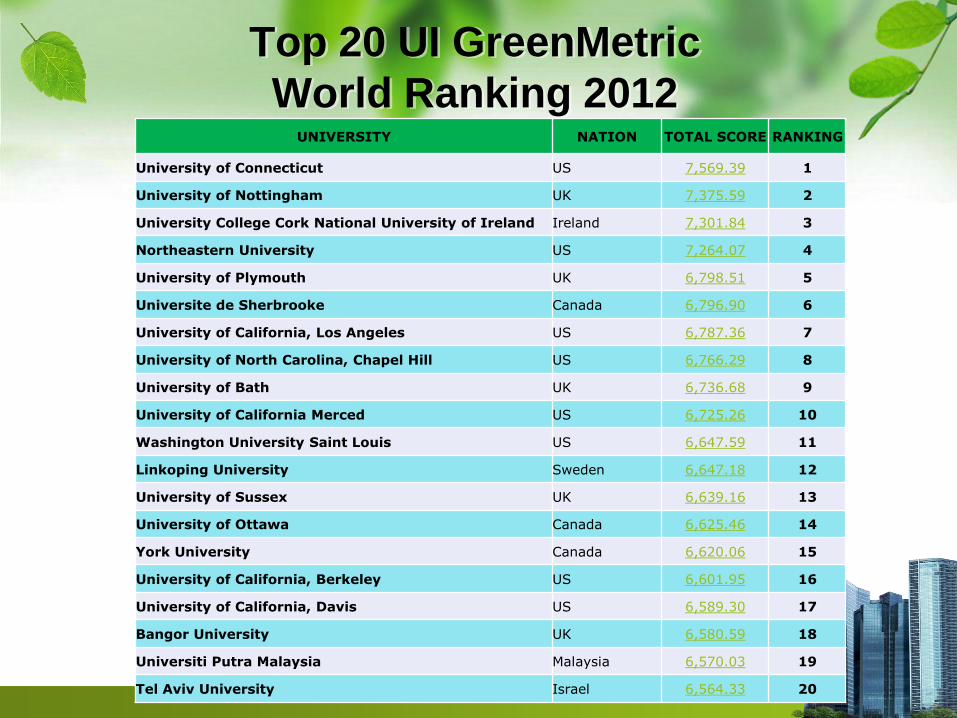
Top 20 UI GreenMetric
World Ranking 2012 UNIVERSITY NATION TOTAL SCORE RANKING
University of Connecticut US 7,569.39 1
University of Nottingham UK 7,375.59 2
University College Cork National University of Ireland Ireland 7,301.84 3
Northeastern University US 7,264.07 4
University of Plymouth UK 6,798.51 5
Universite de Sherbrooke Canada 6,796.90 6
University of California, Los Angeles US 6,787.36 7
University of North Carolina, Chapel Hill US 6,766.29 8
University of Bath UK 6,736.68 9
University of California Merced US 6,725.26 10
Washington University Saint Louis US 6,647.59 11
Linkoping University Sweden 6,647.18 12
University of Sussex UK 6,639.16 13
University of Ottawa Canada 6,625.46 14
York University Canada 6,620.06 15
University of California, Berkeley US 6,601.95 16
University of California, Davis US 6,589.30 17
Bangor University UK 6,580.59 18
Universiti Putra Malaysia Malaysia 6,570.03 19
Tel Aviv University Israel 6,564.33 20
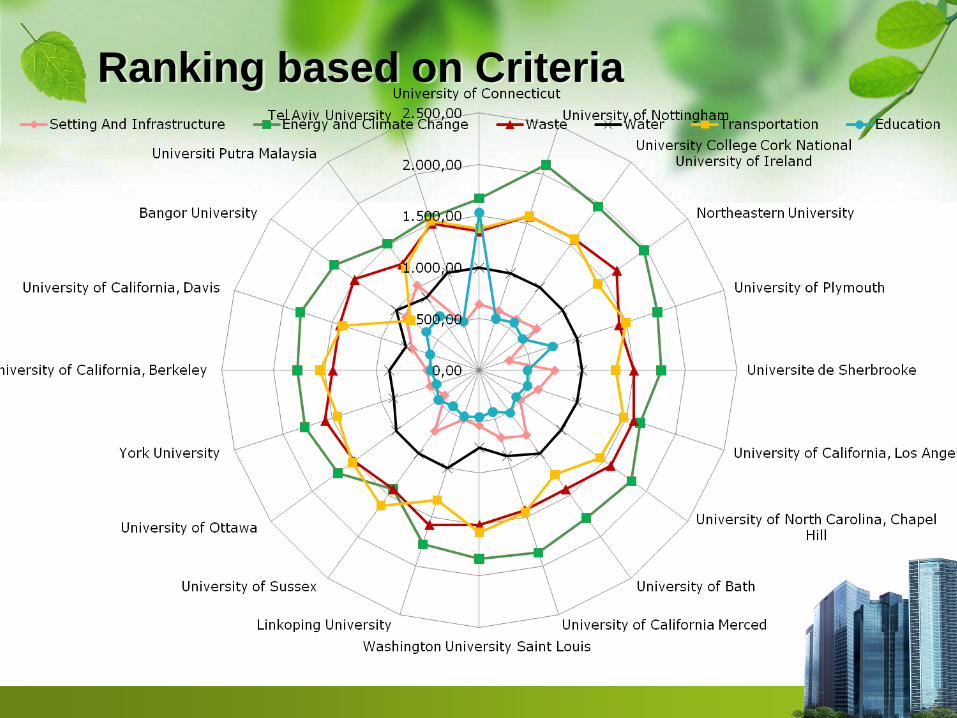
Ranking based on Criteria
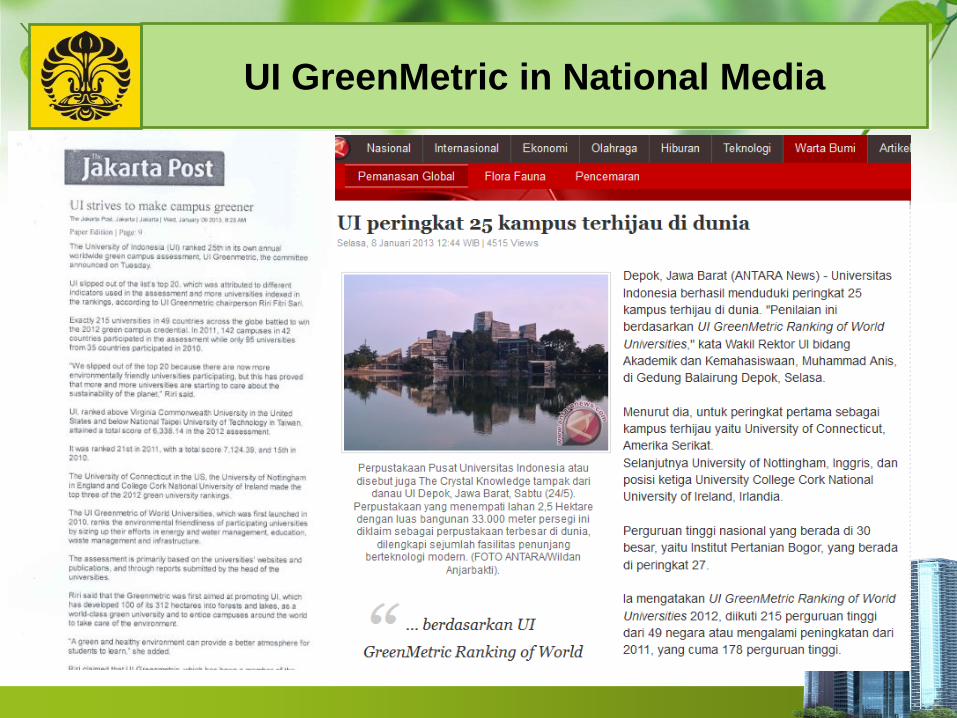
UI GreenMetric in National Media
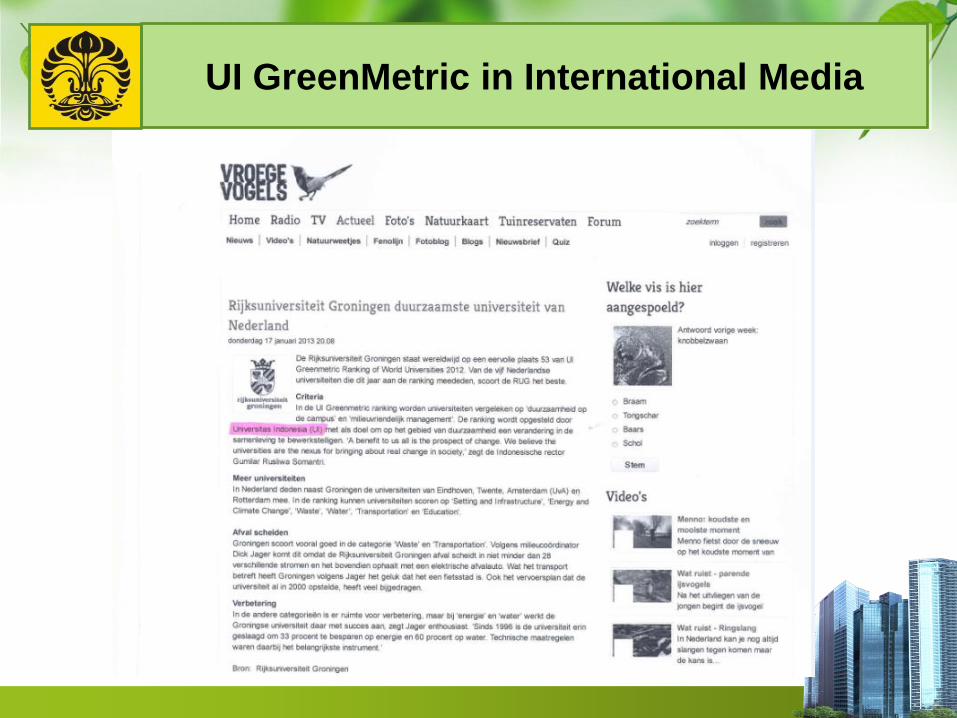
UI GreenMetric in International Media
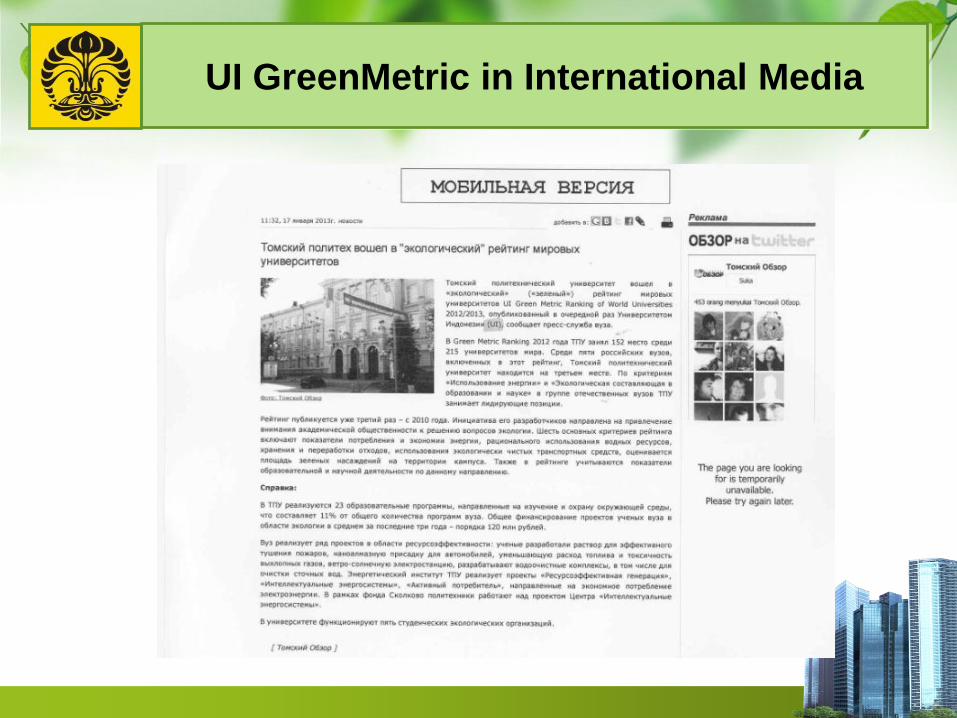
UI GreenMetric in International Media
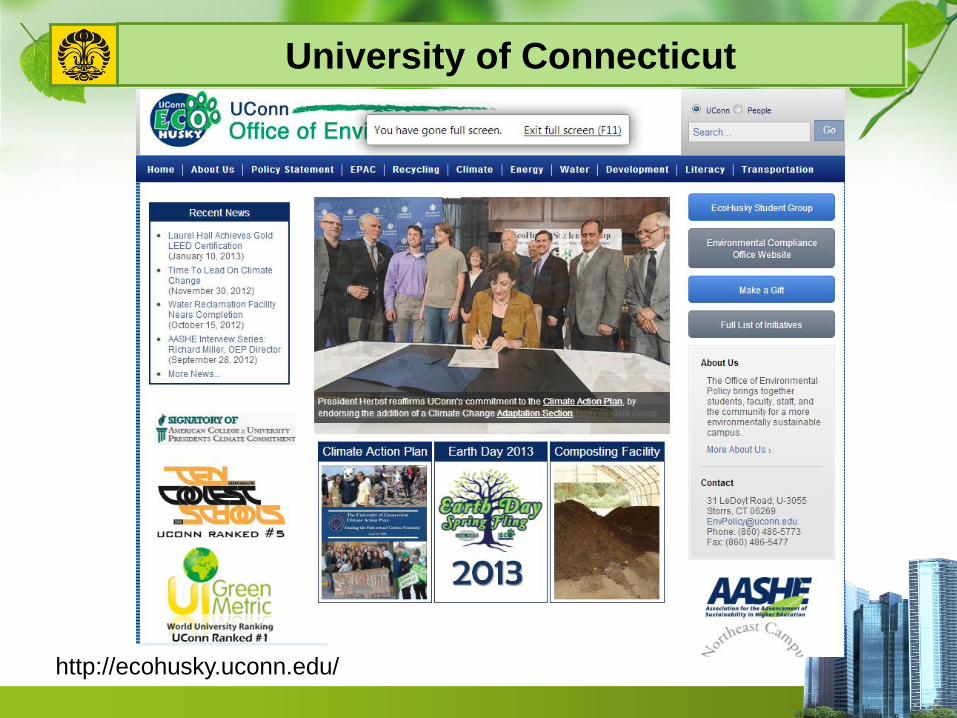
University of Connecticut
http://ecohusky.uconn.edu/
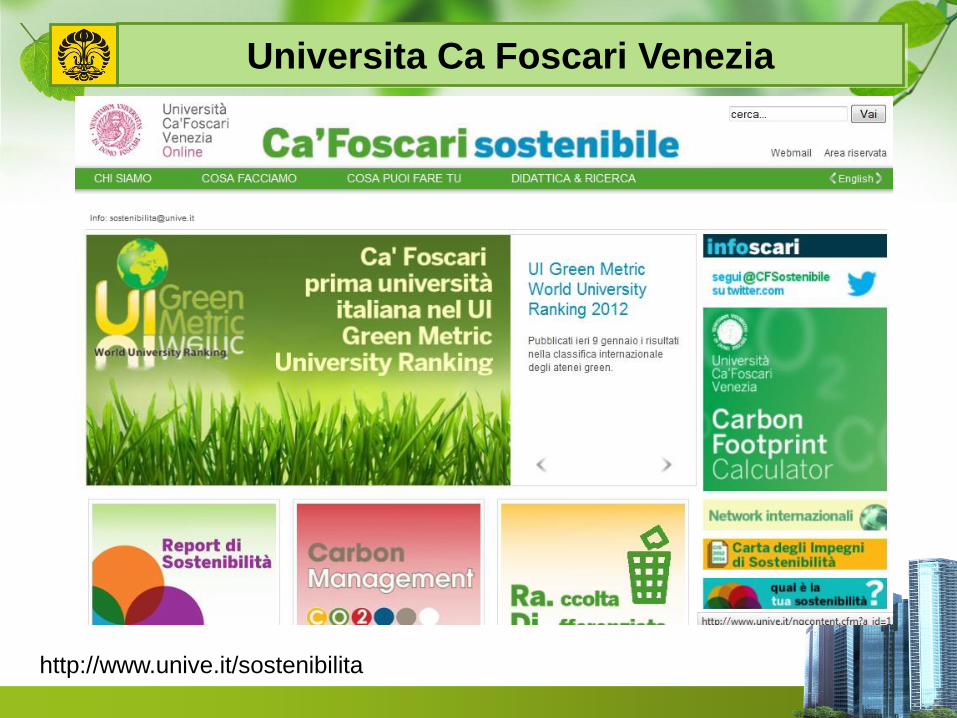
http://www.unive.it/sostenibilita
Universita Ca Foscari Venezia
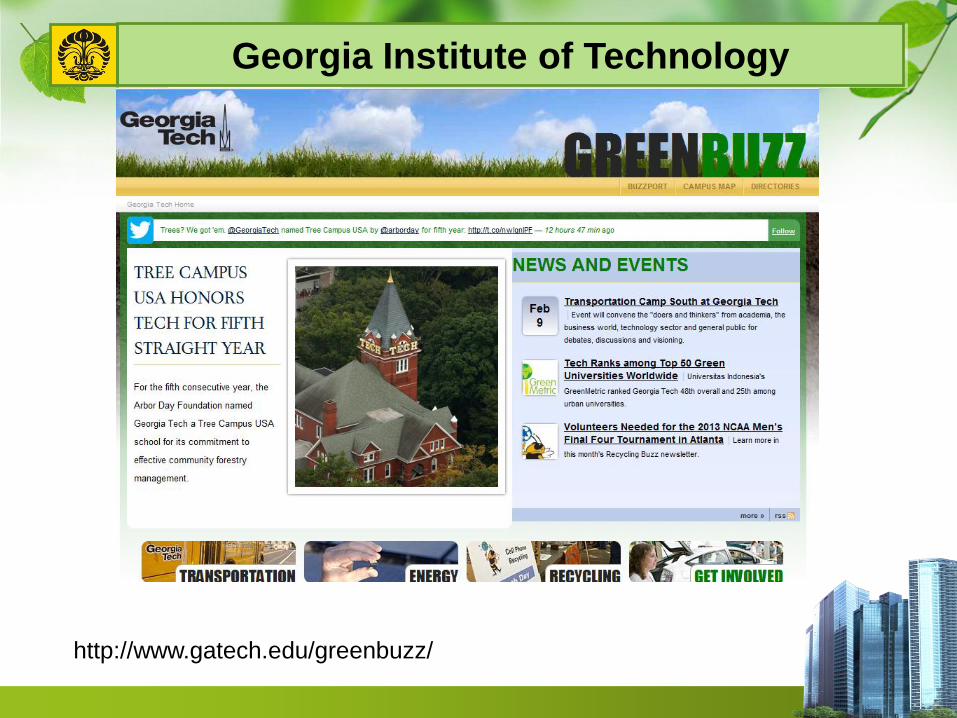
http://www.gatech.edu/greenbuzz/
Georgia Institute of Technology
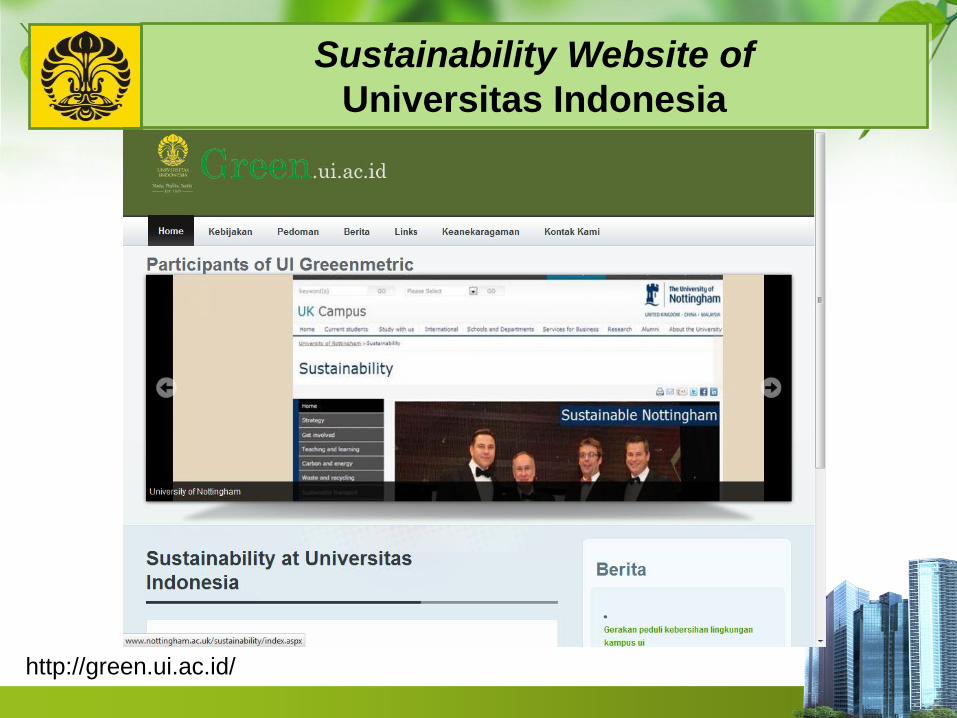
http://green.ui.ac.id/
Sustainability Website of
Universitas Indonesia
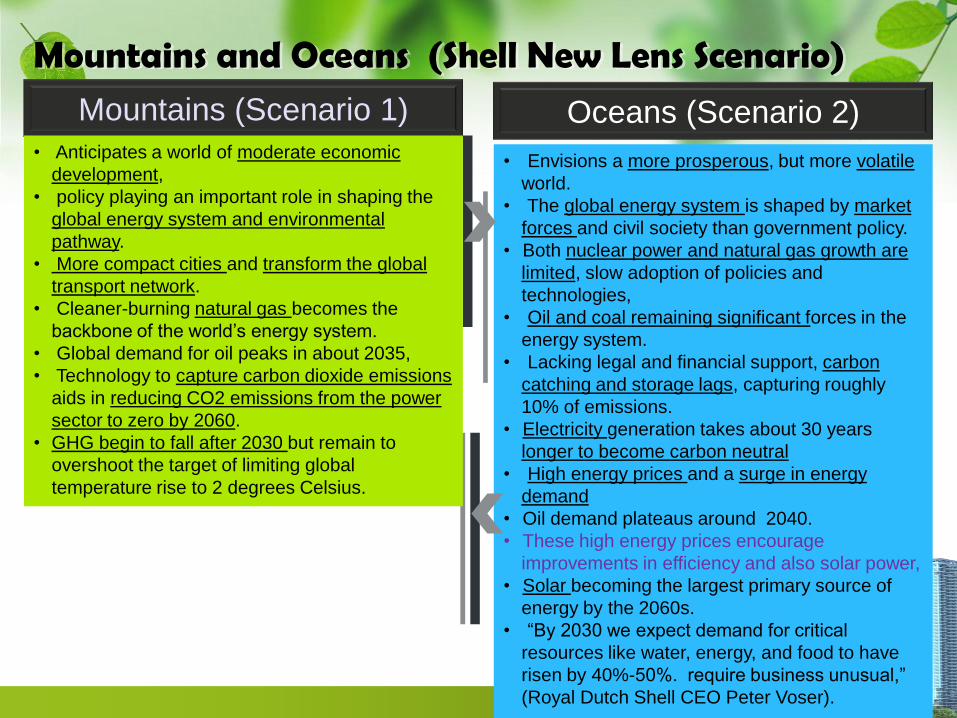
Mountains and Oceans (Shell New Lens Scenario)
Mountains (Scenario 1) Oceans (Scenario 2) • Anticipates a world of moderate economic
development,
• policy playing an important role in shaping the
global energy system and environmental
pathway.
• More compact cities and transform the global
transport network.
• Cleaner-burning natural gas becomes the
backbone of the world’s energy system.
• Global demand for oil peaks in about 2035,
• Technology to capture carbon dioxide emissions
aids in reducing CO2 emissions from the power
sector to zero by 2060.
• GHG begin to fall after 2030 but remain to
overshoot the target of limiting global
temperature rise to 2 degrees Celsius.
• Envisions a more prosperous, but more volatile
world.
• The global energy system is shaped by market
forces and civil society than government policy.
• Both nuclear power and natural gas growth are
limited, slow adoption of policies and
technologies,
• Oil and coal remaining significant forces in the
energy system.
• Lacking legal and financial support, carbon
catching and storage lags, capturing roughly
10% of emissions.
• Electricity generation takes about 30 years
longer to become carbon neutral
• High energy prices and a surge in energy
demand
• Oil demand plateaus around 2040.
• These high energy prices encourage
improvements in efficiency and also solar power,
• Solar becoming the largest primary source of
energy by the 2060s.
• “By 2030 we expect demand for critical
resources like water, energy, and food to have
risen by 40%-50%. require business unusual,”
(Royal Dutch Shell CEO Peter Voser).
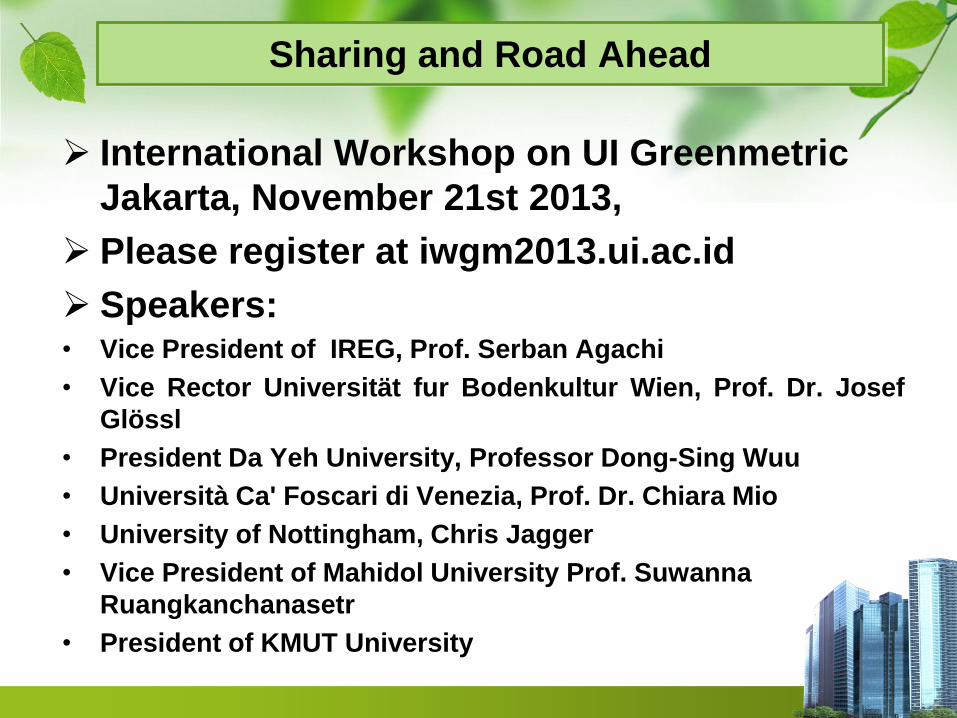
International Workshop on UI Greenmetric
Jakarta, November 21st 2013,
Please register at iwgm2013.ui.ac.id
Speakers: • Vice President of IREG, Prof. Serban Agachi
• Vice Rector Universität fur Bodenkultur Wien, Prof. Dr. Josef
Glössl
• President Da Yeh University, Professor Dong-Sing Wuu
• Università Ca' Foscari di Venezia, Prof. Dr. Chiara Mio
• University of Nottingham, Chris Jagger
• Vice President of Mahidol University Prof. Suwanna
Ruangkanchanasetr
• President of KMUT University
Sharing and Road Ahead
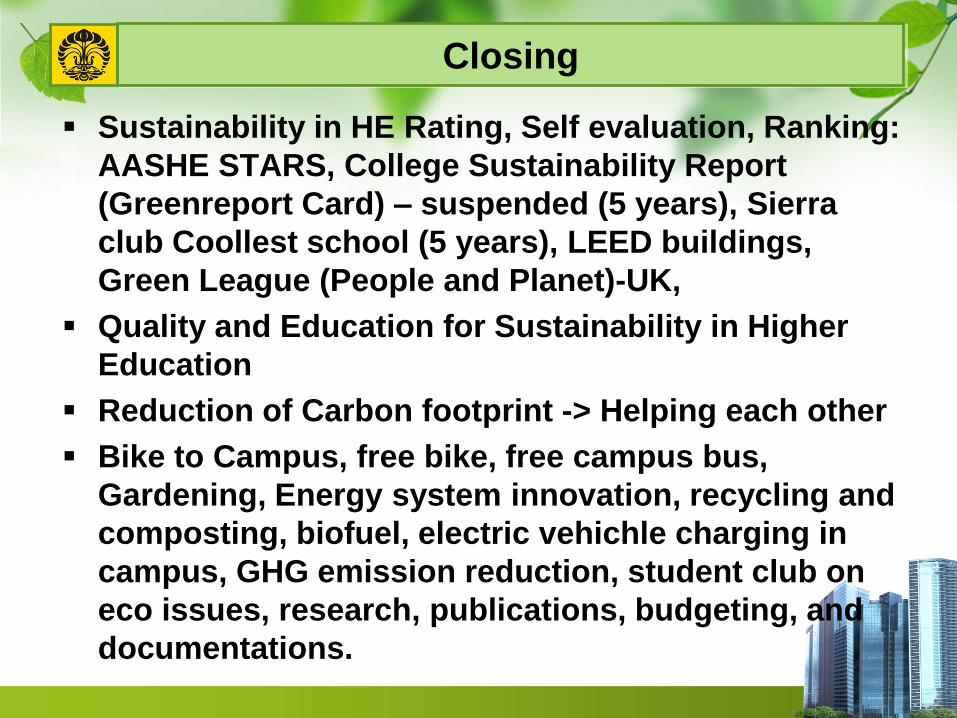
Sustainability in HE Rating, Self evaluation, Ranking:
AASHE STARS, College Sustainability Report
(Greenreport Card) – suspended (5 years), Sierra
club Coollest school (5 years), LEED buildings,
Green League (People and Planet)-UK,
Quality and Education for Sustainability in Higher
Education
Reduction of Carbon footprint -> Helping each other
Bike to Campus, free bike, free campus bus,
Gardening, Energy system innovation, recycling and
composting, biofuel, electric vehichle charging in
campus, GHG emission reduction, student club on
eco issues, research, publications, budgeting, and
documentations.
Closing
Thank you
riri@ui,ac,ud
UI GreenMetric 2013


![IEEE GoogleTV.ppt [Read-Only] · 21 41 Why do you care? Better UI Perceived Quality + Polish Better Ratings Better App Ranking More Installs/Purchases PROFIT! 42 10’ UI •Traditionally](https://img.pdfslide.us/doc/110x75/5fa1e21ec073f719dc091cec/ieee-read-only-21-41-why-do-you-care-better-ui-perceived-quality-polish-better.jpg)