Embed Size (px)
Citation preview
Evaluation of UI GreenMetric 2010 – 2015:Challenges and OpportunityProf. Dr. Ir. Riri Fitri Sari, MSc, MM & Dr. Baiduri WidanarkoChairperson of UI [email protected] of Indonesia
Outline
Introduction
Evaluation of UI GreenMetric
Challenges and Opportunity
Introduction to UI GreenMetric
Overview
• UI GreenMetric World University Ranking was established in April 2010
• It is open for global participation
• It is open for all HEIs in both the developed and developing world
• It contributes to academic discourse on sustainability in education and the greening of campuses
• It encourages university-led social change in the areas of sustainability
• In line with the
– UN Sustainable Development Goals
– UNESCO program of Education of Sustainability in Higher Education
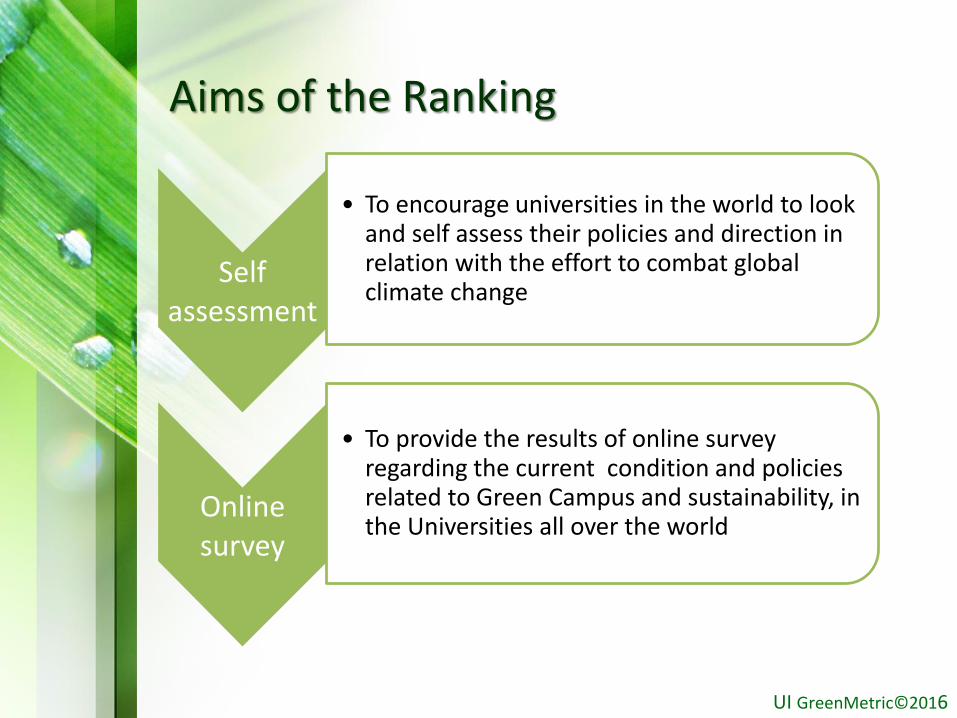
Aims of the Ranking
Self assessment
• To encourage universities in the world to look and self assess their policies and direction in relation with the effort to combat global climate change
Online survey
• To provide the results of online survey regarding the current condition and policies related to Green Campus and sustainability, in the Universities all over the world
UI GreenMetric©2016
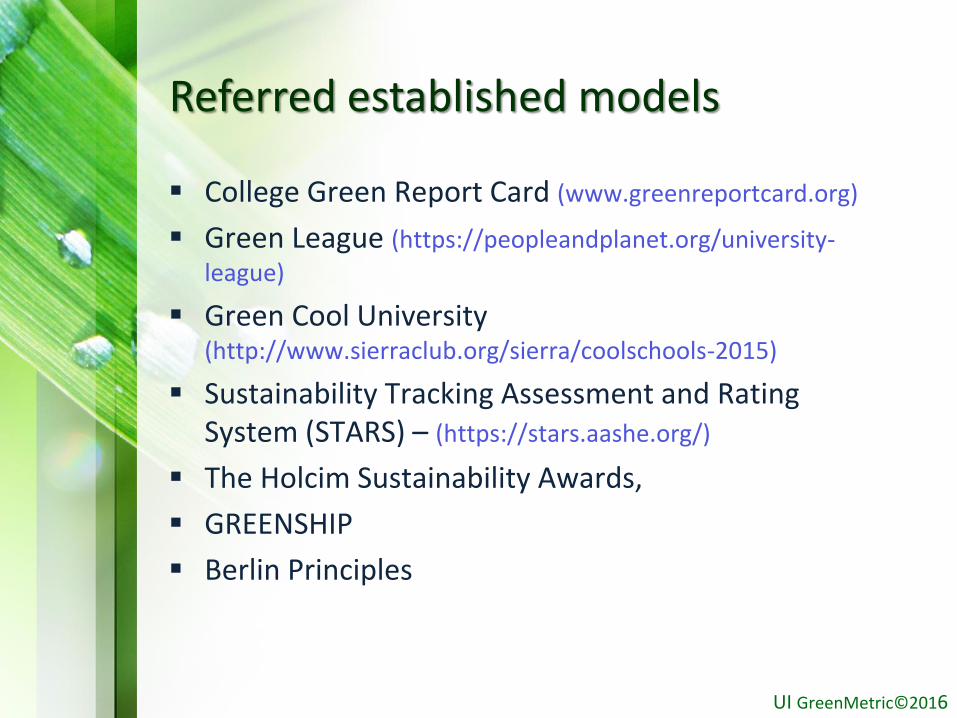
Referred established models
College Green Report Card (www.greenreportcard.org)
Green League (https://peopleandplanet.org/university-
league)
Green Cool University (http://www.sierraclub.org/sierra/coolschools-2015)
Sustainability Tracking Assessment and Rating System (STARS) – (https://stars.aashe.org/)
The Holcim Sustainability Awards,
GREENSHIP
Berlin Principles
UI GreenMetric©2016

Environmental Sustainability Concept
UI GreenMetric©2016
Environment
SocialEconomic
Environmental Sustainibility Concept
• Education• Community• Social
involvement
• Natural resource use• Environmental
management• Pollution prevention
• Profit• Cost saving
In 2010, UI GreenMetric instrument was developed based on environmental sustainabilty concept
Evaluation of UI GreenMetric
UI GreenMetric©2016
Evaluation of UI GreenMetric
• Instrument
• Participants
• University networking
UI GreenMetric©2016
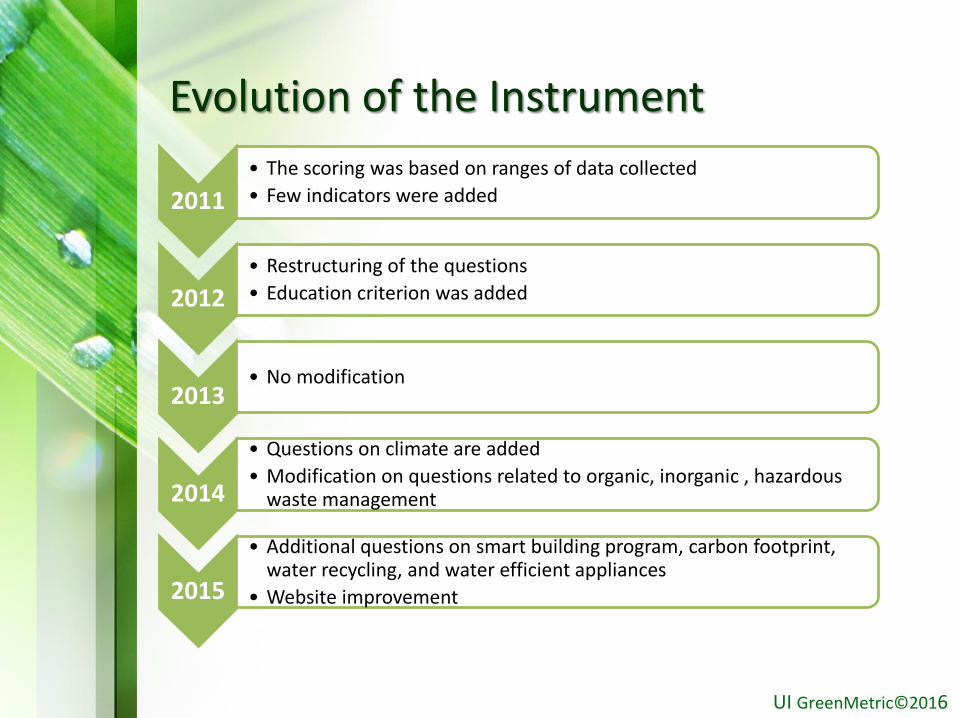
Evolution of the Instrument
UI GreenMetric©2016
2011
• The scoring was based on ranges of data collected
• Few indicators were added
2012
• Restructuring of the questions
• Education criterion was added
2013• No modification
2014
• Questions on climate are added
• Modification on questions related to organic, inorganic , hazardous waste management
2015
• Additional questions on smart building program, carbon footprint, water recycling, and water efficient appliances
• Website improvement
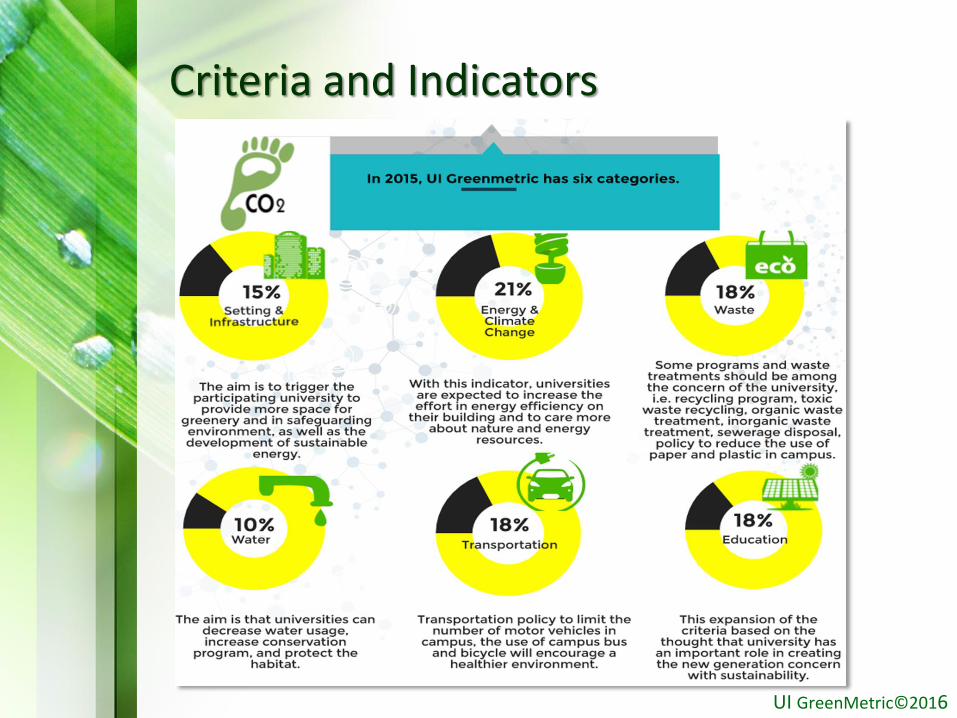
Criteria and Indicators
UI GreenMetric©2016
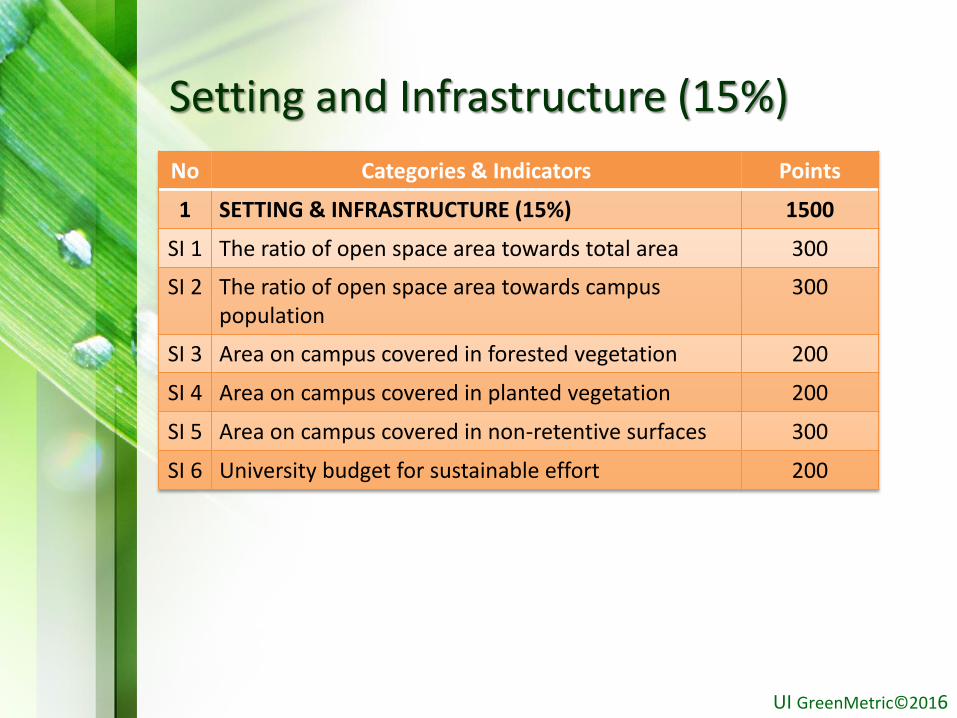
Setting and Infrastructure (15%)
No Categories & Indicators Points
1 SETTING & INFRASTRUCTURE (15%) 1500
SI 1 The ratio of open space area towards total area 300
SI 2 The ratio of open space area towards campus population
300
SI 3 Area on campus covered in forested vegetation 200
SI 4 Area on campus covered in planted vegetation 200
SI 5 Area on campus covered in non-retentive surfaces 300
SI 6 University budget for sustainable effort 200
UI GreenMetric©2016
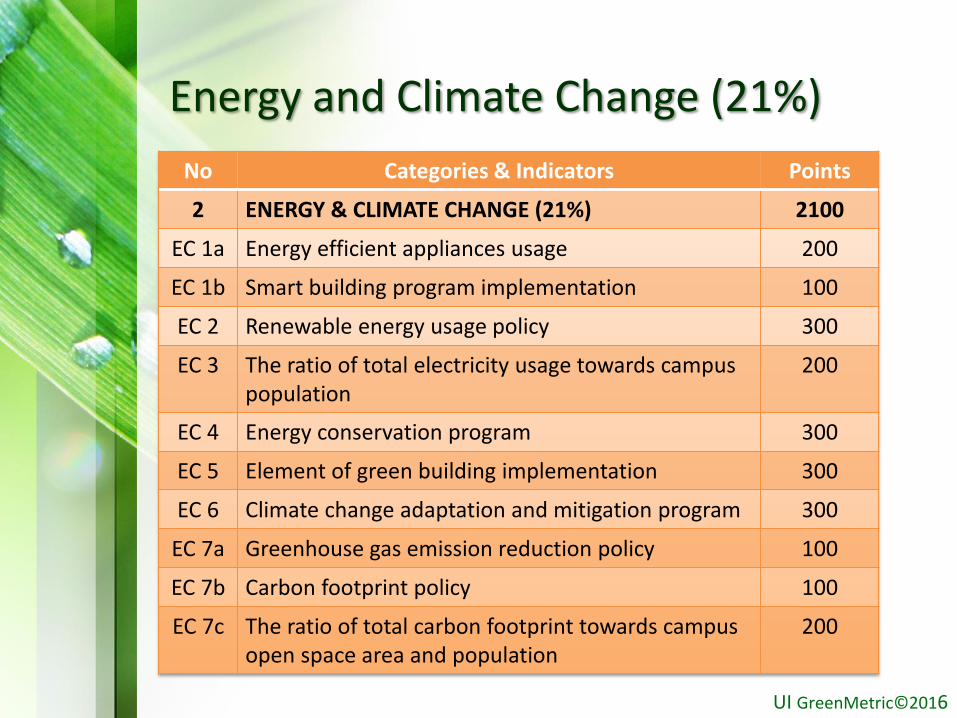
Energy and Climate Change (21%)
No Categories & Indicators Points
2 ENERGY & CLIMATE CHANGE (21%) 2100
EC 1a Energy efficient appliances usage 200
EC 1b Smart building program implementation 100
EC 2 Renewable energy usage policy 300
EC 3 The ratio of total electricity usage towards campuspopulation
200
EC 4 Energy conservation program 300
EC 5 Element of green building implementation 300
EC 6 Climate change adaptation and mitigation program 300
EC 7a Greenhouse gas emission reduction policy 100
EC 7b Carbon footprint policy 100
EC 7c The ratio of total carbon footprint towards campus open space area and population
200
UI GreenMetric©2016
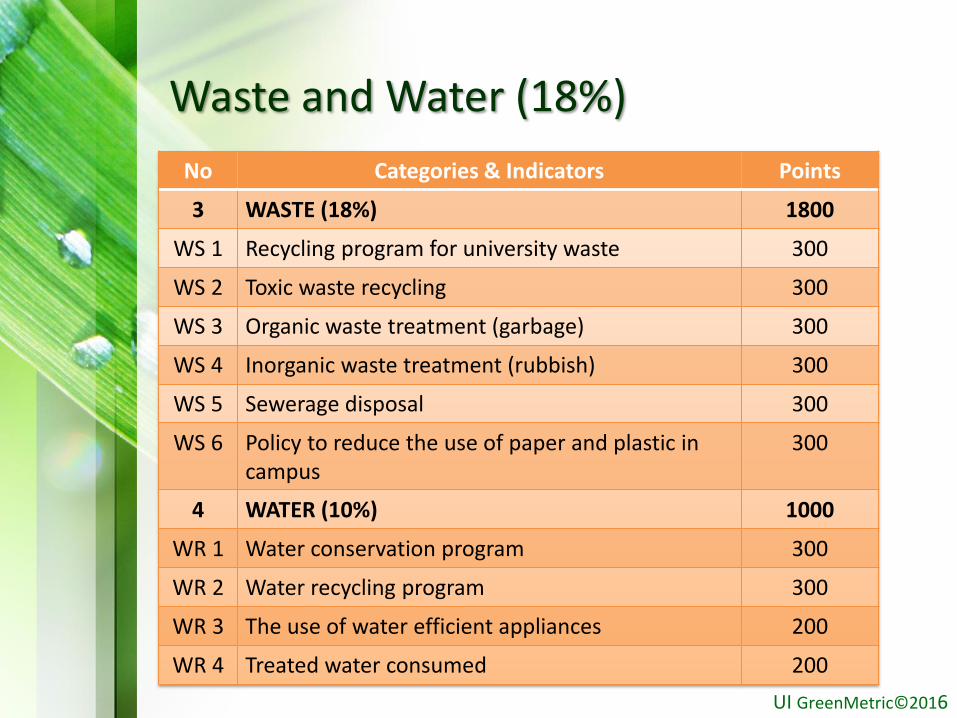
Waste and Water (18%)
No Categories & Indicators Points
3 WASTE (18%) 1800
WS 1 Recycling program for university waste 300
WS 2 Toxic waste recycling 300
WS 3 Organic waste treatment (garbage) 300
WS 4 Inorganic waste treatment (rubbish) 300
WS 5 Sewerage disposal 300
WS 6 Policy to reduce the use of paper and plastic in campus
300
4 WATER (10%) 1000
WR 1 Water conservation program 300
WR 2 Water recycling program 300
WR 3 The use of water efficient appliances 200
WR 4 Treated water consumed 200
UI GreenMetric©2016
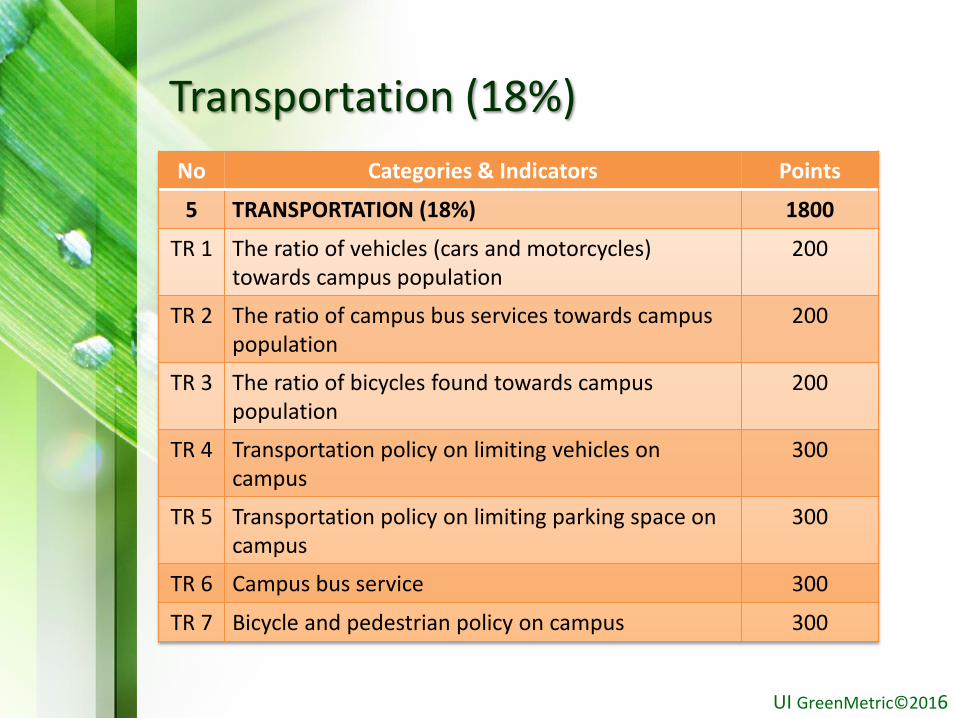
Transportation (18%)
No Categories & Indicators Points
5 TRANSPORTATION (18%) 1800
TR 1 The ratio of vehicles (cars and motorcycles) towards campus population
200
TR 2 The ratio of campus bus services towards campus population
200
TR 3 The ratio of bicycles found towards campus population
200
TR 4 Transportation policy on limiting vehicles on campus
300
TR 5 Transportation policy on limiting parking space on campus
300
TR 6 Campus bus service 300
TR 7 Bicycle and pedestrian policy on campus 300
UI GreenMetric©2016
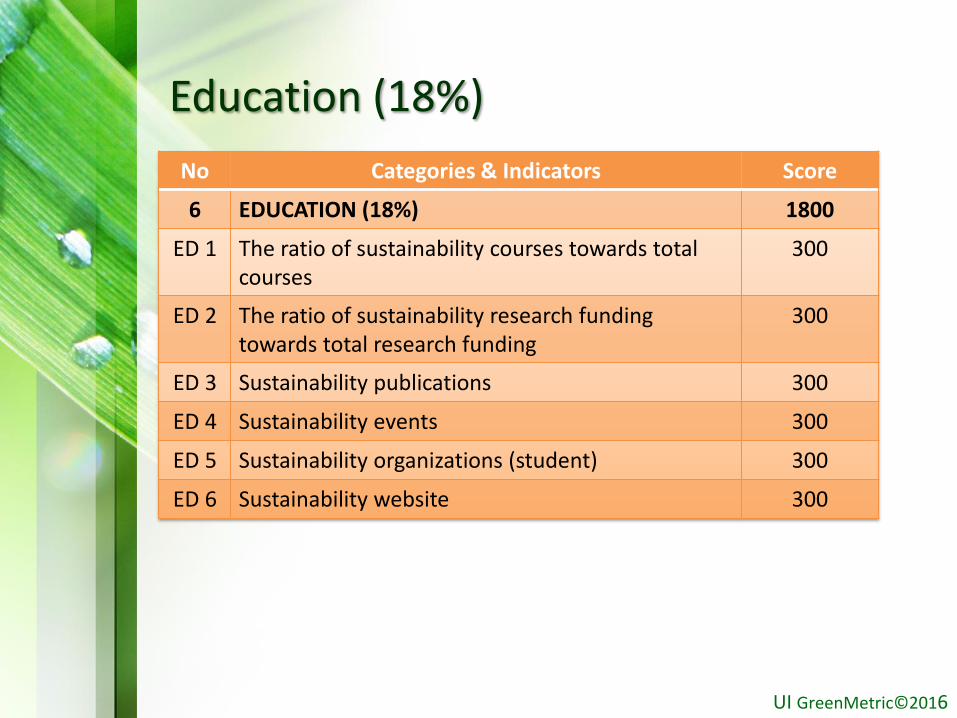
Education (18%)
No Categories & Indicators Score
6 EDUCATION (18%) 1800
ED 1 The ratio of sustainability courses towards total courses
300
ED 2 The ratio of sustainability research funding towards total research funding
300
ED 3 Sustainability publications 300
ED 4 Sustainability events 300
ED 5 Sustainability organizations (student) 300
ED 6 Sustainability website 300
UI GreenMetric©2016
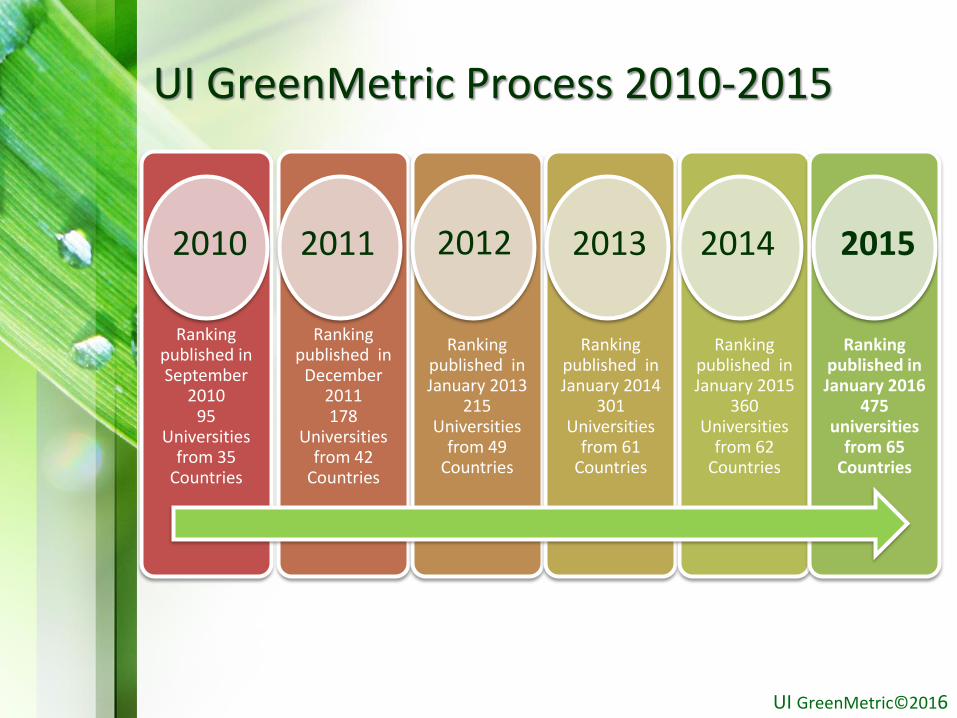
Ranking published in September
201095
Universities from 35
Countries
Ranking published in
December 2011178
Universities from 42
Countries
Ranking published in January 2013
215 Universities
from 49 Countries
Ranking published in January 2014
301 Universities
from 61 Countries
Ranking published in January 2015
360 Universities
from 62 Countries
Ranking published in January 2016
475 universities
from 65 Countries
2011 2012 2013 2014
UI GreenMetric Process 2010-2015
20152010
UI GreenMetric©2016
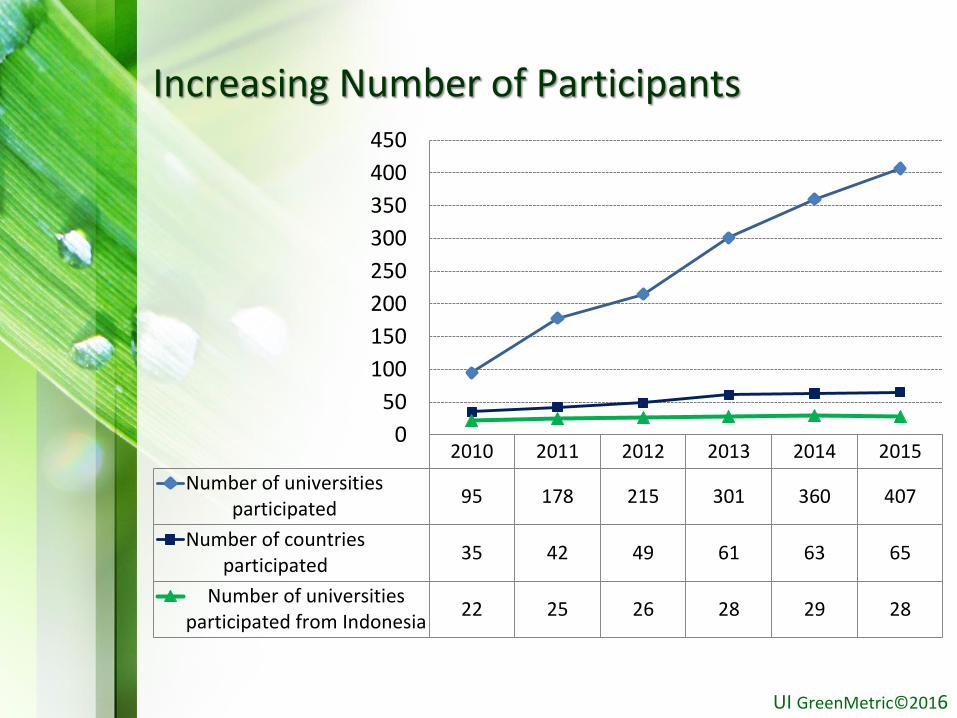
2010 2011 2012 2013 2014 2015
Number of universitiesparticipated
95 178 215 301 360 407
Number of countriesparticipated
35 42 49 61 63 65
Number of universitiesparticipated from Indonesia
22 25 26 28 29 28
0
50
100
150
200
250
300
350
400
450
Increasing Number of Participants
UI GreenMetric©2016
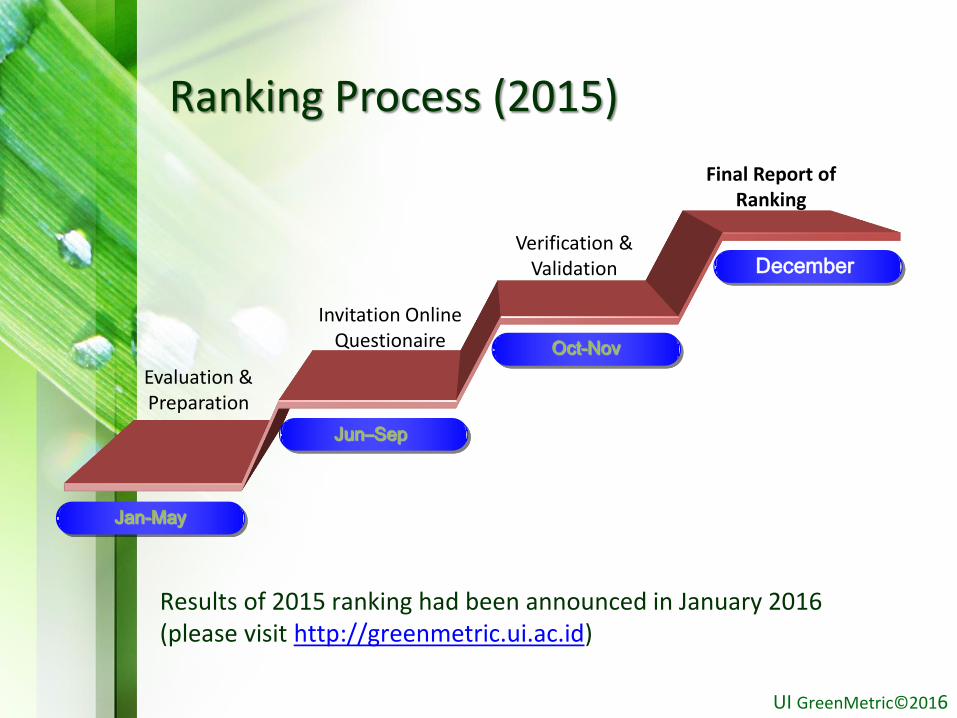
Jan-May
Evaluation & Preparation
Verification & Validation
Final Report of Ranking
Jun–Sep
Oct-Nov
December
Ranking Process (2015)
Invitation Online Questionaire
Results of 2015 ranking had been announced in January 2016 (please visit http://greenmetric.ui.ac.id)
UI GreenMetric©2016
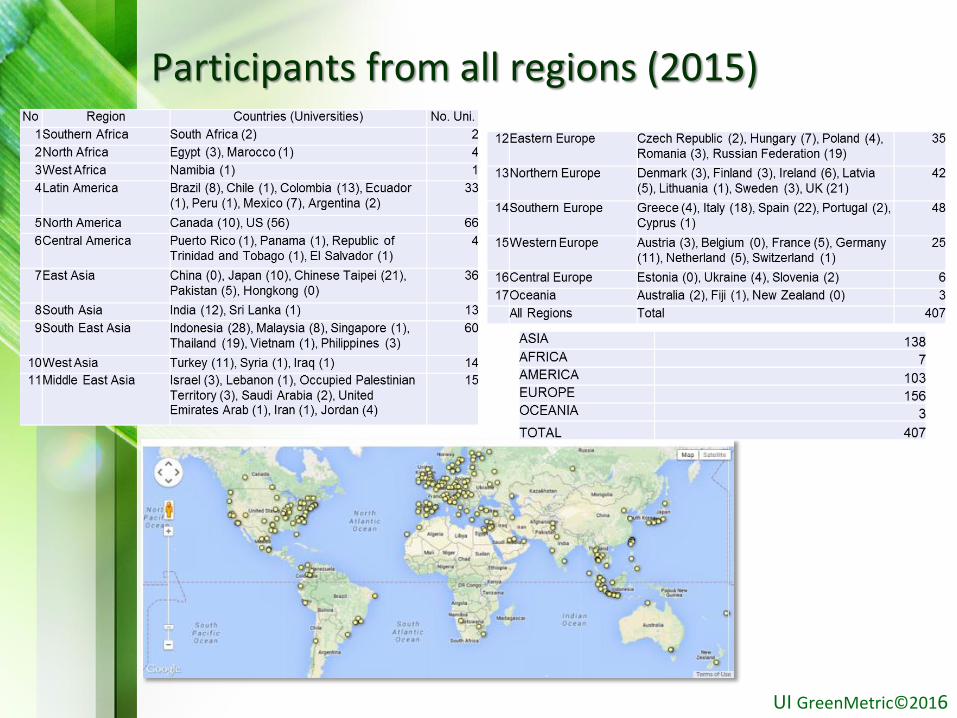
Participants from all regions (2015)
UI GreenMetric©2016
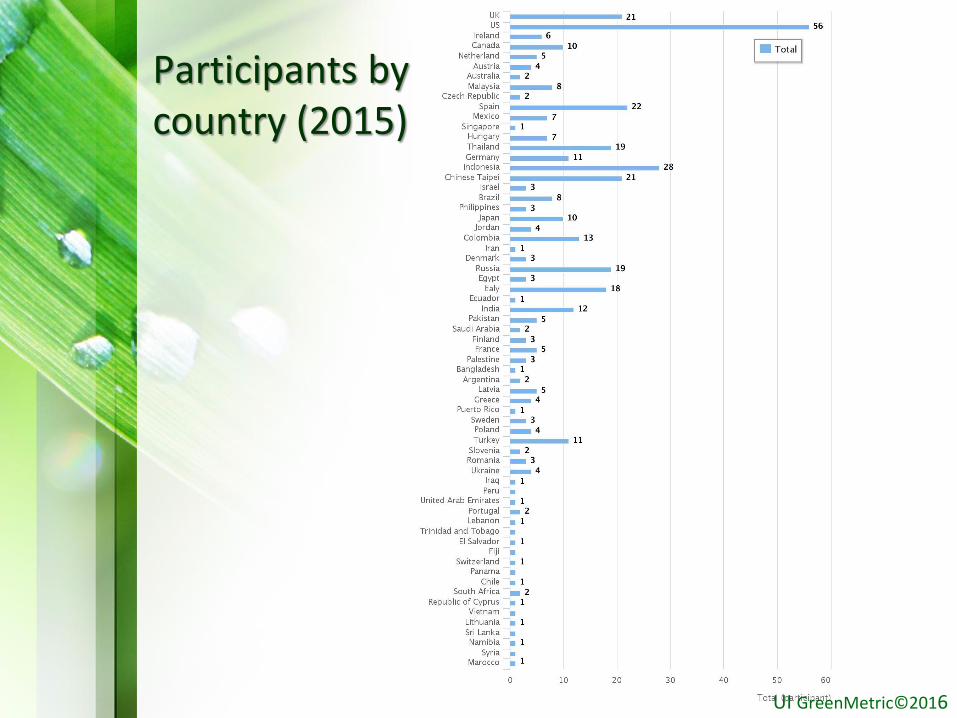
Participants by country (2015)
UI GreenMetric©2016
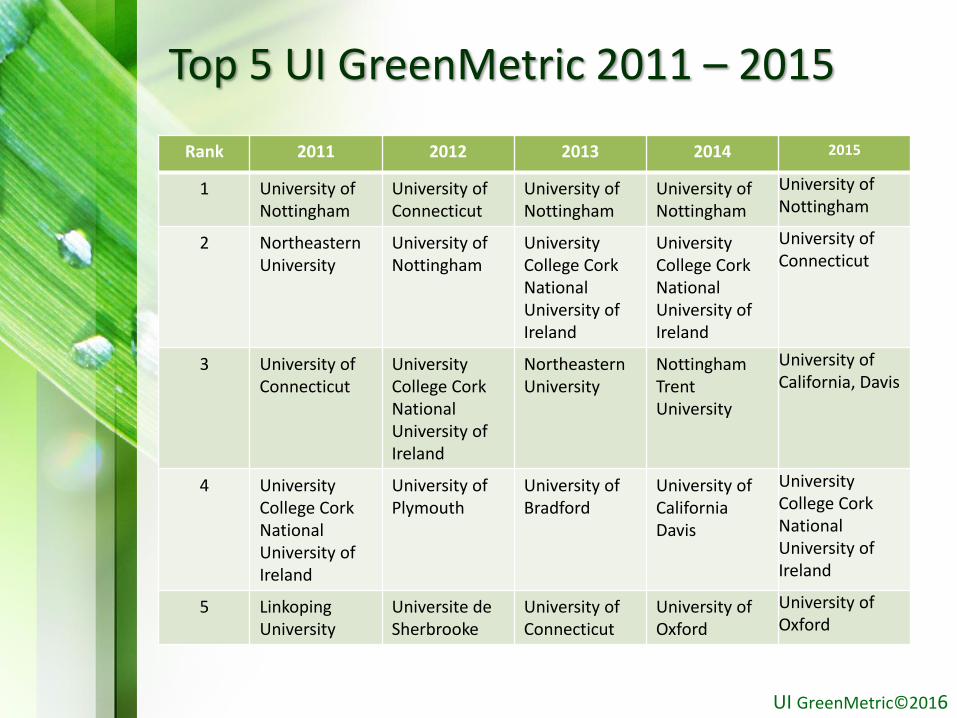
Top 5 UI GreenMetric 2011 – 2015
Rank 2011 2012 2013 2014 2015
1 University of Nottingham
University of Connecticut
University of Nottingham
University of Nottingham
University of Nottingham
2 NortheasternUniversity
University of Nottingham
University College Cork National University of Ireland
University College Cork National University of Ireland
University of Connecticut
3 University of Connecticut
University College Cork National University of Ireland
NortheasternUniversity
Nottingham Trent University
University of California, Davis
4 University College Cork National University of Ireland
University of Plymouth
University of Bradford
University of California Davis
University College Cork National University of Ireland
5 Linkoping University
Universite de Sherbrooke
University of Connecticut
University of Oxford
University of Oxford
UI GreenMetric©2016

Top 20 UI GreenMetric World Ranking 2015
UNIVERSITY NATION TOTAL SCORE RANKING
University of Nottingham UK 7.267 1
University of Connecticut US 7.156 2
University of California, Davis US 7.134 3
University College Cork National University of Ireland Ireland 7.070 4
University of Oxford UK 6.963 5
University of California, Berkeley US 6.893 6
University of North Carolina, Chapel Hill US 6.729 7
University of Bradford UK 6.716 8
Universite de Sherbrooke Canada 6.674 9
Northeastern University US 6.638 10
University of Sussex UK 6.621 11
University of Groningen Netherland 6.593 12
Universitat fur Bodenkultur Wien Austria 6.548 13
University of Melbourne Australia 6.536 14
Nottingham Trent University UK 6.519 15
University of Limerick Ireland 6.519 16
Universiti Putra Malaysia Malaysia 6.491 17
Czech University of Life Sciences Prague (Czech University of Agriculture in Prague)
Czech Republic 6.459 18
Georgia Institute of Technology US 6.435 19
Universitat Autonoma de Barcelona Spain 6.432 20
UI GreenMetric©2016
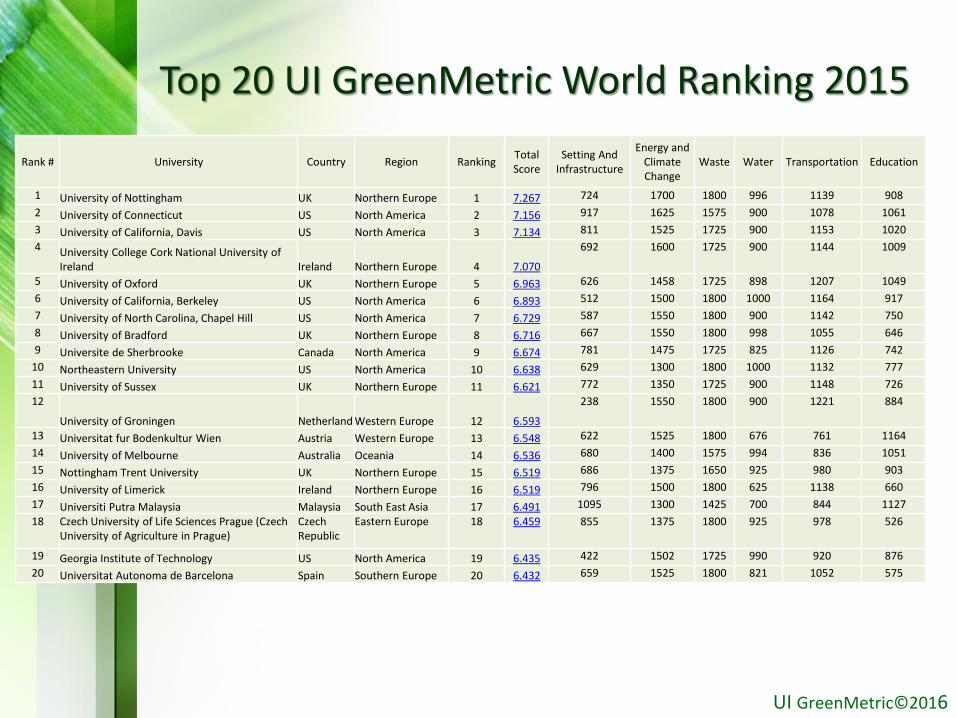
Top 20 UI GreenMetric World Ranking 2015
Rank # University Country Region Ranking Total Score
Setting And Infrastructure
Energy and Climate Change
Waste Water Transportation Education
1 University of Nottingham UK Northern Europe 1 7.267 724 1700 1800 996 1139 908
2 University of Connecticut US North America 2 7.156 917 1625 1575 900 1078 1061
3 University of California, Davis US North America 3 7.134 811 1525 1725 900 1153 1020
4 University College Cork National University of Ireland Ireland Northern Europe 4 7.070
692 1600 1725 900 1144 1009
5 University of Oxford UK Northern Europe 5 6.963 626 1458 1725 898 1207 1049
6 University of California, Berkeley US North America 6 6.893 512 1500 1800 1000 1164 917
7 University of North Carolina, Chapel Hill US North America 7 6.729 587 1550 1800 900 1142 750
8 University of Bradford UK Northern Europe 8 6.716 667 1550 1800 998 1055 646
9 Universite de Sherbrooke Canada North America 9 6.674 781 1475 1725 825 1126 742
10 Northeastern University US North America 10 6.638 629 1300 1800 1000 1132 777
11 University of Sussex UK Northern Europe 11 6.621 772 1350 1725 900 1148 726
12
University of Groningen Netherland Western Europe 12 6.593
238 1550 1800 900 1221 884
13 Universitat fur Bodenkultur Wien Austria Western Europe 13 6.548 622 1525 1800 676 761 1164
14 University of Melbourne Australia Oceania 14 6.536 680 1400 1575 994 836 1051
15 Nottingham Trent University UK Northern Europe 15 6.519 686 1375 1650 925 980 903
16 University of Limerick Ireland Northern Europe 16 6.519 796 1500 1800 625 1138 660
17 Universiti Putra Malaysia Malaysia South East Asia 17 6.491 1095 1300 1425 700 844 1127
18 Czech University of Life Sciences Prague (Czech University of Agriculture in Prague)
Czech Republic
Eastern Europe 18 6.459 855 1375 1800 925 978 526
19 Georgia Institute of Technology US North America 19 6.435 422 1502 1725 990 920 876
20 Universitat Autonoma de Barcelona Spain Southern Europe 20 6.432 659 1525 1800 821 1052 575
UI GreenMetric©2016
UI GreenMetric on World Forum
• Acknowledged as one of the world university rankings at the opening speech of UNESCO Global Forum on University Ranking (16-17 July 2011)
• A member of IREG (International Ranking ExpertGroup) since 2012
• Citations in academic publications (Journal, Conferences), newspapers, university website that reports their achievement based on UI GreenMetric Indicators, etc.
• The 2014 Global Green Award by OMAC (Otherways Management & Consulting)
UI GreenMetric©2016
UI GreenMetric on World Forum
A member of IREG (International Ranking Expert Group) since 2012 In 2011, to IREG-6 Conference, Taiwan.
Invitation from Foreign Institutions• In 2011, to IREG-6 Conference, Taiwan.• In 2012 Dr. Allan Lauder – Nagoya University, Japan• In 2012 to Ca’ Foscari University, Venice, Italy• In 2012 to University College Cork, Ireland• In 2013 Prof. Gunawan Tjahjono – Universidad de Nuevo Leone, Monterrey,
Mexico• In 2013, Invited to International Sustainable Campus Network (ISCN) at the
University of Oregon.• In 2014 to Kaznu Al Farabi University, Kazakhistan• In 2015 Dr. Nyoman Suwartha – National Pingtung University of Science and
Technology• In 2016, Dr. Nyoman Suwartha, Junaidi, invited for presentation at APAEI
Melbourne Australia.• In 2016 to University visited: Nottingham University (UK), UCC (Ireland), Ca’
Foscari University (Italy), UANL (Mexico), KAZNU (Kazakhistan), Northeastern University, Oregon University, University of Texas Austin (USA), University of Melbourne, Monash University (Australia), King Abdul Aziz University and Princess Nourah University (Saudi Arabia)
The 2014 Global Green Award by OMAC (Otherways Management & Consulting)attended by Prof Tommy Ilyas
UI GreenMetric©2016
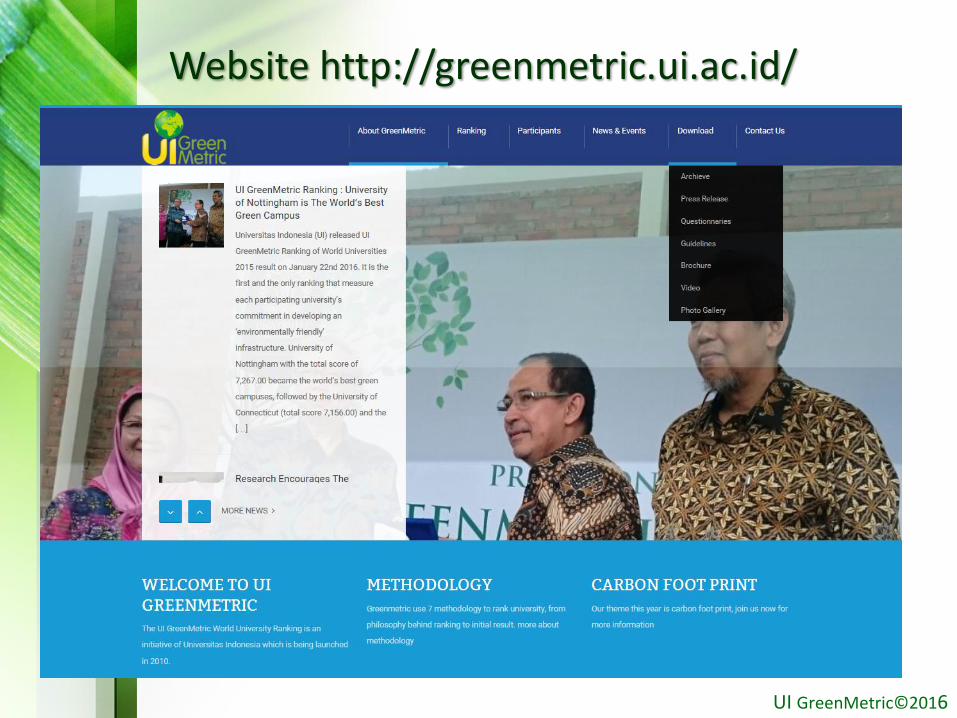
Website http://greenmetric.ui.ac.id/
UI GreenMetric©2016
Challenges and Opportunity
UI GreenMetric©2016
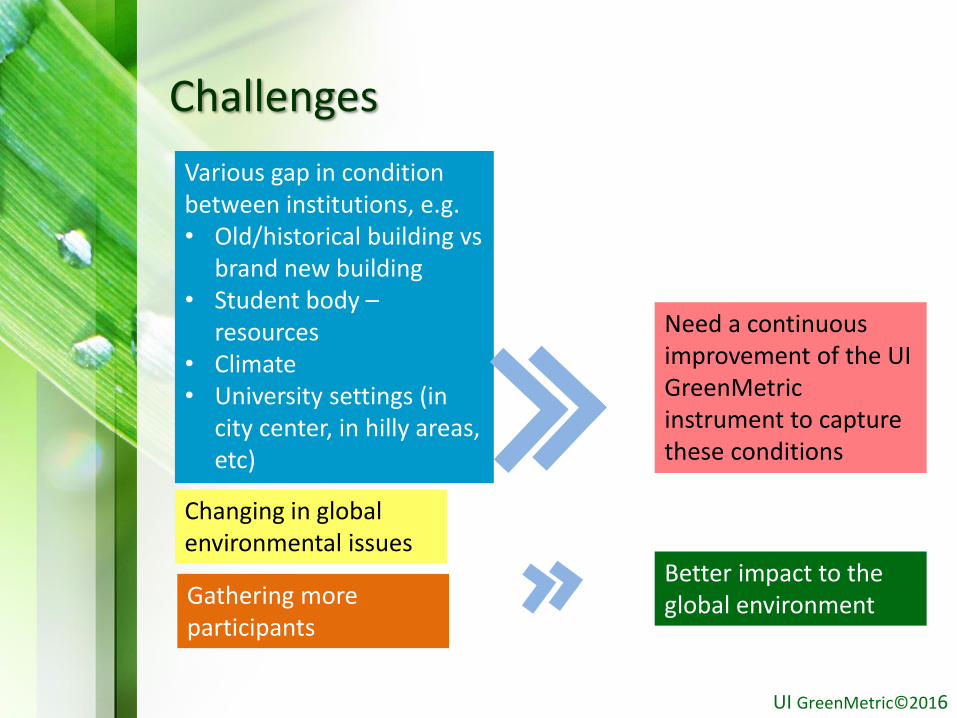
Challenges
Various gap in condition between institutions, e.g.• Old/historical building vs
brand new building• Student body –
resources• Climate• University settings (in
city center, in hilly areas, etc)
Changing in global environmental issues
Need a continuous improvement of the UI GreenMetric instrument to capture these conditions
Gathering more participants
Better impact to the global environment
UI GreenMetric©2016
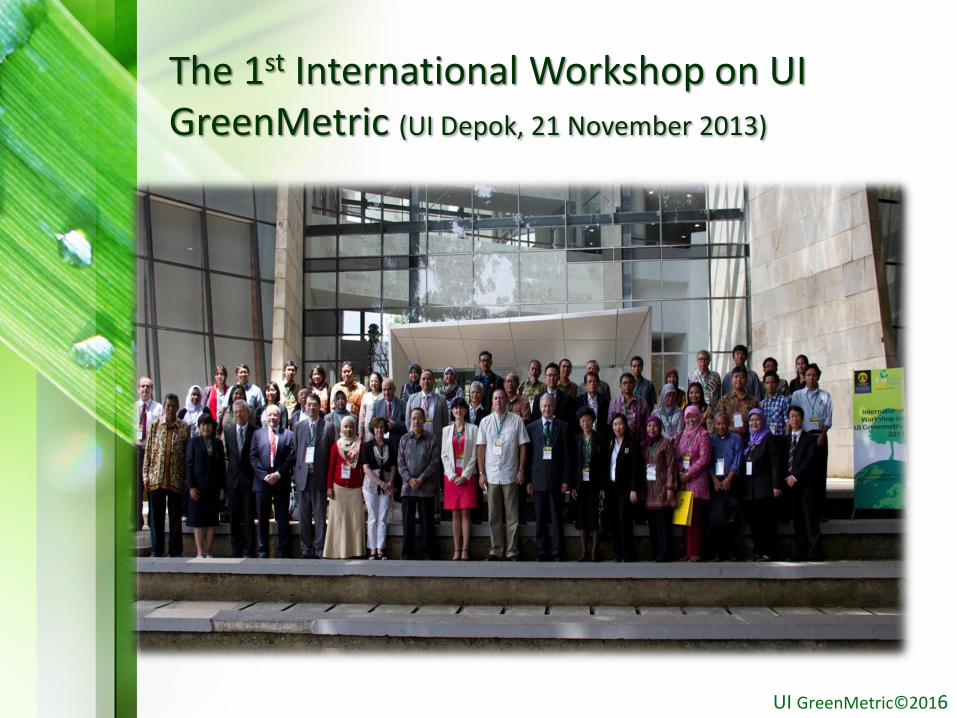
The 1st International Workshop on UI GreenMetric (UI Depok, 21 November 2013)
UI GreenMetric©2016
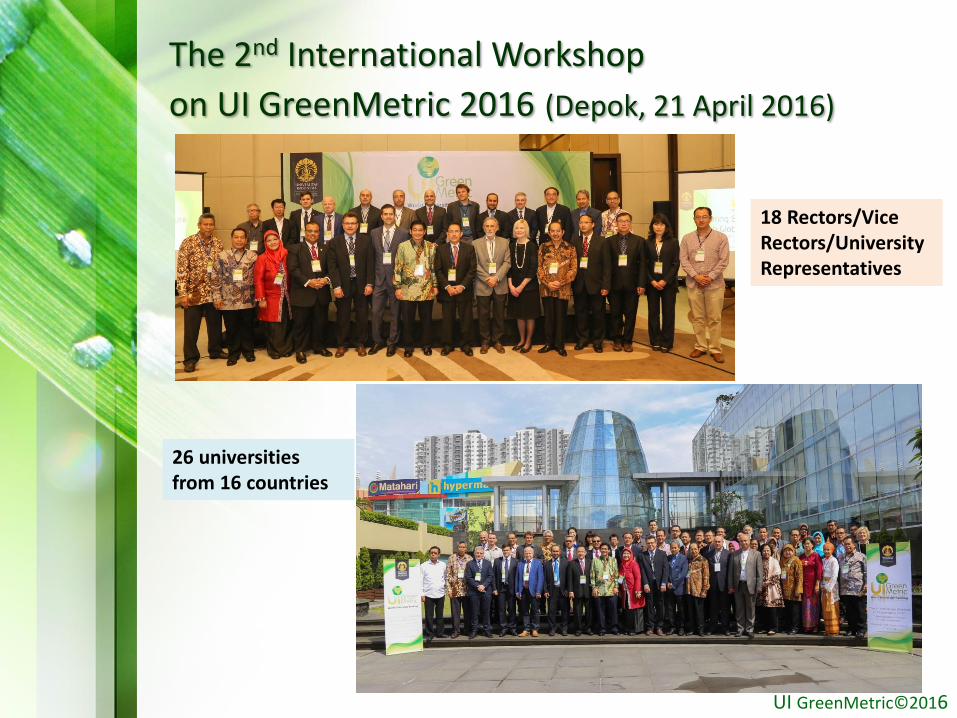
The 2nd International Workshop
on UI GreenMetric 2016 (Depok, 21 April 2016)
18 Rectors/Vice Rectors/University Representatives
26 universities from 16 countries
UI GreenMetric©2016
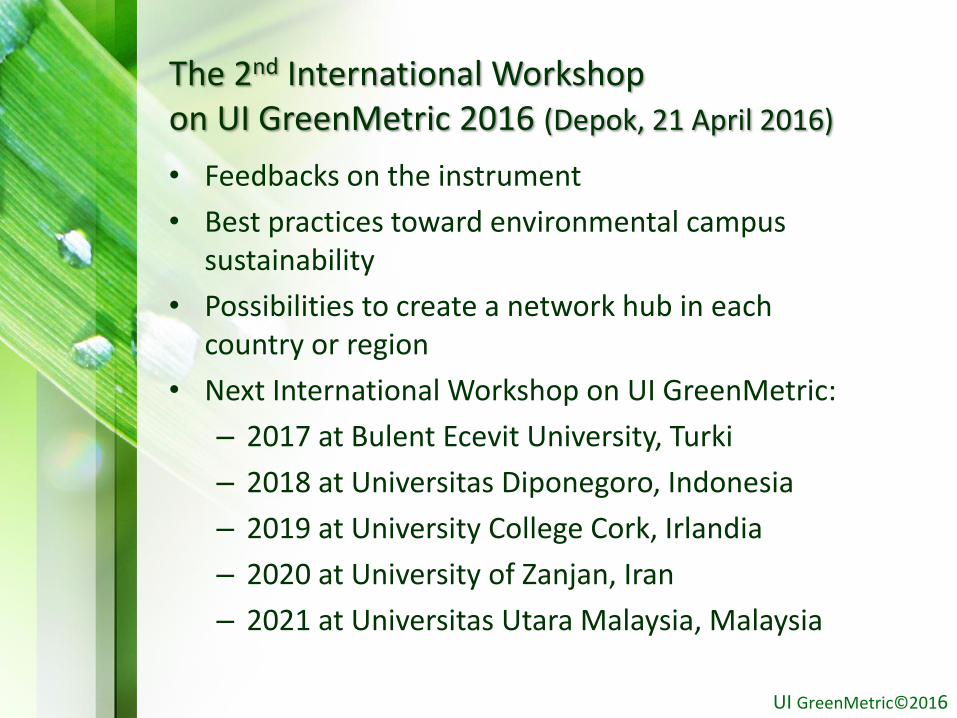
The 2nd International Workshop on UI GreenMetric 2016 (Depok, 21 April 2016)
• Feedbacks on the instrument
• Best practices toward environmental campus sustainability
• Possibilities to create a network hub in each country or region
• Next International Workshop on UI GreenMetric:
– 2017 at Bulent Ecevit University, Turki
– 2018 at Universitas Diponegoro, Indonesia
– 2019 at University College Cork, Irlandia
– 2020 at University of Zanjan, Iran
– 2021 at Universitas Utara Malaysia, Malaysia
UI GreenMetric©2016
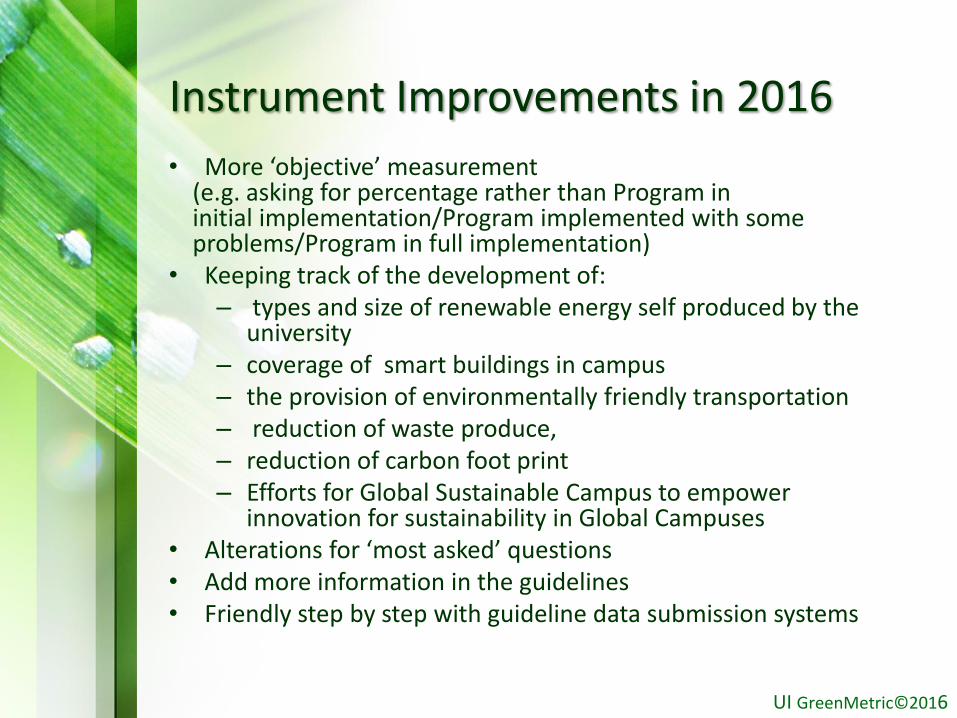
Instrument Improvements in 2016
• More ‘objective’ measurement (e.g. asking for percentage rather than Program in initial implementation/Program implemented with someproblems/Program in full implementation)
• Keeping track of the development of:– types and size of renewable energy self produced by the
university– coverage of smart buildings in campus– the provision of environmentally friendly transportation– reduction of waste produce, – reduction of carbon foot print– Efforts for Global Sustainable Campus to empower
innovation for sustainability in Global Campuses• Alterations for ‘most asked’ questions• Add more information in the guidelines • Friendly step by step with guideline data submission systems
UI GreenMetric©2016
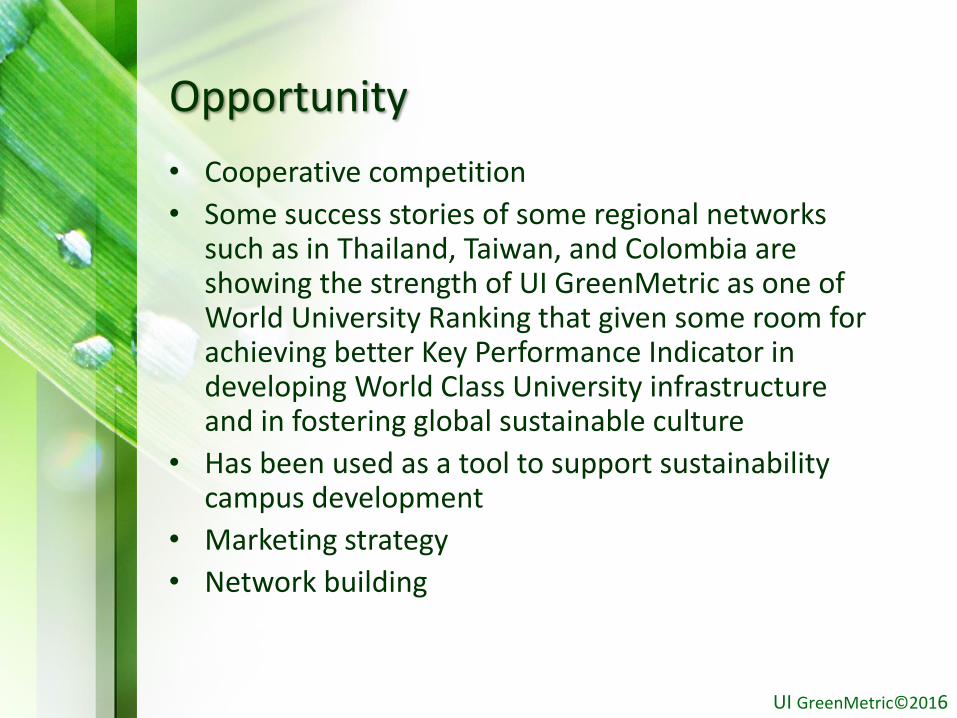
Opportunity
• Cooperative competition
• Some success stories of some regional networks such as in Thailand, Taiwan, and Colombia are showing the strength of UI GreenMetric as one of World University Ranking that given some room for achieving better Key Performance Indicator in developing World Class University infrastructure and in fostering global sustainable culture
• Has been used as a tool to support sustainability campus development
• Marketing strategy
• Network building
UI GreenMetric©2016
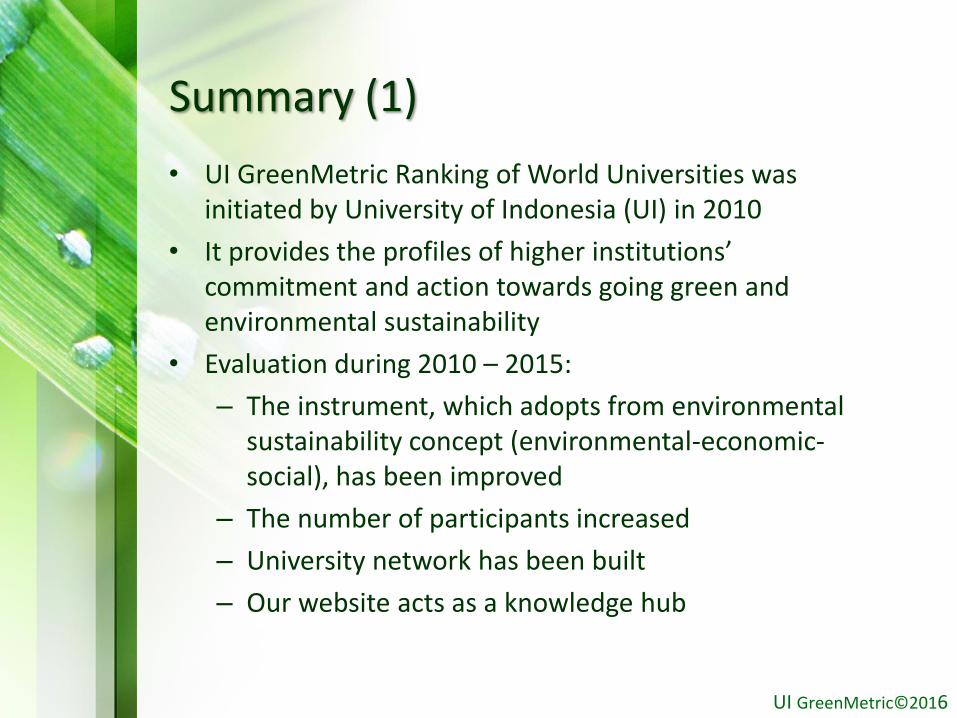
Summary (1)
• UI GreenMetric Ranking of World Universities was initiated by University of Indonesia (UI) in 2010
• It provides the profiles of higher institutions’ commitment and action towards going green and environmental sustainability
• Evaluation during 2010 – 2015:
– The instrument, which adopts from environmental sustainability concept (environmental-economic-social), has been improved
– The number of participants increased
– University network has been built
– Our website acts as a knowledge hub
UI GreenMetric©2016

Summary (2)
• Challenges:– Various gaps in condition between institutions– Changing in global environmental issue– Gathering more participants in order to make better
impact to the global environment• To address these challenges, UI GreenMetric hosted
international workshops in 2013 and 2016. Feedbacks on the instrument, best practices toward environmental campus sustainability, and possibilities to create a network hub in each country or region were discussed.
• Opportunity:– Cooperative competition– Has been used as a tool to support sustainability
campus development– Marketing strategy– Network building
UI GreenMetric©2016
Please visit: http://greenmetric.ui.ac.id