Embed Size (px)
Citation preview

Surface Science 294 (1993) 308-321 North-Holland
.,., .,.... .A.:.:. . . . . . . . . ..C. . . ...+..: . . . . +:+:,: . . . . ..~.~...~.‘..,,.,. L. ~:::::::::::~:~:~:::~:~~:~~~:~:::.:::j::..:.:.:.:.:.:~::::.:.::::::::::::~:?.::::::~ :::::: ..‘.‘.‘.‘.:.“.‘...‘.v.:.:.:.:.:..:,:.:.:.: .,......:,:.:,:,,.,.,,,,.,.~.~,~, :‘:: ,:,,
.,.. . . . ..,.,.,...... ~,;f,;::::::.:... ... . . . . ..:.: ..::::::
surface science
UHV transmission electron microscopy of Ir( 001) I. Microstructure of the (1 X 1) and the reconstructed (5 x 1) surfaces
D.N. Dunn, P. Xu and L.D. Marks Department of Materials Science and Engineering, Northwestern Universiry, Evanston, IL 60208, USA
Received 19 January 1993; accepted for publication 25 May 1993
Experimental results on the unreconstructed IrfOOl)-(1 x 1) and the reconstructed (5 X 1) surfaces using plan view ultra-high vacuum transmission electron microscopy (UHV-TEM) are presented. The contamination-stabilized IrfOOl)-(1 x 1) surface is moderately well ordered with steps preferentially aligned along (110) and (100) directions, but is fairly rough on the atomic scale as evidenced by both dark field and high resolution imaging. The step evolution and the microstructure of the surface with repeated annealing are described. The IrfOOl)-(5 X 1) reconstruction is determined by electron diffraction to be a simple quasi-hexagonal surface layer with very little distortion in a (5 X 1) registry with respect to the bulk. This surface is a much flatter one than the (1 x 0. The basic morphology of the reconstructed surface layer is shown by dark field microscopy, and the transition from (1 X 1) to (5 X 1) is a nucleation and growth process. Evidence for subsurface IrO, precipitate particles is also presented.
1. Introduction
The Ir(OO1) surface has long been known to reconstruct into a (5 X 1) surface unit cell. The majority of the work has been done using low energy electron diffraction (LEED) [l-51 and more recently, field ion microscopy (FIM) [6-81. In general, it has been found that the (001) faces of Au, Pt, and Ir reconstruct in a similar way, i.e. the reconstructed layer consists of a hexagonal layer as suggested first by Fedak and Gjostein [93. For Au and Pt, the misfit between the recon- structed layer and the bulk is taken up by some combination of a surface layer compression and a shear or rotation of the hexagonal surface mesh. On both the Au- and Pt(001) surfaces, this pro- duces rather large reconstructed unit cells. The Ir(OOl)-(5 x 1) is an exception in that the hexago- nal layer seems to have a much stronger coinci- dent relationship with the fee bulk lattice. It is generally found that the hexagonal overlayer in the (5 x 1) reconstruction requires no rotation or shear to fit on the (1 X 1) surface.
In this paper, we report a transmission elec- tron microscopy (TEM) study of both the Ir(OO1)
reconstructed (5 X 1) and contamination-stabi- lized (1 x 1) surfaces. The main advantage of the TEM technique is that it combines both imaging at the atomic scale and diffraction from selected areas. Surface sensitive structure information from imaging and diffraction is also readily avail- able in a UHV-TEM [lo] along with the bulk information which is a well known strong point for conventional TEM.
On route to obtaining the Ir(OOl)-(5 x 1) re- constructed surface, considerable attention was paid to the microstructural development of the Ir(OOl)-(1 x 1) surface as a function of the an- nealing. Although as judged from the (1 x 1) diffraction spots, this surface appears to be mod- erately well ordered with steps preferentially aligned along (110) and (100) directions, imag- ing experiments demonstrate that in fact it is fairly disordered. A surface morphology change with the transition from the (1 x 1) to (5 X 1) surface was also observed.
Direct observation of the domain structure and the nucleation of the (5 x 1) surface over- layer in this experiment reveals some interesting features of the reconstruction that cannot be
0039-6028/93/$06.00 0 1993 - Elsevier Science Publishers B.V. Ah rights reserved

D.N. Dunn et al. / UHVelectron microscopy of Ir(OO1). I 309
probed by LEED, FIM and most other surface techniques. In particular, the domain structure reflects the reconstruction as controlled by a nu- cleation and growth process. Also, the recon- struction is found to coexist with fairly high con- centrations of sub-surface precipitates which we identify as IrO, particles. Electron diffraction patterns support the simple quasi-hexagonal re- construction model. Detailed structure analyses on the atomic positions are carried out from high resolution images and R-factor refinement of the diffraction data, and the results will be presented in a companion paper [ll].
2. Experimental method
A 3 mm sample of single crystal Ir(OO1) (99.99%, Atomergic Chemicals Corp.) was spark- cut from a large plate and then mechanically thinned to about 100 microns. The sample was dimpled and ion-milled with 5 kV argon in a commercial Gatan unit until electron transpar- ent, and then loaded into the side chamber of the UHV-H9000 electron microscope at Northwest-
ern [12,13]. The side chamber was baked down to III-IV conditions with a pressure in the high 10-l’ Torr. The sample was repeatedly ion-beam sput- ter-cleaned using Xe ions at 3-4 kV and then electron-beam annealed at temperatures ranging from about 600 to 1200°C using a Kimball Physics electron gun. Initially, the sample remained stub- bornly unreconstructed even when the surface was apparently ordering up under repeated sput- tering and annealing. Only by accident, we dis- covered that this was caused by CO and CO, contamination during annealing due to electron- stimulated desorption (by secondary electrons) of these molecules from a tungsten evaporator bas- ket near the sample. When the evaporator was degassed separately the (5 X 1) reconstructed sur- face was formed. For a TEM specimen, both surfaces are available and included in the obser- vation, therefore, we prepared clean surfaces for both the top and bottom sides. We also per- formed sputtering and electron annealing simul- taneously in the hope of using ion bombardment to keep the desorbed gaseous species from read- sorbing onto the clean surface at the elevated temperature. The procedure which reproducibly
Fig. 1. Bright field image showing a square hole that appeared after annealing. The external surface of the iridium specimen also tends to be faceted along the (110) directions.

D.N. Dunn et al. / UHVelectron microscopy of Ir(OO1). 1
Fig. 2. irregul showil
(110) within
Montage of the step evolution of Ir(OOl)-(1 X 1) surface with annealing: (a) (1 X 1) dark field image showing narrow ar step terraces, the diffraction inset shows streaked (1 X 1) spots along the [IlO] direction, (b) (1 X 1) dark field in
ng the development of some wider terraces, marked by “T” in a few places. Step edges are preferentially aligned in (100) directions, but the surface is by no means smooth as seen from the rough step edges and the presence of fine line con
the terrace, Cc) bright field image showing a relatively smoother surface. The heavy lines in the horizontal direction repro step bunches.
rage and
trast
:sent

D.N. Dunn et al. / UHVelectron microscopy of Ir(OO1). I 311
produced the reconstructed surface was to outgas the tungsten basket right before the sample treat- ment and then simultaneously anneal at 1000°C and sputter with 4 kV Xe for 5 min for each surface. (The data in this paper is from about a dozen repeats of this approach.)
All the experimental data included here was acquired using the ,microscope operated at 300 kV. Much of the experimental data was examined by microdensitometering the original micrographs and then analyzing these using SEMPER image processing routines.
3. Results
UHV microscopy results on Ir(OOl)-(1 X 1) and (5 X 1) surfaces will be presented in four sections, with emphasis on the microstructure and general diffraction data. Atomic scale imaging of the (5 x 1) surface and quantitative diffraction will be covered in the companion paper. First, the mi-
crostructure and step evolution of the Ir(OOl)- (1 x 1) surface will be described, then the results from the reconstructed surface will be discussed. Finally, the issue of subsurface precipitates will be addressed.
3.1. Surface morphology of the Ir(OOl)-(1 x 1) surface
Iridium (0011, similar to gold (001) [14], showed one characteristic feature as the surface started to order, namely the appearance of square holes and a concurrent squaring of the external surface, see fig. 1. These holes, which in projection are along (110) directions, are made up of (111) facets. We note that at least for the (001) surface of both materials, the formation of these holes appears to be a signature of the sample reaching a high enough temperature to produce surface ordering. Carbonaceous contamination was often observed along the sample edge at this stage when sequential ion-milling and annealing treat-
Fig. 2c (continued).
312 D.N. Dunn et al. / UHVelectron microscopy of Ir(OO1). 1
ment was used. Combined treatments of ion milling and annealing were successful in eliminat- ing this type of contamination.
After several combined ion-milling and anneal- ing cycles, where the annealing temperature was above lOOo”C, steps were found on the surface. The step evolution for this (1 x 1) surface fol- lowed a complicated path, and here we only attempt to show a few selected images represent- ing the crucial stages of the evolution. Dark field images using the {l X l}-type reflections (see spot labelled “A” in the diffraction inset of fig. 2a), which are labelled as (1,O) in LEED notation and (110) in TEM notation, are the most sensitive for imaging surface steps [15], although conventional bright field and weak beam dark field can some- times be quite useful [16,17].
Fig. 2a shows a (1 x 1) dark field image when the steps first appeared, steps of single or possi- bly-multi-layer height are represented by terraces with different contrast levels. The white particles decorating the sample will be the subject of later discussion. The diffraction pattern inset shows streaked {l x 1) diffraction spots along the [llO] direction, confirming what is seen in the image, i.e. steps have very narrow width and tend to arrange along the (110) directions.
With further annealing, the 11 X 1) spots grew sharper and steps developed into wider terraces and took on a zig-zag like pattern in many areas with step facets running approximately along the (100) and (110) directions, see fig. 2b. However, the surfaces are by no means smooth, and the step edges are very rough. Although there exist
Fig. 3. Filtered high resolution image of the stepped Ir(OOl)-(1 X 1) surface. The image was obtained by subtracting a “rank” image from the raw image to enhance the lattice contrast. The roughness of the surface on the atomic scale is clearly visible.

D.N. Dunn et al. / UHVelectron microscopy of IdOOl). I 313
many relatively wide terraces with uniform con-
trast like the ones marked “T.“, fine line contrast is observed in other areas indicating roughness within a single terrace, e.g. the area arrowed in fig. 2b.
As steps evolved into wider and smoother ter- races, step bunches were observed as shown in fig. 2c, a bright field image. Somewhat to our surprise, this image (taken with the transmitted beam) displays a rather distinct surface (step) contrast. Bulk defects, dislocations in this case, which are not easily visible in a surface sensitive (1 x 1) dark field image, are imaged clearly here as expected.
The strongest evidence for a rough (1 X 1) surface is from fig. 3, a high resolution image. A surface may look smooth in a lower magnification image since the eye tends to integrate over small areas, ignoring fine details. In fig. 3, a filtered image (raw data minus a “rank” #’ operation) shows the (1 X 1) surface lattice, which is \liT times larger and rotated by 45” with respect to the bulk (200) lattice, at the same time as the bulk lattice. The surface is recognized to be rough since regions where the (1 X 11 lattice contrast is pronounced are patchy, for example, the area to the right of the line marked “I.,” shows a very strong {l x l} lattice, but to the left the (1 X 1) lattice is almost invisible. The terrace width is on the order of a few nanometers and step edges are preferentially along (110) directions.
3.2. Diffraction and domain structure of the Zr(OOl)- t.5 X 1) surface
3.2. I. Diffraction We will first examine diffraction patterns from
a well-developed (5 X 1) reconstruction before discussing the domain structure. Fig. 4a is a nearly on-zone (001) selected area diffraction pattern (from a micron-sized area) showing two orthogo- nal domains of the (5 X 1) reconstruction. Fig. 4b
#1 In the “rank” operation, each pixel value is replaced by the median value of the (n x n) pixels around it. II = 3 was used in this case.
Fig. 4. (a) (OOl)-selected area diffraction pattern of the Ir@O1)-(5~ 1) reconstruction and (b), a convergent beam diffraction pattern. (a) Shows two orthogonal (5 x 1) domains since the pattern covered a micron-sized area, while (b), from a much smaller area (about 100 nm), shows predominantty one domain. The hexagonal layout of the surface diffraction
spots is clearly seen in (b).
is a convergent beam electron diffraction pattern from a smaller area (< 100 nm), where the main surface spots are due to one domain and clearly form a hexagon. (Large area diffraction patterns
D.N. Dunn et al. / VHVelectron microscopy of IdOOl). I
Fig. tW0
of u
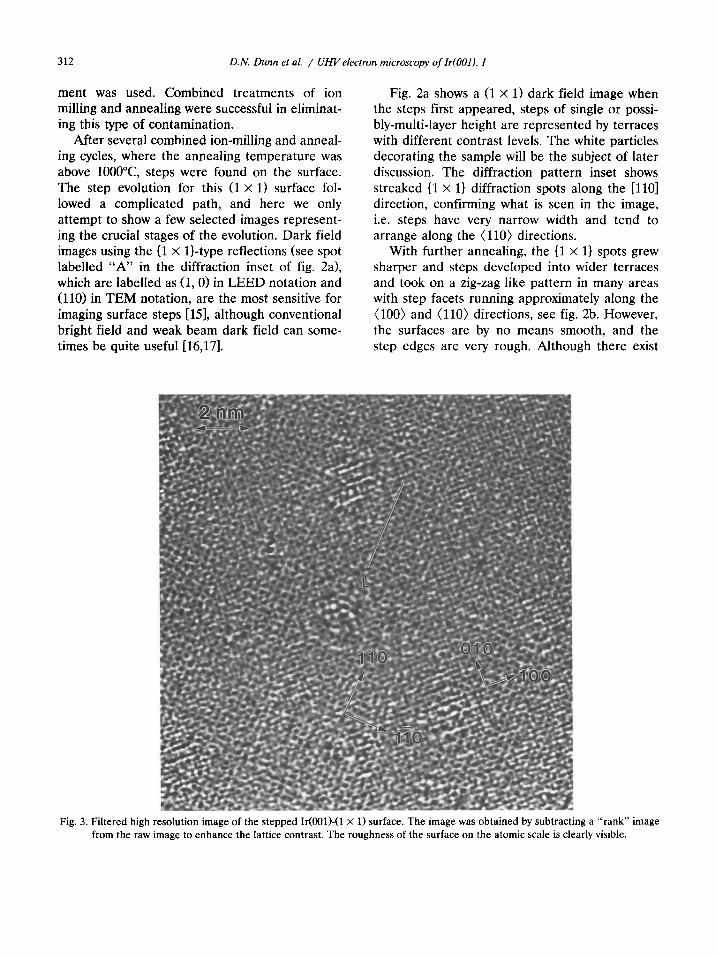
5. (a> (200) dark field micrograph showing primarily the moire fringes (across the image) of 0.68 nm spacing from one of domains of the Ir@Ol)-(5 x 1) reconstruction. The domain is faceted along the (110) direction with steps of an integer nun init cells along the “5” direction as indicated. (b) Another (200) dark fieid image showing overlapping domains, demonstra
that the reconstruction is on both surfaces.
the lber
D.N. Dunn et al. / UHVelectron microscopy of IdOOl). I 315
such as fig. 4a average over both domains.) Addi- tional weaker spots in the pattern (fig. 4a) are caused by double diffraction and the atomic dis- placements away from the surface hexagonal layer, as will be analyzed in more detail in the companion paper. Unlike the Au(OOl)-(5 X n) re- construction [14], there is no splitting of the spots for Ir(OOl)-(5 X 1) ,and they are situated at the exact 1/5th order positions. The intensity of the Ir reconstruction spots is also stronger than for Au. The hexagonal layout of the strong surface diffraction spots immediately suggests an over- layer with a simple hexagonal structure as pro- posed by previous studies and confirmed by mul- tislice calculations. A variety of other structure models were quickly ruled out by the calculations, although a precise determination of the atomic positions within this model has proven to be difficult and will be discussed in the companion paper. It is worth pointing out that although the surface layer only constitutes a small fraction of a specimen with a typical thickness of about 20 nm, and the surface spot intensity is indeed weak, 10e4 as compared to bulk spot [Ml, these recon- struction spots are readily visible on the phosphor screen of the microscope.
3.2.2. Domain structure The primary imaging technique used for the
reconstructed domains was dark field imaging with an objective aperture that covered a bulk (200) spot and the reconstruction spots around it, the strongest of which is (3, 1) (in the (5 x 1) unit cell notation), see fig. 4a. Fig. 5a is such an image showing strong moire fringes (from one of the domains) representing half the unit cell in the “5” direction with a spacing of 5 x a/2 = 0.68 nm (a = 0.27 nm). It is clear that the surface cover- age of the (5 x 1) domains is incomplete. For completeness, fig. 5b shows an area where two orthogonal domains appear to overlap, demon- strating that the reconstruction is present on both surfaces. Straight moire fringes signify a strong coincidence of the surface layer with the bulk lattice. Even in the presence of the particles, which are likely to be in the near surface region (more discussion later), the fringes do not bend or disappear. The reconstruction domains are also seen to terminate sharply in the (110) direc- tions, i.e. the two orthogonal directions of the (5 X 1) unit cell. Looking closely at the edges of the domain structure in the “5” direction (per- pendicular to the moire fringe direction), e.g. fig.
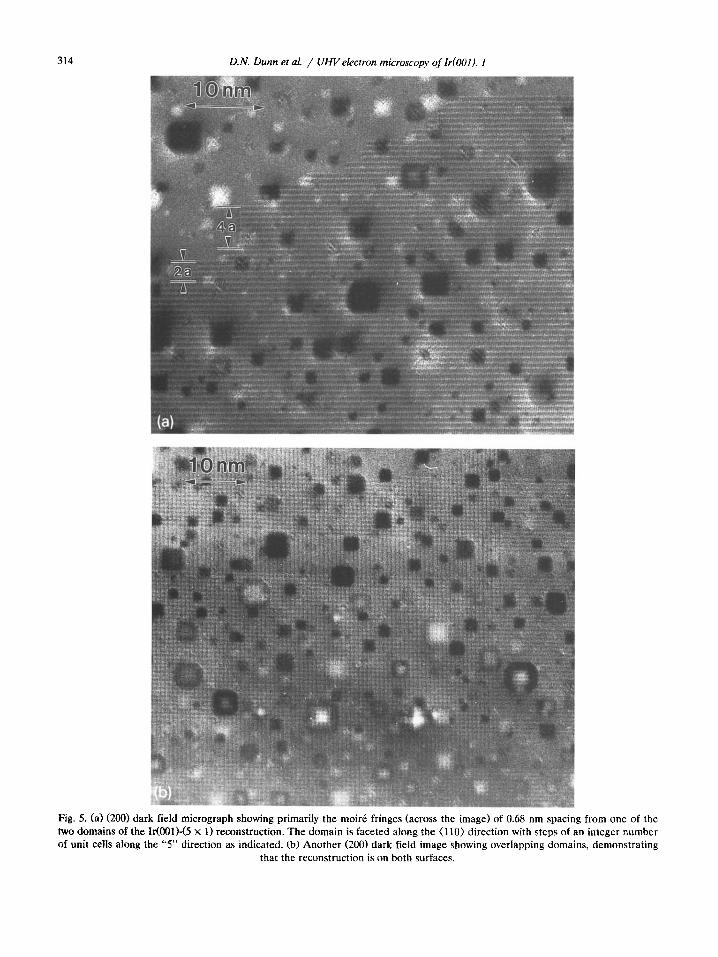
Fig. 6. Dark field micrograph showing a dislocation coexisting with the reconstruction. The reconstruction does not seem to be disturbed by the strain field of the dislocation, since moirt fringes are seen to run straight past the dislocation.

316 D.N. Dunn et al. / UHVelectron microscopy of IdOOl). I
Fig. 7. (a) (1 X 1) dark field image showing the domain structure in the early stage of the transition between the (1 x 1) and the (5 x 1). fb> Selected area diffraction pattern from this area. Streaked {l X II-type spots manifest the finite size of the domains, and streak intensity is higher in the “5” than in the “1” direction. (c) (ZOO) dark field showing the finite size and the long narrow shape of the domain structure for the (5 x 1) reconstruction. The smallest domain size is only one unit cell in width in the “5” dimension.

D.N. Dunn et al. / UHVelectron microscopy of Ir(OO1). I 317
5a, we found with few exceptions that each edge contains a multiple of two fringes, i.e. integer multiples of the unit cell, since two fringes corre- spond to one complete unit cell in the “5” direc- tion.
The lack of disturbance of the reconstruction by bulk defects or irregularities is manifested in another case in fig. 6 where a dislocation is ob- served to coexist with the reconstruction. The surface reconstruction is apparently not affected by the strain field of the dislocation, and fringes are seen to run straight past the dislocation. (Due to the exceedingly strong contrast in the disloca- tion region, this may not be apparent in the reprint.) This is strikingly different from Au(lOO), where a strong interaction between bulk defects and the surface reconstruction was observed [14].
3.3. Nucleation and growth of the (5 X 1) reconstruction domains
Compared to the equilibrium structure of the Ir(lOO)-(5 x 1) phase, little is known about the transition between the metastable (1 x 1) and the reconstructed (5 X 1). Information on the transi-
tion has been obtained by LEED for Ir(100) [4] and Pt [19,20] and work function measurement on Ir [21]. The shortcomings of these studies are that microstructure information is not available, and for LEED, details of the structural transition can only be inferred from the diffraction data. In this work, we show by direct imaging of the surface structures that the transition proceeds by a nucle- ation and growth mechanism.
In fig. 7, the development of the (5 x 1) recon- struction from the metastable (1 X 1) phase under proper annealing condition was captured. Even though we could not observe the transition in situ in a continuous fashion, fig. 7 provides a valuable snapshot during this transition. Rectangular do- mains of the (5 x 1) reconstruction in two orthog- onal directions are seen to criss-cross the image in fig. 7a, which is taken with the objective aper- ture centered around a (1, 0) (or (1 x 1)) spot, see fig. 4a. Most of these domains are much longer in one direction than in the other, with the short dimension being the “5” and the long dimension being the “1” direction of the (5 x 1) unit cell. The diffraction pattern shown in fig. 7h yields similar information: in this area, one domain
Fig. 7c (continued).
318 D.N. Dunn et al. / UHVelectron microscopy of h-(001). 1
(seen as bands running horizontally in the image) is more dominant than the other. The limited extent of the domain size is reflected in the streaks associated with the surface diffraction spots with the streaking stronger in the “5” direc- tion than in the “1” direction.
Fig. 7c, a (200) dark field image, reveals some detailed structure of the domains. We again ob- serve a partial coverage of the (5 x 1) reconstruc- tion with domains being long straight bands. Here, some narrow bands of one unit cell in width (corresponding to two fringes), e.g., the band between the two arrows, are seen as the smallest unit (or nucleus) from which the domain growth is proceeded. The shape of the domain indicates that the initial growth is preferentially along the “1” direction, which is then followed by the growth in the “5” direction.
3.4, Oxide precipitates
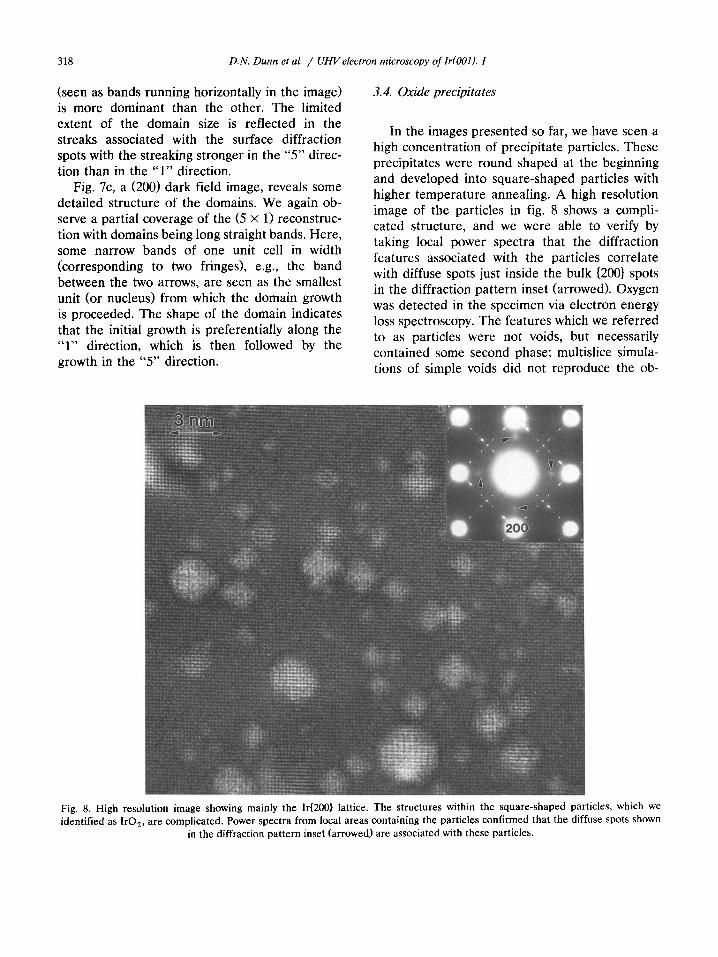
In the images presented so far, we have seen a high concentration of precipitate particles. These precipitates were round shaped at the beginning and developed into square-shaped particles with higher temperature annealing. A high resolution image of the particles in fig. 8 shows a compli- cated structure, and we were able to verify by taking local power spectra that the diffraction features associated with the particles correlate with diffuse spots just inside the bulk (2001 spots in the diffraction pattern inset (arrowed). Oxygen was detected in the specimen via electron energy loss spectroscopy. The features which we referred to as particles were not voids, but necessarily contained some second phase; multislice simula- tions of simple voids did not reproduce the ob-
Fig. iden
8. High resolution image showing mainly the Ir(200} lattice. The structures within the square-shaped particles, which we ltified as IrO,, are complicated. Power spectra from local areas containing the particles confirmed that the diffuse spots shown
in the diffraction pattern inset (arrowed) are associated with these particles.
D.N. Dunn et al. / UHVelectron microscopy of IdOOl). I 319
served contrast. The same applies for gas bub- bles.
A survey of the literature suggested two possi- ble iridium compounds, namely Ir,P which has the fluorite structure with a lattice parameter of 0.546 nm, and IrO, which has the rutile structure with a = b = 0.449 nm and c = 0.314 nm [22]. Ir,P can be immediately ruled out based on the lattice constant. In IrO,, the spacing for (0011 (da,, = 0.314 nm) and {110} (d,,s = 0.317 nm) planes are almost exactly the same, and they would produce diffraction spots in the positions where the diffuse spots were observed if the particles are in a pseudo-cube-cube epitaxial ori- entation. The three possible orientations are: (1) c-axis of IrO, normal to the Ir surface, [11ol,,,2 11m01,,; (2) c-axis of IrO, in the surface, [O01],,02 11[2001,,; (3) c-axis of IrO, in the surface, [100],,02 II [200],,.
Of the three, the first two would produce moire fringes in the particles in a dark field image using an aperture which includes a (200) spot of Ir and the diffuse spot inside, and if an equal probability is assumed for the three orien- tations, 67% of the particles should show moire fringes. From a dark field image such as that shown in fig. 5, a count of the number of particles which showed moire fringes was made. Out of a total of 154 particles counted, 98 were found to have fringes, which is roughly 64% of the total.
These IrO, particles clearly reside in the sub- surface region of the specimen since both high resolution (shown in the companion paper) and dark field images show that the (5 x 1) recon- struction continues across the surface without being disturbed by the presence of the particles. During the experiment, the intensity of the dif- fuse spots due to the IrO, particles increased with time (e.g. over a one-day period) while the specimen was in the lo-” Torr vacuum at room temperature. Although we did not notice any change in the particle density and size distribu- tion, the particles were observed to become more square-like in shape suggesting a slow ordering process toward the equilibrium structure at room temperature. (The phase diagram [23] indicates that IrO, phase separates from a Ir host matrix at temperatures below 1020°C.) This develop-
ment can be visualized qualitatively in a picture taken soon after thermal treatment, e.g., fig. 7c, and in pictures taken about 12 h later, figs. 5a and 5b. (Note that these images were not from the same area.)
4. Discussion
In many instances, one might argue from a LEED pattern that has low or no background and sharp diffraction spots that the surface is flat. However, this is a weak argument since it is difficult to interpret diffuse data in diffraction patterns which only show some sort of statistical average. In this context the imaging data is far more unique. For the Ir(OOl)-(1 X 1) surface, al- though at the statistical atomic scale the surface is fairly flat, on the nanometer scale it does not appear to be so and the surface steps themselves are very rough. Considering that the terraces on this surface have nanometer scale dimensions, this roughness may well play an important role in destabilizing the reconstruction.
We have described the (5 x 1) reconstruction process by a nucleation and growth mechanism. The building block, or the smallest stable nu- cleus, seems to be a narrow band one unit cell wide (rather than a half unit cell) in the “5” dimension. This observation suggests that the (5 X 1) unit cell is not centered, i.e. does not have a (0.5, 0.5) translational symmetry operation. Fur- ther evidence is from the diffraction pattern; al- though the stronger spots are those with h + k =
2n (h and k are indices in the (5 x 1) unit cell notation), spots with h + k = 2n + 1 have weak but non-zero intensities. In the R-factor analysis in the companion paper, no centering symmetry was assumed, and it did not appear in the final solution. In this experiment, we did not find any preferential sites, such as steps, for nucleating the (5 X 1) domains. Furthermore, steps did not arise as a by-product of the reconstruction, instead, steps associated with the (1 X 1) surface disap- peared upon the formation of the (5 x 1) recon- struction. Partial surface coverage of the recon- struction was observed consistently. A role for steps has been argued from the necessity of
320 D.N. Dunn et al. / UHVelectron microscopy of h-(001). I
mass-transport associated with the higher density (20% higher) of the surface in the (5 x 1) phase than the (1 X 1) phase [4]. Other models sug- gested surface dislocations as the mechanism for facilitating the surface mass-transport [24]. We do not have evidence to support either claim; in fact if surface dislocations were present we would have observed them in imaging experiments. LEED patterns [4] did not show the existence of the steps either during the transition period be- tween (1 X 1) and (5 X 11, but it was not conclu- sive since the coherence length of the beam was about 10 nm. Similar streaking in the fractional order spots was observed in the LEED as in our transmission electron diffraction, and we believe the streaking is simply due to the finite size of the domain as evident from the imaging results, rather than disorder within the domain structure.
The reconstruction of the Ir(OOl)-(5 x 1) con- trasts sharply with the Au(OOl)-(5 X n) in many aspects. We discuss it here only briefly since it will be examined closely in another paper [25]. The Ir reconstruction occurs in bands, and these bands seem to be locked in to the surface in straight rows and terminated in an integer num- ber of unit cell. The Au(001) reconstruction de- velops in patches with no well-defined shape. The Au(OOl)-(5 x n) reconstruction was found to be very sensitive to the presence of bulk defects, such as dislocations and stacking faults near the surface. The presence of stacking faults in partic- ular caused the Au reconstruction to bend around the defect regions, and in some cases caused the complete termination of the reconstruction. No such interaction was found in the case of the Ir(5 X 1) both in the presence of the dislocations and the IrO, particles.
The observation of IrO, precipitates in the sub-surface region is an interesting example of the differences in sensitivity between transmis- sion electron microscopy and other more conven- tional surface science techniques. With other techniques these precipitates would have been close to invisible. Although these precipitates do not themselves prevent the formation of the (5 X 1) reconstructed surface for IrCOOl), the presence of the sub-surface defects in general may have a significant effect on the surface prop-
erties of the materials. The surface properties of a material also critically depend on the sample preparation method employed. With this Ir speci- men, the damage in the sub-surface region in- curred during the ion-milling was probably diffi- cult to remove and may have acted as a source for trapping the oxygen and causing the precipita- tion of oxide particles.
Acknowledgements
We would like to acknowledge support from the National Science Foundation (D.N.D.) on grant No. DMR-85-20280 and from the Airforce Office of Scientific Research (P.X. and L.D.M.) on grant No. AFOSR-90-0045.
References
111 121
[31
141
El [61
[71 [81
[91 [lOI
[ill
1121
[131 [141
[151 [161
J.T. Grant, Surf. Sci. 18 (1969) 228. M.A. Van Hove, R.J. Koestner, P.C. Stair, J.P. Biberian, L.L. Kesmodel, I. BartoS and G.A. Somorjai, Surf. Sci. 103 (1981) 189; 218. E. Lang, K. Miiller, K. Heinz, M.A. Van Hove, R.J. Koestner and G.A. Somorjai, Surf. Sci. 127 (1983) 347. K. Heinz, G. Schmidt, L. Hammer and K. Miiller, Phys. Rev. B 32 (1985) 6214. N. Bickel and K. Heinz, Surf. Sci. 163 (198.5) 435. Q.J. Gao and T.T. Tsong, J. Vat. Sci. Technol. A 5 (1987) 761. J. Witt and K. Miiller, Phys. Rev. Lett. 57 (1986) 1153. K. Miiller, J. Witt and 0. Schultz, J. Vat. Sci. Technol. A 5 (1987) 757. D.G. Fedak and N.A. Gjostein, Surf. Sci. 8 (1967) 77. See, for example, K. Takayanagi, Y. Tanishiro, S. Taka- hashi and M. Takahashi, Surf. Sci. 164 (1985) 367; P. Xu, D. Dunn, J.P. Zhang and L.D. Marks, Surf. Sci. Lett. 285 (1993) L479. L.D. Marks, P. Xu and D. Dunn, Surf. Sci. 294 (1993) 322. R. Ai, M.I. Buckett, D. Dunn, T.S. Savage, J.P. Zhang and L.D. Marks, Ultramicroscopy 39 (1991) 387. J.E. Bonevich and L.D. Marks, Microscopy 22 (1992) 95. D.N. Dunn, J.P. Zhang and L.D. Marks, Surf. Sci. 260 (1992) 220. D. Cherns, Philos. Mag. 30 (1974) 549. G. Lehmpfuhl and Y. Uchida, Ultramicroscopy 4 (1979) 275.
[171 S. Iijima, Ultramicroscopy 6 (1981) 41. 1181 P. Xu and L.D. Marks, Ultramicroscopy 45 (1992) 155.

D.N. Dunn et al. / UHVelectron microscopy of Ir(OO1). I 321
1191 K. Heinz, E. Lang, K. Strauss and K. Miiller, Appl. Surf. Sci. 11/L? (1982) 611.
1201 K. Heinz, E. Lang, K. Strauss and K. Miiller, Surf. Sci. 120 (1982) L401.
[21] J. Kippers and H. Michel, Appl. Surf. Sci. 3 (1979) 179. [22] J.D.H. Donnay and H.M. Ondik, Crystal Data (De-
terminative Tables), Vol. 2, Inorganic Compound, 3rd
ed., US Secretary of Commerce and JCPDS Interna- tional Centre for Diffraction Data (1973).
t231 E.M. Levin, C.R. Robbins and H.F. McMurdie, Phase Diagram for Ceramist, 1969 suppl., (The American Ce- ramic Society, Inc., Washington DC, 1969) p. 45.
[241 L.D. Marks and D.J. Smith, Surf. Sci. 157 (1985) L367. 1251 D.N. Dunn and L.D. Marks, in preparation.