Embed Size (px)
Citation preview
UNITED STATES
SECURITIES AND EXCHANGE COMMISSION Washington, D.C. 20549
FORM 6-K
REPORT OF FOREIGN PRIVATE ISSUER PURSUANT TO RULE 13a-16 OR 15d-16 UNDER
THE SECURITIES EXCHANGE ACT OF 1934
Date: May 2, 2012 Commission File Number: 1-15060
UBS AG (Registrant’s Name)
Bahnhofstrasse 45, Zurich, Switzerland, and Aeschenvorstadt 1, Basel, Switzerland
(Address of principal executive office)
Indicate by check mark whether the registrant files or will file annual reports under cover of Form 20-F or Form 40-F.
Form 20-F ⌧ Form 40-F �

This Form 6-K consists of the presentation materials related to the First Quarter 2012 Results of UBS AG, which appear immediately following this page.
First quarter 2012 results
First quarter 2012 results
May 2, 2012
1
This presentation contains statements that constitute “forward-looking statements,” including but not limited to management’s outlook for
UBS’s financial performance and statements relating to the anticipated effect of transactions and strategic initiatives on UBS’s business
and future development. While these forward-looking statements represent UBS’s judgments and expectations concerning the matters
described, a number of risks, uncertainties and other important factors could cause actual developments and results to differ materially
from UBS’s expectations. Additional information about those factors is set forth in documents furnished or filed by UBS with the US
Securities and Exchange Commission, including UBS’s financial report for first quarter 2012 and UBS’s Annual Report on Form 20-F for
the year ended 31 December 2011. UBS is not under any obligation to (and expressly disclaims any obligation to) update or alter its
forward-looking statements, whether as a result of new information, future events or otherwise.
Cautionary statement regarding forward-looking statements
Use of adjusted numbersThroughout this presentation, unless otherwise indicated, “adjusted” figures exclude each of the following items, to the extent applicable, on a Group and business
division level:
- own credit on financial liabilities designated at fair value (CHF 1,164 million loss for the Group in 1Q12)
- debit valuation adjustments (negative CHF 53 million for the Group in 1Q12)
- net restructuring charges (net charge of CHF 126 million for the Group in 1Q12)
- reduction to personnel expenses related to changes to UBS’s Swiss pension plan (reduction to personnel expenses of CHF 485 million for the Group in 1Q12)
Pro-forma Basel 3 RWAs and Basel 3 capital ratiosThe calculation of our pro-forma Basel 3 RWAs combines existing Basel 2.5 RWAs, securitization exposures based on a revised model that applies a fixed risk
weighting, and new capital charges based on new models and calculation engines. These new models require regulatory approval that is not expected until after
further guidance is developed. Our pro-forma Basel 3 RWAs therefore include estimates of the impact of these new capital charges and will be refined as new
models and the associated systems are enhanced and as regulatory interpretations evolve.
Currency translationUSD profit and loss numbers shown in this presentation are based on average rates for the quarter. Refer to “Note 18 Currency translation rates” in UBS’s 1Q12
report for more information.
Important information related to numbers shown in this presentation
2
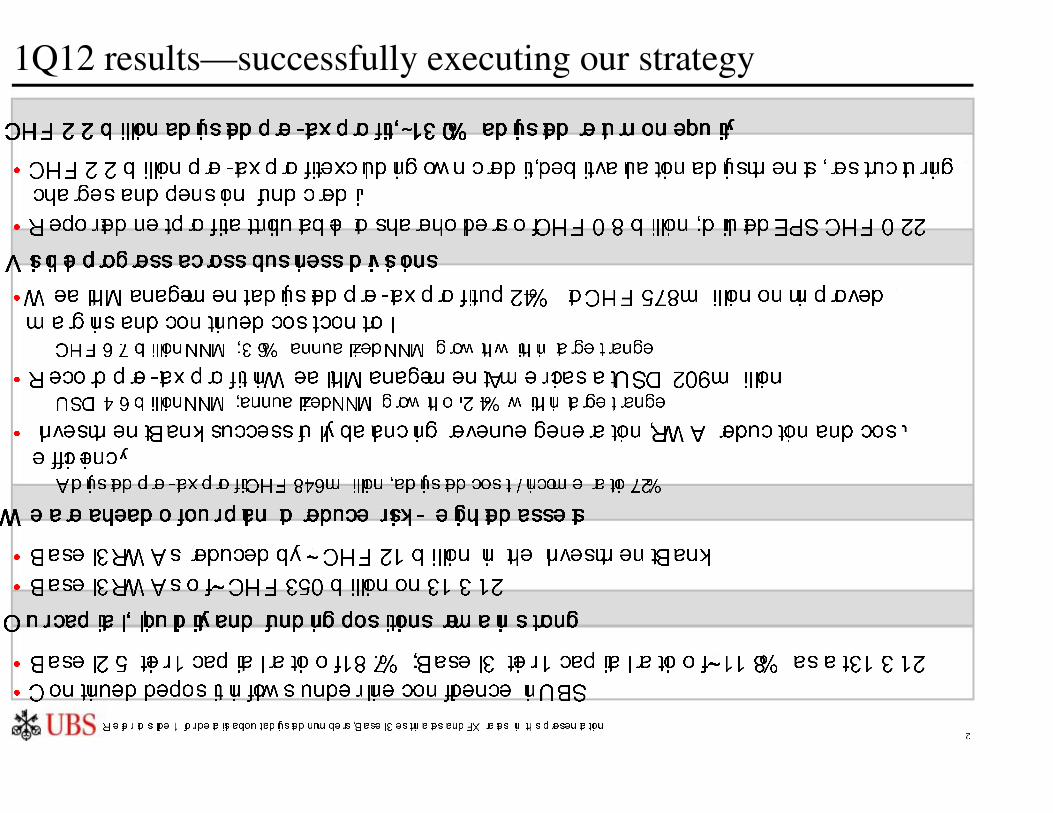
1Q12 results—successfully executing our strategy
• CHF 2.2 billion pre-tax profit excluding own credit, debit valuation adjustments, restructuring
charges and pension fund credit
• Reported net profit attributable to shareholders of CHF 0.8 billion; diluted EPS CHF 0.22
• Basel 3 RWAs reduced by ~ CHF 21 billion in the Investment Bank
• Basel 3 RWAs of ~ CHF 350 billion on 31.3.12
• Basel 2.5 tier 1 capital ratio of 18.7%; Basel 3 tier 1 capital ratio of ~11.8% as at 31.3.12
• Continued deposit inflows underline confidence in UBS
• Wealth Management adjusted pre-tax profit up 24% to CHF 578 million on improved
margins and continued cost control
– CHF 6.7 billion NNM; 3.6% annualized NNM growth within target range
• Record pre-tax profit in Wealth Management Americas at USD 209 million– USD 4.6 billion NNM; annualized NNM growth of 2.4% within target range
• Investment Bank successfully balancing revenue generation, RWA reduction and cost
efficiency
– Adjusted pre-tax profit CHF 846 million, adjusted cost / income ratio 72%
CHF 2.2 billion adjusted pre-tax profit, ~13.0% adjusted return on equity
We are ahead of our plan to reduce risk-weighted assets
Visible progress across business divisions
Our capital, liquidity and funding positions remain strong
Refer to slide 1 for details about adjusted numbers, Basel 3 estimates and FX rates in this presentation
3
1Q11 2Q11 3Q11
NYSE
1Q12
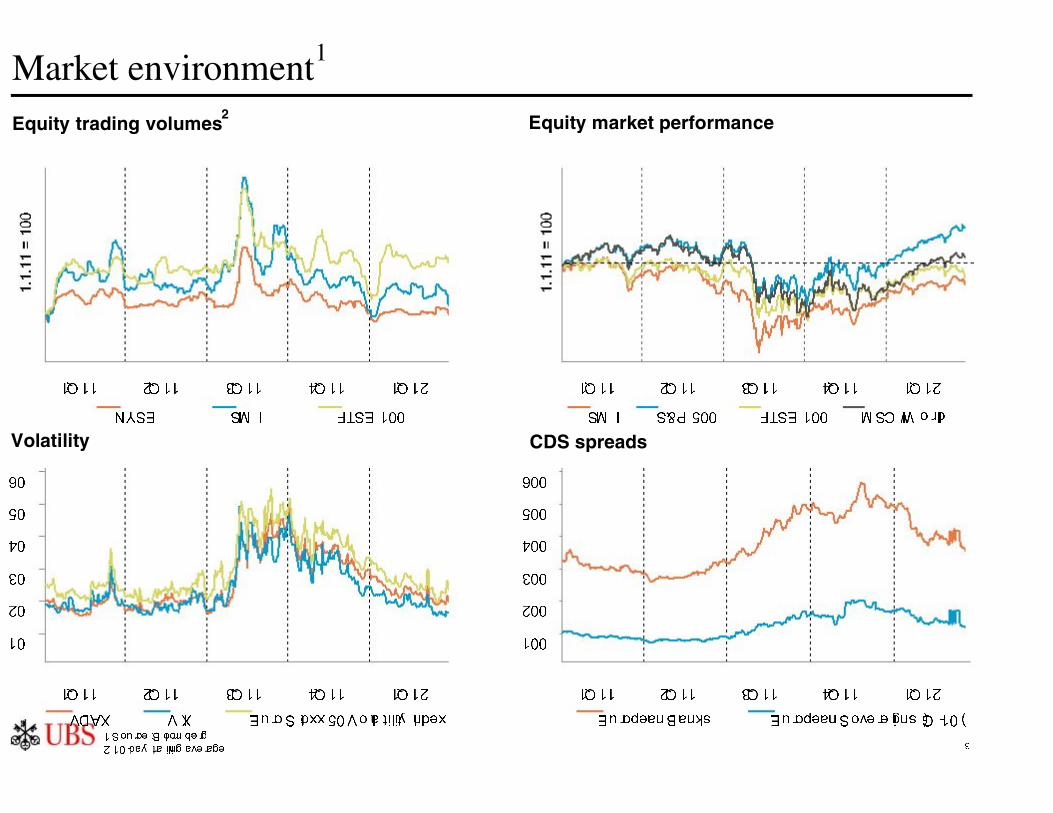
Equity market performance
SMI S&P 500 FTSE 100 MSCI World
1Q11 2Q11 3Q11 1Q12
Volatility
1Q11 2Q11 3Q11 4Q11
VDAX VIX Euro Stoxx 50 Volatility Index
1Q12
CDS spreads
1Q11 2Q11 3Q11 4Q11
European Banks European Sovereigns (G-10)
1Q12
100
200
300
400
500
600
Market environment1
1 Source: Bloomberg
2 10-day trailing average
SMI FTSE 100
4Q11 4Q11
10
20
30
40
50
60
Equity trading volumes2

4
1Q12 resultsBalanced and diversified sources of revenues and profits
Refer to slide 1 for details about adjusted numbers, Basel 3 estimates and FX rates in this presentation
(CHF million) WM WMA IB Global AM R&C CC Group
Income 1,770 1,425 2,889 478 918 173 7,653
of which debit valuation adjustments (53) (53)
Credit loss (expense) / recovery (1) 0 14 0 18 6 37
Own credit gain / (loss) (1,103) (61) (1,164)
Total operating income 1,769 1,425 1,800 478 936 118 6,525
Personnel expenses 559 1,021 1,503 220 253 88 3,643
of which restructuring charges 14 0 109 6 7 3 139
of which Swiss pension fund credit (237) 0 (38) (20) (190) 0 (485)
Non-personnel expenses 407 214 670 102 108 77 1,578
of which restructuring charges (2) (2) (8) 0 0 (1) (13)
Total operating expenses 966 1,235 2,173 322 361 165 5,221
Adjusted pre-tax profitExcluding own credit, debit valuation adjustments,
restructuring charges and Swiss pension fund credit
578 188 846 142 392 17 2,162
% of Group adjusted pre-tax profit 27% 9% 39% 7% 18% 1% 100%
Pre-tax profit / (loss) as reported 803 190 (373) 156 575 (47) 1,304
Tax expense 476
Net profit attributable to non-controlling interests 1
Net profit attributable to UBS shareholders 827
Diluted EPS (CHF) 0.22
55
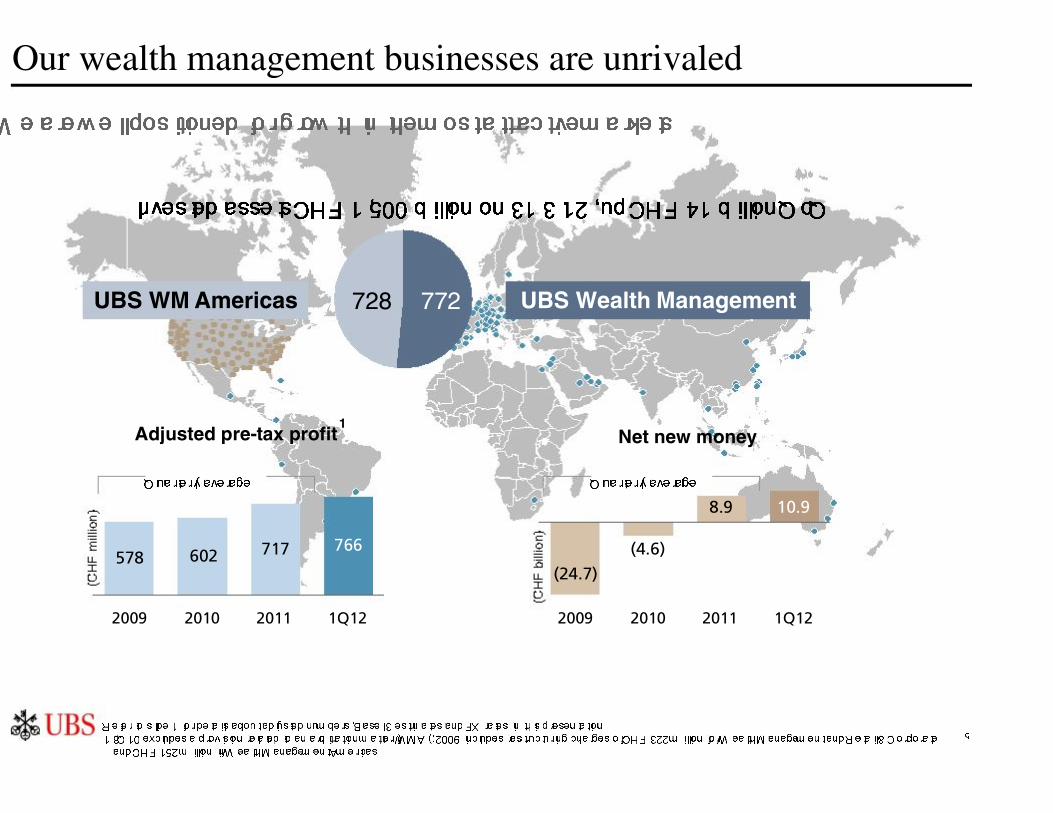
Our wealth management businesses are unrivaled
UBS Wealth Management
Invested assets CHF 1,500 billion on 31.3.12, up CHF 41 billion QoQ
5
UBS WM Americas
Net new money
Refer to slide 1 for details about adjusted numbers, Basel 3 estimates and FX rates in this presentation1 3Q10 excludes a provision related to an arbitration matter (WMA); 2009 includes restructuring charges of CHF 322 million for Wealth Management and Retail & Corporate
and CHF 152 million in Wealth Management Americas
Quarterly average
We are well positioned for growth in the most attractive markets
Adjusted pre-tax profit 1
Quarterly average
766578 602 717
2009 2010 2011 1Q12
10.9
(24.7)
8.9
(4.6)
2009 2010 2011 1Q12
772728

6
11.13.1
6.73.85.6
(21.8)
(3.0)
5.9
2009 2010 2011 1Q11 2Q11 3Q11 4Q11 1Q12
1,9281,673 1,769
803
471645 645
468 578
1Q11 4Q11 1Q12
Wealth Management
Operating income and pre-tax profit
Net new money
Operating income increased 6% asclient activity levels improved from very low levels in 4Q11
Operating income
Pre-tax profit (as reported)
Pre-tax profit (adjusted)
24% increase in adjusted pre-tax profit; CHF 6.7 billion net new money
Quarterly average
3.6% net new money growth, withintarget range
Continued hiring of client advisors instrategic growth regions
Adjusted operating expensesremained stable– Adjusted cost / income ratio improved to 67%,
within target range
Refer to slide 1 for details about adjusted numbers, Basel 3 estimates and FX rates in this presentation
(1)(1)5
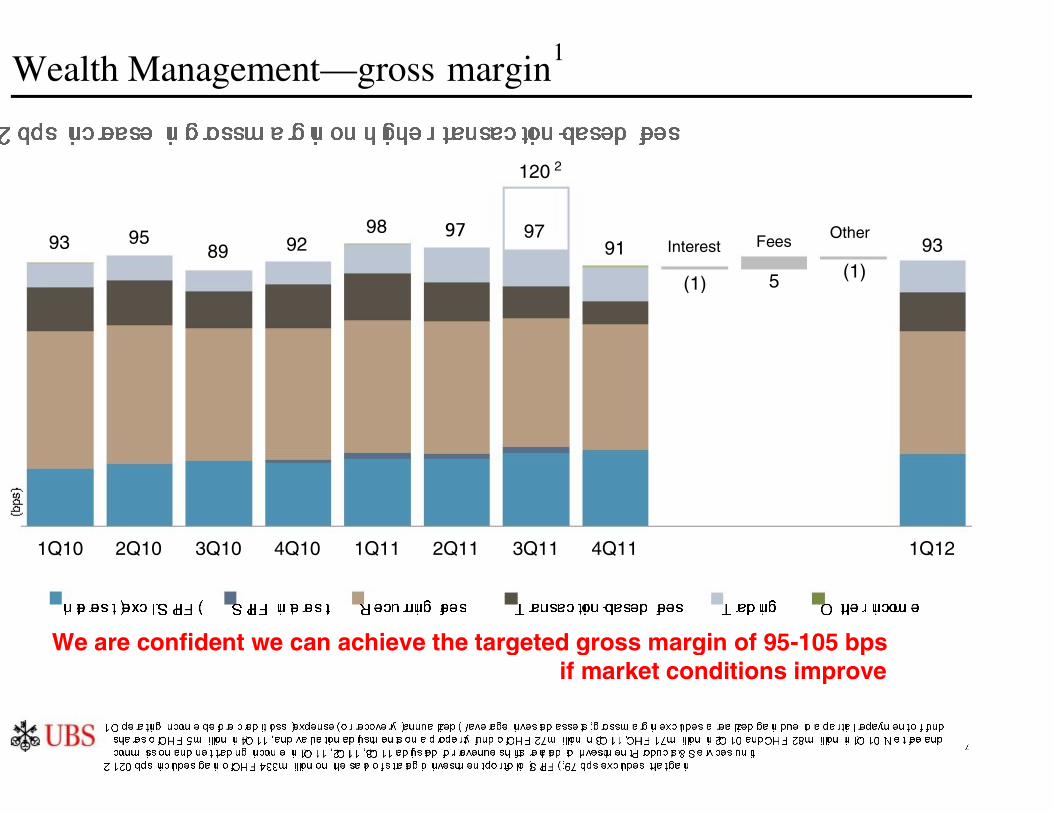
91 FeesInterest 9393 9589 92
98 97 97
1Q10 2Q10 3Q10 4Q10 1Q11 2Q11 3Q11 4Q11 1Q12
Other
7
Wealth Management—gross margin1
1 Operating income before credit loss (expense) or recovery (annualized) / average invested assets; gross margin excludes a realized gain due to a partial repayment of fundshares of CHF 5 million in 4Q11, and valuation adjustments on a property fund of CHF 27 million in 3Q11, CHF 17 million in 2Q10 and CHF 28 million in 1Q10. Net fee and
commission and net trading income in 1Q11, 2Q11, 3Q11 adjusted for revenue shifts related to Investment Products & Services unit
2 120 bps includes gain of CHF 433 million on the sale of strategic investment portfolio (SIPF); 97 bps excludes that gain
2 bps increase in gross margin on higher transaction-based fees
120
Interest (excl. SIPF) Recurring fees TradingTransaction-based feesSIPF interest Other income
We are confident we can achieve the targeted gross margin of 95-105 bpsif market conditions improve
2
8
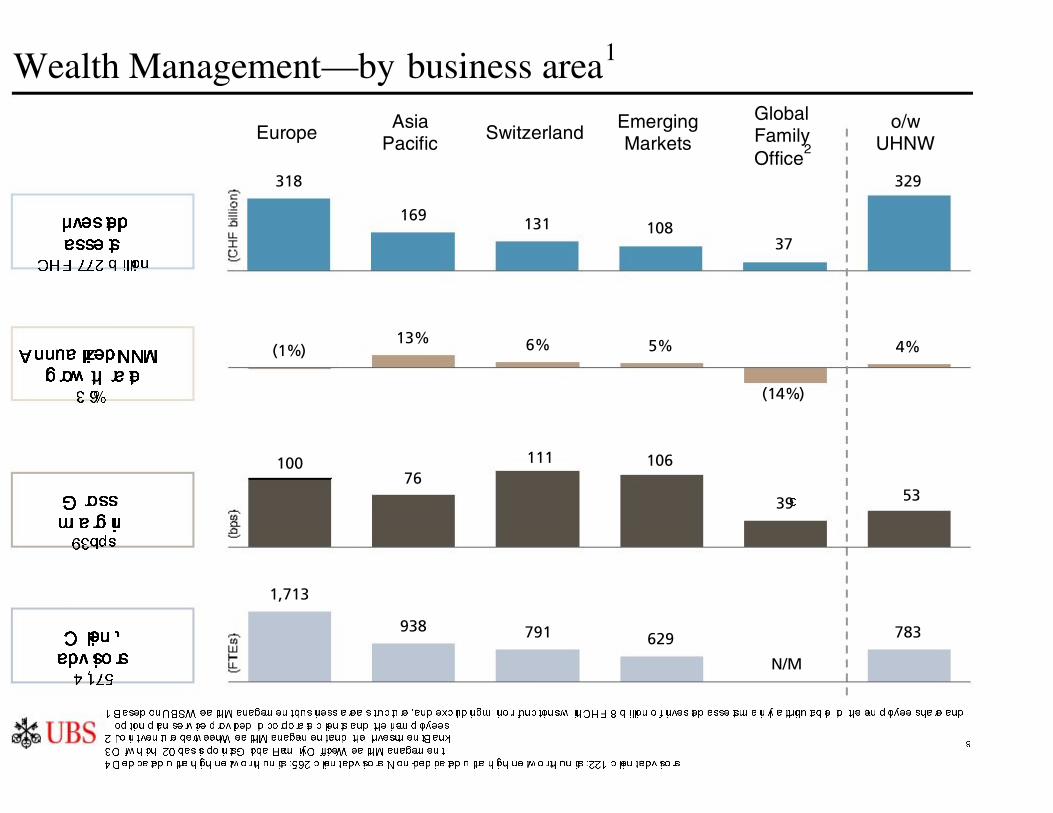
938 791 629 783
1,713
N/M
5376
106100
39
111
13% 6% 5%
(14%)
4%(1%)
318
169 131 10837
329
Wealth Management—by business area1
Investedassets
CHF 772 billion
Annualized NNMgrowth rate
3.6%
Grossmargin93bps
Clientadvisors
4,175
1 Based on UBS Wealth Management business area structure, and excluding minor functions with CHF 8 billion of invested assets mainly attributable to the employee share and
option plan service provided to corporate clients and their employees2 Joint venture between Wealth Management and the Investment Bank
3 Of which: 20 basis points Global Family Office Wealth Management4 Dedicated ultra high net worth units: 562 client advisors. Non-dedicated ultra high net worth units: 221 client advisors
SwitzerlandGlobalFamily
EmergingMarketsEurope
o/wUHNW
AsiaPacific
3
4
Office2
9
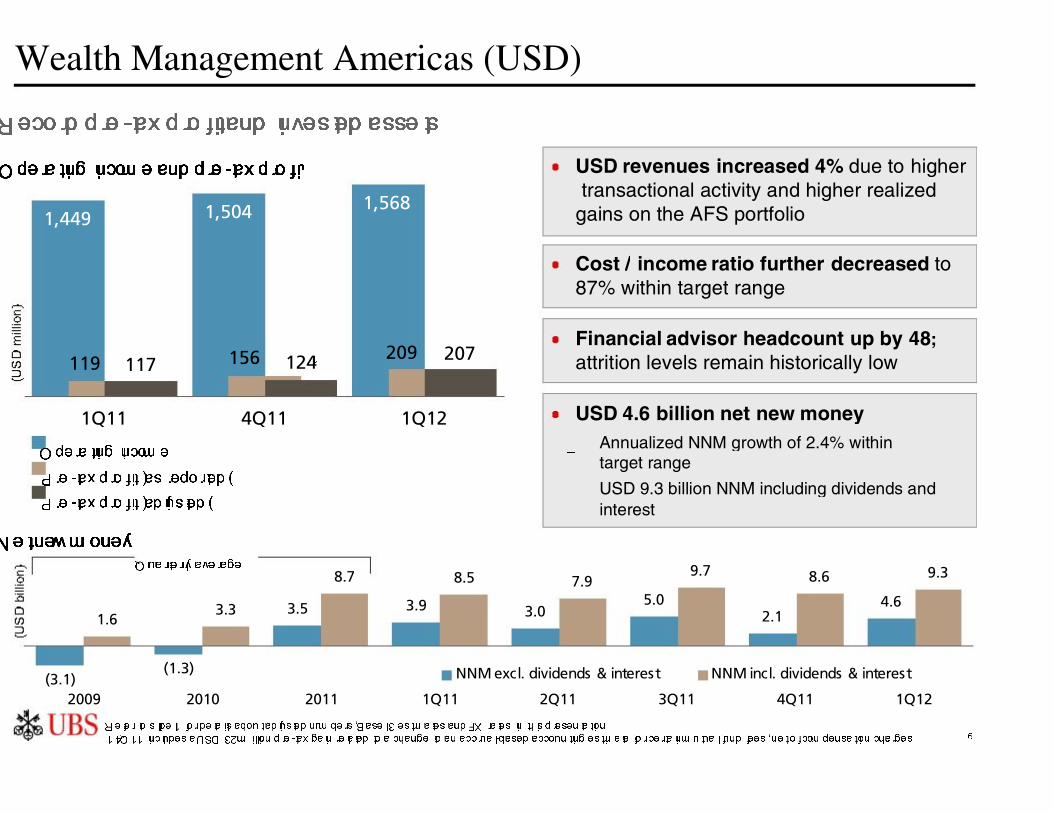
(3.1)(1.3)
3.5 3.9 3.05.0
2.14.6
1.6
8.7 8.5 7.99.7 8.6 9.3
3.3
2009 2010 2011 1Q11 2Q11 3Q11 4Q11 1Q12
NNM excl. dividends & interest NNM incl. dividends & interest
1,449 1,504 1,568
209156119 117 124 207
1Q11 4Q11 1Q12
Wealth Management Americas (USD)
USD 4.6 billion net new money– Annualized NNM growth of 2.4% within
target range
– USD 9.3 billion NNM including dividends andinterest
Refer to slide 1 for details about adjusted numbers, Basel 3 estimates and FX rates in this presentation1 4Q11 includes a USD 32 million pre-tax gain related to a change to an accrual-based accounting estimate for certain mutual fund fees, net of compensation charges
Operating income and pre-tax profit
Record pre-tax profit and invested assets
Operating income
Pre-tax profit (as reported)
Pre-tax profit (adjusted)
Net new money
Quarterly average
USD revenues increased 4% due to highertransactional activity and higher realized
gains on the AFS portfolio
Cost / income ratio further decreased to87% within target range
Financial advisor headcount up by 48;attrition levels remain historically low
1
10
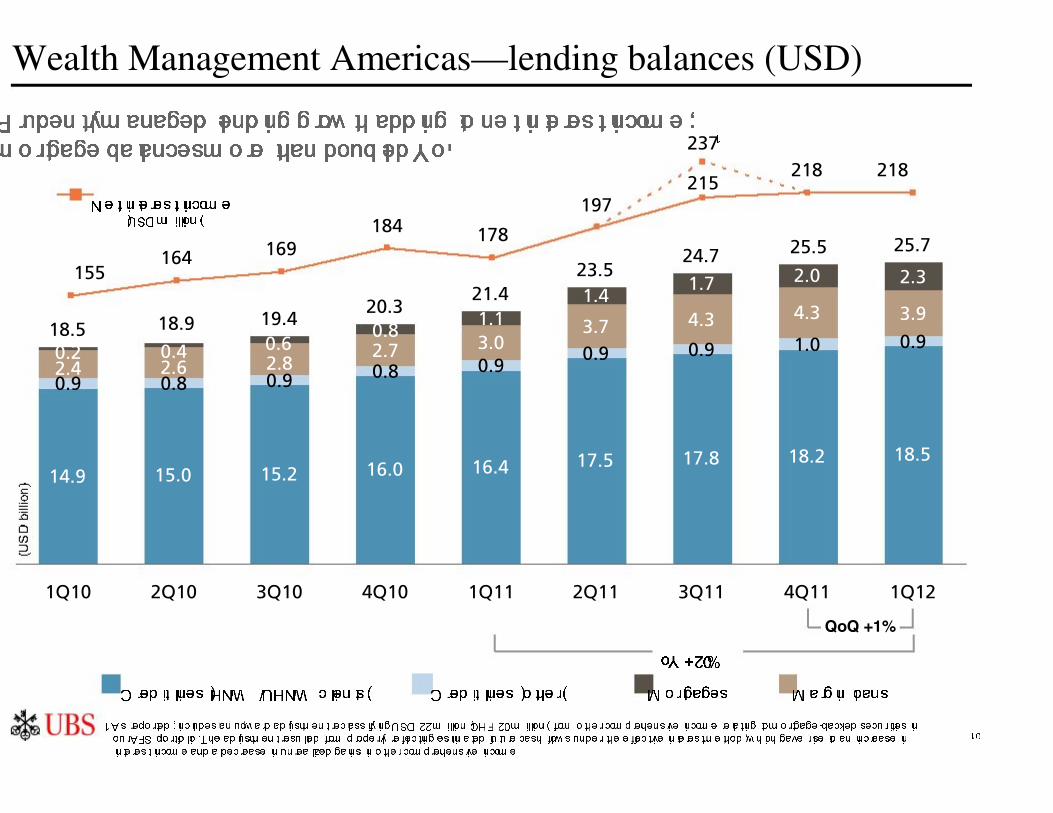
14.9 15.0 15.2 16.0 16.4 17.5 17.8 18.2 18.5
0.9 0.8 0.9 0.8 0.90.9 0.9 1.0 0.92.7 3.03.7 4.3 4.3 3.91.11.4
2.3
2.62.4 2.80.2 0.4 0.60.8
2.01.7
25.7
18.5 18.9 19.420.3
21.423.5
24.7 25.5
1Q10 2Q10 3Q10 4Q10 1Q11 2Q11 3Q11 4Q11 1Q12
Wealth Management Americas—lending balances (USD)Prudently managed lending growth adding to net interest income;
mortgage balances more than doubled YoY
YoY +20%
Credit lines (HNW / UHNW clients) Margin loansMortgages
QoQ +1%
1 As reported; includes an upward adjustment reclassifying USD 22 million (CHF 20 million) from other comprehensive income relating to mortgage-backed securities inour AFS portfolio. The adjustment resulted from properly reflecting estimated future cash flows under the effective interest method, which gave rise to an increase in
interest income and a decrease in unrealized gains in other comprehensive income
1
Credit lines (other)
155164 169
184 178
197
218 218215
237
Net interest income(USD million)

11
704992
1,758
1,554
466
280
396
1,310
1,224
2,956
2,190
3,537
1Q11 4Q11 1Q12
1,412
7791,092
1,891
1,333
1,708
502
301
437
3,809
2,393
3,252
1Q11 4Q11 1Q12
Investment Bank
Refer to slide 1 for details about adjusted numbers, Basel 3 estimates and FX rates in this presentation
Operating income excluding own credit and DVA
CHF USD
Equities FICC IBD Credit loss (expense) / recovery
Successfully balancing revenue generation, RWA reduction and cost efficiency
+35% +36%
CHF 846 million adjusted pre-tax profit– Higher revenues across all business areas
– 13% adjusted return on attributed equity
Adjusted cost / income ratio improvedto 72% from 87%
Continued progress in RWA reduction– Mainly due to lower market and credit risk
– Basel 2.5 RWAs reduced by CHF 21 billionto CHF 114 billion
– Basel 3 RWAs reduced by ~ CHF 21 billionto ~ CHF 191 billion
QoQ comparison
Adjusted pre-tax profit
994276
846
1Q11 4Q11 1Q12
12
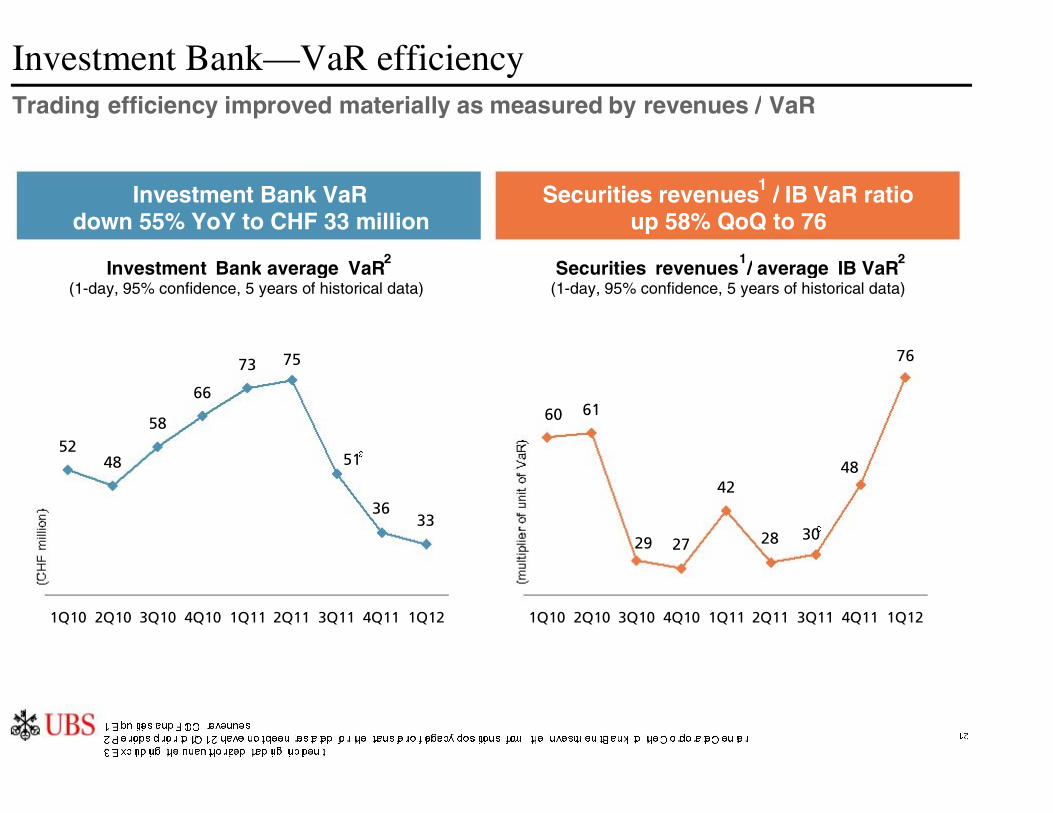
5248
58
66
73
3633
51
75
1Q10 2Q10 3Q10 4Q10 1Q11 2Q11 3Q11 4Q11 1Q12
61
27
42
28 30
60
29
48
76
1Q10 2Q10 3Q10 4Q10 1Q11 2Q11 3Q11 4Q11 1Q12
Investment Bank—VaR efficiencyTrading efficiency improved materially as measured by revenues / VaR
Investment Bank average VaR (1-day, 95% confidence, 5 years of historical data)
Securities revenues / average IB VaR (1-day, 95% confidence, 5 years of historical data)
Investment Bank VaRdown 55% YoY to CHF 33 million
3
1 Equities and FICC revenues2 Periods prior to 1Q12 have not been restated for the transfer of legacy positions from the Investment Bank to the Corporate Center
3 Excluding the unauthorized trading incident
3
Securities revenues1 / IB VaR ratioup 58% QoQ to 76
2 21
13
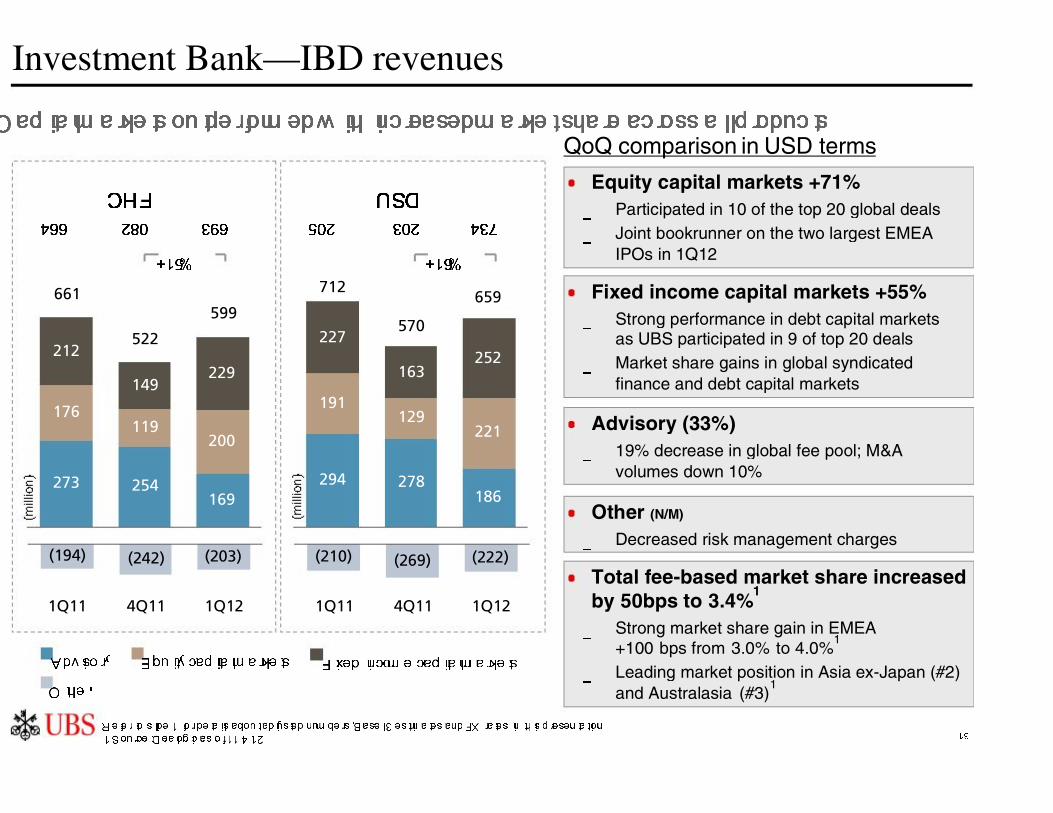
273 254169
176119
200
212
149229
599661
522
(194) (242) (203)
1Q11 4Q11 1Q12
294 278186
191129
221
227
163252
659
570
712
QoQ comparison in USD terms
Investment Bank—IBD revenues
Refer to slide 1 for details about adjusted numbers, Basel 3 estimates and FX rates in this presentation1 Source: Dealogic as of 11.4.12
CHF USD
Advisory Equity capital markets Fixed income capital markets
Other
502 302 437466 280 396
Capital markets outperformed with increased market share across all products
+15% +16%
Total fee-based market share increased by 50bps to 3.4%
1
– Strong market share gain in EMEA+100 bps from 3.0% to 4.0%
1
– Leading market position in Asia ex-Japan (#2) and Australasia (#3)
1
Equity capital markets +71%– Participated in 10 of the top 20 global deals– Joint bookrunner on the two largest EMEA
IPOs in 1Q12
Other (N/M)
– Decreased risk management charges
Fixed income capital markets +55%– Strong performance in debt capital markets
as UBS participated in 9 of top 20 deals– Market share gains in global syndicated
finance and debt capital markets
Advisory (33%)– 19% decrease in global fee pool; M&A
volumes down 10%
(210) (269) (222)
1Q11 4Q11 1Q12

14
515
277 347
459
128
365
235
240
271
8
59
101
992
704
1,310
1Q11 4Q11 1Q12
555
304 382
494
146
402
253
264
299
8
65
110
1,092
779
1,412
1Q11 4Q11 1Q12
Investment Bank—Equities revenues
QoQ comparison in USD terms
Cash Derivatives Prime services Other
CHF USD
Refer to slide 1 for details about adjusted numbers, Basel 3 estimates and FX rates in this presentation
Improved volumes in Cash; more stable trading conditions
+40%+41%
Other (88%)
– Decreased proprietary trading revenues
Prime services +13%
– Improved financing revenues
Derivatives +175%
– Stronger trading revenues and improved
client flows
– Equity-linked revenues improved as
sentiment in the equity and credit markets
improved
Cash +26%
– Higher volumes led to higher commissions in
all regions

15
679968
1,040 408 827
771
215
99
217
(144)(46) (105)
1,708
1,333
1,891
1Q11 4Q11 1Q12
631892
967 377 748
699
196201
89
(134)(89)(42)
1,758
1,224
1,554
1Q11 4Q11 1Q12
Investment Bank—FICC revenues
QoQ comparison in USD terms
Credit and EM revenues more than doubled with significantly lower risk profile
CHF(excluding DVAs)
USD(excluding DVAs)
Macro Credit Emerging Markets Other
Refer to slide 1 for details about adjusted numbers, Basel 3 estimates and FX rates in this presentation1 The commodities business is reported in Macro starting 1Q12 (previously in Other); prior periods have been restated
+27% +28%
Emerging markets +117%– Improved performance in all regions and all
products on improved client flows
Credit +103%– Flow businesses captured good bid offer
spreads and increased client activity
– Structured credit benefited from increased client activity
Macro (20%)– FX recorded steady returns despite lower
volatility
– Commodities revenues doubled with a strongperformance in the index business
1
– Rates: impacted by tightening spreads inshort-term rates and reduced market activity

16
(6.7)(2.0) (0.8)
4.1
(2.9)
2.10.3
3.1
(1.7)
(8.4)
(2.6)
2.3
FY09 FY10 FY11 1Q12
496463 478
124156
118124 142132
1Q11 4Q11 1Q12
Global Asset Management
Operating income increased 3%– Performance fees more than doubled, mainly in
A&Q
– 92% of A&Q assets eligible for performancefees were above or within 5% of high watermarks by quarter-end
– Net management fees down 3%
Higher pre-tax profit driven by increased performance fees
Operating income and pre-tax profit
WM businesses
Third party
Total
Operating income
Pre-tax profit (as reported)
Pre-tax profit (adjusted)
Quarterly average
Gross margin steady at 34 bps, withintarget range
Adjusted operating expenses increased 2% on good cost control
Refer to slide 1 for details about adjusted numbers, Basel 3 estimates and FX rates in this presentation
NNM by channel - excluding money market

17
590 567 539
125 123 128170 166 175
936928965
1Q11 4Q11 1Q12
965 928 936
403575
412403 420 392
1Q11 4Q11 1Q12
Stable operating income supported by reduced credit loss expenses
Operating income and pre-tax profit
Operating income components
1
Interest
Recurring fees
Trading
Other income
Transaction-based fees
Credit loss (expense) / recovery
Operating income
Pre-tax profit (as reported)
Pre-tax profit (adjusted)
Operating income increased– CHF 18 million credit loss recovery
– Trading income declined due to decreased treasury-related income and lower FX-relatedclient activity
– Fee income increased on higher client assetsand credit-related fees
Retail & Corporate
Refer to slide 1 for details about adjusted numbers, Basel 3 estimates and FX rates in this presentation
Adjusted cost / income ratio of 59%,within target range
18
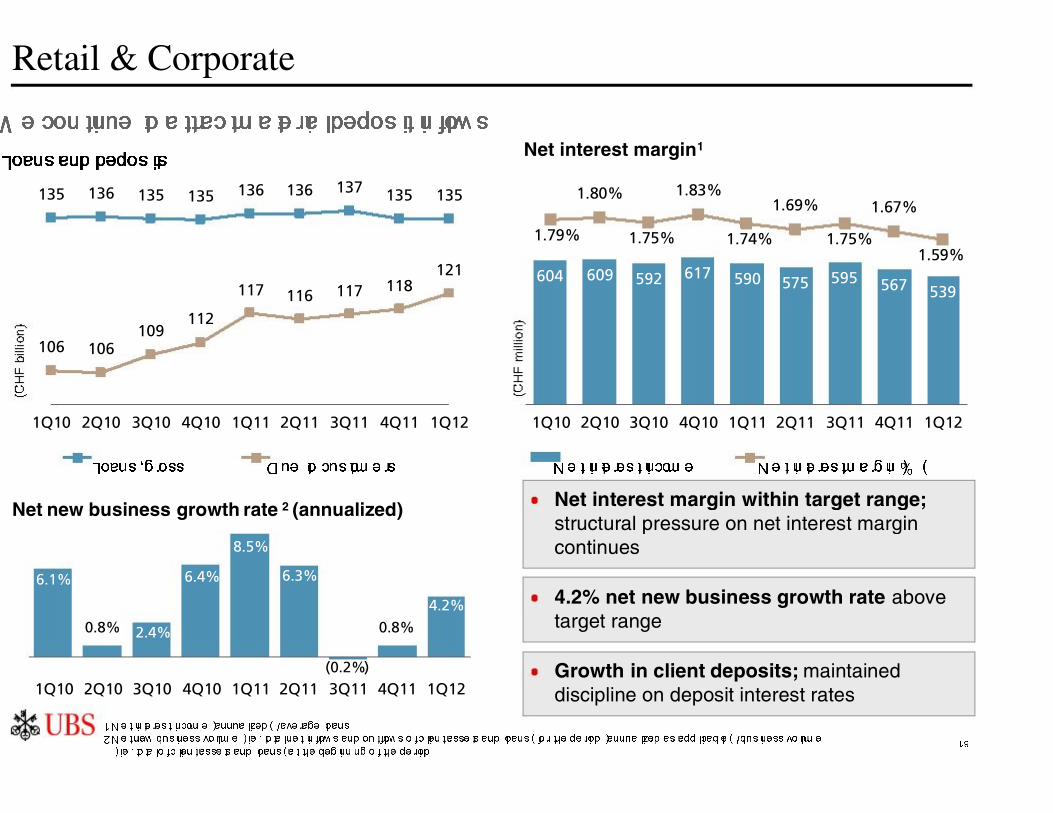
135 136 135 135 136 136 137 135 135
106 106109
112
117 116 117 118121
1Q10 2Q10 3Q10 4Q10 1Q11 2Q11 3Q11 4Q11 1Q12
604 609 592 617 590 575 595 567 539
1.80% 1.83%1.69% 1.67%
1.79% 1.75% 1.74% 1.75%1.59%
1Q10 2Q10 3Q10 4Q10 1Q11 2Q11 3Q11 4Q11 1Q12
Retail & Corporate
Growth in client deposits; maintaineddiscipline on deposit interest rates
1 Net interest income (annualized) / average loans2 Net new business volume (i.e. total net inflows and outflows of client assets and loans) for the period (annualized as applicable) / business volume
(i.e. total of client assets and loans) at the beginning of the period
Loans and deposits
We continue to attract material deposit inflows
Net interest income Net interest margin (%)Loans, gross Due to customers
Net interest margin within target range; structural pressure on net interest margin continues
4.2% net new business growth rate above target range0.8% 0.8%
(0.2%)
4.2%
2.4%
6.1% 6.3%6.4%
8.5%
1Q10 2Q10 3Q10 4Q10 1Q11 2Q11 3Q11 4Q11 1Q12
Net interest margin1
Net new business growth rate 2 (annualized)

19
(76)
54
(75)(76)(126)
1Q11 2Q11 3Q11 4Q11 1Q12
71
(252)(388)
193
(207)
(125)
13181 31
13
273
162
(513)
84
(459)
1Q11 2Q11 3Q11 4Q11 1Q12
Corporate Center - Core Functions:CHF 75 million pre-tax loss– CHF 11 million operating income after allocations to the
business divisions
– CHF 86 million operating expenses not allocated to thebusiness divisions
Corporate CenterPre-tax loss of CHF 47 million; positive contribution from the Legacy Portfolio
Legacy Portfolio:CHF 28 million pre-tax profit– Legacy Portfolio consists of legacy positions
transferred from the Investment Bank and the option toacquire the SNB StabFund’s equity
Continued progress in risk reduction– ~ CHF 3 billion reduction in Basel 3 RWAs
– Recent commutation agreement with a monolineinsurer removed certain impediments to restructure orsell assets which account for aggregate Basel 3 RWAsof almost CHF 15 billion
Legacy Portfolio revenues
Refer to slide 1 for details about adjusted numbers, Basel 3 estimates and FX rates in this presentation1 Option fair value CHF 1.7 billion (USD 1.9 billion) on 31.3.12
2 Excluding own credit and credit loss expense / (recovery)
Corporate Center - Core Functions pre-tax profit
Legacy positions transferred from the Investment Bank
SNB StabFund option
1
2
1
20
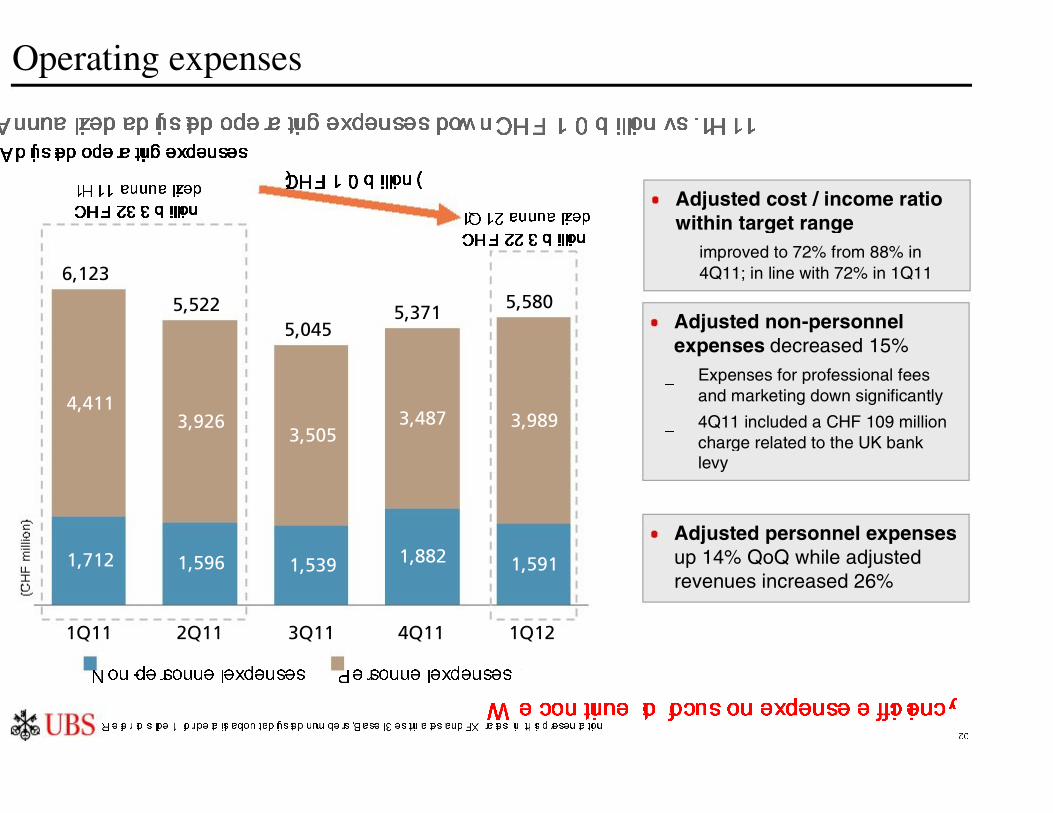
1,712 1,596 1,539 1,882 1,591
4,4113,926
3,5053,487 3,989
6,123
5,5225,045
5,371 5,580
1Q11 2Q11 3Q11 4Q11 1Q12
Operating expensesAnnualized adjusted operating expenses down CHF 1.0 billion vs. 1H11
Adjusted operating expenses
Adjusted non-personnelexpenses decreased 15%– Expenses for professional fees
and marketing down significantly
– 4Q11 included a CHF 109 million charge related to the UK bank levy
Adjusted personnel expenses up 14% QoQ while adjusted revenues increased 26%
Non-personnel expenses Personnel expenses
Adjusted cost / income ratiowithin target range– improved to 72% from 88% in
4Q11; in line with 72% in 1Q11
Refer to slide 1 for details about adjusted numbers, Basel 3 estimates and FX rates in this presentation
1Q12 annualized
CHF 22.3 billion
1H11 annualized
CHF 23.3 billion
(CHF 1.0 billion)
We continue to focus on expense efficiency

21
1Q12 net tax expense
Tax expense
Deferred tax expenses with respect to theamortization of previously recognized DTAs
1Q12 net tax expense of CHF 476 million
Other net tax expenses in respectof 1Q12 taxable profits
Tax benefits arising from the release of provisions following agreement of prior year tax positions
CHF 447 million
CHF 80 million
CHF (51) million
CHF 476 million
We expect the Group’s effective tax rate to be in the range of 20–25% for FY12, exclusive of any potentially
significant book tax adjustments that could distort the rate (e.g., own credit gains / losses)
1Q12 effective tax rate 36.5%
Pre-tax profit (as reported) CHF 1,304 million
1 Exclusive of own credit and other IFRS items that are treated differently for Swiss GAAP and tax purposes, totaling CHF 811 million in 1Q12. The 1Q12 adjusted effective taxrate of 22.5% = CHF 476 million / CHF 2,115 million (CHF 2,115 million = CHF 1,304 million + CHF 811 million)
22.5%1Q12 adjusted effective tax rate1

22
Net profit attributable to non-controlling interests
1 Fixed rate until call date, floating rate coupon payment thereafter2 Retail Trust Preferred Securities callable monthly since 15.6.08
Hybrid tier 1 instruments outstanding
CHF 1 million of net profit attributed to non-controlling interests in 1Q12
We expect to attribute profit of ~ CHF 270 million to non-controlling interests in 2Q12
No event triggering dividend obligations and no dividend payments not previously accruedexpected in 2H12
Interest for USD 2.0 billion tier 2 loss-absorbing notes issued in February 2012 is accounted asinterest expense
Amount Issue date Interest rate First call date
EUR 1,000 million 11.4.08 8.836%1 11.4.13
EUR 1,000 million 15.4.05 4.28%1 15.4.15
USD 1,000 million 12.5.06 6.243%1 12.5.16
EUR 600 million 21.12.07 7.152%1 21.12.17
USD 300 million 23.5.03 Libor + 70bps 15.6.08 2
23
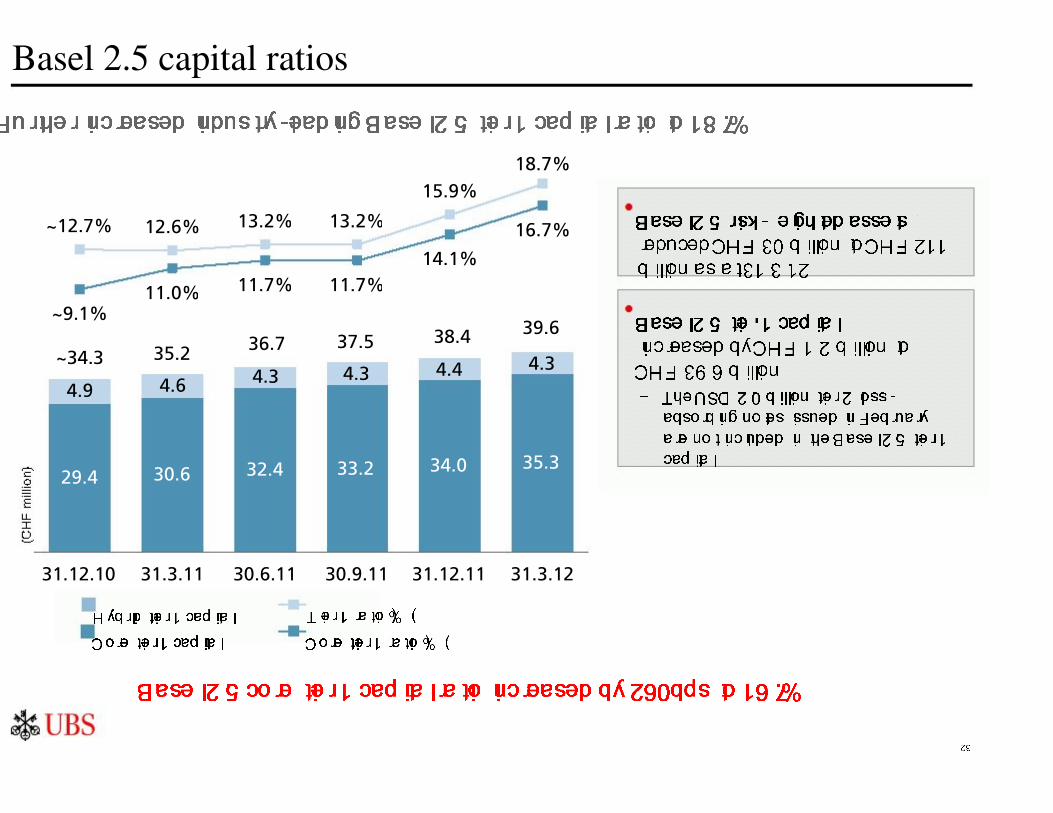
Basel 2.5 capital ratiosFurther increased industry-leading Basel 2.5 tier 1 capital ratio to 18.7%
Core tier 1 capital
Hybrid tier 1 capital
Basel 2.5 risk-weighted assets
reduced CHF 30 billion to CHF 211
billion as at 31.3.12
Basel 2.5 tier 1 capital
increased by CHF 1.2 billion to
CHF 39.6 billion
– The USD 2.0 billion tier 2 loss-
absorbing notes issued in February
are not included in the Basel 2.5 tier 1
capital
Basel 2.5 core tier 1 capital ratio increased by 260bps to 16.7%
Core tier 1 ratio (%)
Tier 1 ratio (%)
29.4 30.6 32.4 33.2 34.0 35.3
4.9 4.6 4.3 4.3 4.4 4.3
39.638.437.536.735.2~34.3
11.0%
14.1%
16.7%12.6% 13.2% 13.2%
15.9%18.7%
~9.1%
11.7%11.7%
~12.7%
31.12.10 31.3.11 30.6.11 30.9.11 31.12.11 31.3.12
24
30.9.11
estimated
pro-forma
~21
~220
~80
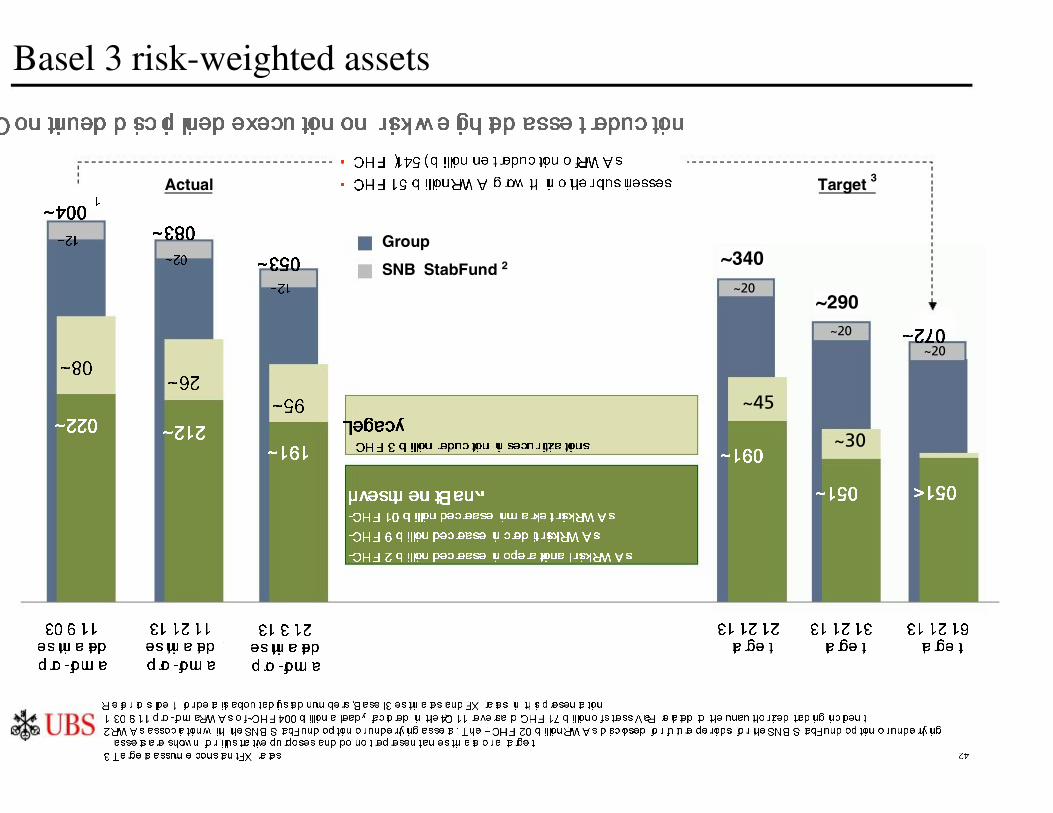
Basel 3 risk-weighted assets
Refer to slide 1 for details about adjusted numbers, Basel 3 estimates and FX rates in this presentation
1 30.9.11 pro-formaRWAs of ~CHF 400 billion already factored in the 4Q11 reversal of CHF 17 billionof stress VaR related to the unauthorized trading incident2 RWAs association with the SNB StabFund option or underlying assets. The ~ CHF 20 billion RWAs disclosed for future periods for the SNB StabFund option or underlying
assets are shown for illustrative purposes and do not represent an estimate or a target3 Targets assume constant FX rates
31.12.16
target
Continued disciplined execution on risk-weighted asset reduction
~270
31.12.12
target
31.12.13
target
31.12.11
estimated
pro-forma
~380
~212
~62
SNB StabFund 2
Group
• CHF (145) billion net reduction of RWAs
• CHF 15 billion RWA growth in other businesses
~400
31.3.12
estimated
pro-forma
~350
~191
~59
~21
Investment Bank- CHF 10 billion decrease in market risk RWAs
- CHF 9 billion decrease in credit risk RWAs
- CHF 2 billion decrease in operational risk RWAs
Legacy- CHF 3 billion reduction in securitizations
TargetActual 3
~190
<150
~45
~30
~150
~20
~20
~20
1
~340
~290
~20
25
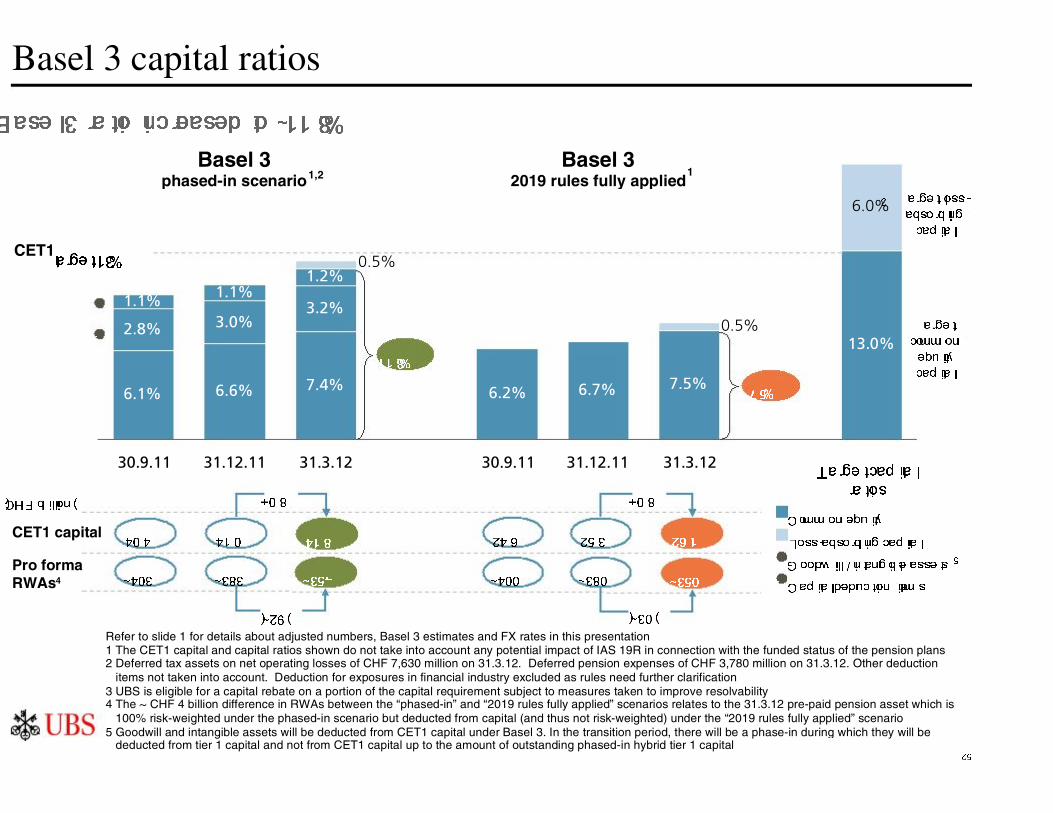
6.1% 6.6% 7.4% 6.2% 6.7% 7.5%
13.0%
6.0%
2.8% 3.0%3.2%1.1% 1.1%1.2%
0.5%
0.5%
30.9.11 31.12.11 31.3.12 30.9.11 31.12.11 31.3.12
41.0
~383
26.1
Basel 3 capital ratios
CET1 capital
Pro formaRWAs4
(CHF billion)
Basel 3phased-in scenario
Basel 32019 rules fully applied
Loss-absorbing capital
Goodwill / intangible assets 51
Capital deduction items2
Basel 3 ratio increased to ~11.8%
25.3
+0.8
(~30)
40.4
~403
1
2
41.8
~354
+0.8
(~29)
24.6
~380~400 ~350
CET1 target 13%
Target capital
ratios
Target loss-
absorbing
capital
Target
common
equity
capital
Common equity
3
7.5%
11.8%
Refer to slide 1 for details about adjusted numbers, Basel 3 estimates and FX rates in this presentation1 The CET1 capital and capital ratios shown do not take into account any potential impact of IAS 19R in connection with the funded status of the pension plans2 Deferred tax assets on net operating losses of CHF 7,630 million on 31.3.12. Deferred pension expenses of CHF 3,780 million on 31.3.12. Other deduction items not taken into account. Deduction for exposures in financial industry excluded as rules need further clarification3 UBS is eligible for a capital rebate on a portion of the capital requirement subject to measures taken to improve resolvability4 The ~ CHF 4 billion difference in RWAs between the “phased-in” and “2019 rules fully applied” scenarios relates to the 31.3.12 pre-paid pension asset which is 100% risk-weighted under the phased-in scenario but deducted from capital (and thus not risk-weighted) under the “2019 rules fully applied” scenario 5 Goodwill and intangible assets will be deducted from CET1 capital under Basel 3. In the transition period, there will be a phase-in during which they will be deducted from tier 1 capital and not from CET1 capital up to the amount of outstanding phased-in hybrid tier 1 capital
1,2 1
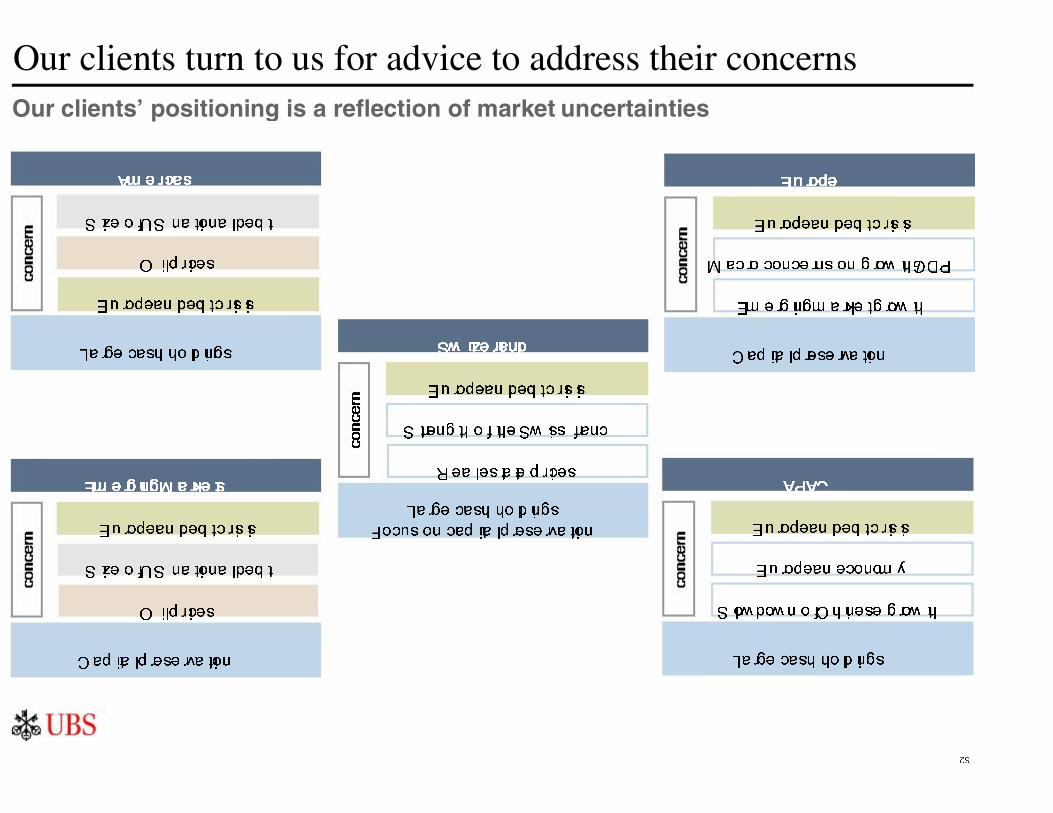
Our clients turn to us for advice to address their concernsOur clients’ positioning is a reflection of market uncertainties
Size of US national debt
Oil prices
European debt crisis
Americas
Large cash holdings
European debt crisis
Size of US national debt
Oil prices
Emerging Markets
Capital preservation
European debt crisis
Strength of the Swiss franc
Real estate prices
Switzerland
Large cash holdings
Focus on capital preservation
European debt crisis
Macro concerns on growth/GDP
Emerging market growth
Europe
Capital preservation
European debt crisis
European economy
Slowdown of Chinese growth
APAC
Large cash holdings
26
27
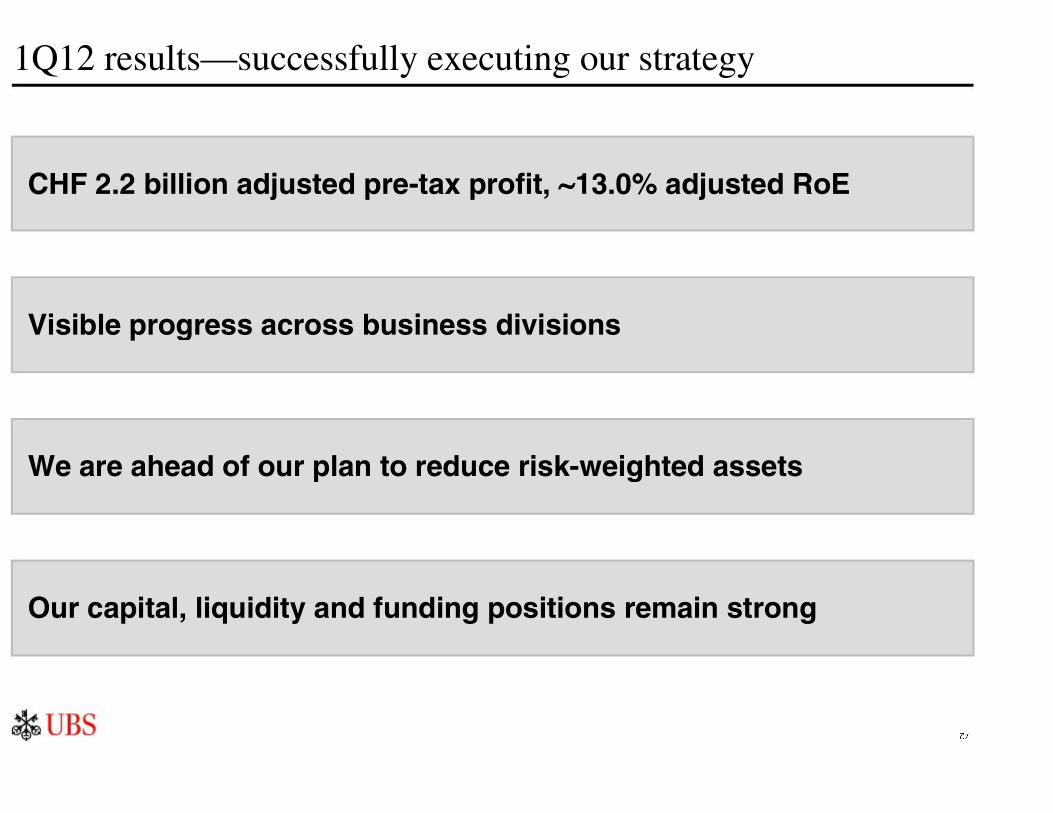
1Q12 results—successfully executing our strategy
CHF 2.2 billion adjusted pre-tax profit, ~13.0% adjusted RoE
We are ahead of our plan to reduce risk-weighted assets
Visible progress across business divisions
Our capital, liquidity and funding positions remain strong

Appendix

29
Held at amortized cost 74
Financial liabilitiesdesignated at fair value 89
Retail savings / deposits 115
Fiduciary deposits 28
Time deposits 61
Demand deposits 139
Total equity 58
Other liabilities 128
Bonds and notes issued 163
Customer deposits 343
Trading portfolio liabilities 53
Cash collateral on securities lent and repurchase agreements 126
Money market paper issued 59
Due to banks 32
Other assets (incl. net RVs) 102
Loans 266
Trading portfolio assets 188
Cash collateral on securitiesborrowed and reverserepurchase agreement 232
Financial investments AFS 60
Cash, balances with central banksand due from banks 113
129%coverage
CHF 77 billionsurplus
CHF 106billion
collateralsurplus
Asset funding—31 March 2012
Assets Liabilities and equity
30
Equity
Money market
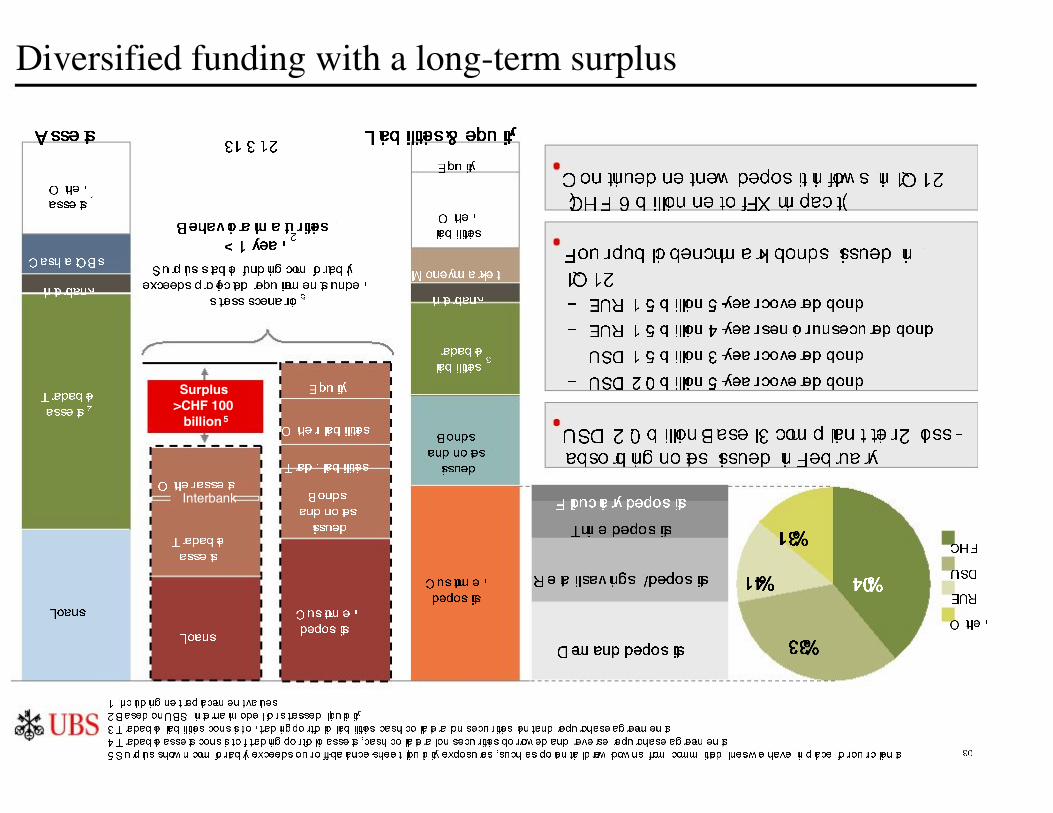
Diversified funding with a long-term surplus
1 Including net replacement values2 Based on UBS internal model for stressed liquidity
3 Tradable liabilities consist of tradingportfolio liabilities, cash collateral on securities lent and repurchase agreements
4 Tradable assets consist of trading portfolio assets, cash collateral on securities borrowed and reverse repurchase agreements5 Surplus shown comfortably exceeds our off-balance-sheet liquidity exposures, such as potential draw-downs from committed lines we have in place for our clients
Customer
deposits
Assets Liabilities & equity
Other
assets
Continued net new deposit inflows in 1Q12
(CHF 6 billion net of FX impact)Other
liabilities
Cash at CBs
Tradable
assets4
Interbank
Tradable
liabilities
31.3.12
USD
EUR
Other
CHF
40%
33%
14%
13%
Loans
Other liabilities
Trad. liabilities
Bonds
and notes
issuedTradable
assets
Other assets
Customer
deposits
Behavioral maturities
> 1 year
Surplus stable funding comfortably
exceeds projected requirements under
stress scenario5
Surplus >CHF 100
billion 5
Equity
Bonds
and notes
issued
Loans
Retail savings / deposits
Fiduciary deposits
Time deposits
Demand deposits
Interbank
Four public benchmark bonds issued in
1Q12
– EUR 1.5 billion 5-year covered bond
– EUR 1.5 billion 4-year senior unsecured bond
– USD 1.5 billion 3-year covered bond
– USD 2.0 billion 5-year covered bond
USD 2.0 billion Basel 3 compliant tier 2 loss-
absorbing notes issued in February
Interbank
2
3
1
31
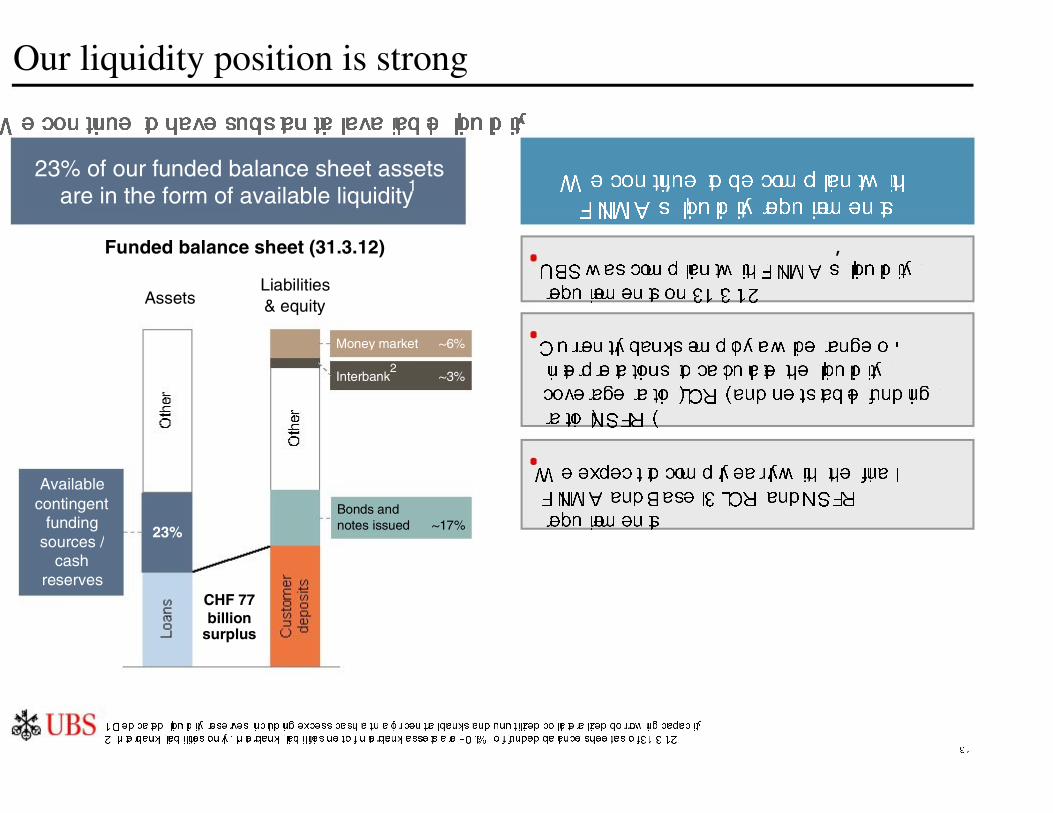
Our liquidity position is strong
Funded balance sheet (31.3.12)
23% of our funded balance sheet assetsare in the form of available liquidity1
We continue to be compliant with
FINMA’s liquidity requirements
We continue to have substantial available liquidity
1 Dedicated liquidity reserves including excess cash at major central banks and unutilized collateralized borrowing capacity2 Interbank liabilities only. Interbank liabilities net of interbank assets are ~0.1% of funded balance sheet as of 31.3.12
UBS was compliant with FINMA’s liquidity
requirements on 31.3.12Assets
Liabilities& equity
CHF 77billion
surplus
Interbank2
~3%
Money market ~6%
Bonds and notes issued ~17%
Available contingent
funding sources /
cashreserves
23%
Currently banks employ a wide range of
interpretations to calculate the liquidity
coverage ratio (LCR) and net stable funding
ratio (NSFR)
We expect to comply early with the final
FINMA and Basel 3 LCR and NSFR
requirements

32
Funding sources by currency—31 March 2012
45% USDCHF 367 billion
21% EURCHF 175 billion
20% CHFCHF 166 billion
14% otherCHF 113 billion
1 In % of total funding on the balance sheet (CHF 821 billion) comprising repurchase agreements, securities lending against cash collateral received, due to banks,money market paper issued, due to customers, long-term debt (including financial liabilities at fair value) and cash collateral on derivative transactions and prime brokerage
payables2 Comprises cash collateral payable on derivatives and prime brokerage payables
Interbank Money market paper issued Repos / securities lent
Customer deposits Bonds and notes issued Cash margin
Customer deposits represent a significant source of funding in all major currencies
(CHF billion)
11
11
2
47
61
33
4 1318
114
6049
8
37
99
136
262
20
97
14
14
22
46

33
Basel 2.5 core tier 1 capital and RWAs
1 31.3.12 includes IFRS deferred tax assets on net operating losses of CHF 7,630 million; 31.3.12 deferred pension expenses CHF 3,780 million2 Includes DTAs, changes in deduction items and dividend accruals
3 Adjusted for FX effect
Core tier 1 capital
Risk-weighted assets
3 33
3
2
1.2
0.8
34.0
(0.6)
35.3
(0.1)
31.12.11 Net profit attributable
to shareholders
Own credit Share-related
components
FX and other 31.3.12
0.1
(6.6)
211.1
241.0
(4.9)(4.6)
(13.9)
31.12.11 Credit risk Non-counterparty
related risk
Market risk Operational risk FX effects 31.3.12
1

34
Wealth Management—operating income
Invested assets
1 Adjusted for the gain on the sale of the strategic investment portfolio (CHF 433 million)2 Net fee and commissionand net trading incomein 1Q11, 2Q11, 3Q11 adjustedfor revenue shifts related to Investment Products & Services unit
2,178
2
2
22
2
827786 787 768 791
748720
750 772
409 433 447 427 457 451 469 487 478
991 982 912 895 908 892 805 818
322 313 252 298 319 259 205 150 262
170 178145 154
198232 216
209
823
1,7691,6731,745
1,8671,9281,8031,759
1,8911,904
1Q10 2Q10 3Q10 4Q10 1Q11 2Q11 3Q11 4Q11 1Q12
2
233
Interest (excl. SIPF) Recurring fees
Trading Other income
Transaction-based fees
Credit loss (expense) / recovery
SIPF interest
1
35
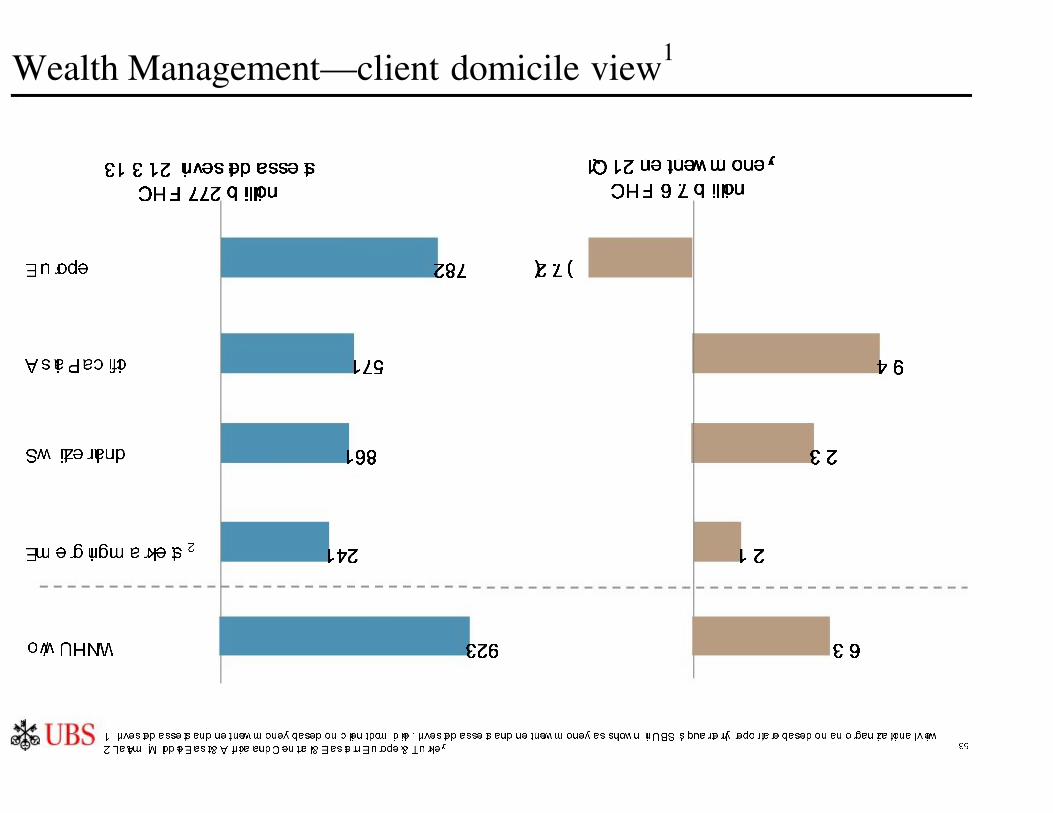
Wealth Management—client domicile view1
31.3.12 invested assets
CHF 772 billion
1 Invested assets and net new money based on client domicile. Invested assets and net new money as shown in UBS's quarterly report
2 LatAm, Middle East & Africa and Central & Eastern Europe & Turkey
1Q12 net new money
CHF 6.7 billion
287
175
168
142
Europe
Asia Pacific
Switzerland
Emerging markets
(2.7)
4.9
3.2
1.2
o/w UHNW 3.6329
2
are based on an organizational view.
36
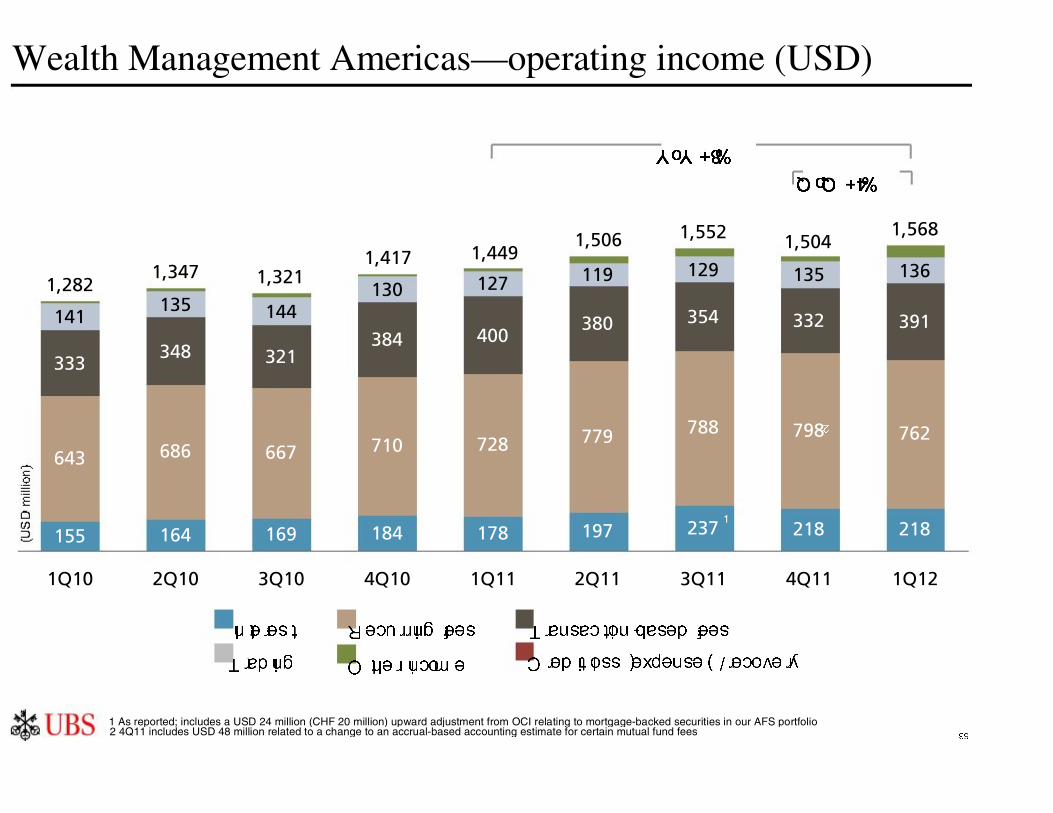
155 164 169 184 178 197 237 218 218
643 686 667 710 728 779 788 798 762
333348 321
384 400380 354 332 391141
135 144130 127 119 129 135 136
1,5681,504
1,2821,347 1,321
1,417 1,4491,506 1,552
1Q10 2Q10 3Q10 4Q10 1Q11 2Q11 3Q11 4Q11 1Q12
Wealth Management Americas—operating income (USD)
YoY +8%
Interest Recurring fees
Trading Other income
Transaction-based fees
Credit loss (expense) / recovery
QoQ +4%
2 4Q11 includes USD 48 million related to a change to an accrual-based accounting estimate for certain mutual fund fees
1
2
1 As reported; includes a USD 24 million (CHF 20 million) upward adjustment from OCI relating to mortgage-backed securities in our AFS portfolio
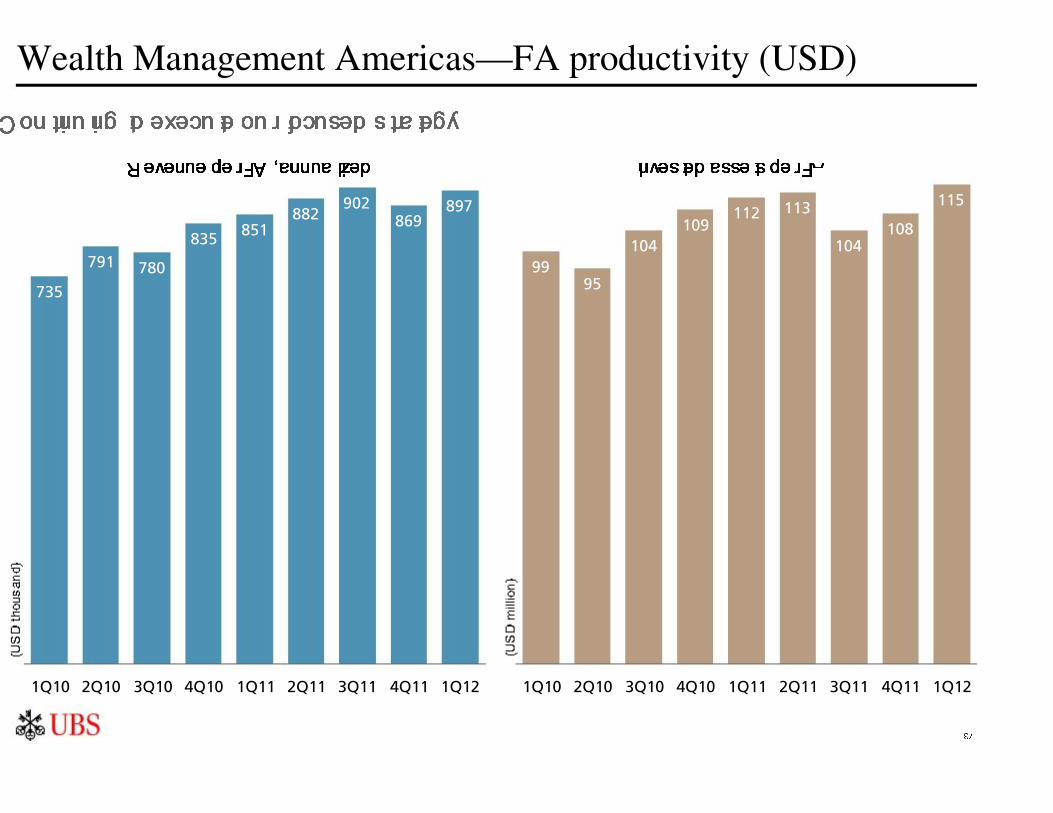
735
791 780
835 851882
902869
897
1Q10 2Q10 3Q10 4Q10 1Q11 2Q11 3Q11 4Q11 1Q12
9995
104109
112 113
104108
115
1Q10 2Q10 3Q10 4Q10 1Q11 2Q11 3Q11 4Q11 1Q12
Wealth Management Americas—FA productivity (USD)Continuing to execute our focused strategy
Invested assets per FARevenue per FA, annualized
37
38
24
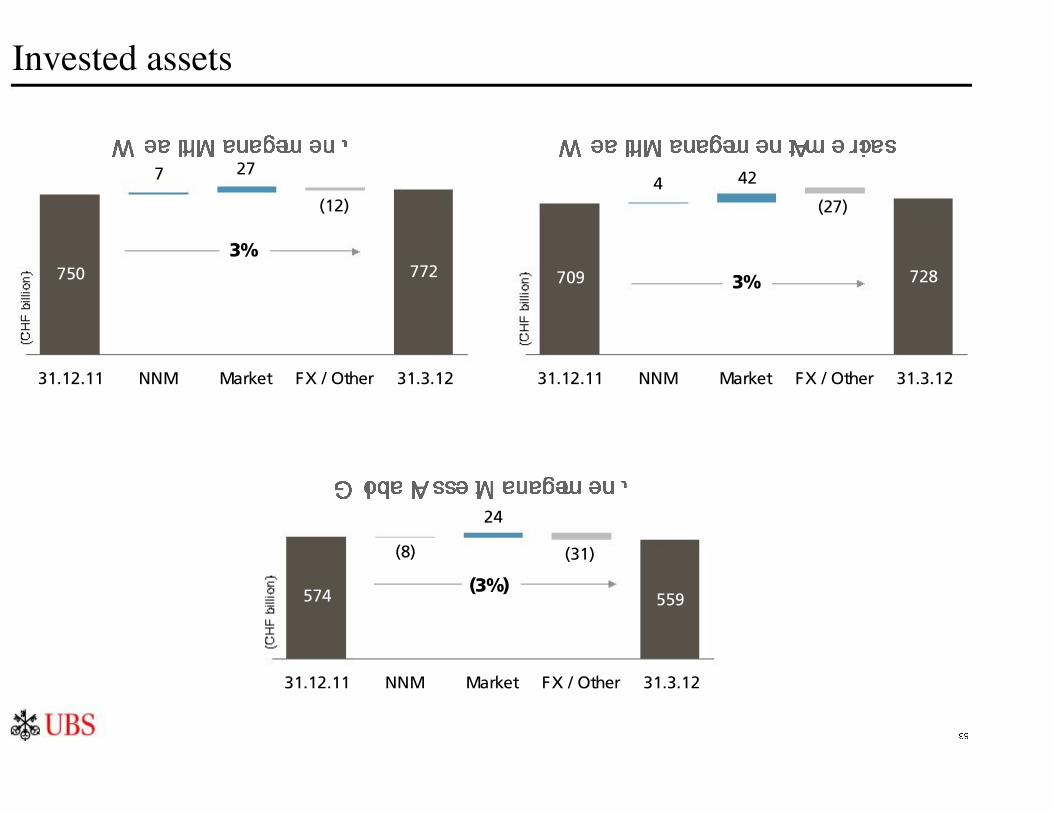
574 559
(8) (31)
31.12.11 NNM Market FX / Other 31.3.12
(3%)
7
(12)
750
27
772
31.12.11 NNM Market FX / Other 31.3.12
3%
(27)4
728709
42
31.12.11 NNM Market FX / Other 31.3.12
3%
Invested assets
Wealth Management Wealth Management Americas
Global Asset Management
39
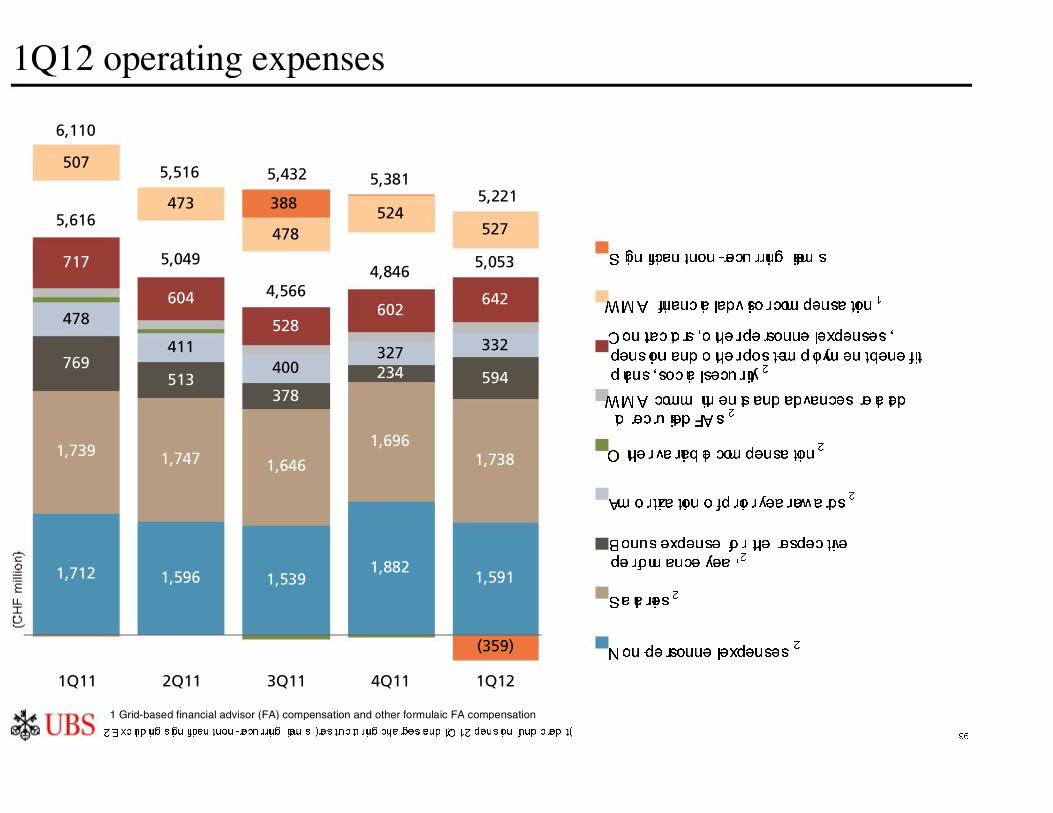
1,712 1,596 1,5391,882
1,591
1,739 1,747 1,646
1,6961,738
769513
378234 594
478
411400
327 332
717
604
528602
642
507
473
478524
527
3885,616
5,049
4,5664,846
5,053
(359)
6,110
5,516 5,432 5,3815,221
1Q11 2Q11 3Q11 4Q11 1Q12
1Q12 operating expenses
Amortization of prior year awards
Bonus expense for the respective
performance year
WMA commitments and advances related
to recruited FAs
Salaries
Non-personnel expenses
Contractors, other personnel expenses,
pension and other post-employment benefit
plans, social security
Significant non-recurring items
Other variable compensation
WMA financial advisor compensation
2 Excluding significant non-recurring items (restructuring charges and 1Q12 pension fund credit)1 Grid-based financial advisor (FA) compensation and other formulaic FA compensation
2
2
2
2
2
2
2
1
40
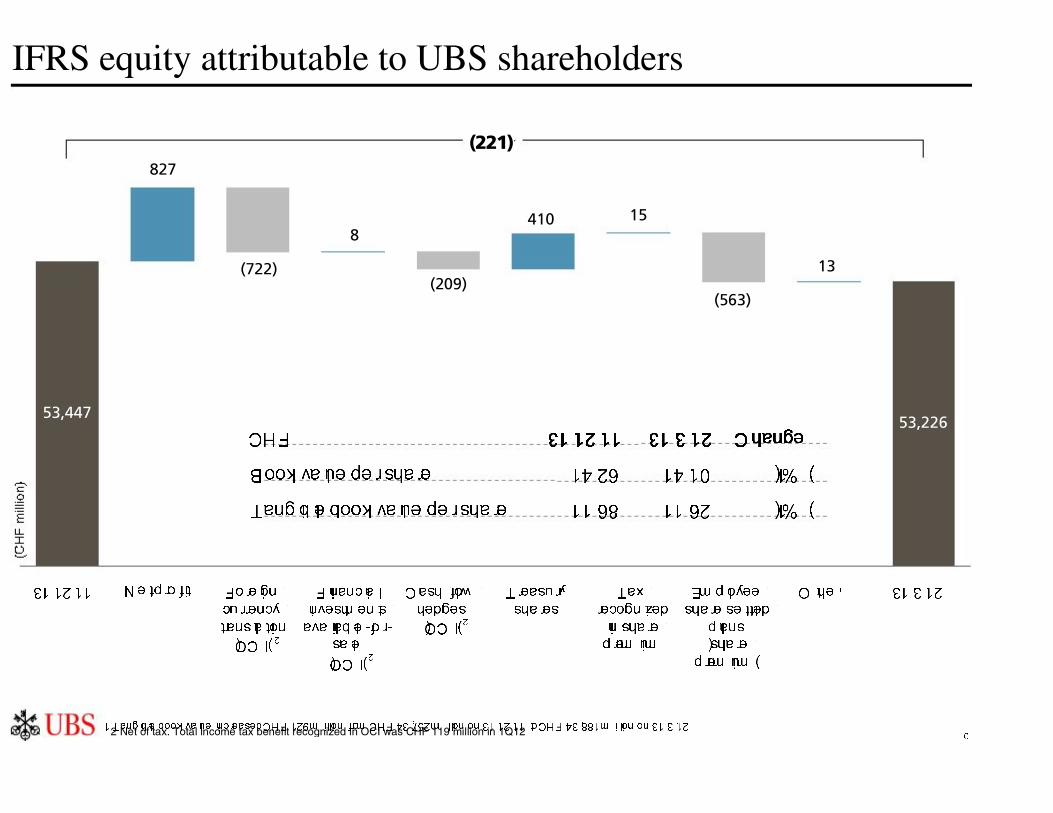
15410
(209)
8
(722)
827
53,447
13
(563)
53,226
(221)
IFRS equity attributable to UBS shareholders
31.12.11 Foreign
currency
translation
31.3.12Tax
recognized
in share premium
Cash flow
hedges
Net profit Employee
share settled
plans(share
premium)
Financial
investments
available-for-sale
Treasury
shares
1 Tangible book value increased CHF 129 million from CHF 43,752 million on 31.12.11 to CHF 43,881 million on 31.3.12
Other
CHF 31.12.11 31.3.12 Change
Book value per share 14.26 14.10 (1%)
Tangible book value per share 11.68 11.62 (1%)
1
2 Net of tax. Total income tax benefit recognized in OCI was CHF 119 million in 1Q12
2
2
2
(OCI)
(OCI)
(OCI)
41
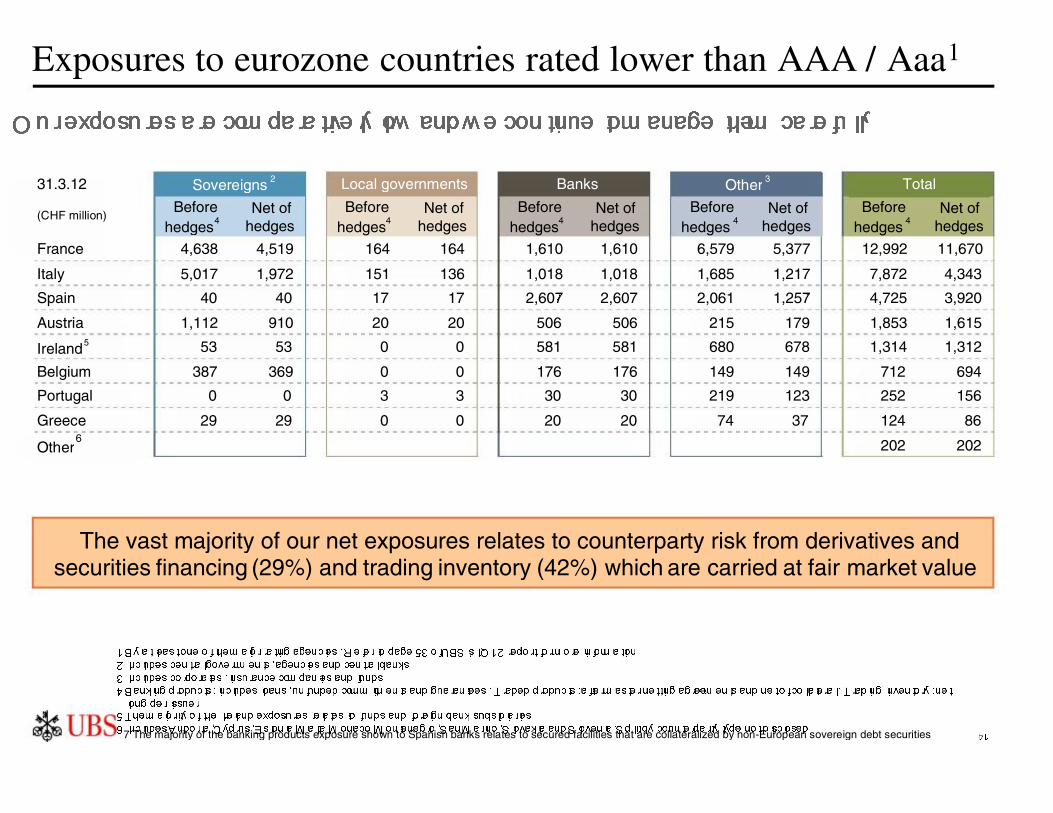
Exposures to eurozone countries rated lower than AAA / Aaa
1 By at least one of the major rating agencies. Refer to page 53 of UBS’s 1Q12 report for more information
2 Includes central governments, agencies and central banks
3 Includes corporates, insurance companies and funds4 Banking products: includes loans, unfunded commitments and guarantees. Traded products: after master netting agreements and net of collateral. Trading inventory: net
long per issuer5 The majority of the Ireland exposures relates to funds and foreign bank subsidiaries
6 Includes Andorra, Cyprus, Estonia, Malta, Monaco, Montenegro, San Marino, Slovakia and Slovenia. Split by counterparty type not disclosed
Our exposures are comparatively low and we continue to manage them carefully
The vast majority of our net exposures relates to counterparty risk from derivatives andsecurities financing (29%) and trading inventory (42%) which are carried at fair market value
7
31.3.12
(CHF million) 4 4Before
hedges4Net of
hedgesBefore
hedges 4Net of
hedgesBefore
hedges 4Net of
hedges
France 4,638 4,519 164 164 1,610 1,610 6,579 5,377 12,992 11,670
Italy 5,017 1,972 151 136 1,018 1,018 1,685 1,217 7,872 4,343
Spain 40 40 17 17 2,607 2,607 2,061 1,257 4,725 3,920
Austria 1,112 910 20 20 506 506 215 179 1,853 1,615
Ireland5 53 53 0 0 581 581 680 678 1,314 1,312
Belgium 387 369 0 0 176 176 149 149 712 694
Portugal 0 0 3 3 30 30 219 123 252 156
Greece 29 29 0 0 20 20 74 37 124 86
Other6 202 202
2 Banks Other 3 Total
7 The majority of the banking products exposure shown to Spanish banks relates to secured facilities that are collateralized by non-European sovereign debt securities
1
Beforehedges
Net ofhedges
Before hedges
Net ofhedges
Sovereigns Local governments
42
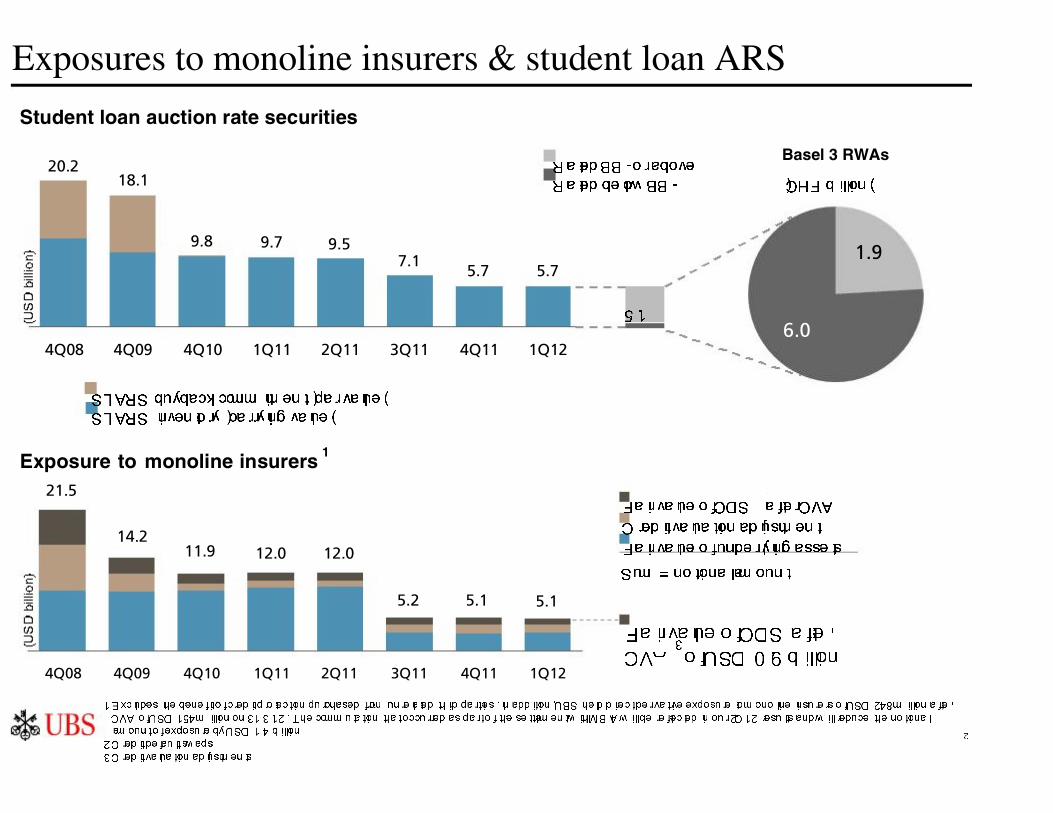
5.15.15.2
12.012.011.914.2
21.5
4Q08 4Q09 4Q10 1Q11 2Q11 3Q11 4Q11 1Q12
5.77.1
9.59.79.8
18.120.2
5.7
4Q08 4Q09 4Q10 1Q11 2Q11 3Q11 4Q11 1Q12
Exposures to monoline insurers & student loan ARS
Basel 3 RWAs(CHF billion)
Student loan auction rate securities
SL ARS buyback commitment (par value)
SL ARS inventory (carrying value)
Rated BB- or above
Rated below BB-
Exposure to monoline insurers 1
Fair value of CDS2
after CVA
Credit valuation adjustment
Fair value of underlying assets
Fair value of CDS after
CVA3
of USD 0.9 billion
1 Excludes the benefit of credit protection purchased from unrelated third parties. In addition, UBS held direct derivative exposure to monoline insurers of USD 248 million after
CVA of USD 154 million on 31.3.12. The commutation that occurred as part of the settlement with MBIA will be reflected in our 2Q12 results and will reduce the notionalamount of exposure by USD 1.4 billion
2 Credit default swaps
3 Credit valuation adjustments
Sum = notional amount
5.1
6.0
1.9

43
Headcount
WealthManagement
WealthManagement
Americas
InvestmentBank
GlobalAsset
Management
Retail &Corporate
CorporateCenter
31.3.1231.12.11
64,820
64,243
(4)(13)
89
(34)
(353)
(263)
(577)

This Form 6-K is hereby incorporated by reference into (1) each of the registration statements of UBS AG on Form F-3 (Registration Number 333-178960) and Form S-8 (Registration Numbers 333-49210; 333-49212; 333-127183; 333-127184; 333-162798; 333-162799; 333-162800; 333-178539; 333-178540; 333-178541; and 333-178543) and into each prospectus outstanding under any of the foregoing registration statements, (2) any outstanding offering circular or similar document issued or authorized by UBS AG that incorporates by reference any Form 6-K’s of UBS AG that are incorporated into its registration statements filed with the SEC, and (3) the base prospectus of Corporate Asset Backed Corporation (“CABCO”) dated June 23, 2004 (Registration Number 333-111572), the Form 8-K of CABCO filed and dated June 23, 2004 (SEC File Number 001-13444), and the Prospectus Supplements relating to the CABCO Series 2004-101 Trust dated May 10, 2004 and May 17, 2004 (Registration Number 033-91744 and 033-91744-05).

SIGNATURES
Pursuant to the requirements of the Securities Exchange Act of 1934, the registrant has duly caused this report to be signed on itsbehalf by the undersigned, thereunto duly authorized.
Date: May 2, 2012
UBS AG
By: /s/ Louis Eber Name: Louis Eber Title: Group Managing Director
By: /s/ Sarah M. Starkweather Name: Sarah M. Starkweather Title: Director