Embed Size (px)
Citation preview

U27: Real-Time Commercial Vehicle Safety & Security Monitoring
Final Report
This project was funded by the NTRCI University Transportation Center under a grant from the U.S. Department of Transportation Research and Innovative Technology Administration (#DTRT-06-G-0043)
The contents of this report reflect the views of the authors, who are responsible for the facts and the accuracy of the information presented herein. This document is disseminated under the sponsorship of the Department of Transportation University Transportation Centers Program, in the interest of information exchange. The U.S. Government assumes no liability for the contents or use thereof.
Lee D. Han and Stephanie Hargrove The University of Tennessee
December 2011


Technical Report Documentation Page
1. Report No.
2. Government Accession No.
3. Recipient's Catalog No.
4. Title and Subtitle U27: Real-Time Commercial Vehicle Safety & Security Monitoring
5. Report Date December 2011
6. Performing Organization Code
7. Author(s) Lee D. Han and Stephanie Hargrove
8. Performing Organization Report No. NTRCI-50-2011-026
9. Performing Organization Name and Address National Transportation Research Center, Inc. University Transportation Center 9125 Cross Park Drive Suite 150 Knoxville, TN 37923
10. Work Unit No. (TRAIS) 11. Contract or Grant No. RITA Grant – DTRT-06-G-0043
12. Sponsoring Agency Name and Address U.S. Department of Transportation Research and Innovative Technology Administration 1200 New Jersey Avenue, SE Washington, DC 20590
13. Type of Report and Period Covered Final Report December 2010 – December 2011
14. Sponsoring Agency Code
15. Supplementary Notes Special thanks to: The University of Tennessee, PIPS Technology, Tennessee Department of Safety (TDOS), Tennessee Department of Transportation (TDOT) and Dr. M.K. Jeong 16. Abstract Accurate real-time vehicle tracking has a wide range of applications including fleet management, drug/speed/law enforcement, transportation planning, traffic safety, air quality, electronic tolling, and national security. While many alternative tracking technologies have been developed in the recent years, license plate recognition (LPR) technology is still the simplest and readily available means for uniquely identifying vehicles in more circumstances. LPR technology has gone through quite a bit of research and development since the 1970’s. While the video-imaging based approach was novel, promising, and even effective for license plate identification in the early days of the technology, accuracy of the technology has not improved much largely because of the thousands of different designs of license plates in the U.S. This study takes an entirely different path with LPR. Realizing even when a plate is read incorrectly, certain amount of useful information may still exist in the misread result. For example, when a plate of “ABC 123” is read as, say, “ABC I23,” instead of just admitting defeat, we recognize that: 5/6 of characters were read correctly; the incorrectly read character is very similar to the correct; character, the sequence of the characters are in the right order; the number of characters are correct, etc. By using this information cleverly, one can address the plate-matching and vehicle-tracking problem with much better results. In real-time operational condition, one would not know if a plate reading of “ABC I23” is correct or not and if not which character or characters were incorrect. So a challenging and complex mathematical challenge ensues here. This study boils down to the development of an algorithm for solving this problem and, for this phase particularly, demonstrating the algorithm in the field. Aided by the generous assistance of Tennessee Department of Transportation (TDOT), Tennessee Department of Safety (TDOS), and PIPS Technology, three state-of-the-art LPR machines are installed for capturing real-world license plates strategically located on the Interstate highways. Using 3G cellular data network, license plate information is collected from all LPR sites and processed instantaneous for real-time plate matching, vehicle tracking, and, real-time speed monitoring.
This study marks the most significant advancement in LPR technology in decades. The results can improve the utility of new and already deployed LPR units and significantly increase the license plate matching rate (from less than 40% to over 98%) without the need for unified license plate system, further LPR hardware enhancement, per-vehicle technology investment (e.g. transponder and RFID), or significant legislative changes.
17. Key Word license plate recognition (LPR), vehicle tracking, speed enforcement, weigh station, large trucks, text mining, plate matching, self-learning algorithm, electronic tolling, real-time operations, commercial vehicles
18. Distribution Statement No restrictions
19. Security Classif. (of this report) Unclassified
20. Security Classif. (of this page) Unclassified
21. No. of Pages 55
22. Price
Form DOT F 1700.7 (8-72) Reproduction of completed page authorized

ii
This page intentionally left blank.

iii
Table of Contents LIST OF ABBREVIATIONS AND ACRONYMS .................................................................................................. X UNITS OF MEASUREMENT ............................................................................................................................. XIII EXECUTIVE SUMMARY ..................................................................................................................................... XIV
BACKGROUND .....................................................................................................................................................................XV BRIEF OVERVIEW ...............................................................................................................................................................XV RESEARCH STRATEGY ..................................................................................................................................................... XVI CONCLUSION ..................................................................................................................................................................... XVI FUTURE PROGRAM EFFORTS ......................................................................................................................................... XVI
CHAPTER 1 – INTRODUCTION AND BACKGROUND ................................................................................... 1 1.1 BACKGROUND............................................................................................................................................................ 1 1.2 PROJECT TEAM ......................................................................................................................................................... 2
1.2.1 The University of Tennessee ............................................................................................................................ 2 1.2.2 PIPS Technology .................................................................................................................................................... 2 1.2.3 Tennessee Department of Transportation ................................................................................................ 2 1.2.4 Tennessee Department of Safety ................................................................................................................... 2 1.2.5 Dr. M.K. Jeong .......................................................................................................................................................... 2
1.3 PROJECT DESCRIPTION ............................................................................................................................................ 2 1.4 PROJECT SCHEDULE ................................................................................................................................................. 3
CHAPTER 2 – PRE-DEPLOYMENT PREPARATIONS .................................................................................... 4 2.1 PLATE MATCHING SOFTWARE DEVELOPMENT................................................................................................... 5
2.1.1 Levenshtein Edit Distance Module ................................................................................................................ 5 2.1.2 Association Matrix Learning Module ........................................................................................................... 6 2.1.3 Travel Time Module ............................................................................................................................................. 6 2.1.4 Multi-Point Tracking & Reporting ................................................................................................................. 7 2.1.5 Data Interfacing Module .................................................................................................................................... 8
2.2 LICENSE PLATE RECOGNITION MACHINES .......................................................................................................... 8 2.3 DATA SERVER PREPARATIONS ............................................................................................................................. 14
CHAPTER 3 – FIELD DEMONSTRATION ....................................................................................................... 17 3.1 STUDY SITE .............................................................................................................................................................. 17 3.2 DRY RUNS ................................................................................................................................................................ 18
3.2.1 Alternative Setup at LPR Station 1 .............................................................................................................. 18 3.2.2 Alternative Association Matrices ................................................................................................................. 18 3.2.3 The Control Center ............................................................................................................................................. 19 3.2.4 UT’s FTP Server ................................................................................................................................................... 19
3.3 IN THE FIELD ........................................................................................................................................................... 21 3.4 AT THE NTRCI CONTROL CENTER ..................................................................................................................... 21
CHAPTER 4 – CONCLUSIONS ............................................................................................................................ 26 4.1 ACCOMPLISHMENTS ............................................................................................................................................... 27 4.2 FUTURE DIRECTIONS ............................................................................................................................................. 27
CHAPTER 5 – REFERENCES .............................................................................................................................. 29

iv
This page intentionally left blank.

v
List of Appendices Appendix A – Presentation at Field Demonstration on 11.02.2011 ........................................... A-1

vi
This page intentionally left blank.

vii
List of Figures Figure 1-1. Chart. Project Schedule. ............................................................................................... 3 Figure 2-1. Graph. Levenshtein Edit Distance Calculation. ........................................................... 5 Figure 2-2. Matrices. Learning Results of an Association Matrix. ................................................. 6 Figure 2-3. Illustration. Plate Filtering with Travel Time Window. ............................................... 7 Figure 2-4. Photograph. Sample Report from PlateMat. ................................................................ 8 Figure 2-5. Photograph. PIPS Technology P357/359/366 License Plate Reader Combo .............. 9 Figure 2-6. Photograph. UT Research Team Testing a PIPS Technology P372 ALPR Camera ... 9 Figure 2-7. Photograph. Several P382 Cameras Being Tested at PIPS Technology Headquarters....................................................................................................................................................... 11 Figure 2-8. Photograph. Fix-Mounted LPR Unit on I-40. ............................................................ 13 Figure 2-9. Photograph. Mobile LPR Testing at I-40 Weigh Station. .......................................... 13 Figure 2-10. Photograph. Mobile LPR Training on UT Campus. ................................................ 14 Figure 2-11. Equation. Formula for estimating the storage requirement for the data server. ....... 15 Figure 2-12. Equation. Estimation of the size of the data server needed. ..................................... 15 Figure 2-13. Screenshot. Sample Output of Captured LPR files on UT's FTP Server ................. 16 Figure 3-1. Map. LPR Field Demonstration Configurations. ....................................................... 17 Figure 3-2. Photograph. Mobile LPR Setup at LP Station 1. ....................................................... 18 Figure 3-3. Graph. Efficiency of Association Matrix Learning Algorithm. ................................. 19 Figure 3-4. Photograph. Dr. Xiong Monitoring Real-Time Plate Matching Report at NTRCI. ... 20 Figure 3-5. Photograph. Field Team Leader James Ensley Reporting in Real-Time from LPR Station 1. ....................................................................................................................................... 20 Figure 3-6. Photograph. Welcome Speech by Joseph Petrolino. .................................................. 21 Figure 3-7. Photograph. Dr. Han Acknowledges All Contributing Partners. ............................... 22 Figure 3-8. Photograph. Stephanie Hargrove Providing Details on the Field Setup. ................... 23 Figure 3-9. Photograph. Demonstration Attendees Conversing with Field Team Students. ........ 23 Figure 3-10. Photograph. Field Team Captain on Skype Videoconference. ................................ 24 Figure 3-11. Photograph. Viewing of Site Traffic Condition via Skype. ..................................... 24 Figure 3-12. Photograph. Attendees Observing PlateMat Software in Action. ........................... 25

viii
This page intentionally left blank.

ix
List of Tables Table 2-1. PIPS Technology P372 Camera Specifications. .......................................................... 10 Table 2-2. PIPS Technology P382 Camera Specifications .......................................................... 12

x
This page intentionally left blank.

xi
List of Abbreviations and Acronyms Abbreviation or Acronym Definition
3G 3rd Generation ALPR Automated License Plate Recognition ASCII American Standard Code for Information Interchange BOLO Be On the Look Out DC Direct Current DOT Department of Transportation Dr. Doctor ED Edit Distance or Levenshtein Edit Distance FHWA Federal Highway Administration FMCSA Federal Motor Carrier Safety Administration GB Gigabyte GPRS General Packet Radio Service GPS Global positioning system GSM Groupe Spécial Mobile I-40 Interstate 40 I-640 Interstate 640 I-75 Interstate 75 IEEE Institute of Electrical and Electronics Engineers IP Interchange Protocol IR Infrared ISO International Organization for Standards ITS Intelligent Transportation Systems JPEG Joint Photographic Experts Group LAN Local Area Network LED Light Emitting Diode LPR License Plate Recognition MB Megabyte NTRCI National Transportation Research Center, Inc. OD Origin-Destination OIT Office of Information Technology at UT ORNL Oak Ridge National Laboratory PI Principal Investigator PlateMat A real-time plate matching software developed by UT RFID Radio Frequency Identification Device TDOS Tennessee Department of Safety TDOT Tennessee Department of Transportation
xii
Abbreviation or Acronym Definition
THP Tennessee Highway Patrol TN Tennessee US United States UT University of Tennessee VMS Variable Message Sign Wi-Fi Wireless Network

xiii
Units of Measurement Unit Meaning mph miles per hour kg Kilogram m Meter
m/s meter per second m/s2 meter per second squared mm Millimeter N•m Newton-meter
s Second V Volt W Watt

xiv
This page intentionally left blank.

xv
Executive Summary Accurate real-time vehicle tracking has a wide range of applications including fleet management, drug/speed/law enforcement, transportation planning, traffic safety, air quality, electronic tolling, and national security. While many alternative tracking technologies have been developed in the recent years, license plate recognition (LPR) technology is still the simplest and most readily available means for uniquely identifying vehicles in more circumstances. This study marks the most significant advancement in LPR technology in decades. The results can improve the utility of new and already deployed LPR units and significantly increase the license plate matching rate (from less than 40% to over 98%) without the need for unified license plate system, further LPR hardware enhancement, per-vehicle technology investment (e.g. transponder and RFID), or significant legislative changes.
Background Because of the concerns of personal privacy, R&D costs, technology maturity, and legislative challenges associated with emerging non-license plate vehicle identification technologies, video-imaging based license plate recognition (LPR) continues to be the most commonly deployed means for vehicle tracking in the U.S. and other countries. For countries with a unified license plate design, e.g. China and the European Union, LPR is exceedingly effective for LPR vehicle identification and tracking. On the other hand, a country with thousands of different designs, colors, fonts, reflectiveness in its plates, LPR-based vehicle tracking has much to be desired. To this end, this project aims to significantly improve the vehicle tracking capability of the existing LPR technology. By significantly improving the state of the art of vehicle tracking capability, better capabilities in fleet management, law enforcement, transportation planning, traffic safety, air quality, electronic tolling, and national security could result.
Brief Overview LPR technology has gone through quite a bit of research and development since the 1970’s. While the video-imaging based approach was novel, promising, and even effective for license plate identification in the early days of the technology, accuracy of the technology has not improved much largely because of the thousands of different designs of license plates in the U.S. This study takes an entirely different path with LPR. Realizing even when a plate is read incorrectly, certain amount of useful information may still exist in the misread result. For example, when a plate of “ABC 123” is read as, say, “ABC I23”, instead of just admitting defeat, we recognize that
- 5/6 of characters were read correctly,
- The incorrectly read character is very similar to the correct character,
- The sequence of the characters are in the right order,

xvi
- The number of characters are correct,
- Etc.
By using this information cleverly, one can address the plate-matching and vehicle-tracking problem with much better results. In real-time operational condition, one would not know if a plate reading of “ABC I23” is correct or not and if not which character or characters were incorrect. So a challenging and complex mathematical challenge ensues here. This study boils down to the development of an algorithm for solving this problem and, for this phase particularly, demonstrating the algorithm in the field.
Research Strategy Since the text-mining based algorithm has been developed in Phase B of this study (NTRCI-50-2010-016) and published in two major Web of Science cited journals, the main thrust of this Phase C is to conduct the field demonstration. Aided by the generous assistance of Tennessee Department of Transportation (TDOT), Tennessee Department of Safety (TDOS), and PIPS Technology, three state-of-the-art LPR machines are installed for capturing real-world license plates strategically located on the Interstate highways. Using 3G cellular data network, license plate information is collected from all LPR sites and processed instantaneous for real-time plate matching, vehicle tracking, and, real-time speed monitoring.
Conclusion While the algorithm utilized in this phase was already proven “on paper.” The development of a working software program that runs the algorithm and actually produces high-accuracy plate matches in real-time is a major step towards future deployment. The success of the field demonstration proved the feasibility of the technology developed in this study and can lead to significant improvement efficiency and money saving in both private and public sections.
Future Program Efforts Obviously, the next step for this technology is to derive benefits by deploying it in the field. This would need the vision and support from public agencies at local and state levels or entrepreneurs providing services to these agencies.
While the embedded algorithm has elevated the plate matching (and vehicle tracking) accuracy to 98% while keeping a very low false matching rate of less than 1%, it would be desirable to push the false matching rate to, basically, 0%, so that no human intervention is needed for crucial law enforcement and electronic tolling applications where no error is acceptable. This can potentially be achieved via the combination of text-mining and non-LPR based video image processing.

1
Chapter 1 – Introduction and Background License plate recognition (LPR) technology has gone through quite a bit of research and development since the 1970’s. Due to the large number of different plate designs in the U.S. (over 3,000 designs with different fonts, colors, images, syntaxes, reflectivity, character stacking, etc.) LPR has mixed success with accuracy only reaching around 80%, under most favorable conditions. For some day-to-day conditions, LPR could perform rather poorly with an accuracy of less than 30%. With reading accuracy rates in such a dismal range, it is exceedingly challenging to track a plate, and the vehicle the plate is attached to, at multiple points in a network. This challenge is many times harder to perform in real-time. Nevertheless, with the enthused and visionary support from NTRCI, we had accomplished two very successful phases towards developing a reliable mechanism for vehicle tracking by the time we began with this third phase of the study.
1.1 Background During the first phase of this study, which was generously sponsored by NTRCI, mobile configuration of two license plate units were used for limited data collection followed by laborious plate matching activities. During this first phase, we identified Levenshtein Edit Distance as a viable technique to improve the plate-matching task and achieved significant improvement in correct matching rate of around 90%. However, this high matching rate was accomplished at a cost of a marked 15% false-matching rate on average. The results of this effort were published in Transportation Research Records (Oliveira-Neto 2009), which was written with the visionary support from NTRCI.
With the cost-sharing assistance of Tennessee Department of Transportation (TDOT) and PIPS Technology, a subsidiary area of Federal Signal Corporation, in the second phase, we were able to deploy two LPR units on I-40 and I-640 near Knoxville TN each with an uninterrupted power supply and a 3G cellular network connection. In the end, we attained continuous and real-time plate capturing capability, which is a crucial milestone towards real-time speed enforcement. We also made major breakthroughs with plate-matching techniques. First, we introduced a weighted Edit Distance technique to cut the false matching rate by 50%. Then, we developed fixed time-window and later variable time-window algorithms to further reduce the false matching rate to around 3%.
At this point, though, our Edit Distance methodology still relies heavily on “truth matrix,” which in essence is a collection of probabilities of how each character might be read incorrectly as some other characters. Truth matrix changes from site to site and can only be derived from painstaking comparisons of actual plate images and LPR reported plate texts. To overcome this major hurdle in deploying our plate-matching techniques, we devised an automated learning process so that no human intervention or any truth matrix is needed. Furthermore, this process reduced the false matching rate to a mere 1%. This monumental breakthrough makes it possible to deploy plate matching as soon as the LPR hardware is installed and can achieve peak

2
performance, as it continues to learn on its own, within a week or so. This technology is ready to be demonstrated and, perhaps, implemented in the field when all the algorithms are programmed and connected with all the hardware and communication pieces.
1.2 Project Team While many agencies were involved in the endeavor, this project, as funded by NTRCI and documented herein, was performed under the leadership of the University of Tennessee.
1.2.1 The University of Tennessee The University of Tennessee (UT) provided administrative leadership and research visions for this study. All algorithm development, software coding, data collection, field demonstration, and progress reporting tasks were performed by the Principal Investigator (PI) and his team of students at the University of Tennessee. In addition, UT’s Office of Information Technology (OIT) contributed invaluable real-time data hosting and archiving support throughout the duration of the project.
1.2.2 PIPS Technology
PIPS Technology, a subsidiary of the Chicago-based Federal Signal, provided LPR hardware, 3G connectivity for real-time data networking, general maintenance and support, as well as hands-on training for UT.
1.2.3 Tennessee Department of Transportation Tennessee Department of Transportation (TDOT) was an active partner of this project. They contributed to the project uninterrupted power supply and the use of their infrastructure for field data collection and operational demonstration.
1.2.4 Tennessee Department of Safety Tennessee Department of Safety (TDOS) was an active partner of this project. They contributed the use of uninterrupted power supply, Internet connection, and the use of their office space at their Knoxville weigh station on I-40W between Campbell Station Road and Watts Road.
1.2.5 Dr. M.K. Jeong
Dr. M.K. Jeong, an independent consultant to NTRCI, provided paid support to UT researchers on data-mining related subjects.
1.3 Project Description The goal of this phase is to integrate the hardware and the algorithms and demonstrate real-time commercial vehicle tracking in a test bed along I-40/75/640 in Knoxville, TN. To this end, LPR devices were installed at strategic locations on I-40, I-640, and at the weigh station west of Knoxville. Continuous 3G cellular data network connectivity was maintained among these LPR

3
units and with a control center during the demonstration. Sentinel software implementing the plate matching algorithms was developed to perform the vehicle-tracking task in real time. A field demonstration was held successfully during the course of this project.
By developing this highly reliable vehicle technology, our research enables many desirable applications including automated speed enforcement, in-depth origin-destination study, continuous Be On the Look Out (BOLO) vehicle identification and tracking, sensible fuel-tax considerations, inexpensive non-stop tolling, Intelligent Transportation Systems (ITS) traffic condition monitoring, evacuation order compliance monitoring, incident detection, air quality and truck speed control, etc. without resorting to active tracking devices, which face technological and policy challenges.
1.4 Project Schedule This project was conducted from November 2010 thru December 2011. Figure 1-1 is the project schedule. The tasks are identified in the figure. This is a high level schedule; it details only the major tasks.
Figure 1-1. Chart. Project Schedule.

4
This page intentionally left blank.

5
Chapter 2 – Pre-Deployment Preparations Based on the results from the first two phases, which were generously sponsored by RITA and NTRCI, the UT team proceeded further in this third phase to make necessary preparations for the eventual real-time field demonstration. The following are the key components of a functional and deployed vehicle-tracking system that was accomplished in this study.
2.1 Plate Matching Software Development To track vehicles in real-time, the algorithms developed in Phase B of this study (NTRCI-50-2010-016) must be coded to run on computers. To this end, the UT team developed a suite of C++ based software called PlateMat for Windows 7 platform. The main algorithms and procedures embedded in the software suite include the following.
2.1.1 Levenshtein Edit Distance Module Using Levenshtein Edit Distance (ED) and its many variances that the UT team developed in the previous phase, we programmed PlateMat to calculate the “distance” between two license plate readings (Figure 2-1). This is a very fundamental module of the matching process as it not only measures the “distance” between two plates in real-time, it is also employed by the learning algorithm later on.
Figure 2-1. Graph. Levenshtein Edit Distance Calculation.

6
2.1.2 Association Matrix Learning Module
A good Association Matrix is at the heart of high positive matching rate and low false matching rate. In theory, one could derive an Association Matrix between a pair of LPR machines with “brute force,” namely, an investment of tremendous amount of manual labor and time comparing the actual plates (ground truth) and the recognized text strings. However, a different Association Matrix is required for each one-way pair of LPR machines in a roadway system. For example, in a system with 100 LPR machines, which is not uncommon in practice, a total of 9,900 Association Matrices would be needed to match plates between any possible pairs of LPR machines. This is obviously too cost-prohibitive for implementation. Worse yet, cell values in an Association Matrix will inevitably “drift” over time due to a wide range of factors, including the inevitable new plate designs introduced into the system, LPR camera lenses getting dirty over time, effects of inclement weather and length of daylight, changes in the composition of traffic, etc. As such, even if an agency were able to attain all 9,900 Association Matrices, to maintain and update them would be a constant drain on the agency financially.
Dr. Han, the PI of the project, developed a host of self-learning algorithms to automatically create and maintain these Association Matrices. The algorithms were coded into PlateMat form for this project. PlateMat starts from a simple identity matrix and gradually, through iterative self-learning, attains a fully functional Association Matrix (Figure 2-2).
Figure 2-2. Matrices. Learning Results of an Association Matrix.
2.1.3 Travel Time Module
While not always necessary, a travel time window can be incorporated into Levenshtein text mining operations to filter out a large number of plates that don’t need to be processed otherwise. To this end, a dynamically floating time window is used at selected stations in the system. The module for this function is based on the concept illustrated in Figure 2-3. The time window shifts

7
back and forth based on the travel speed, which can be from external sensors or travel time per the most recent positive plate-matching results. The window also contracts or expands based on the consistency of travel time, which is often a function of traffic demand. This module is a dynamic gatekeeper that weeds out plates that do not need to be examined based on travel time. More in-depth discussions on this topic are published in Transportation Research Part C (Olieveira-Neto 2012), which was written with the generous support of RITA/NTRCI and US DOT’s Dwight D. Eisenhower Program.
Figure 2-3. Illustration. Plate Filtering with Travel Time Window.
2.1.4 Multi-Point Tracking & Reporting
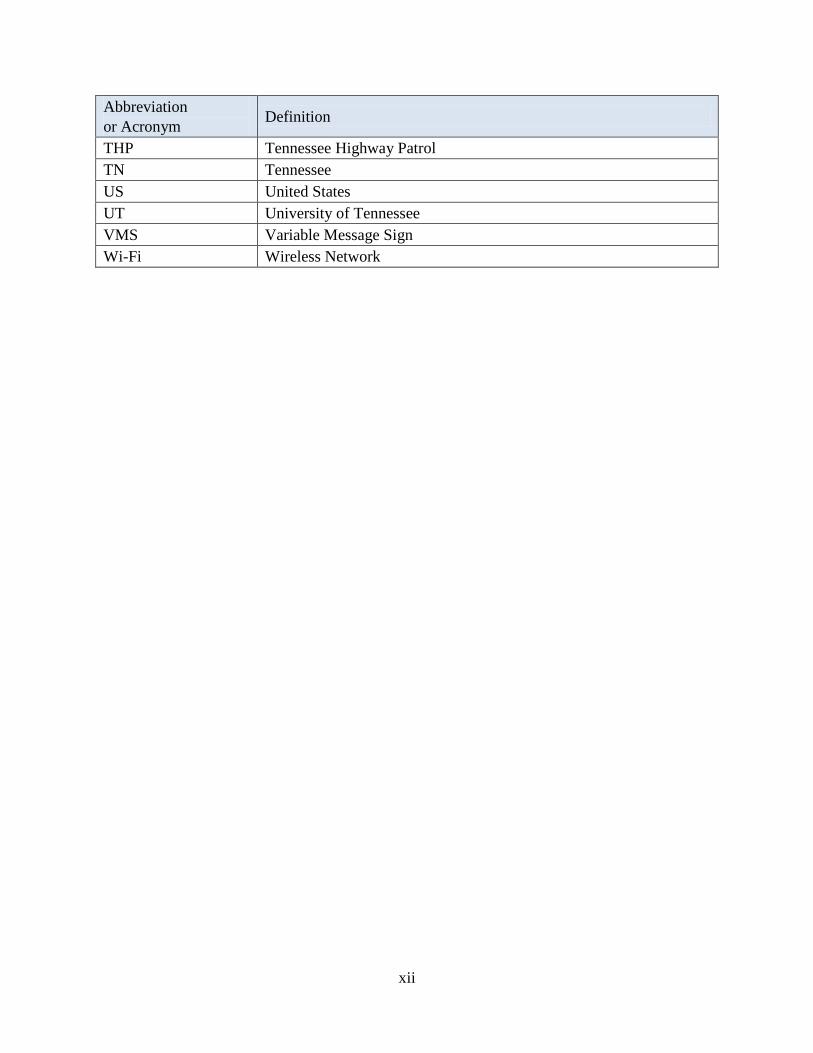
Integrating the aforementioned modules together, this module compares LPR text strings from two or more streams (LPR machines) to find matches. Multiple Association Matrices are employed by Levenshtein ED algorithms to compare license plates read at these locations. When a plate is matched with one or more plates at different locations, the plates are displayed and a match is declared. For example, Figure 2-4 shows an actual match report of truck traversing a distance of 3.00 miles for the duration of 2 minutes and 25.35 seconds, which yields an average speed of 74.30 mph.
8
Figure 2-4. Photograph. Sample Report from PlateMat.
2.1.5 Data Interfacing Module
Quite a lot of data, in the form or image files, are transferred from the LPR machines in the field to, eventually, PlateMat. There are multiple paths for the data to flow over a 3G cellular network, a Wi-Fi (IEEE 802.11) network, or via wired Ethernet. Eventually, though, the data have to be archived at a location and accessible from other locations, such as the weigh station. To be able to access the data remotely and perform plate matching in real-time, the data have to be downloaded quickly through protocols such as an FTP client. To that end, PlateMat developed in this study monitors the FTP server and downloads new files as soon as they become available. Because a large amount of data is collected, transmitted, processed, and stored within this system in real-time, issues of bandwidth and storage capacity are crucial. More discussions on this are presented in Section 2.3.
2.2 License Plate Recognition Machines Multiple LPR units are required for deployment or even a demonstration of future deployment. Students were trained with both mobile implementation and fixed installation of LPR units. In fact, several generations of LPR cameras from PIPS Technology were made available to this project through outright acquisition, leasing, rental, and in-kind use-agreement arrangements. These cameras include P357/359/366 combo, P372, and P382.
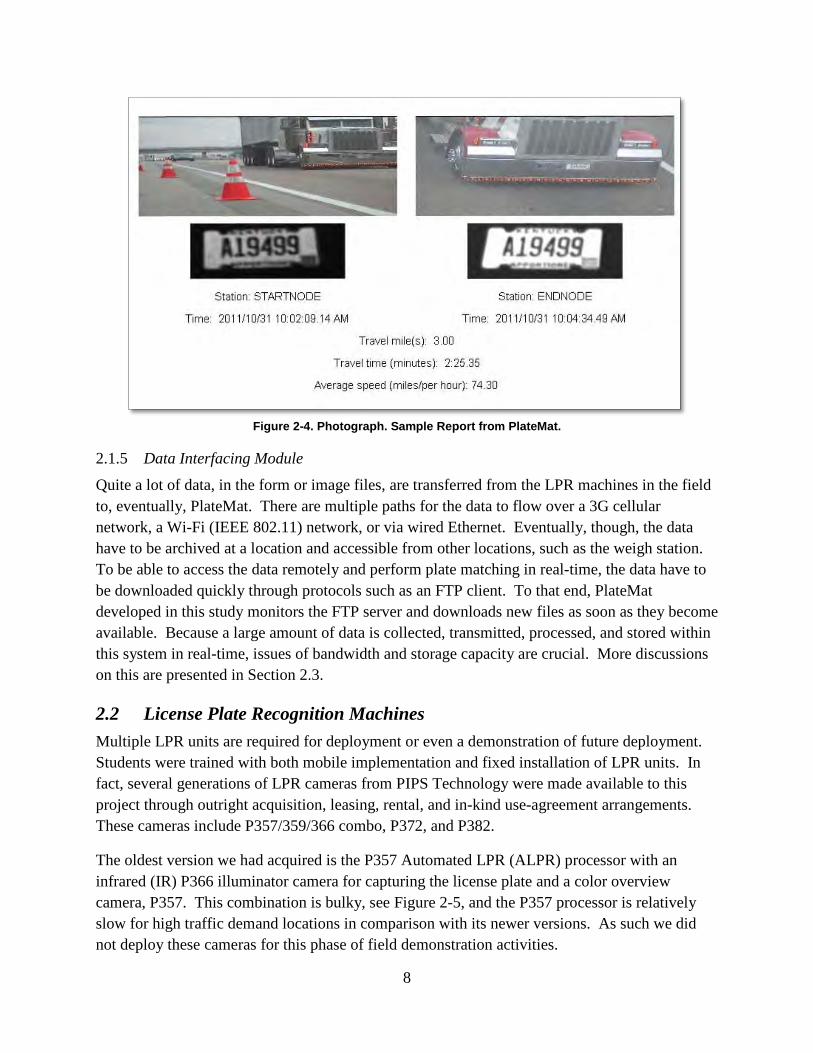
The oldest version we had acquired is the P357 Automated LPR (ALPR) processor with an infrared (IR) P366 illuminator camera for capturing the license plate and a color overview camera, P357. This combination is bulky, see Figure 2-5, and the P357 processor is relatively slow for high traffic demand locations in comparison with its newer versions. As such we did not deploy these cameras for this phase of field demonstration activities.

9
Figure 2-5. Photograph. PIPS Technology P357/359/366 License Plate Reader Combo
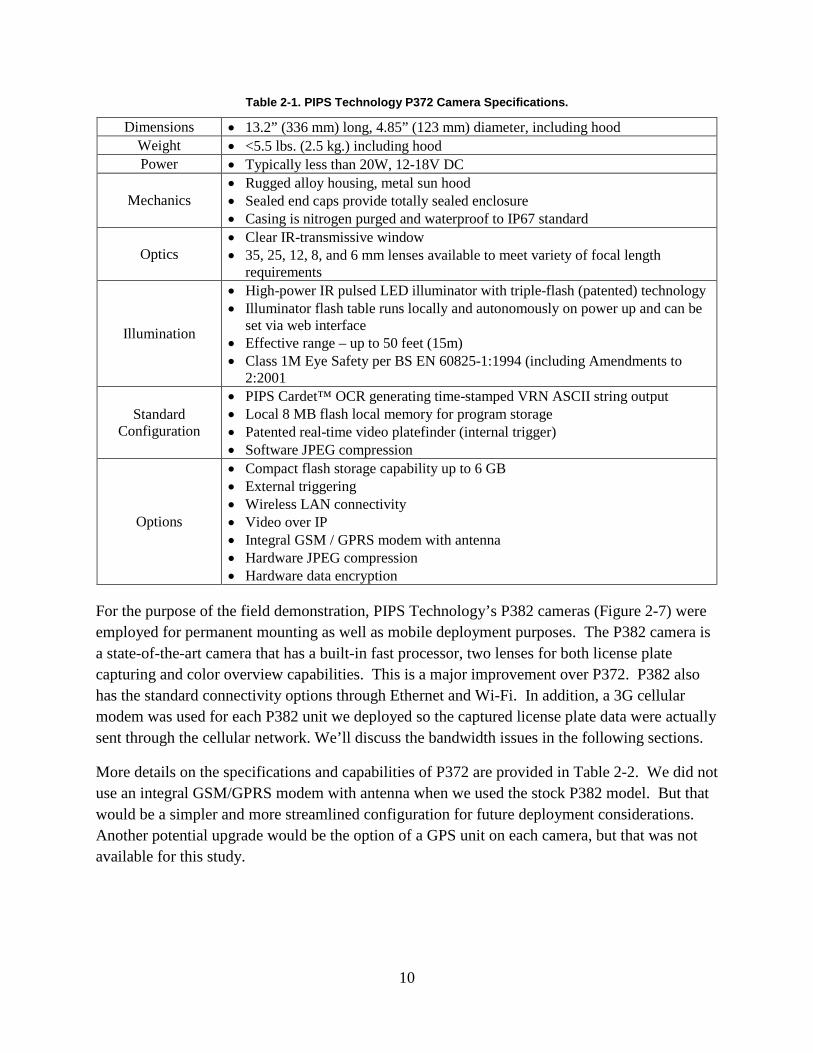
We also purchased a P372 ALPR camera previously. The P372 is much smaller and less conspicuous for field deployment purposes. It also has a faster processor. A drawback of the camera is it only has one lens for license plate capturing without another lens for the overview of the vehicle, which could provide more insights for, potentially, the weigh station operator, the toll collector, and/or the enforcement officer. Nevertheless this is major step forward towards better mobility and field deployment. The specs of the camera are provided in Table 2-1.
Figure 2-6. Photograph. UT Research Team Testing a PIPS Technology P372 ALPR Camera
10
Table 2-1. PIPS Technology P372 Camera Specifications.
Dimensions • 13.2” (336 mm) long, 4.85” (123 mm) diameter, including hood Weight • <5.5 lbs. (2.5 kg.) including hood Power • Typically less than 20W, 12-18V DC
Mechanics • Rugged alloy housing, metal sun hood • Sealed end caps provide totally sealed enclosure • Casing is nitrogen purged and waterproof to IP67 standard
Optics • Clear IR-transmissive window • 35, 25, 12, 8, and 6 mm lenses available to meet variety of focal length
requirements
Illumination
• High-power IR pulsed LED illuminator with triple-flash (patented) technology • Illuminator flash table runs locally and autonomously on power up and can be
set via web interface • Effective range – up to 50 feet (15m) • Class 1M Eye Safety per BS EN 60825-1:1994 (including Amendments to
2:2001
Standard Configuration
• PIPS Cardet™ OCR generating time-stamped VRN ASCII string output • Local 8 MB flash local memory for program storage • Patented real-time video platefinder (internal trigger) • Software JPEG compression
Options
• Compact flash storage capability up to 6 GB • External triggering • Wireless LAN connectivity • Video over IP • Integral GSM / GPRS modem with antenna • Hardware JPEG compression • Hardware data encryption
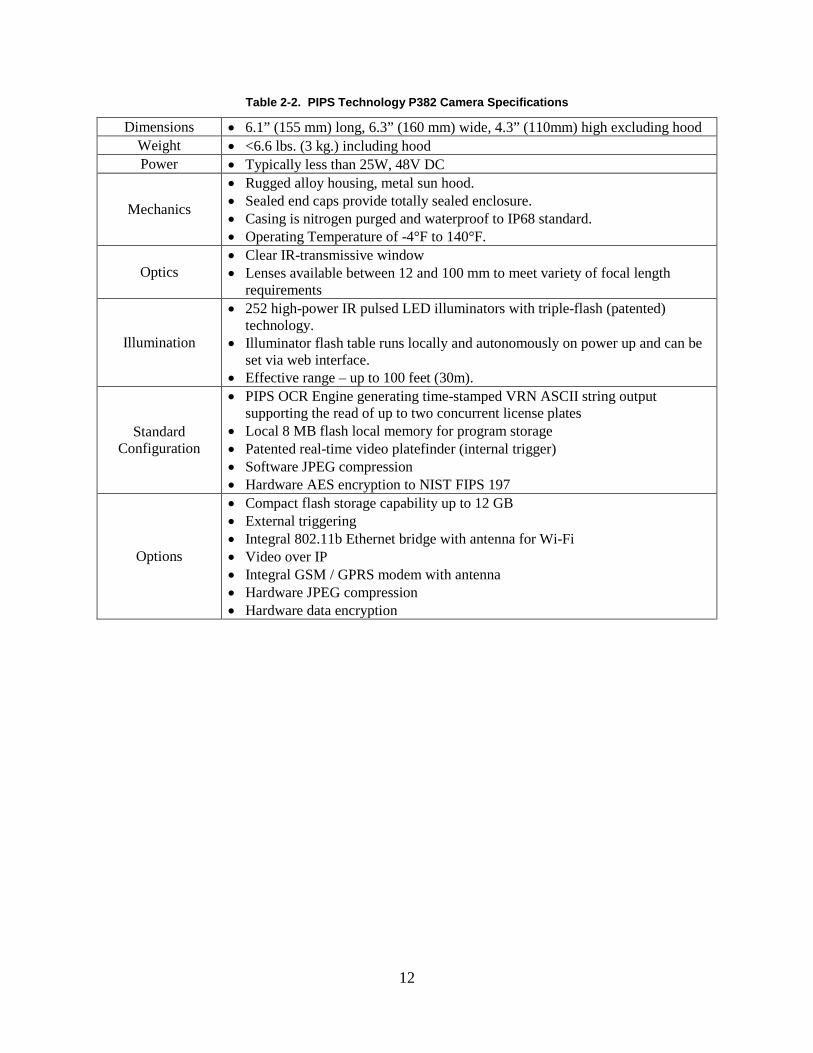
For the purpose of the field demonstration, PIPS Technology’s P382 cameras (Figure 2-7) were employed for permanent mounting as well as mobile deployment purposes. The P382 camera is a state-of-the-art camera that has a built-in fast processor, two lenses for both license plate capturing and color overview capabilities. This is a major improvement over P372. P382 also has the standard connectivity options through Ethernet and Wi-Fi. In addition, a 3G cellular modem was used for each P382 unit we deployed so the captured license plate data were actually sent through the cellular network. We’ll discuss the bandwidth issues in the following sections.
More details on the specifications and capabilities of P372 are provided in Table 2-2. We did not use an integral GSM/GPRS modem with antenna when we used the stock P382 model. But that would be a simpler and more streamlined configuration for future deployment considerations. Another potential upgrade would be the option of a GPS unit on each camera, but that was not available for this study.

11
Figure 2-7. Photograph. Several P382 Cameras Being Tested at PIPS Technology Headquarters
Actually in addition to a battery of P382 cameras shown in Figure 2-7, a P372 camera and an even newer P392 camera are also shown in this photo. The research team has worked with a number of differently capable LPR cameras. The interesting point is that all of these cameras would work with the algorithms and configurations developed and demonstrated in this study.
During the preparation stage, two LPR machines were installed on I-640 at Pleasant Ridge Road and on I-40 near Papermill Road Exit on the variable message signs (VMS) (Figure 2-8). The LPR units were mounted on VMS structures because of the need for continuous power supply and the access to vantage points over traffic lanes. A cellular modem, in addition to power supply, is connected to the LPR unit so that the data can be forwarded to a data server.
An additional mobile LPR unit, tripod mounted, was also acquired for the use at the I-40 weigh station where fixed-mounting was not an option (Figure 2-9). Students went through intensive training to ensure quick and adequate set-up for field demonstration purposes (Figure 2-10). With the option of mobile deployment, this technology can be implemented for many additional applications.
12
Table 2-2. PIPS Technology P382 Camera Specifications
Dimensions • 6.1” (155 mm) long, 6.3” (160 mm) wide, 4.3” (110mm) high excluding hood Weight • <6.6 lbs. (3 kg.) including hood Power • Typically less than 25W, 48V DC
Mechanics
• Rugged alloy housing, metal sun hood. • Sealed end caps provide totally sealed enclosure. • Casing is nitrogen purged and waterproof to IP68 standard. • Operating Temperature of -4°F to 140°F.
Optics • Clear IR-transmissive window • Lenses available between 12 and 100 mm to meet variety of focal length
requirements
Illumination
• 252 high-power IR pulsed LED illuminators with triple-flash (patented) technology.
• Illuminator flash table runs locally and autonomously on power up and can be set via web interface.
• Effective range – up to 100 feet (30m).
Standard Configuration
• PIPS OCR Engine generating time-stamped VRN ASCII string output supporting the read of up to two concurrent license plates
• Local 8 MB flash local memory for program storage • Patented real-time video platefinder (internal trigger) • Software JPEG compression • Hardware AES encryption to NIST FIPS 197
Options
• Compact flash storage capability up to 12 GB • External triggering • Integral 802.11b Ethernet bridge with antenna for Wi-Fi • Video over IP • Integral GSM / GPRS modem with antenna • Hardware JPEG compression • Hardware data encryption

13
Figure 2-8. Photograph. Fix-Mounted LPR Unit on I-40.
Figure 2-9. Photograph. Mobile LPR Testing at I-40 Weigh Station.

14
Figure 2-10. Photograph. Mobile LPR Training on UT Campus.
2.3 Data Server Preparations The expeditious flow of real-time data, ample space for their temporary buffering, and the reliability of permanent data archival are crucial to the success of the implementation of this technology. We used UT’s FTP server with some special tailored functionalities to ensure timely data transfer and storage.
As an engineering project, one has to keep in mind the ultimate costs and physical limitations of communication technology of the day. Therefore, by ample storage, we mean enough of storage space to hold the license plate image files captured by all the LPR units. Ultimately the size of the storage depends on:
• Number of LPR units (N)
• Number of vehicles captured by each LPR unit per day (F)
• Number of days the images are collected and kept (D)
• Various sizes of the transferred image files (S)
• Number of different image files captured for each vehicle (M)
In other words, the storage size can be calculated as:

15
����𝑆𝑖,𝑗,𝑘,𝑙
𝑀
𝑙=1
𝐹
𝑘=1
𝑁
𝑗=1
𝐷
𝑖=1
Figure 2-11. Equation. Formula for estimating the storage requirement for the data server.
For the case of this study during the days leading to the final field demonstration, two units were installed on VMS sign structures collecting data for some 400 days. Only one lane each was monitored at each location and two images (Figure 2-4) were captured for each vehicle. The size of cropped plate images is typically in the range of 1.5 to 4 KB. The file size for each plate varies based on the physical dimension of the plate, the angle it was captured, the lighting condition, and a number of other considerations. Figure 2-13 shows a partial listing of plate images files captured on November 3, 2011. The numbers in the column left to the wording of “NOV 03” are the sizes of the files in bytes.
The size of the colored overview image of the vehicle is in the range of 25 to 80 KB, which reflects the different lighting conditions, set-up of the camera, and so on. For storage space estimation, one can use the average sizes of the images, 3 and 50 KB. There were typically 2,000 trucks captured at LPR Station 1 and 4,000 trucks captured at LPR station 2. To that end, the minimum storage space for this study can be estimated as:
400 × (2,000 + 4,000) × (3 + 50) = 127,200,000KB 𝑜𝑟 127GB
Figure 2-12. Equation. Estimation of the size of the data server needed.
Now that 3 TB external hard drives can be bought for approximately $200, 127 GB is really not that big. But if this were for, say, a city with 20 miles of freeway and LPR units are installed for all four lanes in each direction at one-mile intervals, a total of 10 TB would be needed annually.
The other consideration is bandwidth for the data. Instead of using the average file sizes as we did for storage calculations, we need to use the largest file sizes for this case because large sizes, resultant from lighting considerations, can run together. At 4,000 plates per day, or about 4,000x(4+80)/24/3,600 = 3.9 KB/sec, any 3G data network can handle this easily even when the vehicles bunch together. On the receiving end, the FTP server has to handle a combined data traffic volume from all LPR units. Using the same example of the city with 20 miles of freeway, the FTP server would have to handle an average load of about 350 KB/sec. Even when the number surges to, say, 1 MB/sec due to peak hour traffic, it is still well within the bandwidth limit of FTP servers.

16
Figure 2-13. Screenshot. Sample Output of Captured LPR files on UT's FTP Server

17
Chapter 3 – Field Demonstration The formal field demonstration was held on November 2, 2011. Representatives from key agencies were invited. These agencies include TDOT, TDOS/THP, FHWA, FMCSA, UT, PIPS Technology, and NTRCI.
3.1 Study Site The field demonstration was held at NTRCI headquarters in Knoxville, TN. Three LPR machines were strategically placed along I-640 (southbound) and I-40 (westbound) for real-time tracking (Figure 3-1). LPR Station 1 (also known as the “STARTNODE”) is on I-640 near Pleasant Ridge Road. LPR Station 2 (also known as the “ENDNODE”) is on I-40 right before Papermill Road. The distance between the two sites is 3.0 miles. Further downstream, about 12 miles west of LPR Station 2, is the weigh station where the mobile LPR station is. With over 12 million trucks per year, this stretch of I-40/75 is the second busiest Interstate, in terms of heavy vehicle traffic, in the entire nation. Based the value of the freight carried by these trucks, this stretch of I-40/75 carries a higher total value of commercial goods than any other roadways in the U.S.
Figure 3-1. Map. LPR Field Demonstration Configurations.
These sites are strategically selected so that actions, if warranted, could be performed when a perpetrating truck arrives at the weigh station. This ensures a straightforward and responsive workflow and eliminates the need of high-speed pursuit on the Interstate. It should be noted that NTRCI, the agency sponsoring this field demonstration, is advantageously located right in the midst of the study area. This affords quick physical response to all sites if technical issues or

18
other problems should arise during the demonstration. This is also a good practice for siting of a future control center if this technology is deployed in the future.
3.2 Dry Runs Multiple test “runs” were conducted to work out the “kinks” that are not included in our plate-matching algorithm, but may have hampered the field demonstration experience.
3.2.1 Alternative Setup at LPR Station 1
An example of these was the outage of the fix-mounted LPR unit at LPR Station 1 a few weeks before the field demonstration. Because it would take quite an effort, including lane closures, to remove and replace the unit, the UT team opted for a mobile setup at the original LPR Station 1 site to carry out the subsequent tasks (Figure 3-2). This decision meant there would be two mobile LPR machines in our setup and made the training task that much more challenging for attaining Association Matrices, since mobile units are deployed only a few hours at a time, due to security and safety considerations, the amount of self-learning is, therefore, relatively limited.
Figure 3-2. Photograph. Mobile LPR Setup at LP Station 1.
3.2.2 Alternative Association Matrices
The self-learned Association Matrices, when using fix-mounted LPR units, yielded a positive matching rate of over 98% within a week of self-learning (Figure 3-3). This is extraordinary especially considering the two LPR units used for the analysis were not calibrated for truck or Tennessee plates and were only reading at 29% and 59% of accuracy. With any mobile configuration, we typically have only two to four hours of time for Association Matrices learning and would not quite get a positive matching rate of over 90%. To speed up the learning process,

19
instead of starting with an identity matrix, like those shown in Figure 2-2, we started the process with an existing Association Matrix, which is not optimal but is serviceable, and successfully reduced the learning time for rapid and ad hoc deployment.
Figure 3-3. Graph. Efficiency of Association Matrix Learning Algorithm.
3.2.3 The Control Center Originally we were to take the attendees of the field demonstration to the three LPR sites and the weigh station for hands-on demonstration. Due to the considerations of potential inclement weather in November, logistics of busing a group of dignitaries, and practical safety concerns on the shoulder of the Interstate system, we have opted to perform the demonstration at the centrally located NTRCI headquarters. In addition to seeing LPR plate information coming in live (Figure 3-4), the students manning the LPR units in the field can also be seen via real-time video links (Figure 3-5).
This turned out to be a very sensible decision as NTRCI has high-speed wired and wireless Internet connections, which are essential to the demonstration; it has a nice ceiling-mounted projector and screen, which was used for the introduction of the project on the demonstration day; and there was ample space of setting up the equipment and refreshments for the guests.
3.2.4 UT’s FTP Server The FTP server, where all real-time plate data is sent to immediately after being captured, is an important hub of information. The real-time functionality of our matching software, PlateMat, relies on the constant high-bandwidth connectivity to the FTP server. This FTP server that we

20
use for the demonstration is not a dedicated server for our project alone. It is shared, instead, by thousands of faculty, staff, and students on UT campus. As such, we experienced occasional slowdowns and storage issues during our dry runs. We were able to keep things going reasonably during the dry runs after some tinkering. But a dedicated server would be desirable for real-world deployment.
Figure 3-4. Photograph. Dr. Xiong Monitoring Real-Time Plate Matching Report at NTRCI.
Figure 3-5. Photograph. Field Team Leader James Ensley Reporting in Real-Time from LPR Station 1.

21
3.3 In the Field During the field demonstration, two teams of students led by James Ensley, a UT research assistant, were situated at LPR Station 1 and the weigh station to make sure the LPR machines, the cellular modems, and other equipment were functioning throughout the duration. Each team ran a computer with a video feed, through Skype, to communicate with the demonstration central in real-time. The success of this study thanks to no small part of a large number of students involved in the fieldwork. The contributions of these students were also acknowledged in the presentation at the field demonstration session, which is attached in Appendix A of this report.
3.4 At the NTRCI Control Center While the field teams were in place at LPR Station 1 and the weight station by 7 AM on the field demonstration day, the actual demonstration did not kick off until 9 AM when all the dignitaries arrived. After the general pleasantry and introduction offered by Joseph Petrolino, NTRCI Director (Figure 3-6), Dr. Han (Figure 3-7) gave a presentation on the background and the specifics about the field demonstration, see Appendix A
Figure 3-6. Photograph. Welcome Speech by Joseph Petrolino.
Several key personnel attended the demonstration from TDOT, TDOS/THP, PIPS Technology, NTRCI, and the office of Senator Corker. Towards the end of Dr. Han’s presentation, Stephanie Hargrove (Figure 3-8) presented the study site conditions and the field team responsibilities.
During the presentation, field teams were on Skype videoconference for real-time feedbacks and communications. The attendees were able to talk to the research assistants in the field (Figure

22
3-10 and Figure 3-11) and looked at the actual roadway and traffic conditions at the LPR stations (Figure 3-11).
The attendees subsequently moved to a different room at NTRCI, which represents a different locale from where the license plates are captured in the field, and observed PlateMat in action matching license plates in real-time (Figure 3-12). As truck plates get captured at LPR Station 1 and then LPR Station 2, PlateMat matches the plates, and hence the vehicle. A report is automatically generated in real-time providing the travel time, distance, and average speed information supported with the time-stamped images the vehicle and its license plate as captured at the two (or more) LPR stations. The attendees were free to roam around the NTRCI Control Center, discuss with the UT team, and ask questions for about two hours.
Figure 3-7. Photograph. Dr. Han Acknowledges All Contributing Partners.

23
Figure 3-8. Photograph. Stephanie Hargrove Providing Details on the Field Setup.
The attendees of the field demonstration event had the opportunity to see a very efficient algorithm at work in real-time. They also discussed issues related to intellectual property and future applications in the areas of safety, security, air quality, and so on.
Figure 3-9. Photograph. Demonstration Attendees Conversing with Field Team Students.

24
Figure 3-10. Photograph. Field Team Captain on Skype Videoconference.
Due to logistical issues not all invitees were able to attend the event. The UT team plans to package the multimedia presentation and the results into a video, distributable as a DVD perhaps, and provide it to potential stakeholders and future users.
Figure 3-11. Photograph. Viewing of Site Traffic Condition via Skype.

25
Figure 3-12. Photograph. Attendees Observing PlateMat Software in Action.

26
This page intentionally left blank.
27
Chapter 4 – Conclusions With the assistance from many partners including TDOT, TDOS/THP, and PIPS Technology, the UT team successfully developed the theoretical algorithms into deployable software and put on a field demonstration showcasing the power and potential of this technology. As this study concludes, this section outlines the accomplishments of this effort and a few potential follow-up efforts in the future.
4.1 Accomplishments During the three phases of this study, the UT team approached the goal of real-time license plate tracking with progressively more sophisticated algorithms over time but always with the eventual field implementation in mind. In that process we were able to accomplish the following.
• Establishment of an Association Matrix based text-mining framework that utilizes existing LPR technologies to match license plates at a much higher level of success. These include a better than 98% positive matching rate and a less than 1% false matching rate, both in real-time.
• Design of a self-learning algorithm to generate Association Matrices without laborious human efforts or ground-truthing process. The saving in terms of time and money is significant.
• Development of the algorithms into a software (PlateMat) that integrates subsystems and report matching results in real-time.
• Demonstration of the real-time plate-based vehicle tracking technologies in field, which empowers public agencies to address safety, security, air quality, etc. issues with this technology. All technologies are in place and ready to be deployed.
4.2 Future Directions A few ideas are in the works to further this technology. Without going into details, here are some general concepts.
• Zero Faults Proposition – While many researchers get caught up in an effort to increase positive matching rate, we will focus on the reduction of false matching rate. We have already achieved a better than 98% positive match rate, which is a monumental accomplishment from mere 36% without our technology. Pushing that number to 100% is attainable but with limited utility. But reducing the false matching rate to 0%, which we have already reduced from over 15% to 0.7%, means operations without humans in the loop. This could be significant for law enforcement and electronic tolling applications.

28
• Improve Recognition Accuracy – Computer scientists and electrical engineers have worked on LPR since 1970s. The current challenges of low recognition accuracy in the U.S. are due to the multitude of license plate designs, colors, fonts, syntaxes, etc. Our technique currently matches plates without relying on the plates being correctly recognized by any of the LPR machines. Conversely, since we can match these plates at such a high rate (over 98%), we can go back to help better recognize these plates at individual LPR locations. This is yet another breakthrough in this field.
• Field Deployment – The two ideas identified above are for research purposes. But this technology really has tremendous implementation potentials. Two LPR companies have contacted us on the potential licensing of the algorithms. It would be desirable to have the technology implemented to derive true benefits, in the form of better safety, security, air quality, etc., for the public.

29
Chapter 5 – References Clark, S. D., Grant-Muller, S., Chen, H. (2002) Cleaning of Matched License Plate Data.
Transportation Research Record 1804, 1-7.
Duda, R.O., P.E. Hart, and D.G. Stork (2000). Recognition with Strings. Pattern Classification. 2nd Ed. Wiley Inter Science. Ch. 8, p. 413-420.
Han, L.D., M.K. Jeong, and F.M. Oliveira-Neto (2008). Phase A – Final Report on License Plate Recognition and Plate Matching, project report submitted to National Transportation Research Center, Inc., Knoxville, TN.
Han, L.D., F.J. Wegmann, and A. Chatterjee (1997). Using License Plate Recognition Technology for Transportation Study Data Collection, project report submitted to Tennessee Department of Transportation, Nashville, TN.
Levenshtein, V.I. (1966). Binary Codes Capable of Correcting Deletions, Insertions, and Reversals, Soviet Physics Doklady, Vol. 10, No. 8, pp. 707-710.
Marzal, A., Vidal, E., 1993. Computation of Normalized Edit Distance and Applications. IEEE Transactions on Pattern Analysis and Machine Intelligence, 15 (9), 926-932.
Mei, J. (2004). Markov Edit Distance, IEEE Transactions on Pattern Analysis and Machine Intelligence, Vol. 6, No. 3, 2004, pp. 311-320.
Nakanishi, Y. J., Western, J., (2005). Ensuring the Security of Transportation Facilities: Evaluation of Advanced Vehicle Identification Technologies. Transportation Research Record 1938, 9-16.
Nelson, L. J., (2000a). Identification/Recognition: A Change of Order. ITS World, 32-33.
Nelson, L. J., (2000b). Snap Decisions. Traffic Technology International, 50-52.
Nelson, L. J., (2003). An Avid Reader. Traffic Technology International, 72-74.
Ocuda, T., Tanaka, E., Kasai, T., (1976). A method for Correction of Garbled Words based on the Levenstein Metric. IEEE Transactions on Computers, C-25(2), 172-177.
Oliveira-Neto, F.M., L.D. Han, and M.K. Jeong (2009). Tracking Large Trucks in Real Time with License Plate Recognition and Text-Mining Techniques, Transportation Research Records: Journal of the Transportation Research Board, No. 2121, Transportation Research Board of National Academies, Washington, D.C., pp. 121-127.
Oliveira-Neto, F.M., L.D. Han, and M.K. Jeong (2012). Online License Plate Matching Procedures using License-Plate Recognition Machines and New Weighted Edit Distance, Transportation Research Part C: Emerging Technologies, Volume 21, pp. 306-320.
Oommen, B. J., (1986). Constrained String Editing. Information Sciences, 40 (3), 267-284.

30
Tang, T, M. Roberts, and C. Ho (2003). Sensitivity Analysis of MOBILE6 Motor Vehicle Emission Factor Model, Federal Highway Administration, FHWA Resource Center, Atlanta, GA.
Rossetti, M. D., Baker., J., (2001). Applications and Evaluation of Automated License Plate Reading Systems. In 11th ITS America Meeting. CD-ROM. Conference proceedings. Miami Beach, Fla.
Seni, G., Kripasundar, V., Srihari, R., (1996). Generalizing Edit Distance to Incorporate Domain Information: Handwritten Text Recognition as a Case Study. Pattern Recognition, 29(3), 405-414.
Wagner, R. A. and M. J. Fischer (1974). The String-To-String Correction Problem, Journal of Association Computer Machinery, Vol. 21, No. 1, pp. 168-173.
Watling, D. P., (1994). Maximum Likelihood Estimation of an Origin-Destination Matrix from a Partial Registration Plate Survey. Transportation Research Part B, 28B(4), 289-214.
Watling, D. P., Maher, M. J., (1988). A Graphical Procedure for Analyzing Partial Registration Plate Data. Traffic Engineering & Control 29, 515-519.
Watling, D. P., Maher, M. J., (1992). A Statistical Procedure for Estimating a Mean Origin-Destination Matrix from Partial Registration Plate Survey. Transportation Research Part B, 26B(3), 171-193.
Wei J., (2004). Markov Edit Distance. IEEE Transactions on Pattern Analysis and Machine Intelligence, 6(3), 311-320.
Wiggins, A., (2006). ANPR Technology and Applications in ITS. 2006. Research into practice: 22nd ARRB Conference Proceedings. CD-ROM. Australia Road Research Board, ARRB, Canberra, Australia, October of 2006.

A-1
Appendix A – Presentation at Field Demonstration on 11.02.2011

A-2
This page intentionally left blank.

A-3

A-4

A-5

A-6

A-7

A-8

A-9