Embed Size (px)
Citation preview
Directorate for Educationand Human Resources
Division of Research,Evaluation and Communication
National Science Foundation
User-Friendly Handbook for
Mixed Method Evaluations
The Foundation provides awards for research in the sciences andengineering. The awardee is wholly responsible for the conduct of suchresearch and the preparation of the results for publication. TheFoundation, therefore, does not assume responsibility for the researchfindings or their interpretation.
The Foundation welcomes proposals from all qualified scientists andengineers, and strongly encourages women, minorities, and persons withdisabilities to compete fully in any of the research and related programsdescribed here.
In accordance with federal statutes, regulations, and NSF policies, noperson on grounds of race, color, age, sex, national origin, or disabilityshall be excluded from participation in, denied the benefits of, or besubject to discrimination under any program or activity receiving financialassistance from the National Science Foundation.
Facilitation Awards for Scientists and Engineers with Disabilities(FASED) provide funding for special assistance or equipment to enablepersons with disabilities (investigators and other staff, including studentresearch assistants) to work on an NSF project. See the programannouncement or contact the program coordinator at (703) 306-1636.
Privacy Act and Public Burden
The information requested on proposal forms is solicited under theauthority of the National Science Foundation Act of 1950, as amended. Itwill be used in connection with the selection of qualified proposals andmay be disclosed to qualified reviewers and staff assistants as part of thereview process; to applicant institutions/grantees; to provide or obtain dataregarding the application review process, award decisions, or theadministration of awards; to government contractors, experts, volunteers,and researchers as necessary to complete assigned work; and to othergovernment agencies in order to coordinate programs. See Systems ofRecords, NSF-50, Principal Investigators/Proposal File and AssociatedRecords, and NSF-51, 60 Federal Register 4449 (January 23, 1995).Reviewer/Proposal File and Associated Records, 59 Federal Register 8031(February 17 , 194). Submission of the information is voluntary. Failureto provide full and complete information, however, may reduce thepossibility of your receiving an award.
Public reporting burden for this collection of information is estimated toaverage 120 hours per response, including the time for reviewinginstructions. Send comments regarding this burden estimate or any otheraspect of this collection of information, including suggestions for reducingthis burden, to Herman G. Fleming, Reports Clearance Officer, Contracts,Policy, and Oversight, National Science Foundation, 4201 WilsonBoulevard, Arlington, VA 22230.
The National Science Foundation has TTD (Telephonic Device for theDeaf) capability, which enables individuals with hearing impairment tocommunication with the Foundation about NSF programs, employment, orgeneral information. This number is (703) 306-0090.

ACKNOWLEDGMENTS
Appreciation is expressed to our external advisory panel Dr.Frances Lawrenz, Dr. Jennifer Greene, Dr. Mary Ann Millsap,and Dr. Steve Dietz for their comprehensive reviews of thisdocument and their helpful suggestions. We also appreciate thedirection provided by Dr. Conrad Katzenmeyer and Mr. JamesDietz of the Division of Research, Evaluation andCommunication.
User-Friendly Handbook forMixed Method Evaluations
Edited by
Joy FrechtlingLaure SharpWestat, Inc.
August 1997
NSF Program OfficerConrad Katzenmeyer
Directorate for Educationand Human Resources
Division of Research,Evaluation and Communication
This handbook was developed with support from the National Science Foundation RED 94-52965.
Table of Contents
Part I. Introduction to Mixed Method Evaluations Page
1 Introducing This Handbook ............................................................................. 1-1(Laure Sharp and Joy Frechtling)
The Need for a Handbook on Designing and Conducting Mixed MethodEvaluations.......................................................................................... 1-1
Key Concepts and Assumptions....................................................................... 1-2
2 Illustration: A Hypothetical Project ................................................................ 2-1(Laure Sharp)
Project Title...................................................................................................... 2-1Project Description........................................................................................... 2-1Project Goals as Stated in the Grant Application to NSF ................................ 2-2Overview of the Evaluation Plan ..................................................................... 2-3
Part II. Overview of Qualitative Methods and Analytic Techniques
3 Common Qualitative Methods ......................................................................... 3-1(Colleen Mahoney)
Observations..................................................................................................... 3-1Interviews ......................................................................................................... 3-5Focus Groups.................................................................................................... 3-9Other Qualitative Methods............................................................................... 3-13Appendix A: Sample Observation Instrument ................................................ A-1Appendix B: Sample Indepth Interview Guide ............................................... B-1Appendix C: Sample Focus Group Topic Guide ............................................ C-1
4 Analyzing Qualitative Data.............................................................................. 4-1(Suzanne Berkowitz)
What Is Qualitative Analysis?.......................................................................... 4-1Processes in Qualitative Analysis .................................................................... 4-3Summary: Judging the Quality of Qualitative Analysis.................................. 4-17Practical Advice in Conducting Qualitative Analyses ..................................... 4-19
Table of Contents (continued)
Part III. Designing and Reporting Mixed Method Evaluations Page
5 Overview of the Design Process for Mixed Method Evaluation ..................... 5-1(Laure Sharp and Joy Frechtling)
Developing Evaluation Questions.................................................................... 5-2Selecting Methods for Gathering the Data: The Case for Mixed Method
Designs ................................................................................................ 5-9Other Considerations in Designing Mixed Method Evaluations ..................... 5-10
6 Evaluation Design for the Hypothetical Project .............................................. 6-1(Laure Sharp)
Step 1. Develop Evaluation Questions............................................................ 6-1Step 2. Determine Appropriate Data Sources and Data Collection
Approaches to Obtain Answers to the Final Set of EvaluationQuestions............................................................................................. 6-3
Step 3. Reality Testing and Design Modifications: Staff Needs, Costs,Time Frame Within Which All Tasks (Data Collection, DataAnalysis, and Reporting Writing) Must Be Completed ...................... 6-8
7 Reporting the Results of Mixed Method Evaluations...................................... 7-1(Gary Silverstein and Laure Sharp)
Ascertaining the Interests and Needs of the Audience..................................... 7-2Organizing and Consolidating the Final Report............................................... 7-4Formulating Sound Conclusions and Recommendations................................. 7-7Maintaining Confidentiality ............................................................................. 7-8Tips for Writing Good Evaluation Reports...................................................... 7-10
Part IV. Supplementary Materials
8 Annotated Bibliography ................................................................................... 8-1
9 Glossary............................................................................................................ 9-1
Table of Contents
List of Exhibits
Exhibit Page
1 Common techniques ......................................................................................... 1-4
2 Example of a mixed method design ................................................................. 1-9
3 Advantages and disadvantages of observations ............................................... 3-2
4 Types of data for which observations are a good source ................................ 3-3
5 Advantages and disadvantages of indepth interviews...................................... 3-7
6 Considerations in conducting indepth interviews and focus groups................ 3-8
7 Which to use: Focus groups or indepth interviews? ....................................... 3-11
8 Advantages and disadvantages of document studies........................................ 3-14
9 Advantages and disadvantages of using key informants.................................. 3-15
10 Data matrix for Campus A: What was done to share knowledge ................... 4-7
11 Participants’ views of information sharing at eight campuses......................... 4-9
12 Matrix of cross-case analysis linking implementation and outcome factors ... 4-17
13 Goals, stakeholders, and evaluation questions for a formative evaluation ...... 6-2
14 Goals, stakeholders, and evaluation questions for a summative evaluation .... 6-3
15 Evaluation questions, data sources, and data collection methods for aformative evaluation......................................................................................... 6-5
16 Evaluation questions, data sources, and data collection methods for asummative evaluation....................................................................................... 6-6
17 First data collection plan .................................................................................. 6-7
18 Final data collection plan ................................................................................. 6-9
19 Matrix of stakeholders...................................................................................... 7-3
20 Example of an evaluation/methodology matrix ............................................... 7-6
PART I.
INTRODUCTION TO
MIXED METHOD
EVALUATIONS
1-1
The Need for a Handbook on Designing and Conducting MixedMethod Evaluations
Evaluation of the progress and effectiveness of projects funded by theNational Science Foundation’s (NSF) Directorate for Education andHuman Resources (EHR) has become increasingly important. Projectstaff, participants, local stakeholders, and decisionmakers need toknow how funded projects are contributing to knowledge andunderstanding of mathematics, science, and technology. To do so,some simple but critical questions must be addressed:
• What are we finding out about teaching and learning?
• How can we apply our new knowledge?
• Where are the dead ends?
• What are the next steps?
Although there are many excellent textbooks, manuals, and guidesdealing with evaluation, few are geared to the needs of the EHRgrantee who may be an experienced researcher but a noviceevaluator. One of the ways that EHR seeks to fill this gap is by thepublication of what have been called “user-friendly” handbooks forproject evaluation.
The first publication, User-Friendly Handbook for ProjectEvaluation: Science, Mathematics, Engineering and TechnologyEducation, issued in 1993, describes the types of evaluationsprincipal investigators/project directors (PIs/PDs) may be called uponto perform over the lifetime of a project. It also describes in somedetail the evaluation process, which includes the development ofevaluation questions and the collection and analysis of appropriatedata to provide answers to these questions. Although this firsthandbook discussed both qualitative and quantitative methods, it
1 INTRODUCING
THIS HANDBOOK
Chapter 1.Introducing This Handbook
1-2
covered techniques that produce numbers (quantitative data) ingreater detail. This approach was chosen because decisionmakersusually demand quantitative (statistically documented) evidence ofresults. Indicators that are often selected to document outcomesinclude percentage of targeted populations participating inmathematics and science courses, test scores, and percentage oftargeted populations selecting careers in the mathematics and sciencefields.
The current handbook, User-Friendly Guide to Mixed MethodEvaluations, builds on the first but seeks to introduce a broaderperspective. It was initiated because of the recognition that byfocusing primarily on quantitative techniques, evaluators may missimportant parts of a story. Experienced evaluators have found thatmost often the best results are achieved through the use of mixedmethod evaluations, which combine quantitative and qualitativetechniques. Because the earlier handbook did not include an indepthdiscussion of the collection and analysis of qualitative data, thishandbook was initiated to provide more information on qualitativetechniques and discuss how they can be combined effectively withquantitative measures.
Like the earlier publication, this handbook is aimed at users whoneed practical rather than technically sophisticated advice aboutevaluation methodology. The main objective is to make PIs and PDs"evaluation smart" and to provide the knowledge needed for planningand managing useful evaluations.
Key Concepts and Assumptions
Why Conduct an Evaluation?
There are two simple reasons for conducting an evaluation:
• To gain direction for improving projects as they aredeveloping, and
• To determine projects’ effectiveness after they have had timeto produce results.
Formative evaluations (which include implementation and processevaluations) address the first set of issues. They examine thedevelopment of the project and may lead to changes in the way theproject is structured and carried out. Questions typically askedinclude:
Like the earlierpublication, this
handbook is aimed atusers who need
practical rather thantechnically
sophisticated adviceabout evaluation
methodology.
Chapter 1.Introducing This Handbook
1-3
• To what extent do the activities and strategies match thosedescribed in the plan? If they do not match, are the changes inthe activities justified and described?
• To what extent were the activities conducted according to theproposed timeline? By the appropriate personnel?
• To what extent are the actual costs of project implementationin line with initial budget expectations?
• To what extent are the participants moving toward theanticipated goals of the project?
• Which of the activities or strategies are aiding the participantsto move toward the goals?
• What barriers were encountered? How and to what extentwere they overcome?
Summative evaluations (also called outcome or impact evaluations)address the second set of issues. They look at what a project hasactually accomplished in terms of its stated goals. Summativeevaluation questions include:
• To what extent did the project meet its overall goals?
• Was the project equally effective for all participants?
• What components were the most effective?
• What significant unintended impacts did the project have?
• Is the project replicable and transportable?
For each of these questions, both quantitative data (data expressed innumbers) and qualitative data (data expressed in narratives or words)can be useful in a variety of ways.
The remainder of this chapter provides some background on thediffering and complementary nature of quantitative and qualitativeevaluation methodologies. The aim is to provide an overview of theadvantages and disadvantages of each, as well as an idea of some ofthe more controversial issues concerning their use.
Before doing so, however, it is important to stress that there are manyways of performing project evaluations, and that there is no recipe orformula that is best for every case. Quantitative and qualitativemethods each have advantages and drawbacks when it comes to anevaluation's design, implementation, findings, conclusions, and
Chapter 1.Introducing This Handbook
1-4
utilization. The challenge is to find a judicious balance in anyparticular situation. According to Cronbach (1982),
There is no single best plan for an evaluation, not even for aninquiry into a particular program at a particular time,with a particular budget.
What Are the Major Differences Between Quantitative andQualitative Techniques?
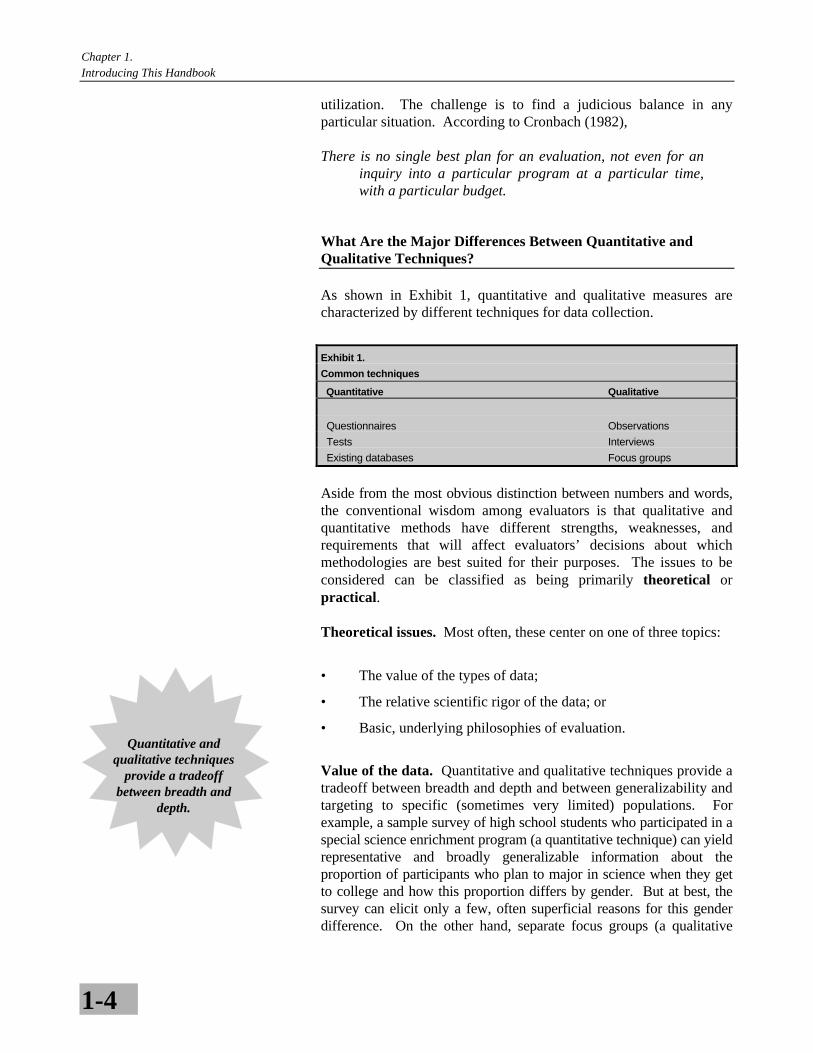
As shown in Exhibit 1, quantitative and qualitative measures arecharacterized by different techniques for data collection.
Exhibit 1.
Common techniques
Quantitative Qualitative
Questionnaires Observations
Tests Interviews
Existing databases Focus groups
Aside from the most obvious distinction between numbers and words,the conventional wisdom among evaluators is that qualitative andquantitative methods have different strengths, weaknesses, andrequirements that will affect evaluators’ decisions about whichmethodologies are best suited for their purposes. The issues to beconsidered can be classified as being primarily theoretical orpractical.
Theoretical issues. Most often, these center on one of three topics:
• The value of the types of data;
• The relative scientific rigor of the data; or
• Basic, underlying philosophies of evaluation.
Value of the data. Quantitative and qualitative techniques provide atradeoff between breadth and depth and between generalizability andtargeting to specific (sometimes very limited) populations. Forexample, a sample survey of high school students who participated in aspecial science enrichment program (a quantitative technique) can yieldrepresentative and broadly generalizable information about theproportion of participants who plan to major in science when they getto college and how this proportion differs by gender. But at best, thesurvey can elicit only a few, often superficial reasons for this genderdifference. On the other hand, separate focus groups (a qualitative
Quantitative andqualitative techniques
provide a tradeoffbetween breadth and
depth.
Chapter 1.Introducing This Handbook
1-5
technique) conducted with small groups of male and female studentswill provide many more clues about gender differences in the choice ofscience majors and the extent to which the special science programchanged or reinforced attitudes. But this technique may be limited inthe extent to which findings apply beyond the specific individualsincluded in the focus groups.
Scientific rigor. Data collected through quantitative methods areoften believed to yield more objective and accurate informationbecause they were collected using standardized methods, can bereplicated, and, unlike qualitative data, can be analyzed usingsophisticated statistical techniques. In line with these arguments,traditional wisdom has held that qualitative methods are most suitablefor formative evaluations, whereas summative evaluations require"hard" (quantitative) measures to judge the ultimate value of theproject.
This distinction is too simplistic. Both approaches may or may notsatisfy the canons of scientific rigor. Quantitative researchers arebecoming increasingly aware that some of their data may not beaccurate and valid, because some survey respondents may notunderstand the meaning of questions to which they respond, andbecause people’s recall of even recent events is often faulty. On theother hand, qualitative researchers have developed better techniquesfor classifying and analyzing large bodies of descriptive data. It isalso increasingly recognized that all data collection—quantitative andqualitative—operates within a cultural context and is affected tosome extent by the perceptions and beliefs of investigators and datacollectors.
Philosophical distinction. Some researchers and scholars differabout the respective merits of the two approaches largely because ofdifferent views about the nature of knowledge and how knowledge isbest acquired. Many qualitative researchers argue that there is noobjective social reality, and that all knowledge is "constructed" byobservers who are the product of traditions, beliefs, and the socialand political environment within which they operate. And whilequantitative researchers no longer believe that their research methodsyield absolute and objective truth, they continue to adhere to thescientific model and seek to develop increasingly sophisticatedtechniques and statistical tools to improve the measurement of socialphenomena. The qualitative approach emphasizes the importance ofunderstanding the context in which events and outcomes occur,whereas quantitative researchers seek to control the context by usingrandom assignment and multivariate analyses. Similarly, qualitativeresearchers believe that the study of deviant cases provides importantinsights for the interpretation of findings; quantitative researcherstend to ignore the small number of deviant and extreme cases.
Chapter 1.Introducing This Handbook
1-6
This distinction affects the nature of research designs. According toits most orthodox practitioners, qualitative research does not startwith narrowly specified evaluation questions; instead, specificquestions are formulated after open-ended field research has beencompleted (Lofland and Lofland, 1995). This approach may bedifficult for program and project evaluators to adopt, since specificquestions about the effectiveness of interventions being evaluated areusually expected to guide the evaluation. Some researchers havesuggested that a distinction be made between Qualitative andqualitative work: Qualitative work (large Q) refers to methods thateschew prior evaluation questions and hypothesis testing, whereasqualitative work (small q) refers to open-ended data collectionmethods such as indepth interviews embedded in structured research(Kidder and Fine, 1987). The latter are more likely to meet EHRevaluators' needs.
Practical issues. On the practical level, there are four issues whichcan affect the choice of method:
• Credibility of findings;
• Staff skills;
• Costs; and
• Time constraints.
Credibility of findings. Evaluations are designed for variousaudiences, including funding agencies, policymakers in governmentaland private agencies, project staff and clients, researchers inacademic and applied settings, as well as various other "stakeholders"(individuals and organizations with a stake in the outcome of aproject). Experienced evaluators know that they often deal withskeptical audiences or stakeholders who seek to discredit findingsthat are too critical or uncritical of a project's outcomes. For thisreason, the evaluation methodology may be rejected as unsound orweak for a specific case.
The major stakeholders for EHR projects are policymakers withinNSF and the federal government, state and local officials, anddecisionmakers in the educational community where the project islocated. In most cases, decisionmakers at the national level tend tofavor quantitative information because these policymakers areaccustomed to basing funding decisions on numbers and statisticalindicators. On the other hand, many stakeholders in the educationalcommunity are often skeptical about statistics and “numbercrunching” and consider the richer data obtained through qualitativeresearch to be more trustworthy and informative. A particular case inpoint is the use of traditional test results, a favorite outcome criterion
Chapter 1.Introducing This Handbook
1-7
for policymakers, school boards, and parents, but one that teachersand school administrators tend to discount as a poor tool forassessing true student learning.
Staff skills. Qualitative methods, including indepth interviewing,observations, and the use of focus groups, require good staff skillsand considerable supervision to yield trustworthy data. Somequantitative research methods can be mastered easily with the help ofsimple training manuals; this is true of small-scale, self-administeredquestionnaires, where most questions can be answered by yes/nocheckmarks or selecting numbers on a simple scale. Large-scale,complex surveys, however, usually require more skilled personnel todesign the instruments and to manage data collection and analysis.
Costs. It is difficult to generalize about the relative costs of the twomethods; much depends on the amount of information needed,quality standards followed for the data collection, and the number ofcases required for reliability and validity. A short survey based on asmall number of cases (25-50) and consisting of a few “easy”questions would be inexpensive, but it also would provide onlylimited data. Even cheaper would be substituting a focus groupsession for a subset of the 25-50 respondents; while this methodmight provide more “interesting” data, those data would be primarilyuseful for generating new hypotheses to be tested by moreappropriate qualitative or quantitative methods. To obtain robustfindings, the cost of data collection is bound to be high regardless ofmethod.
Time constraints. Similarly, data complexity and quality affect thetime needed for data collection and analysis. Although technologicalinnovations have shortened the time needed to process quantitativedata, a good survey requires considerable time to create and pretestquestions and to obtain high response rates. However, qualitativemethods may be even more time consuming because data collectionand data analysis overlap, and the process encourages the explorationof new evaluation questions (see Chapter 4). If insufficient time isallowed for the evaluation, it may be necessary to curtail the amountof data to be collected or to cut short the analytic process, therebylimiting the value of the findings. For evaluations that operate undersevere time constraints—for example, where budgetary decisionsdepend on the findings—the choice of the best method can present aserious dilemma.
In summary, the debate over the merits of qualitative versusquantitative methods is ongoing in the academic community, butwhen it comes to the choice of methods for conducting projectevaluations, a pragmatic strategy has been gaining increased support.Respected practitioners have argued for integrating the two
Chapter 1.Introducing This Handbook
1-8
approaches building on their complimentary strengths.1 Others havestressed the advantages of linking qualitative and quantitativemethods when performing studies and evaluations, showing how thevalidity and usefulness of findings will benefit (Miles and Huberman,1994).
Why Use a Mixed Method Approach?
The assumption guiding this handbook is that a strong case can bemade for using an approach that combines quantitative andqualitative elements in most evaluations of EHR projects. We offerthis assumption because most of the interventions sponsored by EHRare not introduced into a sterile laboratory, but rather into a complexsocial environment with feature that affect the success of the project.To ignore the complexity of the background is to impoverish theevaluation. Similarly, when investigating human behavior andattitudes, it is most fruitful to use a variety of data collection methods(Patton, 1990). By using different sources and methods at variouspoints in the evaluation process, the evaluation team can build on thestrength of each type of data collection and minimize the weaknessesof any single approach. A multimethod approach to evaluation canincrease both the validity and reliability of evaluation data.
The range of possible benefits that carefully crafted mixed methoddesigns can yield has been conceptualized by a number ofevaluators.2
• The validity of results can be strengthened by using more thanone method to study the same phenomenon. This approach—called triangulation—is most often mentioned as the mainadvantage of the mixed method approach.
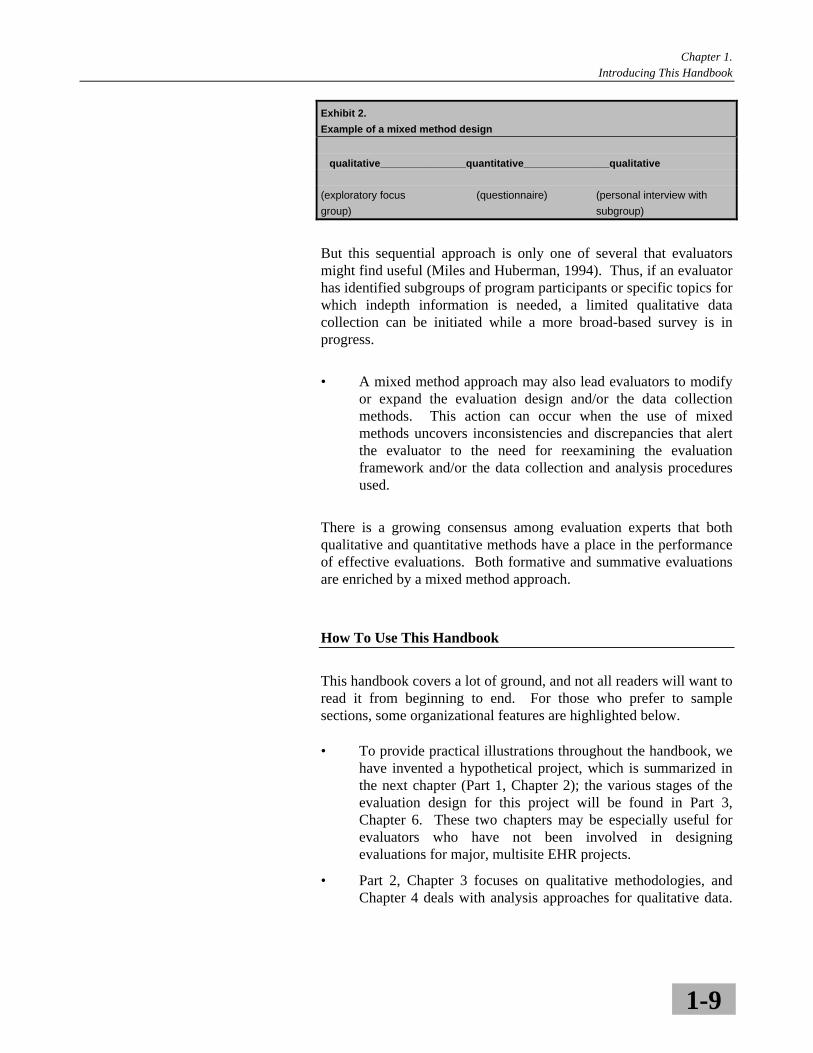
• Combining the two methods pays off in improvedinstrumentation for all data collection approaches and insharpening the evaluator's understanding of findings. A typicaldesign might start out with a qualitative segment such as a focusgroup discussion, which will alert the evaluator to issues thatshould be explored in a survey of program participants, followedby the survey, which in turn is followed by indepth interviews toclarify some of the survey findings (Exhibit 2).
1See especially the article by William R. Shadish in Program Evaluation: A Pluralistic Enterprise,
New Directions for Program Evaluation, No. 60 (San Francisco: Jossey Bass. Winter 1993).
2 For a full discussion of this topic, see Jennifer C. Greene, Valerie J. Caracelli, and Wendy F.Graham, Toward a Conceptual Framework for Mixed Method Evaluation Designs, EducationalEvaluation and Policy Analysis, Vol. 11, No. 3, (Fall 1989), pp. 255-274.
Chapter 1.Introducing This Handbook
1-9
Exhibit 2.
Example of a mixed method design
qualitative_______________quantitative_______________qualitative
(exploratory focus (questionnaire) (personal interview with
group) subgroup)
But this sequential approach is only one of several that evaluatorsmight find useful (Miles and Huberman, 1994). Thus, if an evaluatorhas identified subgroups of program participants or specific topics forwhich indepth information is needed, a limited qualitative datacollection can be initiated while a more broad-based survey is inprogress.
• A mixed method approach may also lead evaluators to modifyor expand the evaluation design and/or the data collectionmethods. This action can occur when the use of mixedmethods uncovers inconsistencies and discrepancies that alertthe evaluator to the need for reexamining the evaluationframework and/or the data collection and analysis proceduresused.
There is a growing consensus among evaluation experts that bothqualitative and quantitative methods have a place in the performanceof effective evaluations. Both formative and summative evaluationsare enriched by a mixed method approach.
How To Use This Handbook
This handbook covers a lot of ground, and not all readers will want toread it from beginning to end. For those who prefer to samplesections, some organizational features are highlighted below.
• To provide practical illustrations throughout the handbook, wehave invented a hypothetical project, which is summarized inthe next chapter (Part 1, Chapter 2); the various stages of theevaluation design for this project will be found in Part 3,Chapter 6. These two chapters may be especially useful forevaluators who have not been involved in designingevaluations for major, multisite EHR projects.
• Part 2, Chapter 3 focuses on qualitative methodologies, andChapter 4 deals with analysis approaches for qualitative data.
Chapter 1.Introducing This Handbook
1-10
These two chapters are intended to supplement the informationon quantitative methods in the previous handbook.
• Part 3, Chapters 5, 6, and 7 cover the basic steps in developinga mixed method evaluation design and describes ways ofreporting findings to NSF and other stakeholders.
• Part 4 presents supplementary material, including an annotatedbibliography and a glossary of common terms.
Before turning to these issues, however, we present the hypotheticalNSF project that is used as an anchoring point for discussing theissues presented in the subsequent chapters.
References
Cronbach, L. (1982). Designing Evaluations of Educational andSocial Programs. San Francisco: Jossey-Bass.
Kidder, L., and Fine, M. (1987). Qualitative and QuantitativeMethods: When Stories Converge. Multiple Methods inProgram Evaluation. New Directions for Program Evaluation,No. 35. San Francisco: Jossey-Bass.
Lofland, J., and Lofland, L.H. (1995). Analyzing Social Settings: AGuide to Qualitative Observation and Analysis. Belmont, CA:Wadsworth Publishing Company.
Miles, M.B., and Huberman, A.M. (1994). Qualitative DataAnalysis, 2nd Ed. Newbury Park, CA: Sage, p. 40-43.
National Science Foundation. (1993). User-Friendly Handbook forProject Evaluation: Science, Mathematics, Engineering andTechnology Education. NSF 93-152. Arlington, VA: NSF.
Patton, M.Q. (1990). Qualitative Evaluation and Research Methods,2nd Ed. Newbury Park, CA: Sage.
2-1
Project Title
Undergraduate Faculty Enhancement: Introducing faculty in stateuniversities and colleges to new concepts and methods in preservicemathematics instruction.
Project Description
In response to the growing national concern about the quality ofAmerican elementary and secondary education and especially aboutstudents' achievement in mathematics and science, considerableefforts have been directed at enhancing the skills of the teachers inthe labor force through inservice training. Less attention has beenfocused on preservice training, especially for elementary schoolteachers, most of whom are educated in departments and schools ofeducation. In many institutions, faculty members who provide thisinstruction need to become more conversant with the new standardsand instructional techniques for the teaching of mathematics inelementary schools.
The proposed pilot project was designed to examine a strategy formeeting this need. The project attempts to improve preserviceeducation by giving the faculty teaching courses in mathematics tofuture elementary school teachers new knowledge, skills, andapproaches for incorporation into their instruction. In the project, theinvestigators ascertain the extent of faculty members' knowledgeabout standards-based instruction, engage them in expanding theirunderstanding of standards-based reform and the instructionalapproaches that support high-quality teaching; and assess the extentto which the strategies emphasized and demonstrated in the pilotproject are transferred to the participants' own classroom practices.
2 ILLUSTRATION: A
HYPOTHETICAL
PROJECT
Chapter 2.Illustration: A Hypothetical Project
2-2
The project is being carried out on the main campus of a major stateuniversity under the leadership of the Director of the Center forEducational Innovation. Ten day-long workshops will be offered totwo cohorts of faculty members from the main campus and branchcampuses. These workshops will be supplemented by opportunitiesfor networking among participating faculty members and theexchange of experiences and recommendations during a summersession following the academic year. The workshops are based on anintegrated plan for reforming undergraduate education for futureelementary teachers. The focus of the workshops is to providecarefully articulated information and practice on current approachesto mathematics instruction (content and pedagogy) in elementarygrades, consistent with state frameworks and standards of excellence.The program uses and builds on the knowledge of content experts,master practitioners, and teacher educators.
The following strategies are being employed in the workshops:presentations, discussions, hands-on experiences with varioustraditional and innovative tools, coaching, and videotapeddemonstrations of model teaching. The summer session is offered forsharing experiences, reflecting on successful and unsuccessfulapplications, and constructing new approaches. In addition,participants are encouraged to communicate with each otherthroughout the year via e-mail. Project activities are funded for 2years and are expected to support two cohorts of participants; fundingfor an additional 6-month period to allow performance of thesummative evaluation has been included.
Participation is limited to faculty members on the main campus andin the seven 4-year branch campuses of the state university wherecourses in elementary mathematics education are offered.Participants are selected on the basis of a written essay and acommitment to attend all sessions and to try suggested approaches intheir classroom. A total of 25 faculty members are to be enrolled inthe workshops each year. During the life of the project, roughly1,000 undergraduate students will be enrolled in classes taught by theparticipating faculty members.
Project Goals as Stated in the Grant Application to NSF
As presented in the grant application, the project has four main goals:
• To further the knowledge of college faculty with respect tonew concepts, standards, and methods for mathematicseducation in elementary schools;
Chapter 2.Illustration: A Hypothetical Project
2-3
• To enable and encourage faculty members to incorporate theseapproaches in their own classrooms activities and, hopefully,into the curricula of their institutions;
• To stimulate their students’ interest in teaching mathematicsand in using the new techniques when they become elementaryschool teachers; and
• To test a model for achieving these goals.
Overview of the Evaluation Plan
A staff member of the Center for Educational Innovation with priorevaluation experience was assigned responsibility for the evaluation.She will be assisted by undergraduate and graduate students. Asrequired, consultation will be provided by members of the Center’sstatistical and research staff and by faculty members on the maincampus who have played leadership roles in reforming mathematicseducation.
A formative (progress) evaluation will be carried out at the end of thefirst year. A summative (outcome) evaluation is to be completed 6months after project termination. Because the project was conceivedas a prototype for future expansion to other institutions, a thoroughevaluation was considered an essential component, and the evaluationbudget represented a higher-than-usual percentage of total costs(project costs were $500,000, of which $75,000 was allocated forevaluation).
The evaluation designs included in the application were specifiedonly in general terms. The formative evaluation would look at theimplementation of the program and be used for identifying itsstrengths and weaknesses. Suggested formative evaluation questionsincluded the following:
• Were the workshops delivered and staffed as planned? If not,what were the reasons?
• Was the workshop content (disciplinary and pedagogical)accurate and up to date?
• Did the instructors communicate effectively with participants,stimulate questions, and encourage all participants to take partin discussions?
• Were appropriate materials available?
Chapter 2.Illustration: A Hypothetical Project
2-4
• Did the participants have the opportunity to engage in inquiry-based activities?
• Was there an appropriate balance of knowledge building andapplication?
The summative evaluation was intended to document the extent towhich participants introduced changes in their classroom teachingand to determine which components of the workshops wereespecially effective in this respect. The proposal also promised toinvestigate the impact of the workshops on participating facultymembers, especially on their acquisition of knowledge and skills.Furthermore, the impact on other faculty members, on the institution,and on students was to be part of the evaluation. Recommendationsfor replicating this project in other institutions, and suggestions forchanges in the workshop content or administrative arrangements,were to be included in the summative evaluation. Proposedsummative evaluation questions included the following:
• To what extent did the participants use what they were taughtin their own instruction or activities? Which topics andtechniques were most often (or least often) incorporated?
• To what extent did participants share their recently acquiredknowledge and skills with other faculty? Which topics werefrequently discussed? Which ones were not?
• To what extent was there an impact on the students of theseteachers? Had they become more (or less) positive aboutmaking the teaching of elementary mathematics an importantcomponent of their future career?
• Did changes occur in the overall program of instruction offeredto potential elementary mathematics teachers? What were theobstacles to the introduction of changes?
The proposal also enumerated possible data sources for conductingthe evaluations, including self-administered questionnaires completedafter each workshop, indepth interviews with knowledgeableinformants, focus groups, observation of workshops, classroomobservations, and surveys of students. It was stated that a morecomplete design for the formative and summative evaluations wouldbe developed after contract award.
PART II.
OVERVIEW OF
QUALITATIVE METHODS
AND
ANALYTIC TECHNIQUES
3-1
In this chapter we describe and compare the most common qualitativemethods employed in project evaluations.3 These includeobservations, indepth interviews, and focus groups. We also coverbriefly some other less frequently used qualitative techniques.Advantages and disadvantages are summarized. For those readersinterested in learning more about qualitative data collection methods,a list of recommended readings is provided.
Observations
Observational techniques are methods by which an individual orindividuals gather firsthand data on programs, processes, or behaviorsbeing studied. They provide evaluators with an opportunity to collectdata on a wide range of behaviors, to capture a great variety ofinteractions, and to openly explore the evaluation topic. By directlyobserving operations and activities, the evaluator can develop aholistic perspective, i.e., an understanding of the context withinwhich the project operates. This may be especially important whereit is not the event that is of interest, but rather how that event may fitinto, or be impacted by, a sequence of events. Observationalapproaches also allow the evaluator to learn about things theparticipants or staff may be unaware of or that they are unwilling orunable to discuss in an interview or focus group.
When to use observations. Observations can be useful during boththe formative and summative phases of evaluation. For example,during the formative phase, observations can be useful indetermining whether or not the project is being delivered andoperated as planned. In the hypothetical project, observations couldbe used to describe the faculty development sessions, examining theextent to which participants understand the concepts, ask the rightquestions, and are engaged in appropriate interactions. Such
3 COMMON QUALITATIVE
METHODS
3Information on common quantitative methods is provided in the earlier User-Friendly
Handbook for Project Evaluation (NSF 93-152).
Chapter 3.Common Qualitative Methods
3-2
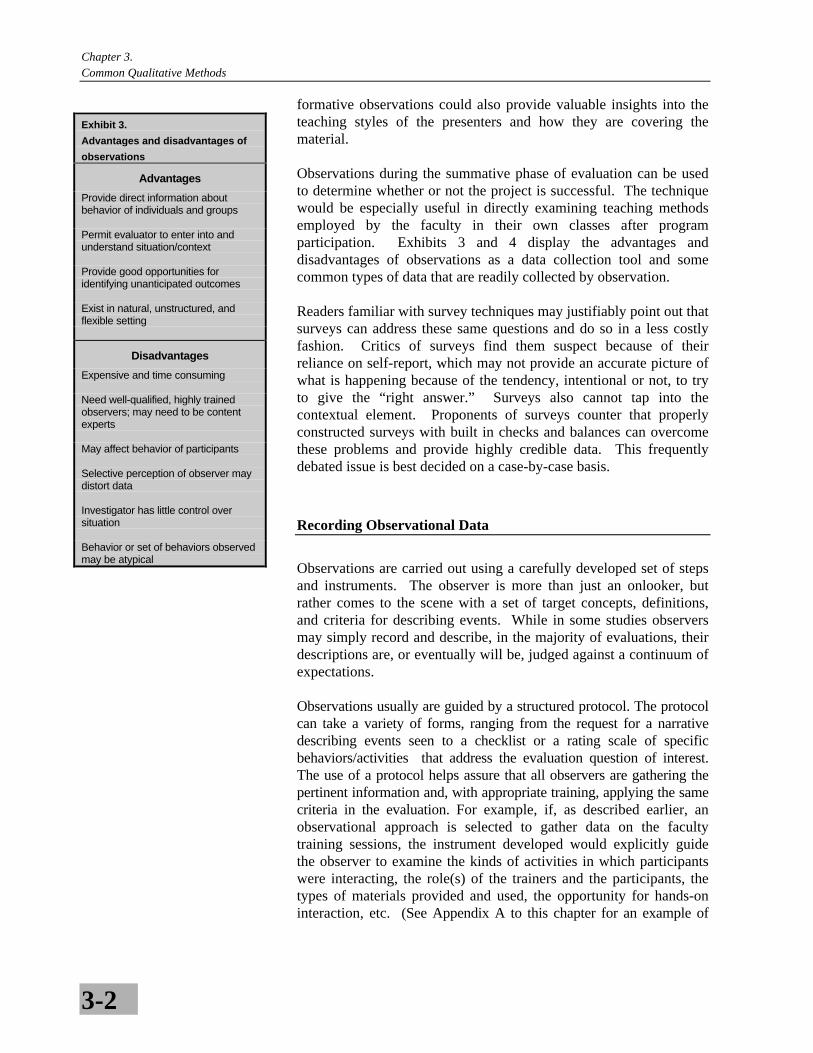
Exhibit 3.
Advantages and disadvantages of
observations
Advantages
Provide direct information aboutbehavior of individuals and groups
Permit evaluator to enter into andunderstand situation/context
Provide good opportunities foridentifying unanticipated outcomes
Exist in natural, unstructured, andflexible setting
Disadvantages
Expensive and time consuming
Need well-qualified, highly trainedobservers; may need to be contentexperts
May affect behavior of participants
Selective perception of observer maydistort data
Investigator has little control oversituation
Behavior or set of behaviors observedmay be atypical
formative observations could also provide valuable insights into theteaching styles of the presenters and how they are covering thematerial.
Observations during the summative phase of evaluation can be usedto determine whether or not the project is successful. The techniquewould be especially useful in directly examining teaching methodsemployed by the faculty in their own classes after programparticipation. Exhibits 3 and 4 display the advantages anddisadvantages of observations as a data collection tool and somecommon types of data that are readily collected by observation.
Readers familiar with survey techniques may justifiably point out thatsurveys can address these same questions and do so in a less costlyfashion. Critics of surveys find them suspect because of theirreliance on self-report, which may not provide an accurate picture ofwhat is happening because of the tendency, intentional or not, to tryto give the “right answer.” Surveys also cannot tap into thecontextual element. Proponents of surveys counter that properlyconstructed surveys with built in checks and balances can overcomethese problems and provide highly credible data. This frequentlydebated issue is best decided on a case-by-case basis.
Recording Observational Data
Observations are carried out using a carefully developed set of stepsand instruments. The observer is more than just an onlooker, butrather comes to the scene with a set of target concepts, definitions,and criteria for describing events. While in some studies observersmay simply record and describe, in the majority of evaluations, theirdescriptions are, or eventually will be, judged against a continuum ofexpectations.
Observations usually are guided by a structured protocol. The protocolcan take a variety of forms, ranging from the request for a narrativedescribing events seen to a checklist or a rating scale of specificbehaviors/activities that address the evaluation question of interest.The use of a protocol helps assure that all observers are gathering thepertinent information and, with appropriate training, applying the samecriteria in the evaluation. For example, if, as described earlier, anobservational approach is selected to gather data on the facultytraining sessions, the instrument developed would explicitly guidethe observer to examine the kinds of activities in which participantswere interacting, the role(s) of the trainers and the participants, thetypes of materials provided and used, the opportunity for hands-oninteraction, etc. (See Appendix A to this chapter for an example of
Chapter 3.Common Qualitative Methods
3-3
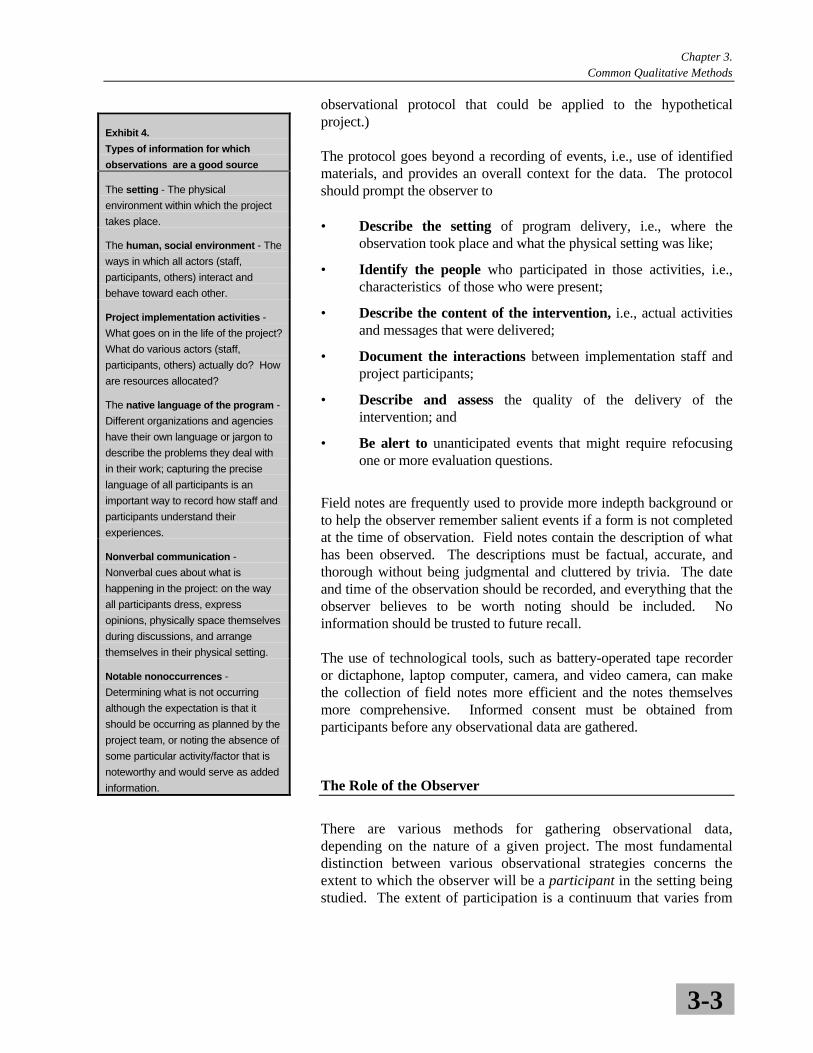
Exhibit 4.
Types of information for which
observations are a good source
The setting - The physical
environment within which the project
takes place.
The human, social environment - The
ways in which all actors (staff,
participants, others) interact and
behave toward each other.
Project implementation activities -
What goes on in the life of the project?
What do various actors (staff,
participants, others) actually do? How
are resources allocated?
The native language of the program -
Different organizations and agencies
have their own language or jargon to
describe the problems they deal with
in their work; capturing the precise
language of all participants is an
important way to record how staff and
participants understand their
experiences.
Nonverbal communication -
Nonverbal cues about what is
happening in the project: on the way
all participants dress, express
opinions, physically space themselves
during discussions, and arrange
themselves in their physical setting.
Notable nonoccurrences -
Determining what is not occurring
although the expectation is that it
should be occurring as planned by the
project team, or noting the absence of
some particular activity/factor that is
noteworthy and would serve as added
information.
observational protocol that could be applied to the hypotheticalproject.)
The protocol goes beyond a recording of events, i.e., use of identifiedmaterials, and provides an overall context for the data. The protocolshould prompt the observer to
• Describe the setting of program delivery, i.e., where theobservation took place and what the physical setting was like;
• Identify the people who participated in those activities, i.e.,characteristics of those who were present;
• Describe the content of the intervention, i.e., actual activitiesand messages that were delivered;
• Document the interactions between implementation staff andproject participants;
• Describe and assess the quality of the delivery of theintervention; and
• Be alert to unanticipated events that might require refocusingone or more evaluation questions.
Field notes are frequently used to provide more indepth background orto help the observer remember salient events if a form is not completedat the time of observation. Field notes contain the description of whathas been observed. The descriptions must be factual, accurate, andthorough without being judgmental and cluttered by trivia. The dateand time of the observation should be recorded, and everything that theobserver believes to be worth noting should be included. Noinformation should be trusted to future recall.
The use of technological tools, such as battery-operated tape recorderor dictaphone, laptop computer, camera, and video camera, can makethe collection of field notes more efficient and the notes themselvesmore comprehensive. Informed consent must be obtained fromparticipants before any observational data are gathered.
The Role of the Observer
There are various methods for gathering observational data,depending on the nature of a given project. The most fundamentaldistinction between various observational strategies concerns theextent to which the observer will be a participant in the setting beingstudied. The extent of participation is a continuum that varies from
Chapter 3.Common Qualitative Methods
3-4
complete involvement in the setting as a full participant to completeseparation from the setting as an outside observer or spectator. Theparticipant observer is fully engaged in experiencing the projectsetting while at the same time trying to understand that settingthrough personal experience, observations, and interactions anddiscussions with other participants. The outside observer standsapart from the setting, attempts to be nonintrusive, and assumes therole of a “fly-on-the-wall.” The extent to which full participation ispossible and desirable will depend on the nature of the project and itsparticipants, the political and social context, the nature of theevaluation questions being asked, and the resources available. “Theideal is to negotiate and adopt that degree of participation that willyield the most meaningful data about the program given thecharacteristics of the participants, the nature of staff-participantinteractions, and the sociopolitical context of the program” (Patton,1990).
In some cases it may be beneficial to have two people observing atthe same time. This can increase the quality of the data by providinga larger volume of data and by decreasing the influence of observerbias. However, in addition to the added cost, the presence of twoobservers may create an environment threatening to those beingobserved and cause them to change their behavior. Studies usingobservation typically employ intensive training experiences to makesure that the observer or observers know what to look for and can, tothe extent possible, operate in an unbiased manner. In long orcomplicated studies, it is useful to check on an observer’sperformance periodically to make sure that accuracy is beingmaintained. The issue of training is a critical one and may make thedifference between a defensible study and what can be challenged as“one person’s perspective.”
A special issue with regard to observations relates to the amount ofobservation needed. While in participant observation this may be amoot point (except with regard to data recording), when an outsideobserver is used, the question of “how much” becomes veryimportant. While most people agree that one observation (a singlehour of a training session or one class period of instruction) is notenough, there is no hard and fast rule regarding how many samplesneed to be drawn. General tips to consider are to avoid atypicalsituations, carry out observations more than one time, and (wherepossible and relevant) spread the observations out over time.
Participant observation is often difficult to incorporate in evaluations;therefore, the use of outside observers is far more common. In thehypothetical project, observations might be scheduled for all trainingsessions and for a sample of classrooms, including some wherefaculty members who participated in training were teaching and somestaffed by teachers who had not participated in the training.
The most fundamentaldistinction
between variousobservational strategiesconcerns the extent towhich the observer willbe a participant in thesetting being studied.
Chapter 3.Common Qualitative Methods
3-5
Issues of privacy and access. Observational techniques are perhapsthe most privacy-threatening data collection technique for staff and, toa lesser extent, participants. Staff fear that the data may be included intheir performance evaluations and may have effects on their careers.Participants may also feel uncomfortable assuming that they are beingjudged. Evaluators need to assure everyone that evaluations ofperformance are not the purpose of the effort, and that no such reportswill result from the observations. Additionally, because mosteducational settings are subject to a constant flow of observers fromvarious organizations, there is often great reluctance to grant access toadditional observers. Much effort may be needed to assure project staffand participants that they will not be adversely affected by theevaluators’ work and to negotiate observer access to specific sites.
Interviews
Interviews provide very different data from observations: they allowthe evaluation team to capture the perspectives of project participants,staff, and others associated with the project. In the hypotheticalexample, interviews with project staff can provide information on theearly stages of the implementation and problems encountered. The useof interviews as a data collection method begins with the assumptionthat the participants’ perspectives are meaningful, knowable, and ableto be made explicit, and that their perspectives affect the success of theproject. An interview, rather than a paper and pencil survey, is selectedwhen interpersonal contact is important and when opportunities forfollowup of interesting comments are desired.
Two types of interviews are used in evaluation research: structuredinterviews, in which a carefully worded questionnaire is administered;and indepth interviews, in which the interviewer does not follow a rigidform. In the former, the emphasis is on obtaining answers to carefullyphrased questions. Interviewers are trained to deviate only minimallyfrom the question wording to ensure uniformity of interviewadministration. In the latter, however, the interviewers seek toencourage free and open responses, and there may be a tradeoffbetween comprehensive coverage of topics and indepth exploration of amore limited set of questions. Indepth interviews also encouragecapturing of respondents’ perceptions in their own words, a verydesirable strategy in qualitative data collection. This allows theevaluator to present the meaningfulness of the experience from therespondent’s perspective. Indepth interviews are conducted withindividuals or with a small group of individuals.4
4 A special case of the group interview is called a focus group. Although we discuss focus groups
separately, several of the exhibits in this section will refer to both forms of data collection becauseof their similarities.
Interviews allowthe evaluation team
to capture theperspectives of projectparticipants, staff, and
others associatedwith the project.
Chapter 3.Common Qualitative Methods
3-6
Indepth interviews. An indepth interview is a dialogue between askilled interviewer and an interviewee. Its goal is to elicit rich, detailedmaterial that can be used in analysis (Lofland and Lofland, 1995).Such interviews are best conducted face to face, although in somesituations telephone interviewing can be successful.
Indepth interviews are characterized by extensive probing and open-ended questions. Typically, the project evaluator prepares an interviewguide that includes a list of questions or issues that are to be exploredand suggested probes for following up on key topics. The guide helpsthe interviewer pace the interview and make interviewing moresystematic and comprehensive. Lofland and Lofland (1995) provideguidelines for preparing interview guides, doing the interview with theguide, and writing up the interview. Appendix B to this chaptercontains an example of the types of interview questions that could beasked during the hypothetical study.
The dynamics of interviewing are similar to a guided conversation.The interviewer becomes an attentive listener who shapes the processinto a familiar and comfortable form of social engagement—aconversation—and the quality of the information obtained is largelydependent on the interviewer’s skills and personality (Patton, 1990). Incontrast to a good conversation, however, an indepth interview is notintended to be a two-way form of communication and sharing. The keyto being a good interviewer is being a good listener and questioner.Tempting as it may be, it is not the role of the interviewer to put forthhis or her opinions, perceptions, or feelings. Interviewers should betrained individuals who are sensitive, empathetic, and able to establisha nonthreatening environment in which participants feel comfortable.They should be selected during a process that weighs personalcharacteristics that will make them acceptable to the individuals beinginterviewed; clearly, age, sex, profession, race/ethnicity, andappearance may be key characteristics. Thorough training, includingfamiliarization with the project and its goals, is important. Poorinterviewing skills, poor phrasing of questions, or inadequateknowledge of the subject’s culture or frame of reference may result in acollection that obtains little useful data.
When to use indepth interviews. Indepth interviews can be used atany stage of the evaluation process. They are especially useful inanswering questions such as those suggested by Patton (1990):
• What does the program look and feel like to the participants? Toother stakeholders?
• What are the experiences of program participants?
Indepth interviews arecharacterized by
extensive probing andopen-ended questions.
Chapter 3.Common Qualitative Methods
3-7
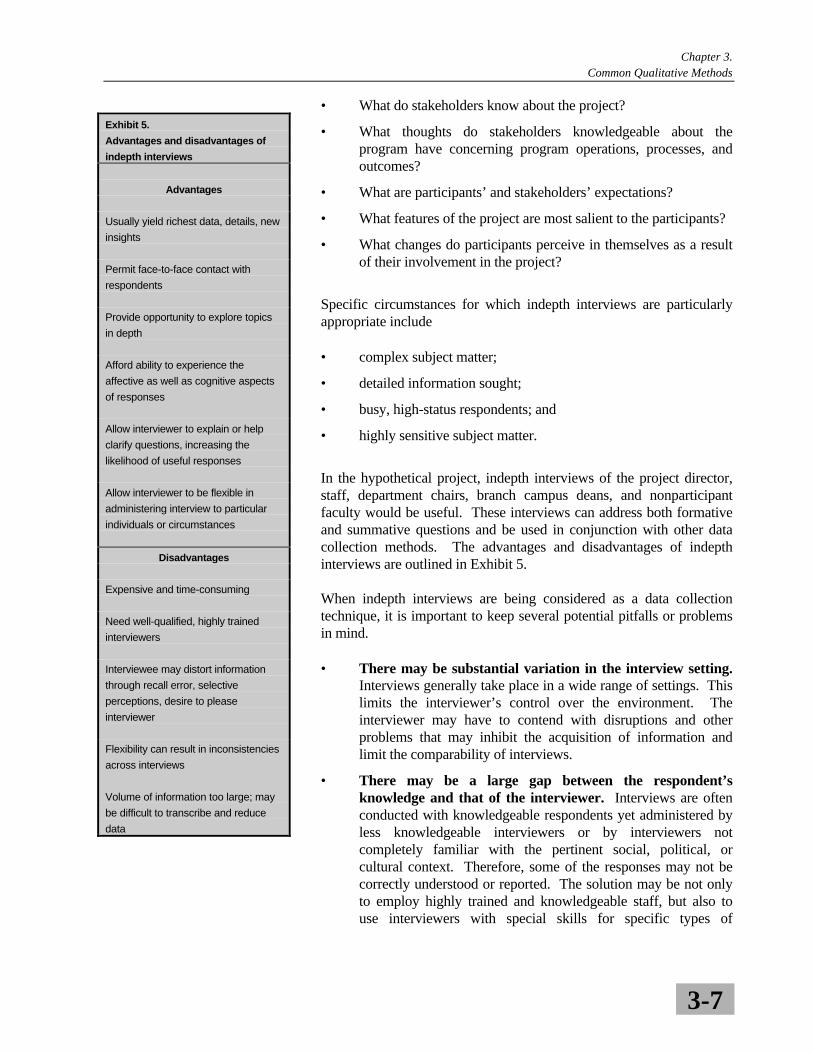
Exhibit 5.
Advantages and disadvantages of
indepth interviews
Advantages
Usually yield richest data, details, new
insights
Permit face-to-face contact with
respondents
Provide opportunity to explore topics
in depth
Afford ability to experience the
affective as well as cognitive aspects
of responses
Allow interviewer to explain or help
clarify questions, increasing the
likelihood of useful responses
Allow interviewer to be flexible in
administering interview to particular
individuals or circumstances
Disadvantages
Expensive and time-consuming
Need well-qualified, highly trained
interviewers
Interviewee may distort information
through recall error, selective
perceptions, desire to please
interviewer
Flexibility can result in inconsistencies
across interviews
Volume of information too large; may
be difficult to transcribe and reduce
data
• What do stakeholders know about the project?
• What thoughts do stakeholders knowledgeable about theprogram have concerning program operations, processes, andoutcomes?
• What are participants’ and stakeholders’ expectations?
• What features of the project are most salient to the participants?
• What changes do participants perceive in themselves as a resultof their involvement in the project?
Specific circumstances for which indepth interviews are particularlyappropriate include
• complex subject matter;
• detailed information sought;
• busy, high-status respondents; and
• highly sensitive subject matter.
In the hypothetical project, indepth interviews of the project director,staff, department chairs, branch campus deans, and nonparticipantfaculty would be useful. These interviews can address both formativeand summative questions and be used in conjunction with other datacollection methods. The advantages and disadvantages of indepthinterviews are outlined in Exhibit 5.
When indepth interviews are being considered as a data collectiontechnique, it is important to keep several potential pitfalls or problemsin mind.
• There may be substantial variation in the interview setting.Interviews generally take place in a wide range of settings. Thislimits the interviewer’s control over the environment. Theinterviewer may have to contend with disruptions and otherproblems that may inhibit the acquisition of information andlimit the comparability of interviews.
• There may be a large gap between the respondent’sknowledge and that of the interviewer. Interviews are oftenconducted with knowledgeable respondents yet administered byless knowledgeable interviewers or by interviewers notcompletely familiar with the pertinent social, political, orcultural context. Therefore, some of the responses may not becorrectly understood or reported. The solution may be not onlyto employ highly trained and knowledgeable staff, but also touse interviewers with special skills for specific types of
Chapter 3.Common Qualitative Methods
3-8
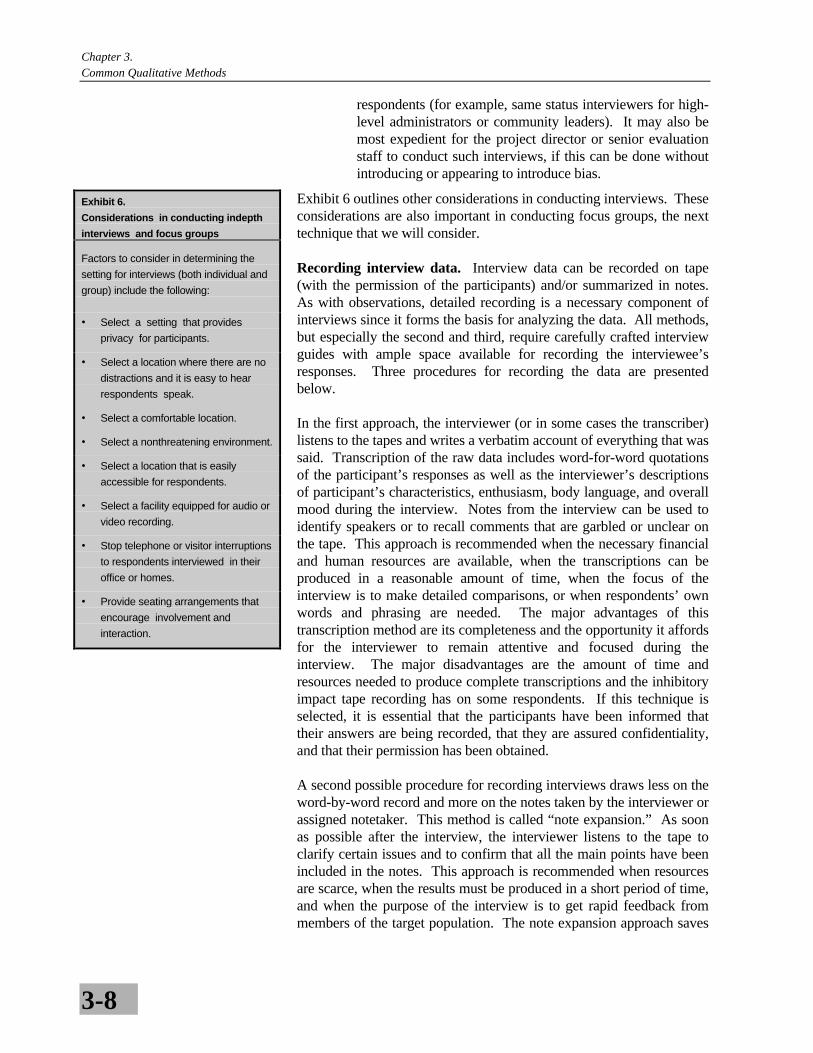
Exhibit 6.
Considerations in conducting indepth
interviews and focus groups
Factors to consider in determining the
setting for interviews (both individual and
group) include the following:
• Select a setting that provides
privacy for participants.
• Select a location where there are no
distractions and it is easy to hear
respondents speak.
• Select a comfortable location.
• Select a nonthreatening environment.
• Select a location that is easily
accessible for respondents.
• Select a facility equipped for audio or
video recording.
• Stop telephone or visitor interruptions
to respondents interviewed in their
office or homes.
• Provide seating arrangements that
encourage involvement and
interaction.
respondents (for example, same status interviewers for high-level administrators or community leaders). It may also bemost expedient for the project director or senior evaluationstaff to conduct such interviews, if this can be done withoutintroducing or appearing to introduce bias.
Exhibit 6 outlines other considerations in conducting interviews. Theseconsiderations are also important in conducting focus groups, the nexttechnique that we will consider.
Recording interview data. Interview data can be recorded on tape(with the permission of the participants) and/or summarized in notes.As with observations, detailed recording is a necessary component ofinterviews since it forms the basis for analyzing the data. All methods,but especially the second and third, require carefully crafted interviewguides with ample space available for recording the interviewee’sresponses. Three procedures for recording the data are presentedbelow.
In the first approach, the interviewer (or in some cases the transcriber)listens to the tapes and writes a verbatim account of everything that wassaid. Transcription of the raw data includes word-for-word quotationsof the participant’s responses as well as the interviewer’s descriptionsof participant’s characteristics, enthusiasm, body language, and overallmood during the interview. Notes from the interview can be used toidentify speakers or to recall comments that are garbled or unclear onthe tape. This approach is recommended when the necessary financialand human resources are available, when the transcriptions can beproduced in a reasonable amount of time, when the focus of theinterview is to make detailed comparisons, or when respondents’ ownwords and phrasing are needed. The major advantages of thistranscription method are its completeness and the opportunity it affordsfor the interviewer to remain attentive and focused during theinterview. The major disadvantages are the amount of time andresources needed to produce complete transcriptions and the inhibitoryimpact tape recording has on some respondents. If this technique isselected, it is essential that the participants have been informed thattheir answers are being recorded, that they are assured confidentiality,and that their permission has been obtained.
A second possible procedure for recording interviews draws less on theword-by-word record and more on the notes taken by the interviewer orassigned notetaker. This method is called “note expansion.” As soonas possible after the interview, the interviewer listens to the tape toclarify certain issues and to confirm that all the main points have beenincluded in the notes. This approach is recommended when resourcesare scarce, when the results must be produced in a short period of time,and when the purpose of the interview is to get rapid feedback frommembers of the target population. The note expansion approach saves
Chapter 3.Common Qualitative Methods
3-9
time and retains all the essential points of the discussion. In addition tothe drawbacks pointed out above, a disadvantage is that the interviewermay be more selective or biased in what he or she writes.
In the third approach, the interviewer uses no tape recording, butinstead takes detailed notes during the interview and draws on memoryto expand and clarify the notes immediately after the interview. Thisapproach is useful if time is short, the results are needed quickly, andthe evaluation questions are simple. Where more complex questionsare involved, effective note-taking can be achieved, but only after muchpractice. Further, the interviewer must frequently talk and write at thesame time, a skill that is hard for some to achieve.
Focus Groups
Focus groups combine elements of both interviewing and participantobservation. The focus group session is, indeed, an interview (Patton,1990) not a discussion group, problem-solving session, or decision-making group. At the same time, focus groups capitalize on groupdynamics. The hallmark of focus groups is the explicit use of the groupinteraction to generate data and insights that would be unlikely toemerge without the interaction found in a group. The techniqueinherently allows observation of group dynamics, discussion, andfirsthand insights into the respondents’ behaviors, attitudes, language,etc.
Focus groups are a gathering of 8 to 12 people who share somecharacteristics relevant to the evaluation. Originally used as a marketresearch tool to investigate the appeal of various products, the focusgroup technique has been adopted by other fields, such as education, asa tool for data gathering on a given topic. Focus groups conducted byexperts take place in a focus group facility that includes recordingapparatus (audio and/or visual) and an attached room with a one-waymirror for observation. There is an official recorder who may or maynot be in the room. Participants are paid for attendance and providedwith refreshments. As the focus group technique has been adopted byfields outside of marketing, some of these features, such as payment orrefreshment, have been eliminated.
When to use focus groups. When conducting evaluations, focusgroups are useful in answering the same type of questions as indepthinterviews, except in a social context. Specific applications of thefocus group method in evaluations include
• identifying and defining problems in project implementation;
Chapter 3.Common Qualitative Methods
3-10
• identifying project strengths, weaknesses, and recommendations;
• assisting with interpretation of quantitative findings;5
• obtaining perceptions of project outcomes and impacts; and
• generating new ideas.
In the hypothetical project, focus groups could be conducted withproject participants to collect perceptions of project implementationand operation (e.g., Were the workshops staffed appropriately? Werethe presentations suitable for all participants?), as well as progresstoward objectives during the formative phase of evaluation (Didparticipants exchange information by e-mail and other means?). Focusgroups could also be used to collect data on project outcomes andimpact during the summative phase of evaluation (e.g., Were changesmade in the curriculum? Did students taught by participants appear tobecome more interested in class work? What barriers did theparticipants face in applying what they had been taught?).
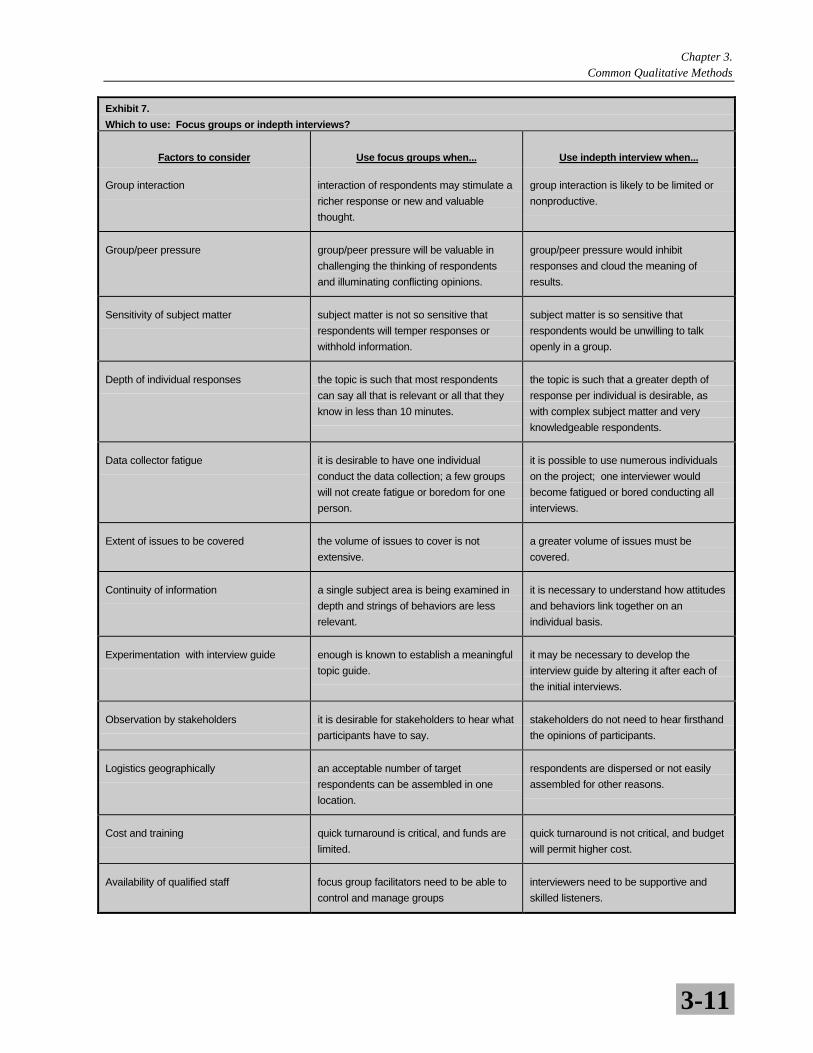
Although focus groups and indepth interviews share manycharacteristics, they should not be used interchangeably. Factors toconsider when choosing between focus groups and indepth interviewsare included in Exhibit 7.
Developing a Focus Group
An important aspect of conducting focus groups is the topic guide.(See Appendix C to this chapter for a sample guide applied to thehypothetical project.) The topic guide, a list of topics or question areas,serves as a summary statement of the issues and objectives to becovered by the focus group. The topic guide also serves as a road mapand as a memory aid for the focus group leader, called a “moderator.”The topic guide also provides the initial outline for the report offinding.
Focus group participants are typically asked to reflect on the questionsasked by the moderator. Participants are permitted to hear each other’sresponses and to make additional comments beyond their own originalresponses as they hear what other people have to say. It is notnecessary for the group to reach any kind of consensus, nor it isnecessary for people to disagree. The moderator must keep the
5 Survey developers also frequently use focus groups to pretest topics or ideas that later will be
used for quantitative data collection. In such cases, the data obtained are considered part ofinstrument development rather than findings. Qualitative evaluators feel that this is toolimited an application and that the technique has broader utility.
Focus groups andindepth interviewsshould not be usedinterchangeably.
Chapter 3.Common Qualitative Methods
3-11
Exhibit 7.
Which to use: Focus groups or indepth interviews?
Factors to consider Use focus groups when... Use indepth interview when...
Group interaction interaction of respondents may stimulate a
richer response or new and valuable
thought.
group interaction is likely to be limited or
nonproductive.
Group/peer pressure group/peer pressure will be valuable in
challenging the thinking of respondents
and illuminating conflicting opinions.
group/peer pressure would inhibit
responses and cloud the meaning of
results.
Sensitivity of subject matter subject matter is not so sensitive that
respondents will temper responses or
withhold information.
subject matter is so sensitive that
respondents would be unwilling to talk
openly in a group.
Depth of individual responses the topic is such that most respondents
can say all that is relevant or all that they
know in less than 10 minutes.
the topic is such that a greater depth of
response per individual is desirable, as
with complex subject matter and very
knowledgeable respondents.
Data collector fatigue it is desirable to have one individual
conduct the data collection; a few groups
will not create fatigue or boredom for one
person.
it is possible to use numerous individuals
on the project; one interviewer would
become fatigued or bored conducting all
interviews.
Extent of issues to be covered the volume of issues to cover is not
extensive.
a greater volume of issues must be
covered.
Continuity of information a single subject area is being examined in
depth and strings of behaviors are less
relevant.
it is necessary to understand how attitudes
and behaviors link together on an
individual basis.
Experimentation with interview guide enough is known to establish a meaningful
topic guide.
it may be necessary to develop the
interview guide by altering it after each of
the initial interviews.
Observation by stakeholders it is desirable for stakeholders to hear what
participants have to say.
stakeholders do not need to hear firsthand
the opinions of participants.
Logistics geographically an acceptable number of target
respondents can be assembled in one
location.
respondents are dispersed or not easily
assembled for other reasons.
Cost and training quick turnaround is critical, and funds are
limited.
quick turnaround is not critical, and budget
will permit higher cost.
Availability of qualified staff focus group facilitators need to be able to
control and manage groups
interviewers need to be supportive and
skilled listeners.
Chapter 3.Common Qualitative Methods
3-12
discussion flowing and make sure that one or two persons do notdominate the discussion. As a rule, the focus group session should notlast longer than 1 1/2 to 2 hours. When very specific information isrequired, the session may be as short as 40 minutes. The objective is toget high-quality data in a social context where people can consider theirown views in the context of the views of others, and where new ideasand perspectives can be introduced.
The participants are usually a relatively homogeneous group of people.Answering the question, “Which respondent variables representrelevant similarities among the target population?” requires somethoughtful consideration when planning the evaluation. Respondents’social class, level of expertise, age, cultural background, and sex shouldalways be considered. There is a sharp division among focus groupmoderators regarding the effectiveness of mixing sexes within a group,although most moderators agree that it is acceptable to mix the sexeswhen the discussion topic is not related to or affected by sexstereotypes.
Determining how many groups are needed requires balancing cost andinformation needs. A focus group can be fairly expensive, costing$10,000 to $20,000 depending on the type of physical facilities needed,the effort it takes to recruit participants, and the complexity of thereports required. A good rule of thumb is to conduct at least two groupsfor every variable considered to be relevant to the outcome (sex, age,educational level, etc.). However, even when several groups aresampled, conclusions typically are limited to the specific individualsparticipating in the focus group. Unless the study population isextremely small, it is not possible to generalize from focus group data.
Recording focus group data. The procedures for recording a focusgroup session are basically the same as those used for indepthinterviews. However, the focus group approach lends itself to morecreative and efficient procedures. If the evaluation team does use afocus group room with a one-way mirror, a colleague can take notesand record observations. An advantage of this approach is that theextra individual is not in the view of participants and, therefore, notinterfering with the group process. If a one-way mirror is not apossibility, the moderator may have a colleague present in the room totake notes and to record observations. A major advantage of theseapproaches is that the recorder focuses on observing and taking notes,while the moderator concentrates on asking questions, facilitating thegroup interaction, following up on ideas, and making smoothtransitions from issue to issue. Furthermore, like observations, focusgroups can be videotaped. These approaches allow for confirmation ofwhat was seen and heard. Whatever the approach to gathering detaileddata, informed consent is necessary and confidentiality should beassured.
Chapter 3.Common Qualitative Methods
3-13
Having highlighted the similarities between interviews and focusgroups, it is important to also point out one critical difference. In focusgroups, group dynamics are especially important. The notes, andresultant report, should include comments on group interaction anddynamics as they inform the questions under study.
Other Qualitative Methods
The last section of this chapter outlines less common but, nonetheless,potentially useful qualitative methods for project evaluation. Thesemethods include document studies, key informants, alternative(authentic) assessment, and case studies.
Document Studies
Existing records often provide insights into a setting and/or group ofpeople that cannot be observed or noted in another way. Thisinformation can be found in document form. Lincoln and Guba (1985)defined a document as “any written or recorded material” not preparedfor the purposes of the evaluation or at the request of the inquirer.Documents can be divided into two major categories: public records,and personal documents (Guba and Lincoln, 1981).
Public records are materials created and kept for the purpose of“attesting to an event or providing an accounting” (Lincoln and Guba,1985). Public records can be collected from outside (external) orwithin (internal) the setting in which the evaluation is taking place.Examples of external records are census and vital statistics reports,county office records, newspaper archives, and local business recordsthat can assist an evaluator in gathering information about the largercommunity and relevant trends. Such materials can be helpful in betterunderstanding the project participants and making comparisonsbetween groups/communities.
For the evaluation of educational innovations, internal records includedocuments such as student transcripts and records, historical accounts,institutional mission statements, annual reports, budgets, grade andstandardized test reports, minutes of meetings, internal memoranda,policy manuals, institutional histories, college/university catalogs,faculty and student handbooks, official correspondence, demographicmaterial, mass media reports and presentations, and descriptions ofprogram development and evaluation. They are particularly useful indescribing institutional characteristics, such as backgrounds andacademic performance of students, and in identifying institutionalstrengths and weaknesses. They can help the evaluator understand the
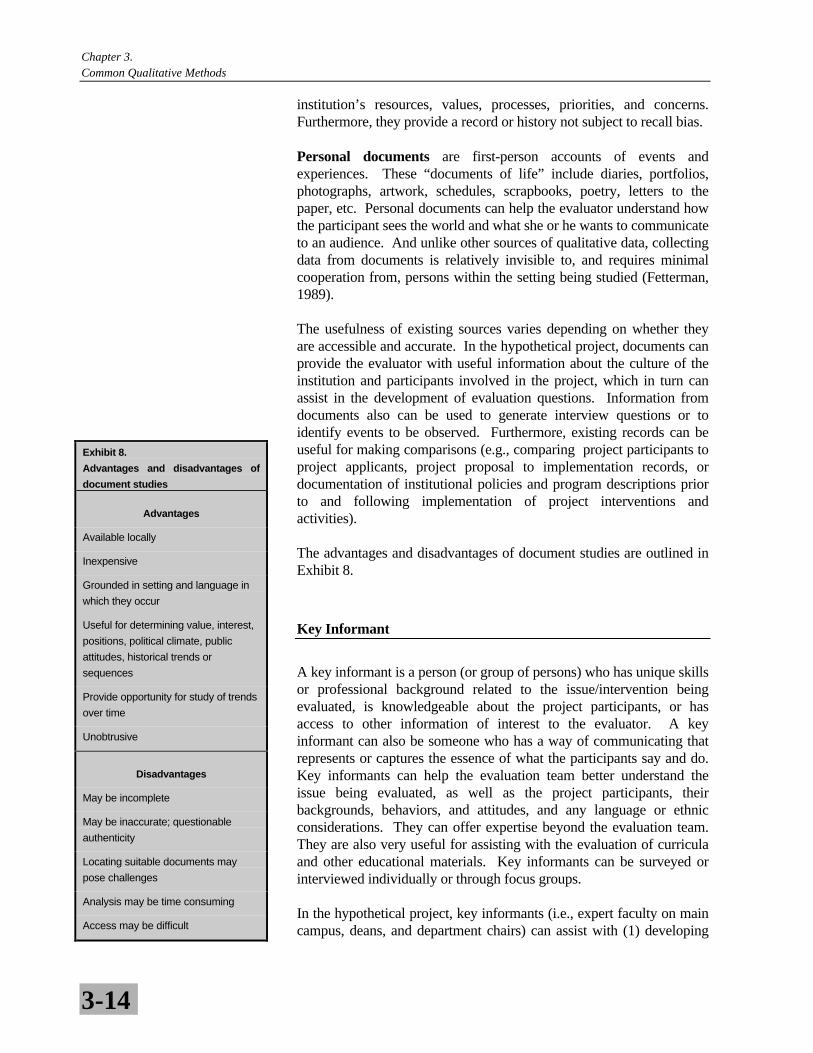
Chapter 3.Common Qualitative Methods
3-14
Exhibit 8.
Advantages and disadvantages of
document studies
Advantages
Available locally
Inexpensive
Grounded in setting and language in
which they occur
Useful for determining value, interest,
positions, political climate, public
attitudes, historical trends or
sequences
Provide opportunity for study of trends
over time
Unobtrusive
Disadvantages
May be incomplete
May be inaccurate; questionable
authenticity
Locating suitable documents may
pose challenges
Analysis may be time consuming
Access may be difficult
institution’s resources, values, processes, priorities, and concerns.Furthermore, they provide a record or history not subject to recall bias.
Personal documents are first-person accounts of events andexperiences. These “documents of life” include diaries, portfolios,photographs, artwork, schedules, scrapbooks, poetry, letters to thepaper, etc. Personal documents can help the evaluator understand howthe participant sees the world and what she or he wants to communicateto an audience. And unlike other sources of qualitative data, collectingdata from documents is relatively invisible to, and requires minimalcooperation from, persons within the setting being studied (Fetterman,1989).
The usefulness of existing sources varies depending on whether theyare accessible and accurate. In the hypothetical project, documents canprovide the evaluator with useful information about the culture of theinstitution and participants involved in the project, which in turn canassist in the development of evaluation questions. Information fromdocuments also can be used to generate interview questions or toidentify events to be observed. Furthermore, existing records can beuseful for making comparisons (e.g., comparing project participants toproject applicants, project proposal to implementation records, ordocumentation of institutional policies and program descriptions priorto and following implementation of project interventions andactivities).
The advantages and disadvantages of document studies are outlined inExhibit 8.
Key Informant
A key informant is a person (or group of persons) who has unique skillsor professional background related to the issue/intervention beingevaluated, is knowledgeable about the project participants, or hasaccess to other information of interest to the evaluator. A keyinformant can also be someone who has a way of communicating thatrepresents or captures the essence of what the participants say and do.Key informants can help the evaluation team better understand theissue being evaluated, as well as the project participants, theirbackgrounds, behaviors, and attitudes, and any language or ethnicconsiderations. They can offer expertise beyond the evaluation team.They are also very useful for assisting with the evaluation of curriculaand other educational materials. Key informants can be surveyed orinterviewed individually or through focus groups.
In the hypothetical project, key informants (i.e., expert faculty on maincampus, deans, and department chairs) can assist with (1) developing
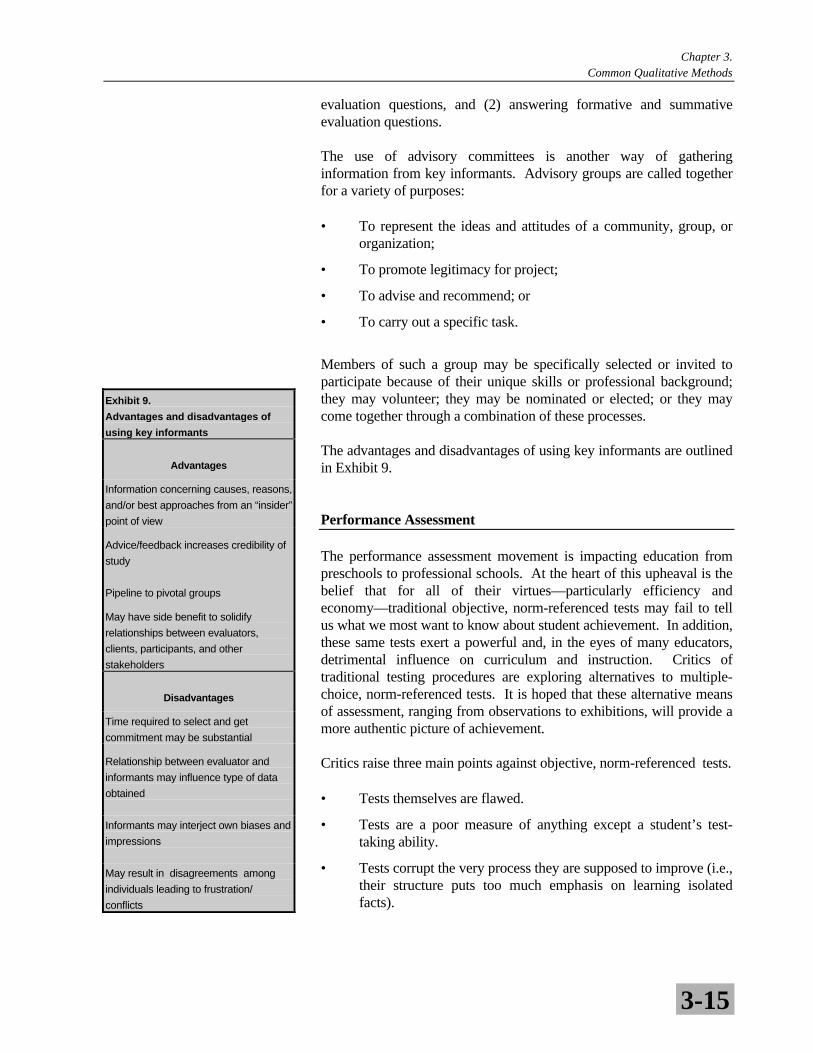
Chapter 3.Common Qualitative Methods
3-15
Exhibit 9.
Advantages and disadvantages of
using key informants
Advantages
Information concerning causes, reasons,
and/or best approaches from an “insider”
point of view
Advice/feedback increases credibility of
study
Pipeline to pivotal groups
May have side benefit to solidify
relationships between evaluators,
clients, participants, and other
stakeholders
Disadvantages
Time required to select and get
commitment may be substantial
Relationship between evaluator and
informants may influence type of data
obtained
Informants may interject own biases and
impressions
May result in disagreements among
individuals leading to frustration/
conflicts
evaluation questions, and (2) answering formative and summativeevaluation questions.
The use of advisory committees is another way of gatheringinformation from key informants. Advisory groups are called togetherfor a variety of purposes:
• To represent the ideas and attitudes of a community, group, ororganization;
• To promote legitimacy for project;
• To advise and recommend; or
• To carry out a specific task.
Members of such a group may be specifically selected or invited toparticipate because of their unique skills or professional background;they may volunteer; they may be nominated or elected; or they maycome together through a combination of these processes.
The advantages and disadvantages of using key informants are outlinedin Exhibit 9.
Performance Assessment
The performance assessment movement is impacting education frompreschools to professional schools. At the heart of this upheaval is thebelief that for all of their virtues—particularly efficiency andeconomy—traditional objective, norm-referenced tests may fail to tellus what we most want to know about student achievement. In addition,these same tests exert a powerful and, in the eyes of many educators,detrimental influence on curriculum and instruction. Critics oftraditional testing procedures are exploring alternatives to multiple-choice, norm-referenced tests. It is hoped that these alternative meansof assessment, ranging from observations to exhibitions, will provide amore authentic picture of achievement.
Critics raise three main points against objective, norm-referenced tests.
• Tests themselves are flawed.
• Tests are a poor measure of anything except a student’s test-taking ability.
• Tests corrupt the very process they are supposed to improve (i.e.,their structure puts too much emphasis on learning isolatedfacts).
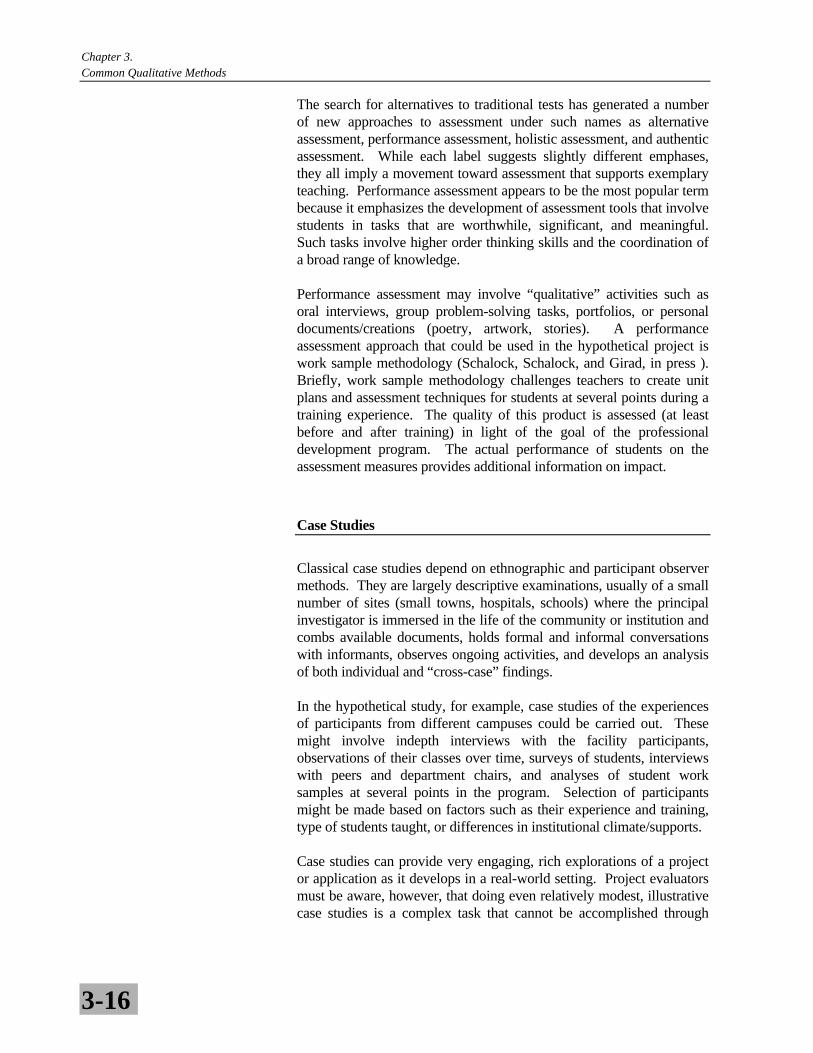
Chapter 3.Common Qualitative Methods
3-16
The search for alternatives to traditional tests has generated a numberof new approaches to assessment under such names as alternativeassessment, performance assessment, holistic assessment, and authenticassessment. While each label suggests slightly different emphases,they all imply a movement toward assessment that supports exemplaryteaching. Performance assessment appears to be the most popular termbecause it emphasizes the development of assessment tools that involvestudents in tasks that are worthwhile, significant, and meaningful.Such tasks involve higher order thinking skills and the coordination ofa broad range of knowledge.
Performance assessment may involve “qualitative” activities such asoral interviews, group problem-solving tasks, portfolios, or personaldocuments/creations (poetry, artwork, stories). A performanceassessment approach that could be used in the hypothetical project iswork sample methodology (Schalock, Schalock, and Girad, in press ).Briefly, work sample methodology challenges teachers to create unitplans and assessment techniques for students at several points during atraining experience. The quality of this product is assessed (at leastbefore and after training) in light of the goal of the professionaldevelopment program. The actual performance of students on theassessment measures provides additional information on impact.
Case Studies
Classical case studies depend on ethnographic and participant observermethods. They are largely descriptive examinations, usually of a smallnumber of sites (small towns, hospitals, schools) where the principalinvestigator is immersed in the life of the community or institution andcombs available documents, holds formal and informal conversationswith informants, observes ongoing activities, and develops an analysisof both individual and “cross-case” findings.
In the hypothetical study, for example, case studies of the experiencesof participants from different campuses could be carried out. Thesemight involve indepth interviews with the facility participants,observations of their classes over time, surveys of students, interviewswith peers and department chairs, and analyses of student worksamples at several points in the program. Selection of participantsmight be made based on factors such as their experience and training,type of students taught, or differences in institutional climate/supports.
Case studies can provide very engaging, rich explorations of a projector application as it develops in a real-world setting. Project evaluatorsmust be aware, however, that doing even relatively modest, illustrativecase studies is a complex task that cannot be accomplished through
Chapter 3.Common Qualitative Methods
3-17
occasional, brief site visits. Demands with regard to design, datacollection, and reporting can be substantial.
For those wanting to become thoroughly familiar with this topic, anumber of relevant texts are referenced here.
References
Fetterman, D.M. (1989). Ethnography: Step by Step. AppliedSocial Research Methods Series, Vol. 17. Newbury Park, CA:Sage.
Guba, E.G., and Lincoln, Y.S. (1981). Effective Evaluation. SanFrancisco: Jossey-Bass.
Lincoln, Y.S., and Guba, E.G. (1985). Naturalistic Inquiry. BeverlyHills, CA: Sage.
Lofland, J., and Lofland, L.H. (1995). Analyzing Social Settings: AGuide to Qualitative Observation and Analysis, 3rd Ed.Belmont, CA: Wadsworth.
Patton, M.Q. (1990). Qualitative Evaluation and Research Methods,2nd Ed. Newbury Park, CA: Sage.
Schalock, H.D., Schalock, M.D., and Girad, G.R. (In press). Teacherwork sample methodology, as used at Western Oregon StateCollege. In J. Millman, Ed., Assuring Accountability? UsingGains in Student Learning to Evaluate Teachers and Schools.Newbury Park, CA: Corwin.
Other Recommended Reading
Debus, M. (1995). Methodological Review: A Handbook forExcellence in Focus Group Research. Washington, DC:Academy for Educational Development.
Denzin, N.K., and Lincoln, Y.S. (Eds.). (1994). Handbook ofQualitative Research. Thousand Oaks, CA: Sage.
Erlandson, D.A., Harris, E.L., Skipper, B.L., and Allen, D. (1993).Doing Naturalist Inquiry: A Guide to Methods. NewburyPark, CA: Sage.
Greenbaum, T.L. (1993). The Handbook of Focus Group Research.New York: Lexington Books.
Chapter 3.Common Qualitative Methods
3-18
Hart, D. (1994). Authentic Assessment: A Handbook for Educators.Menlo Park, CA: Addison-Wesley.
Herman, J.L., and Winters, L. (1992). Tracking Your School’sSuccess: A Guide to Sensible Evaluation. Newbury Park, CA:Corwin Press.
Hymes, D.L., Chafin, A.E., and Gondor, R. (1991). The ChangingFace of Testing and Assessment: Problems and Solutions.Arlington, VA: American Association of SchoolAdministrators.
Krueger, R.A. (1988). Focus Groups: A Practical Guide forApplied Research. Newbury Park, CA: Sage.
LeCompte, M.D., Millroy, W.L., and Preissle, J. (Eds.). (1992). TheHandbook of Qualitative Research in Education. San Diego,CA: Academic Press.
Merton, R.K., Fiske, M., and Kendall, P.L. (1990). The FocusedInterview: A Manual of Problems and Procedures, 2nd Ed.New York: The Free Press.
Miles, M.B., and Huberman, A.M. (1994). Qualitative DataAnalysis: An Expanded Sourcebook. Thousand Oaks, CA:Sage.
Morgan, D.L. (Ed.). (1993). Successful Focus Groups: Advancingthe State of the Art. Newbury Park, CA: Sage.
Morse, J.M. (Ed.). (1994). Critical Issues in Qualitative ResearchMethods. Thousand Oaks, CA: Sage.
Perrone, V. (Ed.). (1991). Expanding Student Assessment.Alexandria, VA: Association for Supervision and CurriculumDevelopment.
Reich, R.B. (1991). The Work of Nations. New York: Alfred A.Knopf.
Schatzman, L., and Strauss, A.L. (1973). Field Research.Englewood Cliffs, NJ: Prentice-Hall.
Seidman, I.E. (1991). Interviewing as Qualitative Research: AGuide for Researchers in Education and Social Sciences. NewYork: Teachers College Press.
Stewart, D.W., and Shamdasani, P.N. (1990). Focus Groups:Theory and Practice. Newbury Park, CA: Sage.

Chapter 3.Common Qualitative Methods
3-19
United States General Accounting Office (GAO). (1990). CaseStudy Evaluations, Paper 10.1.9. Washington, DC: GAO.
Weiss, R.S. (1994). Learning from Strangers: The Art and Methodof Qualitative Interview Studies. New York: Free Press.
Wiggins, G. (1989). A True Test: Toward More Authentic andEquitable Assessment. Phi Delta Kappan, May, 703-704.
Wiggins, G. (1989). Teaching to the (Authentic) Test. EducationalLeadership, 46, 45.
Yin, R.K. (1989). Case Study Research: Design and Method.Newbury Park, CA: Sage.

A-1
Appendix A
Sample Observation Instrumenti
i Developed from Weiss, Iris, 1997 Local Systemic Change Observation Protocol.
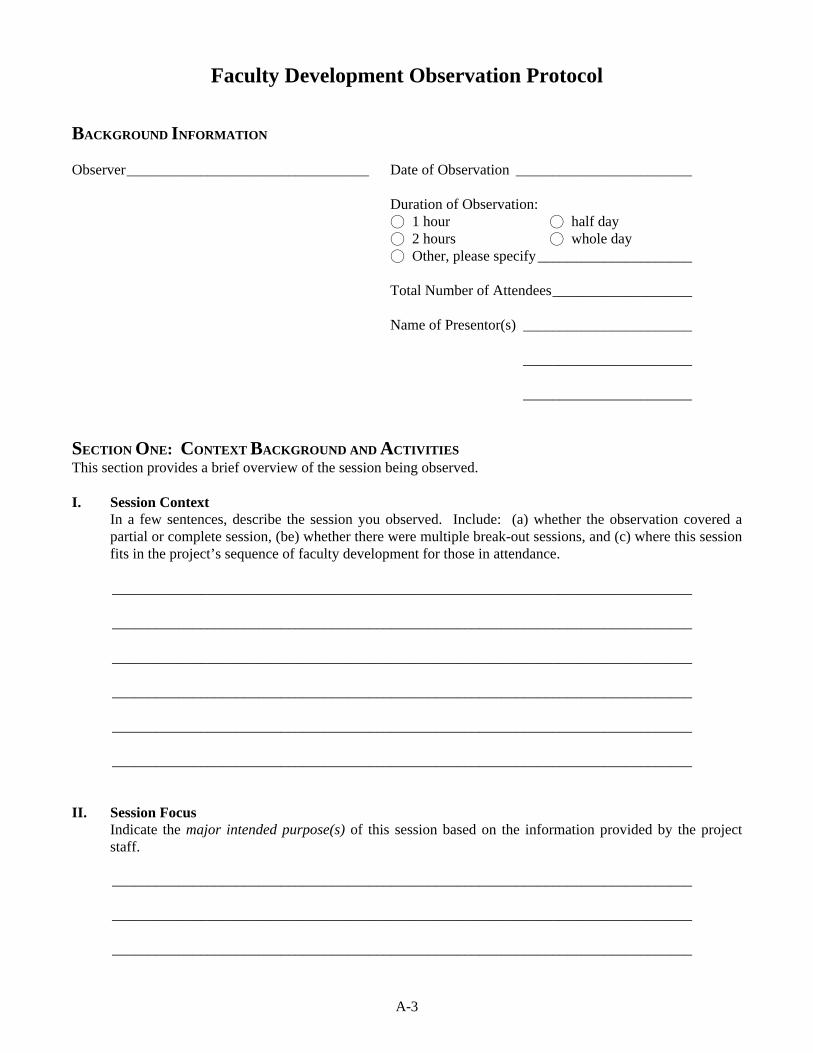
A-3
Faculty Development Observation Protocol
BACKGROUND INFORMATION
Observer_________________________________ Date of Observation ________________________
Duration of Observation:± 1 hour ± half day± 2 hours ± whole day± Other, please specify _____________________
Total Number of Attendees___________________
Name of Presentor(s) _______________________
_______________________
_______________________
SECTION ONE: CONTEXT BACKGROUND AND ACTIVITIESThis section provides a brief overview of the session being observed.
I. Session ContextIn a few sentences, describe the session you observed. Include: (a) whether the observation covered apartial or complete session, (be) whether there were multiple break-out sessions, and (c) where this sessionfits in the project’s sequence of faculty development for those in attendance.
_______________________________________________________________________________
_______________________________________________________________________________
_______________________________________________________________________________
_______________________________________________________________________________
_______________________________________________________________________________
_______________________________________________________________________________
II. Session FocusIndicate the major intended purpose(s) of this session based on the information provided by the projectstaff.
_______________________________________________________________________________
_______________________________________________________________________________
_______________________________________________________________________________
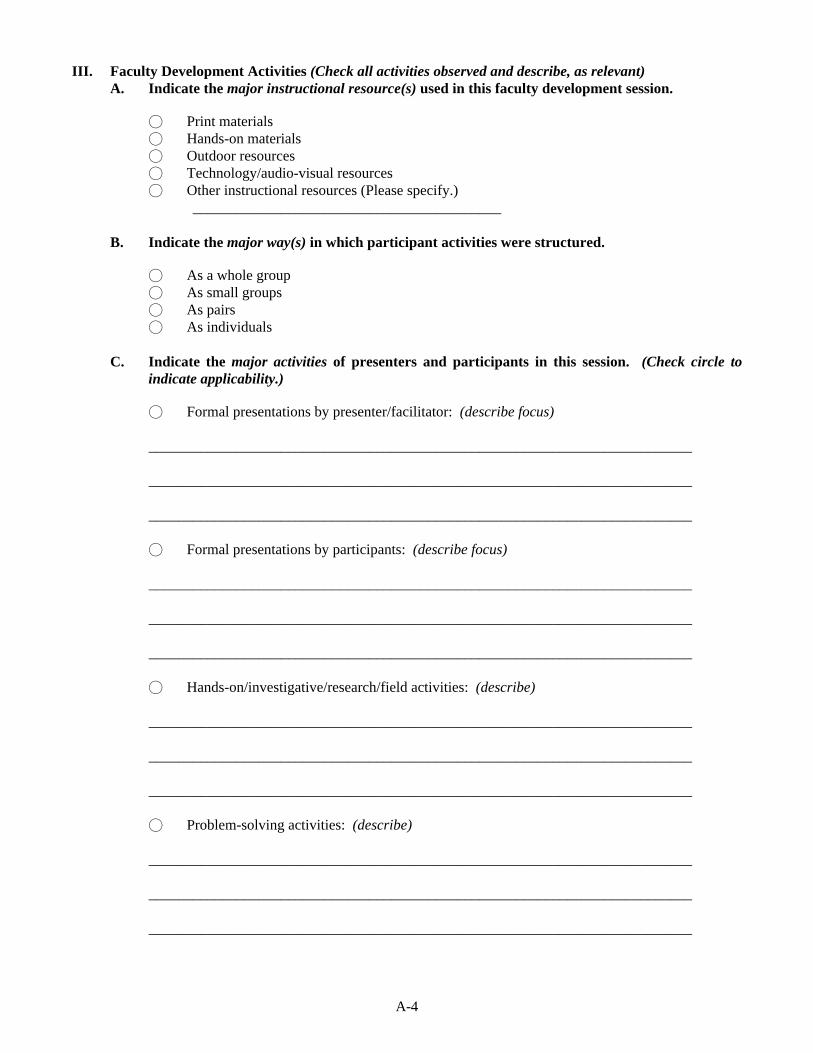
A-4
III. Faculty Development Activities (Check all activities observed and describe, as relevant)A. Indicate the major instructional resource(s) used in this faculty development session.
± Print materials± Hands-on materials± Outdoor resources± Technology/audio-visual resources± Other instructional resources (Please specify.)
__________________________________________
B. Indicate the major way(s) in which participant activities were structured.
± As a whole group± As small groups± As pairs± As individuals
C. Indicate the major activities of presenters and participants in this session. (Check circle toindicate applicability.)
± Formal presentations by presenter/facilitator: (describe focus)
__________________________________________________________________________
__________________________________________________________________________
__________________________________________________________________________
± Formal presentations by participants: (describe focus)
__________________________________________________________________________
__________________________________________________________________________
__________________________________________________________________________
± Hands-on/investigative/research/field activities: (describe)
__________________________________________________________________________
__________________________________________________________________________
__________________________________________________________________________
± Problem-solving activities: (describe)
__________________________________________________________________________
__________________________________________________________________________
__________________________________________________________________________

A-5
± Proof and evidence: (describe)
__________________________________________________________________________
__________________________________________________________________________
__________________________________________________________________________
± Reading/reflection/written communication: (describe)
__________________________________________________________________________
__________________________________________________________________________
__________________________________________________________________________
± Explored technology use: (describe focus)
__________________________________________________________________________
__________________________________________________________________________
__________________________________________________________________________
± Explored assessment strategies: (describe focus)
__________________________________________________________________________
__________________________________________________________________________
__________________________________________________________________________
± Assessed participants’ knowledge and/or skills: (describe approach)
__________________________________________________________________________
__________________________________________________________________________
__________________________________________________________________________
± Other activities: (Please specify)
__________________________________________________________________________
__________________________________________________________________________
__________________________________________________________________________

A-6
D. CommentsPlease provide any additional information you consider necessary to capture the activities or contextof this faculty development session. Include comments on any feature of the session that is sosalient that you need to get it “on the table” right away to help explain your ratings.
__________________________________________________________________________
__________________________________________________________________________
__________________________________________________________________________
__________________________________________________________________________
__________________________________________________________________________
__________________________________________________________________________
__________________________________________________________________________
__________________________________________________________________________
__________________________________________________________________________

A-7
SECTION TWO: RATINGS
In Section One of this form, you documented what occurred in the session. In this section, youare asked to use that information, as well as any other pertinent observations, to rate each of anumber of key indicators from 1 (not at all) to 5 (to a great extent) in five difference categoriesby circling the appropriate response. Note that any one session is not likely to provide evidencefor every single indicator; use 6, “Don’t know” when there is not enough evidence for you tomake a judgment. Use 7, “N/A” (Not Applicable) when you consider the indicator inappropriategiven the purpose and context of the session. Similarly, there may be entire rating categories thatare not applicable to a particular session.
Note that you may list any additional indicators you consider important in capturing the essenceof this session and rate these as well.
Use your “Ratings of Key Indicators” (Part A) to inform your “Synthesis Ratings” (Part B) andindicate in “Supporting Evidence for Synthesis Ratings” (Part C) what factors were mostinfluential in determining your synthesis ratings. Section Two concludes with ratings of thelikely impact of faculty development and a capsule description of the session.
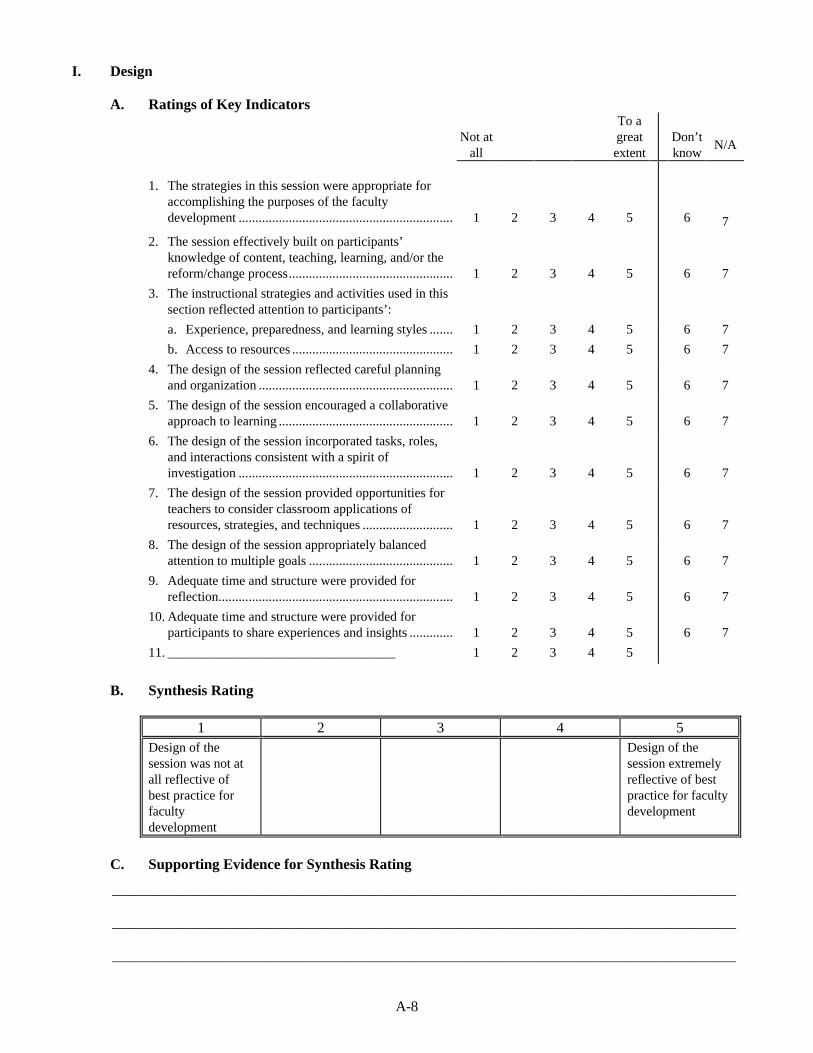
A-8
I. Design
A. Ratings of Key Indicators
Not atall
To agreatextent
Don’tknow
N/A
1. The strategies in this session were appropriate foraccomplishing the purposes of the facultydevelopment ................................................................ 1 2 3 4 5 6 7
2. The session effectively built on participants’knowledge of content, teaching, learning, and/or thereform/change process................................................. 1 2 3 4 5 6 7
3. The instructional strategies and activities used in thissection reflected attention to participants’:
a. Experience, preparedness, and learning styles ....... 1 2 3 4 5 6 7
b. Access to resources ................................................ 1 2 3 4 5 6 7
4. The design of the session reflected careful planningand organization .......................................................... 1 2 3 4 5 6 7
5. The design of the session encouraged a collaborativeapproach to learning .................................................... 1 2 3 4 5 6 7
6. The design of the session incorporated tasks, roles,and interactions consistent with a spirit ofinvestigation ................................................................ 1 2 3 4 5 6 7
7. The design of the session provided opportunities forteachers to consider classroom applications ofresources, strategies, and techniques ........................... 1 2 3 4 5 6 7
8. The design of the session appropriately balancedattention to multiple goals ........................................... 1 2 3 4 5 6 7
9. Adequate time and structure were provided forreflection...................................................................... 1 2 3 4 5 6 7
10. Adequate time and structure were provided forparticipants to share experiences and insights ............. 1 2 3 4 5 6 7
11. __________________________________ 1 2 3 4 5
B. Synthesis Rating
1 2 3 4 5Design of thesession was not atall reflective ofbest practice forfacultydevelopment
Design of thesession extremelyreflective of bestpractice for facultydevelopment
C. Supporting Evidence for Synthesis Rating
_____________________________________________________________________________________
_____________________________________________________________________________________
_____________________________________________________________________________________
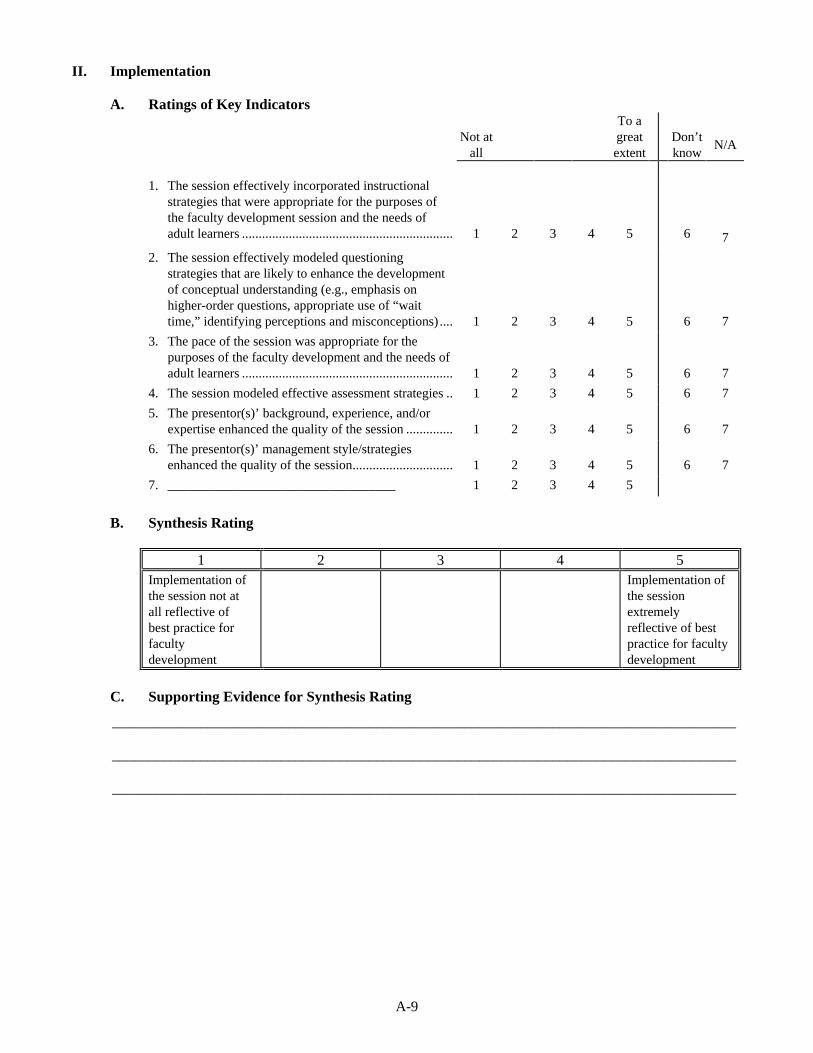
A-9
II. Implementation
A. Ratings of Key Indicators
Not atall
To agreatextent
Don’tknow
N/A
1. The session effectively incorporated instructionalstrategies that were appropriate for the purposes ofthe faculty development session and the needs ofadult learners ............................................................... 1 2 3 4 5 6 7
2. The session effectively modeled questioningstrategies that are likely to enhance the developmentof conceptual understanding (e.g., emphasis onhigher-order questions, appropriate use of “waittime,” identifying perceptions and misconceptions) .... 1 2 3 4 5 6 7
3. The pace of the session was appropriate for thepurposes of the faculty development and the needs ofadult learners ............................................................... 1 2 3 4 5 6 7
4. The session modeled effective assessment strategies .. 1 2 3 4 5 6 7
5. The presentor(s)’ background, experience, and/orexpertise enhanced the quality of the session .............. 1 2 3 4 5 6 7
6. The presentor(s)’ management style/strategiesenhanced the quality of the session.............................. 1 2 3 4 5 6 7
7. __________________________________ 1 2 3 4 5
B. Synthesis Rating
1 2 3 4 5Implementation ofthe session not atall reflective ofbest practice forfacultydevelopment
Implementation ofthe sessionextremelyreflective of bestpractice for facultydevelopment
C. Supporting Evidence for Synthesis Rating
_____________________________________________________________________________________
_____________________________________________________________________________________
_____________________________________________________________________________________
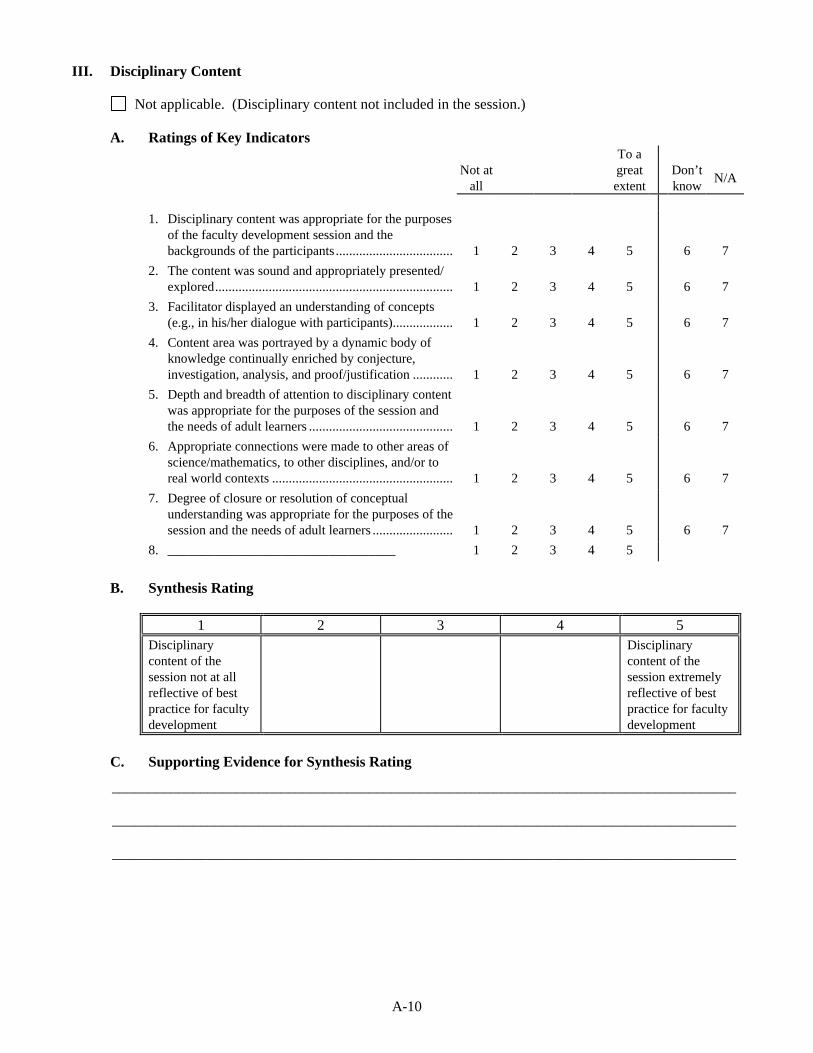
A-10
III. Disciplinary Content
Not applicable. (Disciplinary content not included in the session.)
A. Ratings of Key Indicators
Not atall
To agreatextent
Don’tknow
N/A
1. Disciplinary content was appropriate for the purposesof the faculty development session and thebackgrounds of the participants ................................... 1 2 3 4 5 6 7
2. The content was sound and appropriately presented/explored....................................................................... 1 2 3 4 5 6 7
3. Facilitator displayed an understanding of concepts(e.g., in his/her dialogue with participants).................. 1 2 3 4 5 6 7
4. Content area was portrayed by a dynamic body ofknowledge continually enriched by conjecture,investigation, analysis, and proof/justification ............ 1 2 3 4 5 6 7
5. Depth and breadth of attention to disciplinary contentwas appropriate for the purposes of the session andthe needs of adult learners ........................................... 1 2 3 4 5 6 7
6. Appropriate connections were made to other areas ofscience/mathematics, to other disciplines, and/or toreal world contexts ...................................................... 1 2 3 4 5 6 7
7. Degree of closure or resolution of conceptualunderstanding was appropriate for the purposes of thesession and the needs of adult learners ........................ 1 2 3 4 5 6 7
8. __________________________________ 1 2 3 4 5
B. Synthesis Rating
1 2 3 4 5Disciplinarycontent of thesession not at allreflective of bestpractice for facultydevelopment
Disciplinarycontent of thesession extremelyreflective of bestpractice for facultydevelopment
C. Supporting Evidence for Synthesis Rating
_____________________________________________________________________________________
_____________________________________________________________________________________
_____________________________________________________________________________________
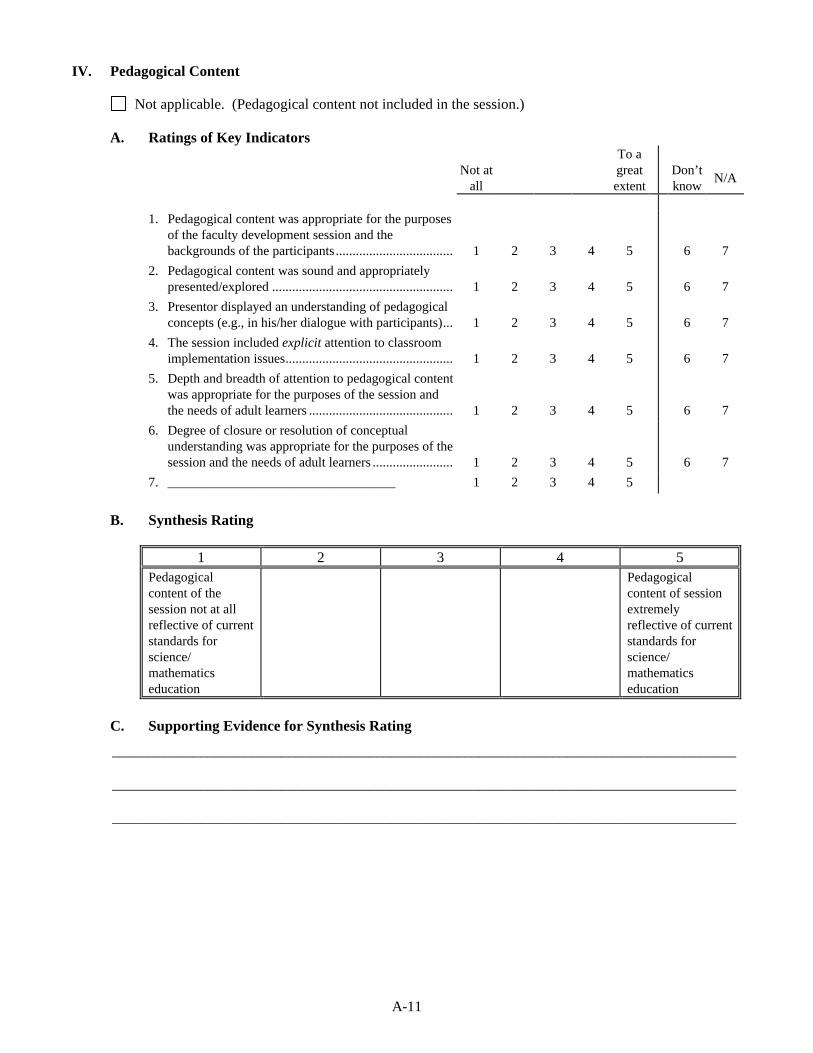
A-11
IV. Pedagogical Content
Not applicable. (Pedagogical content not included in the session.)
A. Ratings of Key Indicators
Not atall
To agreatextent
Don’tknow
N/A
1. Pedagogical content was appropriate for the purposesof the faculty development session and thebackgrounds of the participants ................................... 1 2 3 4 5 6 7
2. Pedagogical content was sound and appropriatelypresented/explored ...................................................... 1 2 3 4 5 6 7
3. Presentor displayed an understanding of pedagogicalconcepts (e.g., in his/her dialogue with participants)... 1 2 3 4 5 6 7
4. The session included explicit attention to classroomimplementation issues.................................................. 1 2 3 4 5 6 7
5. Depth and breadth of attention to pedagogical contentwas appropriate for the purposes of the session andthe needs of adult learners ........................................... 1 2 3 4 5 6 7
6. Degree of closure or resolution of conceptualunderstanding was appropriate for the purposes of thesession and the needs of adult learners ........................ 1 2 3 4 5 6 7
7. __________________________________ 1 2 3 4 5
B. Synthesis Rating
1 2 3 4 5Pedagogicalcontent of thesession not at allreflective of currentstandards forscience/mathematicseducation
Pedagogicalcontent of sessionextremelyreflective of currentstandards forscience/mathematicseducation
C. Supporting Evidence for Synthesis Rating
_____________________________________________________________________________________
_____________________________________________________________________________________
_____________________________________________________________________________________
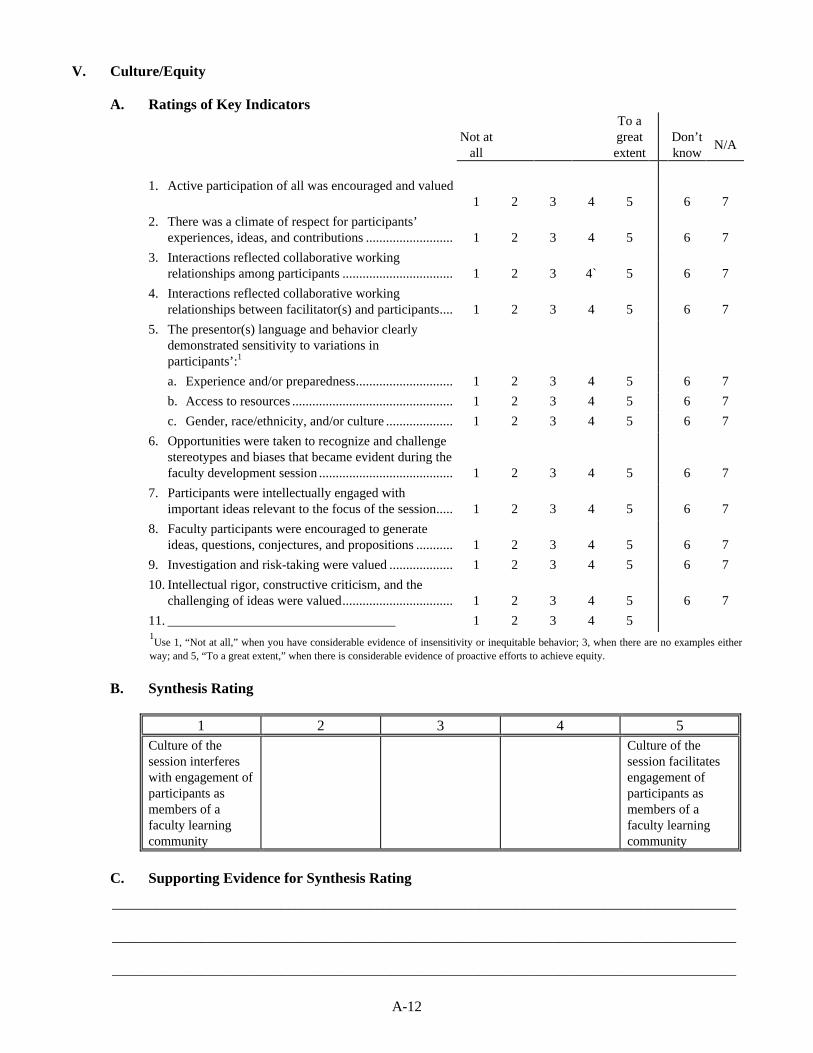
A-12
V. Culture/Equity
A. Ratings of Key Indicators
Not atall
To agreatextent
Don’tknow
N/A
1. Active participation of all was encouraged and valued1 2 3 4 5 6 7
2. There was a climate of respect for participants’experiences, ideas, and contributions .......................... 1 2 3 4 5 6 7
3. Interactions reflected collaborative workingrelationships among participants ................................. 1 2 3 4` 5 6 7
4. Interactions reflected collaborative workingrelationships between facilitator(s) and participants.... 1 2 3 4 5 6 7
5. The presentor(s) language and behavior clearlydemonstrated sensitivity to variations inparticipants’:1
a. Experience and/or preparedness............................. 1 2 3 4 5 6 7
b. Access to resources ................................................ 1 2 3 4 5 6 7
c. Gender, race/ethnicity, and/or culture .................... 1 2 3 4 5 6 7
6. Opportunities were taken to recognize and challengestereotypes and biases that became evident during thefaculty development session ........................................ 1 2 3 4 5 6 7
7. Participants were intellectually engaged withimportant ideas relevant to the focus of the session..... 1 2 3 4 5 6 7
8. Faculty participants were encouraged to generateideas, questions, conjectures, and propositions ........... 1 2 3 4 5 6 7
9. Investigation and risk-taking were valued ................... 1 2 3 4 5 6 7
10. Intellectual rigor, constructive criticism, and thechallenging of ideas were valued................................. 1 2 3 4 5 6 7
11. __________________________________ 1 2 3 4 51Use 1, “Not at all,” when you have considerable evidence of insensitivity or inequitable behavior; 3, when there are no examples either
way; and 5, “To a great extent,” when there is considerable evidence of proactive efforts to achieve equity.
B. Synthesis Rating
1 2 3 4 5Culture of thesession interfereswith engagement ofparticipants asmembers of afaculty learningcommunity
Culture of thesession facilitatesengagement ofparticipants asmembers of afaculty learningcommunity
C. Supporting Evidence for Synthesis Rating
_____________________________________________________________________________________
_____________________________________________________________________________________
_____________________________________________________________________________________
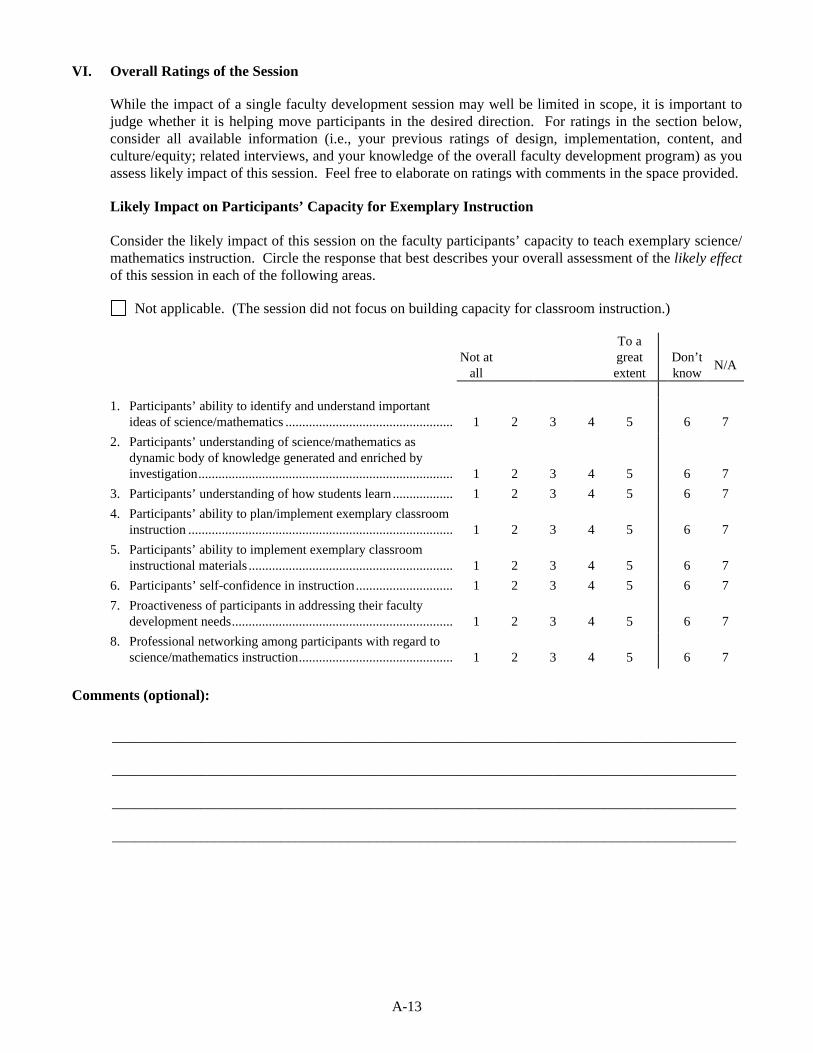
A-13
VI. Overall Ratings of the Session
While the impact of a single faculty development session may well be limited in scope, it is important tojudge whether it is helping move participants in the desired direction. For ratings in the section below,consider all available information (i.e., your previous ratings of design, implementation, content, andculture/equity; related interviews, and your knowledge of the overall faculty development program) as youassess likely impact of this session. Feel free to elaborate on ratings with comments in the space provided.
Likely Impact on Participants’ Capacity for Exemplary Instruction
Consider the likely impact of this session on the faculty participants’ capacity to teach exemplary science/mathematics instruction. Circle the response that best describes your overall assessment of the likely effectof this session in each of the following areas.
Not applicable. (The session did not focus on building capacity for classroom instruction.)
Not atall
To agreatextent
Don’tknow
N/A
1. Participants’ ability to identify and understand importantideas of science/mathematics .................................................. 1 2 3 4 5 6 7
2. Participants’ understanding of science/mathematics asdynamic body of knowledge generated and enriched byinvestigation............................................................................ 1 2 3 4 5 6 7
3. Participants’ understanding of how students learn .................. 1 2 3 4 5 6 7
4. Participants’ ability to plan/implement exemplary classroominstruction ............................................................................... 1 2 3 4 5 6 7
5. Participants’ ability to implement exemplary classroominstructional materials ............................................................. 1 2 3 4 5 6 7
6. Participants’ self-confidence in instruction............................. 1 2 3 4 5 6 7
7. Proactiveness of participants in addressing their facultydevelopment needs.................................................................. 1 2 3 4 5 6 7
8. Professional networking among participants with regard toscience/mathematics instruction.............................................. 1 2 3 4 5 6 7
Comments (optional):
_____________________________________________________________________________________
_____________________________________________________________________________________
_____________________________________________________________________________________
_____________________________________________________________________________________
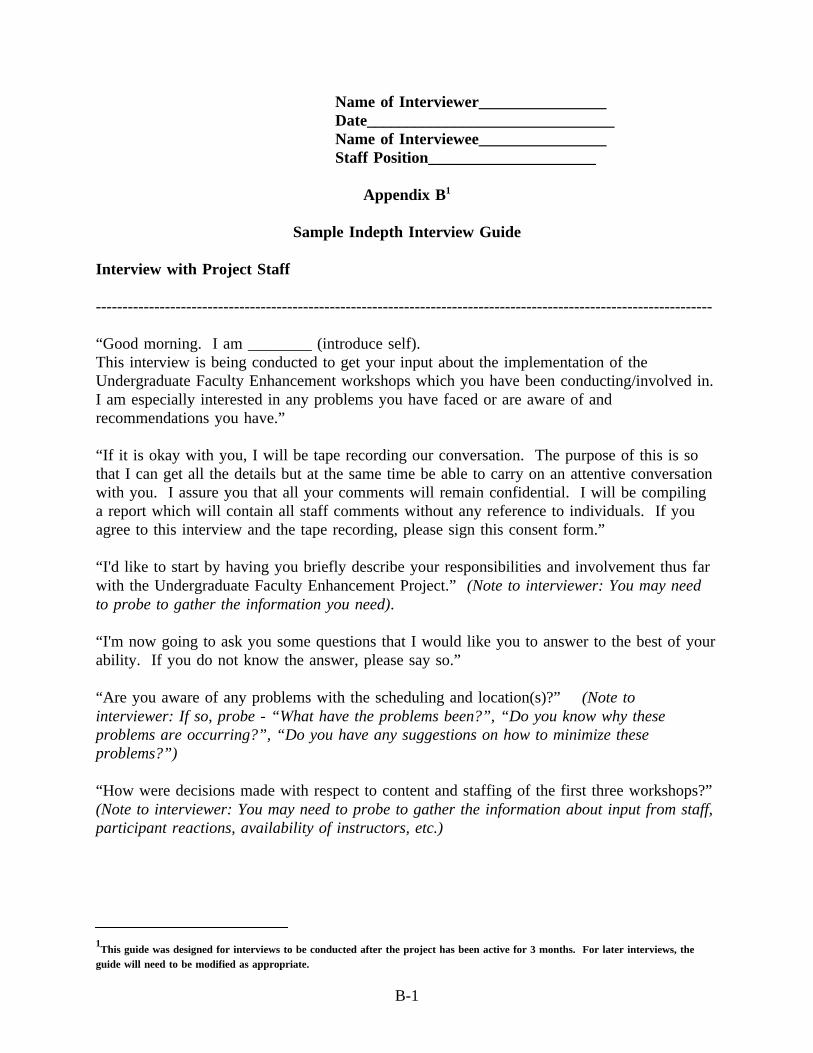
Name of Interviewer________________Date_______________________________Name of Interviewee________________Staff Position_____________________
Appendix B1
Sample Indepth Interview Guide
Interview with Project Staff
--------------------------------------------------------------------------------------------------------------------
“Good morning. I am ________ (introduce self).This interview is being conducted to get your input about the implementation of theUndergraduate Faculty Enhancement workshops which you have been conducting/involved in.I am especially interested in any problems you have faced or are aware of andrecommendations you have.”
“If it is okay with you, I will be tape recording our conversation. The purpose of this is sothat I can get all the details but at the same time be able to carry on an attentive conversationwith you. I assure you that all your comments will remain confidential. I will be compilinga report which will contain all staff comments without any reference to individuals. If youagree to this interview and the tape recording, please sign this consent form.”
“I'd like to start by having you briefly describe your responsibilities and involvement thus farwith the Undergraduate Faculty Enhancement Project.”(Note to interviewer: You may needto probe to gather the information you need).
“I'm now going to ask you some questions that I would like you to answer to the best of yourability. If you do not know the answer, please say so.”
“Are you aware of any problems with the scheduling and location(s)?”(Note tointerviewer: If so, probe - “What have the problems been?”, “Do you know why theseproblems are occurring?”, “Do you have any suggestions on how to minimize theseproblems?”)
“How were decisions made with respect to content and staffing of the first three workshops?”(Note to interviewer: You may need to probe to gather the information about input from staff,participant reactions, availability of instructors, etc.)
1This guide was designed for interviews to be conducted after the project has been active for 3 months. For later interviews, the
guide will need to be modified as appropriate.
B-1

“What is taking place in the workshops?” (Note to interviewer: After giving individual timeto respond, probe specific planned activities/strategies he/she may not have addressed -“What have the presentations been like?”, “Have there been demonstrations of modelteaching? If so, please describe?”, “Has active participation been encouraged? Pleasedescribe for me how?”)
“What do you think the strongest points of the workshops have been up to this point? Whydo you say this?” (Note to interviewer: You may need to probe why specific strongelements are mentioned - e.g., if interviewee replies “They work”, respond “How can you tellthat they work?”)
“What types of concerns have you had or heard regarding the availability of materials andequipment?” (Note to interviewer: You may need to probe to gather the information youneed)
“What other problems are you aware of?”(Note to interviewer: You may need to probe togather the information you need)
“What do you think about the project/workshops at this point?”(Note to interviewer: Youmay need to probe to gather the information you need - e.g., “I'd like to know more aboutwhat your thinking is on that issue?”)
“Is there any other information about the workshops or other aspects of the project that youthink would be useful for me to know?” (Note to interviewer: If so, you may need to probeto gather the information you need)
B-2
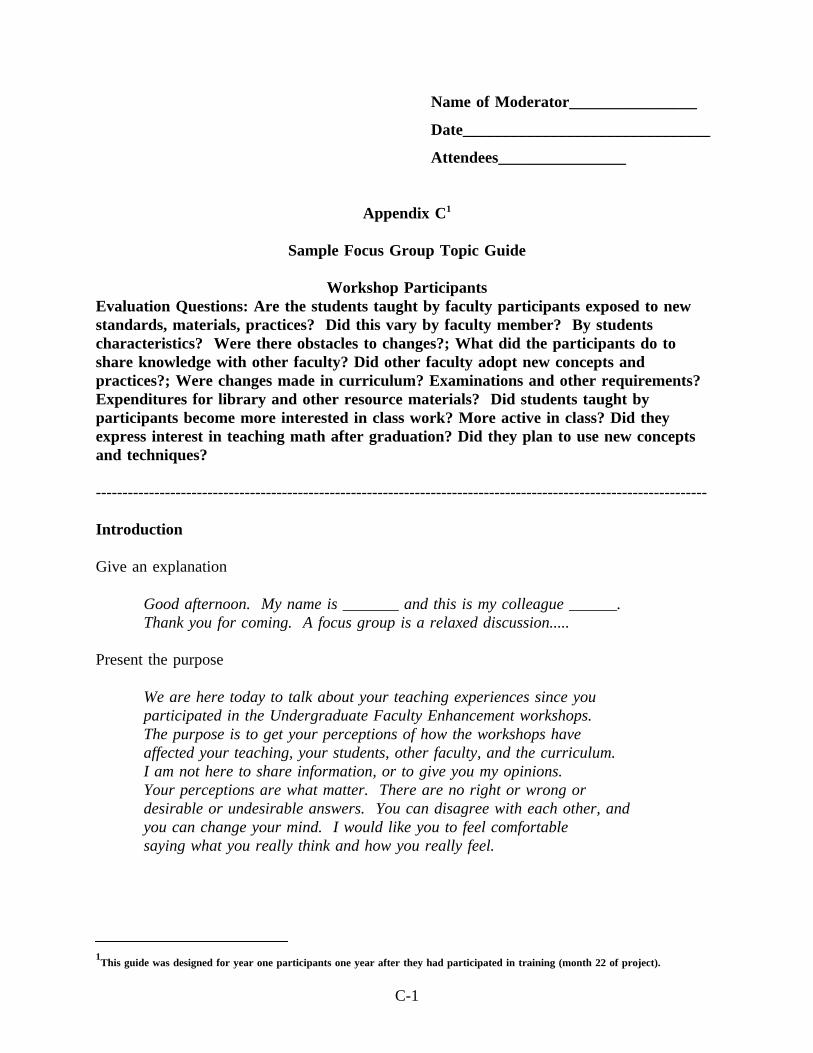
Name of Moderator________________
Date_______________________________
Attendees________________
Appendix C1
Sample Focus Group Topic Guide
Workshop ParticipantsEvaluation Questions: Are the students taught by faculty participants exposed to newstandards, materials, practices? Did this vary by faculty member? By studentscharacteristics? Were there obstacles to changes?; What did the participants do toshare knowledge with other faculty? Did other faculty adopt new concepts andpractices?; Were changes made in curriculum? Examinations and other requirements?Expenditures for library and other resource materials? Did students taught byparticipants become more interested in class work? More active in class? Did theyexpress interest in teaching math after graduation? Did they plan to use new conceptsand techniques?
-------------------------------------------------------------------------------------------------------------------
Introduction
Give an explanation
Good afternoon. My name is _______ and this is my colleague ______.Thank you for coming. A focus group is a relaxed discussion.....
Present the purpose
We are here today to talk about your teaching experiences since youparticipated in the Undergraduate Faculty Enhancement workshops.The purpose is to get your perceptions of how the workshops haveaffected your teaching, your students, other faculty, and the curriculum.I am not here to share information, or to give you my opinions.Your perceptions are what matter. There are no right or wrong ordesirable or undesirable answers. You can disagree with each other, andyou can change your mind. I would like you to feel comfortablesaying what you really think and how you really feel.
1This guide was designed for year one participants one year after they had participated in training (month 22 of project).
C-1
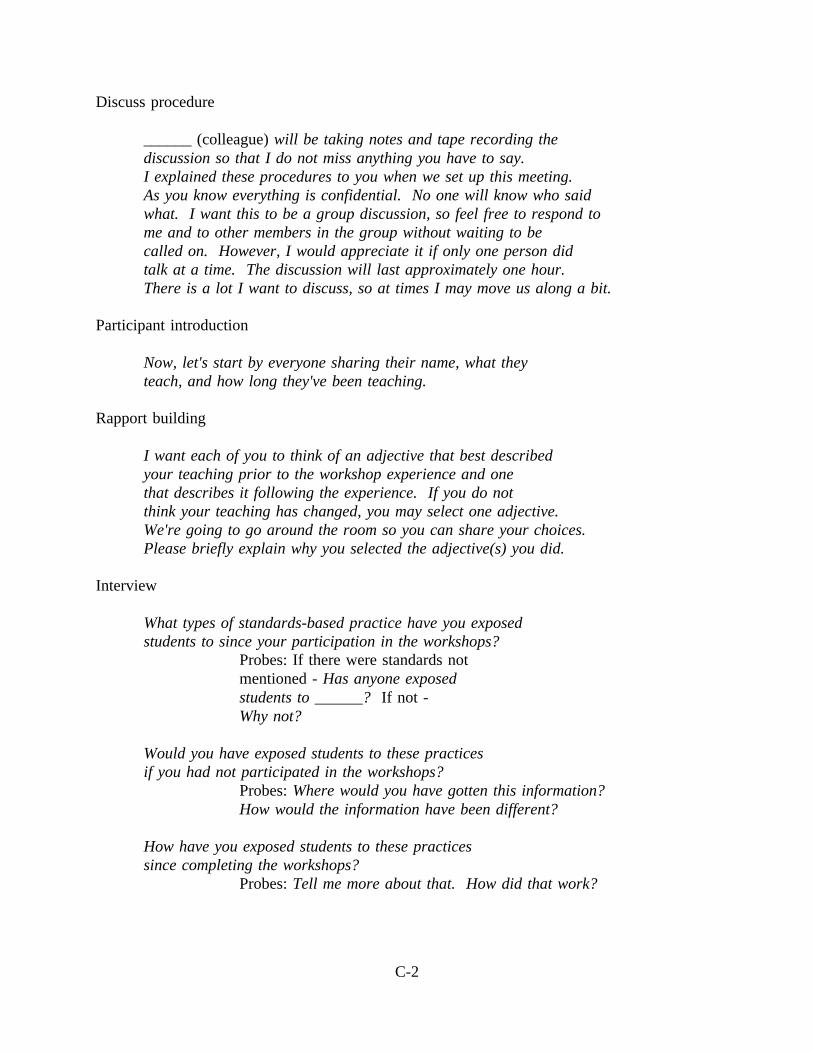
Discuss procedure
______(colleague)will be taking notes and tape recording thediscussion so that I do not miss anything you have to say.I explained these procedures to you when we set up this meeting.As you know everything is confidential. No one will know who saidwhat. I want this to be a group discussion, so feel free to respond tome and to other members in the group without waiting to becalled on. However, I would appreciate it if only one person didtalk at a time. The discussion will last approximately one hour.There is a lot I want to discuss, so at times I may move us along a bit.
Participant introduction
Now, let's start by everyone sharing their name, what theyteach, and how long they've been teaching.
Rapport building
I want each of you to think of an adjective that best describedyour teaching prior to the workshop experience and onethat describes it following the experience. If you do notthink your teaching has changed, you may select one adjective.We're going to go around the room so you can share your choices.Please briefly explain why you selected the adjective(s) you did.
Interview
What types of standards-based practice have you exposedstudents to since your participation in the workshops?
Probes: If there were standards notmentioned -Has anyone exposedstudents to ______?If not -Why not?
Would you have exposed students to these practicesif you had not participated in the workshops?
Probes:Where would you have gotten this information?How would the information have been different?
How have you exposed students to these practicessince completing the workshops?
Probes:Tell me more about that. How did that work?
C-2
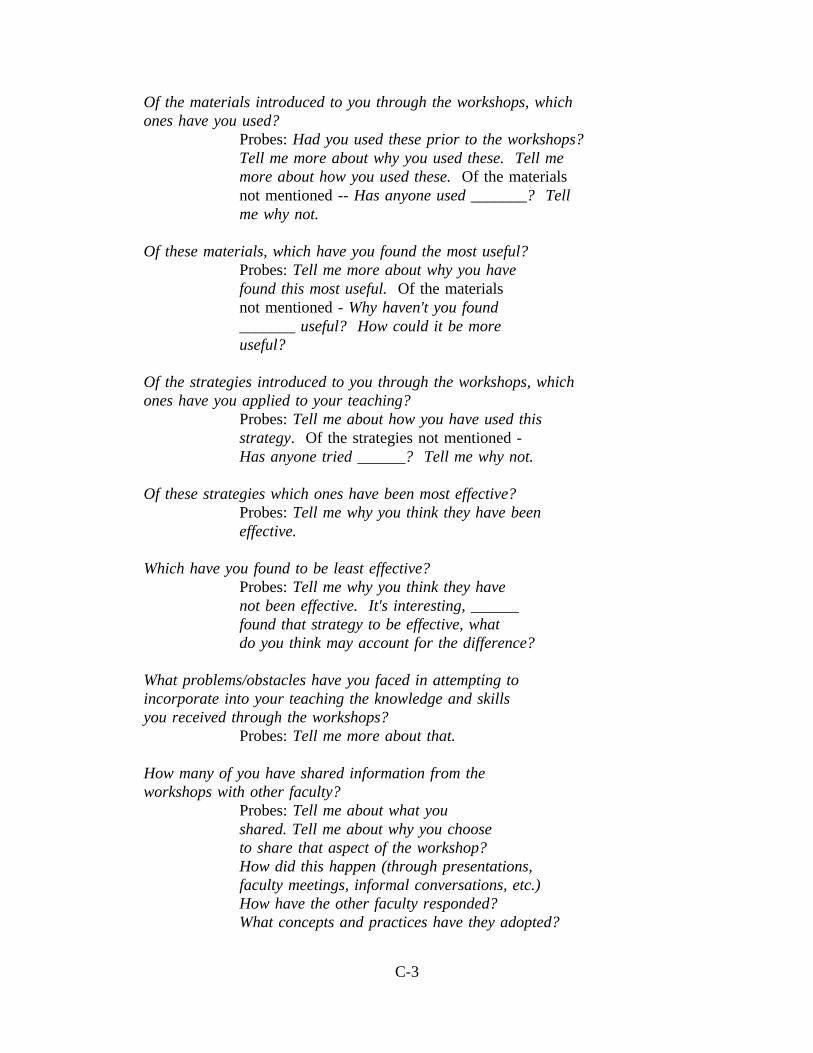
Of the materials introduced to you through the workshops, whichones have you used?
Probes:Had you used these prior to the workshops?Tell me more about why you used these. Tell memore about how you used these.Of the materialsnot mentioned --Has anyone used _______? Tellme why not.
Of these materials, which have you found the most useful?Probes:Tell me more about why you havefound this most useful.Of the materialsnot mentioned -Why haven't you found_______ useful? How could it be moreuseful?
Of the strategies introduced to you through the workshops, whichones have you applied to your teaching?
Probes:Tell me about how you have used thisstrategy. Of the strategies not mentioned -Has anyone tried ______? Tell me why not.
Of these strategies which ones have been most effective?Probes:Tell me why you think they have beeneffective.
Which have you found to be least effective?Probes:Tell me why you think they havenot been effective. It's interesting, ______found that strategy to be effective, whatdo you think may account for the difference?
What problems/obstacles have you faced in attempting toincorporate into your teaching the knowledge and skillsyou received through the workshops?
Probes:Tell me more about that.
How many of you have shared information from theworkshops with other faculty?
Probes:Tell me about what youshared. Tell me about why you chooseto share that aspect of the workshop?How did this happen (through presentations,faculty meetings, informal conversations, etc.)How have the other faculty responded?What concepts and practices have they adopted?
C-3
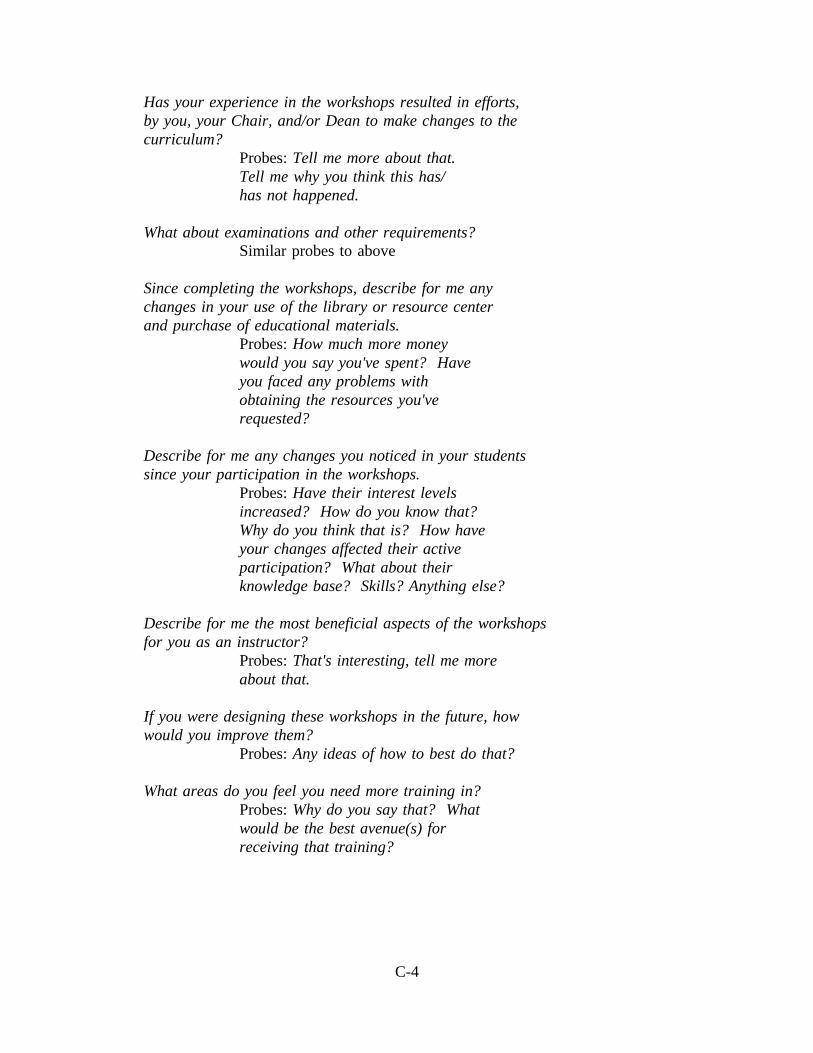
Has your experience in the workshops resulted in efforts,by you, your Chair, and/or Dean to make changes to thecurriculum?
Probes:Tell me more about that.Tell me why you think this has/has not happened.
What about examinations and other requirements?Similar probes to above
Since completing the workshops, describe for me anychanges in your use of the library or resource centerand purchase of educational materials.
Probes:How much more moneywould you say you've spent? Haveyou faced any problems withobtaining the resources you'verequested?
Describe for me any changes you noticed in your studentssince your participation in the workshops.
Probes:Have their interest levelsincreased? How do you know that?Why do you think that is? How haveyour changes affected their activeparticipation? What about theirknowledge base? Skills? Anything else?
Describe for me the most beneficial aspects of the workshopsfor you as an instructor?
Probes:That's interesting, tell me moreabout that.
If you were designing these workshops in the future, howwould you improve them?
Probes:Any ideas of how to best do that?
What areas do you feel you need more training in?Probes:Why do you say that? Whatwould be the best avenue(s) forreceiving that training?
C-4

Closure
Though there were many different opinions about _______,it appears unanimous that _______. Does anyone see itdifferently? It seems most of you agree ______, but somethink that _____. Does anyone want to add or clarify anopinion on this?
Is there any other information regarding your experiencewith or following the workshops that you think would beuseful for me to know?
Thank you very much for coming this afternoon. Yourtime is very much appreciated and your comments havebeen very helpful.
C-5
4-1
4 ANALYZING
QUALITATIVE DATA
What Is Qualitative Analysis?
Qualitative modes of data analysis provide ways of discerning,examining, comparing and contrasting, and interpreting meaningfulpatterns or themes. Meaningfulness is determined by the particulargoals and objectives of the project at hand: the same data can beanalyzed and synthesized from multiple angles depending on theparticular research or evaluation questions being addressed. Thevarieties of approaches—including ethnography, narrative analysis,discourse analysis, and textual analysis—correspond to differenttypes of data, disciplinary traditions, objectives, and philosophicalorientations. However, all share several common characteristics thatdistinguish them from quantitative analytic approaches.
In quantitative analysis, numbers and what they stand for are thematerial of analysis. By contrast, qualitative analysis deals in wordsand is guided by fewer universal rules and standardized proceduresthan statistical analysis.
We have few agreed-on canons for qualitative dataanalysis, in the sense of shared ground rules fordrawing conclusions and verifying their sturdiness(Miles and Huberman, 1984).
This relative lack of standardization is at once a source of versatilityand the focus of considerable misunderstanding. That qualitativeanalysts will not specify uniform procedures to follow in all casesdraws critical fire from researchers who question whether analysiscan be truly rigorous in the absence of such universal criteria; in fact,these analysts may have helped to invite this criticism by failing toadequately articulate their standards for assessing qualitativeanalyses, or even denying that such standards are possible. Theirstance has fed a fundamentally mistaken but relatively common ideaof qualitative analysis as unsystematic, undisciplined, and “purelysubjective.”
Chapter 4.Analyzing Qualitative Data
4-2
Although distinctly different from quantitative statistical analysisboth in procedures and goals, good qualitative analysis is bothsystematic and intensely disciplined. If not “objective” in the strictpositivist sense, qualitative analysis is arguably replicable insofar asothers can be “walked through” the analyst's thought processes andassumptions. Timing also works quite differently in qualitativeevaluation. Quantitative evaluation is more easily divided intodiscrete stages of instrument development, data collection, dataprocessing, and data analysis. By contrast, in qualitative evaluation,data collection and data analysis are not temporally discrete stages:as soon as the first pieces of data are collected, the evaluator beginsthe process of making sense of the information. Moreover, thedifferent processes involved in qualitative analysis also overlap intime. Part of what distinguishes qualitative analysis is a loop-likepattern of multiple rounds of revisiting the data as additionalquestions emerge, new connections are unearthed, and more complexformulations develop along with a deepening understanding of thematerial. Qualitative analysis is fundamentally an iterative set ofprocesses.
At the simplest level, qualitative analysis involves examining theassembled relevant data to determine how they answer the evaluationquestion(s) at hand. However, the data are apt to be in formats thatare unusual for quantitative evaluators, thereby complicating thistask. In quantitative analysis of survey results, for example,frequency distributions of responses to specific items on aquestionnaire often structure the discussion and analysis of findings.By contrast, qualitative data most often occur in more embedded andless easily reducible or distillable forms than quantitative data. Forexample, a relevant “piece” of qualitative data might be interspersedportions of an interview transcript, multiple excerpts from a set offield notes, or a comment or cluster of comments from a focus group.
Throughout the course of qualitative analysis, the analyst should beasking and reasking the following questions:
• What patterns and common themes emerge in responses dealingwith specific items? How do these patterns (or lack thereof) helpto illuminate the broader study question(s)?
• Are there any deviations from these patterns? If yes, are thereany factors that might explain these atypical responses?
• What interesting stories emerge from the responses? How canthese stories help to illuminate the broader study question(s)?
• Do any of these patterns or findings suggest that additional datamay need to be collected? Do any of the study questions need tobe revised?
Although distinctlydifferent from
quantitative statisticalanalyses both in
procedures and goals,good qualitativeanalysis is bothsystematic and
intensely disciplined.
Chapter 4.Analyzing Qualitative Data
4-3
• Do the patterns that emerge corroborate the findings of anycorresponding qualitative analyses that have been conducted? Ifnot, what might explain these discrepancies?
Two basic forms of qualitative analysis, essentially the same in theirunderlying logic, will be discussed: intra-case analysis and cross-case analysis. A case may be differently defined for differentanalytic purposes. Depending on the situation, a case could be asingle individual, a focus group session, or a program site(Berkowitz, 1996). In terms of the hypothetical project described inChapter 2, a case will be a single campus. Intra-case analysis willexamine a single project site, and cross-case analysis willsystematically compare and contrast the eight campuses.
Processes in Qualitative Analysis
Qualitative analysts are justifiably wary of creating an undulyreductionistic or mechanistic picture of an undeniably complex,iterative set of processes. Nonetheless, evaluators have identified afew basic commonalities in the process of making sense of qualitativedata. In this chapter we have adopted the framework developed byMiles and Huberman (1994) to describe the major phases of dataanalysis: data reduction, data display, and conclusion drawing andverification.
Data Reduction
First, the mass of data has to be organized and somehowmeaningfully reduced or reconfigured. Miles and Huberman (1994)describe this first of their three elements of qualitative data analysisas data reduction. “Data reduction refers to the process of selecting,focusing, simplifying, abstracting, and transforming the data thatappear in written up field notes or transcriptions.” Not only do thedata need to be condensed for the sake of manageability, they alsohave to be transformed so they can be made intelligible in terms ofthe issues being addressed.
Data reduction often forces choices about which aspects of theassembled data should be emphasized, minimized, or set asidecompletely for the purposes of the project at hand. Beginners oftenfail to understand that even at this stage, the data do not speak forthemselves. A common mistake many people make in quantitative aswell as qualitative analysis, in a vain effort to remain “perfectly
“Data reduction refersto the process of
selecting, focusing,simplifying,
abstracting, andtransforming the datathat appear in written
up field notes ortranscriptions.”
Chapter 4.Analyzing Qualitative Data
4-4
objective,” is to present a large volume of unassimilated anduncategorized data for the reader's consumption.
In qualitative analysis, the analyst decides which data are to besingled out for description according to principles of selectivity. Thisusually involves some combination of deductive and inductiveanalysis. While initial categorizations are shaped by preestablishedstudy questions, the qualitative analyst should remain open toinducing new meanings from the data available.
In evaluation, such as the hypothetical evaluation project in thishandbook, data reduction should be guided primarily by the need toaddress the salient evaluation question(s). This selective winnowingis difficult, both because qualitative data can be very rich, andbecause the person who analyzes the data also often played a direct,personal role in collecting them. The words that make up qualitativeanalysis represent real people, places, and events far more concretelythan the numbers in quantitative data sets, a reality that can makecutting any of it quite painful. But the acid test has to be therelevance of the particular data for answering particular questions.For example, a formative evaluation question for the hypotheticalstudy might be whether the presentations were suitable for allparticipants. Focus group participants may have had a number ofinteresting things to say about the presentations, but remarks thatonly tangentially relate to the issue of suitability may have to bebracketed or ignored. Similarly, a participant’s comments on hisdepartment chair that are unrelated to issues of programimplementation or impact, however fascinating, should not beincorporated into the final report. The approach to data reduction isthe same for intra-case and cross-case analysis.
With the hypothetical project of Chapter 2 in mind, it is illustrative toconsider ways of reducing data collected to address the question“what did participating faculty do to share knowledge withnonparticipating faculty?” The first step in an intra-case analysis ofthe issue is to examine all the relevant data sources to extract adescription of what they say about the sharing of knowledge betweenparticipating and nonparticipating faculty on the one campus.Included might be information from focus groups, observations, andindepth interviews of key informants, such as the department chair.The most salient portions of the data are likely to be concentrated incertain sections of the focus group transcripts (or write-ups) andindepth interviews with the department chair. However, it is best toalso quickly peruse all notes for relevant data that may be scatteredthroughout.
In initiating the process of data reduction, the focus is on distillingwhat the different respondent groups suggested about the activitiesused to share knowledge between faculty who participated in the
Chapter 4.Analyzing Qualitative Data
4-5
project and those who did not. How does what the participatingfaculty say compare to what the nonparticipating faculty and thedepartment chair report about knowledge sharing and adoption ofnew practices? In setting out these differences and similarities, it isimportant not to so “flatten” or reduce the data that they sound likeclose-ended survey responses. The tendency to treat qualitative datain this manner is not uncommon among analysts trained inquantitative approaches. Not surprisingly, the result is to makequalitative analysis look like watered down survey research with atiny sample size. Approaching qualitative analysis in this fashionunfairly and unnecessarily dilutes the richness of the data and, thus,inadvertently undermines one of the greatest strengths of thequalitative approach.
Answering the question about knowledge sharing in a trulyqualitative way should go beyond enumerating a list of knowledge-sharing activities to also probe the respondents' assessments of therelative effectiveness of these activities, as well as their reasons forbelieving some more effective than others. Apart from exploring thespecific content of the respondents' views, it is also a good idea totake note of the relative frequency with which different issues areraised, as well as the intensity with which they are expressed.
Data Display
Data display is the second element or level in Miles and Huberman's(1994) model of qualitative data analysis. Data display goes a stepbeyond data reduction to provide “an organized, compressedassembly of information that permits conclusion drawing...” Adisplay can be an extended piece of text or a diagram, chart, or matrixthat provides a new way of arranging and thinking about the moretextually embedded data. Data displays, whether in word ordiagrammatic form, allow the analyst to extrapolate from the dataenough to begin to discern systematic patterns and interrelationships.At the display stage, additional, higher order categories or themesmay emerge from the data that go beyond those first discoveredduring the initial process of data reduction.
From the perspective of program evaluation, data display can beextremely helpful in identifying why a system (e.g., a given programor project) is or is not working well and what might be done tochange it. The overarching issue of why some projects work better orare more successful than others almost always drives the analyticprocess in any evaluation. In our hypothetical evaluation example,faculty from all eight campuses come together at the central campusto attend workshops. In that respect, all participants are exposed tothe identical program. However, implementation of teaching
At the display stage,additional, higherorder categories orthemes may emerge
from the data that gobeyond those first
discovered during theinitial process of data
reduction.
Chapter 4.Analyzing Qualitative Data
4-6
techniques presented at the workshop will most likely vary fromcampus to campus based on factors such as the participants’ personalcharacteristics, the differing demographics of the student bodies, anddifferences in the university and departmental characteristics (e.g.,size of the student body, organization of preservice courses,department chair’s support of the program goals, departmentalreceptivity to change and innovation). The qualitative analyst willneed to discern patterns of interrelationships to suggest why theproject promoted more change on some campuses than on others.
One technique for displaying narrative data is to develop a series offlow charts that map out any critical paths, decision points, andsupporting evidence that emerge from establishing the data for asingle site. After the first flow chart has been developed, the processcan be repeated for all remaining sites. Analysts may (1) use the datafrom subsequent sites to modify the original flow chart; (2) preparean independent flow chart for each site; and/or (3) prepare a singleflow chart for some events (if most sites adopted a generic approach)and multiple flow charts for others. Examination of the data displayacross the eight campuses might produce a finding thatimplementation proceeded more quickly and effectively on thosecampuses where the department chair was highly supportive of tryingnew approaches to teaching but was stymied and delayed whendepartment chairs had misgivings about making changes to a tried-and-true system.
Data display for intra-case analysis. Exhibit 10 presents a datadisplay matrix for analyzing patterns of response concerningperceptions and assessments of knowledge-sharing activities for onecampus. We have assumed that three respondent units—participatingfaculty, nonparticipating faculty, and department chairs—have beenasked similar questions. Looking at column (a), it is interesting thatthe three respondent groups were not in total agreement even onwhich activities they named. Only the participants considered e-maila means of sharing what they had learned in the program with theircolleagues. The nonparticipant colleagues apparently viewed thesituation differently, because they did not include e-mail in their list.The department chair—perhaps because she was unaware they weretaking place—did not mention e-mail or informal interchanges asknowledge-sharing activities.
Column (b) shows which activities each group considered mosteffective as a way of sharing knowledge, in order of perceivedimportance; column (c) summarizes the respondents' reasons forregarding those particular activities as most effective. Looking downcolumn (b), we can see that there is some overlap across groups—forexample, both the participants and the department chair believedstructured seminars were the most effective knowledge-sharing
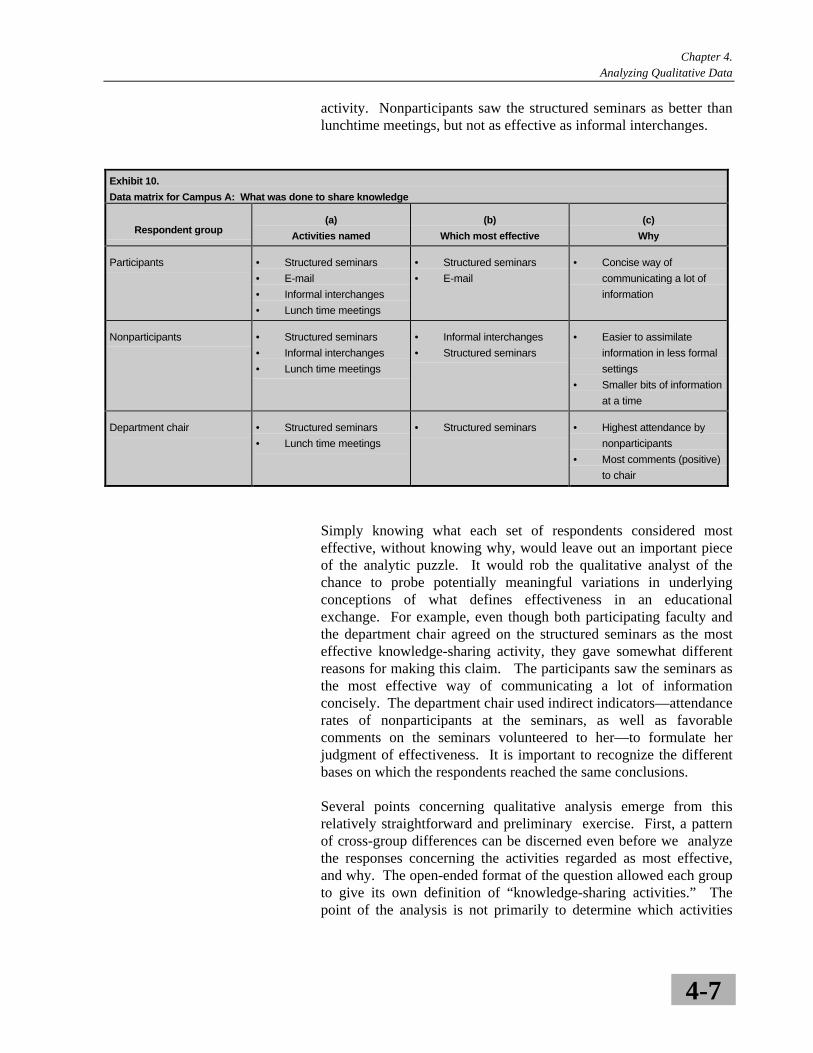
Chapter 4.Analyzing Qualitative Data
4-7
activity. Nonparticipants saw the structured seminars as better thanlunchtime meetings, but not as effective as informal interchanges.
Exhibit 10.
Data matrix for Campus A: What was done to share knowledge
Respondent group(a)
Activities named
(b)
Which most effective
(c)
Why
Participants • Structured seminars
• Informal interchanges
• Lunch time meetings
• Structured seminars
• Concise way of
communicating a lot of
information
Nonparticipants • Structured seminars
• Informal interchanges
• Lunch time meetings
• Informal interchanges
• Structured seminars
• Easier to assimilate
information in less formal
settings
• Smaller bits of information
at a time
Department chair • Structured seminars
• Lunch time meetings
• Structured seminars • Highest attendance by
nonparticipants
• Most comments (positive)
to chair
Simply knowing what each set of respondents considered mosteffective, without knowing why, would leave out an important pieceof the analytic puzzle. It would rob the qualitative analyst of thechance to probe potentially meaningful variations in underlyingconceptions of what defines effectiveness in an educationalexchange. For example, even though both participating faculty andthe department chair agreed on the structured seminars as the mosteffective knowledge-sharing activity, they gave somewhat differentreasons for making this claim. The participants saw the seminars asthe most effective way of communicating a lot of informationconcisely. The department chair used indirect indicators—attendancerates of nonparticipants at the seminars, as well as favorablecomments on the seminars volunteered to her—to formulate herjudgment of effectiveness. It is important to recognize the differentbases on which the respondents reached the same conclusions.
Several points concerning qualitative analysis emerge from thisrelatively straightforward and preliminary exercise. First, a patternof cross-group differences can be discerned even before we analyzethe responses concerning the activities regarded as most effective,and why. The open-ended format of the question allowed each groupto give its own definition of “knowledge-sharing activities.” Thepoint of the analysis is not primarily to determine which activities
Chapter 4.Analyzing Qualitative Data
4-8
were used and how often; if that were the major purpose of askingthis question, there would be far more efficient ways (e.g., a checklistor rating scale) to find the answer. From an analytic perspective, it ismore important to begin to uncover relevant group differences inperceptions.
Differences in reasons for considering one activity more effectivethan another might also point to different conceptions of the primarygoals of the knowledge-sharing activities. Some of these variationsmight be attributed to the fact that the respondent groups occupydifferent structural positions in life and different roles in this specificsituation. While both participating and nonparticipating faculty teachin the same department, in this situation the participating faculty areplaying a teaching role vis-a-vis their colleagues. The data in column(c) indicate the participants see their main goal as imparting a greatdeal of information as concisely as possible. By contrast, thenonparticipants—in the role of students—believe they assimilate thematerial better when presented with smaller quantities of informationin informal settings. Their different approaches to the question mightreflect different perceptions based on this temporary rearrangementin their roles. The department chair occupies a different structuralposition in the university than either the participating ornonparticipating faculty. She may be too removed from day-to-dayexchanges among the faculty to see much of what is happening onthis more informal level. By the same token, her removal from thegrassroots might give her a broader perspective on the subject.
Data display in cross-case analysis. The principles applied inanalyzing across cases essentially parallel those employed in theintra-case analysis. Exhibit 11 shows an example of a hypotheticaldata display matrix that might be used for analysis of programparticipants’ responses to the knowledge-sharing question across alleight campuses. Looking down column (a), one sees differences inthe number and variety of knowledge-sharing activities named byparticipating faculty at the eight schools. Brown bag lunches,department newsletters, workshops, and dissemination of written(hard-copy) materials have been added to the list, which for branchcampus A included only structured seminars, e-mail, informalinterchanges, and lunchtime meetings. This expanded list probablyencompasses most, if not all, such activities at the eight campuses. Inaddition, where applicable, we have indicated whether thenonparticipating faculty involvement in the activity was compulsoryor voluntary.
In Exhibit 11, we are comparing the same group on differentcampuses, rather than different groups on the same campus, as inExhibit 10. Column (b) reveals some overlap across participants inwhich activities were considered most effective: structured seminarswere named by participants at campuses A and C, brown bag lunches
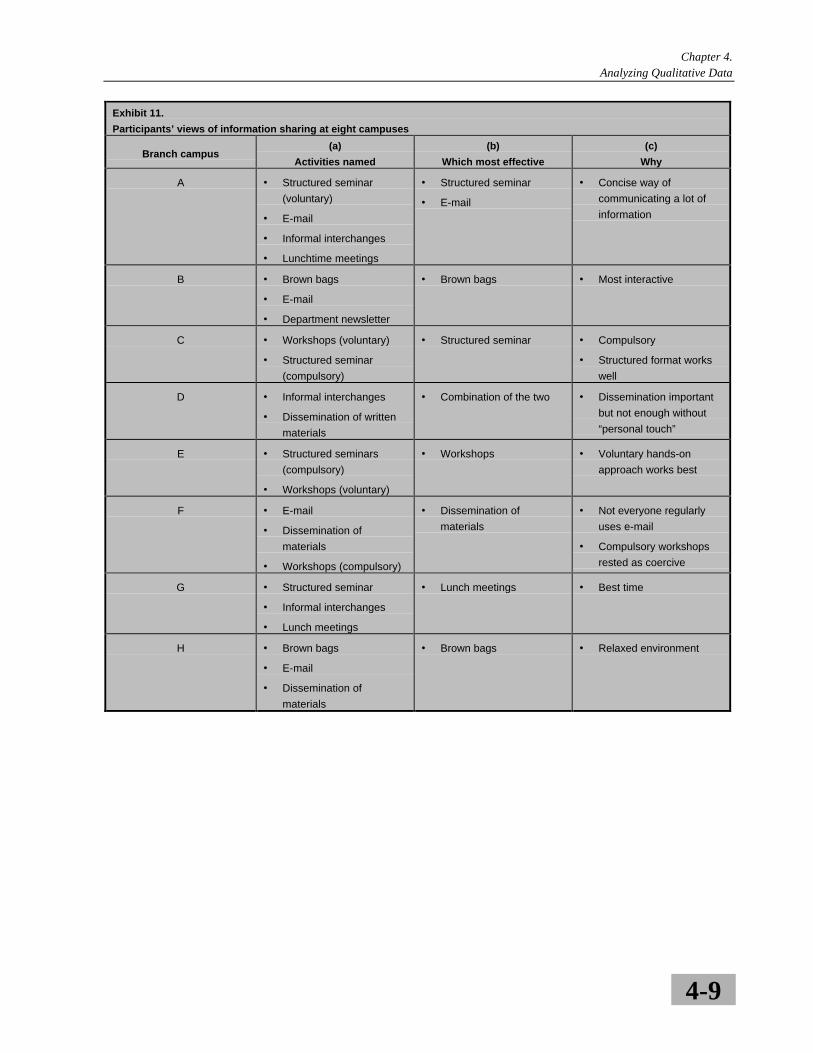
Chapter 4.Analyzing Qualitative Data
4-9
Exhibit 11.
Participants’ views of information sharing at eight campuses
Branch campus(a)
Activities named
(b)
Which most effective
(c)
Why
A • Structured seminar
(voluntary)
• Informal interchanges
• Lunchtime meetings
• Structured seminar
• Concise way of
communicating a lot of
information
B • Brown bags
• Department newsletter
• Brown bags • Most interactive
C • Workshops (voluntary)
• Structured seminar
(compulsory)
• Structured seminar • Compulsory
• Structured format works
well
D • Informal interchanges
• Dissemination of written
materials
• Combination of the two • Dissemination important
but not enough without
“personal touch”
E • Structured seminars
(compulsory)
• Workshops (voluntary)
• Workshops • Voluntary hands-on
approach works best
F • E-mail
• Dissemination of
materials
• Workshops (compulsory)
• Dissemination of
materials
• Not everyone regularly
uses e-mail
• Compulsory workshops
rested as coercive
G • Structured seminar
• Informal interchanges
• Lunch meetings
• Lunch meetings • Best time
H • Brown bags
• Dissemination of
materials
• Brown bags • Relaxed environment
Chapter 4.Analyzing Qualitative Data
4-10
by those at campuses B and H. However, as in Exhibit 10, theprimary reasons for naming these activities were not always the same.Brown bag lunches were deemed most effective because of theirinteractive nature (campus B) and the relaxed environment in whichthey took place (campus H), both suggesting a preference for lessformal learning situations. However, while campus A participantsjudged voluntary structured seminars the most effective way tocommunicate a great deal of information, campus C participants alsoliked that the structured seminars on their campus were compulsory.Participants at both campuses appear to favor structure, but may partcompany on whether requiring attendance is a good idea. Thevoluntary/compulsory distinction was added to illustrate differentaspects of effective knowledge sharing that might prove analyticallyrelevant.
It would also be worthwhile to examine the reasons participants gavefor deeming one activity more effective than another, regardless ofthe activity. Data in column (c) show a tendency for participants oncampuses B, D, E, F, and H to prefer voluntary, informal, hands-on,personal approaches. By contrast, those from campuses A and Cseemed to favor more structure (although they may disagree onvoluntary versus compulsory approaches). The answer supplied forcampus G (“best time”) is ambiguous and requires returning to thetranscripts to see if more material can be found to clarify thisresponse.
To have included all the knowledge-sharing information from fourdifferent respondent groups on all eight campuses in a single matrixwould have been quite complicated. Therefore, for clarity's sake, wepresent only the participating faculty responses. However, tocomplete the cross-case analysis of this evaluation question, the sameprocedure should be followed—if not in matrix format, thenconceptually—for nonparticipating faculty and departmentchairpersons. For each group, the analysis would be modeled on theabove example. It would be aimed at identifying importantsimilarities and differences in what the respondents said or observedand exploring the possible bases for these patterns at differentcampuses. Much of qualitative analysis, whether intra-case or cross-case, is structured by what Glaser and Strauss (1967) called the“method of constant comparison,” an intellectually disciplinedprocess of comparing and contrasting across instances to establishsignificant patterns, then further questioning and refinement of thesepatterns as part of an ongoing analytic process.
Chapter 4.Analyzing Qualitative Data
4-11
Conclusion Drawing and Verification
This activity is the third element of qualitative analysis. Conclusiondrawing involves stepping back to consider what the analyzed datamean and to assess their implications for the questions at hand.6
Verification, integrally linked to conclusion drawing, entailsrevisiting the data as many times as necessary to cross-check orverify these emergent conclusions. “The meanings emerging fromthe data have to be tested for their plausibility, their sturdiness, their‘confirmability’—that is, their validity” (Miles and Huberman, 1994,p. 11). Validity means something different in this context than inquantitative evaluation, where it is a technical term that refers quitespecifically to whether a given construct measures what it purports tomeasure. Here validity encompasses a much broader concern forwhether the conclusions being drawn from the data are credible,defensible, warranted, and able to withstand alternative explanations.
For many qualitative evaluators, it is above all this third phase thatgives qualitative analysis its special appeal. At the same time, it isprobably also the facet that quantitative evaluators and others steepedin traditional quantitative techniques find most disquieting. Oncequalitative analysts begin to move beyond cautious analysis of thefactual data, the critics ask, what is to guarantee that they are notengaging in purely speculative flights of fancy? Indeed, theirconcerns are not entirely unfounded. If the unprocessed “data heap”is the result of not taking responsibility for shaping the “story line” ofthe analysis, the opposite tendency is to take conclusion drawing wellbeyond what the data reasonably warrant or to prematurely leap toconclusions and draw implications without giving the data properscrutiny.
The question about knowledge sharing provides a good example.The underlying expectation, or hope, is for a diffusion effort, whereinparticipating faculty stimulate innovation in teaching mathematicsamong their colleagues. A cross-case finding might be thatparticipating faculty at three of the eight campuses made active,ongoing efforts to share their new knowledge with their colleagues ina variety of formal and informal settings. At two other campuses,initial efforts at sharing started strong but soon fizzled out and werenot continued. In the remaining three cases, one or two facultyparticipants shared bits and pieces of what they had learned with afew selected colleagues on an ad hoc basis, but otherwise took nosteps to diffuse their new knowledge and skills more broadly.
6When qualitative data are used as a precursor to the design/development of quantitative
instruments, this step may be postponed. Reducing the data and looking for relationships willprovide adequate information for developing other instruments.
Conclusion drawinginvolves stepping back
to consider what theanalyzed data meanand to assess their
implications for thequestions at hand.
If the unprocessed“data heap” is the result ofnot taking responsibility forshaping the “story line” ofthe analysis, the opposite
tendency is to takeconclusion drawing well
beyond what the datareasonably warrant.
Chapter 4.Analyzing Qualitative Data
4-12
Taking these findings at face value might lead one to conclude thatthe project had largely failed in encouraging diffusion of newpedagogical knowledge and skills to nonparticipating faculty. Afterall, such sharing occurred in the desired fashion at only three of theeight campuses. However, before jumping ahead to conclude that theproject was disappointing in this respect, or to generalize beyond thiscase to other similar efforts at spreading pedagogic innovationsamong faculty, it is vital to examine more closely the likely reasonswhy sharing among participating and nonparticipating facultyoccurred, and where and how it did. The analysts would first look forfactors distinguishing the three campuses where ongoing organizedefforts at sharing did occur from those where such efforts were eithernot sustained or occurred in largely piecemeal fashion. However, itwill also be important to differentiate among the less successful sitesto tease out factors related both to the extent of sharing and thedegree to which activities were sustained.
One possible hypothesis would be that successfully sustainingorganized efforts at sharing on an ongoing basis requires structuralsupports at the departmental level and/or conducive environmentalconditions at the home campus. In the absence of these supports, agreat burst of energy and enthusiasm at the beginning of the academicyear will quickly give way under the pressure of the myriad demands,as happened for the second group of two campuses. Similarly, undermost circumstances, the individual good will of one or twoparticipating faculty on a campus will in itself be insufficient togenerate the type and level of exchange that would make a differenceto the nonparticipating faculty (the third set of campuses).
At the three "successful" sites, for example, faculty schedules mayallow regularly scheduled common periods for colleagues to shareideas and information. In addition, participation in such events mightbe encouraged by the department chair, and possibly even consideredas a factor in making promotion and tenure decisions. Thedepartment might also contribute a few dollars for refreshments inorder to promote a more informal, relaxed atmosphere at theseactivities. In other words, at the campuses where sharing occurred asdesired, conditions were conducive in one or more ways: a new timeslot did not have to be carved out of already crowded facultyschedules, the department chair did more than simply pay "lipservice" to the importance of sharing (faculty are usually quite astuteat picking up on what really matters in departmental culture), andefforts were made to create a relaxed ambiance for transfer ofknowledge.
Chapter 4.Analyzing Qualitative Data
4-13
At some of the other campuses, structural conditions might not beconducive, in that classes are taught continuously from 8 a.m.through 8 p.m., with faculty coming and going at different times andon alternating days. At another campus, scheduling might not presentso great a hurdle. However, the department chair may be so busy thatdespite philosophic agreement with the importance of diffusing thenewly learned skills, she can do little to actively encourage sharingamong participating and nonparticipating faculty. In this case, it isnot structural conditions or lukewarm support so much as competingpriorities and the department chair's failure to act concretely on hercommitment that stood in the way. By contrast, at another campus,the department chairperson may publicly acknowledge the goals ofthe project but really believe it a waste of time and resources. Hisfailure to support sharing activities among his faculty stems frommore deeply rooted misgivings about the value and viability of theproject. This distinction might not seem to matter, given that theoutcome was the same on both campuses (sharing did not occur asdesired). However, from the perspective of an evaluation researcher,whether the department chair believes in the project could make amajor difference to what would have to be done to change theoutcome.
We have begun to develop a reasonably coherent explanation for thecross-site variations in the degree and nature of sharing taking placebetween participating and nonparticipating faculty. Arriving at thispoint required stepping back and systematically examining and re-examining the data, using a variety of what Miles and Huberman(1994, pp. 245-262) call "tactics for generating meaning." Theydescribe 13 such tactics, including noting patterns and themes,clustering cases, making contrasts and comparisons, partitioningvariables, and subsuming particulars in the general. Qualitativeanalysts typically employ some or all of these, simultaneously anditeratively, in drawing conclusions.
One factor that can impede conclusion drawing in evaluation studiesis that the theoretical or logical assumptions underlying the researchare often left unstated. In this example, as discussed above, theseare assumptions or expectations about knowledge sharing anddiffusion of innovative practices from participating to non-participating faculty, and, by extension, to their students. For theanalyst to be in a position to take advantage of conclusion-drawingopportunities, he or she must be able to recognize and address theseassumptions, which are often only implicit in the evaluationquestions. Toward that end, it may be helpful to explicitly spell out a"logic model" or set of assumptions as to how the program isexpected to achieve its desired outcome(s.) Recognizing theseassumptions becomes even more important when there is a need or
It may be helpful toexplicitly spell out a
"logic model" or set ofassumptions as to how
the program isexpected to achieve its
desired outcome(s.)
Chapter 4.Analyzing Qualitative Data
4-14
desire to place the findings from a single evaluation into widercomparative context vis-a-vis other program evaluations.
Once having created an apparently credible explanation for variationsin the extent and kind of sharing that occurs between participatingand nonparticipating faculty across the eight campuses, how can theanalyst verify the validity—or truth value—of this interpretation ofthe data? Miles and Huberman (1994, pp. 262-277) outline 13 tacticsfor testing or confirming findings, all of which address the need tobuild systematic "safeguards against self-delusion" (p. 265) into theprocess of analysis. We will discuss only a few of these, which haveparticular relevance for the example at hand and emphasize criticalcontrasts between quantitative and qualitative analytic approaches.However, two points are very important to stress at the outset: severalof the most important safeguards on validity—-such as using multiplesources and modes of evidence—must be built into the design fromthe beginning; and the analytic objective is to create a plausible,empirically grounded account that is maximally responsive to theevaluation questions at hand. As the authors note: "You are notlooking for one account, forsaking all others, but for the best ofseveral alternative accounts" (p. 274).
One issue of analytic validity that often arises concerns the need toweigh evidence drawn from multiple sources and based on differentdata collection modes, such as self-reported interview responses andobservational data. Triangulation of data sources and modes iscritical, but the results may not necessarily corroborate one another,and may even conflict. For example, another of the summativeevaluation questions proposed in Chapter 2 concerns the extent towhich nonparticipating faculty adopt new concepts and practices intheir teaching. Answering this question relies on a combination ofobservations, self-reported data from participant focus groups, andindepth interviews with department chairs and nonparticipatingfaculty. In this case, there is a possibility that the observational datamight be at odds with the self-reported data from one or more of therespondent groups. For example, when interviewed, the vast majorityof nonparticipating faculty might say, and really believe, that they areapplying project-related innovative principles in their teaching.However, the observers may see very little behavioral evidence thatthese principles are actually influencing teaching practices in thesefaculty members' classrooms. It would be easy to brush off thisfinding by concluding that the nonparticipants are saving face byparroting what they believe they are expected to say about theirteaching. But there are other, more analytically interesting,possibilities. Perhaps the nonparticipants have an incompleteunderstanding of these principles, or they were not adequatelytrained in how to translate them effectively into classroom practice.
Chapter 4.Analyzing Qualitative Data
4-15
The important point is that analyzing across multiple groupperspectives and different types of data is not a simple matter ofdeciding who is right or which data are most accurate. Weighing theevidence is a more subtle and delicate matter of hearing each group'sviewpoint, while still recognizing that any single perspective ispartial and relative to the respondent's experiences and socialposition. Moreover, as noted above, respondents' perceptions are nomore or less real than observations. In fact, discrepancies betweenself-reported and observational data may reveal profitable topics orareas for further analysis. It is the analyst's job to weave the variousvoices and sources together in a narrative that responds to therelevant evaluation question(s). The more artfully this is done, thesimpler, more natural it appears to the reader. To go to the trouble tocollect various types of data and listen to different voices, only topound the information into a flattened picture, is to do a realdisservice to qualitative analysis. However, if there is a reason tobelieve that some of the data are stronger than others (some of therespondents are highly knowledgeable on the subject, while othersare not), it is appropriate to give these responses greater weight in theanalysis.
Qualitative analysts should also be alert to patterns of inter-connection in their data that differ from what might have beenexpected. Miles and Huberman define these as “following upsurprises” (1994, p. 270). For instance, at one campus,systematically comparing participating and nonparticipating facultyresponses to the question about knowledge-sharing activities (seeExhibit 10) might reveal few apparent cross-group differences.However, closer examination of the two sets of transcripts mightshow meaningful differences in perceptions dividing along other, lessexpected lines. For purposes of this evaluation, it was tacitlyassumed that the relevant distinctions between faculty would mostlikely be between those who had and had not participated in theproject. However, both groups also share a history as faculty in thesame department. Therefore, other factors—such as prior personalties—might have overridden the participant/nonparticipant facultydistinction. One strength of qualitative analysis is its potential todiscover and manipulate these kinds of unexpected patterns, whichcan often be very informative. To do this requires an ability to listenfor, and be receptive to, surprises.
Unlike quantitative researchers, who need to explain away deviant orexceptional cases, qualitative analysts are also usually delightedwhen they encounter twists in their data that present fresh analyticinsights or challenges. Miles and Huberman (1994, pp. 269, 270)talk about “checking the meaning of outliers” and “using extremecases.” In qualitative analysis deviant instances or cases that do notappear to fit the pattern or trend are not treated as outliers,
Qualitative analystsshould also be alert to
patterns of inter-connection in their data
that differ from whatmight have been
expected.
Analyzing acrossmultiple group
perspectives anddifferent types of data is not a simple matter ofdeciding who is right
or which data are most accurate.
Chapter 4.Analyzing Qualitative Data
4-16
as they would be in statistical, probability-based analysis. Rather,deviant or exceptional cases should be taken as a challenge to furtherelaboration and verification of an evolving conclusion. For example,if the department chair strongly supports the project's aims and goalsfor all successful projects but one, perhaps another set of factors isfulfilling the same function(s) at the “deviant” site. Identifying thosefactors will, in turn, help to clarify more precisely what it is aboutstrong leadership and belief in a project that makes a difference. Or,to elaborate on another extended example, suppose at one campuswhere structural conditions are not conducive to sharing betweenparticipating and nonparticipating faculty, such sharing is occurringnonetheless, spearheaded by one very committed participating facultymember. This example might suggest that a highly committedindividual who is a natural leader among his faculty peers is able toovercome the structural constraints to sharing. In a sense, this“deviant” case analysis would strengthen the general conclusion byshowing that it takes exceptional circumstances to override theconstraints of the situation.
Elsewhere in this handbook, we noted that summative and formativeevaluations are often linked by the premise that variations in projectimplementation will, in turn, effect differences in project outcomes.In the hypothetical example presented in this handbook, allparticipants were exposed to the same activities on the centralcampus, eliminating the possibility of analyzing the effects ofdifferences in implementation features. However, using a differentmodel and comparing implementation and outcomes at three differentuniversities, with three campuses participating per university, wouldgive some idea of what such an analysis might look like.
A display matrix for a cross-site evaluation of this type is given inExhibit 12. The upper portion of the matrix shows how the threecampuses varied in key implementation features. The bottomportion summarizes outcomes at each campus. While we would notnecessarily expect a one-to-one relationship, the matrix loosely pairsimplementation features with outcomes with which they might beassociated. For example, workshop staffing and delivery are pairedwith knowledge-sharing activities, accuracy of workshop contentwith curricular change. However, there is nothing to precludelooking for a relationship between use of appropriate techniques inthe workshops (formative) and curricular changes on the campuses(summative). Use of the matrix would essentially guide the analysisalong the same lines as in the examples provided earlier.
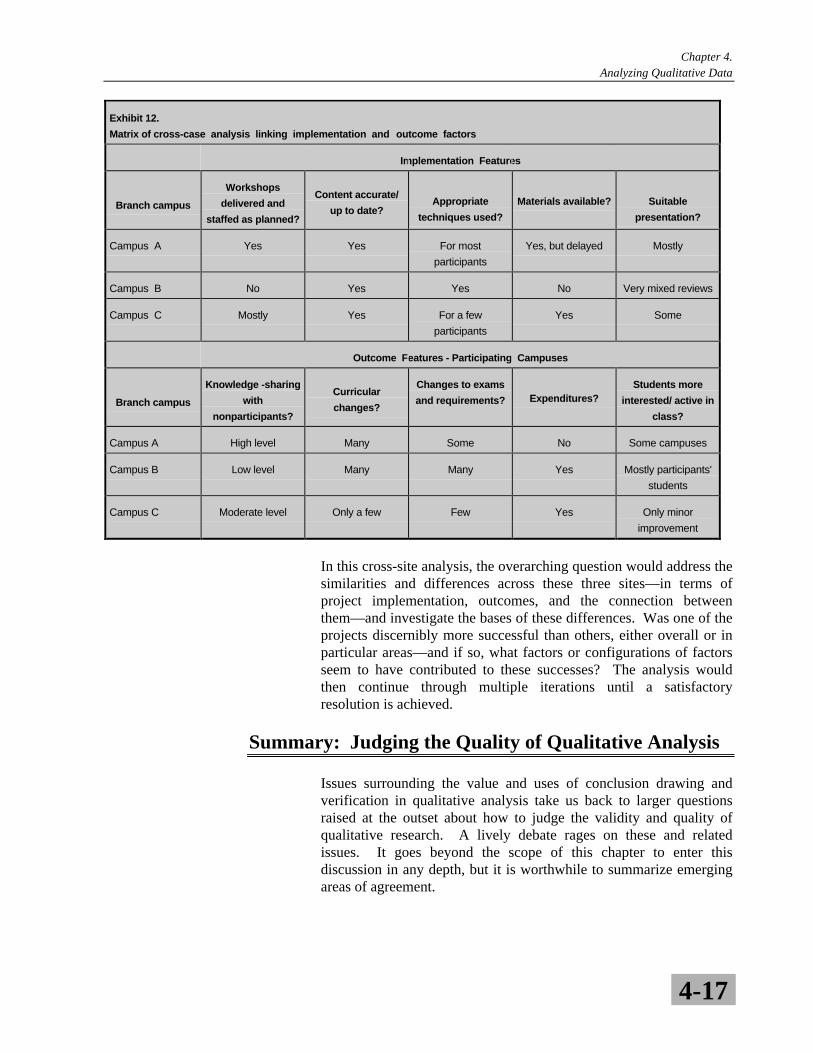
Chapter 4.Analyzing Qualitative Data
4-17
Exhibit 12.
Matrix of cross-case analysis linking implementation and outcome factors
Implementation Features
Branch campus
Workshops
delivered and
staffed as planned?
Content accurate/
up to date?Appropriate
techniques used?
Materials available? Suitable
presentation?
Campus A Yes Yes For most
participants
Yes, but delayed Mostly
Campus B No Yes Yes No Very mixed reviews
Campus C Mostly Yes For a few
participants
Yes Some
Outcome Features - Participating Campuses
Branch campus
Knowledge -sharing
with
nonparticipants?
Curricular
changes?
Changes to exams
and requirements? Expenditures?Students more
interested/ active in
class?
Campus A High level Many Some No Some campuses
Campus B Low level Many Many Yes Mostly participants'
students
Campus C Moderate level Only a few Few Yes Only minor
improvement
In this cross-site analysis, the overarching question would address thesimilarities and differences across these three sites—in terms ofproject implementation, outcomes, and the connection betweenthem—and investigate the bases of these differences. Was one of theprojects discernibly more successful than others, either overall or inparticular areas—and if so, what factors or configurations of factorsseem to have contributed to these successes? The analysis wouldthen continue through multiple iterations until a satisfactoryresolution is achieved.
Summary: Judging the Quality of Qualitative Analysis
Issues surrounding the value and uses of conclusion drawing andverification in qualitative analysis take us back to larger questionsraised at the outset about how to judge the validity and quality ofqualitative research. A lively debate rages on these and relatedissues. It goes beyond the scope of this chapter to enter thisdiscussion in any depth, but it is worthwhile to summarize emergingareas of agreement.
Chapter 4.Analyzing Qualitative Data
4-18
First, although stated in different ways, there is broad consensusconcerning the qualitative analyst's need to be self-aware, honest, andreflective about the analytic process. Analysis is not just the endproduct, it is also the repertoire of processes used to arrive at thatparticular place. In qualitative analysis, it is not necessary or evendesirable that anyone else who did a similar study should findexactly the same thing or interpret his or her findings in precisely thesame way. However, once the notion of analysis as a set of uniform,impersonal, universally applicable procedures is set aside, qualitativeanalysts are obliged to describe and discuss how they did their workin ways that are, at the very least, accessible to other researchers.Open and honest presentation of analytic processes provides animportant check on an individual analyst’s tendencies to get carriedaway, allowing others to judge for themselves whether the analysisand interpretation are credible in light of the data.
Second, qualitative analysis, as all of qualitative research, is in someways craftsmanship (Kvale, 1995). There is such a thing as poorlycrafted or bad qualitative analysis, and despite their reluctance toissue universal criteria, seasoned qualitative researchers of differentbents can still usually agree when they see an example of it.Analysts should be judged partly in terms of how skillfully, artfully,and persuasively they craft an argument or tell a story. Does theanalysis flow well and make sense in relation to the study's objectivesand the data that were presented? Is the story line clear andconvincing? Is the analysis interesting, informative, provocative?Does the analyst explain how and why she or he drew certainconclusions, or on what bases she or he excluded other possibleinterpretations? These are the kinds of questions that can and shouldbe asked in judging the quality of qualitative analyses. In evaluationstudies, analysts are often called upon to move from conclusions torecommendations for improving programs and policies. Therecommendations should fit with the findings and with the analysts’understanding of the context or milieu of the study. It is often usefulto bring in stakeholders at the point of “translating” analyticconclusions to implications for action.
As should by now be obvious, it is truly a mistake to imagine thatqualitative analysis is easy or can be done by untrained novices. AsPatton (1990) comments:
Applying guidelines requires judgment and creativity.Because each qualitative study is unique, the analyticalapproach used will be unique. Because qualitativeinquiry depends, at every stage, on the skills, training,insights, and capabilities of the researcher, qualitativeanalysis ultimately depends on the analytical intellect andstyle of the analyst. The human factor is the greatest
“Because eachqualitative study is
unique, the analyticalapproach usedwill be unique.”
Chapter 4.Analyzing Qualitative Data
4-19
strength and the fundamental weakness of qualitativeinquiry and analysis.
Practical Advice in Conducting Qualitative Analyses
Start the analysis right away and keep a running account of it inyour notes: It cannot be overstressed that analysis should beginalmost in tandem with data collection, and that it is an iterative set ofprocesses that continues over the course of the field work andbeyond. It is generally helpful for field notes or focus group orinterview summaries to include a section containing comments,tentative interpretations, or emerging hypotheses. These mayeventually be overturned or rejected, and will almost certainly berefined as more data are collected. But they provide an importantaccount of the unfolding analysis and the internal dialogue thataccompanied the process.
Involve more than one person: Two heads are better than one, andthree may be better still. Qualitative analysis need not, and in manycases probably should not, be a solitary process. It is wise to bringmore than one person into the analytic process to serve as a cross-check, sounding board, and source of new ideas and cross-fertilization. It is best if all analysts know something aboutqualitative analysis as well as the substantive issues involved. If it isimpossible or impractical for a second or third person to play acentral role, his or her skills may still be tapped in a more limitedway. For instance, someone might review only certain portions of aset of transcripts.
Leave enough time and money for analysis and writing:Analyzing and writing up qualitative data almost always takes moretime, thought, and effort than anticipated. A budget that assumes aweek of analysis time and a week of writing for a project that takes ayear’s worth of field work is highly unrealistic. Along with revealinga lack of understanding of the nature of qualitative analysis, failing tobuild in enough time and money to complete this process adequatelyis probably the major reason why evaluation reports that includequalitative data can disappoint.
Be selective when using computer software packages inqualitative analysis: A great proliferation of software packages thatcan be used to aid analysis of qualitative data has been developed inrecent years. Most of these packages were reviewed by Weitzmanand Miles (1995), who grouped them into six types: wordprocessors, word retrievers, textbase managers, code-and-retrieveprograms, code-based theory builders, and conceptual network
Chapter 4.Analyzing Qualitative Data
4-20
builders. All have strengths and weaknesses. Weitzman and Milessuggested that when selecting a given package, researchers shouldthink about the amount, types, and sources of data to be analyzed andthe types of analyses that will be performed.
Two caveats are in order. First, computer software packages forqualitative data analysis essentially aid in the manipulation ofrelevant segments of text. While helpful in marking, coding, andmoving data segments more quickly and efficiently than can be donemanually, the software cannot determine meaningful categories forcoding and analysis or define salient themes or factors. In qualitativeanalysis, as seen above, concepts must take precedence overmechanics: the analytic underpinnings of the procedures must still besupplied by the analyst. Software packages cannot and should not beused as a way of evading the hard intellectual labor of qualitativeanalysis. Second, since it takes time and resources to become adeptin utilizing a given software package and learning its peculiarities,researchers may want to consider whether the scope of their project,or their ongoing needs, truly warrant the investment.
References
Berkowitz, S. (1996). Using Qualitative and Mixed MethodApproaches. Chapter 4 in Needs Assessment: A Creative andPractical Guide for Social Scientists, R. Reviere, S.Berkowitz, C.C. Carter, and C. Graves-Ferguson, Eds. Washington, DC: Taylor & Francis.
Glaser, B., and Strauss, A. (1967). The Discovery of GroundedTheory. Chicago: Aldine.
Kvale, S. (1995). The Social Construction of Validity. QualitativeInquiry, (1):19-40.
Miles, M.B., and Huberman, A.M. (1984). Qualitative DataAnalysis, 16. Newbury Park, CA: Sage.
Miles, M.B, and Huberman, A.M. (1994). Qualitative DataAnalysis, 2nd Ed., p. 10-12. Newbury Park, CA: Sage.
Patton, M.Q. (1990). Qualitative Evaluation and Research Methods,2nd Ed. Newbury Park: CA, Sage.
Weitzman, E.A., and Miles, M.B. (1995). A Software Sourcebook:Computer Programs for Qualitative Data Analysis. ThousandOaks, CA: Sage.

Chapter 4.Analyzing Qualitative Data
4-21
Other Recommended Reading
Coffey, A., and Atkinson, P. (1996). Making Sense of QualitativeData: Complementary Research Strategies. Thousand Oaks,CA: Sage.
Howe, K., and Eisenhart, M. (1990). Standards for Qualitative (andQuantitative) Research: A Prolegomenon. EducationalResearcher, 19(4):2-9.
Wolcott, H.F. (1994). Transforming Qualitative Data: Description,Analysis and Interpretation, Thousand Oaks: CA, Sage.
PART III.
DESIGNING AND REPORTING
MIXED METHOD
EVALUATIONS
5-1
One size does not fit all. Consequently, when it comes to designingan evaluation, experience has proven that the evaluator must keep inmind that the specific questions being addressed and the audience forthe answers must influence the selection of an evaluation design andtools for data collection.
Chapter 2 of the earlier User-Friendly Handbook for ProjectEvaluation (National Science Foundation, 1993) deals at length withdesigning and implementing an evaluation, identifying the followingsteps for carrying out an evaluation:
• Developing evaluation questions;
• Matching questions with appropriate information-gatheringtechniques;
• Collecting data;
• Analyzing the data; and
• Providing information to interested audiences.
Readers of this volume who are unfamiliar with the overall processare urged to read that chapter. In this chapter, we are briefly reviewingthe process of designing an evaluation, including the development ofevaluation questions, the selection of data collection methodologies,and related technical issues, with special attention to the advantages ofmixed method designs. We are stressing mixed method designsbecause such designs frequently provide a more comprehensive andbelievable set of understandings about a project’s accomplishmentsthan studies based on either quantitative or qualitative data alone.
5 OVERVIEW OF THE
DESIGN PROCESS FOR
MIXED METHOD
EVALUATIONS
Chapter 5.Overview of the Design Process for Mixed Method Evaluations
5-2
Developing Evaluation Questions
The development of evaluation questions consists of several steps:
• Clarifying the goals and objectives of the project;
• Identifying key stakeholders and audiences;
• Listing and prioritizing evaluation questions of interest tovarious stakeholders; and
• Determining which questions can be addressed given theresources and constraints for the evaluation (money, deadlines,access to informants and sites).
The process is not an easy one. To quote an experienced evaluator(Patton, 1990):
Once a group of intended evaluation users begins to takeseriously the notion that they can learn from thecollection and analysis of evaluative information, theysoon find that there are lots of things they would like tofind out. The evaluator's role is to help them move from arather extensive list of potential questions to a muchshorter list of realistically possible questions and finallyto a focused list of essential and necessary questions.
We have developed a set of tools intended to help navigate theseinitial steps of evaluation design. These tools are simple forms ormatrices that help to organize the information needed to identify andselect among evaluation questions. Since the objectives of theformative and summative evaluations are usually different, separateforms need to be completed for each.
Worksheet 1 provides a form for briefly describing the project, theconceptual framework that led to the initiation of the project, and itsproposed activities, and for summarizing its salient features.Information on this form will be used in the design effort. A sidebenefit of filling out this form and sharing it among project staff isthat it can be used to make sure that there is a common understandingof the project’s basic characteristics. Sometimes newcomers to aproject, and even those who have been with it from the start, begin todevelop some divergent ideas about emphases and goals.
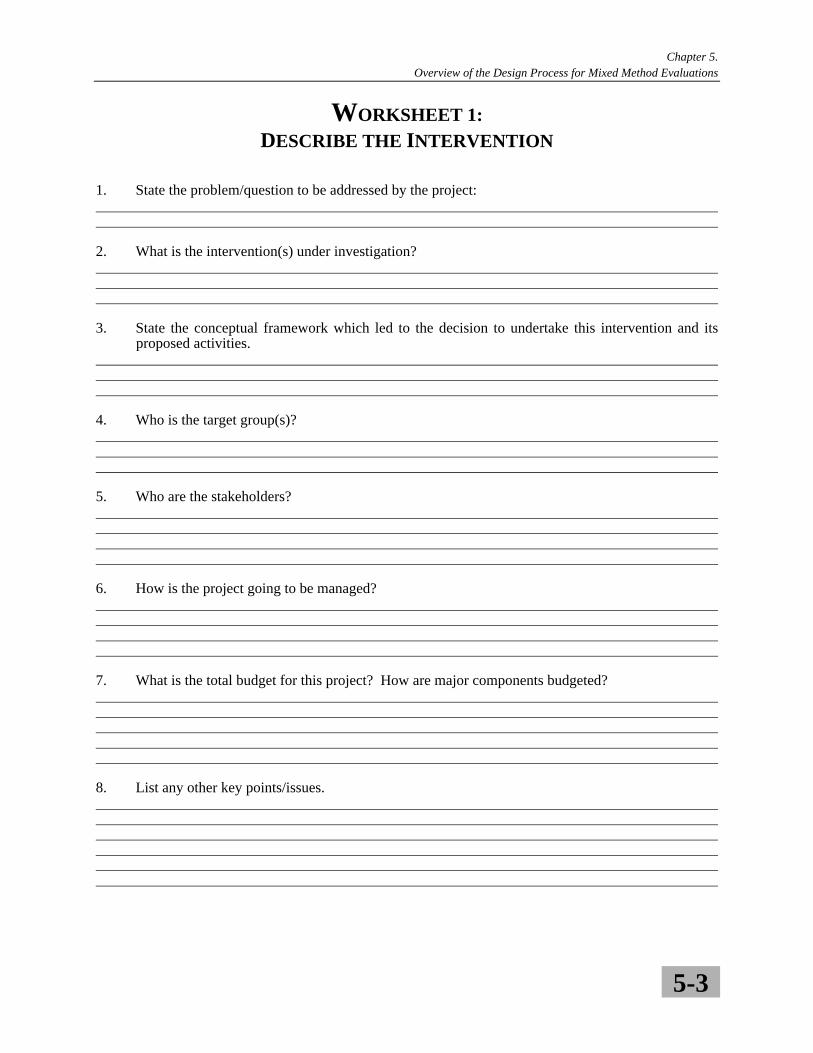
Chapter 5.Overview of the Design Process for Mixed Method Evaluations
5-3
WORKSHEET 1:DESCRIBE THE INTERVENTION
1. State the problem/question to be addressed by the project:
2. What is the intervention(s) under investigation?
3. State the conceptual framework which led to the decision to undertake this intervention and itsproposed activities.
4. Who is the target group(s)?
5. Who are the stakeholders?
6. How is the project going to be managed?
7. What is the total budget for this project? How are major components budgeted?
8. List any other key points/issues.
Chapter 5.Overview of the Design Process for Mixed Method Evaluations
5-4
Worksheet 2 provides a format for further describing the goals andobjectives of the project in measurable terms. This step, essential indeveloping an evaluation design, can prove surprisingly difficult. Afrequent problem is that goals or objectives may initially be stated insuch global terms that it is not readily apparent how they might bemeasured. For example, the statement “improve the education offuture mathematics and science educators” needs more refinementbefore it can be used as the basis for structuring an evaluation.
Worksheets 3 and 4 assist the evaluator in identifying the keystakeholders in the project and clarifying what it is each might wantto address in an evaluation. Stakeholder involvement has become animportant part of evaluation design, as it has been recognized that anevaluation must address the needs of individuals beyond the fundingagency and the project director.
Worksheet 5 provides a tool for organizing and selecting amongpossible evaluation questions. It points to several criteria that shouldbe considered. Who wants to know? Will the information be new orconfirmatory? How important is the information to variousstakeholders? Are there sufficient resources to collect and analyzethe information needed to answer the questions? Can the question beaddressed in the time available for the evaluation?
Once the set of evaluation questions is determined, the next step isselecting how each will be addressed and developing an overallevaluation design. It is at this point that decisions regarding the typesand mixture of data collection methodologies, sampling, schedulingof data collection, and data analysis need to be made. Thesedecisions are quite interdependent, and the data collectiontechniques selected will have important implications for bothscheduling and analysis plans.
Stakeholder involvementhas become an
increasingly importantpart of evaluation
design.

Chapter 5.Overview of the Design Process for Mixed Method Evaluations
5-5
WORKSHEET 2: DESCRIBE PROJECT GOAL
AND OBJECTIVE
1. Briefly describe the purpose of the project.
2. State the above in terms of a general goal.
3. State the first objective to be evaluated as clearly as you can.
4. Can this objective be broken down further? Break it down to the smallest unit. It must beclear what specifically you hope to see documented or changed.
5. Is this objective measurable (can indicators and standards be developed for it)?If not, restate it.
6. Formulate one or more questions that will yield information about the extent to whichthe objective was addressed.
7. Once you have completed the above steps, go back to #3 and write the next objective.Continue with steps 4, and 5, and 6.

Chapter 5.Overview of the Design Process for Mixed Method Evaluations
5-6
WORKSHEET 3:
IDENTIFY KEY STAKEHOLDERS AND AUDIENCES
Audience SpokespersonValues, Interests, Expectations,
etc. That EvaluationShould Address

Chapter 5.Overview of the Design Process for Mixed Method Evaluations
5-7
WORKSHEET 4:
STAKEHOLDERS’ INTEREST IN
POTENTIAL EVALUATION QUESTIONS
Question Stakeholder Group(s)
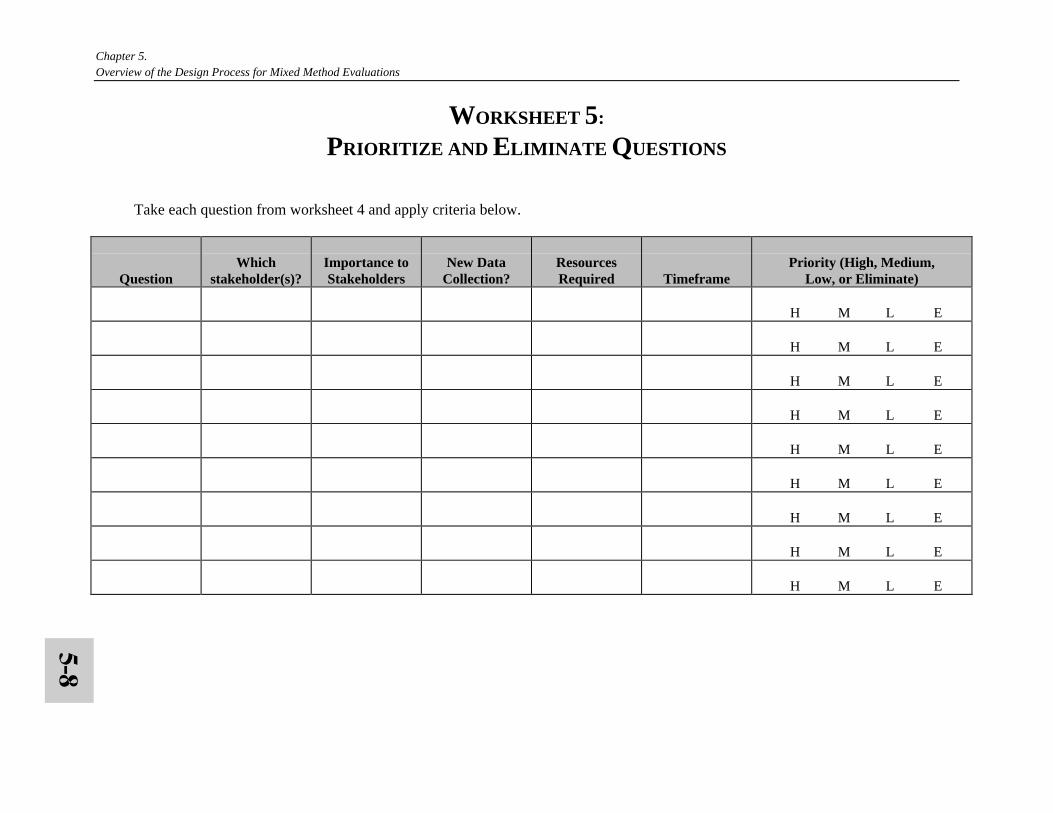
Chapter 5.Overview of the Design Process for Mixed Method Evaluations
WORKSHEET 5:
PRIORITIZE AND ELIMINATE QUESTIONS
Take each question from worksheet 4 and apply criteria below.
QuestionWhich
stakeholder(s)?Importance toStakeholders
New DataCollection?
ResourcesRequired Timeframe
Priority (High, Medium,Low, or Eliminate)
H M L E
H M L E
H M L E
H M L E
H M L E
H M L E
H M L E
H M L E
H M L E
Chapter 5.Overview of the Design Process for Mixed Method Evaluations
5-9
Selecting Methods for Gathering the Data:The Case for Mixed Method Designs
As discussed in Chapter 1, mixed method designs can yield richer,more valid, and more reliable findings than evaluations based on eitherthe qualitative or quantitative method alone. A further advantage is thata mixed method approach is likely to increase the acceptance offindings and conclusions by the diverse groups that have a stake in theevaluation.
When designing a mixed method evaluation, the investigator mustconsider two factors:
• Which is the most suitable data collection method for the type ofdata to be collected?
• How can the data collected be most effectively combined orintegrated?
To recapitulate the earlier summary of the main differences betweenthe two methods, qualitative methods provide a better understanding ofthe context in which the intervention is embedded; when a major goalof the evaluation is the generalizability of findings, quantitative dataare usually needed. When the answer to an evaluation question calls forunderstanding the perceptions and reactions of the targetpopulation, a qualitative method (indepth interview, focus group) ismost appropriate. If a major evaluation question calls for theassessment of the behavior of participants or other individualsinvolved in the intervention, trained observers will provide the mostuseful data.
In Chapter 1, we also showed some of the many ways in which thequantitative and qualitative techniques can be combined to yield moremeaningful findings. Specifically, the two methods have beensuccessfully combined by evaluators to test the validity of results(triangulation), to improve data collection instruments, and to explainfindings. A good design for mixed method evaluations should includespecific plans for collecting and analyzing the data through thecombined use of both methods; while it may often be difficult to comeup with a detailed analysis plan at the outset, it is very useful to havesuch a plan when designing data collection instruments and whenorganizing narrative data obtained through qualitative methods. Thereneeds to be considerable up-front thinking regarding probable data
While in any goodevaluation data
analysis is to someextent an iterative
process, it is importantto think things throughas much as possible at
the outset.
Chapter 5.Overview of the Design Process for Mixed Method Evaluations
5-10
analysis plans and strategies for synthesizing the information fromvarious sources. Initial decisions can be made regarding the extent towhich qualitative techniques will be used to provide full-blownstand-alone descriptions versus commentaries or illustrations to givegreater meaning to quantitative data. Preliminary strategies forcombining information from different data sources need to beformulated. Schedules for initiating the data analysis need to beestablished. The early findings thus generated should be used toreflect on the evaluation design and initiate any changes that might bewarranted. While in any good evaluation data analysis is to someextent an iterative process, it is important to think things through asmuch as possible at the outset to avoid being left awash in data orwith data focusing more on peripheral questions, rather than thosethat are germane to the study’s goals and objectives (see Chapter 4;also see Miles and Huberman, 1994, and Greene, Caracelli, andGraham, 1989).
Other Considerations in DesigningMixed Method Evaluations
Sampling. Except in the rare cases when a project is very small andaffects only a few participants and staff members, it will be necessaryto deal with a subset of sites and/or informants for budgetary andmanagerial reasons. Sampling thus becomes an issue in the use ofmixed methods, just as in the use of quantitative methods. However,the sampling approaches differ sharply depending on the methodused.
The preferred sampling methods for quantitative studies are thosethat will enable researchers to make generalizations from the sampleto the universe, i.e., all project participants, all sites, all parents.Random sampling is the appropriate method for this purpose.Statistically valid generalizations are seldom a goal of qualitativeresearch; rather, the qualitative investigation is primarily interested inlocating information-rich cases for study in depth. Purposefulsampling is therefore practiced, and it may take many forms. Insteadof studying a random sample of a project's participants, evaluatorsmay chose to concentrate their investigation on the lowest achieversadmitted to the program. When selecting classrooms for observationof the implementation of an innovative practice, the evaluator mayuse deviant-case sampling, choosing one classroom where theinnovation was reported “most successfully” implemented andanother where major problems have been reported. Depending on theevaluation questions to be answered, many other sampling methods,including maximum variation sampling, critical case sampling, or
Chapter 5.Overview of the Design Process for Mixed Method Evaluations
5-11
even typical case sampling, may be appropriate (Patton, 1990).When sampling subjects for indepth interviews, the investigator hasconsiderable flexibility with respect to sample size.
In many evaluation studies, the design calls for studying a populationat several points in time, e.g., students in the 9th grade and then againin the 12th grade. There are two ways of carrying out such studiesthat seek to measure trends. In a longitudinal approach, data arecollected from the same individuals at designated time intervals; in across-sectional approach, new samples are drawn for each successivedata collection. While in most cases, longitudinal designs thatrequire collecting information from the same students or teachers atseveral points in time are best, they are often difficult and expensiveto carry out because students move and teachers are reassigned.Furthermore, loss of respondents due to failure to locate or to obtaincooperation from some segment of the original sample is often amajor problem. Depending on the nature of the evaluation and thesize of the population studied, it may be possible to obtain goodresults with successive cross-sectional designs.
Timing, sequencing, frequency of data collection, and cost. Theevaluation questions and the analysis plan will largely determinewhen data should be collected and how often focus groups,interviews, or observations should be scheduled. In mixed methoddesigns, when the findings of qualitative data collection will affectthe structuring of quantitative instruments (or vice versa), propersequencing is crucial. As a general rule, project evaluations arestrongest when data are collected at least at two points in time:before the time an innovation is first introduced, and after it has beenin operation for a sizable period of time.
Throughout the design process, it is essential to keep an eye on thebudgetary implications of each decision. As was pointed out in Chapter1, costs depend not on the choice between qualitative and quantitativemethods, but on the number of cases required for analysis and thequality of the data collection. Evaluators must resist the temptation toplan for a more extensive data collection than the budget can support,which may result in lower data quality or the accumulation of raw datathat cannot be processed and analyzed.
Tradeoffs in the design of evaluations based on mixed methods.All evaluators find that both during the design phase, when plans arecarefully crafted according to experts' recommendations, and laterwhen fieldwork gets under way, modifications and tradeoffs becomea necessity. Budget limitations, problems in accessing fieldworksites and administrative records, and difficulties in recruiting staffwith appropriate skills are among the recurring problems that shouldbe anticipated as far as possible during the design phase, but that alsomay require modifying the design at a later time.
Chapter 5.Overview of the Design Process for Mixed Method Evaluations
5-12
What tradeoffs are least likely to impair the integrity and usefulnessof mixed method evaluations if the evaluation plan as designedcannot be fully implemented? A good general rule for dealing withbudget problems is to sacrifice the number of cases or the number ofquestions to be explored (this may mean ignoring the needs of somelow priority stakeholders), but to preserve the depth necessary tofully and rigorously address the issues targeted.
When it comes to design modifications, it is of course essential thatthe evaluator be closely involved in decisionmaking. But closecontact among the evaluator, the project director, and other projectstaff is essential throughout the life of the project. In particular, someproject directors tend to see the summative evaluation as an add-on,that is, something to be done—perhaps by a contractor—after theproject has been completed. But the quality of the evaluation isdependent on record keeping and data collection during the life of theproject, which should be closely monitored by the evaluator.
In the next chapter, we illustrate some of the issues related todesigning an evaluation, using the hypothetical example provided inChapter 2.
References
Greene, J.C., Caracelli, V.J., and Graham, W.F. (1989). Toward aConceptual Framework for Mixed Method Evaluation Designs.Educational Evaluation and Policy Analysis, Vol. II, No. 3.
Miles, M.B., and Huberman, A.M. (1994). Qualitative DataAnalysis, 2nd Ed. Newbury Park, CA: Sage
National Science Foundation. (1993). User-Friendly Handbook forProject Evaluation: Science, Mathematics and TechnologyEducation. NSF 93-152. Arlington, VA: NSF.
Patton, M.Q. 1990. Qualitative Evaluation and Research Methods,2nd Ed. Newbury Park, CA: Sage.
Close contactamong the evaluator,the project director,
and other project staffis essential
throughout thelife of the project.
6-1
Step 1. Develop Evaluation Questions
As soon as the Center was notified of the grant award for the projectdescribed in Chapter 2, staff met with the evaluation specialist todiscuss the focus, timing, and tentative cost allocation for the twoevaluations. They agreed that although the summative evaluationwas 2 years away, plans for both evaluations had to be drawn up atthis time because of the need to identify stakeholders and todetermine evaluation questions. The evaluation specialist requestedthat the faculty members named in the proposal as technical andsubject matter resource persons be included in the planning stage.Following the procedure outlined in Chapter 5, the evaluationquestions were specified through the use of Worksheets 1 through 5.
As the staff went through the process of developing the evaluationquestions, they realized that they needed to become moreknowledgeable about the characteristics of the participatinginstitutions and especially the way courses in elementary preserviceeducation were organized. For example, how many levels andsections were there for each course, and how were students andfaculty assigned? How much autonomy did faculty have with respectto course content, examinations, etc.? What were library and othermaterial resources? The evaluator and her staff spent time reviewingcatalogues and other available documents to learn more about eachcampus and to identify knowledgeable informants familiar withissues of interest in planning the evaluation. The evaluator alsovisited three of the seven branch campuses and held informalconversations with department chairs and faculty to understand theinstitutional context and issues that the evaluation questions and thedata collection needed to take into account.
6 EVALUATION DESIGN
FOR THE
HYPOTHETICAL
PROJECT
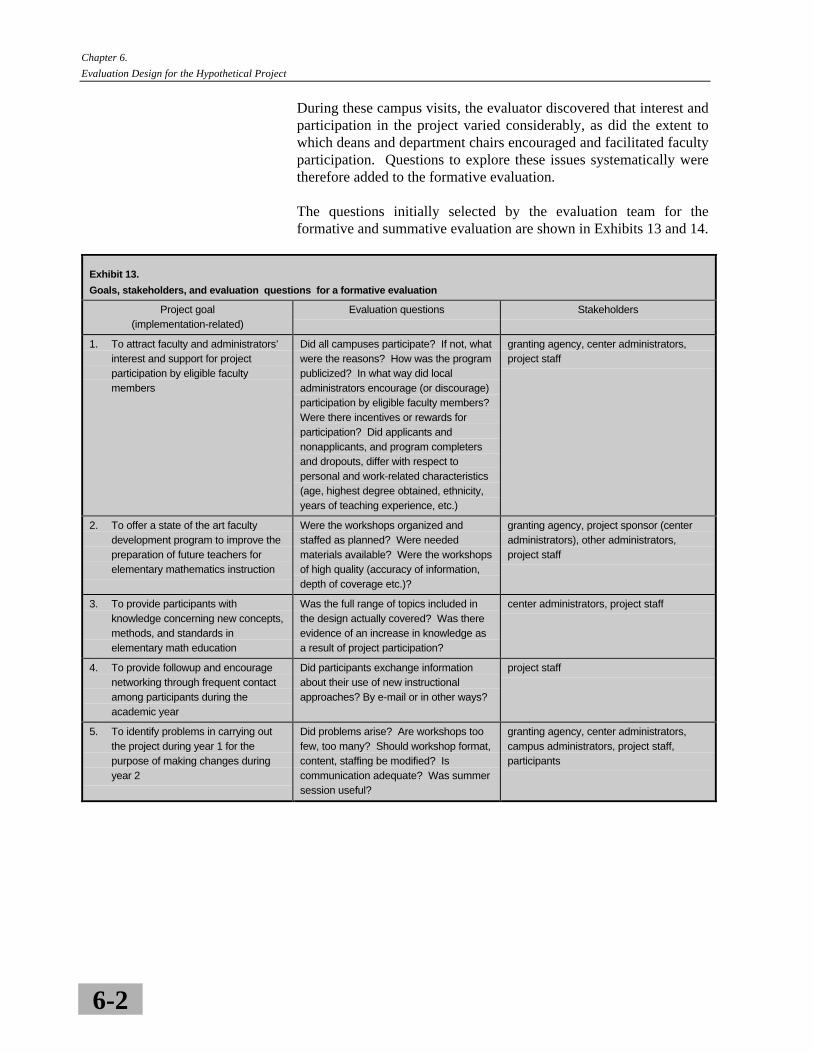
Chapter 6.
Evaluation Design for the Hypothetical Project
6-2
During these campus visits, the evaluator discovered that interest andparticipation in the project varied considerably, as did the extent towhich deans and department chairs encouraged and facilitated facultyparticipation. Questions to explore these issues systematically weretherefore added to the formative evaluation.
The questions initially selected by the evaluation team for theformative and summative evaluation are shown in Exhibits 13 and 14.
Exhibit 13.
Goals, stakeholders, and evaluation questions for a formative evaluation
Project goal(implementation-related)
Evaluation questions Stakeholders
1. To attract faculty and administrators’interest and support for projectparticipation by eligible facultymembers
Did all campuses participate? If not, whatwere the reasons? How was the programpublicized? In what way did localadministrators encourage (or discourage)participation by eligible faculty members?Were there incentives or rewards forparticipation? Did applicants andnonapplicants, and program completersand dropouts, differ with respect topersonal and work-related characteristics(age, highest degree obtained, ethnicity,years of teaching experience, etc.)
granting agency, center administrators,project staff
2. To offer a state of the art facultydevelopment program to improve thepreparation of future teachers forelementary mathematics instruction
Were the workshops organized andstaffed as planned? Were neededmaterials available? Were the workshopsof high quality (accuracy of information,depth of coverage etc.)?
granting agency, project sponsor (centeradministrators), other administrators,project staff
3. To provide participants withknowledge concerning new concepts,methods, and standards inelementary math education
Was the full range of topics included inthe design actually covered? Was thereevidence of an increase in knowledge asa result of project participation?
center administrators, project staff
4. To provide followup and encouragenetworking through frequent contactamong participants during theacademic year
Did participants exchange informationabout their use of new instructionalapproaches? By e-mail or in other ways?
project staff
5. To identify problems in carrying outthe project during year 1 for thepurpose of making changes duringyear 2
Did problems arise? Are workshops toofew, too many? Should workshop format,content, staffing be modified? Iscommunication adequate? Was summersession useful?
granting agency, center administrators,campus administrators, project staff,participants
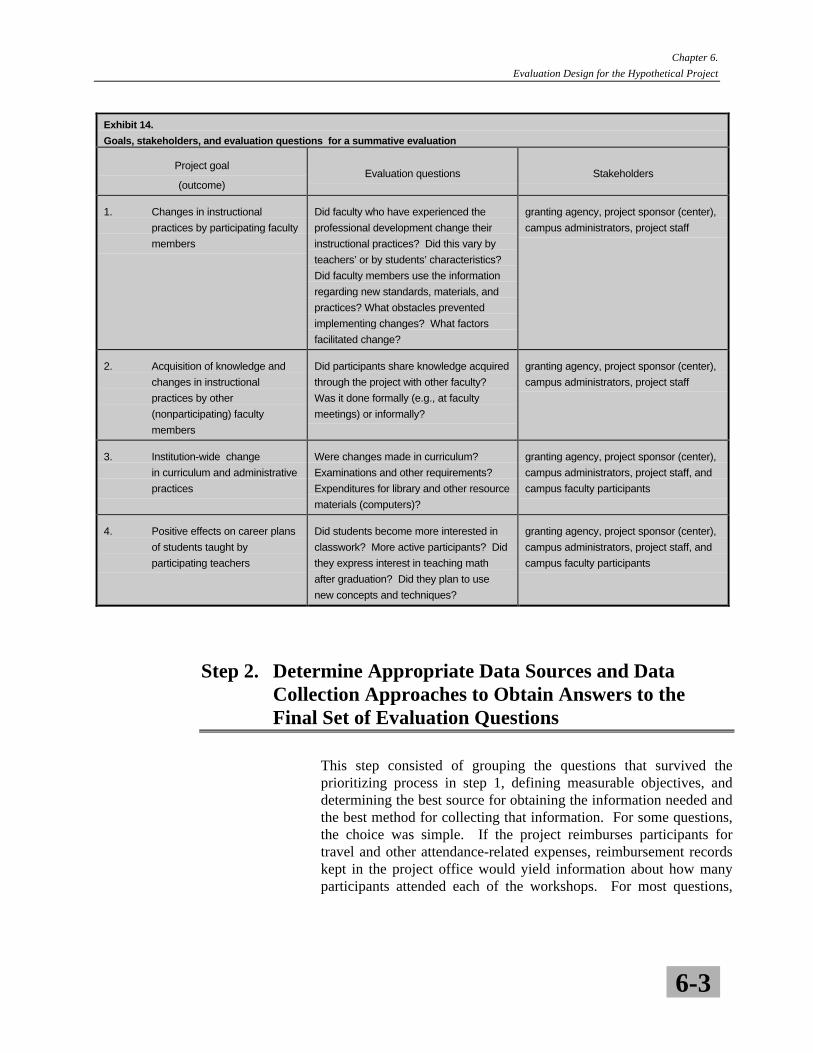
Chapter 6.
Evaluation Design for the Hypothetical Project
6-3
Exhibit 14.
Goals, stakeholders, and evaluation questions for a summative evaluation
Project goal
(outcome)Evaluation questions Stakeholders
1. Changes in instructional
practices by participating faculty
members
Did faculty who have experienced the
professional development change their
instructional practices? Did this vary by
teachers’ or by students’ characteristics?
Did faculty members use the information
regarding new standards, materials, and
practices? What obstacles prevented
implementing changes? What factors
facilitated change?
granting agency, project sponsor (center),
campus administrators, project staff
2. Acquisition of knowledge and
changes in instructional
practices by other
(nonparticipating) faculty
members
Did participants share knowledge acquired
through the project with other faculty?
Was it done formally (e.g., at faculty
meetings) or informally?
granting agency, project sponsor (center),
campus administrators, project staff
3. Institution-wide change
in curriculum and administrative
practices
Were changes made in curriculum?
Examinations and other requirements?
Expenditures for library and other resource
materials (computers)?
granting agency, project sponsor (center),
campus administrators, project staff, and
campus faculty participants
4. Positive effects on career plans
of students taught by
participating teachers
Did students become more interested in
classwork? More active participants? Did
they express interest in teaching math
after graduation? Did they plan to use
new concepts and techniques?
granting agency, project sponsor (center),
campus administrators, project staff, and
campus faculty participants
Step 2. Determine Appropriate Data Sources and DataCollection Approaches to Obtain Answers to theFinal Set of Evaluation Questions
This step consisted of grouping the questions that survived theprioritizing process in step 1, defining measurable objectives, anddetermining the best source for obtaining the information needed andthe best method for collecting that information. For some questions,the choice was simple. If the project reimburses participants fortravel and other attendance-related expenses, reimbursement recordskept in the project office would yield information about how manyparticipants attended each of the workshops. For most questions,
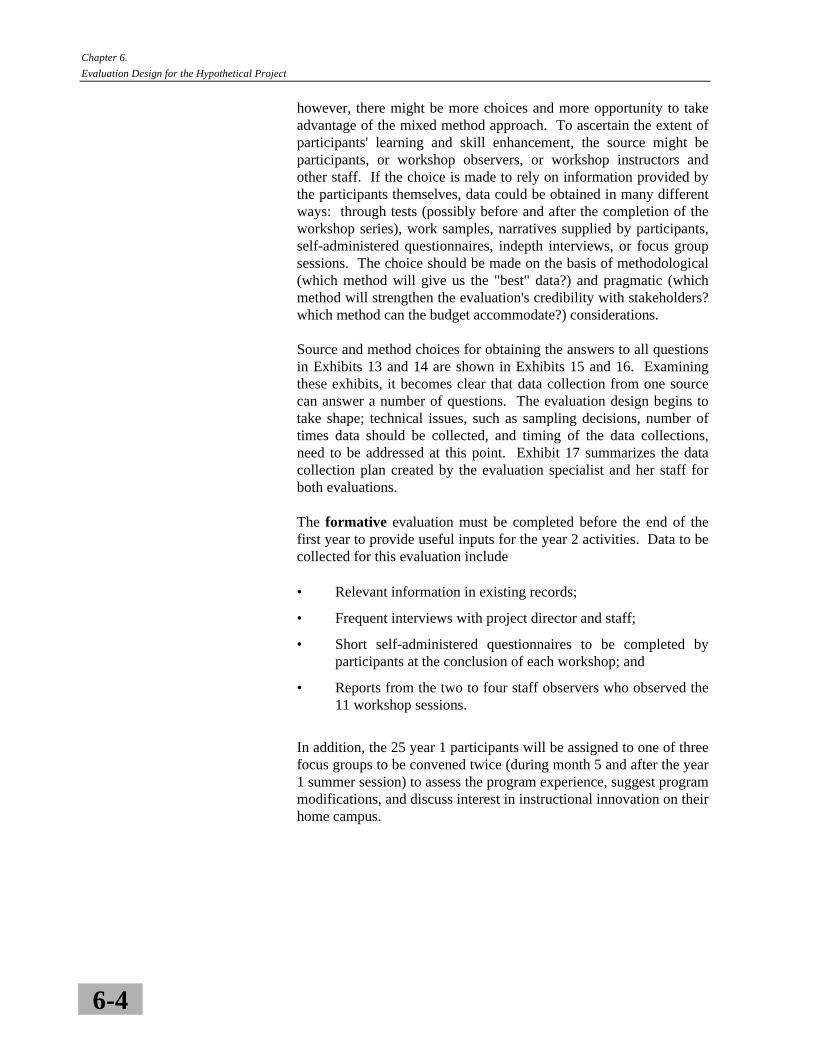
Chapter 6.
Evaluation Design for the Hypothetical Project
6-4
however, there might be more choices and more opportunity to takeadvantage of the mixed method approach. To ascertain the extent ofparticipants' learning and skill enhancement, the source might beparticipants, or workshop observers, or workshop instructors andother staff. If the choice is made to rely on information provided bythe participants themselves, data could be obtained in many differentways: through tests (possibly before and after the completion of theworkshop series), work samples, narratives supplied by participants,self-administered questionnaires, indepth interviews, or focus groupsessions. The choice should be made on the basis of methodological(which method will give us the "best" data?) and pragmatic (whichmethod will strengthen the evaluation's credibility with stakeholders?which method can the budget accommodate?) considerations.
Source and method choices for obtaining the answers to all questionsin Exhibits 13 and 14 are shown in Exhibits 15 and 16. Examiningthese exhibits, it becomes clear that data collection from one sourcecan answer a number of questions. The evaluation design begins totake shape; technical issues, such as sampling decisions, number oftimes data should be collected, and timing of the data collections,need to be addressed at this point. Exhibit 17 summarizes the datacollection plan created by the evaluation specialist and her staff forboth evaluations.
The formative evaluation must be completed before the end of thefirst year to provide useful inputs for the year 2 activities. Data to becollected for this evaluation include
• Relevant information in existing records;
• Frequent interviews with project director and staff;
• Short self-administered questionnaires to be completed byparticipants at the conclusion of each workshop; and
• Reports from the two to four staff observers who observed the11 workshop sessions.
In addition, the 25 year 1 participants will be assigned to one of threefocus groups to be convened twice (during month 5 and after the year1 summer session) to assess the program experience, suggest programmodifications, and discuss interest in instructional innovation on theirhome campus.
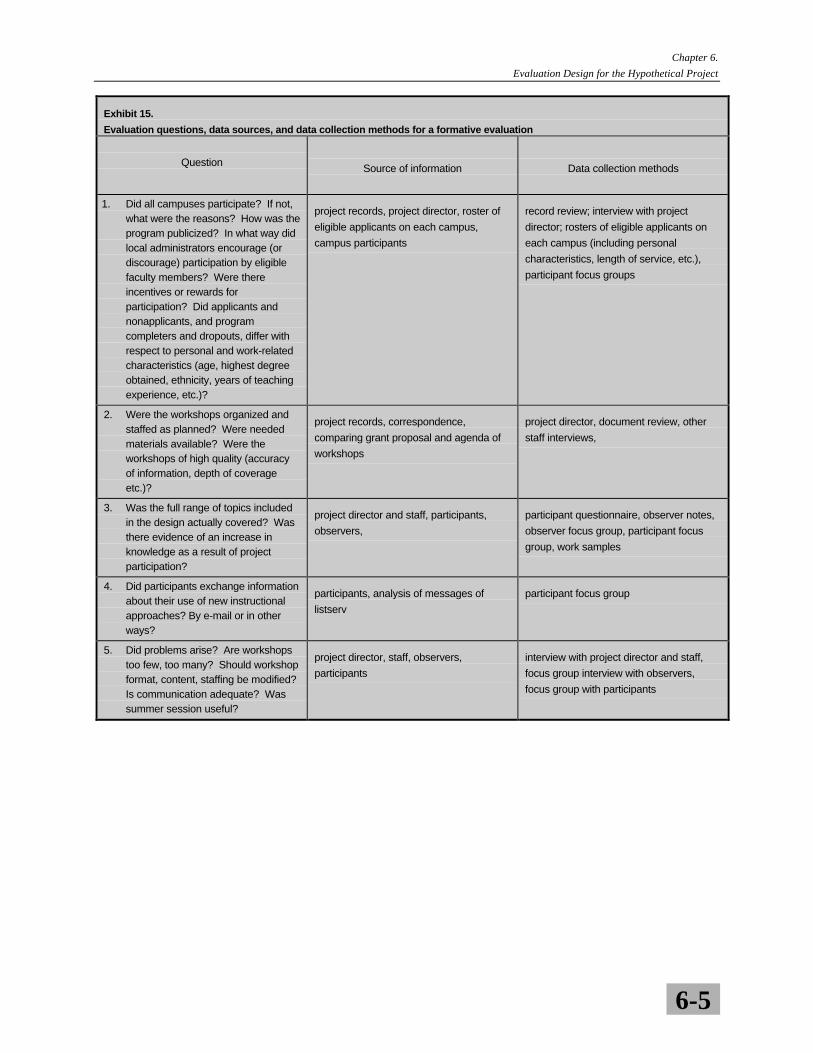
Chapter 6.
Evaluation Design for the Hypothetical Project
6-5
Exhibit 15.
Evaluation questions, data sources, and data collection methods for a formative evaluation
Question Source of information Data collection methods
1. Did all campuses participate? If not,what were the reasons? How was theprogram publicized? In what way didlocal administrators encourage (ordiscourage) participation by eligiblefaculty members? Were thereincentives or rewards forparticipation? Did applicants andnonapplicants, and programcompleters and dropouts, differ withrespect to personal and work-relatedcharacteristics (age, highest degreeobtained, ethnicity, years of teachingexperience, etc.)?
project records, project director, roster of
eligible applicants on each campus,
campus participants
record review; interview with project
director; rosters of eligible applicants on
each campus (including personal
characteristics, length of service, etc.),
participant focus groups
2. Were the workshops organized andstaffed as planned? Were neededmaterials available? Were theworkshops of high quality (accuracyof information, depth of coverageetc.)?
project records, correspondence,
comparing grant proposal and agenda of
workshops
project director, document review, other
staff interviews,
3. Was the full range of topics includedin the design actually covered? Wasthere evidence of an increase inknowledge as a result of projectparticipation?
project director and staff, participants,
observers,
participant questionnaire, observer notes,
observer focus group, participant focus
group, work samples
4. Did participants exchange informationabout their use of new instructionalapproaches? By e-mail or in otherways?
participants, analysis of messages of
listserv
participant focus group
5. Did problems arise? Are workshopstoo few, too many? Should workshopformat, content, staffing be modified?Is communication adequate? Wassummer session useful?
project director, staff, observers,
participants
interview with project director and staff,
focus group interview with observers,
focus group with participants
Chapter 6.
Evaluation Design for the Hypothetical Project
6-6
Exhibit 16.
Evaluation questions, data sources, and data collection methods for summative evaluation
Question Source of information Data collection methods
1. Did faculty who have experienced
the professional development
change their instructional practices?
Did this vary by teachers’ or by
students’ characteristics? Do they
use the information regarding new
standards, materials, and practices?
What obstacles prevented
implementing changes? What
factors facilitated change?
participants, classroom observers,
department chair
focus group with participants, reports of
classroom observers, interview with
department chair
2. Did participants share knowledge
acquired through the project with
other faculty? Was it done formally
(e.g., at faculty meetings) or
informally?
participants, other faculty, classroom
observers, department chair
focus groups with participants, interviews
with nonparticipants, reports of classroom
observers (nonparticipants’ classrooms),
interview with department chair
3. Were changes made in curriculum?
Examinations and other
requirements? Expenditures for
library and other resource materials
(computers)?
participants, department chair, dean,
budgets and other documents
focus groups with participants, interview
with department chair and dean, document
review
4. Did students become more
interested in classwork? More
active participants? Did they
express interest in teaching math
after graduation? Did they plan to
use new concepts and techniques?
students, participants self-administered questionnaire to be
completed by students, focus group with
participants
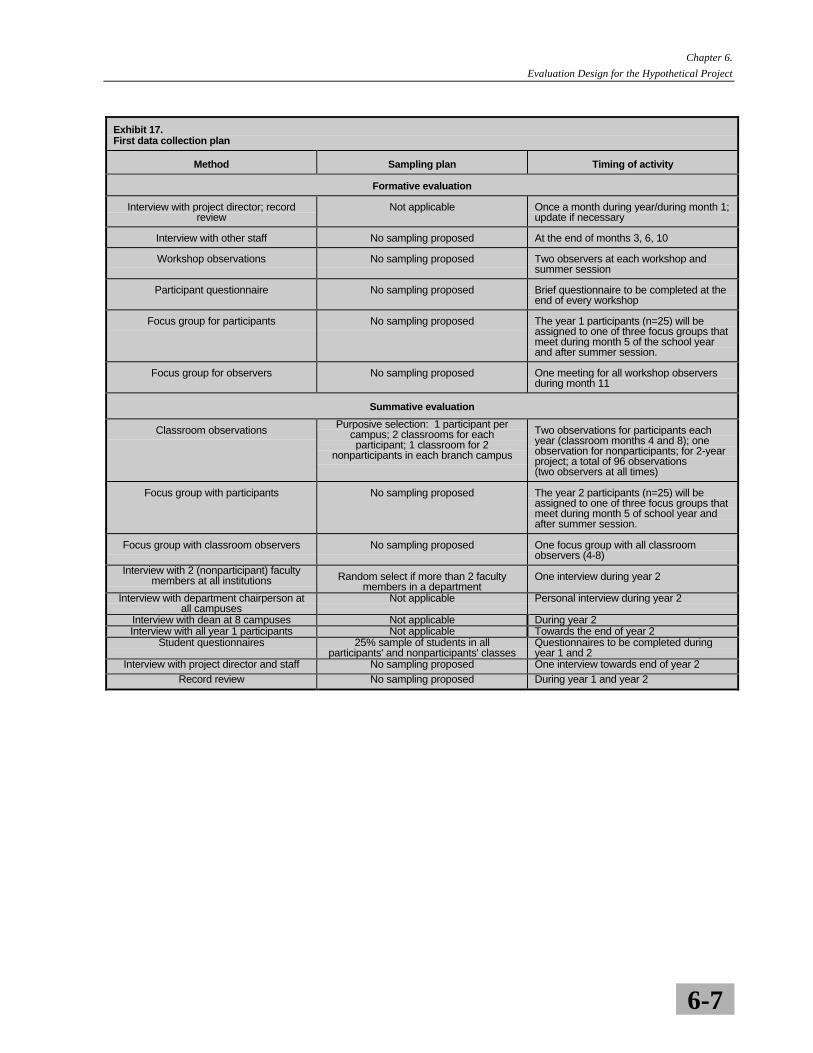
Chapter 6.
Evaluation Design for the Hypothetical Project
6-7
Exhibit 17.First data collection plan
Method Sampling plan Timing of activity
Formative evaluation
Interview with project director; recordreview
Not applicable Once a month during year/during month 1;update if necessary
Interview with other staff No sampling proposed At the end of months 3, 6, 10
Workshop observations No sampling proposed Two observers at each workshop andsummer session
Participant questionnaire No sampling proposed Brief questionnaire to be completed at theend of every workshop
Focus group for participants No sampling proposed The year 1 participants (n=25) will beassigned to one of three focus groups thatmeet during month 5 of the school yearand after summer session.
Focus group for observers No sampling proposed One meeting for all workshop observersduring month 11
Summative evaluation
Classroom observations Purposive selection: 1 participant percampus; 2 classrooms for eachparticipant; 1 classroom for 2
nonparticipants in each branch campus
Two observations for participants eachyear (classroom months 4 and 8); oneobservation for nonparticipants; for 2-yearproject; a total of 96 observations(two observers at all times)
Focus group with participants No sampling proposed The year 2 participants (n=25) will beassigned to one of three focus groups thatmeet during month 5 of school year andafter summer session.
Focus group with classroom observers No sampling proposed One focus group with all classroomobservers (4-8)
Interview with 2 (nonparticipant) facultymembers at all institutions Random select if more than 2 faculty
members in a departmentOne interview during year 2
Interview with department chairperson atall campuses
Not applicable Personal interview during year 2
Interview with dean at 8 campuses Not applicable During year 2Interview with all year 1 participants Not applicable Towards the end of year 2
Student questionnaires 25% sample of students in allparticipants' and nonparticipants' classes
Questionnaires to be completed duringyear 1 and 2
Interview with project director and staff No sampling proposed One interview towards end of year 2Record review No sampling proposed During year 1 and year 2
Chapter 6.
Evaluation Design for the Hypothetical Project
6-8
The summative evaluation will use relevant data from the formativeevaluation; in addition, the following data will be collected:
• During years 1 and 2, teams of two classroom observers willvisit a sample of participants' and nonparticipants' classrooms.There will be focus group meetings with these observers at theend of school years 1 and 2 (four to eight staff members arelikely to be involved in conducting the 48 scheduledobservations each year).
• During year 2 and after the year 2 summer session, focus groupmeetings will be held with the 25 year 2 participants.
• At the end of year 2, all year 1 participants will be interviewed.
• Interviews will be conducted with nonparticipant facultymembers, department chairs and deans at each campus, theproject director, and project staff.
• Student surveys will be conducted.
Step 3. Reality Testing and Design Modifications: StaffNeeds, Costs, Time Frame Within Which All Tasks(Data Collection, Data Analysis, and Report Writing)Must Be Completed
The evaluation specialist converted the data collection plan (Exhibit17) into a timeline, showing for each month of the 2 1/2-year life ofthe project data collection, data analysis, and report-writing activities.Staff requirements and costs for these activities were also computed.She also contacted the chairperson of the department of elementaryeducation at each campus to obtain clearance for the plannedclassroom observations and data collection from students(undergraduates) during years 1 and 2. This exercise showed a needto fine tune data collection during year 2 so that data analysis couldbegin by month 18; it also suggested that the scheduled datacollection activities and associated data reduction and analysis costswould exceed the evaluation budget by $10,000. Conversations withcampus administrators had raised questions about the feasibility ofon-campus data collection from students. The administrators alsoquestioned the need for the large number of scheduled classroomobservations. The evaluation staff felt that these observations werean essential component of the evaluation, but they decided to surveystudents only once (at the end of year 2). They plan to incorporatequestion about impact on students in the focus group discussions with
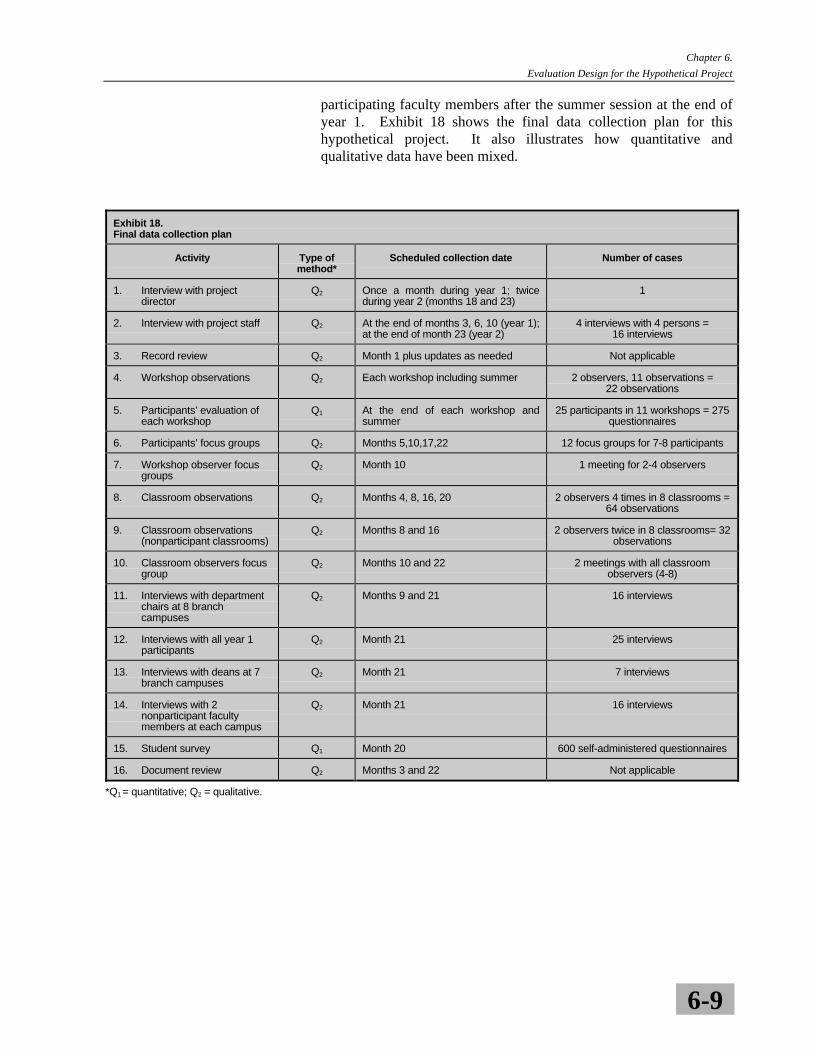
Chapter 6.
Evaluation Design for the Hypothetical Project
6-9
participating faculty members after the summer session at the end ofyear 1. Exhibit 18 shows the final data collection plan for thishypothetical project. It also illustrates how quantitative andqualitative data have been mixed.
Exhibit 18.Final data collection plan
Activity Type ofmethod*
Scheduled collection date Number of cases
1. Interview with projectdirector
Q2 Once a month during year 1; twiceduring year 2 (months 18 and 23)
1
2. Interview with project staff Q2 At the end of months 3, 6, 10 (year 1);at the end of month 23 (year 2)
4 interviews with 4 persons =16 interviews
3. Record review Q2 Month 1 plus updates as needed Not applicable
4. Workshop observations Q2 Each workshop including summer 2 observers, 11 observations =22 observations
5. Participants’ evaluation ofeach workshop
Q1 At the end of each workshop andsummer
25 participants in 11 workshops = 275questionnaires
6. Participants’ focus groups Q2 Months 5,10,17,22 12 focus groups for 7-8 participants
7. Workshop observer focusgroups
Q2 Month 10 1 meeting for 2-4 observers
8. Classroom observations Q2 Months 4, 8, 16, 20 2 observers 4 times in 8 classrooms =64 observations
9. Classroom observations(nonparticipant classrooms)
Q2 Months 8 and 16 2 observers twice in 8 classrooms= 32observations
10. Classroom observers focusgroup
Q2 Months 10 and 22 2 meetings with all classroomobservers (4-8)
11. Interviews with departmentchairs at 8 branchcampuses
Q2 Months 9 and 21 16 interviews
12. Interviews with all year 1participants
Q2 Month 21 25 interviews
13. Interviews with deans at 7branch campuses
Q2 Month 21 7 interviews
14. Interviews with 2nonparticipant facultymembers at each campus
Q2 Month 21 16 interviews
15. Student survey Q1 Month 20 600 self-administered questionnaires
16. Document review Q2 Months 3 and 22 Not applicable
*Q1 = quantitative; Q2 = qualitative.
Chapter 6.
Evaluation Design for the Hypothetical Project
6-10
It should be noted that due chiefly to budgetary constraints, thepriorities that the final evaluation plan did not provide for thesystematic collection of some information that might have been ofimportance for the overall assessment of the project andrecommendations for replication. For example, there is noprovision to examine systematically (by using trained workshopobservers, as is done during year 1) the extent to which the year 2workshops were modified as a result of the formative evaluation.This does not mean, however, that an evaluation question that didnot survive the prioritization process cannot be explored inconjunction with the data collection tools specified in Exhibit 17.Thus, the question of workshop modifications and theireffectiveness can be explored in the interviews scheduled withproject staff and the self-administered questionnaires and focusgroups for year 2 participants. Furthermore, informal interactionbetween the evaluation staff, the project staff, participants, andothers involved in the project can yield valuable information toenrich the evaluation.
Experienced evaluators know that, in hindsight, the prioritizationprocess is often imperfect. And during the life of any project, it islikely that unanticipated events will affect project outcomes. Giventhe flexible nature of qualitative data collection tools, to someextent the need for additional information can be accommodated inmixed method designs by including narrative and anecdotalmaterial. Some of the ways in which such material can beincorporated in reaching conclusions and recommendations will bediscussed in Chapter 7 of this handbook.
7-1
The final task the evaluator is required to perform is to summarizewhat the team has done, what has been learned, and how others mightbenefit from this project’s experience. As a rule, NSF grantees areexpected to submit a final report when the evaluation has beencompleted. For the evaluator, this is seen as the primary reportingtask, which provides the opportunity to depict in detail the richqualitative and quantitative information obtained from the variousstudy activities.
In addition to the contracting agency, most evaluations have otheraudiences as well, such as previously identified stakeholders, otherpolicymakers, and researchers. For these audiences, whose interestmay be limited to a few of the topics covered in the full report,shorter summaries, oral briefings, conference presentations, orworkshops may be more appropriate. Oral briefings allow thesharing of key findings and recommendations with thosedecisionmakers who lack the time to carefully review a voluminousreport. In addition, conference presentations and workshops can beused to focus on special themes or to tailor messages to the interestsand background of a specific audience.
In preparing the final report and other products that communicate theresults of the evaluation, the evaluator must consider the followingquestions:
• How should the communication be best tailored to meet the needsand interests of a given audience?
• How should the comprehensive final report be organized? How
should the findings based on qualitative and quantitative methodsbe integrated?
• Does the report distinguish between conclusions based on robust
data and those that are more speculative?
7 REPORTING THE
RESULTS OF
MIXED METHOD
EVALUATIONS
Preparing a reportprovides evaluators theopportunity to depict in
detail the richinformation obtained
from the variousstudy activities.
Chapter 7.Reporting the Results of Mixed Method Evaluations
7-2
• Where findings are reported, especially those likely to beconsidered sensitive, have appropriate steps been taken to makesure that promises of confidentiality are met?
This chapter deals primarily with these questions. More extensivecoverage of the general topic of reporting and communicatingevaluation results can be found in the earlier User-FriendlyHandbook for Project Evaluation (NSF, 1993).
Ascertaining the Interests and Needs of the Audience
The diversity of audiences for which the findings are likely to be ofinterest is illustrated for the hypothetical project in Exhibit 19. Asshown, in addition to NSF, the immediate audience for the evaluationmight include top-level administrators at the major state university,staff at the Center for Educational Innovation, and the undergraduatefaculty who are targeted to participate in these or similar workshops.Two other indirect audiences might be policymakers at other 4-yearinstitutions interested in developing similar preservice programs andother researchers. Each of these potential audiences might beinterested in different aspects of the evaluation's findings. Not alldata collected in a mixed method evaluation will be relevant to theirinterests. For example:
• The National Science Foundation staff interested in replicationmight want rich narrative detail in order to help otheruniversities implement similar preservice programs. For thisaudience, the model would be a descriptive report that tracesthe flow of events over time, recounts how the preserviceprogram was planned and implemented, identifies factors thatfacilitated or impeded the project’s overall success, andrecommends possible modifications.
• Top-level administrators at the university might be mostinterested in knowing whether the preservice program had itsintended effect, i.e., to inform future decisions about fundinglevels and to optimize the allocation of scarce educationalresources. For this audience, data from the summativeevaluation are most pertinent.
• Staff at the Center for Educational Innovation might beinterested in knowing which activities were most successful inimproving the overall quality of their projects. In addition, theCenter would likely want to use any positive findings togenerate ongoing support for their program.
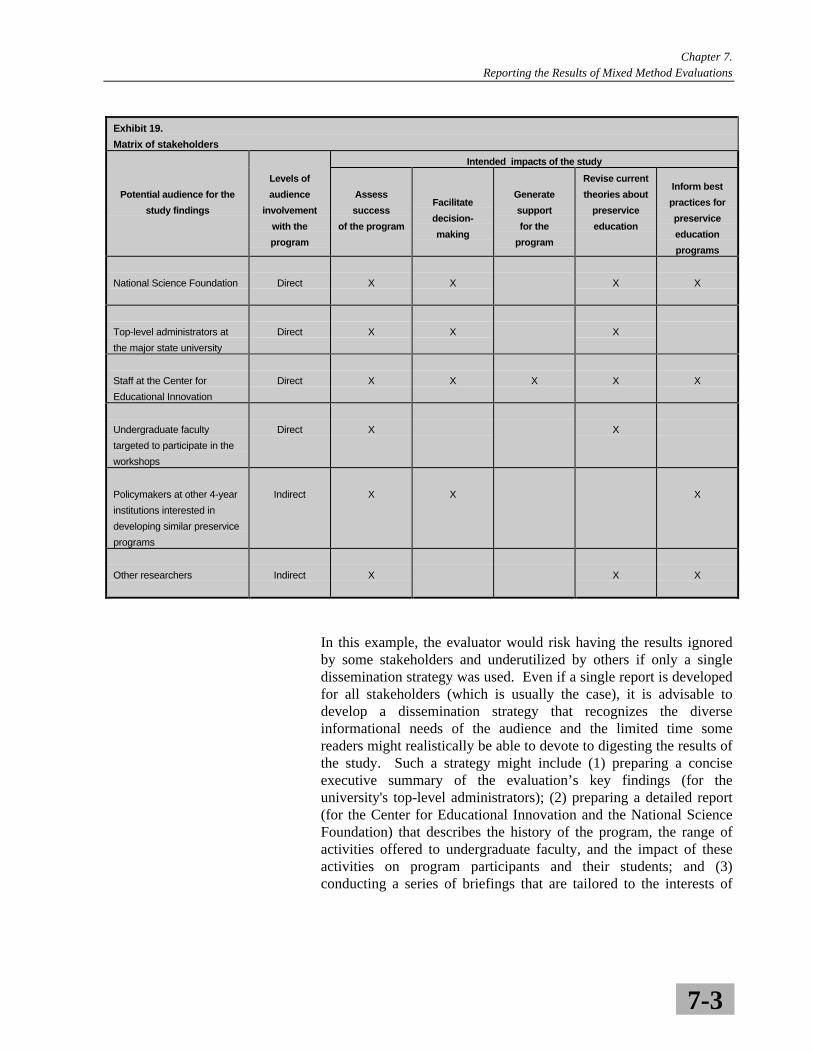
Chapter 7.Reporting the Results of Mixed Method Evaluations
7-3
Exhibit 19.
Matrix of stakeholders
Intended impacts of the study
Potential audience for the
study findings
Levels of
audience
involvement
with the
program
Assess
success
of the program
Facilitate
decision-
making
Generate
support
for the
program
Revise current
theories about
preservice
education
Inform best
practices for
preservice
education
programs
National Science Foundation Direct X X X X
Top-level administrators at
the major state university
Direct X X X
Staff at the Center for
Educational Innovation
Direct X X X X X
Undergraduate faculty
targeted to participate in the
workshops
Direct X X
Policymakers at other 4-year
institutions interested in
developing similar preservice
programs
Indirect X X X
Other researchers Indirect X X X
In this example, the evaluator would risk having the results ignoredby some stakeholders and underutilized by others if only a singledissemination strategy was used. Even if a single report is developedfor all stakeholders (which is usually the case), it is advisable todevelop a dissemination strategy that recognizes the diverseinformational needs of the audience and the limited time somereaders might realistically be able to devote to digesting the results ofthe study. Such a strategy might include (1) preparing a conciseexecutive summary of the evaluation’s key findings (for theuniversity's top-level administrators); (2) preparing a detailed report(for the Center for Educational Innovation and the National ScienceFoundation) that describes the history of the program, the range ofactivities offered to undergraduate faculty, and the impact of theseactivities on program participants and their students; and (3)conducting a series of briefings that are tailored to the interests of
Chapter 7.Reporting the Results of Mixed Method Evaluations
7-4
specific stakeholders (e.g., university administrators might be briefedon the program's tangible benefits and costs). By referring back tothe worksheets that were developed in planning the evaluation (seeChapter 5), the interests of specific stakeholders can be ascertained.However, rigid adherence to the original interests expressed bystakeholders is not always the best approach. This strategy mayshortchange the audience if the evaluation—as is often the case—pointed to unanticipated developments. It should also be pointed outthat while the final report usually is based largely on answers tosummative evaluation questions, it is useful to summarize salientresults of the formative evaluation as well, where these resultsprovide important information for project replication.
Organizing and Consolidating the Final Report
Usually, the organization of mixed method reports follows thestandard format, described in detail in the earlier NSF user-friendlyhandbook, that consists of five major sections:
• Background (the project’s objectives and activities); • Evaluation questions (meeting stakeholders’ information needs); • Methodology (data collection and analysis); • Findings; and • Conclusions (and recommendations). In addition to the main body of the report, a short abstract and a one-to four-page executive summary should be prepared. The latter isespecially important because many people are more likely to read theexecutive summary than the full document. The executive summarycan help focus readers on the most significant aspects of theevaluation. It is desirable to keep the methodology section short and toinclude a technical appendix containing detailed information aboutthe data collection and other methodological issues. All evaluationinstruments and procedures should be contained in the appendix, wherethey are accessible to interested readers.
Regardless of the audience for which it is written, the final reportmust engage the reader and stimulate attention and interest.Descriptive narrative, anecdotes, personalized observations, andvignettes make for livelier reading than a long recitation of statistical
Many people aremore likely to read
the executivesummary than the
full document.
Chapter 7.Reporting the Results of Mixed Method Evaluations
7-5
measures and indicators. One of the major virtues of the mixedmethod approach is the evaluator’s ability to balance narrative andnumerical reporting. This can be done in many ways: for example,by alternating descriptive material (obtained through qualitativetechniques) and numerical material (obtained through quantitativetechniques) when describing project activities, or by using qualitativeinformation to illustrate, personalize, or explicate a statistical finding.
But—as discussed in the earlier chapters—the main virtue of using amixed method approach is that it enlarges the scope of the analysis.And it is important to remember that the purpose of the final report isnot only to tell the story of the project, its participants, and itsactivities, but also to assess in what ways it succeeded or failed inachieving its goals.
In preparing the findings section, which constitutes the heart of thereport, it is important to balance and integrate the descriptive andevaluative reporting section. A well-written report should provide aconcise context for understanding the conditions in which resultswere obtained and identifying specific factors (e.g., implementationstrategies) that affected the results. According to Patton (1990),
Description is thus balanced by analysis andinterpretation. Endless description becomes its ownmuddle. The purpose of analysis is to organizedescription so that it is manageable. Description isbalanced by analysis and leads into interpretation.An interesting and reasonable report providessufficient description to allow the reader tounderstand the basis for an interpretation, andsufficient interpretation to allow the reader tounderstand the description.
For the hypothetical project, most questions identified for thesummative evaluation in Exhibit 16 can be explored through the jointuse of qualitative and quantitative data, as shown in Exhibit 20. Forexample, to answer some of the questions pertaining to the impact offaculty training on their students’ attitudes and behaviors,quantitative data (obtained from a student survey) are being used,together with qualitative information obtained through severaltechniques (classroom observations, faculty focus groups, interviewswith knowledgeable informants.)
The purpose of thefinal report is not onlyto tell the story of the
project, but also toassess in what ways itsucceeded or failed in
achieving its goals.
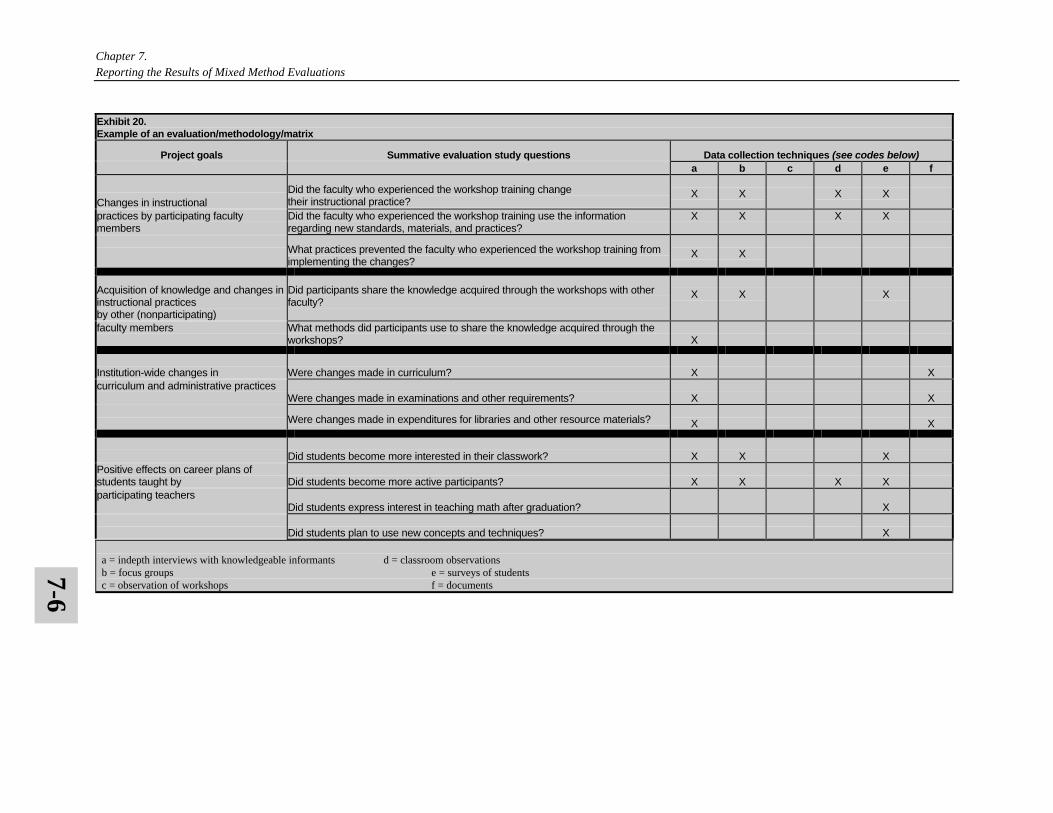
Chapter 7.Reporting the Results of Mixed Method Evaluations
Exhibit 20.Example of an evaluation/methodology/matrix
Project goals Summative evaluation study questions Data collection techniques (see codes below)a b c d e f
Changes in instructionalDid the faculty who experienced the workshop training changetheir instructional practice?
X X X X
practices by participating facultymembers
Did the faculty who experienced the workshop training use the informationregarding new standards, materials, and practices?
X X X X
What practices prevented the faculty who experienced the workshop training fromimplementing the changes?
X X
Acquisition of knowledge and changes ininstructional practicesby other (nonparticipating)
Did participants share the knowledge acquired through the workshops with otherfaculty?
X X X
faculty members What methods did participants use to share the knowledge acquired through theworkshops? X
Institution-wide changes in Were changes made in curriculum? X Xcurriculum and administrative practices
Were changes made in examinations and other requirements? X X
Were changes made in expenditures for libraries and other resource materials? X X
Did students become more interested in their classwork? X X XPositive effects on career plans ofstudents taught by Did students become more active participants? X X X Xparticipating teachers
Did students express interest in teaching math after graduation? X
Did students plan to use new concepts and techniques? X
a = indepth interviews with knowledgeable informants d = classroom observations b = focus groups e = surveys of students c = observation of workshops f = documents
7-6
Chapter 7.Reporting the Results of Mixed Method Evaluations
7-7
Formulating Sound Conclusions and Recommendations
In the great majority of reporting activities, the evaluator will seek toinclude a conclusion and recommendations section in which thefindings are summarized, broader judgments are made about thestrengths and weaknesses of the project and its various features, andrecommendations for future, perhaps improved, replications arepresented. Like the executive summary, this section is widely read andmay affect policymakers' and administrators' decisions with respect tofuture project support.
The report writer can include in this section only a limited amount ofmaterial, and should therefore select the most salient findings. But howshould saliency be defined? Should the "strongest" findings beemphasized, i.e., those satisfying accepted criteria for soundness in thequantitative and qualitative traditions? Or should the writer presentmore sweeping conclusions, ones which may be based in part onimpressionistic and anecdotal material?
It can be seen that the evaluator often faces a dilemma. On the onehand, it is extremely important that the bulk of evaluative statementsmade in this section can be supported by accurate and robust data andsystematic analysis. As discussed in Chapter 1, some stakeholders mayseek to discredit evaluations if they are not in accord with theirexpectations or preferences; such critics may question the conclusionsand recommendations offered by the evaluator that seem to leapbeyond the documented evidence. On the other hand, it is oftenbeneficial to capture insights that result from immersion in a project,insights not provided by sticking only to results obtained throughscientific documentation. The evaluator may have developed a strong,intuitive sense of how the project really worked out, what were its bestor worst features, and what benefits accrued to participants or toinstitutions impacted by the project (for example, schools or schoolsystems). Thus, there may be a need to stretch the data beyond theirinherent limits, or to make statements for which the only supportingdata are anecdotal.
We have several suggestions for dealing with these issues:
• Distinguish carefully between conclusions that are based on“hard” data and those that are more speculative. The beststrategy is to start the conclusions section with material that hasundergone thorough verification and to place the more subjectivespeculations toward the end of the section.
• Provide full documentation for all findings where available.Data collection instruments, descriptions of the study subjects,specific procedures followed for data collection, survey
Chapter 7.Reporting the Results of Mixed Method Evaluations
7-8
response rates, refusal rates for personal interviews and focusgroup participation, access problems, etc., should all be discussedin an appendix. If problems were encountered that may haveaffected the findings, possible biases and how the evaluatorsought to correct them should be discussed.
• Use the recommendations section to express views based on thetotal project experience. Of course, references to data should beincluded whenever possible. For example, a recommendation inthe report for the hypothetical project might include thefollowing phrase: "Future programs should provide career-relatedincentives for faculty participation, as was suggested by severalparticipants." But the evaluator should also feel free to offercreative suggestions that do not necessarily rely on the systematicdata collection.
Maintaining Confidentiality
All research involving human subjects entails possible risks forparticipants and usually requires informed consent on their part. Toobtain this consent, researchers usually assure participants that theiridentity will not be revealed when the research is reported and that allinformation obtained through surveys, focus groups, personalinterviews, and observations will be handled confidentially.Participants are assured that the purpose of the study is not to makejudgments about their performance or behavior, but simply toimprove knowledge about a project's effectiveness and improvefuture activities.
In quantitative studies, reporting procedures have been developed tominimize the risk that the actions and responses of participants can beassociated with a specific individual; usually results are reported forgroupings only and, as a rule, only for groupings that include aminimum number of subjects.
In studies that use qualitative methods, it may be more difficult toreport all findings in ways that make it impossible to identify aparticipant. The number of respondents is often quite small, especiallyif one is looking at respondents with characteristics that are of specialinterest in the analysis (for example, older teachers, or teachers whohold a graduate degree). Thus, even if a finding does not name therespondent, it may be possible for someone (a colleague, anadministrator) to identify a respondent who made a critical ordisparaging comment in an interview.
Chapter 7.Reporting the Results of Mixed Method Evaluations
7-9
Of course, not all persons who are interviewed in the course of anevaluation can be anonymous: the name of those persons who have aunique or high status role (the project director, a college dean, or aschool superintendent) are known, and anonymity should not bepromised. The issue is of importance to more vulnerable persons,usually those in subordinate positions (teachers, counselors, orstudents) who may experience negative consequences if their behaviorand opinions become known.
It is in the interest of the evaluator to obtain informed consent fromparticipants by assuring them that their participation is risk-free; theywill be more willing to participate and will speak more openly. But inthe opinion of experienced qualitative researchers, it is oftenimpossible to fulfill promises of anonymity when qualitative methodsare used:
Confidentiality and anonymity are usuallypromised—sometimes very superficially—ininitial agreements with respondents. Forexample, unless the researcher explainsvery clearly what a fed-back case will looklike, people may not realize that they willnot be anonymous at all to other peoplewithin the setting who read the case (Milesand Huberman, 1994).
The evaluator may also find it difficult to balance the need to conveycontextual information that will provide vivid descriptive informationand the need to protect the identity of informants. But if participantshave been promised anonymity, it behooves the evaluator to take everyprecaution so that informants cannot be linked to any of theinformation they provided.
In practice, the decision of how and when to attribute findings to asite or respondent is generally made on a case-by-case basis. Thefollowing example provides a range of options for revealing anddisclosing the source of information received during an interviewconducted for the hypothetical project:
• Attribute the information to a specific respondent withinan individual site: “The dean at Lakewood College indicatedthat there was no need for curriculum changes at this time.”
• Attribute the information to someone within a site: “Arespondent at Lakewood College indicated that there was noneed for curriculum changes at this time.” In this example, therespondent's identity within the site is protected, i.e., the readeris only made aware that someone at a site expressed apreference for the status quo. Note that this option would not
Chapter 7.Reporting the Results of Mixed Method Evaluations
7-10
be used if only one respondent at the school was in a positionto make this statement.
• Attribute the information to the respondent type withoutidentifying the site: “The dean at one of the participatingcolleges indicated that there was no need for curriculumchanges at this time.” In this example, the reader is only madeaware of the type of respondent that expressed a preference forthe status quo.
• Do not attribute the information to a specific respondenttype or site: “One of the study respondents indicated thatthere was no need for curriculum changes at this time.” In thisexample, the identity of the respondent is fully protected.
Each of these alternatives has consequences not only for protectingrespondent anonymity, but also for the value of the information that isbeing conveyed. The first formulation discloses the identity of therespondent and should only be used if anonymity was not promisedinitially, or if the respondent agrees to be identified. The lastalternative, while offering the best guarantee of anonymity, is sogeneral that it weakens the impact of the finding. Depending on thedirection taken by the analysis (were there important differences bysite? by type of respondent?), it appears that either the second or thirdalternative 2 or 3 represents the best choice.
One common practice is to summarize key findings in chapters thatprovide cross-site analyses of controversial issues. This alternative is“directly parallel to the procedure used in surveys, in which the onlypublished report is about the aggregate evidence” (Yin, 1990).Contextual information about individual sites can be providedseparately, e.g., in other chapters or an appendix.
Tips for Writing Good Evaluation Reports
Start early. Although we usually think about report writing as thefinal step in the evaluation, a good deal of the work can (and oftendoes) take place before the data are collected. For example, abackground section can often be developed using material from theoriginal proposal. While some aspects of the methodology maydeviate from the original proposal as the study progresses, most ofthe background information (e.g., nature of the problem, projectgoals) will remain the same throughout the evaluation. In addition,the evaluation study questions section can often be written usingmaterial that was developed for the evaluation design. The
Chapter 7.Reporting the Results of Mixed Method Evaluations
7-11
evaluation findings, conclusions, and recommendations generallyneed to wait for the end of the evaluation.
Because of the volume of written data that are collected on site, it isgenerally a good idea to organize study notes as soon after a site visitor interview as possible. These notes will often serve as a startingpoint for any individual case studies that might be included in thereport. In addition, as emphasized in Chapter 4, preparing writtentext soon after the data collection activity will help to classify anddisplay the data and reduce the overall volume of narrative data thatwill eventually need to be summarized and reported at the end of thestudy. Finally, preparing sections of the findings chapter during thedata collection phase allows researchers to generate preliminaryconclusions or identify potential trends that can be confirmed orrefuted by additional data collection activities.
Make the report concise and readable. Because of the volume ofmaterial that is generally collected during mixed method evaluations,a challenging aspect of reporting is deciding what information mightbe omitted from the final report. As a rule, only a fraction of thetabulations prepared for survey analysis need to be displayed anddiscussed. Qualitative field work and data collection methods yield alarge volume of narrative information, and evaluators who try toincorporate all of the qualitative data they collected into their reportrisk losing their audience. Conversely, by omitting too much,evaluators risk removing the context that helps readers attachmeaning to any of the report's conclusions. One method for limitingthe volume of information is to include only narrative that is tied tothe evaluation questions. Regardless of how interesting an anecdoteis, if the information does not relate to one of the evaluationquestions, it probably does not belong in the report. As discussedpreviously, another method is to consider the likely informationneeds of your audience. Thinking about who is most likely to actupon the report's findings may help in the preparation of a useful andilluminating narrative (and in the discarding of anecdotes that areirrelevant to the needs of the reader).
The liberal use of qualitative information will enhance the overalltone of the report. In particular, lively quotes can highlight keypoints and break up the tedium of a technical summation of studyfindings. In addition, graphic displays and tables can be used tosummarize significant trends that were uncovered duringobservations or interviews. Photographs are an effective tool tofamiliarize readers with the conditions (e.g., classroom size) withinwhich a project is being implemented. New desktop publishing andsoftware packages have made it easier to enhance papers andbriefings with photographs, colorful graphics, and even cartoons.Quotes can be enlarged and italicized throughout the report to make
New desktoppublishing and
software packageshave made it easier toenhance papers and
briefings withphotographs, colorful
graphics, and evencartoons.
A challenging aspectof reporting isdeciding what
information mightbe omitted from the
final report.
Chapter 7.Reporting the Results of Mixed Method Evaluations
7-12
important points or to personalize study findings. Many of thesesuggestions hold true for oral presentations as well.
Solicit feedback from project staff and respondents. It is oftenuseful to ask the project director and other staff members to reviewsections of the report that quote information they have contributed ininterviews, focus groups, or informal conversations. This review isuseful for correcting omissions and misinterpretations and may elicitnew details or insights that staff members failed to share during thedata collection period. The early review may also avoid angry denialsafter the report becomes public, although it is no guarantee thatcontroversy and demands for changes will not follow publication.However, the objectivity of the evaluation is best served if overallfindings, conclusions and recommendations are not shared with theproject staff before the draft is circulated to all stakeholders.
In general, the same approach is suggested for obtaining feedback fromrespondents. It is essential to inform them of the inclusion of data withwhich they can be identified, and to honor requests for anonymity. Theextent to which other portions of the write-up should be shared withrespondents will depend on the nature of the project and the respondentpopulation, but in general it is probably best to solicit feedbackfollowing dissemination of the report to all stakeholders.
References
Miles, M.B., and Huberman, A.M. (1994). Qualitative DataAnalysis, 2nd Ed. Newbury Park, CA: Sage.
National Science Foundation. (1993). User-Friendly Handbook forProject Evaluation: Science, Mathematics, Engineering, andTechnical Education. NSF 93-152. Washington, DC: NSF.
Patton, M.Q. (1990). Qualitative Evaluation and Research Method,2nd Ed. Newbury Park, CA: Sage.
Yin, R.K. (1989). Case Study Research: Design and Method.Newbury Park, CA: Sage.
PART IV.
SUPPLEMENTARY
MATERIALS
8-1
In selecting books and major articles for inclusion in this shortbibliography, an effort was made to incorporate those useful forprincipal investigators (PIs) and project directors (PDs) who want tofind information relevant to the tasks they will face, and which thisbrief handbook could not cover in depth. Thus, we have not includedall books that experts in qualitative research and mixed methodevaluations would consider to be of major importance. Instead, wehave included primarily reference materials that NSF/EHR granteesshould find most useful. Included are many of those already listed inthe references to Chapters 1 through 7.
Some of these publications are heavier on theory, others deal primarilywith practice and specific techniques used in qualitative data collectionand analysis. However, with few exceptions, all the publicationsselected for this bibliography contain a great deal of technicalinformation and hands-on advice.
Denzin, Norman K., and Lincoln, Yvonna S. (Eds.). (1994). Handbookof Qualitative Research. Thousand Oaks, CA: Sage.
This formidable volume (643 pages set in small type) consists of 36chapters written by experts on their respective topics, all of whom arepassionate advocates of the qualitative method in social andeducational research. The volume covers historical and philosophicalperspectives, as well as detailed research methods. Extensive coverageis given to data collection and data analysis, and to the “art ofinterpretation” of findings obtained through qualitative research. Mostof the chapters assume that the qualitative researcher functions in anacademic setting and uses qualitative methods exclusively; the use ofquantitative methods in conjunction with qualitative approaches andconstraints that apply to evaluation research are seldom considered.However, two chapters—“Designing Funded Qualitative Research,” byJanice M. Morse, and “Qualitative Program Evaluation,” by Jennifer C.Greene—contain a great deal of material of interest to PIs and PDs. ButPIs and PDs will also benefit from consulting other chapters, inparticular “Interviewing,” by Andrea Fontana and James H. Frey, and“Data Management and Analysis Methods,” by A. Michael Hubermanand Matthew B. Miles.
8 ANNOTATED
BIBLIOGRAPHY
Chapter 8.Annotated Bibliography
8-2
The Joint Committee on Standards for Educational Evaluation. (1994).How to Assess Evaluations of Educational Programs, 2nd Ed.Thousand Oaks, CA: Sage.
This new edition of the widely accepted Standards for EducationalEvaluation is endorsed by professional associations in the field ofeducation. The volume defines 30 standards for program evaluation,with examples of their application, and incorporates standards forquantitative as well as qualitative evaluation methods. The Standardsare categorized into four groups: utility, feasibility, propriety, andaccuracy. The Standards are intended to assist legislators, fundingagencies, educational administrators, and evaluators. They are not asubstitute for texts in technical areas such as research design or datacollection and analysis. Instead they provide a framework andguidelines for the practice of responsible and high-quality evaluations.For readers of this handbook, the section on Accuracy Standards,which includes discussions of quantitative and qualitative analysis,justified conclusions, and impartial reporting, is especially useful.
Patton, Michael Quinn. (1990). Qualitative Evaluation and ResearchMethods, 2nd Ed. Newbury Park, CA: Sage.
This is a well-written book with many practical suggestions, examples,and illustrations. The first part covers, in jargon-free language, theconceptual and theoretical issues in the use of qualitative methods; forpractitioners the second and third parts, dealing with design, datacollection, analysis, and interpretation, are especially useful. Pattonconsistently emphasizes a pragmatic approach: he stresses the need forflexibility, common sense, and the choice of methods best suited toproduce the needed information. The last two chapters, “Analysis,Interpretation and Reporting” and “Enhancing the Quality andCredibility of Qualitative Analysis,” are especially useful for PIs andPDs of federally funded research. They stress the need for utilization-focused evaluation and the evaluator's responsibility for providing dataand interpretations, which specific audiences will find credible andpersuasive.
Marshall, Catherine, and Rossman, Gretchen B. (1995). DesigningQualitative Research, 2nd Ed. Thousand Oaks, CA: Sage.
This small book (178 pages) does not deal specifically with theperformance of evaluations; it is primarily written for graduate studentsto provide a practical guide for the writing of research proposals basedon qualitative methods. However, most of the material presented isrelevant and appropriate for project evaluation. In succinct and clearlanguage, the book discusses the main ingredients of a sound research
Chapter 8.Annotated Bibliography
8-3
project: framing evaluation questions; designing the research; datacollection methods; and strategies, data management, and analysis.The chapter on data collection methods is comprehensive and includessome of the less widely used techniques (such as films and videos,unobtrusive measures, and projective techniques) that may be ofinterest for the evaluation of some projects. There are also useful tables(e.g., identifying the strengths and weaknesses of various methods forspecific purposes; managing time and resources), as well as a series ofvignettes throughout the text illustrating specific strategies used byqualitative researchers.
Lofland, John, and Lofland, Lyn H. (1995). Analyzing Social Settings:A Guide to Qualitative Observation and Analysis, 3rd Ed. Belmont,CA: Wadsworth.
As the title indicates, this book is designed as a guide to field studies,using as their main data collection techniques participant observationand intensive interviews. The authors' vast experience and knowledgein these areas results in a thoughtful presentation of both technicaltopics (such as the best approach to compiling field notes) andnontechnical issues, which may be equally important in the conduct ofqualitative research. The chapters that discuss gaining access toinformants, maintaining access for the duration of the study, anddealing with issues of confidentiality and ethical concerns areespecially helpful for PIs and PDs who seek to collect qualitativematerial. Also useful is Chapter 5, “Logging Data,” which deals withall aspects of the interviewing process and includes examples ofquestion formulation, the use of interview guides, and the write-up ofdata.
Miles, Matthew B., and Huberman, A. Michael. (1994). QualitativeData Analysis - An Expanded Sourcebook, 2nd Ed. Thousand Oaks,CA: Sage.
Although this book is not specifically oriented to evaluation research, itis an excellent tool for evaluators because, in the authors' words, “thisis a book for practicing researchers in all fields whose work involvesthe struggle with actual qualitative data analysis issues.” It has thefurther advantage that many examples are drawn from the field ofeducation. Because analysis cannot be separated from research designissues, the book takes the reader through the sequence of steps that laythe groundwork for sound analysis, including a detailed discussion offocusing and bounding the collection of data, as well as managementissues bearing on analysis. The subsequent discussion of analysismethods is very systematic, relying heavily on data displays, matrices,and examples to arrive at meaningful descriptions, explanations, and
Chapter 8.Annotated Bibliography
8-4
the drawing and verifying of conclusions. An appendix covers choiceof software for qualitative data analysis. Readers will find this a verycomprehensive and useful resource for the performance of qualitativedata reduction and analysis.
New Directions for Program Evaluation, Vols. 35, 60, 61. A quarterlypublication of the American Evaluation Association, published byJossey-Bass, Inc., San Francisco, CA.
Almost every issue of this journal contains material of interest to thosewho want to learn about evaluation, but the three issues described hereare especially relevant to the use of qualitative methods in evaluationresearch. Vol. 35 (Fall 1987), Multiple Methods in ProgramEvaluation, edited by Melvin M. Mark and R. Lance Shotland, containsseveral articles discussing the combined use of quantitative andqualitative methods in evaluation designs. Vol. 60 (Winter 1993),Program Evaluation: A Pluralistic Enterprise, edited by Lee Sechrest,includes the article “Critical Multiplism: A Research Strategy and itsAttendant Tactics,” by William R. Shadish, in which the authorprovides a clear discussion of the advantages of combining severalmethods in reaching valid findings. In Vol. 61 (Spring 1994), TheQualitative-Quantitative Debate, edited by Charles S. Reichardt andSharon F. Rallis, several of the contributors take a historicalperspective in discussing the long-standing antagonism betweenqualitative and quantitative researchers in evaluation. Others look forways of integrating the two perspectives. The contributions by severalexperienced nonacademic program and project evaluators (Rossi,Datta, Yin) are especially interesting.
Greene, Jennifer C., Caracelli, Valerie J., and Graham, Wendy F.(1989). “Toward a Conceptual Framework for Mixed-MethodEvaluation Designs” in Educational Evaluation and Policy Analysis,Vol. II, No. 3.
In this article, a framework for the design and implementation ofevaluations using a mixed method methodology is presented, basedboth on the theoretical literature and a review of 57 mixed methodevaluations. The authors have identified five purposes for using mixedmethods, and the recommended design characteristics for each of thesepurposes are presented.
Yin, Robert K. (1989). Case Study Research: Design and Method.Newbury Park, CA: Sage.
The author's background in experimental psychology may explain theemphasis in this book on the use of rigorous methods in the conduct
Chapter 8.Annotated Bibliography
8-5
and analysis of case studies, thus minimizing what many believe is aspurious distinction between quantitative and qualitative studies.While arguing eloquently that case studies are an important tool whenan investigator (or evaluator) has little control over events and whenthe focus is on a contemporary phenomenon within some real-lifecontext, the author insists that case studies be designed and analyzed soas to provide generalizable findings. Although the focus is on designand analysis, data collection and report writing are also covered.
Krueger, Richard A. (1988). Focus Groups: A Practical Guide forApplied Research. Newbury Park, CA: Sage.
Krueger is well known as an expert on focus groups; the bulk of hisexperience and the examples cited in his book are derived from marketresearch. This is a useful book for the inexperienced evaluator whoneeds step-by-step advice on selecting focus group participants, theprocess of conducting focus groups, and analyzing and reportingresults. The author writes clearly and avoids social science jargon,while discussing the complex problems that focus group leaders needto be aware of. This book is best used in conjunction with some of theother references cited here, such as the Handbook of QualitativeResearch (Ch. 22) and Focus Groups: Theory and Practice.
Stewart, David W., and Shamdasani, Prem N. (1990). Focus Groups:Theory and Practice. Newbury Park, CA: Sage.
This book differs from many others published in recent years thataddress primarily techniques of recruiting participants and the actualconduct of focus group sessions. Instead, these authors payconsiderable attention to the fact that focus groups are by definition anexercise in group dynamics. This must be taken into account wheninterpreting the results and attempting to draw conclusions that mightbe applicable to a larger population. However, the book also coversvery adequately practical issues such as recruitment of participants, therole of the moderator, and appropriate techniques for data analysis.
Weiss, Robert S. (1994). Learning from Strangers - The Art andMethod of Qualitative Interview Studies. New York: The Free Press.
After explaining the different functions of quantitative and qualitativeinterviews in the conduct of social science research studies, the authordiscusses in considerable detail the various steps of the qualitativeinterview process. Based largely on his own extensive experience inplanning and carrying out studies based on qualitative interviews, hediscusses respondent selection and recruitment, preparing for the
Chapter 8.Annotated Bibliography
8-6
interview (which includes such topics as pros and cons of taping, theuse of interview guides, interview length, etc.), the interviewingrelationship, issues in interviewing (including confidentiality andvalidity of the information provided by respondents), data analysis, andreport writing. There are lengthy excerpts from actual interviews thatillustrate the topics under discussion. This is a clearly written, veryuseful guide, especially for newcomers to this data collection method.
Wolcott, Harry F. (1994). Transforming Qualitative Data: Descrip-tion, Analysis and Interpretation. Thousand Oaks, CA: Sage.
This book is written by an anthropologist who has done fieldwork forstudies focused on education issues in a variety of cultural settings; hisemphasis throughout is “on what one does with data rather than oncollecting it.” His frank and meticulous description of the ways inwhich he assembled his data, interacted with informants, and reachednew insights based on the gradual accumulation of field experiencesmakes interesting reading. It also points to the pitfalls in theinterpretation of qualitative data, which he sees as the most difficulttask for the qualitative researcher.
U.S. General Accounting Office. (1990). Case Study Evaluations.Transfer Paper 10.1.9. issued by the Program Evaluation andMethodology Division. Washington, DC: GAO.
This paper presents an evaluation perspective on case studies, definesthem, and determines their appropriateness in terms of the type ofevaluation question posed. Unlike the traditional, academic definitionof the case study, which calls for long-term participation by theevaluator or researcher in the site to be studied, the GAO sees a widerange of shorter term applications for case study methods in evaluation.These include their use in conjunction with other methods forillustrative and exploratory purposes, as well as for the assessment ofprogram implementation and program effects. Appendix 1 includes avery useful discussion dealing with the adaptation of the case studymethod for evaluation and the modifications and compromises thatevaluators—unlike researchers who adopt traditional field workmethods—are required to make.
9-1
Accuracy: The extent to which an evaluation is truthful or valid in what it saysabout a program, project, or material.
Achievement: Performance as determined by some type of assessment or testing.
Affective: Consists of emotions, feelings, and attitudes.
Anonymity:(provision for)
Evaluator action to ensure that the identity of subjects cannot beascertained during the course of a study, in study reports, or in any otherway.
Assessment: Often used as a synonym for evaluation. The term is sometimesrecommended for restriction to processes that are focused onquantitative and/or testing approaches
Attitude: A person’s mental set toward another person, thing, or state.
Attrition: Loss of subjects from the defined sample during the course of alongitudinal study.
Audience(s): Consumers of the evaluation; those who will or should read or hear ofthe evaluation, either during or at the end of the evaluation process.Includes those persons who will be guided by the evaluation in makingdecisions and all others who have a stake in the evaluation (seestakeholders).
Authentic assessment: Alternative to traditional testing, using indicators of student taskperformance.
Background: The contextual information that describes the reasons for the project,including its goals, objectives, and stakeholders’ information needs.
Baseline: Facts about the condition or performance of subjects prior to treatmentor intervention.
9 GLOSSARY
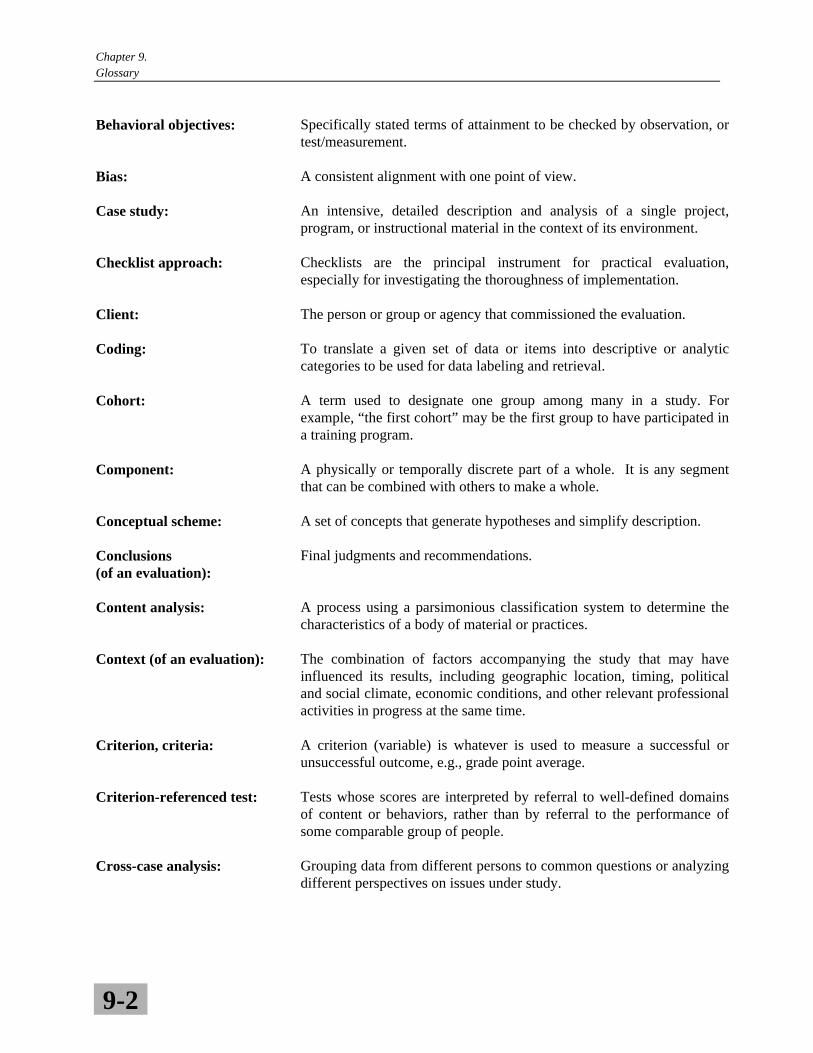
Chapter 9.Glossary
9-2
Behavioral objectives: Specifically stated terms of attainment to be checked by observation, ortest/measurement.
Bias: A consistent alignment with one point of view.
Case study: An intensive, detailed description and analysis of a single project,program, or instructional material in the context of its environment.
Checklist approach: Checklists are the principal instrument for practical evaluation,especially for investigating the thoroughness of implementation.
Client: The person or group or agency that commissioned the evaluation.
Coding: To translate a given set of data or items into descriptive or analyticcategories to be used for data labeling and retrieval.
Cohort: A term used to designate one group among many in a study. Forexample, “the first cohort” may be the first group to have participated ina training program.
Component: A physically or temporally discrete part of a whole. It is any segmentthat can be combined with others to make a whole.
Conceptual scheme: A set of concepts that generate hypotheses and simplify description.
Conclusions(of an evaluation):
Final judgments and recommendations.
Content analysis: A process using a parsimonious classification system to determine thecharacteristics of a body of material or practices.
Context (of an evaluation): The combination of factors accompanying the study that may haveinfluenced its results, including geographic location, timing, politicaland social climate, economic conditions, and other relevant professionalactivities in progress at the same time.
Criterion, criteria: A criterion (variable) is whatever is used to measure a successful orunsuccessful outcome, e.g., grade point average.
Criterion-referenced test: Tests whose scores are interpreted by referral to well-defined domainsof content or behaviors, rather than by referral to the performance ofsome comparable group of people.
Cross-case analysis: Grouping data from different persons to common questions or analyzingdifferent perspectives on issues under study.
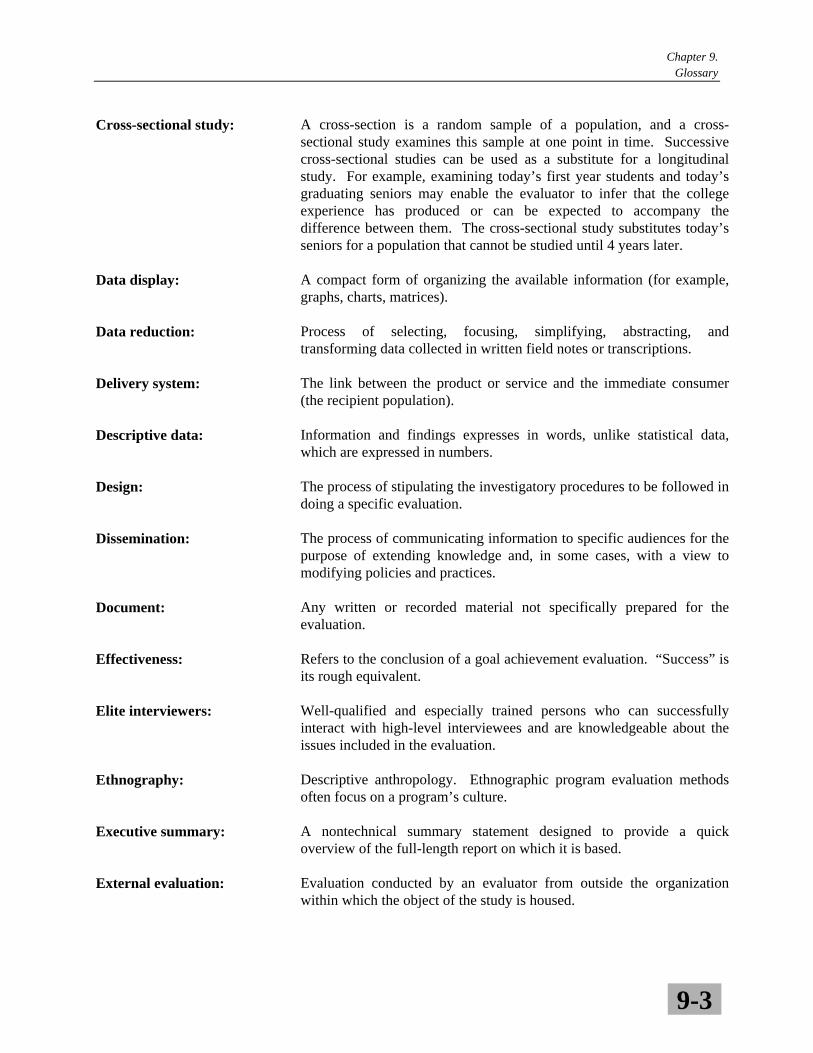
Chapter 9.Glossary
9-3
Cross-sectional study: A cross-section is a random sample of a population, and a cross-sectional study examines this sample at one point in time. Successivecross-sectional studies can be used as a substitute for a longitudinalstudy. For example, examining today’s first year students and today’sgraduating seniors may enable the evaluator to infer that the collegeexperience has produced or can be expected to accompany thedifference between them. The cross-sectional study substitutes today’sseniors for a population that cannot be studied until 4 years later.
Data display: A compact form of organizing the available information (for example,graphs, charts, matrices).
Data reduction: Process of selecting, focusing, simplifying, abstracting, andtransforming data collected in written field notes or transcriptions.
Delivery system: The link between the product or service and the immediate consumer(the recipient population).
Descriptive data: Information and findings expresses in words, unlike statistical data,which are expressed in numbers.
Design: The process of stipulating the investigatory procedures to be followed indoing a specific evaluation.
Dissemination: The process of communicating information to specific audiences for thepurpose of extending knowledge and, in some cases, with a view tomodifying policies and practices.
Document: Any written or recorded material not specifically prepared for theevaluation.
Effectiveness: Refers to the conclusion of a goal achievement evaluation. “Success” isits rough equivalent.
Elite interviewers: Well-qualified and especially trained persons who can successfullyinteract with high-level interviewees and are knowledgeable about theissues included in the evaluation.
Ethnography: Descriptive anthropology. Ethnographic program evaluation methodsoften focus on a program’s culture.
Executive summary: A nontechnical summary statement designed to provide a quickoverview of the full-length report on which it is based.
External evaluation: Evaluation conducted by an evaluator from outside the organizationwithin which the object of the study is housed.
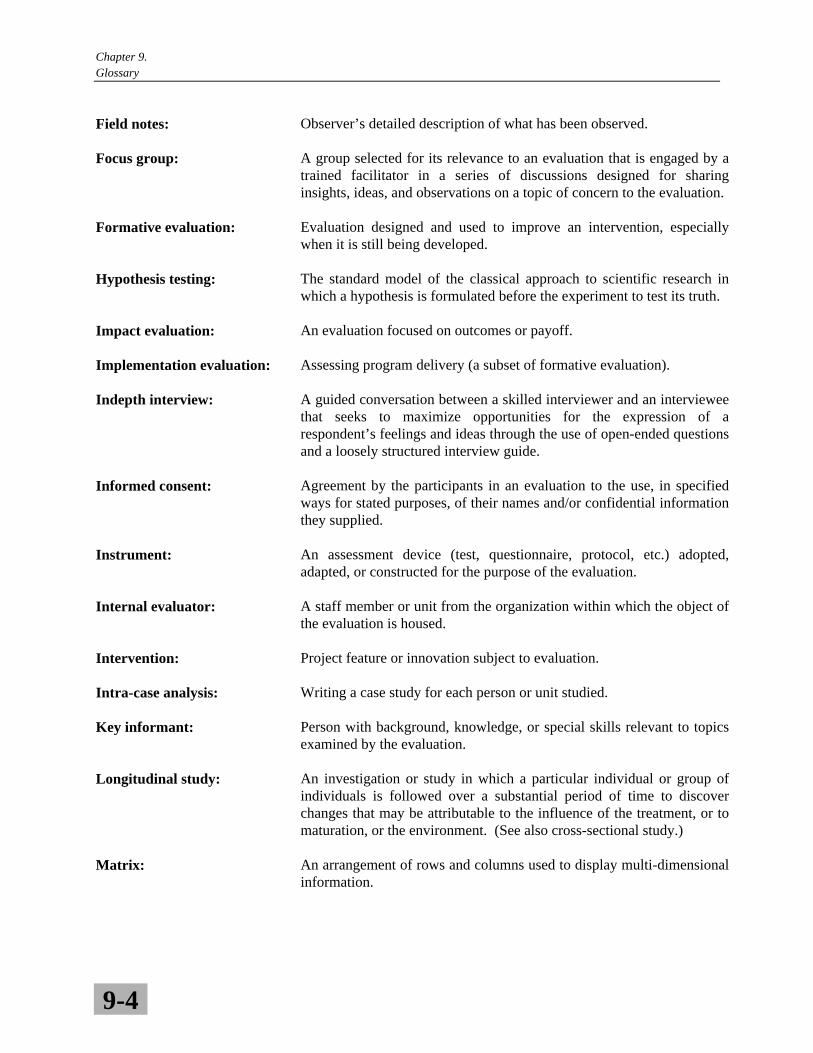
Chapter 9.Glossary
9-4
Field notes: Observer’s detailed description of what has been observed.
Focus group: A group selected for its relevance to an evaluation that is engaged by atrained facilitator in a series of discussions designed for sharinginsights, ideas, and observations on a topic of concern to the evaluation.
Formative evaluation: Evaluation designed and used to improve an intervention, especiallywhen it is still being developed.
Hypothesis testing: The standard model of the classical approach to scientific research inwhich a hypothesis is formulated before the experiment to test its truth.
Impact evaluation: An evaluation focused on outcomes or payoff.
Implementation evaluation: Assessing program delivery (a subset of formative evaluation).
Indepth interview: A guided conversation between a skilled interviewer and an intervieweethat seeks to maximize opportunities for the expression of arespondent’s feelings and ideas through the use of open-ended questionsand a loosely structured interview guide.
Informed consent: Agreement by the participants in an evaluation to the use, in specifiedways for stated purposes, of their names and/or confidential informationthey supplied.
Instrument: An assessment device (test, questionnaire, protocol, etc.) adopted,adapted, or constructed for the purpose of the evaluation.
Internal evaluator: A staff member or unit from the organization within which the object ofthe evaluation is housed.
Intervention: Project feature or innovation subject to evaluation.
Intra-case analysis: Writing a case study for each person or unit studied.
Key informant: Person with background, knowledge, or special skills relevant to topicsexamined by the evaluation.
Longitudinal study: An investigation or study in which a particular individual or group ofindividuals is followed over a substantial period of time to discoverchanges that may be attributable to the influence of the treatment, or tomaturation, or the environment. (See also cross-sectional study.)
Matrix: An arrangement of rows and columns used to display multi-dimensionalinformation.
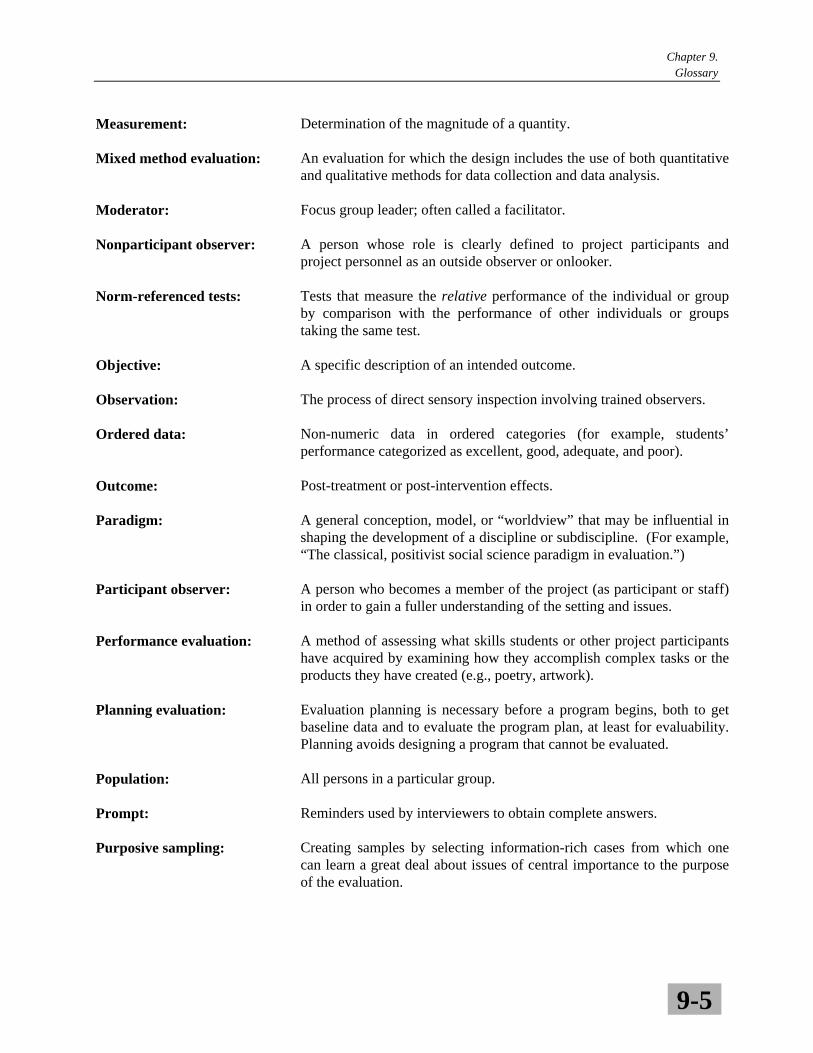
Chapter 9.Glossary
9-5
Measurement: Determination of the magnitude of a quantity.
Mixed method evaluation: An evaluation for which the design includes the use of both quantitativeand qualitative methods for data collection and data analysis.
Moderator: Focus group leader; often called a facilitator.
Nonparticipant observer: A person whose role is clearly defined to project participants andproject personnel as an outside observer or onlooker.
Norm-referenced tests: Tests that measure the relative performance of the individual or groupby comparison with the performance of other individuals or groupstaking the same test.
Objective: A specific description of an intended outcome.
Observation: The process of direct sensory inspection involving trained observers.
Ordered data: Non-numeric data in ordered categories (for example, students’performance categorized as excellent, good, adequate, and poor).
Outcome: Post-treatment or post-intervention effects.
Paradigm: A general conception, model, or “worldview” that may be influential inshaping the development of a discipline or subdiscipline. (For example,“The classical, positivist social science paradigm in evaluation.”)
Participant observer: A person who becomes a member of the project (as participant or staff)in order to gain a fuller understanding of the setting and issues.
Performance evaluation: A method of assessing what skills students or other project participantshave acquired by examining how they accomplish complex tasks or theproducts they have created (e.g., poetry, artwork).
Planning evaluation: Evaluation planning is necessary before a program begins, both to getbaseline data and to evaluate the program plan, at least for evaluability.Planning avoids designing a program that cannot be evaluated.
Population: All persons in a particular group.
Prompt: Reminders used by interviewers to obtain complete answers.
Purposive sampling: Creating samples by selecting information-rich cases from which onecan learn a great deal about issues of central importance to the purposeof the evaluation.
Chapter 9.Glossary
9-6
Qualitative evaluation: The approach to evaluation that is primarily descriptive andinterpretative.
Quantitative evaluation: The approach to evaluation involving the use of numerical measurementand data analysis based on statistical methods.
Random sampling: Drawing a number of items of any sort from a larger group or populationso that every individual item has a specified probability of being chosen.
Recommendations: Suggestions for specific actions derived from analytic approaches to theprogram components.
Sample: A part of a population.
Secondary data analysis: A reanalysis of data using the same or other appropriate procedures toverify the accuracy of the results of the initial analysis or for answeringdifferent questions.
Self-administered instrument: A questionnaire or report completed by a study participant without theassistance of an interviewer.
Stakeholder: A stakeholder is one who has credibility, power, or other capitalinvested in a project and thus can be held to be to some degree at riskwith it.
Standardized tests: Tests that have standardized instructions for administration, use,scoring, and interpretation with standard printed forms and content.They are usually norm-referenced tests but can also be criterionreferenced.
Strategy: A systematic plan of action to reach predefined goals.
Structured interview: An interview in which the interviewer asks questions from a detailedguide that contains the questions to be asked and the specific areas forprobing.
Summary: A short restatement of the main points of a report.
Summative evaluation: Evaluation designed to present conclusions about the merit or worth ofan intervention and recommendations about whether it should beretained, altered, or eliminated.
Transportable: An intervention that can be replicated in a different site.
Chapter 9.Glossary
9-7
Triangulation: In an evaluation, triangulation is an attempt to get a fix on aphenomenon or measurement by approaching it via several (three ormore) independent routes. This effort provides redundant measurement.
Utility: The extent to which an evaluation produces and disseminates reportsthat inform relevant audiences and have beneficial impact on their work.
Utilization of (evaluations): Use and impact are terms used as substitutes for utilization. Sometimesseen as the equivalent of implementation, but this applies only toevaluations that contain recommendations.
Validity: The soundness of the inferences made from the results of a data-gathering process.
Verification: Revisiting the data as many times as necessary to cross-check or confirmthe conclusions that were drawn.
Sources: Jaeger, R.M. (1990). Statistics: A Spectator Sport. Newbury Park, CA:Sage.
Joint Committee on Standards for Educational Evaluations (1981).Standards for Evaluation of Educational Programs, Projects andMaterials. New York: McGraw Hill.
Scriven, M. (1991). Evaluation Thesaurus. 4th Ed. Newbury Park, CA:Sage.
Authors of Chapters 1-7.