Embed Size (px)
Citation preview

Proceedings of the 8th Conference on Asphalt Pavements for Southern Africa (CAPSA'04) 12 – 16 September 2004 ISBN Number: 1-920-01718-6 Sun City, South Africa Produced by: Document Transformation Technologies cc
TYRE-PAVEMENT INTERFACE CONTACT STRESSES ON FLEXIBLE PAVEMENTS – QUO VADIS?
M. De Beer1, C. Fisher1 and L. Kannemeyer2 1Transportek, CSIR
PO Box 395, Pretoria, 0001. South Africa. E-mail: [email protected] and [email protected] 2South African National Roads Agency
PO Box 451, Pretoria, South Africa. E-mail: [email protected]
ABSTRACT
Worldwide, road pavement networks are constantly under pressure of an ever increasing demand from economic and other market forces. As a result, road infrastructure needs constant protection and it is therefore necessary to understand the ever-changing operating conditions such as the impact of heavy vehicles (HVs).
Since the previous CAPSA 1999 conference further progress has been made with the application of Stress-In-Motion (SIM) technology to assist in the quantification of tyre-pavement interaction. An up-graded 4-pad system was recently used at the Traffic Control Centre (TCC) on the National Route 3 (N3) near Heidelberg in South Africa.
The aim of this paper is to highlight the use of SIM technology on typical HVs found at this site (N3-TCC), with illustrative examples on real world trucks on this highway. A summary of the findings on tyre inflation pressure on this route is also given.
Finally, the paper discusses an improved definition of the actual tyre/pavement interaction of modern heavy vehicles and their loads on the current flexible road infrastructure. A simplified method is used as an example to illustrate the application of improved tyre loading models that could be used for thinly surfaced flexible pavement design methodologies in future. The effect on maximum horisontal tensile strain as a direct result of a weak bond at the bottom of the thin asphalt surfacing is also discussed.
Keywords: Tyre-pavement, interface, contact stresses, flexible, Stress-In-Motion (SIM), thin surfacings, inflation pressure
1. INTRODUCTION AND BACKGROUND
Of the paved roads in South Africa, approximately 90 per cent incorporate relatively thin (< 50 mm) asphaltic layers or surface seals as the all weather surface (De Beer et al, 1999). Infrastructure protection is one of the most important aspects concerning both short and longer-term economic growth of any country, and especially when its economy is export orientated. Adequate infrastructure protection will assist to ensure international competitiveness of export goods of a country. On the other hand, for internal purposes it is vital to look after the huge investment made in infrastructure such as the flexible roads in South Africa (SA). It is estimated that the formal rural road network in SA is approximately 365 000 km, of which only approximately 20 per cent is paved. This is representative of a capital replacement cost of more than R350 billion. For flexible pavements, the asphalt component on our national roads equates to approximately R5 billion (De Beer et al, 2002). Managing the asset of roads in SA is a huge task, and therefore needs a well-structured approach especially in optimising the design, construction and maintenance actions. For these actions it is necessary to continuously rationalise methodologies used in the practical everyday pavement engineering needed. These

8th CONFERENCE ON ASPHALT PAVEMENTS FOR SOUTHERN AFRICA
Paper 061
methodologies include aspects such as traffic counting, load/stress measurement, estimation of future variations in growth, construction and maintenance activities.
During the last ten years efforts in South Africa concentrated on the quantification of the load intensity (i.e. contact stresses) on our roads from the tyres of heavy vehicles, the purpose of which is too improve the methodologies used for flexible road pavement design and analysis. In the field of load stress management, the aim of this paper is to report on progress made since the last CAPSA conference in 1999 on the use of Stress-In-Motion (SIM) technology on National Roads in South Africa. Background to the development of the SIM technology is given in several international papers (See De Beer et al, 1997, 1999, 2002, 2004). The work reported in this paper includes the measurement of typical tyre inflation pressures of heavy vehicles (HV). A heavy vehicle is classified as a vehicle with Gross Vehicle Mass (GVM) > 3,5 ton (TRH 16, 1991). The research further includes aspects of the SIM measurements that were done in 2003 on National Road N3, at the Traffic Control Centre (TCC) near Heidelberg.
2. SOUTH AFRICAN MAJOR ROADS – FREIGHT TRAFFIC AND IMPACT
In order to assist with improved road and traffic management Bosman (2004) proposed a provisional road map of SA based on the impact of traffic loading (Figure 1). The map indicates three categories of traffic loading impact, based on recent Weigh-In-Motion (WIM) and Comprehensive Traffic Observation (CTO) data sets. It is clear from the map that the primary road network in SA carries the medium to high HV type of vehicles, and therefore represents the higher impact based on traffic loading. Current estimates are that road freight represents 70 percent of all freight in SA, and the growth is approximately four (4) percent per annum (Bosman, 2004). It is however accepted that currently there are many provincial and even secondary roads that carry very high traffic loading, mostly traffic loading for which the facility was not designed. Such an example is the provincial roads between Witbank coal area and the Majuba Power Station in Mpumalanga. With minimal and often totally inadequate road maintenance, structural deterioration of these roads is accelerating fast towards a totally unacceptable situation (Figure 2). This type of situation will certainly inform the current debate on more efficient use of rail for certain freight currently on our roads (Shaw, 2004).
Figure 1. Recent map of road classification based on impact of traffic loading (after Bosman, 2004). (Note: HV = Heavy Vehicle -Gross Vehicle Mass (GVM) >3 500 kg).

8th CONFERENCE ON ASPHALT PAVEMENTS FOR SOUTHERN AFRICA
Paper 061
Potholes… Potholes…
Figure 2. Failure of a secondary provincial road in Mpumalanga,
not designed to carry this type of traffic.
3. RECENT TYRE PRESSURE DATA ON NATIONAL ROAD 3 (N3)
From a pavement preservation point of view (in addition to truck logistics, such as fleet operations and running cost issues) it is crucially important to understand the effects of current loading and tyre inflation pressures from HVs on the road infrastructure. This is especially so when tyre loading/pressure assumptions are made for the design and rehabilitation and maintenance actions of flexible roads. The inflation pressure information also enhances the interpretation of SIM measurements that is discussed later in the paper. For the tyre pressure reported in this paper two sets of data were used. One set was measured on HVs using the N3 at N3-TCC during 26 February 20-03 to 06 March 2003 (referred to as Data SET-1 in this paper (Morton et al 2004)). The second set of measurements was made only on trucks with overloading violations at N3-TCC for the period 8 September 2003 to 31 October 2003 (referred to as Data SET-2)1.
3.1 HV Tyre Inflation Pressure Distributions
3.1.1 Random sample for all heavy vehicles (data set-1) Figure 3 illustrates the distribution of tyre inflation pressures found during early 2003 at N3-TCC. The data (SET-1, 1070 tyres left side and 1070 tyres right side) has been separated between tyres on steering axle (225 tyres left side and 225 tyres right side) from the rest of the axles (845 tyres left side and 845 tyres right side). The average/median/mode of the inflation pressures are approximately 850/870/900 kPa for the steering tyres, and 774/800/800 kPa for the rest of the tyres. This finding suggests that the tyres on the steering axle are at a higher inflation pressure than the rest, by approximately 10 to 13 percent. In addition it was found that there is a slight difference in the distribution comparing left front tyres with the right front tyres. This difference seems to dominate on the lower side of inflation pressure distribution (between 400 to 900 kPa).
1Note that these inflation pressure data sets were not compensated for temperature, and reflect the “warm” inflation
pressure on the site soon after parking. The inflation pressures reported here are therefore at a somewhat higher level because of increased tyre temperature than the typical “cold” inflation pressure, prescribed by tyre manufactures.

8th CONFERENCE ON ASPHALT PAVEMENTS FOR SOUTHERN AFRICA
Paper 061
The higher inflation pressures occur at the right-hand side (driver side), which may suggest that these tyres on the driver side are better “maintained” than the other, purely because it is more visible to the driver getting in and out of the vehicle than the rest of the tyres. This aspect, however, needs to be confirmed with further research.
The standard deviation of tyre inflation pressure ranges between 88 kPa to 111 kPa, but it should be noted that the distributions in Figure 3 are not purely Gaussian, but more peaked (positive kurtosis was found). The distributions are also skewed towards the lower inflation pressures (negative skewness found). For the steering tyres the range of inflation pressure was 340 kPa to 1080 kPa, and for the rest of the tyres the range was 90 to 1200 kPa.
N3 TCC - SELECTED HEAVY VEHICLE (HV) TRUCK TYRE PRESSURE DATA (26 Feb 2003 - 06 March 2003)
0
0.2
0.4
0.6
0.8
1
1.2
0 100 200 300 400 500 600 700 800 900 1000 1100 1200 1300 1400 1500
TYRE INFLATION PRESSURE (kPa)
Nor
mal
ised
Fre
quen
cy
LEFT-FRONT-(225 tyres) RIGHT-FRONT-(225 tyres) REST-LEFT-(845) REST-RIGHT-(845)
Figure 3. Tyre inflation pressure distributions of the tyres of HVs found during 26 February 2003 to 06 March 2003 at N3-TCC (Data SET-1, total of 1070 tyres left side and 1070 tyres right side).
3.1.2 Sample for overloaded (O/L) HVS (data set-2) Data SET-2 represents the tyre inflation pressure of only overloaded (O/L) trucks at the N3-TCC during another period (8 September 2003 to 31 October 2003. To study possible differences between these data sets, the distributions were compared. Figure 4 illustrates the comparison between the distributions of the two cases (including left and right tyres separated for data SET-1). In these cases the steering tyres were grouped together with the rest of the tyres for data SET-1. The figure clearly illustrates that there is no significant difference between these distributions, and that it can be concluded from this limited information that the tyre inflation pressures of overloaded trucks are not necessarily higher (or lower) than the typical HVs found on this road. The distributions are statistically very similar.

8th CONFERENCE ON ASPHALT PAVEMENTS FOR SOUTHERN AFRICA
Paper 061
N3 TCC - SELECTED HEAVY VEHICLE (HV) TRUCK TYRE PRESSURE DATA
0
0.2
0.4
0.6
0.8
1
1.2
0 100 200 300 400 500 600 700 800 900 1000 1100 1200 1300 1400 1500
TYRE INFLATION PRESSURE (kPa)
Nor
mal
ised
Fre
quen
cyLeft-(1070 tyres) Right-(1070 tyres) O/L TRUCKS-(3566 tyres)
Figure 4. Comparison of tyre inflation pressure distributions of HVs found during 26 February 2003
to 06 March 2003 at N3-TCC (Data SET-1) with overloaded (O/L) HVs during 8 September 2003 to 31 October 2003 (Data SET-2).
4. SIM TECHNOLOGY AND TESTS ON NATIONAL ROADS IN SOUTH AFRICA
4.1 Background
Road-related research in South Africa with SIM systems has been conducted since 1992. Currently a semi-industrial version of this equipment exists for research purposes. This system, referred to as the SIM Mk IV system, is a semi-portable system, but does need installation methodologies as precise as the current commercially available WIM systems.
Typically, the SIM Mk IV system configuration includes single, twin or quad measuring pads, depending on the requirements. For single tyre testing (normally truck tyres), the single pad system is used; the twin system is used for dual truck tyres and the quad system is used for full axle measurements of on-road or test trucks. The current SIM system described here is designed for slow (creep) speed conditions, i.e. < 5 km/hr.
Figures 5, 6 and 7 illustrate the typical SIM Mk IV installation and measurement configurations used in the research and development environment. The single and twin SIM pad configurations during HVS tyre testing are illustrated in Figures 5 and 6. In these cases, the SIM pads were used to measure the contact stresses of the typical slow moving free-rolling tyres that are normally used on the Heavy Vehicle Simulator (HVS). 2
In Figure 8 a typical SIM quad test configuration (full 4-pad) is shown on the typical weighbridge station at N3-TCC. This configuration limited the test speed of on-road vehicles (mostly trucks) to less than 5 km/h. A specially designed test pit constructed of reinforced concrete with an approach and exit slab supports the SIM system indicated here. The SIM measuring system is a time-based system and is triggered by the forward moving tyre using a static acoustic sensor on the side of the road. The axle count and speed per axle are measured using infrared beam
2The HVS systems are normally used to perform accelerated testing and evaluation of both flexible and rigid road
pavement systems (ATC, 1985; APT, 1999).

8th CONFERENCE ON ASPHALT PAVEMENTS FOR SOUTHERN AFRICA
Paper 061
triggers. Basic description of the SIM system as well as some data analyses are given by De Beer (1996) and De Beer et al (1997, 1999, 2002), Blab and Harvey (2000) and Blab (1999).
The tyre-SIM pad interaction is measured in 3 dimensions (x, y, z); by an array of sensors across the SIM pad (typically 21 specially designed and calibrated tri-axial load cells at 17 mm centre-to-centre, orthogonal to the direction of the tyre)3. These load cells measure vertical, lateral and longitudinal loads during one pass of the tyre, typically at an instantaneous sampling frequency of between 150 Hz and 1500 Hz. The Society of Automotive Engineers (SAE) tyre axis sign convention (Gillespie, 1992) used for the SIM testing is illustrated in Figure 8.
In total five directional loadings are measured simultaneously, i.e.:
• +X: Forward (Positive) Longitudinal Force;
• -X: Backward (Negative) Longitudinal Force;
• +Y: Positive Lateral Force;
• -Y: Negative Lateral Force; and
• +Z: Positive (downward) Vertical Force.
In the data reduction process these measured forces are transformed to average contact stresses. It is assumed that the contact stresses measured in this way are a fair representation of the rather complex tyre-road interface stresses from moving pneumatic tyres on a typical dry asphalt surfaced road with average friction properties, and could be used effectively for the purposes of improved road design and evaluation (De Beer et al, 1997, 1999, 2002).
Figure 5. Single SIM pad configuration (used under Heavy Vehicle Simulator (HVS) with single test tyre).
3The geometry of the SIM load cell is such that the effective pin contact area is approximately 30 per cent of the total
load cell area.

8th CONFERENCE ON ASPHALT PAVEMENTS FOR SOUTHERN AFRICA
Paper 061
Figure 6. Twin (or dual) SIM pad configuration (used under Heavy Vehicle Simulator (HVS) with dual test tyres).
Figure 7. Quad (full) SIM pad configuration at a typical weighbridge site on National Road 3 (N3), near Heidelberg in Gauteng.
+Z
+X
Tyre Rotation
+Y
Figure 8. Society of Automotive Engineering (SAE) sign convention used during SIM measurements. X-Longitudinal, Y-Lateral and Z Vertical
loads/stresses.

8th CONFERENCE ON ASPHALT PAVEMENTS FOR SOUTHERN AFRICA
Paper 061
4.2 SIM Measurements and Results from N3-TCC
During 2003 a total of 3156 trucks representing a total 65 456 tyres, were measured with the SIM system during a six-week operation at the N3-TCC, near Heidelberg, South Africa. The purpose of this testing was to obtain the 3D contact stress patterns of a typical HV population currently on the busiest national highway in SA.
Before the SIM measurement series was initiated, a calibration check was done comparing the load measurements from the SIM system to that of the permanent Multi-deck scale and DAW50 scale at the N3-TCC. The comparison between the SIM and these other scales is given in Figure 9, and appears to be relatively accurate on the average. The variation seen for the SIM weight measurements are primarily due to the variation of the tread pattern on truck tyres (De Beer et al, 1997). Based on this relatively good comparison, it was agreed to proceed with the six-week SIM measurement series at the N3-TCC with more confidence.
SIM Heidelberg (N3 TCC): Test Speed < 5 km/h (1.4 m/s)
4000
5000
6000
7000
8000
9000
10000
11000
12000
13000
14000
15000
4000
4500
5000
5500
6000
6500
7000
7500
8000
8500
9000
9500
1000
0
1050
0
1100
0
1150
0
1200
0
1250
0
1300
0
1350
0
1400
0
1450
0
1500
0
SIM measured weight (kg)
DA
W50
and
Mul
ti-D
eck
Scal
e -
wei
ght (
kg)
Front Rear Total Multi deck front Multi deck RearMulti deck Total Other Truck Axles Series8 Linear (Series8)
Figure 9. Comparison between preliminary weight measurements of the SIM, Multi-Deck
and DAW50 scales at N3-TCC.
4.2.1 Typical results - vertical contact stresses In this paper the results of only the measured vertical contact stresses will be discussed. For approximately 65 000 tyres measured, the maximum vertical contact stress varied between 10 kPa (tyre just in relatively light contact with road, i.e. tyre weight in the order of 50 kg) to values exceeding 1 800 kPa (i.e. tyre weight exceeding of 5.0 ton). This is a somewhat wider range than found previously for National Route 1 (N1) in 1999 (De Beer et al, 1999).
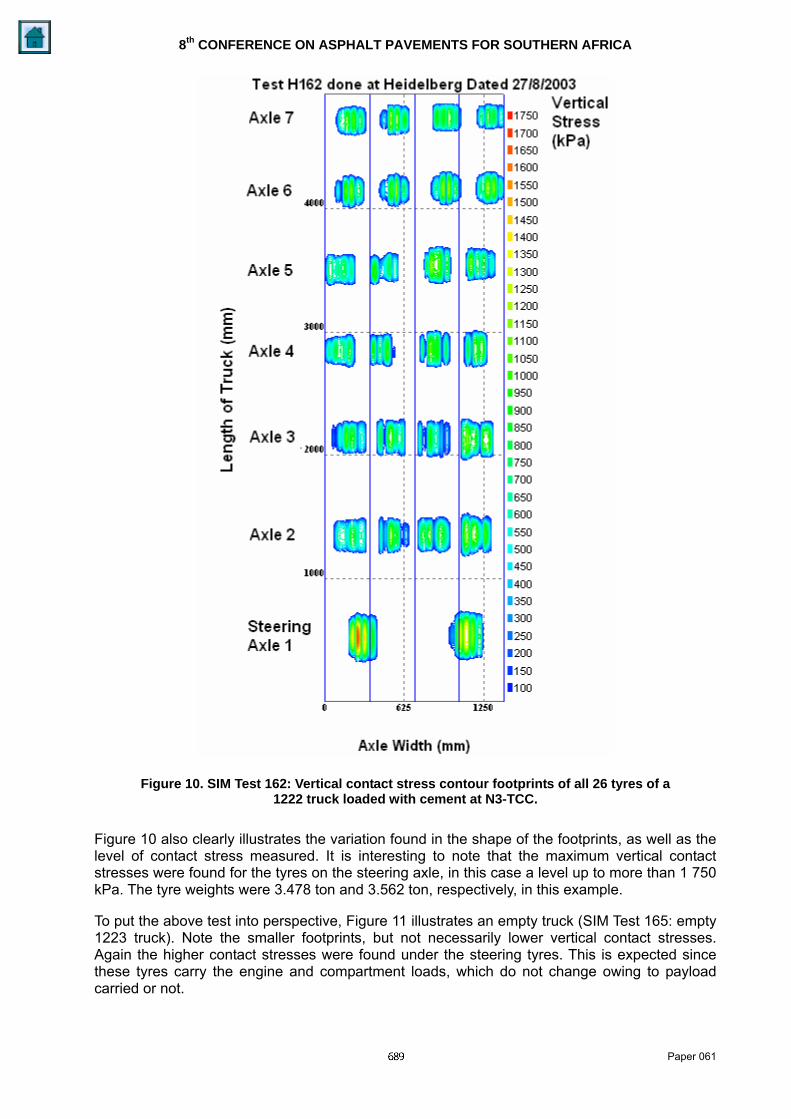
In Figure 10 the contour footprints of all 26 tyres of a typical heavily loaded truck (SIM Test 162; 1222 truck loaded with cement in this case) is illustrated. For Figures 10 to12 the steering axle (single axle, two tyres) is at bottom of images.
8th CONFERENCE ON ASPHALT PAVEMENTS FOR SOUTHERN AFRICA
Paper 061
Figure 10. SIM Test 162: Vertical contact stress contour footprints of all 26 tyres of a 1222 truck loaded with cement at N3-TCC.
Figure 10 also clearly illustrates the variation found in the shape of the footprints, as well as the level of contact stress measured. It is interesting to note that the maximum vertical contact stresses were found for the tyres on the steering axle, in this case a level up to more than 1 750 kPa. The tyre weights were 3.478 ton and 3.562 ton, respectively, in this example.
To put the above test into perspective, Figure 11 illustrates an empty truck (SIM Test 165: empty 1223 truck). Note the smaller footprints, but not necessarily lower vertical contact stresses. Again the higher contact stresses were found under the steering tyres. This is expected since these tyres carry the engine and compartment loads, which do not change owing to payload carried or not.

8th CONFERENCE ON ASPHALT PAVEMENTS FOR SOUTHERN AFRICA
Paper 061
Figure 11.SIM Test 165: Vertical contact stress contour footprints of all 26 tyres of a 1223 empty truck at N3-TCC.
Figure 12 illustrates a typical example of a passenger bus, (SIM Test 164:111 vehicle). Also here the maximum stresses appear to be under the steering tyres.

8th CONFERENCE ON ASPHALT PAVEMENTS FOR SOUTHERN AFRICA
Paper 061
Figure 12. SIM Test 164: Vertical contact stress contour footprints of all 8 tyres of a 111 vehicle (Passenger Bus) at N3-TCC. (Note that the length of the vehicle is not to scale).
In Figure 13 below, a 1222 heavy vehicle is shown with highly non-uniform footprint shapes (see right outer tyre on axle 5, as well as a “missing” tyre on axle 4 (4th from bottom, only three tyres on axle!).

8th CONFERENCE ON ASPHALT PAVEMENTS FOR SOUTHERN AFRICA
Paper 061
Figure 13. SIM Test 306: Vertical contact stress contour footprints of 25 tyres of a 1222 truck
at N3-TCC. Note “missing”inner left tyre on axle 4.
4.2.2 Perspective images of measured vertical contact stress For pavement design purposes it is important to take the shape of the contact stress into consideration (De Beer et, al, 1997, 1999, 2002, 2004). As an illustration from the test done at N3-TCC, Figures 14 and 15 illustrate a normal “n” – shape4 and an abnormal so-called “m”-shape pattern. Figure 16 illustrates typical SIM data defining these shapes of vertical contact stress from previous work (De Beer et al, 2004). In addition, this figure also gives images of the lateral and longitudinal stresses for the three cases given. Typically, normally loaded and correctly inflated tyres produce the “n-shape”, whilst overloaded/underinflated tyres typically produce the “m-shape” vertical stress profile (Figure 15).
4The “n”-shape represents normal vertical contact stress distribution with no overload or under inflation. The “m”-
shape represents a condition of under inflation, and or overloading (De Beer et al, 2004).

8th CONFERENCE ON ASPHALT PAVEMENTS FOR SOUTHERN AFRICA
Paper 061
Figure 14. SIM Test 297: Vertical contact stress contour footprint of a normal “n”-shape – axle 1 – steering tyre - right side.
From the above illustrations it is clear that especially for pavements with thin asphaltic surfaces, including surfacing seals the vertical contact stress footprints obtained from real world trucks are non-circular and non-uniform. This aspect was studied in detailed previously (De Beer et al, 1997, 1999, 2002, 2004). It is the opinion of the author therefore that “shape and profile” of the contact stresses (3D) should therefore be introduced during the design stage of pavements and pavement surfacings. The effects of lateral and longitudinal stresses can be significant as was demonstrated by previous research on this topic (De Beer et al, 2002).
Figure 15. SIM Test 306: Vertical contact stress contour footprint of abnormal
“m”-shape – axle 5 right outer tyre.
4.2.3 Implications for pavement design During this previous research, various methodologies have been suggested, ranging from Finite Element Methods (FEM) to more simplified methods such as multiple circle method, etc. (Blab, 1999, De Beer, 2002, 2004).

8th CONFERENCE ON ASPHALT PAVEMENTS FOR SOUTHERN AFRICA
Paper 061
For the purposes of this paper, another more simplified method is illustrated and used to quantify pavement response parameters, such as the maximum horisontal strain at the bottom of the asphalt surfacing layer. During the De Beer (2002) study it was found that for solutions based on linear elastic (LE) modelling the strain parameters seem to be more sensitive to the shape and direction of stresses than perhaps other parameters such as stresses and yield functions. Therefore, in this paper the focus for the simplified pavement analysis is on the maximum horisontal tensile strain at the bottom of the asphalt surfacing.
In addition to the shape and size of the tyre-pavement contact stresses, more field evidence exists which suggest that weak surfacings, interface layers and delamination are causing premature failures, as well as longer term failures on flexible pavements in southern Africa (Netterberg, 1994a, 1994b, 2004).
The foregoing is discussed in the next section by way of simplified modelling examples.

8th CONFERENCE ON ASPHALT PAVEMENTS FOR SOUTHERN AFRICA
Paper 061
Figure 16. (a) Case 1: 720 kPa, 20 kN, n-shape; (b) Case 2: 720 kPa, 35 kN, m-shape; (c) Case 3: 720 kPa, 50 kN, m-shape (from De Beer et al, 2004).

8th CONFERENCE ON ASPHALT PAVEMENTS FOR SOUTHERN AFRICA
Paper 061
5. STRUCTURAL DESIGN - ANALYTICAL ISSUES AND MODELLING
5.1 Simplified Approaches
In this final section of the paper, multi-layer linear elastic (LE) methodology is used to demonstrate by a simplified method the effects of the typical ”n”-shape, and the “m-shape” vertical contact stress distributions on pavement response parameters. The modelling parameters used are given in Tables 1 and 2 and are illustrated in Figure 17.
In addition, the analyses are also done on an asphalt surfacing with a relatively “weak” bond between the new asphalt surfacing and an older bottom layer.
Table 1. Modelling parameters for 2-layer pavement to be modeled - without weak layer.
Layers Elastic Moduli (MPa), Poisson, µ
Loading/Contact Stress Comments
Continuous graded Asphalt surfacing (AC)
3500, 0.44 See Figure 17 Thickness, tac: [Vary between
10 mm to 200 mm]
Base layers 350, 0.44 -- Semi-infinite: Sub-layers
combined into single layer of composite modules of 350 MPa
Table 2. Modelling parameters for 2-layer pavement to be modeled - with weak layer at bottom of asphalt layer.
Layers Elastic Moduli (MPa), Poisson, µ
Loading/Contact Stress Comments
Asphalt surfacing
3500, 0.44 See Figure 17 Thickness, tac: [Vary between 10
mm to 200 mm] Weak layer 1, 0.44 -- 1 mm thick
Base layers 350, 0.44 -- Semi-infinite: Sub-layers
combined into single layer of composite modules of 350 MPa
520 kPa, r = 111 mm
770 kPa, r = 36 mm
Load Radius: r Load Radius: r
950 kPa, r = 111 mm
450 kPa, r = 87 mm
tac
C/L Edge C/L EdgeCase 1: “n”- shape Case 2: “m”- shape
Horisontal Tensile Strains at C/L and Edge Semi-Infinite
Figure 17. Simplified loading shapes used for LE modelling on thinly surfaced
flexible pavement.

8th CONFERENCE ON ASPHALT PAVEMENTS FOR SOUTHERN AFRICA
Paper 061
5.2 Results of Maximum Horisontal Tensile Strains at Bottom of AC Layer
The results from the various analyses are compiled in Figures 18 and 19. These figures illustrate the maximum horisontal tensile micro-strain values (εac) calculated at the bottom of the asphalt surfacing (AC) layer.
5.2.1 2-Layer pavement without weak layer Figure 18 illustrates the maximum horisontal tensile strain at the bottom of the AC layer, without any weak bond5. The results are given for both the “n”-shape and “m”-shape loading cases.
The results indicate that for this rather typical “thin asphalt surfacing” 2-layer pavement condition, the maximum horisontal tensile strain (εac) reaches a maximum at approximately 30 mm to 40 mm of asphalt thickness for the “n”-shape - on the centre-line (C/L) of the loading (approximately 281 µε). For the “m”-shape case, the maximum tensile strain occurs at approximately 50 mm to 60 mm, also on the C/L of the loading, but it is lower than that found for the “n”-shape case (approximately 208 µε). This relatively lower value is explained by the lower contact stress in the centre region of the “m”-shape loading case (i.e. 450 kPa vs 770 kPa on the edges - see Figure 18).
Considering the strain εac directly under the tyre edges, the “n”-shape produced a lower strain distribution up to 40 mm compared to that from the “m”-shape loading. At 40 mm the strains are equal at approximately 200 µε. However, critically large values of strain are obtained at the edges of the “m”-shape loading close to the surface (approximately 363 µε at 10 mm depth). See Figure 18.
This analysis (based on representative assumptions for vertical loading) illustrates the importance of load shape on pavement response parameters such as the maximum tensile strain at the bottom of the asphalt surfacing layer. This type of analysis could be used to study the effect of overloading/under-inflation on the traffic- load associated damaged such as fatigue cracking of thinly surfaced pavements. These results clearly demonstrate that efficient loading and inflation pressures levels could go a long way in protecting our infrastructure. Efforts should therefore be focussed on avoiding the “m”-shape loading to occur on our roads.
5.2.2 Effect of weak bond at the bottom of the asphalt surfacing layer To study the effect of a weak bond” at the bottom of the thin asphalt layer, an artificial weak layer (i.e. discontinuity with partial friction) between the surfacing and base layer was introduced. This artificial weak layer with properties 1 mm thick and stiffness of 1 MPa seems to be an efficient way to demonstrate the increase in εac owing to this weakness near the surface of the pavement. Figure 19 illustrates the results when such a layer is introduced. The lines with the markers represent the weak layer case, for both loading cases (“n” and “m”) discussed above.
For the “n”-shape loading case the strain increases at the tyre load centre, with maximum (360 µε) between 30 mm and 40 mm depth. For the “m”-shape loading the strain increased to more than 500 µε at a depth of 10 mm at the edge of the loading. This again demonstrates the danger of “m”-shape loading, which is worsened by the presence of a weak bond at the bottom of the asphalt surfacing layer.
The importance of this rather simplistic demonstration lies in the fact that a discontinuity such as weak interlayers (and/or a weak bond) at the bottom of asphalt surfacing layers should be avoided at all costs.
5The “weak bond” represents a condition of “discontinuity” and also partial friction between AC layer and base layer in
the LE model used here.

8th CONFERENCE ON ASPHALT PAVEMENTS FOR SOUTHERN AFRICA
Paper 061
Horisontal Tensile Strain vs AC thickness at the bottom of AC surfacing layer
0
100
200
300
400
500
600
0 10 20 30 40 50 60 70 80 90 100 110 120 130 140 150 160 170 180 190 200 210 220 230 240 250
AC Thickness (mm)
Hor
ison
tal T
ensi
le M
icro
-Str
ain
N-SHAPE-C/L N-SHAPE-EDGE-95 mm
M-SHAPE-C/L M-SHAPE-EDGE-90 mm
Figure 18. Horisontal tensile strain at the bottom of the asphalt surfacing (AC) layer for the various
modelling cases given in Table 1 – without a weak bond between asphalt surfacing and base layer (i.e. continuous, full friction).
Horisontal Tensile Strain vs AC thickness at the bottom of AC surfacing layer
0
100
200
300
400
500
600
0 10 20 30 40 50 60 70 80 90 100 110 120 130 140 150 160 170 180 190 200 210 220 230 240 250
AC Thickness (mm)
Hor
ison
tal T
ensi
le M
icro
- Str
ain
N-SHAPE-C/L N-SHAPE-EDGE-95 mm Standard-20-520-C/LM-SHAPE-C/L M-SHAPE-EDGE-90 mm M-SHAPE-EDGE-90 mm+Weak BondN-SHAPE-C/L+Weak Bond
Figure 19. Horisontal tensile strain at the bottom of the asphalt surfacing layer for the various modelling cases given in Table 1- with a the weak bond between asphalt surfacing and base l
ayer (i.e. discontinuous, partial friction).

8th CONFERENCE ON ASPHALT PAVEMENTS FOR SOUTHERN AFRICA
Paper 061
6. DISCUSSION AND THE WAY FORWARD?
The results and overview in this paper of tyre-pavement interaction as largely defined by the measured vertical contact stress distributions and some simplistic modelling demonstrates the importance of this aspect of flexible pavement design. At this point evidence from the measured SIM data and limited analysis so far, points to the fact that non-uniform tyre-pavement contact stresses should be used for pavement design, instead of the usual uniform and circular shapes. However, the challenge for the way forward will be mainly two-fold:
• Implementation of improved “tyre” load models for everyday textured seal, pavement structural design and analysis, and
• Additional SIM measurements on a wider range of vehicles and typical routes in SA;
The application of non-uniform tyre-pavement contact stresses using these simplified modelling approaches discussed in this paper will facilitate the quantification of more appropriate tyre-road models for design and analysis of flexible pavements, including textures seals (See Milne et al, 2004a, 2004b). Additional SIM measurements will facilitate further calibration of the contact stresses found on southern African roads.
Implementation of the above could serve the pavement design community well in using the latest information in order to rationalise the design and analysis of thinly surfaced flexible pavements in southern Africa.
7. SUMMARY, CONCLUSIONS AND RECOMMENDATIONS
7.1 Summary
This paper demonstrates the use of Stress-In-motion (SIM) technology for the quantification of tyre-pavement contact stresses of real world heavy trucks on a busy national highway in South Africa. It further showed the non-uniformity of the vertical contact stress patterns for most tyres investigated. In addition to the tyre-pavement contact stresses, the tyre inflation pressure levels seem to be much higher than in the past, with tyres on the steering axles at levels 7 to 13 percent higher than the rest.
With increased road freight in South Africa (currently growing at 4 per cent per annum) it will be necessary to develop methodologies to quantify the effects of increased loading on our road networks, both the major networks and also the minor or secondary road networks. This research should also include the effects of wide base (“super single”) tyres on heavy vehicles used in southern Africa.
7.2 Conclusions
The following is concluded from this work:
• Stress-In-Motion (SIM) technology can effectively be used to quantify the tyre-pavement contact stresses of real world trucks and vehicles;
• It may not be enough to study tyre inflation pressure in isolation – this needs to be done in association with the outputs from the SIM Technology;
• Increasing road freight in southern Africa will result in more frequent maintenance actions on our road networks.
• Improved tyre loading models are crucial for improved optimisation of the pavement design efforts for flexible pavements with thin (< 50 mm) surfacings, including textured seals.

8th CONFERENCE ON ASPHALT PAVEMENTS FOR SOUTHERN AFRICA
Paper 061
• Maximum horisontal tensile strain occurs at an asphalt thickness of approximately 30 mm to 50 mm for the cases investigated here. This might raise questions on the use of these thin layers on flexible pavements;
• For overloaded/underinflated tyres the fatigue “life” of thinly surfaced flexible pavements will be significantly reduced as a direct result of increased horisontal tensile strains under the edges of the tyre.
• The case is further worsened if a weak layer (or bond) exists at the bottom of the asphalt surfacing layer. This weak layer should be avoided at all costs.
7.3 Recommendations
The following recommendations follow naturally from this work:
• Stress-In-Motion (SIM) type research must continue, and also expanded to a wider range of road and vehicle types in southern Africa.
• Tyre inflation pressure and its changes over time should be researched in greater detail in order to link SIM results with inflation pressure.
• Improved tyre loading modelling is needed for flexible pavement design and analysis. For simplified methods, the non-uniformity should be introduced by varying the loading shapes.
• Road maps to be further developed which are based on impact of heavy vehicle tyre-pavement interaction. This could aid road designers and road authorities with optimised maintenance and up-grading actions, including possible law enforcement.
• Road authorities and designers to take cognisance of the actual traffic loading demand on flexible pavements in South Africa.
The foregoing might imply that an improved load equivalency concept for damage of the surfacing of flexible pavements could be introduced. In the opinion of the authors, however, the rather simplistic power law for relative damage based on load level only appear not be the best option for the design of thin surfacings of flexible pavements. This is a topic for urgent future research on the structural and functional performance of thin surfaced pavements.
8. ACKNOWLEDGEMENTS
The Director of CSIR Transportek and the Programme Manager for the Infrastructure Programme are thanked for their continued support and permission to publish this paper. The South African Roads Agency (Pty) Ltd. is also thanked for its continued support and funding of the SIM technology.
9. REFERENCES
ATC, 1985. The South African Heavy Vehicle Simulator. Proceedings of the Annual Transportation Convention (ATC), 29 July – 2 August 1985. Session: Transport Infrastructure, Accelerated Testing of Pavements. CSIR Conference Centre, Pretoria, South Africa.
APT, 1999. Accelerated Pavement Testing (APT). International Conference, 1999, October 18-20, 1999, Reno Nevada (Proceedings only available on CD from Conference organisers). University of Nevada, Reno, NV 89557-0179.
Bosman, J. 2004. Traffic loading characteristics of South African Heavy vehicles. Eight (8th ) International Symposium on Heavy Vehicles, Weights and Dimensions. Loads, Roads and the Information Highway. 14-18 March 2004, Misty Hills Conference Centre, Muldersdrift, Gauteng, South Africa.
8th CONFERENCE ON ASPHALT PAVEMENTS FOR SOUTHERN AFRICA
Paper 061
Blab, R, and Harvey, J, 2000, Modelling Measured 3D Tire Contact Stresses In A Visco-Elastic FE Pavement Model. Second National Symposium on 3D Finite Element Modelling for Pavement Analysis & Design. 2000, Embassy Suites Hotel, Charleston, West Virginia, USA.
Blab, R, 1999, Introducing Improved Loading Assumptions into Analytical Pavement Models Based on Measured Contact Stresses of Tires. International Conference on Accelerated Pavement Testing, Reno, Nevada, USA, 1999. Paper Number: CS5-3.
De Beer, M. 1996. Measurement of tyre/pavement interface stresses under moving wheel loads. Heavy Vehicle Systems, Special Series, International Journal of Vehicle Design, Vol. 3, No’s 1-4, pp. 97-115.
De Beer, M., Fisher, C. and Jooste, F. J. 1997. Determination of pneumatic tyre/pavement interface contact stresses under moving loads and some effects on pavements with thin asphalt surfacing layers. In: Eighth International Conference on Asphalt Pavements (ICAP ‘97). (Proceedings of the conference held in Seattle, Washington on 10-14 August 1997).
De Beer, M., Kannemeyer, L. and Fisher, C. 1999. Towards improved mechanistic design of thin asphalt layer surfacings based on actual type/pavement contact stress-in-motion data in South Africa. Seventh (7th) Conference on Asphalt Pavements for Southern Africa, 1999 (CAPSA ’99), Victoria Falls, Zimbabwe, 29 August to 2 September 1999. (This paper as well as animated movies of the tyre/pavement interaction problem based on SIM data can be viewed at the following Internet Site: http://asphalt.csir.co.za/sim/index.htm).
De Beer, M. and Fisher, C. 2000. Contact Stresses of the 11.00 – R22.5 pneumatic radial tyres on the Gautrans Heavy Vehicle Simulator (HVS) measured with the Vehicle-Road Pressure Transducer Array (VRSPTA) system. Confidential Contract Report CR-99/012, CSIR Transportek, South Africa, March 2000.
De Beer, M., Fisher, C., and Jooste, F. J. 2002: Evaluation of non-uniform tyre contact stresses on thin asphalt pavements. Ninth (9th) International Conference on Asphalt Pavements (ICAP 2002), Copenhagen, August 17-22, 2002. (Proceedings on CD from conference organisers: The Danish Road Directorate, Ministry of Transport, Denmark, and the International Society of Asphalt Pavements (ISAP).
De Beer, M., Fisher, C and Kannemeyer, L. 2004. Towards the application of Stress-In-Motion (SIM) results in pavement design and infrastructure protection. Eight (8th ) International Symposium on Heavy Vehicles, Weights and Dimensions. Loads, Roads and the Information Highway. 14-18 March 2004, Misty Hills Conference Centre, Muldersdrift, Gauteng, South Africa.
Milne TI, Huurman M, van de Ven MFC, Jenkins KJ, Scarpas A. 2004. Kasbergen, Development of a Prototype FEM Road Surfacing Seal Behavioural Model. CAPSA 2004, Sun City, September 2004 12 to 16, Sun City, NorthWest Province, South Africa (This Conference).
Morton, BS, Luttig E, Horak E and Visser A.T. (2004). The Effect of Axle Load Spectra and Tyre Inflation Pressures on Standard Pavement Design Methods. Paper offered for publication at the 8th Conference of Asphalt Pavements of Southern Africa (CAPSA), 2004. Sun City, September12 to 16, 2004, Northwest Province, South Africa.
Netterberg, F (1994a). Stabilization Reflection Cracking of Roads in South Africa: A Preliminary Survey of Local Experience Research Report RR 90/279, Department of Transport, March 1994.
Netterberg, F (1994b). Surface Disintegration of Primed Pavement Layers and Blistering of Bituminous Surfacings. Research Report RR 90/275, Department of Transport, March 1994.
Netterberg, F (2004). Personal Discussions. 79 Charles Jackson Street, Weavind Park, 0184, Pretoria, South Africa. E-mail [email protected]. Tel: +27 12 804 7203, Fax: +27 12 804 6179.

8th CONFERENCE ON ASPHALT PAVEMENTS FOR SOUTHERN AFRICA
Paper 061
Gillespie, T. D. 1992. Fundamentals of Vehicle Dynamics. ISBN 1-56091-199-9. Published by Society of Automotive Engineers, Inc. 400 Commonwealth Drive, Warrendale, PA 15096-0001.
Shaw, A. 2004. Personal Discussions on streamlining freight logistics in South Africa. CSIR Transportek, March 2004.
TRH16. 1991. Traffic Loading. Technical Recommendations for Highways (TRH). Committee of Land Transport Officials (COLTO), Department of Transport, Pretoria, South Africa, 1991.