Embed Size (px)
Citation preview
TXC Corporation and Subsidiaries Consolidated Financial Statements for the Nine Months Ended September 30, 2019 and 2018
- 1 -
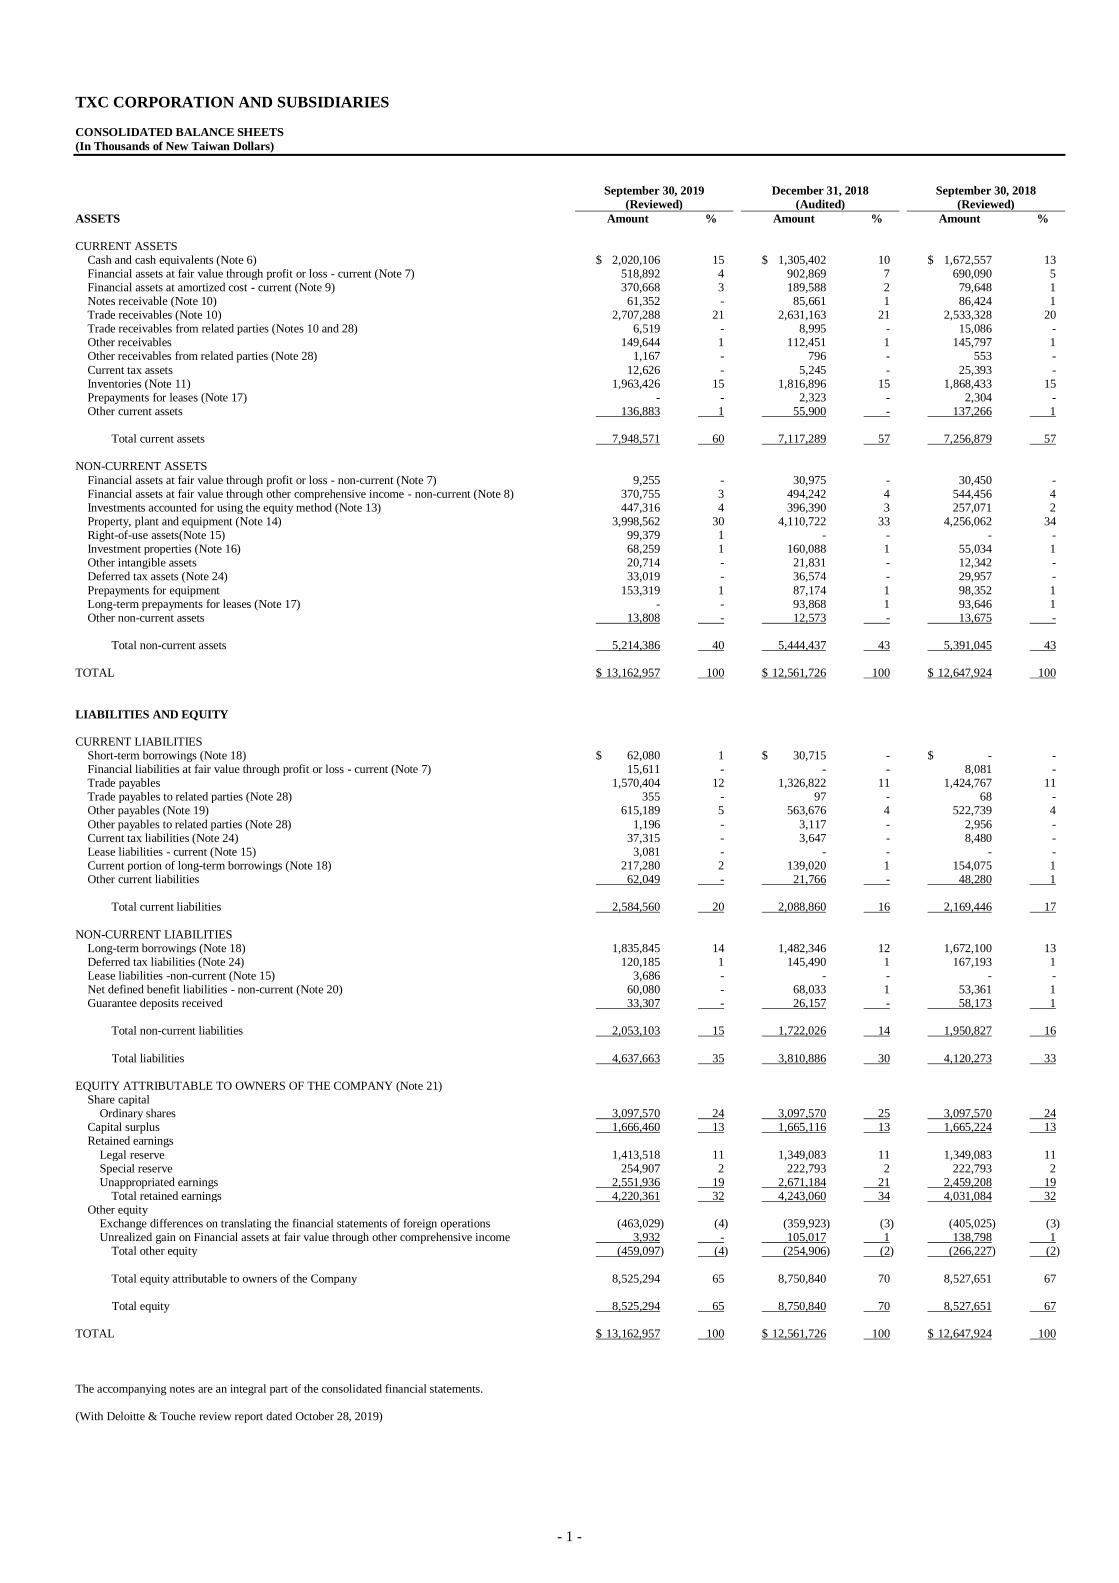
TXC CORPORATION AND SUBSIDIARIES
CONSOLIDATED BALANCE SHEETS
(In Thousands of New Taiwan Dollars)
September 30, 2019
(Reviewed)
December 31, 2018
(Audited)
September 30, 2018
(Reviewed)
ASSETS Amount % Amount % Amount %
CURRENT ASSETS Cash and cash equivalents (Note 6) $ 2,020,106 15 $ 1,305,402 10 $ 1,672,557 13 Financial assets at fair value through profit or loss - current (Note 7) 518,892 4 902,869 7 690,090 5 Financial assets at amortized cost - current (Note 9) 370,668 3 189,588 2 79,648 1 Notes receivable (Note 10) 61,352 - 85,661 1 86,424 1 Trade receivables (Note 10) 2,707,288 21 2,631,163 21 2,533,328 20 Trade receivables from related parties (Notes 10 and 28) 6,519 - 8,995 - 15,086 - Other receivables 149,644 1 112,451 1 145,797 1 Other receivables from related parties (Note 28) 1,167 - 796 - 553 -
Current tax assets 12,626 - 5,245 - 25,393 - Inventories (Note 11) 1,963,426 15 1,816,896 15 1,868,433 15 Prepayments for leases (Note 17) - - 2,323 - 2,304 - Other current assets 136,883 1 55,900 - 137,266 1
Total current assets 7,948,571 60 7,117,289 57 7,256,879 57
NON-CURRENT ASSETS
Financial assets at fair value through profit or loss - non-current (Note 7) 9,255 - 30,975 - 30,450 - Financial assets at fair value through other comprehensive income - non-current (Note 8) 370,755 3 494,242 4 544,456 4 Investments accounted for using the equity method (Note 13) 447,316 4 396,390 3 257,071 2 Property, plant and equipment (Note 14) 3,998,562 30 4,110,722 33 4,256,062 34 Right-of-use assets(Note 15) 99,379 1 - - - - Investment properties (Note 16) 68,259 1 160,088 1 55,034 1 Other intangible assets 20,714 - 21,831 - 12,342 - Deferred tax assets (Note 24) 33,019 - 36,574 - 29,957 -
Prepayments for equipment 153,319 1 87,174 1 98,352 1 Long-term prepayments for leases (Note 17) - - 93,868 1 93,646 1 Other non-current assets 13,808 - 12,573 - 13,675 -
Total non-current assets 5,214,386 40 5,444,437 43 5,391,045 43
TOTAL $ 13,162,957 100 $ 12,561,726 100 $ 12,647,924 100
LIABILITIES AND EQUITY CURRENT LIABILITIES
Short-term borrowings (Note 18) $ 62,080 1 $ 30,715 - $ - - Financial liabilities at fair value through profit or loss - current (Note 7) 15,611 - - - 8,081 - Trade payables 1,570,404 12 1,326,822 11 1,424,767 11 Trade payables to related parties (Note 28) 355 - 97 - 68 - Other payables (Note 19) 615,189 5 563,676 4 522,739 4
Other payables to related parties (Note 28) 1,196 - 3,117 - 2,956 - Current tax liabilities (Note 24) 37,315 - 3,647 - 8,480 - Lease liabilities - current (Note 15) 3,081 - - - - - Current portion of long-term borrowings (Note 18) 217,280 2 139,020 1 154,075 1 Other current liabilities 62,049 - 21,766 - 48,280 1
Total current liabilities 2,584,560 20 2,088,860 16 2,169,446 17
NON-CURRENT LIABILITIES Long-term borrowings (Note 18) 1,835,845 14 1,482,346 12 1,672,100 13 Deferred tax liabilities (Note 24) 120,185 1 145,490 1 167,193 1 Lease liabilities -non-current (Note 15) 3,686 - - - - - Net defined benefit liabilities - non-current (Note 20) 60,080 - 68,033 1 53,361 1 Guarantee deposits received 33,307 - 26,157 - 58,173 1
Total non-current liabilities 2,053,103 15 1,722,026 14 1,950,827 16
Total liabilities 4,637,663 35 3,810,886 30 4,120,273 33
EQUITY ATTRIBUTABLE TO OWNERS OF THE COMPANY (Note 21)
Share capital Ordinary shares 3,097,570 24 3,097,570 25 3,097,570 24
Capital surplus 1,666,460 13 1,665,116 13 1,665,224 13 Retained earnings
Legal reserve 1,413,518 11 1,349,083 11 1,349,083 11 Special reserve 254,907 2 222,793 2 222,793 2 Unappropriated earnings 2,551,936 19 2,671,184 21 2,459,208 19
Total retained earnings 4,220,361 32 4,243,060 34 4,031,084 32 Other equity
Exchange differences on translating the financial statements of foreign operations (463,029) (4) (359,923) (3) (405,025) (3) Unrealized gain on Financial assets at fair value through other comprehensive income 3,932 - 105,017 1 138,798 1
Total other equity (459,097) (4) (254,906) (2) (266,227) (2)
Total equity attributable to owners of the Company 8,525,294 65 8,750,840 70 8,527,651 67
Total equity 8,525,294 65 8,750,840 70 8,527,651 67 TOTAL $ 13,162,957 100 $ 12,561,726 100 $ 12,647,924 100
The accompanying notes are an integral part of the consolidated financial statements. (With Deloitte & Touche review report dated October 28, 2019)
- 2 -
TXC CORPORATION AND SUBSIDIARIES
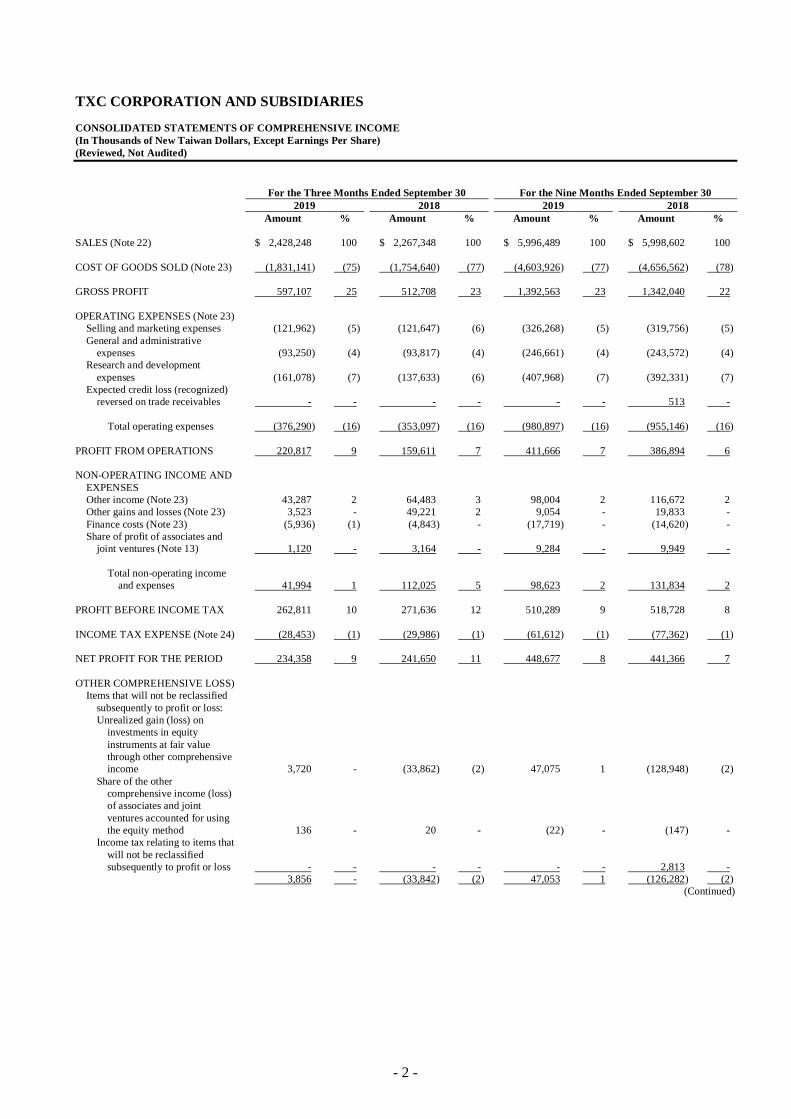
CONSOLIDATED STATEMENTS OF COMPREHENSIVE INCOME
(In Thousands of New Taiwan Dollars, Except Earnings Per Share)
(Reviewed, Not Audited)
For the Three Months Ended September 30 For the Nine Months Ended September 30
2019 2018 2019 2018
Amount % Amount % Amount % Amount %
SALES (Note 22) $ 2,428,248 100 $ 2,267,348 100 $ 5,996,489 100 $ 5,998,602 100
COST OF GOODS SOLD (Note 23) (1,831,141 ) (75) (1,754,640 ) (77) (4,603,926 ) (77) (4,656,562 ) (78)
GROSS PROFIT 597,107 25 512,708 23 1,392,563 23 1,342,040 22
OPERATING EXPENSES (Note 23)
Selling and marketing expenses (121,962 ) (5) (121,647 ) (6) (326,268 ) (5) (319,756 ) (5)
General and administrative
expenses (93,250 ) (4) (93,817 ) (4) (246,661 ) (4) (243,572 ) (4)
Research and development
expenses (161,078 ) (7) (137,633 ) (6) (407,968 ) (7) (392,331 ) (7)
Expected credit loss (recognized)
reversed on trade receivables - - - - - - 513 -
Total operating expenses (376,290 ) (16) (353,097 ) (16) (980,897 ) (16) (955,146 ) (16)
PROFIT FROM OPERATIONS 220,817 9 159,611 7 411,666 7 386,894 6
NON-OPERATING INCOME AND
EXPENSES
Other income (Note 23) 43,287 2 64,483 3 98,004 2 116,672 2
Other gains and losses (Note 23) 3,523 - 49,221 2 9,054 - 19,833 -
Finance costs (Note 23) (5,936 ) (1) (4,843 ) - (17,719 ) - (14,620 ) -
Share of profit of associates and
joint ventures (Note 13) 1,120 - 3,164 - 9,284 - 9,949 -
Total non-operating income
and expenses 41,994 1 112,025 5 98,623 2 131,834 2
PROFIT BEFORE INCOME TAX 262,811 10 271,636 12 510,289 9 518,728 8
INCOME TAX EXPENSE (Note 24) (28,453 ) (1) (29,986 ) (1) (61,612 ) (1) (77,362 ) (1)
NET PROFIT FOR THE PERIOD 234,358 9 241,650 11 448,677 8 441,366 7
OTHER COMPREHENSIVE LOSS)
Items that will not be reclassified
subsequently to profit or loss:
Unrealized gain (loss) on
investments in equity
instruments at fair value
through other comprehensive
income 3,720 - (33,862 ) (2) 47,075 1 (128,948 ) (2)
Share of the other
comprehensive income (loss)
of associates and joint
ventures accounted for using
the equity method 136 - 20 - (22 ) - (147 ) -
Income tax relating to items that
will not be reclassified
subsequently to profit or loss - - - - - - 2,813 -
3,856 - (33,842 ) (2) 47,053 1 (126,282 ) (2)
(Continued)
- 3 -
TXC CORPORATION AND SUBSIDIARIES
CONSOLIDATED STATEMENTS OF COMPREHENSIVE INCOME
(In Thousands of New Taiwan Dollars, Except Earnings Per Share)
(Reviewed, Not Audited)
For the Three Months Ended September 30 For the Nine Months Ended September 30
2019 2018 2019 2018
Amount % Amount % Amount % Amount %
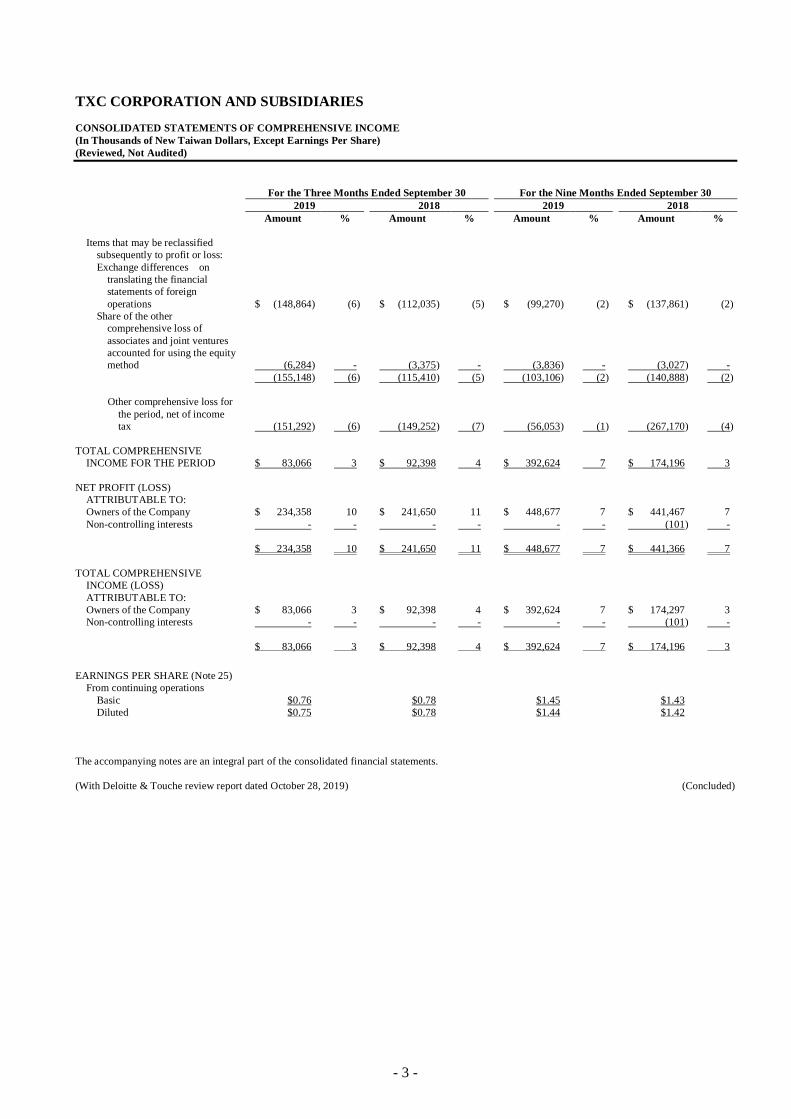
Items that may be reclassified
subsequently to profit or loss:
Exchange differences on
translating the financial
statements of foreign
operations $ (148,864 ) (6) $ (112,035 ) (5) $ (99,270 ) (2) $ (137,861 ) (2)
Share of the other
comprehensive loss of
associates and joint ventures
accounted for using the equity
method (6,284 ) - (3,375 ) - (3,836 ) - (3,027 ) -
(155,148 ) (6) (115,410 ) (5) (103,106 ) (2) (140,888 ) (2)
Other comprehensive loss for
the period, net of income
tax (151,292 ) (6) (149,252 ) (7) (56,053 ) (1) (267,170 ) (4)
TOTAL COMPREHENSIVE
INCOME FOR THE PERIOD $ 83,066 3 $ 92,398 4 $ 392,624 7 $ 174,196 3
NET PROFIT (LOSS)
ATTRIBUTABLE TO:
Owners of the Company $ 234,358 10 $ 241,650 11 $ 448,677 7 $ 441,467 7
Non-controlling interests - - - - - - (101 ) -
$ 234,358 10 $ 241,650 11 $ 448,677 7 $ 441,366 7
TOTAL COMPREHENSIVE
INCOME (LOSS)
ATTRIBUTABLE TO:
Owners of the Company $ 83,066 3 $ 92,398 4 $ 392,624 7 $ 174,297 3
Non-controlling interests - - - - - - (101 ) -
$ 83,066 3 $ 92,398 4 $ 392,624 7 $ 174,196 3
EARNINGS PER SHARE (Note 25)
From continuing operations
Basic $0.76 $0.78 $1.45 $1.43
Diluted $0.75 $0.78 $1.44 $1.42
The accompanying notes are an integral part of the consolidated financial statements.
(With Deloitte & Touche review report dated October 28, 2019) (Concluded)
- 4 -
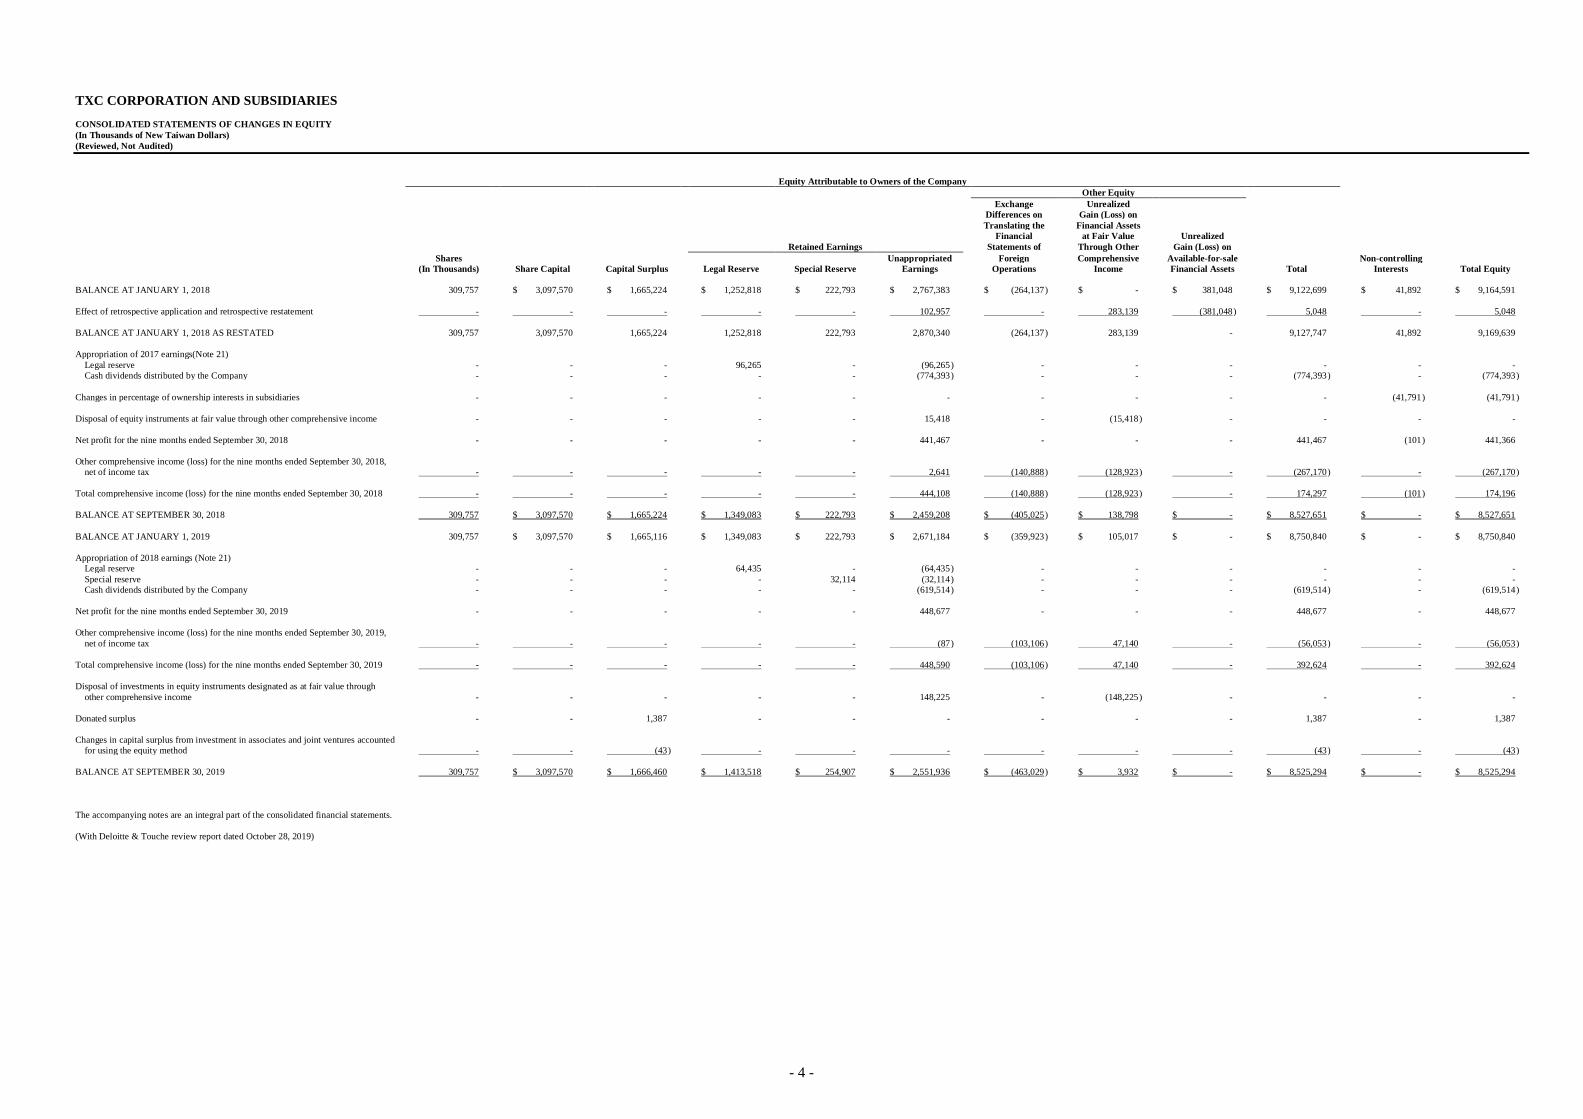
TXC CORPORATION AND SUBSIDIARIES
CONSOLIDATED STATEMENTS OF CHANGES IN EQUITY
(In Thousands of New Taiwan Dollars)
(Reviewed, Not Audited)
Equity Attributable to Owners of the Company
Other Equity
Exchange Unrealized Differences on Gain (Loss) on
Translating the Financial Assets Financial at Fair Value Unrealized
Retained Earnings Statements of Through Other Gain (Loss) on
Shares Unappropriated Foreign Comprehensive Available-for-sale Non-controlling (In Thousands) Share Capital Capital Surplus Legal Reserve Special Reserve Earnings Operations Income Financial Assets Total Interests Total Equity
BALANCE AT JANUARY 1, 2018 309,757 $ 3,097,570 $ 1,665,224 $ 1,252,818 $ 222,793 $ 2,767,383 $ (264,137 ) $ - $ 381,048 $ 9,122,699 $ 41,892 $ 9,164,591
Effect of retrospective application and retrospective restatement - - - - - 102,957 - 283,139 (381,048 ) 5,048 - 5,048
BALANCE AT JANUARY 1, 2018 AS RESTATED 309,757 3,097,570 1,665,224 1,252,818 222,793 2,870,340 (264,137 ) 283,139 - 9,127,747 41,892 9,169,639
Appropriation of 2017 earnings(Note 21)
Legal reserve - - - 96,265 - (96,265 ) - - - - - -
Cash dividends distributed by the Company - - - - - (774,393 ) - - - (774,393 ) - (774,393 )
Changes in percentage of ownership interests in subsidiaries - - - - - - - - - - (41,791 ) (41,791 )
Disposal of equity instruments at fair value through other comprehensive income - - - - - 15,418 - (15,418 ) - - - -
Net profit for the nine months ended September 30, 2018 - - - - - 441,467 - - - 441,467 (101 ) 441,366
Other comprehensive income (loss) for the nine months ended September 30, 2018,
net of income tax - - - - - 2,641 (140,888 ) (128,923 ) - (267,170 ) - (267,170 )
Total comprehensive income (loss) for the nine months ended September 30, 2018 - - - - - 444,108 (140,888 ) (128,923 ) - 174,297 (101 ) 174,196
BALANCE AT SEPTEMBER 30, 2018 309,757 $ 3,097,570 $ 1,665,224 $ 1,349,083 $ 222,793 $ 2,459,208 $ (405,025 ) $ 138,798 $ - $ 8,527,651 $ - $ 8,527,651
BALANCE AT JANUARY 1, 2019 309,757 $ 3,097,570 $ 1,665,116 $ 1,349,083 $ 222,793 $ 2,671,184 $ (359,923 ) $ 105,017 $ - $ 8,750,840 $ - $ 8,750,840
Appropriation of 2018 earnings (Note 21)
Legal reserve - - - 64,435 - (64,435 ) - - - - - -
Special reserve - - - - 32,114 (32,114 ) - - - - - -
Cash dividends distributed by the Company - - - - - (619,514 ) - - - (619,514 ) - (619,514 )
Net profit for the nine months ended September 30, 2019 - - - - - 448,677 - - - 448,677 - 448,677
Other comprehensive income (loss) for the nine months ended September 30, 2019,
net of income tax - - - - - (87 ) (103,106 ) 47,140 - (56,053 ) - (56,053 )
Total comprehensive income (loss) for the nine months ended September 30, 2019 - - - - - 448,590 (103,106 ) 47,140 - 392,624 - 392,624
Disposal of investments in equity instruments designated as at fair value through
other comprehensive income - - - - - 148,225 - (148,225 ) - - - -
Donated surplus - - 1,387 - - - - - - 1,387 - 1,387
Changes in capital surplus from investment in associates and joint ventures accounted
for using the equity method - - (43 ) - - - - - - (43 ) - (43 )
BALANCE AT SEPTEMBER 30, 2019 309,757 $ 3,097,570 $ 1,666,460 $ 1,413,518 $ 254,907 $ 2,551,936 $ (463,029 ) $ 3,932 $ - $ 8,525,294 $ - $ 8,525,294
The accompanying notes are an integral part of the consolidated financial statements.
(With Deloitte & Touche review report dated October 28, 2019)
- 5 -
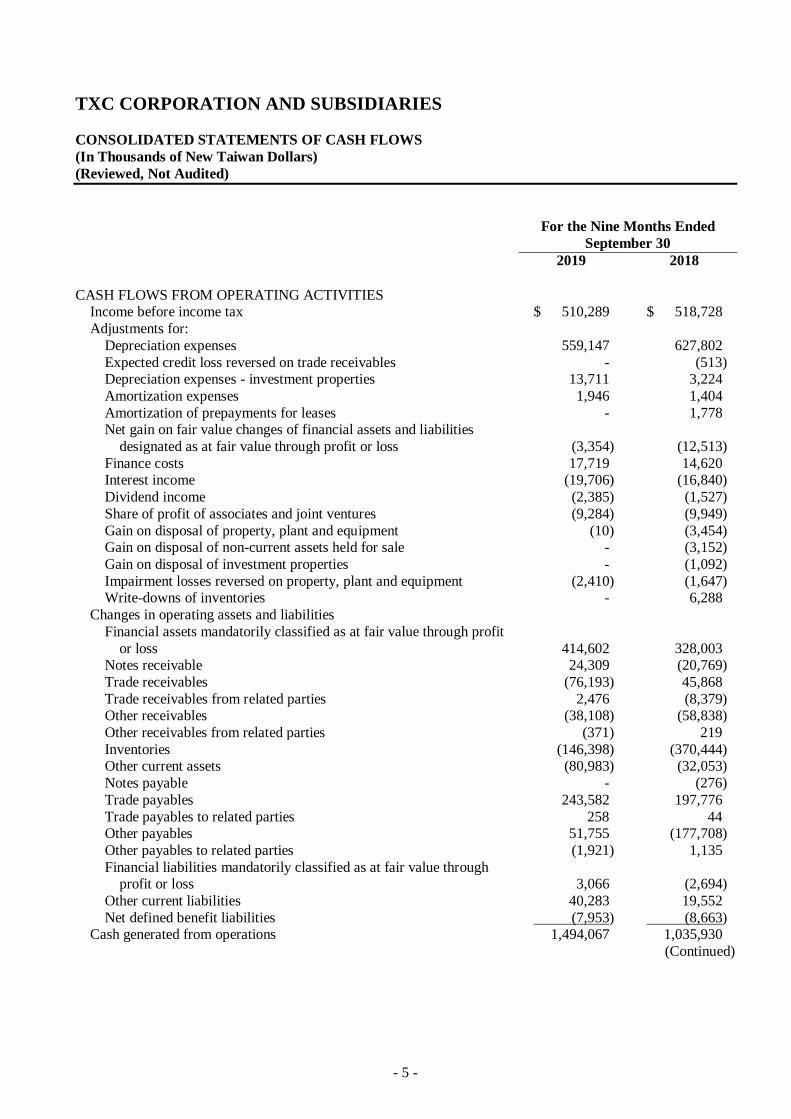
TXC CORPORATION AND SUBSIDIARIES
CONSOLIDATED STATEMENTS OF CASH FLOWS
(In Thousands of New Taiwan Dollars)
(Reviewed, Not Audited)
For the Nine Months Ended
September 30
2019 2018
CASH FLOWS FROM OPERATING ACTIVITIES Income before income tax $ 510,289 $ 518,728
Adjustments for:
Depreciation expenses 559,147 627,802
Expected credit loss reversed on trade receivables - (513) Depreciation expenses - investment properties 13,711 3,224
Amortization expenses 1,946 1,404
Amortization of prepayments for leases - 1,778 Net gain on fair value changes of financial assets and liabilities
designated as at fair value through profit or loss (3,354) (12,513)
Finance costs 17,719 14,620 Interest income (19,706) (16,840)
Dividend income (2,385) (1,527)
Share of profit of associates and joint ventures (9,284) (9,949)
Gain on disposal of property, plant and equipment (10) (3,454) Gain on disposal of non-current assets held for sale - (3,152)
Gain on disposal of investment properties - (1,092)
Impairment losses reversed on property, plant and equipment (2,410) (1,647) Write-downs of inventories - 6,288
Changes in operating assets and liabilities
Financial assets mandatorily classified as at fair value through profit
or loss 414,602 328,003 Notes receivable 24,309 (20,769)
Trade receivables (76,193) 45,868
Trade receivables from related parties 2,476 (8,379) Other receivables (38,108) (58,838)
Other receivables from related parties (371) 219
Inventories (146,398) (370,444) Other current assets (80,983) (32,053)
Notes payable - (276)
Trade payables 243,582 197,776
Trade payables to related parties 258 44 Other payables 51,755 (177,708)
Other payables to related parties (1,921) 1,135
Financial liabilities mandatorily classified as at fair value through profit or loss 3,066 (2,694)
Other current liabilities 40,283 19,552
Net defined benefit liabilities (7,953) (8,663) Cash generated from operations 1,494,067 1,035,930
(Continued)
- 6 -
TXC CORPORATION AND SUBSIDIARIES
CONSOLIDATED STATEMENTS OF CASH FLOWS
(In Thousands of New Taiwan Dollars)
(Reviewed, Not Audited)
For the Nine Months Ended
September 30
2019 2018
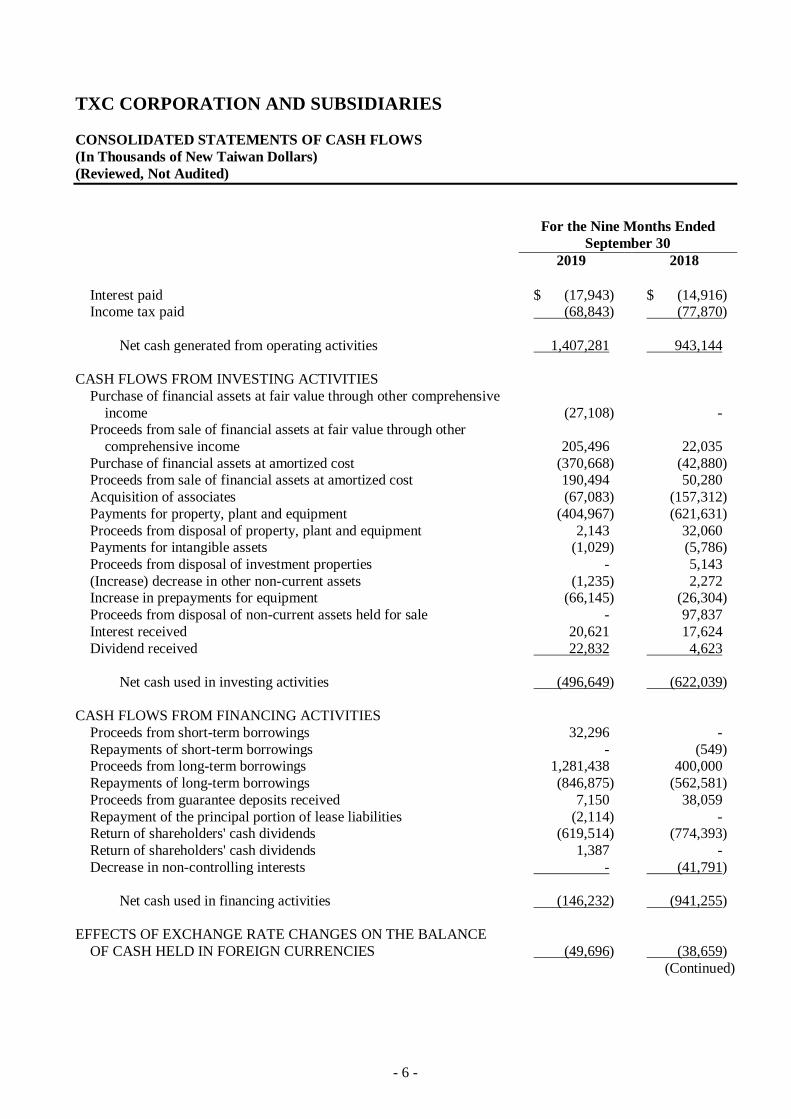
Interest paid $ (17,943) $ (14,916) Income tax paid (68,843) (77,870)
Net cash generated from operating activities 1,407,281 943,144
CASH FLOWS FROM INVESTING ACTIVITIES
Purchase of financial assets at fair value through other comprehensive
income (27,108) - Proceeds from sale of financial assets at fair value through other
comprehensive income 205,496 22,035
Purchase of financial assets at amortized cost (370,668) (42,880) Proceeds from sale of financial assets at amortized cost 190,494 50,280
Acquisition of associates (67,083) (157,312)
Payments for property, plant and equipment (404,967) (621,631)
Proceeds from disposal of property, plant and equipment 2,143 32,060 Payments for intangible assets (1,029) (5,786)
Proceeds from disposal of investment properties - 5,143
(Increase) decrease in other non-current assets (1,235) 2,272 Increase in prepayments for equipment (66,145) (26,304)
Proceeds from disposal of non-current assets held for sale - 97,837
Interest received 20,621 17,624
Dividend received 22,832 4,623
Net cash used in investing activities (496,649) (622,039)
CASH FLOWS FROM FINANCING ACTIVITIES
Proceeds from short-term borrowings 32,296 -
Repayments of short-term borrowings - (549) Proceeds from long-term borrowings 1,281,438 400,000
Repayments of long-term borrowings (846,875) (562,581)
Proceeds from guarantee deposits received 7,150 38,059
Repayment of the principal portion of lease liabilities (2,114) - Return of shareholders' cash dividends (619,514) (774,393)
Return of shareholders' cash dividends 1,387 -
Decrease in non-controlling interests - (41,791)
Net cash used in financing activities (146,232) (941,255)
EFFECTS OF EXCHANGE RATE CHANGES ON THE BALANCE
OF CASH HELD IN FOREIGN CURRENCIES (49,696) (38,659)
(Continued)
- 7 -
TXC CORPORATION AND SUBSIDIARIES
CONSOLIDATED STATEMENTS OF CASH FLOWS
(In Thousands of New Taiwan Dollars)
(Reviewed, Not Audited)
For the Nine Months Ended
September 30
2019 2018
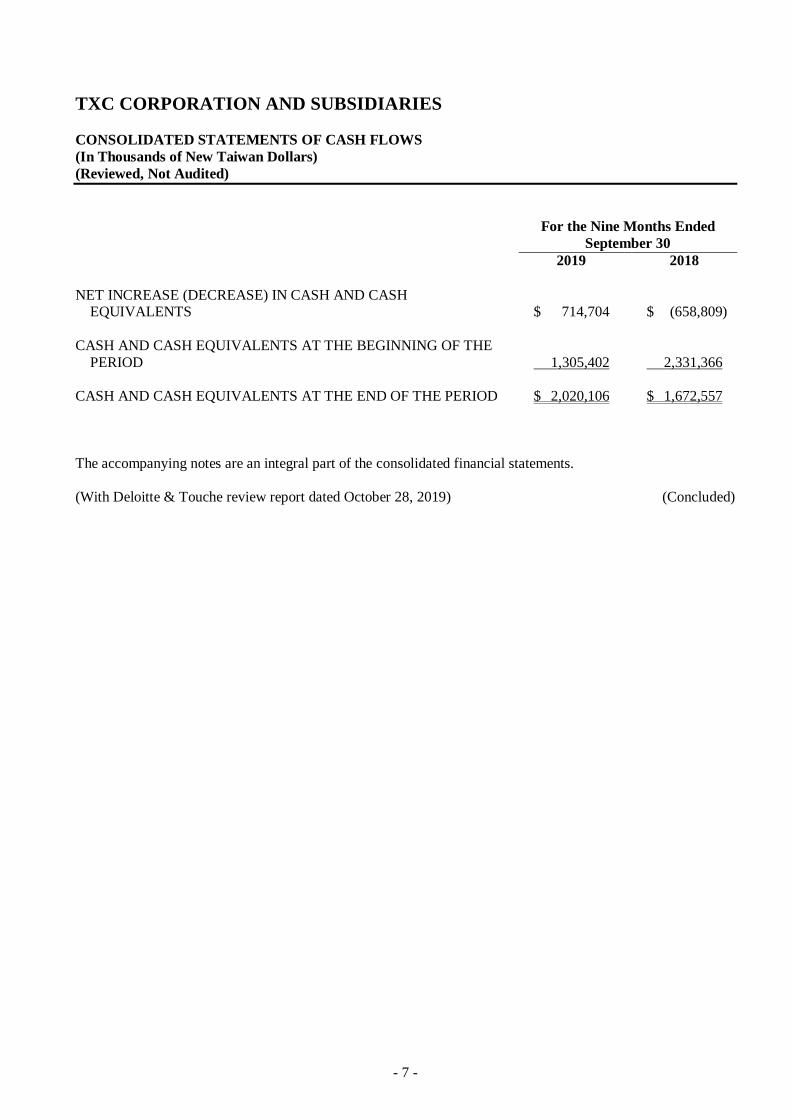
NET INCREASE (DECREASE) IN CASH AND CASH EQUIVALENTS $ 714,704 $ (658,809)
CASH AND CASH EQUIVALENTS AT THE BEGINNING OF THE
PERIOD 1,305,402 2,331,366
CASH AND CASH EQUIVALENTS AT THE END OF THE PERIOD $ 2,020,106 $ 1,672,557
The accompanying notes are an integral part of the consolidated financial statements.
(With Deloitte & Touche review report dated October 28, 2019) (Concluded)
- 8 -
TXC CORPORATION AND SUBSIDIARIES
NOTES TO CONSOLIDATED FINANCIAL STATEMENTS
FOR THE NINE MONTHS ENDED SEPTEMBER 30, 2019 AND 2018
(In Thousands of New Taiwan Dollars, Unless Stated Otherwise)
(Reviewed, Not Audited)
1. GENERAL INFORMATION
TXC Corporation (the “Company”) was incorporated in the Republic of China (“ROC”) in December 1983.
TXC specializes in producing high quality Quartz Unite Crystal, Automotive Crystal, Crystal Oscillator
(CXO), and Timing Module (TM) as well as develops a variety of sensors by core technology to satisfy the
market demand. Sensors are applied to various applications including mobile communication, wearable device, Internet of Things and vehicle electronics, etc.
TXC’s shares have been listed on the Taiwan Stock Exchange since August 26, 2002.
The consolidated financial statements are presented in the Company’s functional currency, the New Taiwan
dollar.
In order to ensure investors’ rights and interests, the Company had applied to Taiwan Corporate
Governance Association for corporate governance assessment certification. The Company has acquired
(CG6005 general version of corporate governance assessment and authentication) and (CG6008 advanced
version of corporate governance assessment and authentication), on March 23, 2011 and June 27, 2013, respectively. In the event of first “Corporate Governance Assessment and Authentication” which is jointly
held by the “Taiwan Stock Exchange” and “Taipei Exchange”, the Company was listed as the top 20
percent of the listed companies in 2014 and awarded the top 5 percent of the listed companies from 2015 to 2017. The Company will continue to strengthen corporate governance functions in order to work with
international standards and to protect public interests.
2. APPROVAL OF FINANCIAL STATEMENTS
The consolidated financial statements were approved by the Company’s board of directors on October 28, 2019.
- 9 -
3. APPLICATION OF NEW, AMENDED AND REVISED STANDARDS AND INTERPRETATIONS
a. Initial application of the amendments to the Regulations Governing the Preparation of Financial Reports by Securities Issuers and the International Financial Reporting Standards (IFRS), International
Accounting Standards (IAS), Interpretations of IFRS (IFRIC), and Interpretations of IAS (SIC)
(collectively, the “IFRSs”) endorsed and issued into effect by the FSC
Except for the following, whenever applied, the initial application of the amendments to the
Regulations Governing the Preparation of Financial Reports by Securities Issuers and the IFRSs endorsed and issued into effect by the FSC would not have any material impact on the Group’s
accounting policies:
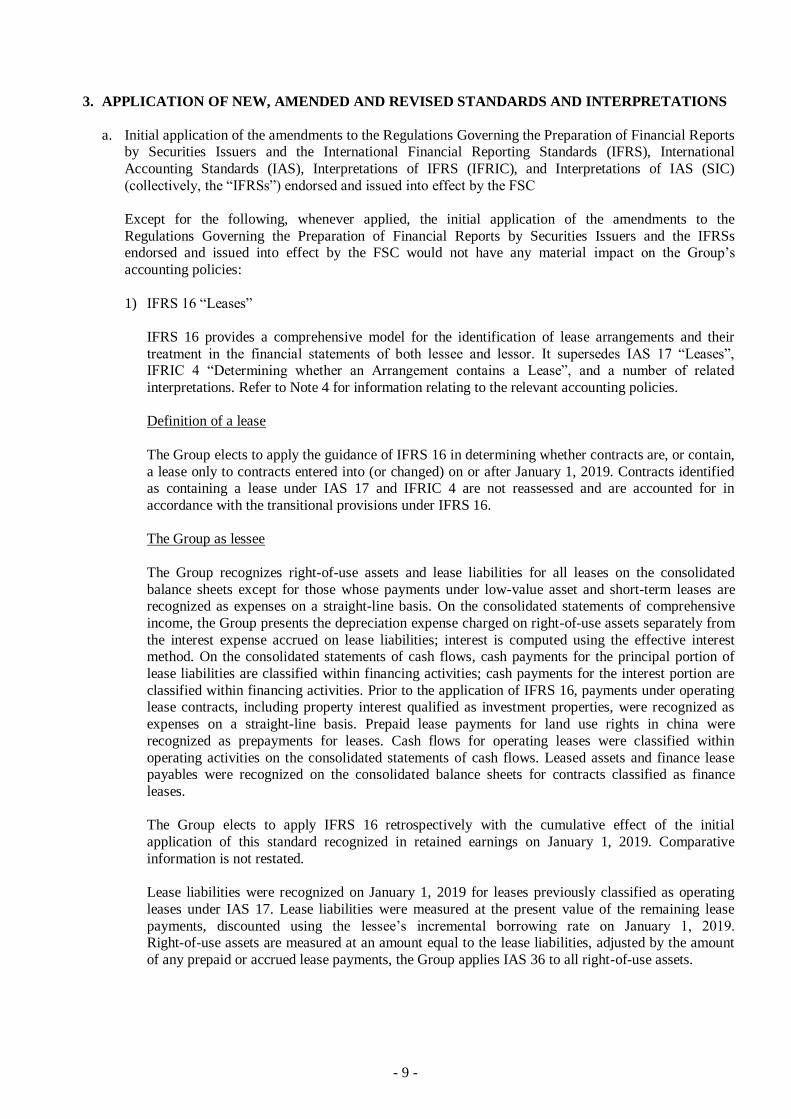
1) IFRS 16 “Leases”
IFRS 16 provides a comprehensive model for the identification of lease arrangements and their
treatment in the financial statements of both lessee and lessor. It supersedes IAS 17 “Leases”, IFRIC 4 “Determining whether an Arrangement contains a Lease”, and a number of related
interpretations. Refer to Note 4 for information relating to the relevant accounting policies.
Definition of a lease
The Group elects to apply the guidance of IFRS 16 in determining whether contracts are, or contain,
a lease only to contracts entered into (or changed) on or after January 1, 2019. Contracts identified as containing a lease under IAS 17 and IFRIC 4 are not reassessed and are accounted for in
accordance with the transitional provisions under IFRS 16.
The Group as lessee
The Group recognizes right-of-use assets and lease liabilities for all leases on the consolidated
balance sheets except for those whose payments under low-value asset and short-term leases are recognized as expenses on a straight-line basis. On the consolidated statements of comprehensive
income, the Group presents the depreciation expense charged on right-of-use assets separately from
the interest expense accrued on lease liabilities; interest is computed using the effective interest method. On the consolidated statements of cash flows, cash payments for the principal portion of
lease liabilities are classified within financing activities; cash payments for the interest portion are
classified within financing activities. Prior to the application of IFRS 16, payments under operating lease contracts, including property interest qualified as investment properties, were recognized as
expenses on a straight-line basis. Prepaid lease payments for land use rights in china were
recognized as prepayments for leases. Cash flows for operating leases were classified within
operating activities on the consolidated statements of cash flows. Leased assets and finance lease payables were recognized on the consolidated balance sheets for contracts classified as finance
leases.
The Group elects to apply IFRS 16 retrospectively with the cumulative effect of the initial
application of this standard recognized in retained earnings on January 1, 2019. Comparative
information is not restated.
Lease liabilities were recognized on January 1, 2019 for leases previously classified as operating
leases under IAS 17. Lease liabilities were measured at the present value of the remaining lease
payments, discounted using the lessee’s incremental borrowing rate on January 1, 2019. Right-of-use assets are measured at an amount equal to the lease liabilities, adjusted by the amount
of any prepaid or accrued lease payments, the Group applies IAS 36 to all right-of-use assets.
- 10 -
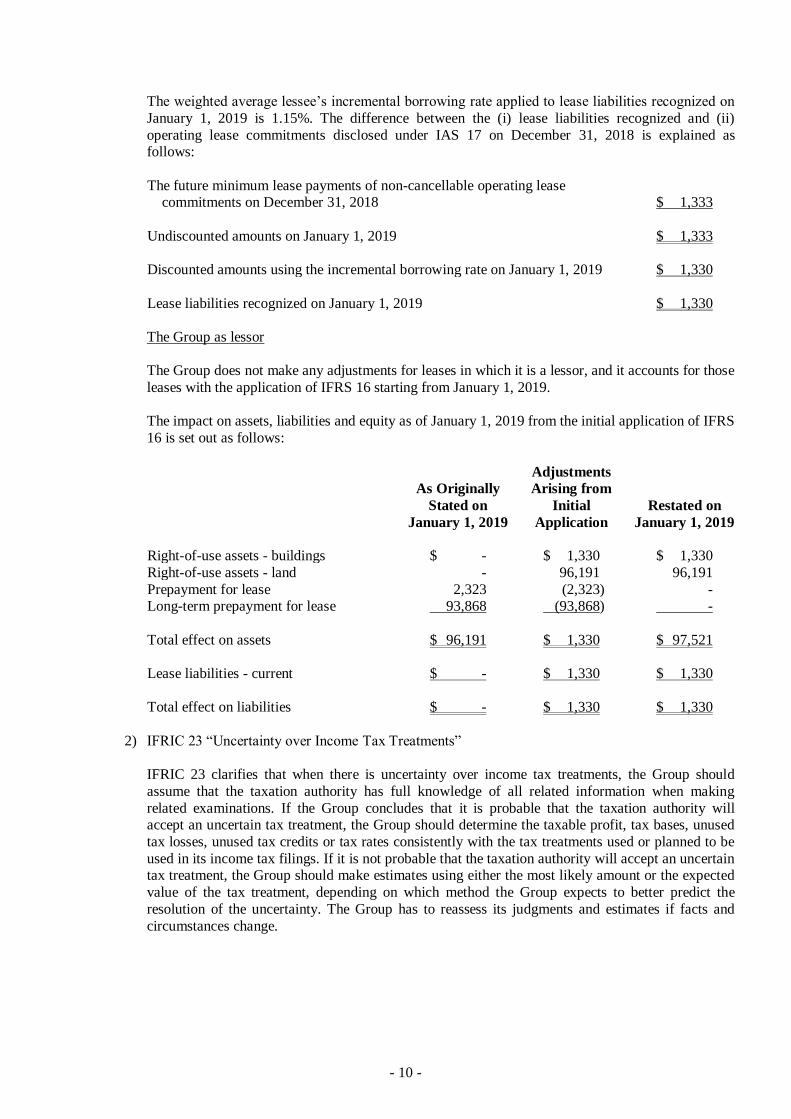
The weighted average lessee’s incremental borrowing rate applied to lease liabilities recognized on
January 1, 2019 is 1.15%. The difference between the (i) lease liabilities recognized and (ii)
operating lease commitments disclosed under IAS 17 on December 31, 2018 is explained as follows:
The future minimum lease payments of non-cancellable operating lease commitments on December 31, 2018 $ 1,333
Undiscounted amounts on January 1, 2019 $ 1,333
Discounted amounts using the incremental borrowing rate on January 1, 2019 $ 1,330
Lease liabilities recognized on January 1, 2019 $ 1,330
The Group as lessor
The Group does not make any adjustments for leases in which it is a lessor, and it accounts for those
leases with the application of IFRS 16 starting from January 1, 2019.
The impact on assets, liabilities and equity as of January 1, 2019 from the initial application of IFRS
16 is set out as follows:
As Originally
Stated on
January 1, 2019
Adjustments
Arising from
Initial
Application
Restated on
January 1, 2019
Right-of-use assets - buildings $ - $ 1,330 $ 1,330
Right-of-use assets - land - 96,191 96,191
Prepayment for lease 2,323 (2,323) - Long-term prepayment for lease 93,868 (93,868) -
Total effect on assets $ 96,191 $ 1,330 $ 97,521
Lease liabilities - current $ - $ 1,330 $ 1,330
Total effect on liabilities $ - $ 1,330 $ 1,330
2) IFRIC 23 “Uncertainty over Income Tax Treatments”
IFRIC 23 clarifies that when there is uncertainty over income tax treatments, the Group should
assume that the taxation authority has full knowledge of all related information when making
related examinations. If the Group concludes that it is probable that the taxation authority will accept an uncertain tax treatment, the Group should determine the taxable profit, tax bases, unused
tax losses, unused tax credits or tax rates consistently with the tax treatments used or planned to be
used in its income tax filings. If it is not probable that the taxation authority will accept an uncertain tax treatment, the Group should make estimates using either the most likely amount or the expected
value of the tax treatment, depending on which method the Group expects to better predict the
resolution of the uncertainty. The Group has to reassess its judgments and estimates if facts and
circumstances change.
- 11 -
3) Amendments to IAS 28 “Long-term Interests in Associates and Joint Ventures”
The amendments clarified that IFRS 9 “Financial Instruments” shall be applied to account for other financial instruments in an associate or joint venture to which the equity method is not applied.
These included long-term interests that, in substance, form part of the Group’s net investment in an
associate or joint venture.
4) Amendments to IFRS 9 “Prepayment Features with Negative Compensation”
IFRS 9 stipulates that if a contractual term of a financial asset permits the issuer (i.e. the debtor) to
prepay a debt instrument or permits the holder (i.e. the creditor) to put a debt instrument back to the
issuer before maturity and the prepayment amount substantially represents unpaid amounts of the
principal and interest on the principal amount outstanding, which may include reasonable compensation for early termination, the financial asset has contractual cash flows that are solely
payments of principal and interest on the principal amount outstanding. The amendments further
explain that reasonable compensation may be paid or received by either of the parties, i.e. a party may receive reasonable compensation when it chooses to terminate the contract early.
5) Annual Improvements to IFRSs 2015-2017 Cycle
Several standards, including IFRS 3 “Business Combinations”, IFRS 11 “Joint Arrangements”, IAS
12 “Income Taxes” and IAS 23 “Borrowing Costs”, were amended in this annual improvement. IAS
23 was amended to clarify that, if any specific borrowing remains outstanding after the related asset is ready for its intended use or sale, the related borrowing costs shall be included in the calculation
of the capitalization rate on general borrowings.
6) Amendments to IAS 19 “Plan Amendment, Curtailment or Settlement”
The amendments stipulate that, if a plan amendment, curtailment or settlement occurs, the current
service cost and the net interest for the remainder of the annual reporting period are determined using the actuarial assumptions used for the remeasurement of the net defined benefit liabilities
(assets). In addition, the amendments clarify the effect of a plan amendment, curtailment or
settlement on the requirements regarding the asset ceiling. The Group applied the above amendments prospectively.
b. The IFRSs endorsed by the Financial Supervisory Commission (FSC) for application starting from 2020
New IFRSs
Effective Date
Announced by IASB
Amendments to IFRS 3 “Definition of a Business” January 1, 2020 (Note 1)
Amendments to IAS 1 and IAS 8 “Definition of Material” January 1, 2020 (Note 2)
Note 1: The Group shall apply these amendments to business combinations for which the acquisition
date is on or after the beginning of the first annual reporting period beginning on or after
January 1, 2020 and to asset acquisitions that occur on or after the beginning of that period.
Note 2: The Group shall apply these amendments prospectively for annual reporting periods
beginning on or after January 1, 2020.
- 12 -
Amendments to IFRS 3 “Definition of a Business”
The amendments clarify that, to be considered a business, an acquired set of activities and assets must include, at a minimum, an input and a substantive process applied to the input that together
significantly contribute to the ability to create outputs. The amendments narrow the definitions of
outputs by focusing on goods and services provided to customers, and the reference to an ability to reduce costs is removed. Moreover, the amendments remove the assessment of whether market
participants are capable of replacing any missing inputs or processes and continuing to produce
outputs.
In addition, the amendments introduce an optional concentration test that permits a simplified
assessment of whether or not an acquired set of activities and assets is a business.
c. New IFRSs in issue but not yet endorsed and issued into effect by the FSC
New IFRSs
Effective Date
Announced by IASB (Note)
Amendments to IFRS 9, IAS 39 and IFRS 7 “Interest Rate Benchmark
Reform”
January 1, 2020
Amendments to IFRS 10 and IAS 28 “Sale or Contribution of Assets
between an Investor and its Associate or Joint Venture”
To be determined by IASB
IFRS 17 “Insurance Contracts” January 1, 2021
Note: Unless stated otherwise, the above New IFRSs are effective for annual periods beginning on or
after their respective effective dates.
Amendments to IFRS 10 and IAS 28 “Sale or Contribution of Assets between an Investor and its
Associate or Joint Venture”
The amendments stipulate that, when the Group sells or contributes assets that constitute a business
(as defined in IFRS 3) to an associate or joint venture, the gain or loss resulting from the transaction
is recognized in full. Also, when the Group loses control of a subsidiary that contains a business but retains significant influence or joint control, the gain or loss resulting from the transaction is
recognized in full.
Conversely, when the Group sells or contributes assets that do not constitute a business to an associate or joint venture, the gain or loss resulting from the transaction is recognized only to the
extent of the Group’s interest as an unrelated investor in the associate or joint venture, i.e. the
Group’s share of the gain or loss is eliminated. Also, when the Group loses control of a subsidiary that does not contain a business but retains significant influence or joint control over an associate or
a joint venture, the gain or loss resulting from the transaction is recognized only to the extent of the
Group’s interest as an unrelated investor in the associate or joint venture, i.e. the Group’s share of the gain or loss is eliminated.
Except for the above impact, as of the date the consolidated financial statements were authorized for
issue, the Group is continuously assessing the possible impact that the application of other standards and interpretations will have on the Group’s financial position and financial performance and will
disclose the relevant impact when the assessment is completed.
- 13 -
4. SUMMARY OF SIGNIFICANT ACCOUNTING POLICIES
a. Statement of compliance
These interim consolidated financial statements have been prepared in accordance with the Regulations
Governing the Preparation of Financial Reports by Securities Issuers and IAS 34 “Interim Financial Reporting” as endorsed and issued into effect by the FSC. Disclosure information included in these
interim consolidated financial statements is less than the disclosure information required in a complete
set of annual financial statements.
b. Basis of preparation
The consolidated financial statements have been prepared on the historical cost basis except for financial instruments which are measured at fair value.
The fair value measurements, which are grouped into Levels 1 to 3 based on the degree to which the fair value measurement inputs are observable and based on the significance of the inputs to the fair
value measurement in its entirety, are described as follows:
1) Level 1 inputs are quoted prices (unadjusted) in active markets for identical assets or liabilities;
2) Level 2 inputs are inputs other than quoted prices included within Level 1 that are observable for an
asset or liability, either directly (i.e. as prices) or indirectly (i.e. derived from prices); and
3) Level 3 inputs are unobservable inputs for an asset or liability.
c. Basis of consolidation
Refer to Note 12 and table 5 for detailed information on subsidiaries, including the percentages of
ownership and main businesses.
d. Other significant accounting policies
Except for the following, refer to the significant accounting policies in 2018 consolidated financial report:
1) Leases
2019
At the inception of a contract, the Group assesses whether the contract is, or contains, a lease.
a) The Group as lessor
Leases are classified as finance leases whenever the terms of a lease transfer substantially all the
risks and rewards of ownership to the lessee. All other leases are classified as operating leases.
Lease payments (less any lease incentives payable) from operating leases are recognized as
income on a straight-line basis over the terms of the relevant leases. Initial direct costs incurred
in obtaining operating leases are added to the carrying amounts of the underlying assets and
recognized as expenses on a straight-line basis over the lease terms.
- 14 -
b) The Group as lessee
The Group recognizes right-of-use assets and lease liabilities for all leases at the commencement date of a lease, except for short-term leases and low-value asset leases
accounted for applying a recognition exemption where lease payments are recognized as
expenses on a straight-line basis over the lease terms.
Right-of-use assets are initially measured at cost, which comprises the initial measurement of
lease liabilities adjusted for lease payments made at or before the commencement date, plus any initial direct costs incurred and an estimate of costs needed to restore the underlying assets, and
less any lease incentives received. Right-of-use assets are subsequently measured at cost less
accumulated depreciation and impairment losses and adjusted for any remeasurement of the
lease liabilities. Right-of-use assets are presented on a separate line in the consolidated balance sheets.
Right-of-use assets are depreciated using the straight-line method from the commencement dates to the earlier of the end of the useful lives of the right-of-use assets or the end of the lease
terms.
Lease liabilities are initially measured at the present value of the lease payments. The lease
payments are discounted using the interest rate implicit in a lease, if that rate can be readily
determined. If that rate cannot be readily determined, the Group uses the lessee’s incremental
borrowing rate.
Subsequently, lease liabilities are measured at amortized cost using the effective interest
method, with interest expense recognized over the lease terms. When there is a change in future lease payments resulting from a change in an index or a rate used to determine those payments,
the Group remeasures the lease liabilities with a corresponding adjustment to the
right-of-use-assets. However, if the carrying amount of the right-of-use assets is reduced to zero,
any remaining amount of the remeasurement is recognized in profit or loss. Lease liabilities are presented on a separate line in the consolidated balance sheets.
2018
Leases are classified as finance leases whenever the terms of a lease transfer substantially all the
risks and rewards of ownership to the lessee. All other leases are classified as operating leases.
a) The Group as lessor
Rental income from operating leases is recognized on a straight-line basis over the term of the relevant lease.
b) The Group as lessee
Assets held under finance leases are initially recognized as assets of the Group at their fair value
at the inception of the lease or, if lower, at the present value of the minimum lease payments. The corresponding liability to the lessor is included in the consolidated balance sheets as a
finance lease obligation.
Finance expenses implicit in lease payments for each period are recognized immediately in profit or loss, unless they are directly attributable to qualifying assets; in which case, they are
capitalized.
Operating lease payments are recognized as expenses on a straight-line basis over the lease
term.
- 15 -
c) Leasehold land for own use
When a lease includes both land and building elements, the Group assesses the classification of each element separately as a finance or an operating lease based on the assessment as to whether
substantially all the risks and rewards incidental to ownership of each element have been
transferred to the Group. The minimum lease payments are allocated between the land and the building elements in proportion to the relative fair values of the leasehold interests in the land
element and building element of the lease at the inception of the lease.
If the allocation of the lease payments can be made reliably, each element is accounted for
separately in accordance with its lease classification. When the lease payments cannot be
allocated reliably between the land and building elements, the entire lease is generally classified
as a finance lease unless it is clear that both elements are operating leases; in which case, the entire lease is classified as an operating lease.
2) Retirement benefits
Pension cost for an interim period is calculated on a year-to-date basis by using the actuarially
determined pension cost rate at the end of the prior financial year, adjusted for significant market fluctuations since that time and for significant plan amendments, settlements, or other significant
one-off events.
3) Taxation
Income tax expense represents the sum of the tax currently payable and deferred tax. Interim period
income taxes are assessed on an annual basis and calculated by applying to an interim period's pre-tax income the tax rate that would be applicable to expected total annual earnings. The effect of
a change in tax rate resulting from a change in tax law is recognized consistently with the
accounting for the transaction itself which gives rise to the tax consequence, and this is recognized
in profit or loss, other comprehensive income or directly in equity in full in the period in which the change in tax rate occurs.
5. CRITICAL ACCOUNTING JUDGMENTS AND KEY SOURCES OF ESTIMATION
UNCERTAINTY
The same critical accounting judgments and key sources of estimation uncertainty of consolidated financial
statements have been followed in these consolidated financial statements as were applied in the preparation
of the consolidated financial statements for the year ended December 31, 2018.
6. CASH AND CASH EQUIVALENTS
September 30,
2019
December 31,
2018
September 30,
2018
Cash on hand $ 1,267 $ 1,260 $ 830
Demand deposits 1,755,051 1,301,939 1,482,136
Checking accounts 1,761 2,203 4,599
Cash equivalents (investments with original maturities of less than three months)
Time deposits 222,027 - 139,992
Repurchase agreements collateralized by bonds 40,000 - 45,000
$ 2,020,106 $ 1,305,402 $ 1,672,557
- 16 -
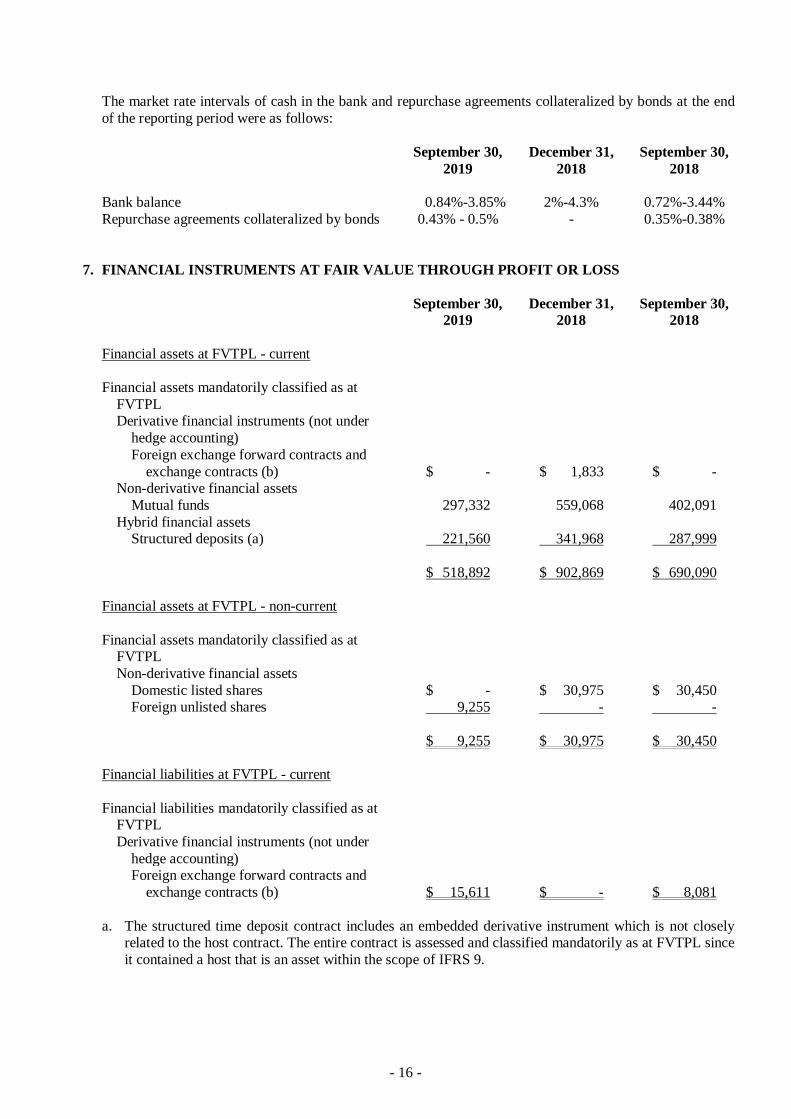
The market rate intervals of cash in the bank and repurchase agreements collateralized by bonds at the end
of the reporting period were as follows:
September 30,
2019
December 31,
2018
September 30,
2018
Bank balance 0.84%-3.85% 2%-4.3% 0.72%-3.44%
Repurchase agreements collateralized by bonds 0.43% - 0.5% - 0.35%-0.38%
7. FINANCIAL INSTRUMENTS AT FAIR VALUE THROUGH PROFIT OR LOSS
September 30,
2019
December 31,
2018
September 30,
2018
Financial assets at FVTPL - current
Financial assets mandatorily classified as at
FVTPL Derivative financial instruments (not under
hedge accounting)
Foreign exchange forward contracts and
exchange contracts (b) $ - $ 1,833 $ - Non-derivative financial assets
Mutual funds 297,332 559,068 402,091
Hybrid financial assets Structured deposits (a) 221,560 341,968 287,999
$ 518,892 $ 902,869 $ 690,090
Financial assets at FVTPL - non-current
Financial assets mandatorily classified as at FVTPL
Non-derivative financial assets
Domestic listed shares $ - $ 30,975 $ 30,450 Foreign unlisted shares 9,255 - -
$ 9,255 $ 30,975 $ 30,450
Financial liabilities at FVTPL - current
Financial liabilities mandatorily classified as at FVTPL
Derivative financial instruments (not under
hedge accounting) Foreign exchange forward contracts and
exchange contracts (b) $ 15,611 $ - $ 8,081
a. The structured time deposit contract includes an embedded derivative instrument which is not closely related to the host contract. The entire contract is assessed and classified mandatorily as at FVTPL since
it contained a host that is an asset within the scope of IFRS 9.
- 17 -
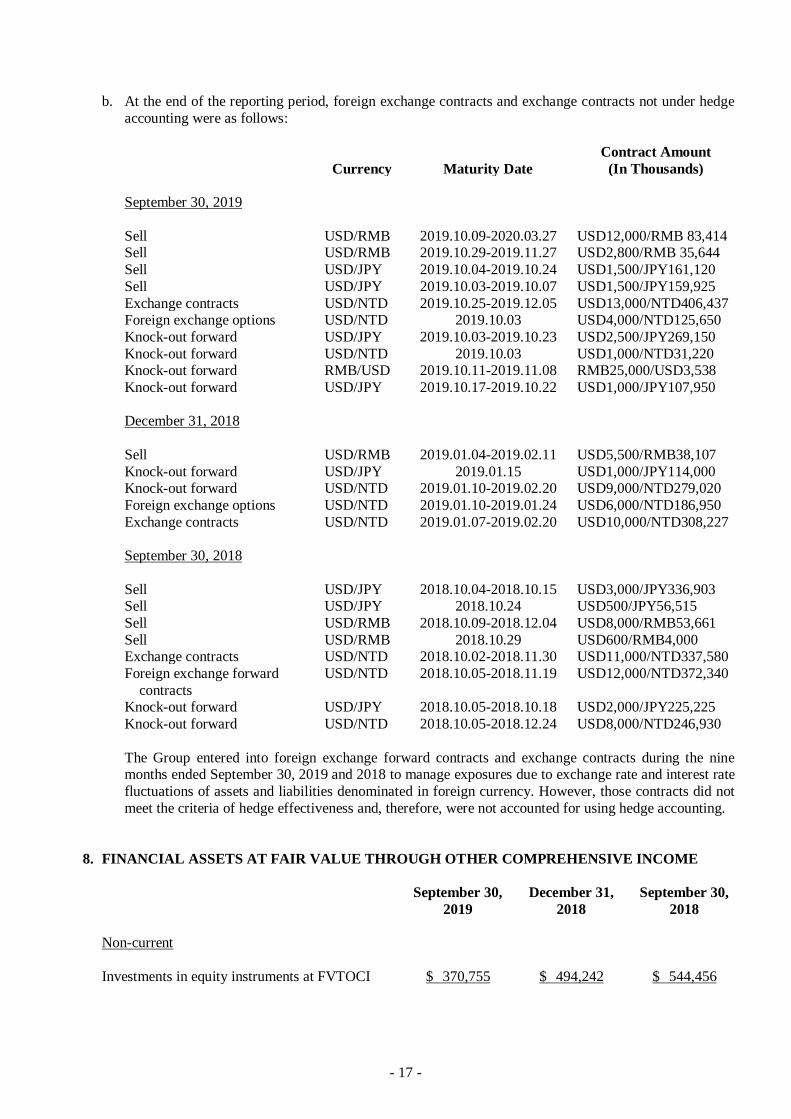
b. At the end of the reporting period, foreign exchange contracts and exchange contracts not under hedge
accounting were as follows:
Contract Amount
Currency Maturity Date (In Thousands)
September 30, 2019
Sell USD/RMB 2019.10.09-2020.03.27 USD12,000/RMB 83,414 Sell USD/RMB 2019.10.29-2019.11.27 USD2,800/RMB 35,644
Sell USD/JPY 2019.10.04-2019.10.24 USD1,500/JPY161,120
Sell USD/JPY 2019.10.03-2019.10.07 USD1,500/JPY159,925
Exchange contracts USD/NTD 2019.10.25-2019.12.05 USD13,000/NTD406,437 Foreign exchange options USD/NTD 2019.10.03 USD4,000/NTD125,650
Knock-out forward USD/JPY 2019.10.03-2019.10.23 USD2,500/JPY269,150
Knock-out forward USD/NTD 2019.10.03 USD1,000/NTD31,220 Knock-out forward RMB/USD 2019.10.11-2019.11.08 RMB25,000/USD3,538
Knock-out forward USD/JPY 2019.10.17-2019.10.22 USD1,000/JPY107,950
December 31, 2018
Sell USD/RMB 2019.01.04-2019.02.11 USD5,500/RMB38,107
Knock-out forward USD/JPY 2019.01.15 USD1,000/JPY114,000 Knock-out forward USD/NTD 2019.01.10-2019.02.20 USD9,000/NTD279,020
Foreign exchange options USD/NTD 2019.01.10-2019.01.24 USD6,000/NTD186,950
Exchange contracts USD/NTD 2019.01.07-2019.02.20 USD10,000/NTD308,227
September 30, 2018
Sell USD/JPY 2018.10.04-2018.10.15 USD3,000/JPY336,903 Sell USD/JPY 2018.10.24 USD500/JPY56,515
Sell USD/RMB 2018.10.09-2018.12.04 USD8,000/RMB53,661
Sell USD/RMB 2018.10.29 USD600/RMB4,000 Exchange contracts USD/NTD 2018.10.02-2018.11.30 USD11,000/NTD337,580
Foreign exchange forward
contracts
USD/NTD 2018.10.05-2018.11.19 USD12,000/NTD372,340
Knock-out forward USD/JPY 2018.10.05-2018.10.18 USD2,000/JPY225,225
Knock-out forward USD/NTD 2018.10.05-2018.12.24 USD8,000/NTD246,930
The Group entered into foreign exchange forward contracts and exchange contracts during the nine months ended September 30, 2019 and 2018 to manage exposures due to exchange rate and interest rate
fluctuations of assets and liabilities denominated in foreign currency. However, those contracts did not
meet the criteria of hedge effectiveness and, therefore, were not accounted for using hedge accounting.
8. FINANCIAL ASSETS AT FAIR VALUE THROUGH OTHER COMPREHENSIVE INCOME
September 30,
2019
December 31,
2018
September 30,
2018
Non-current
Investments in equity instruments at FVTOCI $ 370,755 $ 494,242 $ 544,456
- 18 -
Investments in Equity Instruments at FVTOCI
September 30,
2019
December 31,
2018
September 30,
2018
Non-current
Domestic investments
Unlisted shares and emerging market shares Win Precision Technology Company
Limited $ 14,256 $ 14,256 $ 21,498
Marson Technology Company Limited. 4,773 4,773 4,773
UPI Semiconductor Corp. 61,198 61,198 37,597 80,227 80,227 63,868
Foreign investments
Listed shares Guandong Failong Crystal Technology
Company Limited 104,044 250,698 325,282
Unlisted shares Zhejiang Bright Semiconductor Technology
Company Limited 160,152 163,317 155,306
Ninbo Dhi Jie Technology Company
Limited 26,332 - - 290,528 414,015 480,588
$ 370,755 $ 494,242 $ 544,456
These investments in equity instruments are held for medium to long-term strategic purposes. Accordingly,
the management elected to designate these investments in equity instruments as at FVTOCI as they believe
that recognizing short-term fluctuations in these investments’ fair value in profit or loss would not be consistent with the Group’s strategy of holding these investments for long-term purposes.
In the nine months ended September 30, 2019 and the year of 2018, the Group sold its shares in Guandong Failong Crystal Technology Co., Ltd. in order to manage credit concentration risk. The shares sold had a
fair value of $205,496 thousand and $22,035 thousand and its related unrealized gain of $148,225 thousand
and $15,418 thousand was transferred from other equity to retained earnings.
9. FINANCIAL ASSETS AT AMORTIZED COST
September 30,
2019
December 31,
2018
September 30,
2018
Current
Domestic investments Pledge deposits (a) $ 40,226 $ 149,233 $ -
Time deposits with original maturity of more
than 3 months (b) 330,442 - 39,200
Foreign investments Debt investments - Westpac Banking Corp. (c) - 40,355 40,448
$ 370,668 $ 189,588 $ 79,648
- 19 -
a. Refer to Note 29 for information relating to investments in financial assets at amortized cost pledged as
security.
b. The ranges of interest rates for time deposits with original maturities of more than 3 months were
approximately 0.84%- 4.38% and 0.72% per annum as of September 30, 2019 and September 30, 2018
respectively.
c. In May 23, 2018, the Group bought one-year corporate bonds issued by Westpac Banking Corporation
at value of RMB9,116 thousand with a coupon rate of 4.35%, an effective interest rate of 3.60% and was been redemptive of $41,184 thousand on March 29, 2019.
10. NOTES RECEIVABLE, TRADE RECEIVABLES AND OTHER RECEIVABLES
September 30,
2019
December 31,
2018
September 30,
2018
Notes receivable
Notes receivable - operating $ 61,358 $ 85,667 $ 86,430
Less: Allowance for impairment loss (6) (6) (6)
$ 61,352 $ 85,661 $ 86,424
Trade receivables
At amortized cost
Gross carrying amount $ 2,727,287 $ 2,653,706 $ 2,561,933
Less: Allowance for impairment loss (13,480) (13,548) (13,519)
$ 2,713,807 $ 2,640,158 $ 2,548,414
In order to minimize credit risk, the management of the Group has delegated a team responsible for determining credit limits, credit approvals and other monitoring procedures to ensure that follow-up action
is taken to recover overdue debts. In addition, the Group reviews the recoverable amount of each individual
trade debt at the end of the reporting period to ensure that adequate allowance is made for possible irrecoverable amounts. In this regard, the management believes the Group’s credit risk was significantly
reduced.
The Group applies the simplified approach to providing for expected credit losses prescribed by IFRS 9, which permits the use of lifetime expected loss provision for all trade receivables. The expected credit
losses on trade receivables are estimated using a provision matrix by reference to past default experience of
the debtor and an analysis of the debtor’s current financial position, adjusted for general economic conditions of the industry in which the debtors operate and an assessment of both the current as well as the
forecast direction of economic conditions at the reporting date. As the Group’s historical credit loss
experience does not show significantly different loss patterns for different customer segments, the provision for loss allowance based on past due status is not further distinguished according to the Group’s different
customer base.
The Group writes off a trade receivable when there is information indicating that the debtor is in severe financial difficulty and there is no realistic prospect of recovery. For trade receivables that have been
written off, the Group continues to engage in enforcement activity to attempt to recover the receivables due.
Where recoveries are made, these are recognized in profit or loss.
- 20 -
The following table details the loss allowance of trade receivables based on the Group’s provision matrix.
September 30, 2019
Not Past Due 31 to 90 Days
91 to 150
Days
151 to 180
Days
Over 180
Days Total
Gross carrying amount $ 2,770,438 $ 8,531 $ 9,676 $ - $ - $ 2,788,645 Loss allowance (Lifetime
ECL) (12,925) (77) (484) - - (13,486) Amortized cost $ 2,757,513 $ 8,454 $ 9,192 $ - $ - $ 2,775,159
December 31, 2018
Not Past Due 31 to 90 Days
91 to 150
Days
151 to 180
Days
Over 180
Days Total
Gross carrying amount $ 2,729,830 $ 9,543 $ - $ - $ - $ 2,739,373 Loss allowance (Lifetime
ECL) (13,468) (86) - - - (13,554) Amortized cost $ 2,716,362 $ 9,457 $ - $ - $ - $ 2,725,819
September 30, 2018
Not Past Due 31 to 90 Days
91 to 150
Days
151 to 180
Days
Over 180
Days Total Gross carrying amount $ 2,645,801 $ 1,909 $ 653 $ - $ - $ 2,648,363 Loss allowance (Lifetime
ECL) (13,473) (19) (33) - - (13,525) Amortized cost $ 2,632,328 $ 1,890 $ 620 $ - $ - $ 2,634,838
The expected credit loss rate for each above range of the Group is not more than 1% within and within 90 days of the overdue period; 5% or less within the overdue period from 91 to 180 days; and 5%-100% when
the overdue period exceeds 180 days.
The movements of the loss allowance of trade receivables were as follows:
September 30
2019 2018
Balance at January 1 $ 13,554 $ 14,141
Less: Impairment losses reversed - (513)
Foreign exchange gains and losses (68) (103)
Balance at September 30 $ 13,486 $ 13,525
- 21 -
11. INVENTORIES
September 30,
2019
December 31,
2018
September 30,
2018
Finished goods $ 289,076 $ 417,239 $ 334,946 Work in process 297,817 297,709 322,437
Raw materials 381,818 351,707 338,470
Supplies and spare parts 85,103 88,308 82,829 Merchandise 263,787 342,011 503,764
Land to be development construction in progress 645,825 319,922 285,987
$ 1,963,426 $ 1,816,896 $ 1,868,433
Construction in progress is the payment made by Chongqing All Sum to acquire the land use right in
Chongqing Gao-Shing District to develop and sell real estate in 2012. Chongqing All Sum has acquired real estate certificate issued by Chongqing Association of land and real estate resources during 2013.
The cost of inventories recognized as cost of goods sold for the three and the nine months ended September 30, 2019 and 2018 included $1,831,141 thousand, $1,754,640 thousand, $4,603,926 thousand and
$4,656,562 thousand, respectively. The cost of goods sold for the nine months ended September 30, 2018
included inventory write-downs of $6,288 thousand.
The details of Construction in progress were as follows:
September 30, 2019
Area Prepaid Land
Rights Project Cost Total
Jinfeng Group C Division $ 196,871 $ 448,954 $ 645,825
December 31, 2018
Area Prepaid Land
Rights Project Cost Total
Jinfeng Group C Division $ 199,285 $ 120,637 $ 319,922
September 30, 2018
Area Prepaid Land
Rights Project Cost Total
Jinfeng Group C Division $ 197,593 $ 88,394 $ 285,987
- 22 -
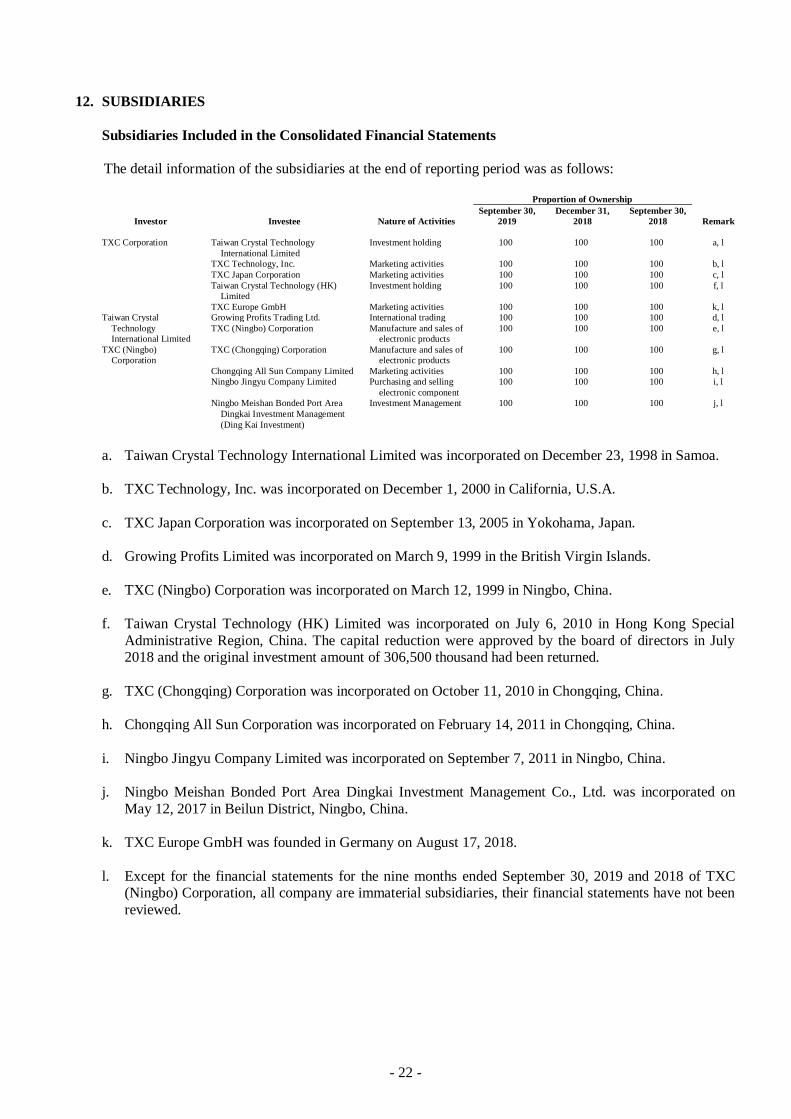
12. SUBSIDIARIES
Subsidiaries Included in the Consolidated Financial Statements
The detail information of the subsidiaries at the end of reporting period was as follows:
Proportion of Ownership
Investor Investee Nature of Activities
September 30,
2019 December 31,
2018 September 30,
2018 Remark
TXC Corporation Taiwan Crystal Technology
International Limited
Investment holding 100 100 100 a, l
TXC Technology, Inc. Marketing activities 100 100 100 b, l
TXC Japan Corporation Marketing activities 100 100 100 c, l
Taiwan Crystal Technology (HK)
Limited
Investment holding 100 100 100 f, l
TXC Europe GmbH Marketing activities 100 100 100 k, l
Taiwan Crystal Growing Profits Trading Ltd. International trading 100 100 100 d, l
Technology
International Limited
TXC (Ningbo) Corporation Manufacture and sales of
electronic products
100 100 100 e, l
TXC (Ningbo)
Corporation
TXC (Chongqing) Corporation Manufacture and sales of
electronic products
100 100 100 g, l
Chongqing All Sun Company Limited Marketing activities 100 100 100 h, l
Ningbo Jingyu Company Limited Purchasing and selling
electronic component
100 100 100 i, l
Ningbo Meishan Bonded Port Area
Dingkai Investment Management
(Ding Kai Investment)
Investment Management 100 100 100 j, l
a. Taiwan Crystal Technology International Limited was incorporated on December 23, 1998 in Samoa.
b. TXC Technology, Inc. was incorporated on December 1, 2000 in California, U.S.A.
c. TXC Japan Corporation was incorporated on September 13, 2005 in Yokohama, Japan.
d. Growing Profits Limited was incorporated on March 9, 1999 in the British Virgin Islands.
e. TXC (Ningbo) Corporation was incorporated on March 12, 1999 in Ningbo, China.
f. Taiwan Crystal Technology (HK) Limited was incorporated on July 6, 2010 in Hong Kong Special
Administrative Region, China. The capital reduction were approved by the board of directors in July 2018 and the original investment amount of 306,500 thousand had been returned.
g. TXC (Chongqing) Corporation was incorporated on October 11, 2010 in Chongqing, China.
h. Chongqing All Sun Corporation was incorporated on February 14, 2011 in Chongqing, China.
i. Ningbo Jingyu Company Limited was incorporated on September 7, 2011 in Ningbo, China.
j. Ningbo Meishan Bonded Port Area Dingkai Investment Management Co., Ltd. was incorporated on
May 12, 2017 in Beilun District, Ningbo, China.
k. TXC Europe GmbH was founded in Germany on August 17, 2018.
l. Except for the financial statements for the nine months ended September 30, 2019 and 2018 of TXC (Ningbo) Corporation, all company are immaterial subsidiaries, their financial statements have not been
reviewed.
- 23 -
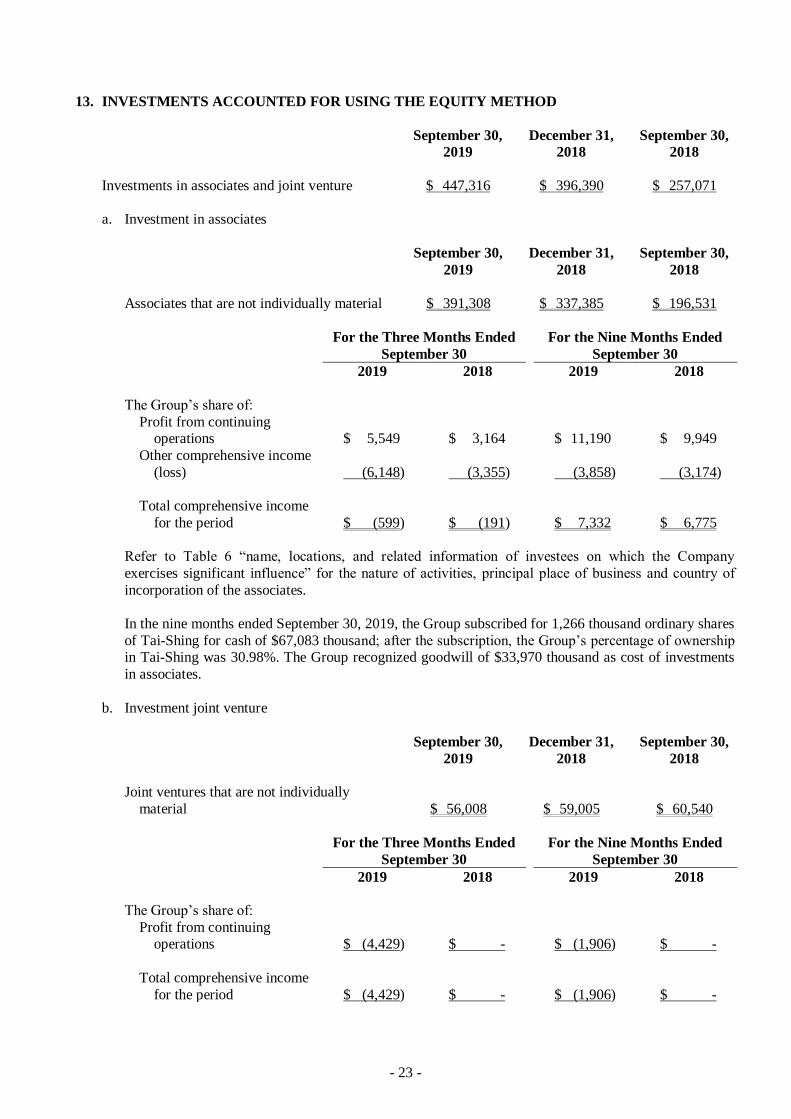
13. INVESTMENTS ACCOUNTED FOR USING THE EQUITY METHOD
September 30,
2019
December 31,
2018
September 30,
2018
Investments in associates and joint venture $ 447,316 $ 396,390 $ 257,071
a. Investment in associates
September 30,
2019
December 31,
2018
September 30,
2018
Associates that are not individually material $ 391,308 $ 337,385 $ 196,531
For the Three Months Ended
September 30
For the Nine Months Ended
September 30
2019 2018 2019 2018
The Group’s share of:
Profit from continuing operations $ 5,549 $ 3,164 $ 11,190 $ 9,949
Other comprehensive income
(loss) (6,148) (3,355) (3,858) (3,174)
Total comprehensive income
for the period $ (599) $ (191) $ 7,332 $ 6,775
Refer to Table 6 “name, locations, and related information of investees on which the Company
exercises significant influence” for the nature of activities, principal place of business and country of
incorporation of the associates.
In the nine months ended September 30, 2019, the Group subscribed for 1,266 thousand ordinary shares
of Tai-Shing for cash of $67,083 thousand; after the subscription, the Group’s percentage of ownership in Tai-Shing was 30.98%. The Group recognized goodwill of $33,970 thousand as cost of investments
in associates.
b. Investment joint venture
September 30,
2019
December 31,
2018
September 30,
2018
Joint ventures that are not individually
material $ 56,008 $ 59,005 $ 60,540
For the Three Months Ended
September 30
For the Nine Months Ended
September 30
2019 2018 2019 2018
The Group’s share of:
Profit from continuing operations $ (4,429) $ - $ (1,906) $ -
Total comprehensive income
for the period $ (4,429) $ - $ (1,906) $ -
- 24 -
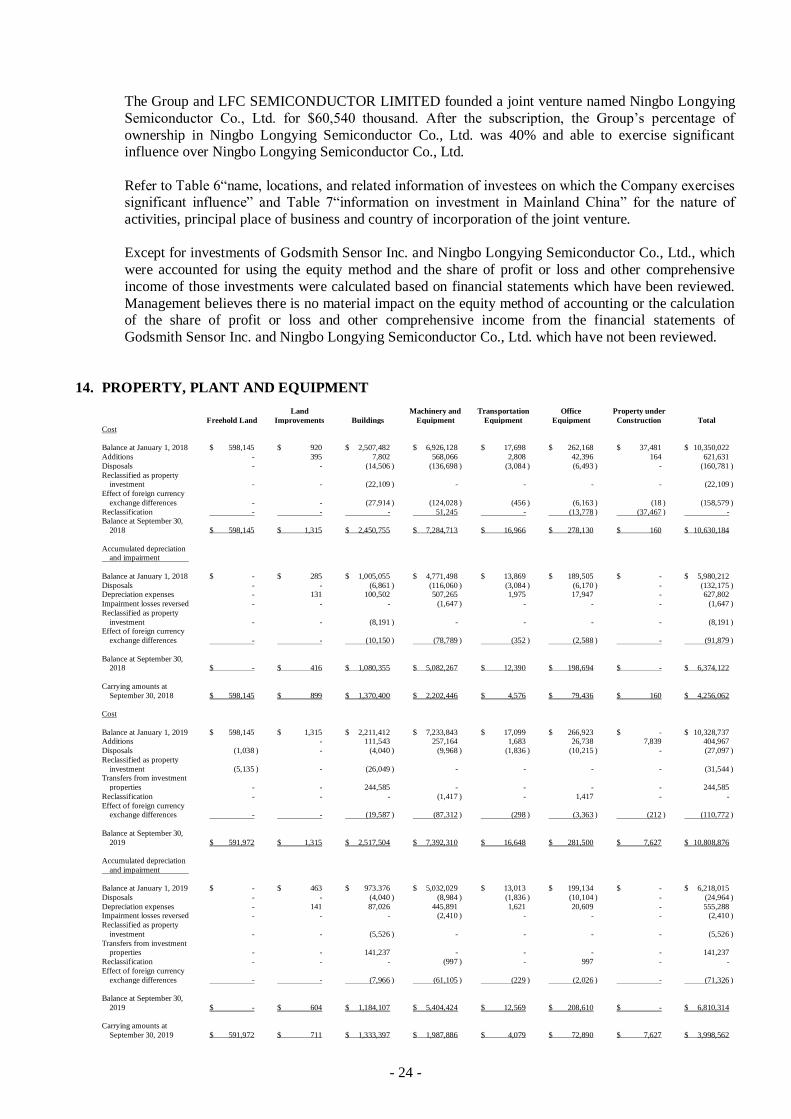
The Group and LFC SEMICONDUCTOR LIMITED founded a joint venture named Ningbo Longying
Semiconductor Co., Ltd. for $60,540 thousand. After the subscription, the Group’s percentage of
ownership in Ningbo Longying Semiconductor Co., Ltd. was 40% and able to exercise significant influence over Ningbo Longying Semiconductor Co., Ltd.
Refer to Table 6“name, locations, and related information of investees on which the Company exercises significant influence” and Table 7“information on investment in Mainland China” for the nature of
activities, principal place of business and country of incorporation of the joint venture.
Except for investments of Godsmith Sensor Inc. and Ningbo Longying Semiconductor Co., Ltd., which
were accounted for using the equity method and the share of profit or loss and other comprehensive
income of those investments were calculated based on financial statements which have been reviewed.
Management believes there is no material impact on the equity method of accounting or the calculation of the share of profit or loss and other comprehensive income from the financial statements of
Godsmith Sensor Inc. and Ningbo Longying Semiconductor Co., Ltd. which have not been reviewed.
14. PROPERTY, PLANT AND EQUIPMENT
Freehold Land
Land
Improvements Buildings
Machinery and
Equipment
Transportation
Equipment
Office
Equipment
Property under
Construction Total
Cost
Balance at January 1, 2018 $ 598,145 $ 920 $ 2,507,482 $ 6,926,128 $ 17,698 $ 262,168 $ 37,481 $ 10,350,022
Additions - 395 7,802 568,066 2,808 42,396 164 621,631
Disposals - - (14,506 ) (136,698 ) (3,084 ) (6,493 ) - (160,781 )
Reclassified as property investment - - (22,109 ) - - - - (22,109 )
Effect of foreign currency
exchange differences - - (27,914 ) (124,028 ) (456 ) (6,163 ) (18 ) (158,579 )
Reclassification - - - 51,245 - (13,778 ) (37,467 ) - Balance at September 30,
2018 $ 598,145 $ 1,315 $ 2,450,755 $ 7,284,713 $ 16,966 $ 278,130 $ 160 $ 10,630,184
Accumulated depreciation and impairment
Balance at January 1, 2018 $ - $ 285 $ 1,005,055 $ 4,771,498 $ 13,869 $ 189,505 $ - $ 5,980,212
Disposals - - (6,861 ) (116,060 ) (3,084 ) (6,170 ) - (132,175 ) Depreciation expenses - 131 100,502 507,265 1,975 17,947 - 627,802
Impairment losses reversed - - - (1,647 ) - - - (1,647 )
Reclassified as property
investment - - (8,191 ) - - - - (8,191 ) Effect of foreign currency
exchange differences - - (10,150 ) (78,789 ) (352 ) (2,588 ) - (91,879 )
Balance at September 30, 2018 $ - $ 416 $ 1,080,355 $ 5,082,267 $ 12,390 $ 198,694 $ - $ 6,374,122
Carrying amounts at
September 30, 2018 $ 598,145 $ 899 $ 1,370,400 $ 2,202,446 $ 4,576 $ 79,436 $ 160 $ 4,256,062
Cost
Balance at January 1, 2019 $ 598,145 $ 1,315 $ 2,211,412 $ 7,233,843 $ 17,099 $ 266,923 $ - $ 10,328,737 Additions - 111,543 257,164 1,683 26,738 7,839 404,967
Disposals (1,038 ) - (1,038 ) (4,040 ) (9,968 ) (1,836 ) (10,215 ) - (27,097 )
Reclassified as property
investment (5,135 ) - (26,049 ) - - - - (31,544 ) Transfers from investment
properties - - 244,585 - - - - 244,585
Reclassification - - - (1,417 ) - 1,417 - -
Effect of foreign currency exchange differences - - (19,587 ) (87,312 ) (298 ) (3,363 ) (212 ) (110,772 )
Balance at September 30,
2019 $ 591,972 $ 1,315 $ 2,517,504 $ 7,392,310 $ 16,648 $ 281,500 $ 7,627 $ 10,808,876
Accumulated depreciation
and impairment
Balance at January 1, 2019 $ - $ 463 $ 973.376 $ 5,032,029 $ 13,013 $ 199,134 $ - $ 6,218,015
Disposals - - (4,040 ) (8,984 ) (1,836 ) (10,104 ) - (24,964 )
Depreciation expenses - 141 87,026 445,891 1,621 20,609 - 555,288 Impairment losses reversed - - - (2,410 ) - - - (2,410 )
Reclassified as property
investment - - (5,526 ) - - - - (5,526 )
Transfers from investment properties - - 141,237 - - - - 141,237
Reclassification - - - (997 ) - 997 - -
Effect of foreign currency
exchange differences - - (7,966 ) (61,105 ) (229 ) (2,026 ) - (71,326 )
Balance at September 30,
2019 $ - $ 604 $ 1,184,107 $ 5,404,424 $ 12,569 $ 208,610 $ - $ 6,810,314
Carrying amounts at
September 30, 2019 $ 591,972 $ 711 $ 1,333,397 $ 1,987,886 $ 4,079 $ 72,890 $ 7,627 $ 3,998,562
- 25 -
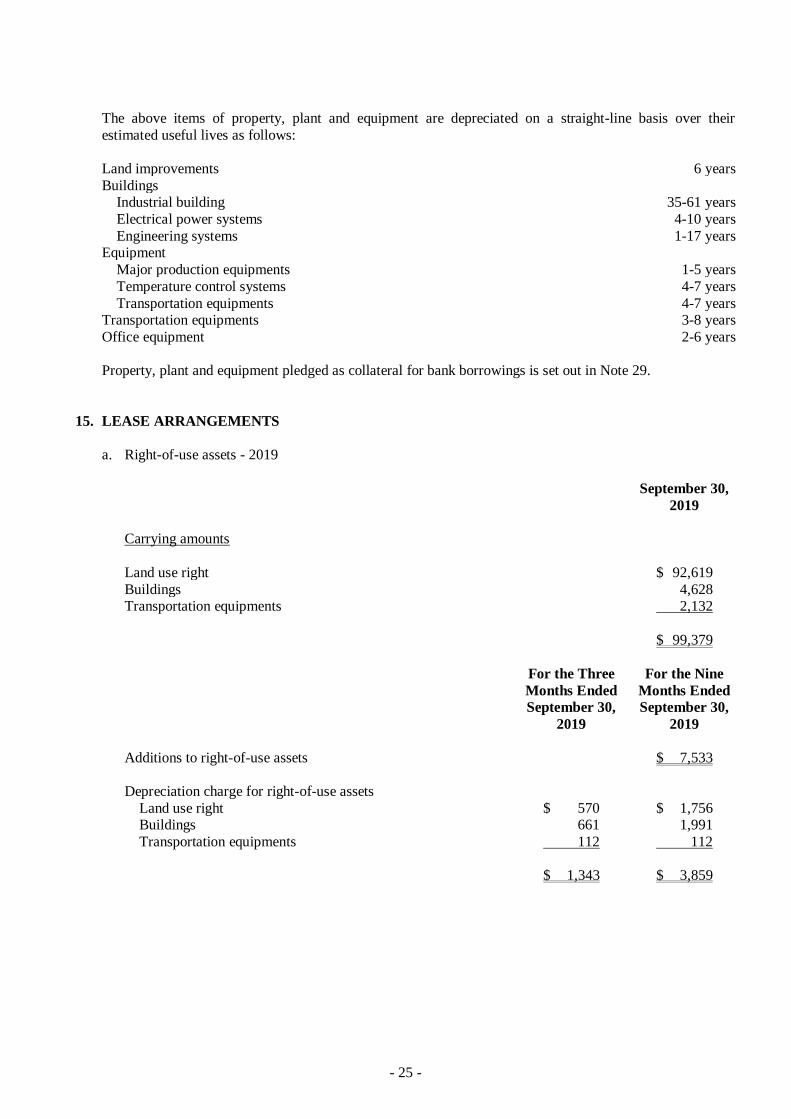
The above items of property, plant and equipment are depreciated on a straight-line basis over their
estimated useful lives as follows:
Land improvements 6 years
Buildings Industrial building 35-61 years
Electrical power systems 4-10 years
Engineering systems 1-17 years Equipment
Major production equipments 1-5 years
Temperature control systems 4-7 years
Transportation equipments 4-7 years Transportation equipments 3-8 years
Office equipment 2-6 years
Property, plant and equipment pledged as collateral for bank borrowings is set out in Note 29.
15. LEASE ARRANGEMENTS
a. Right-of-use assets - 2019
September 30,
2019
Carrying amounts
Land use right $ 92,619
Buildings 4,628 Transportation equipments 2,132
$ 99,379
For the Three
Months Ended
September 30,
2019
For the Nine
Months Ended
September 30,
2019
Additions to right-of-use assets $ 7,533
Depreciation charge for right-of-use assets
Land use right $ 570 $ 1,756 Buildings 661 1,991
Transportation equipments 112 112
$ 1,343 $ 3,859
- 26 -
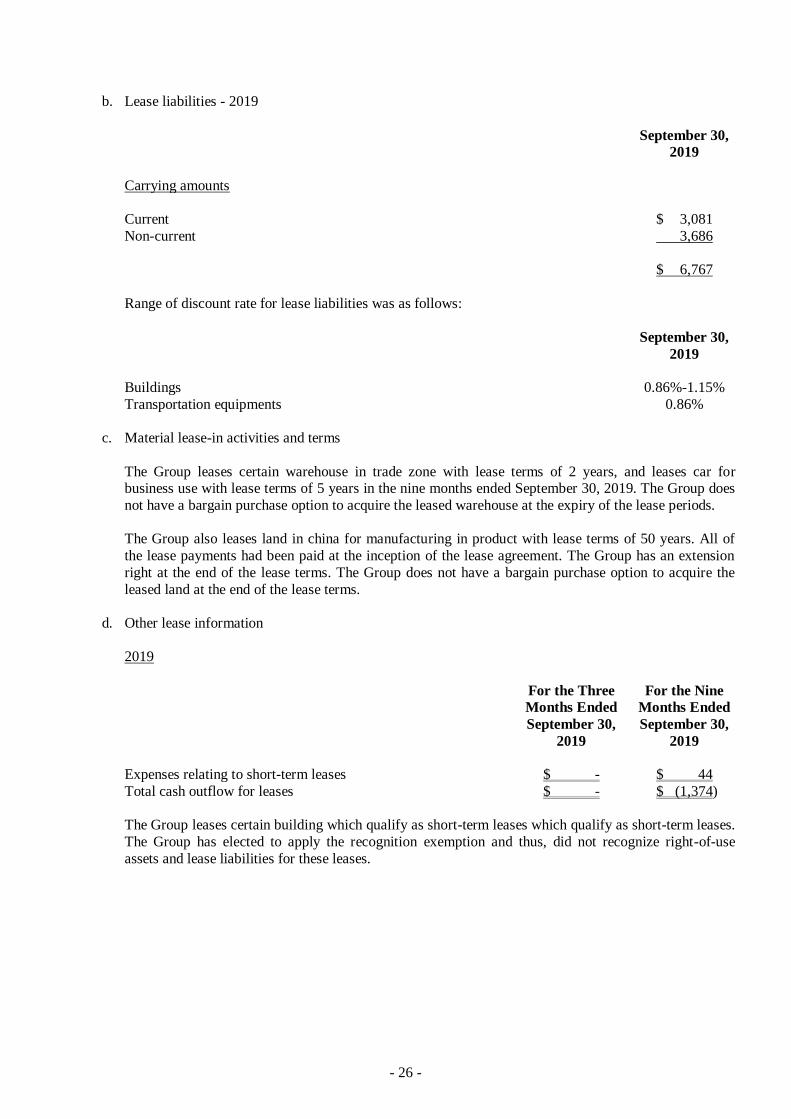
b. Lease liabilities - 2019
September 30,
2019
Carrying amounts
Current $ 3,081
Non-current 3,686
$ 6,767
Range of discount rate for lease liabilities was as follows:
September 30,
2019
Buildings 0.86%-1.15%
Transportation equipments 0.86%
c. Material lease-in activities and terms
The Group leases certain warehouse in trade zone with lease terms of 2 years, and leases car for business use with lease terms of 5 years in the nine months ended September 30, 2019. The Group does
not have a bargain purchase option to acquire the leased warehouse at the expiry of the lease periods.
The Group also leases land in china for manufacturing in product with lease terms of 50 years. All of
the lease payments had been paid at the inception of the lease agreement. The Group has an extension
right at the end of the lease terms. The Group does not have a bargain purchase option to acquire the
leased land at the end of the lease terms.
d. Other lease information
2019
For the Three
Months Ended
September 30,
2019
For the Nine
Months Ended
September 30,
2019
Expenses relating to short-term leases $ - $ 44
Total cash outflow for leases $ - $ (1,374)
The Group leases certain building which qualify as short-term leases which qualify as short-term leases.
The Group has elected to apply the recognition exemption and thus, did not recognize right-of-use
assets and lease liabilities for these leases.
- 27 -
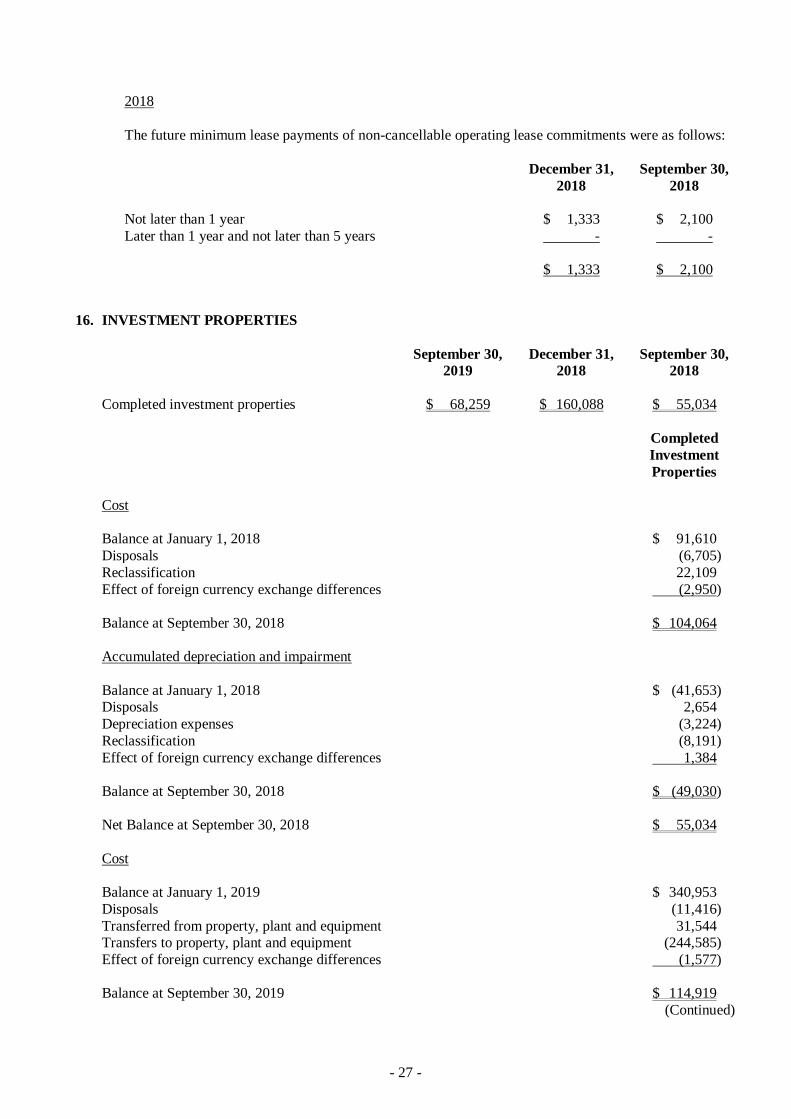
2018
The future minimum lease payments of non-cancellable operating lease commitments were as follows:
December 31,
2018
September 30,
2018
Not later than 1 year $ 1,333 $ 2,100
Later than 1 year and not later than 5 years - -
$ 1,333 $ 2,100
16. INVESTMENT PROPERTIES
September 30,
2019
December 31,
2018
September 30,
2018
Completed investment properties $ 68,259 $ 160,088 $ 55,034
Completed
Investment
Properties
Cost
Balance at January 1, 2018 $ 91,610
Disposals (6,705)
Reclassification 22,109
Effect of foreign currency exchange differences (2,950)
Balance at September 30, 2018 $ 104,064
Accumulated depreciation and impairment
Balance at January 1, 2018 $ (41,653) Disposals 2,654
Depreciation expenses (3,224)
Reclassification (8,191)
Effect of foreign currency exchange differences 1,384
Balance at September 30, 2018 $ (49,030)
Net Balance at September 30, 2018 $ 55,034
Cost
Balance at January 1, 2019 $ 340,953
Disposals (11,416)
Transferred from property, plant and equipment 31,544 Transfers to property, plant and equipment (244,585)
Effect of foreign currency exchange differences (1,577)
Balance at September 30, 2019 $ 114,919
(Continued)
- 28 -
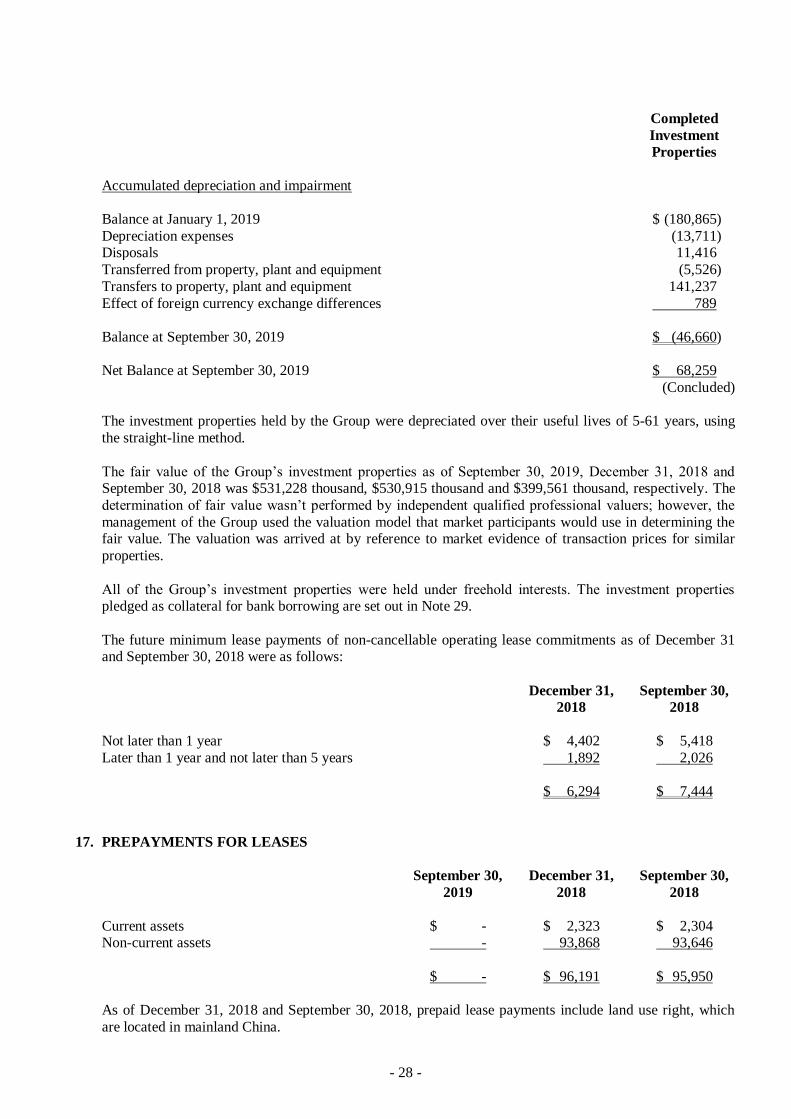
Completed
Investment
Properties
Accumulated depreciation and impairment
Balance at January 1, 2019 $ (180,865)
Depreciation expenses (13,711) Disposals 11,416
Transferred from property, plant and equipment (5,526)
Transfers to property, plant and equipment 141,237
Effect of foreign currency exchange differences 789
Balance at September 30, 2019 $ (46,660)
Net Balance at September 30, 2019 $ 68,259
(Concluded)
The investment properties held by the Group were depreciated over their useful lives of 5-61 years, using
the straight-line method.
The fair value of the Group’s investment properties as of September 30, 2019, December 31, 2018 and September 30, 2018 was $531,228 thousand, $530,915 thousand and $399,561 thousand, respectively. The
determination of fair value wasn’t performed by independent qualified professional valuers; however, the
management of the Group used the valuation model that market participants would use in determining the fair value. The valuation was arrived at by reference to market evidence of transaction prices for similar
properties.
All of the Group’s investment properties were held under freehold interests. The investment properties pledged as collateral for bank borrowing are set out in Note 29.
The future minimum lease payments of non-cancellable operating lease commitments as of December 31 and September 30, 2018 were as follows:
December 31,
2018
September 30,
2018
Not later than 1 year $ 4,402 $ 5,418
Later than 1 year and not later than 5 years 1,892 2,026
$ 6,294 $ 7,444
17. PREPAYMENTS FOR LEASES
September 30,
2019
December 31,
2018
September 30,
2018
Current assets $ - $ 2,323 $ 2,304 Non-current assets - 93,868 93,646
$ - $ 96,191 $ 95,950
As of December 31, 2018 and September 30, 2018, prepaid lease payments include land use right, which
are located in mainland China.
- 29 -
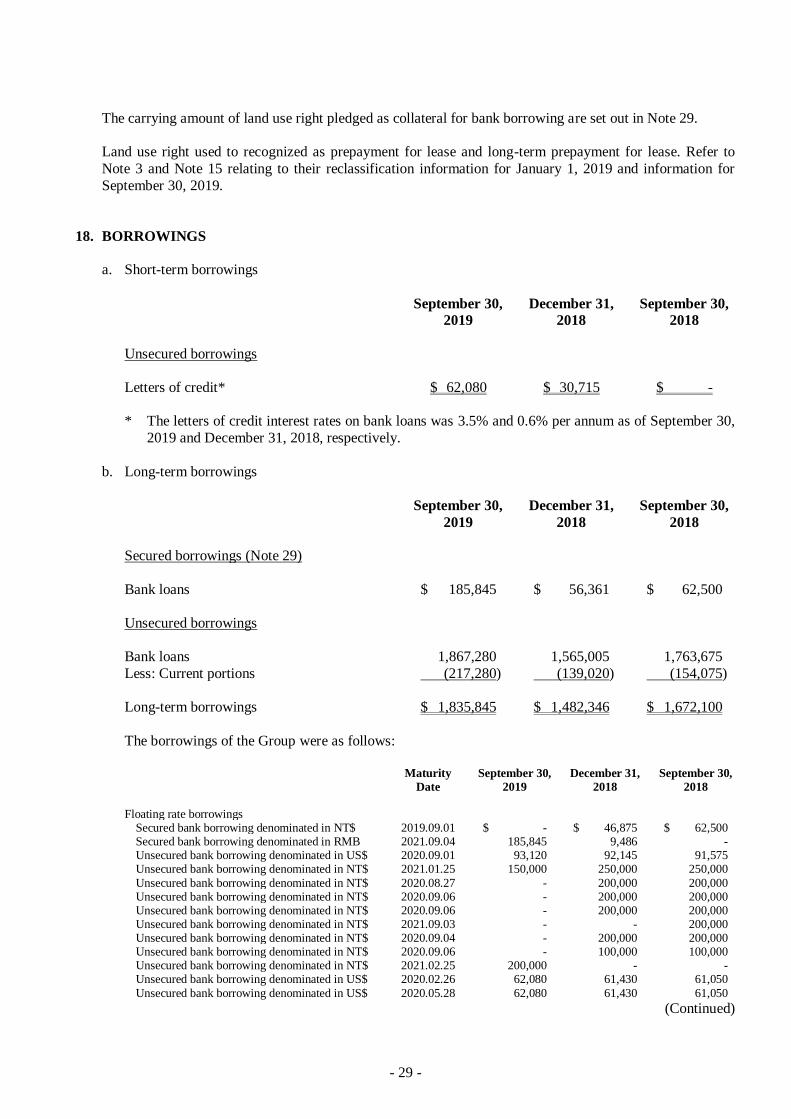
The carrying amount of land use right pledged as collateral for bank borrowing are set out in Note 29.
Land use right used to recognized as prepayment for lease and long-term prepayment for lease. Refer to
Note 3 and Note 15 relating to their reclassification information for January 1, 2019 and information for
September 30, 2019.
18. BORROWINGS
a. Short-term borrowings
September 30,
2019
December 31,
2018
September 30,
2018
Unsecured borrowings
Letters of credit* $ 62,080 $ 30,715 $ -
* The letters of credit interest rates on bank loans was 3.5% and 0.6% per annum as of September 30,
2019 and December 31, 2018, respectively.
b. Long-term borrowings
September 30,
2019
December 31,
2018
September 30,
2018
Secured borrowings (Note 29)
Bank loans $ 185,845 $ 56,361 $ 62,500
Unsecured borrowings
Bank loans 1,867,280 1,565,005 1,763,675
Less: Current portions (217,280) (139,020) (154,075)
Long-term borrowings $ 1,835,845 $ 1,482,346 $ 1,672,100
The borrowings of the Group were as follows:
Maturity
Date
September 30,
2019
December 31,
2018
September 30,
2018
Floating rate borrowings
Secured bank borrowing denominated in NT$ 2019.09.01 $ - $ 46,875 $ 62,500 Secured bank borrowing denominated in RMB 2021.09.04 185,845 9,486 - Unsecured bank borrowing denominated in US$ 2020.09.01 93,120 92,145 91,575 Unsecured bank borrowing denominated in NT$ 2021.01.25 150,000 250,000 250,000
Unsecured bank borrowing denominated in NT$ 2020.08.27 - 200,000 200,000 Unsecured bank borrowing denominated in NT$ 2020.09.06 - 200,000 200,000 Unsecured bank borrowing denominated in NT$ 2020.09.06 - 200,000 200,000 Unsecured bank borrowing denominated in NT$ 2021.09.03 - - 200,000 Unsecured bank borrowing denominated in NT$ 2020.09.04 - 200,000 200,000 Unsecured bank borrowing denominated in NT$ 2020.09.06 - 100,000 100,000 Unsecured bank borrowing denominated in NT$ 2021.02.25 200,000 - - Unsecured bank borrowing denominated in US$ 2020.02.26 62,080 61,430 61,050
Unsecured bank borrowing denominated in US$ 2020.05.28 62,080 61,430 61,050
(Continued)
- 30 -
Maturity
Date
September 30,
2019
December 31,
2018
September 30,
2018
Unsecured bank borrowing denominated in NT$ 2019.09.05 $ - $ 200,000 $ 200,000
Unsecured bank borrowing denominated in NT$ 2024.09.18 300,000 - - Unsecured bank borrowing denominated in NT$ 2021.08.12 200,000 - - Unsecured bank borrowing denominated in NT$ 2021.09.02 100,000 - - Secured bank borrowing denominated in NT$ 2024.09.02 100,000 - - Unsecured bank borrowing denominated in NT$ 2021.09.02 200,000 - - Unsecured bank borrowing denominated in NT$ 2022.09.05 200,000 - - Unsecured bank borrowing denominated in NT$ 2021.08.19 200,000 - -
Less: Current portions (217,280) (139,020) (154,075) $ 1,835,845 $ 1,482,346 $ 1,672,100
(Concluded)
The weighted average effective interest rate of the bank borrowings at September 30, 2019, December
31, 2018 and September 30, 2018 was 0.4%-6.18% per annum, 0.86%-6.18% per annum and 0.85%-3.77% per annum, respectively.
19. OTHER LIABILITIES
September 30,
2019
December 31,
2018
September 30,
2018
Current
Other payables
Payables for bonuses to employees and
directors $ 57,885 $ 85,014 $ 74,512
Payables for commissions 24,638 24,640 24,286 Payables for salaries 99,402 98,292 99,356
Payables for bonuses 167,725 190,419 150,824
Payables for annual leave 28,008 28,199 29,196 Payables for purchases of equipment 104,225 32,022 40,967
Others 133,306 105,090 103,598
$ 615,189 $ 563,676 $ 522,739
20. RETIREMENT BENEFIT PLANS
a. Defined contribution plans
The Group adopted a pension plan under the Labor Pension Act (the “LPA”), which is a state-managed
defined contribution plan. Under the LPA, an entity makes monthly contributions to employees’
individual pension accounts at 6% of monthly salaries and wages.
The employees of the Group’s subsidiaries in TXC (Ningbo) Corporation and TXC (Chongqing)
Corporation are members of a state-managed retirement benefit plan operated by the government of
China. The subsidiaries are required to contribute a specified percentage of payroll costs to the retirement benefit scheme to fund the benefits. The only obligation of the Group with respect to the
retirement benefit plan is to make the specified contributions.
- 31 -
b. Defined benefit plans
Employee benefit expense for the three and the nine months ended September 30, 2019 and 2018 were $647 thousand, $659 thousand, $1,940 thousand and $1,978 thousand, respectively. Employee benefit
expense was calculated on the basis of the actuarial valuations in December 31, 2018 and 2017.
21. EQUITY
a. Share capital
Ordinary shares
September 30,
2019
December 31,
2018
September 30,
2018
Number of shares authorized (in thousands) 500,000 500,000 500,000
Shares authorized $ 5,000,000 $ 5,000,000 $ 5,000,000
Number of shares issued and fully paid (in thousands) 309,757 309,757 309,757
Shares issued $ 3,097,570 $ 3,097,570 $ 3,097,570
Fully paid ordinary shares, which have a par value of $10, carry one vote per share and carry a right to dividends.
30,000 thousand shares of the Company’s shares authorized were reserved for the issuance of convertible bonds and employee share options.
b. Capital surplus
September 30,
2019
December 31,
2018
September 30,
2018
May be used to offset a deficit, distributed as
cash dividends, or transferred to share
capital
Issuance of ordinary shares $ 611,776 $ 611,776 $ 611,776
Conversion of bonds 977,028 977,028 977,028
Overdue options 73,377 73,377 73,377 The difference between consideration
received or paid and the carrying amount of
the subsidiaries’ net assets during actual disposal or acquisition 331 331 331
Donated assets received 1,387 - -
May only be used to offset a deficit
Share of changes in capital surplus of
associates or joint venture 2,561 2,604 2,712
$ 1,666,460 $ 1,665,116 $ 1,665,224
Such capital surplus may be used to offset a deficit; in addition, when the Company has no deficit, such
capital surplus may be distributed as cash dividends or transferred to share capital (limited to a certain
percentage of the Company’s capital surplus and once a year).
- 32 -
c. Retained earnings and dividend policy
Under the dividend policy as set forth in the Articles, where the Company made a profit in a fiscal year,
the profit shall be first utilized for paying taxes, offsetting losses of previous years, setting aside as legal
reserve 10% of the remaining profit, setting aside or reversing a special reserve in accordance with the laws and regulations, and then any remaining profit together with any undistributed retained earnings
shall be used by the Company’s board of directors as the basis for proposing a distribution plan, which
should be resolved in the shareholders’ meeting for distribution of dividends and bonuses to shareholders. For the policies on the distribution of employees’ compensation and remuneration of
directors after the amendment, refer to Employees’ compensation and remuneration of directors in Note
23-f.
In the perspective of the long term financial plan and cash inflows for fulfilling demand of shareholders,
After setting aside as legal reserve 10% of the remaining profit, setting aside or reversing a special
reserve in accordance with the laws and regulations, The Company’s Articles stipulate a dividends policy whereby the issuance of share dividends takes precedence over the payment of cash dividends. In
principle, cash dividends are limited to 20% of the total dividends distributed.
Appropriation of earnings to the legal reserve shall be made until the legal reserve equals the
Company’s paid-in capital. The legal reserve may be used to offset deficits. If the Company has no
deficit and the legal reserve has exceeded 25% of the Company’s paid-in capital, the excess may be
transferred to capital or distributed in cash.
Items referred to under Rule No. 1010012865, Rule No. 1010047490 and Rule No. 1030006415 issued
by the FSC and the directive titled “Questions and Answers for Special Reserves Appropriated Following Adoption of IFRSs” should be appropriated to or reversed from a special reserve by the
Company.
The appropriations of earnings for 2018 and 2017 were approved in the shareholders’ meetings on June 12, 2019 and June 5, 2018, respectively, were as follows:
Appropriation of Earnings Dividends Per Share (NT$)
For the Year Ended December 31 For the Year Ended December 31
2018 2017 2018 2017
Legal reserve $ 64,435 $ 96,265 $ - $ - Cash dividends 619,514 774,393 2 2.5
Special reserve 32,114 - - -
d. Others equity items
1) Exchange differences on translating the financial statements of foreign operations
For the Nine Months Ended
September 30
2019 2018
Balance at January 1 $ (359,923) $ (264,137)
Exchange differences on translating the financial statements
of foreign operations (99,270) (137,861) Share from associates accounted for using the equity method (3,836) (3,027)
Balance at September 30 $ (463,029) $ (405,025)
- 33 -
2) Unrealized gain (loss) on financial assets at FVTOCI
For the Nine Months Ended
September 30
2019 2018
Balance at January 1 $ 105,017 $ 283,139
Effect of change in tax rate - (13,626)
Recognized during the period
Unrealized loss - equity instruments 47,075 (115,322) Share from associates accounted for using the equity
method 65 25
Other comprehensive income recognized in the period 47,140 (128,923) Cumulative unrealized gain/(loss) of equity (148,225) (15,418)
Balance at September 30 $ 3,932 $ 138,798
22. REVENUE
For the Three Months Ended
September 30
For the Nine Months Ended
September 30
2019 2018 2019 2018
Revenue from contracts with
customers
Revenue from sale of goods $ 2,428,248 $ 2,267,348 $ 5,996,489 $ 5,998,602
Contract Balances
For the Nine Months Ended
September 30
2019 2018
Trade receivables (Note 10) $ 2,713,807 $ 2,548,414
Contract liabilities Sale of goods $ 8,402 $ 28,749
Contract liabilities - current $ 8,402 $ 28,749
The contract liabilities were unearned sales revenue and accounted for other current liabilities.
- 34 -
23. NET PROFIT (LOSS) AND OTHER COMPREHENSIVE INCOME (LOSS) FROM CONTINUING
OPERATIONS
Net profit (loss) from continuing operations:
a. Other income
For the Three Months Ended
September 30
For the Nine Months Ended
September 30
2019 2018 2019 2018
Interest income $ 7,269 $ 6,344 $ 19,706 $ 16,840
Income from government grants 24,626 27,648 46,525 38,434
Dividends 2,385 1,527 2,385 1,527
Others 9,007 28,964 29,388 59,871
$ 43,287 $ 64,483 $ 98,004 $ 116,672
b. Other gains and losses
For the Three Months Ended
September 30
For the Nine Months Ended
September 30
2019 2018 2019 2018
(Losses) gain on disposal of
property, plant and equipment $ (187) $ (1,275) $ 10 $ 3,454
Gain on disposal of investment
property - - - 1,092 Gain on disposal of non-current
assets classified as held for
sale - - - 3,152
Fair value changes of financial assets and financial liabilities
Financial assets mandatorily
at FVTPL (3,304) 23,713 3,354 12,513 Net foreign exchange gains 8,950 30,637 22,934 7,961
Property, plant and equipment
impairment (losses) reversed (31) (9) 2,410 1,647 Depreciation expenses -
investment properties (850) (1,182) (13,711) (3,224)
Other expenses (1,055) (2,663) (5,943) (6,762)
$ 3,523 $ 49,221 $ 9,054 $ 19,833
c. Finance costs
For the Three Months Ended
September 30
For the Nine Months Ended
September 30
2019 2018 2019 2018
Interest on bank loans $ (5,921) $ (4,843) $ (17,701) $ (14,620)
Interest on lease liabilities (15) - (18) -
$ (5,936) $ (4,843) $ (17,719) $ (14,620)
- 35 -
d. Depreciation and amortization
For the Three Months Ended
September 30
For the Nine Months Ended
September 30
2019 2018 2019 2018
Property, plant and equipment $ 188,918 $ 237,090 $ 555,288 $ 627,802
Investment properties 850 1,182 13,711 3,224
Right-of-use assets 1,343 - 3,859 - Intangible assets 640 198 1,946 1,404
$ 191,751 $ 238,470 $ 574,804 $ 632,430
An analysis of deprecation by
function Operating costs $ 152,724 $ 209,702 $ 461,561 $ 541,318
Operating expenses 37,537 27,388 97,586 86,484
Other expenses 850 1,182 13,711 3,224
$ 191,111 $ 238,272 $ 572,858 $ 631,026
An analysis of amortization by function
Operating expenses $ 640 $ 198 $ 1,946 $ 1,404
e. Employee benefits expense
For the Three Months Ended
September 30
For the Nine Months Ended
September 30
2019 2018 2019 2018
Post-employment benefits (see
Note 20) Defined contribution plans $ 15,741 $ 18,132 $ 48,729 $ 53,764
Defined benefit plans 647 659 1,940 1,978
16,388 18,791 50,669 55,742 Other employee benefits
Payroll expense 392,365 381,225 1,069,544 1,066,574
Labor and health insurance 21,875 23,074 67,523 69,324 Others 14,903 14,168 44,865 41,078
429,143 418,467 1,181,932 1,176,976
$ 445,531 $ 437,258 $ 1,232,601 $ 1,232,718
An analysis of employee
benefits expense by function Operating costs $ 261,040 $ 258,504 $ 735,127 $ 746,574
Operating expenses 184,491 178,754 497,474 486,144
$ 445,531 $ 437,258 $ 1,232,601 $ 1,232,718
- 36 -
f. Employees’ compensation and remuneration of directors
According to the Articles of Incorporation of the Company, the Company accrued employees’ compensation and remuneration of directors at rates of no less than 3% and no higher than 2%,
respectively, of net profit before income tax, employees’ compensation, and remuneration of directors.
The employees’ compensation and the remuneration of directors for the three and the nine months ended September 30, 2019 and 2018, respectively, were as follows:
Accrual rate
For the Three Months Ended
September 30
For the Nine Months Ended
September 30
2019 2018 2019 2018
Employees’ compensation 9.0% 9.0% 9.0% 9.0%
Remuneration of directors 1.5% 1.5% 1.5% 1.5%
Amount
For the Three Months Ended
September 30
For the Nine Months Ended
September 30
2019 2018 2019 2018
Employees’ compensation $ 24,288 $ 25,069 $ 48,199 $ 48,040
Remuneration to directors $ 4,048 $ 4,179 $ 8,033 $ 8,007
If there is a change in the amounts after the annual consolidated financial statements are authorized for issue, the differences are recorded as a change in the accounting estimate.
The appropriations of employees’ compensation and remuneration of directors for 2018 and 2017 having been resolved by the board of directors on March 22, 2019 and March 15, 2018, respectively,
were as follows:
For the Year Ended December 31
2018 2017
Cash Share Cash Share
Employees’ compensation $ 69,072 $ - $ 103,140 $ -
Remuneration of directors 11,512 - 17,190 -
There is no difference between the actual amounts of employees’ compensation and remuneration of directors paid and the amounts recognized in the consolidated financial statements for the years ended
December 31, 2018 and 2017.
Information on the employees’ compensation and remuneration of directors resolved by the Company’s
board of directors in 2019 and 2018 is available at the Market Observation Post System website of the
Taiwan Stock Exchange.
- 37 -
24. INCOME TAXES RELATING TO CONTINUING OPERATIONS
a. Income tax recognized in profit or loss
Major components of tax expense were as follows:
For the Three Months Ended
September 30
For the Nine Months Ended
September 30
2019 2018 2019 2018
Current tax
In respect of the current
period $ 27,264 $ 33,127 $ 61,159 $ 51,888 Income tax on
unappropriated earnings - - - 7,656
Adjustments for prior periods - - (2,931) (6,925) Deferred tax
Change in tax rate - - - 13,914
In respect of the current
period 1,189 (3,141) 3,384 10,829
Income tax expense recognized
in profit or loss $ 28,453 $ 29,986 $ 61,612 $ 77,362
The Income Tax Act in the ROC was amended in 2018 and the corporate income tax rate was adjusted
from 17% to 20% effective in 2018. The effect of the change in tax rate on deferred tax income/expense
to be recognized in profit or loss. In addition, the rate of the corporate surtax applicable to 2018 unappropriated earnings will be reduced from 10% to 5%.
b. Income tax recognized in other comprehensive income
For the Three Months Ended
September 30
For the Nine Months Ended
September 30
2019 2018 2019 2018
Deferred tax
In respect of the current period:
Fair value changes of
financial assets at FVTOCI $ 929 $ (8,466) $ 11,768 $ (28,831)
Reclassification adjustment
Disposal of equity
instruments at fair value through other
comprehensive income (10,783) (3,854) (37,056) (3,854)
(Continued)
- 38 -
For the Three Months Ended
September 30
For the Nine Months Ended
September 30
2019 2018 2019 2018
Effect of change in tax rate Remeasurement of defined
benefit plans $ - $ - $ - $ (2,813)
Fair value changes of
financial assets at FVTOCI - - - 13,626
$ (9,854) $ (12,320) $ (25,288) $ (21,872) (Concluded)
c. Income tax assessments
The tax returns through 2017, have been assessed by the tax authorities.
25. EARNINGS PER SHARE
The earnings and weighted average number of ordinary shares outstanding in the computation of earnings per share from continuing operations were as follows:
Net Profit for the Period
For the Three Months Ended
September 30
For the Nine Months Ended
September 30
2019 2018 2019 2018
Profit for the period attributable to
owners of the Company $ 234,358 $ 241,650 $ 448,677 $ 441,467
Earnings used in the computation
of diluted earnings per share $ 234,358 $ 241,650 $ 448,677 $ 441,467
Weighted average number of ordinary shares outstanding (in thousand shares):
For the Three Months Ended
September 30
For the Nine Months Ended
September 30
2019 2018 2019 2018
Weighted average number of ordinary shares in the
computation of basic earnings
per share 309,757 309,757 309,757 309,757 Effect of potentially dilutive
ordinary shares:
Employees’ compensation or
bonuses issued to employees 1,237 1,405 1,834 2,108
Weighted average number of
ordinary shares used in the computation of diluted earnings
per share 310,994 311,162 311,591 311,865
- 39 -
If the Group offered to settle compensation or bonuses paid to employees in cash or shares, the Group
assumed the entire amount of the compensation or bonuses will be settled in shares, and the resulting potential shares were included in the weighted average number of shares outstanding used in the
computation of diluted earnings per share, as the effect is dilutive. Such dilutive effect of the potential
shares is included in the computation of diluted earnings per share until the number of shares to be distributed to employees is resolved in the following year.
26. CAPITAL MANAGEMENT
The Group manages its capital to ensure that entities in the Group will be able to continue as going
concerns while maximizing the return to stakeholders through the optimization of the debt and equity balance.
The capital structure of the Group consists of net debt (borrowings offset by cash and cash equivalents) and equity attributable to owners of the Company (comprising issued capital, reserves, retained earnings and
other equity).
The Group is not subject to any externally imposed capital requirements.
27. FINANCIAL INSTRUMENTS
a. Fair value of financial instruments not measured at fair value
The management consider that the carrying amounts of financial assets and financial liabilities
recognized in the consolidated financial statements approximate their fair values.
b. Fair value of financial instruments measured at fair value on a recurring basis
1) Fair value hierarchy
September 30, 2019
Level 1 Level 2 Level 3 Total
Financial assets at FVTPL
Foreign unlisted share and emerging market shares $ - $ - $ 9,255 $ 9,255
Mutual funds 297,332 - - 297,332
Structured deposits - 221,560 - 221,560
$ 297,332 $ 221,560 $ 9,255 $ 528,147
(Continued)
- 40 -
Level 1 Level 2 Level 3 Total
Financial assets at FVTOCI
Investments in equity instruments
Domestic unlisted shares and
emerging market shares $ - $ - $ 80,227 $ 80,227 Foreign listed shares 104,044 - - 104,044
Foreign unlisted shares and
emerging market shares - - 186,484 186,484
$ 104,044 $ - $ 266,711 $ 370,755
Financial liabilities at FVTPL
Foreign exchange forward
contracts $ - $ 15,611 $ - $ 15,611 (Concluded)
December 31, 2018
Level 1 Level 2 Level 3 Total
Financial assets at FVTPL
Domestic listed shares and
emerging market shares $ 30,975 $ - $ - $ 30,975
Foreign exchange forward contracts and exchange
contracts - 1,833 - 1,833
Mutual funds 559,068 - - 559,068 Structured deposits - 341,968 - 341,968
$ 590,043 $ 343,801 $ - $ 933,844
Financial assets at FVTOCI
Investments in equity instruments
Domestic unlisted shares and
emerging market shares $ - $ - $ 80,227 $ 80,227 Foreign listed shares 250,698 - - 250,698
Foreign unlisted shares and
emerging market shares - - 163,317 163,317
$ 250,698 $ - $ 243,544 $ 494,242
- 41 -
September 30, 2018
Level 1 Level 2 Level 3 Total
Financial assets at FVTPL
Mutual funds $ 402,091 $ - $ - $ 402,091
Domestic listed shares and
emerging market shares 30,450 - - 30,450 Structured deposits - 287,999 - 287,999
$ 432,541 $ 287,999 $ - $ 720,540
Financial assets at FVTOCI
Investments in equity instruments
Domestic unlisted shares and
emerging market shares $ - $ - $ 63,868 $ 63,868 Foreign listed shares 325,282 - - 325,282
Foreign unlisted shares and
emerging market shares - - 155,306 155,306
$ 325,282 $ - $ 219,174 $ 544,456
Financial liabilities at FVTPL
Foreign exchange forward
contracts and exchange
contracts $ - $ 8,081 $ - $ 8,081
There were no transfers between Levels 1 and 2 between January 1 to September 30, 2019 to 2018.
2) Reconciliation of Level 3 fair value measurements of financial instruments
September 30, 2019
Financial Assets
at FVTPL
Financial Assets
at FVTOCI
Equity
Instruments
Equity
Instruments
Balance at January 1, 2019 $ - $ 243,544 Purchases 9,255 27,108
Effect of foreign currency exchange differences - (3,941)
Balance at September 30, 2019 $ 9,255 $ 266,711
- 42 -
September 30, 2018
Financial Assets
at FVTOCI
Equity
Instruments
Balance at January 1, 2018 (IAS 39) $ 21,498
Effect of retrospective application and retrospective restatement 202,250
Balance at January 1, 2018 (IFRS 9) 223,748
Exchange differences on translating the financial statements of foreign operations (4,574)
Balance at September 30, 2018 $ 219,174
3) Valuation techniques and inputs applied for Level 2 fair value measurement
Financial Instruments Valuation Techniques and Inputs
Derivatives - foreign exchange
forward contracts and exchange contracts
Discounted cash flow
Future cash flows are estimated based on observable forward
exchange rates at the end of the reporting period and contract
forward rates, discounted at a rate that reflects the credit risk of various counterparties.
Structured deposits Discounted cash flow
Future cash flows are discounted at a rate that reflects current
borrowing interest rates of the bond issuers at the end of the
reporting period
4) Valuation techniques and inputs applied for Level 3 fair value measurement
The estimated approach of part of unlisted shares and emerging market shares is based on analysis regarding the financial condition and operating performance of investees. Refer to the quoted price
of active markets and its imputed value of multiplier. In addition, the Group also consider related
trading information and financial performance of the valuating item.
c. Categories of financial instruments
September 30,
2019
December 31,
2018
September 30,
2018
Financial assets
FVTPL
Mandatorily at FVTPL (1) $ 528,147 $ 933,844 $ 720,540 Financial assets at amortized cost (2) 5,316,744 4,334,056 4,533,393
Financial assets at FVTOCI
Equity instruments 370,755 494,242 544,456
Financial liabilities
FVTPL Mandatorily at FVTPL (3) 15,611 - 8,081
Amortized cost (4) 4,309,116 3,545,793 3,776,705
- 43 -
1) The balances included the carrying amount of mutual fund, foreign exchange forward contracts and
structured deposits.
2) The balances include financial assets measured at amortized cost, which comprise cash and cash
equivalents, notes receivable, trade receivables, financial debt investment and other receivables.
3) The balances included the carrying amount of foreign exchange forward contracts.
4) The balances included financial liabilities measured at amortized cost, which comprise short-term
and long-term loans, notes payable, trade and other payables and lease liabilities.
d. Financial risk management objectives and policies
The Group’s major financial instruments include equity and debt investments, trade receivables, trade
payables, borrowings and lease liabilities. The Group’s Corporate Treasury function provides services to the business, coordinates access to domestic and international financial markets, monitors and
manages the financial risks relating to the operations of the Group through internal risk reports which
analyze exposures by degree and magnitude of risks. These risks include market risk (including foreign currency risk, interest rate risk and other price risk), credit risk and liquidity risk.
The Group seeks to minimize the effects of these risks by using derivative financial instruments to
hedge risk exposures. The use of financial derivatives is governed by the Group’s policies approved by the board of directors, which provided written principles on foreign currency risk, interest rate risk,
credit risk, the use of financial derivatives and non-derivative financial instruments, and the investment
of excess liquidity. Compliance with policies and exposure limits is reviewed by the internal auditors on a continuous basis. The Group did not enter into or trade financial instruments, including derivative
financial instruments, for speculative purposes.
The corporate treasury function reports quarterly to the Group’s risk management committee, an independent body that monitors risks and policies implemented to mitigate risk exposures.
1) Market risk
The Group’s activities exposed it primarily to the financial risks of changes in foreign currency
exchange rates (see (a) below) and interest rates (see (b) below). The Group entered into a variety of derivative financial instruments to manage its exposure to foreign currency risk and interest rate
risk, including: Foreign exchange forward contracts to hedge the exchange rate risk arising on the
Group’s foreign currency monetary.
There has been no change to the Group’s exposure to market risks or the manner in which these
risks were managed and measured.
a) Foreign currency risk
Several subsidiaries of the Company have foreign currency sales and purchases, which exposes the Group to foreign currency risk.
The carrying amounts of the Group’s foreign currency denominated monetary assets and
monetary liabilities (including those eliminated on consolidation) at the end of the reporting period (see Note 32).
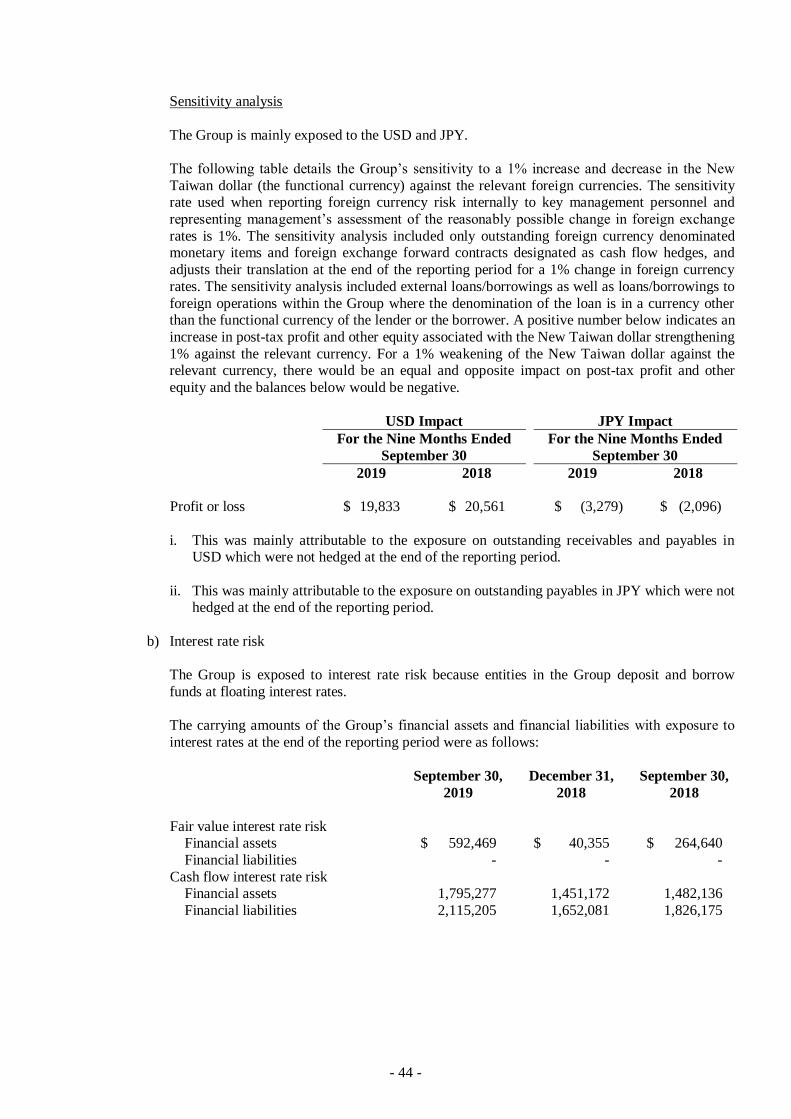
- 44 -
Sensitivity analysis
The Group is mainly exposed to the USD and JPY.
The following table details the Group’s sensitivity to a 1% increase and decrease in the New
Taiwan dollar (the functional currency) against the relevant foreign currencies. The sensitivity rate used when reporting foreign currency risk internally to key management personnel and
representing management’s assessment of the reasonably possible change in foreign exchange
rates is 1%. The sensitivity analysis included only outstanding foreign currency denominated monetary items and foreign exchange forward contracts designated as cash flow hedges, and
adjusts their translation at the end of the reporting period for a 1% change in foreign currency
rates. The sensitivity analysis included external loans/borrowings as well as loans/borrowings to
foreign operations within the Group where the denomination of the loan is in a currency other than the functional currency of the lender or the borrower. A positive number below indicates an
increase in post-tax profit and other equity associated with the New Taiwan dollar strengthening
1% against the relevant currency. For a 1% weakening of the New Taiwan dollar against the relevant currency, there would be an equal and opposite impact on post-tax profit and other
equity and the balances below would be negative.
USD Impact JPY Impact
For the Nine Months Ended
September 30
For the Nine Months Ended
September 30
2019 2018 2019 2018
Profit or loss $ 19,833 $ 20,561 $ (3,279) $ (2,096)
i. This was mainly attributable to the exposure on outstanding receivables and payables in USD which were not hedged at the end of the reporting period.
ii. This was mainly attributable to the exposure on outstanding payables in JPY which were not hedged at the end of the reporting period.
b) Interest rate risk
The Group is exposed to interest rate risk because entities in the Group deposit and borrow
funds at floating interest rates.
The carrying amounts of the Group’s financial assets and financial liabilities with exposure to
interest rates at the end of the reporting period were as follows:
September 30,
2019
December 31,
2018
September 30,
2018
Fair value interest rate risk Financial assets $ 592,469 $ 40,355 $ 264,640
Financial liabilities - - -
Cash flow interest rate risk Financial assets 1,795,277 1,451,172 1,482,136
Financial liabilities 2,115,205 1,652,081 1,826,175
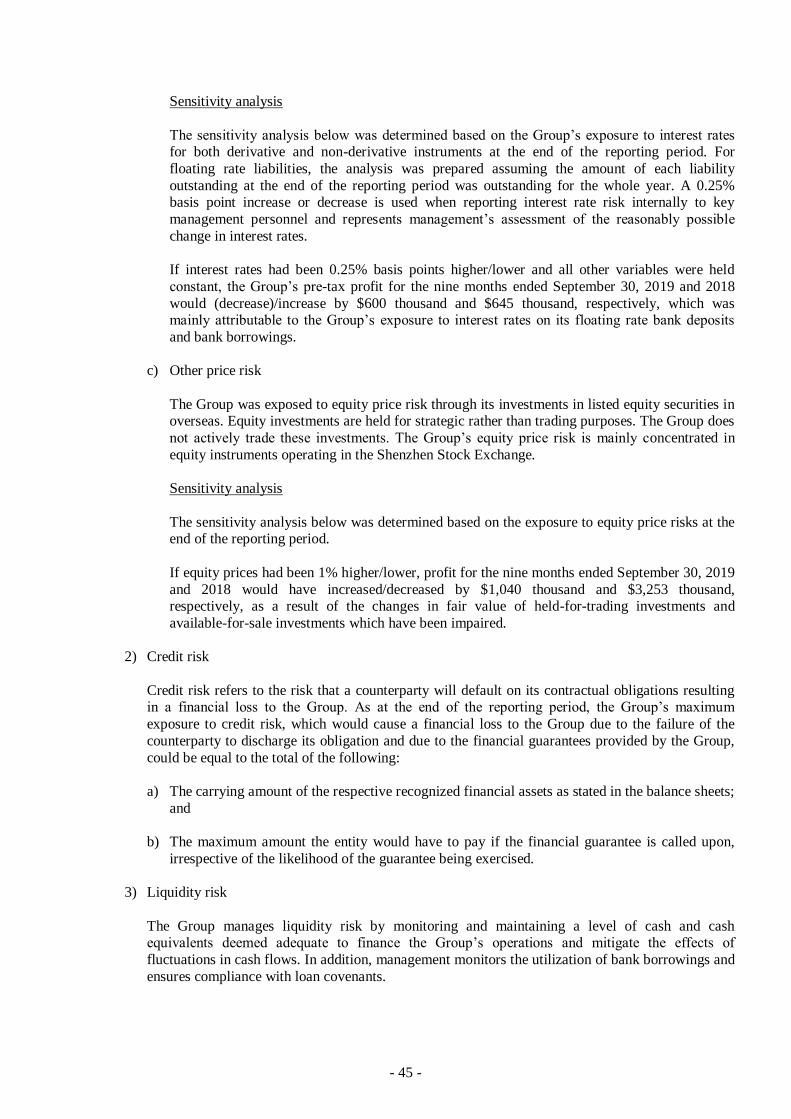
- 45 -
Sensitivity analysis
The sensitivity analysis below was determined based on the Group’s exposure to interest rates for both derivative and non-derivative instruments at the end of the reporting period. For
floating rate liabilities, the analysis was prepared assuming the amount of each liability
outstanding at the end of the reporting period was outstanding for the whole year. A 0.25% basis point increase or decrease is used when reporting interest rate risk internally to key
management personnel and represents management’s assessment of the reasonably possible
change in interest rates.
If interest rates had been 0.25% basis points higher/lower and all other variables were held
constant, the Group’s pre-tax profit for the nine months ended September 30, 2019 and 2018
would (decrease)/increase by $600 thousand and $645 thousand, respectively, which was mainly attributable to the Group’s exposure to interest rates on its floating rate bank deposits
and bank borrowings.
c) Other price risk
The Group was exposed to equity price risk through its investments in listed equity securities in overseas. Equity investments are held for strategic rather than trading purposes. The Group does
not actively trade these investments. The Group’s equity price risk is mainly concentrated in
equity instruments operating in the Shenzhen Stock Exchange.
Sensitivity analysis
The sensitivity analysis below was determined based on the exposure to equity price risks at the end of the reporting period.
If equity prices had been 1% higher/lower, profit for the nine months ended September 30, 2019
and 2018 would have increased/decreased by $1,040 thousand and $3,253 thousand, respectively, as a result of the changes in fair value of held-for-trading investments and
available-for-sale investments which have been impaired.
2) Credit risk
Credit risk refers to the risk that a counterparty will default on its contractual obligations resulting in a financial loss to the Group. As at the end of the reporting period, the Group’s maximum
exposure to credit risk, which would cause a financial loss to the Group due to the failure of the
counterparty to discharge its obligation and due to the financial guarantees provided by the Group,
could be equal to the total of the following:
a) The carrying amount of the respective recognized financial assets as stated in the balance sheets;
and
b) The maximum amount the entity would have to pay if the financial guarantee is called upon,
irrespective of the likelihood of the guarantee being exercised.
3) Liquidity risk
The Group manages liquidity risk by monitoring and maintaining a level of cash and cash equivalents deemed adequate to finance the Group’s operations and mitigate the effects of
fluctuations in cash flows. In addition, management monitors the utilization of bank borrowings and
ensures compliance with loan covenants.
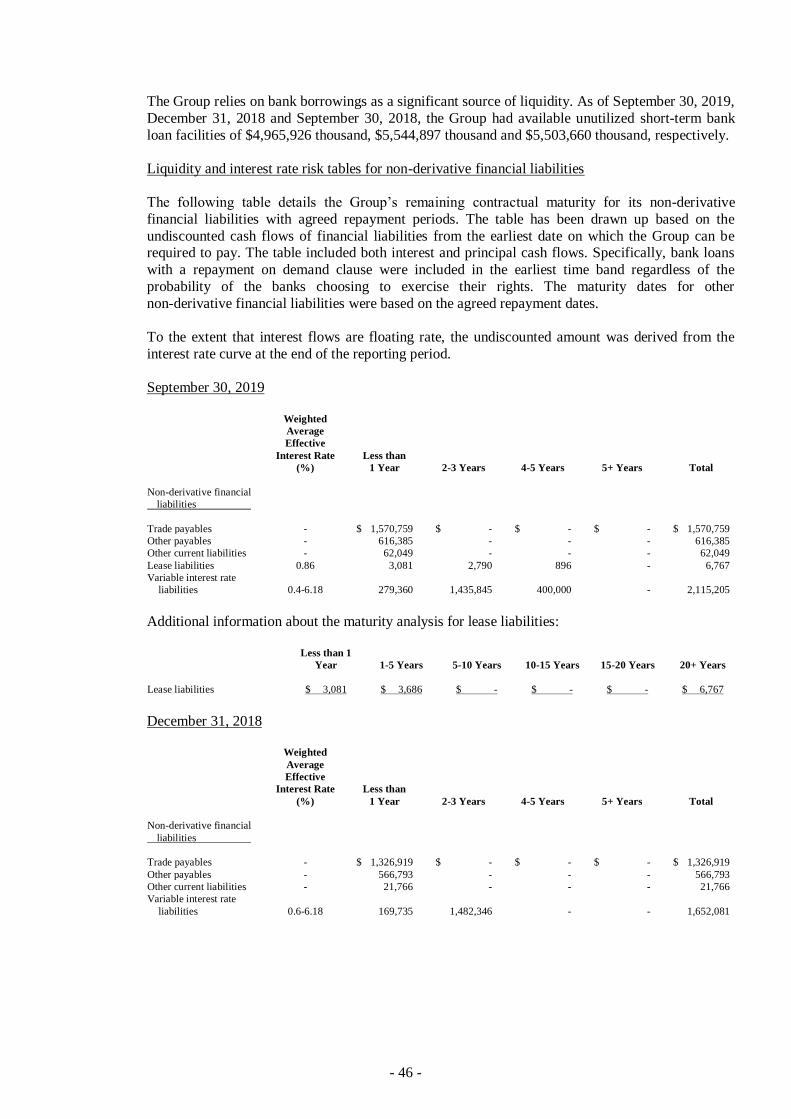
- 46 -
The Group relies on bank borrowings as a significant source of liquidity. As of September 30, 2019,
December 31, 2018 and September 30, 2018, the Group had available unutilized short-term bank
loan facilities of $4,965,926 thousand, $5,544,897 thousand and $5,503,660 thousand, respectively.
Liquidity and interest rate risk tables for non-derivative financial liabilities
The following table details the Group’s remaining contractual maturity for its non-derivative
financial liabilities with agreed repayment periods. The table has been drawn up based on the
undiscounted cash flows of financial liabilities from the earliest date on which the Group can be required to pay. The table included both interest and principal cash flows. Specifically, bank loans
with a repayment on demand clause were included in the earliest time band regardless of the
probability of the banks choosing to exercise their rights. The maturity dates for other
non-derivative financial liabilities were based on the agreed repayment dates.
To the extent that interest flows are floating rate, the undiscounted amount was derived from the
interest rate curve at the end of the reporting period.
September 30, 2019
Weighted
Average
Effective
Interest Rate
(%)
Less than
1 Year 2-3 Years 4-5 Years 5+ Years Total
Non-derivative financial
liabilities
Trade payables - $ 1,570,759 $ - $ - $ - $ 1,570,759
Other payables - 616,385 - - - 616,385
Other current liabilities - 62,049 - - - 62,049
Lease liabilities 0.86 3,081 2,790 896 - 6,767
Variable interest rate
liabilities 0.4-6.18 279,360 1,435,845 400,000 - 2,115,205
Additional information about the maturity analysis for lease liabilities:
Less than 1
Year 1-5 Years 5-10 Years 10-15 Years 15-20 Years 20+ Years
Lease liabilities $ 3,081 $ 3,686 $ - $ - $ - $ 6,767
December 31, 2018
Weighted
Average
Effective
Interest Rate
(%)
Less than
1 Year 2-3 Years 4-5 Years 5+ Years Total
Non-derivative financial
liabilities
Trade payables - $ 1,326,919 $ - $ - $ - $ 1,326,919
Other payables - 566,793 - - - 566,793
Other current liabilities - 21,766 - - - 21,766
Variable interest rate
liabilities 0.6-6.18 169,735 1,482,346 - - 1,652,081
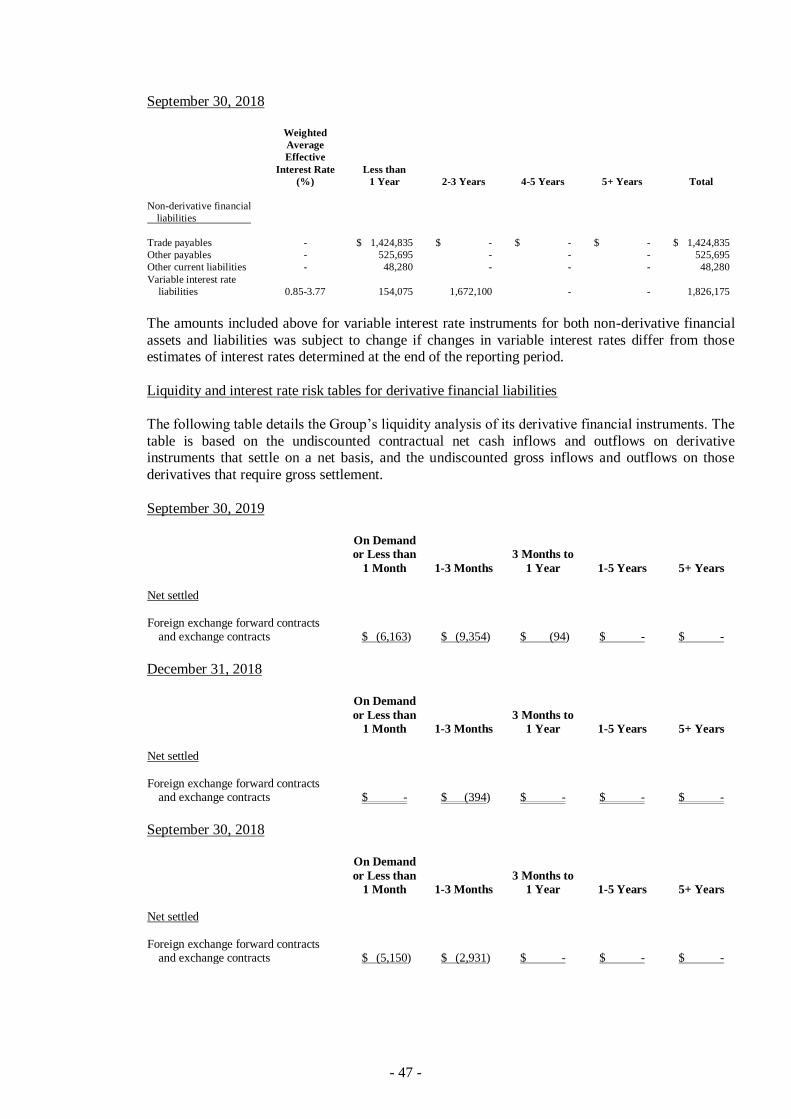
- 47 -
September 30, 2018
Weighted
Average
Effective
Interest Rate
(%)
Less than
1 Year 2-3 Years 4-5 Years 5+ Years Total
Non-derivative financial
liabilities
Trade payables - $ 1,424,835 $ - $ - $ - $ 1,424,835
Other payables - 525,695 - - - 525,695
Other current liabilities - 48,280 - - - 48,280
Variable interest rate
liabilities 0.85-3.77 154,075 1,672,100 - - 1,826,175
The amounts included above for variable interest rate instruments for both non-derivative financial
assets and liabilities was subject to change if changes in variable interest rates differ from those estimates of interest rates determined at the end of the reporting period.
Liquidity and interest rate risk tables for derivative financial liabilities
The following table details the Group’s liquidity analysis of its derivative financial instruments. The
table is based on the undiscounted contractual net cash inflows and outflows on derivative instruments that settle on a net basis, and the undiscounted gross inflows and outflows on those
derivatives that require gross settlement.
September 30, 2019
On Demand
or Less than
1 Month 1-3 Months
3 Months to
1 Year 1-5 Years 5+ Years Net settled Foreign exchange forward contracts
and exchange contracts $ (6,163) $ (9,354) $ (94) $ - $ -
December 31, 2018
On Demand
or Less than
1 Month 1-3 Months
3 Months to
1 Year 1-5 Years 5+ Years Net settled Foreign exchange forward contracts
and exchange contracts $ - $ (394) $ - $ - $ -
September 30, 2018
On Demand
or Less than
1 Month 1-3 Months
3 Months to
1 Year 1-5 Years 5+ Years Net settled Foreign exchange forward contracts
and exchange contracts $ (5,150) $ (2,931) $ - $ - $ -
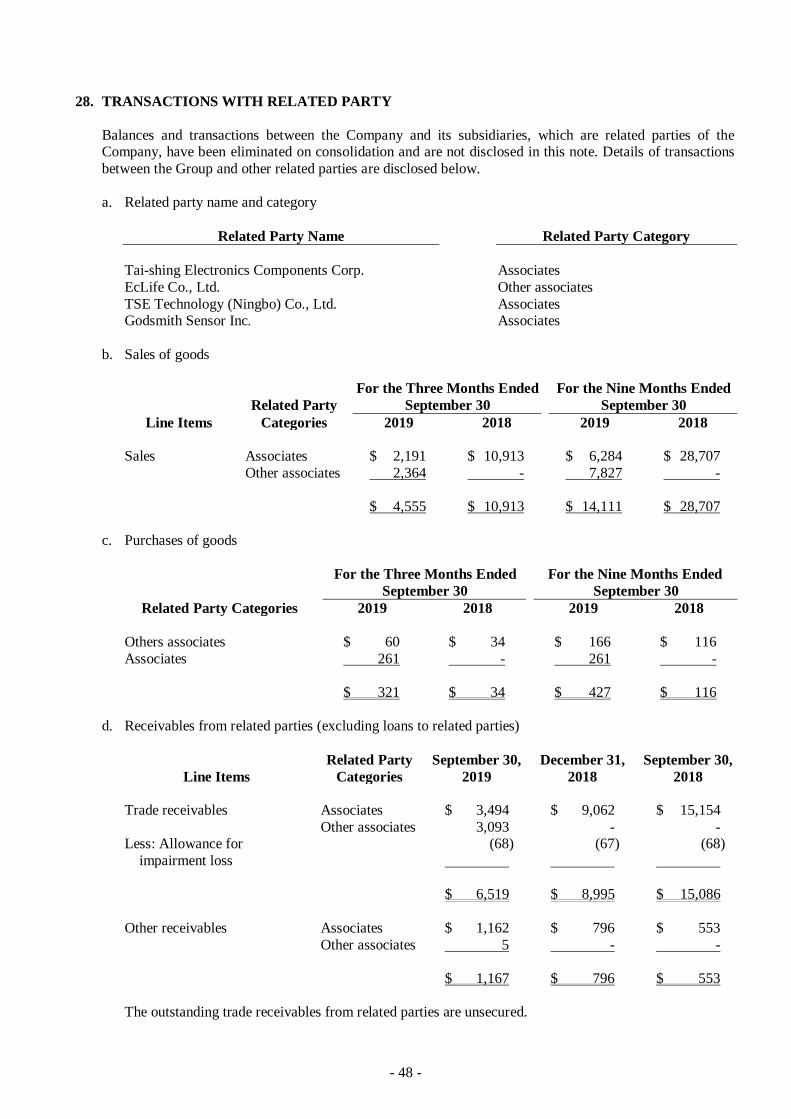
- 48 -
28. TRANSACTIONS WITH RELATED PARTY
Balances and transactions between the Company and its subsidiaries, which are related parties of the Company, have been eliminated on consolidation and are not disclosed in this note. Details of transactions
between the Group and other related parties are disclosed below.
a. Related party name and category
Related Party Name Related Party Category
Tai-shing Electronics Components Corp. Associates
EcLife Co., Ltd. Other associates
TSE Technology (Ningbo) Co., Ltd. Associates Godsmith Sensor Inc. Associates
b. Sales of goods
Related Party
For the Three Months Ended
September 30
For the Nine Months Ended
September 30
Line Items Categories 2019 2018 2019 2018
Sales Associates $ 2,191 $ 10,913 $ 6,284 $ 28,707
Other associates 2,364 - 7,827 -
$ 4,555 $ 10,913 $ 14,111 $ 28,707
c. Purchases of goods
For the Three Months Ended
September 30
For the Nine Months Ended
September 30
Related Party Categories 2019 2018 2019 2018
Others associates $ 60 $ 34 $ 166 $ 116
Associates 261 - 261 -
$ 321 $ 34 $ 427 $ 116
d. Receivables from related parties (excluding loans to related parties)
Line Items
Related Party
Categories
September 30,
2019
December 31,
2018
September 30,
2018
Trade receivables Associates $ 3,494 $ 9,062 $ 15,154
Other associates 3,093 - - Less: Allowance for
impairment loss
(68)
(67)
(68)
$ 6,519 $ 8,995 $ 15,086
Other receivables Associates $ 1,162 $ 796 $ 553
Other associates 5 - -
$ 1,167 $ 796 $ 553
The outstanding trade receivables from related parties are unsecured.
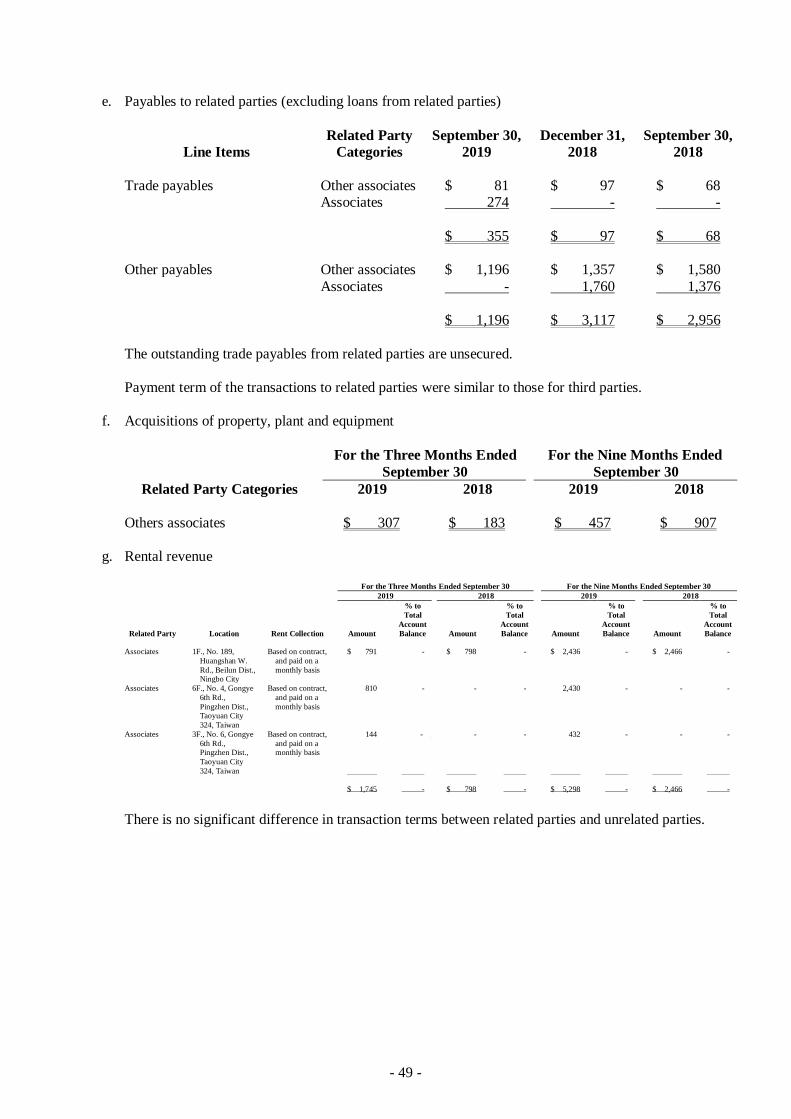
- 49 -
e. Payables to related parties (excluding loans from related parties)
Line Items
Related Party
Categories September 30,
2019
December 31,
2018
September 30,
2018
Trade payables Other associates $ 81 $ 97 $ 68 Associates 274 - -
$ 355 $ 97 $ 68
Other payables Other associates $ 1,196 $ 1,357 $ 1,580
Associates - 1,760 1,376
$ 1,196 $ 3,117 $ 2,956
The outstanding trade payables from related parties are unsecured.
Payment term of the transactions to related parties were similar to those for third parties.
f. Acquisitions of property, plant and equipment
For the Three Months Ended
September 30
For the Nine Months Ended
September 30
Related Party Categories 2019 2018 2019 2018
Others associates $ 307 $ 183 $ 457 $ 907
g. Rental revenue
For the Three Months Ended September 30 For the Nine Months Ended September 30
2019 2018 2019 2018
Related Party Location Rent Collection Amount
% to
Total
Account
Balance Amount
% to
Total
Account
Balance Amount
% to
Total
Account
Balance Amount
% to
Total
Account
Balance
Associates 1F., No. 189,
Huangshan W.
Rd., Beilun Dist., Ningbo City
Based on contract,
and paid on a
monthly basis
$ 791 - $ 798 - $ 2,436 - $ 2,466 -
Associates 6F., No. 4, Gongye
6th Rd.,
Pingzhen Dist., Taoyuan City
324, Taiwan
Based on contract,
and paid on a
monthly basis
810 - - - 2,430 - - -
Associates 3F., No. 6, Gongye
6th Rd., Pingzhen Dist.,
Taoyuan City
324, Taiwan
Based on contract,
and paid on a monthly basis
144
- - -
-
-
432
-
-
-
$ 1,745 - $ 798 - $ 5,298 - $ 2,466 -
There is no significant difference in transaction terms between related parties and unrelated parties.
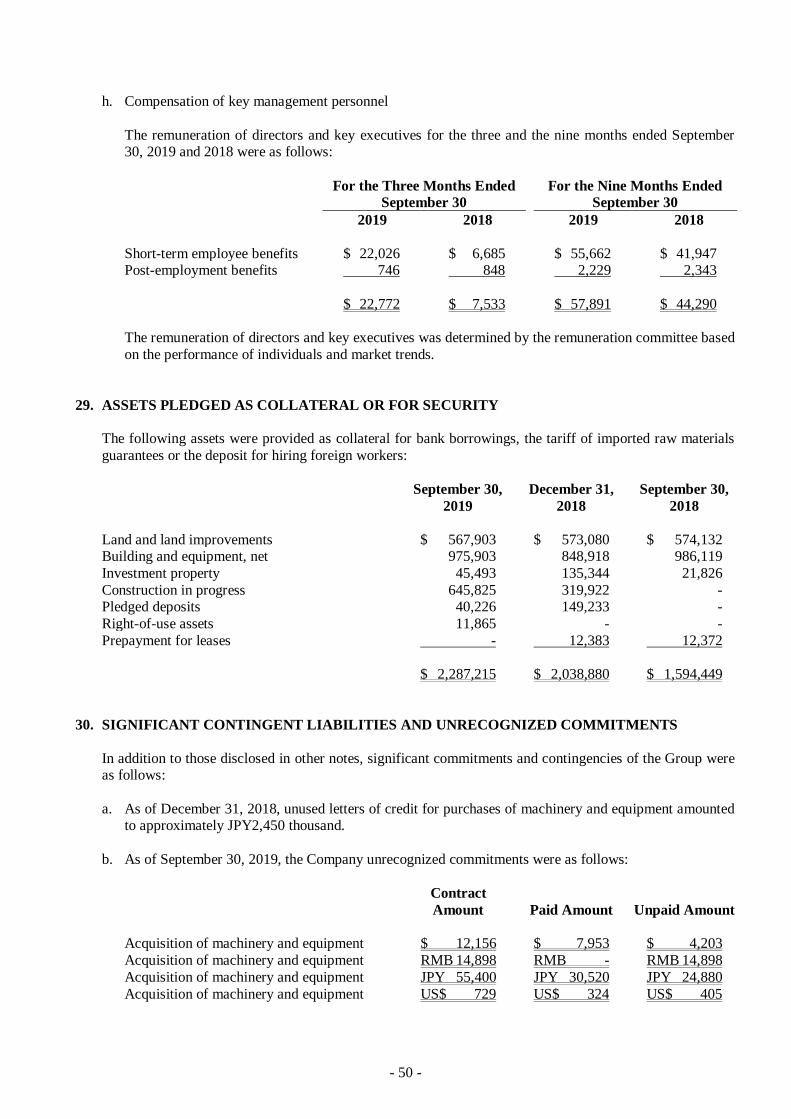
- 50 -
h. Compensation of key management personnel
The remuneration of directors and key executives for the three and the nine months ended September 30, 2019 and 2018 were as follows:
For the Three Months Ended
September 30
For the Nine Months Ended
September 30
2019 2018 2019 2018
Short-term employee benefits $ 22,026 $ 6,685 $ 55,662 $ 41,947 Post-employment benefits 746 848 2,229 2,343
$ 22,772 $ 7,533 $ 57,891 $ 44,290
The remuneration of directors and key executives was determined by the remuneration committee based
on the performance of individuals and market trends.
29. ASSETS PLEDGED AS COLLATERAL OR FOR SECURITY
The following assets were provided as collateral for bank borrowings, the tariff of imported raw materials
guarantees or the deposit for hiring foreign workers:
September 30,
2019
December 31,
2018
September 30,
2018
Land and land improvements $ 567,903 $ 573,080 $ 574,132 Building and equipment, net 975,903 848,918 986,119
Investment property 45,493 135,344 21,826
Construction in progress 645,825 319,922 - Pledged deposits 40,226 149,233 -
Right-of-use assets 11,865 - -
Prepayment for leases - 12,383 12,372
$ 2,287,215 $ 2,038,880 $ 1,594,449
30. SIGNIFICANT CONTINGENT LIABILITIES AND UNRECOGNIZED COMMITMENTS
In addition to those disclosed in other notes, significant commitments and contingencies of the Group were as follows:
a. As of December 31, 2018, unused letters of credit for purchases of machinery and equipment amounted to approximately JPY2,450 thousand.
b. As of September 30, 2019, the Company unrecognized commitments were as follows:
Contract
Amount Paid Amount Unpaid Amount
Acquisition of machinery and equipment $ 12,156 $ 7,953 $ 4,203
Acquisition of machinery and equipment RMB 14,898 RMB - RMB 14,898
Acquisition of machinery and equipment JPY 55,400 JPY 30,520 JPY 24,880
Acquisition of machinery and equipment US$ 729 US$ 324 US$ 405
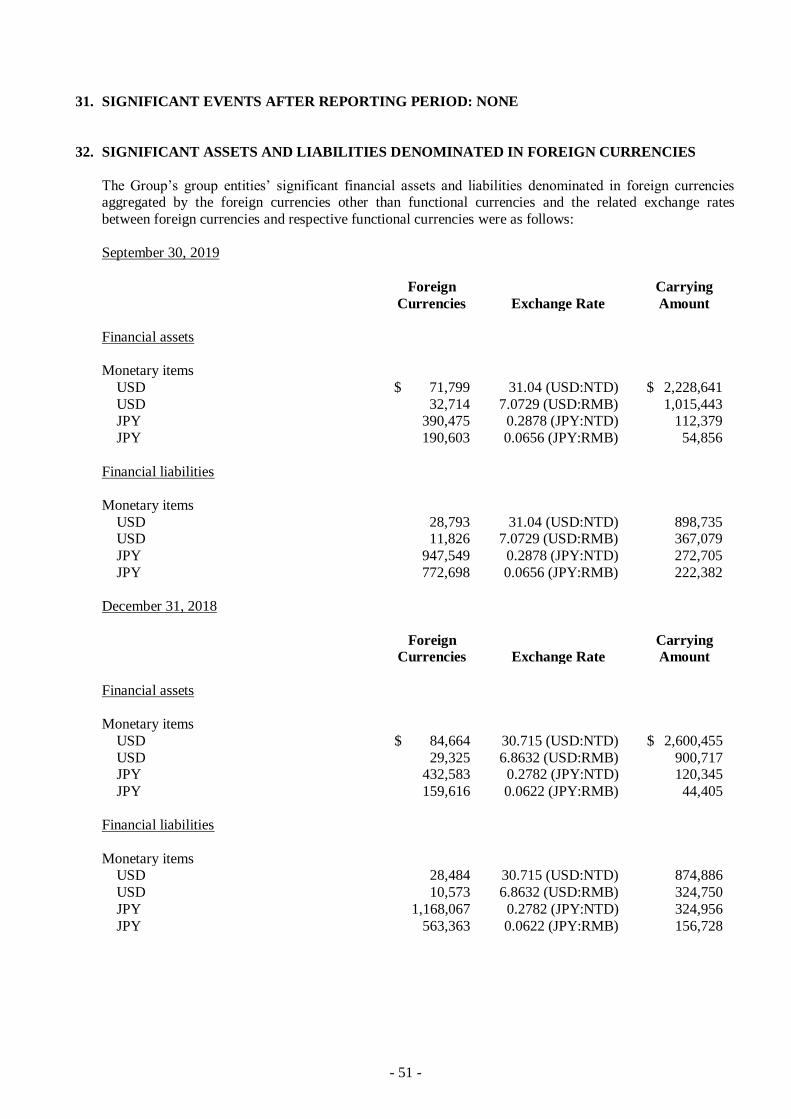
- 51 -
31. SIGNIFICANT EVENTS AFTER REPORTING PERIOD: NONE
32. SIGNIFICANT ASSETS AND LIABILITIES DENOMINATED IN FOREIGN CURRENCIES
The Group’s group entities’ significant financial assets and liabilities denominated in foreign currencies aggregated by the foreign currencies other than functional currencies and the related exchange rates
between foreign currencies and respective functional currencies were as follows:
September 30, 2019
Foreign
Currencies Exchange Rate
Carrying
Amount
Financial assets
Monetary items
USD $ 71,799 31.04 (USD:NTD) $ 2,228,641
USD 32,714 7.0729 (USD:RMB) 1,015,443 JPY 390,475 0.2878 (JPY:NTD) 112,379
JPY 190,603 0.0656 (JPY:RMB) 54,856
Financial liabilities
Monetary items
USD 28,793 31.04 (USD:NTD) 898,735 USD 11,826 7.0729 (USD:RMB) 367,079
JPY 947,549 0.2878 (JPY:NTD) 272,705
JPY 772,698 0.0656 (JPY:RMB) 222,382
December 31, 2018
Foreign
Currencies Exchange Rate
Carrying
Amount
Financial assets
Monetary items
USD $ 84,664 30.715 (USD:NTD) $ 2,600,455
USD 29,325 6.8632 (USD:RMB) 900,717 JPY 432,583 0.2782 (JPY:NTD) 120,345
JPY 159,616 0.0622 (JPY:RMB) 44,405
Financial liabilities
Monetary items USD 28,484 30.715 (USD:NTD) 874,886
USD 10,573 6.8632 (USD:RMB) 324,750
JPY 1,168,067 0.2782 (JPY:NTD) 324,956
JPY 563,363 0.0622 (JPY:RMB) 156,728
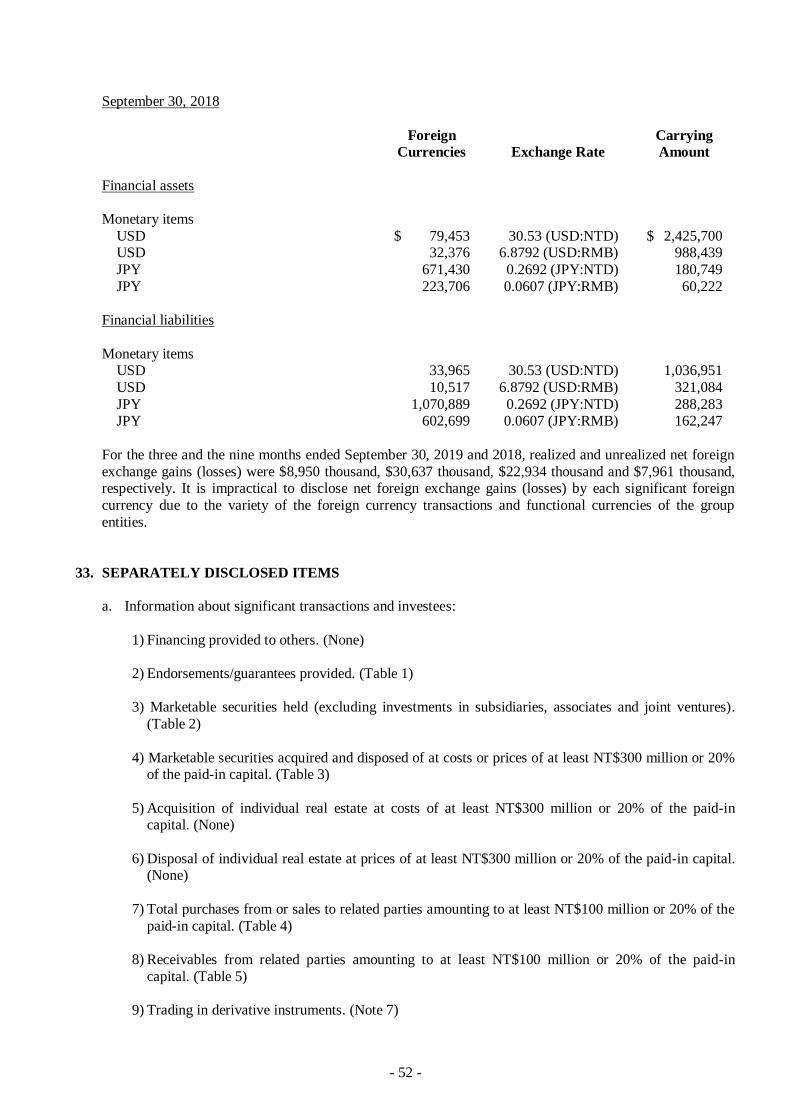
- 52 -
September 30, 2018
Foreign
Currencies Exchange Rate
Carrying
Amount
Financial assets
Monetary items
USD $ 79,453 30.53 (USD:NTD) $ 2,425,700 USD 32,376 6.8792 (USD:RMB) 988,439
JPY 671,430 0.2692 (JPY:NTD) 180,749
JPY 223,706 0.0607 (JPY:RMB) 60,222
Financial liabilities
Monetary items USD 33,965 30.53 (USD:NTD) 1,036,951
USD 10,517 6.8792 (USD:RMB) 321,084
JPY 1,070,889 0.2692 (JPY:NTD) 288,283 JPY 602,699 0.0607 (JPY:RMB) 162,247
For the three and the nine months ended September 30, 2019 and 2018, realized and unrealized net foreign
exchange gains (losses) were $8,950 thousand, $30,637 thousand, $22,934 thousand and $7,961 thousand, respectively. It is impractical to disclose net foreign exchange gains (losses) by each significant foreign
currency due to the variety of the foreign currency transactions and functional currencies of the group
entities.
33. SEPARATELY DISCLOSED ITEMS
a. Information about significant transactions and investees:
1) Financing provided to others. (None)
2) Endorsements/guarantees provided. (Table 1)
3) Marketable securities held (excluding investments in subsidiaries, associates and joint ventures).
(Table 2)
4) Marketable securities acquired and disposed of at costs or prices of at least NT$300 million or 20% of the paid-in capital. (Table 3)
5) Acquisition of individual real estate at costs of at least NT$300 million or 20% of the paid-in capital. (None)
6) Disposal of individual real estate at prices of at least NT$300 million or 20% of the paid-in capital. (None)
7) Total purchases from or sales to related parties amounting to at least NT$100 million or 20% of the
paid-in capital. (Table 4)
8) Receivables from related parties amounting to at least NT$100 million or 20% of the paid-in
capital. (Table 5)
9) Trading in derivative instruments. (Note 7)
- 53 -
10) Others: Intercompany relationships and significant intercompany transactions. (Table 9)
11) Information on investees. (Table 6)
b. Information on investments in mainland China
1) Information on any investee company in mainland China, showing the name, principal business
activities, paid-in capital, method of investment, inward and outward remittance of funds,
ownership percentage, net income of investees, investment income or loss, carrying amount of the investment at the end of the period, repatriations of investment income, and limit on the amount of
investment in the mainland China area. (Table 7)
2) Any of the following significant transactions with investee companies in mainland China, either directly or indirectly through a third party, and their prices, payment terms, and unrealized gains or
losses: (Table 8)
a) The amount and percentage of purchases and the balance and percentage of the related payables
at the end of the period.
b) The amount and percentage of sales and the balance and percentage of the related receivables at
the end of the period.
c) The amount of property transactions and the amount of the resultant gains or losses.
d) The balance of negotiable instrument endorsements or guarantees or pledges of collateral at the
end of the period and the purposes.
e) The highest balance, the end of period balance, the interest rate range, and total current period
interest with respect to financing of funds.
f) Other transactions that have a material effect on the profit or loss for the period or on the
financial position, such as the rendering or receipt of services.
34. SEGMENT INFORMATION
Information reported to the chief operating decision maker for the purpose of resource allocation and
assessment of segment performance focuses on the types of goods or services delivered or provided.
Specifically, the Group’s reportable segments under IFRS 8 “Operating Segments” were as follows:
Crystal
The crystal (direct sales) segment includes a number of direct sales operations in various cities within Taiwan and China each of which is considered separate operating segment by the chief operating decision
maker (CODM). For financial statements presentation purposes, these individual operating segments have
been aggregated into a single operating segment taking into account the following factors:
a. These operating segments have similar long-term gross profit margins;
b. The nature of the products and production processes are similar;
c. The methods used to distribute the products to the customers are the same.
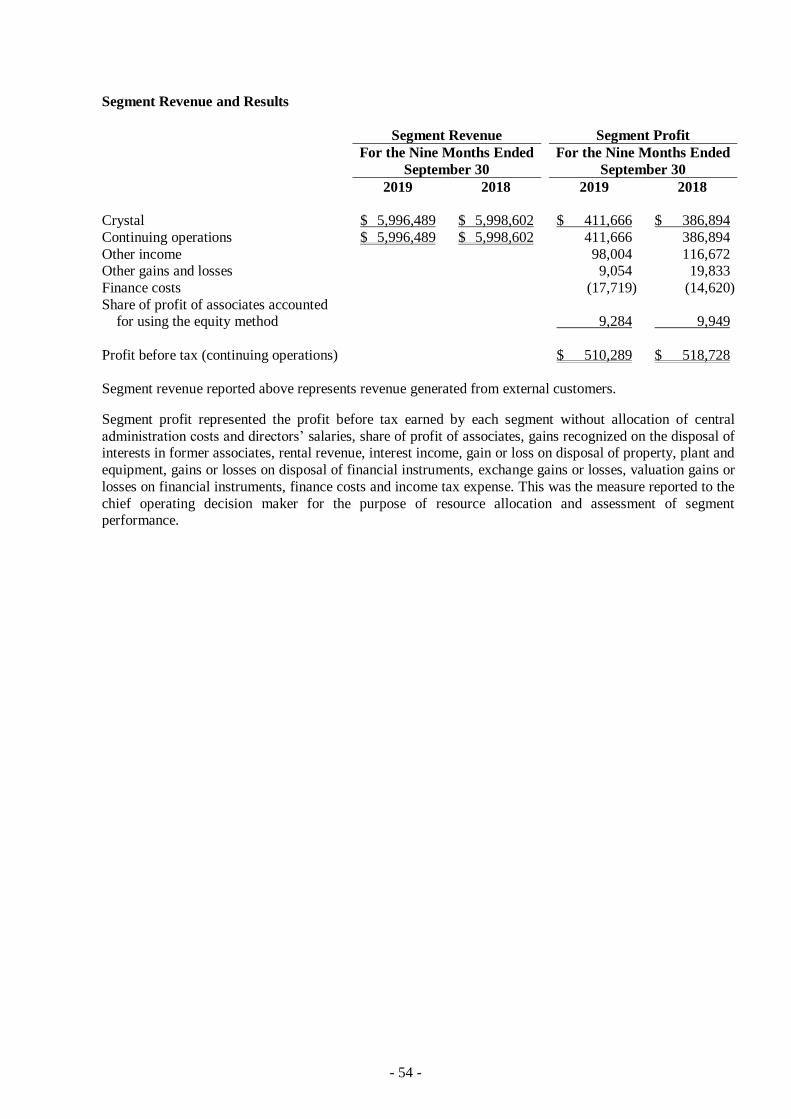
- 54 -
Segment Revenue and Results
Segment Revenue Segment Profit
For the Nine Months Ended
September 30
For the Nine Months Ended
September 30
2019 2018 2019 2018
Crystal $ 5,996,489 $ 5,998,602 $ 411,666 $ 386,894
Continuing operations $ 5,996,489 $ 5,998,602 411,666 386,894
Other income 98,004 116,672 Other gains and losses 9,054 19,833
Finance costs (17,719) (14,620)
Share of profit of associates accounted for using the equity method 9,284 9,949
Profit before tax (continuing operations) $ 510,289 $ 518,728
Segment revenue reported above represents revenue generated from external customers.
Segment profit represented the profit before tax earned by each segment without allocation of central
administration costs and directors’ salaries, share of profit of associates, gains recognized on the disposal of interests in former associates, rental revenue, interest income, gain or loss on disposal of property, plant and
equipment, gains or losses on disposal of financial instruments, exchange gains or losses, valuation gains or
losses on financial instruments, finance costs and income tax expense. This was the measure reported to the
chief operating decision maker for the purpose of resource allocation and assessment of segment performance.
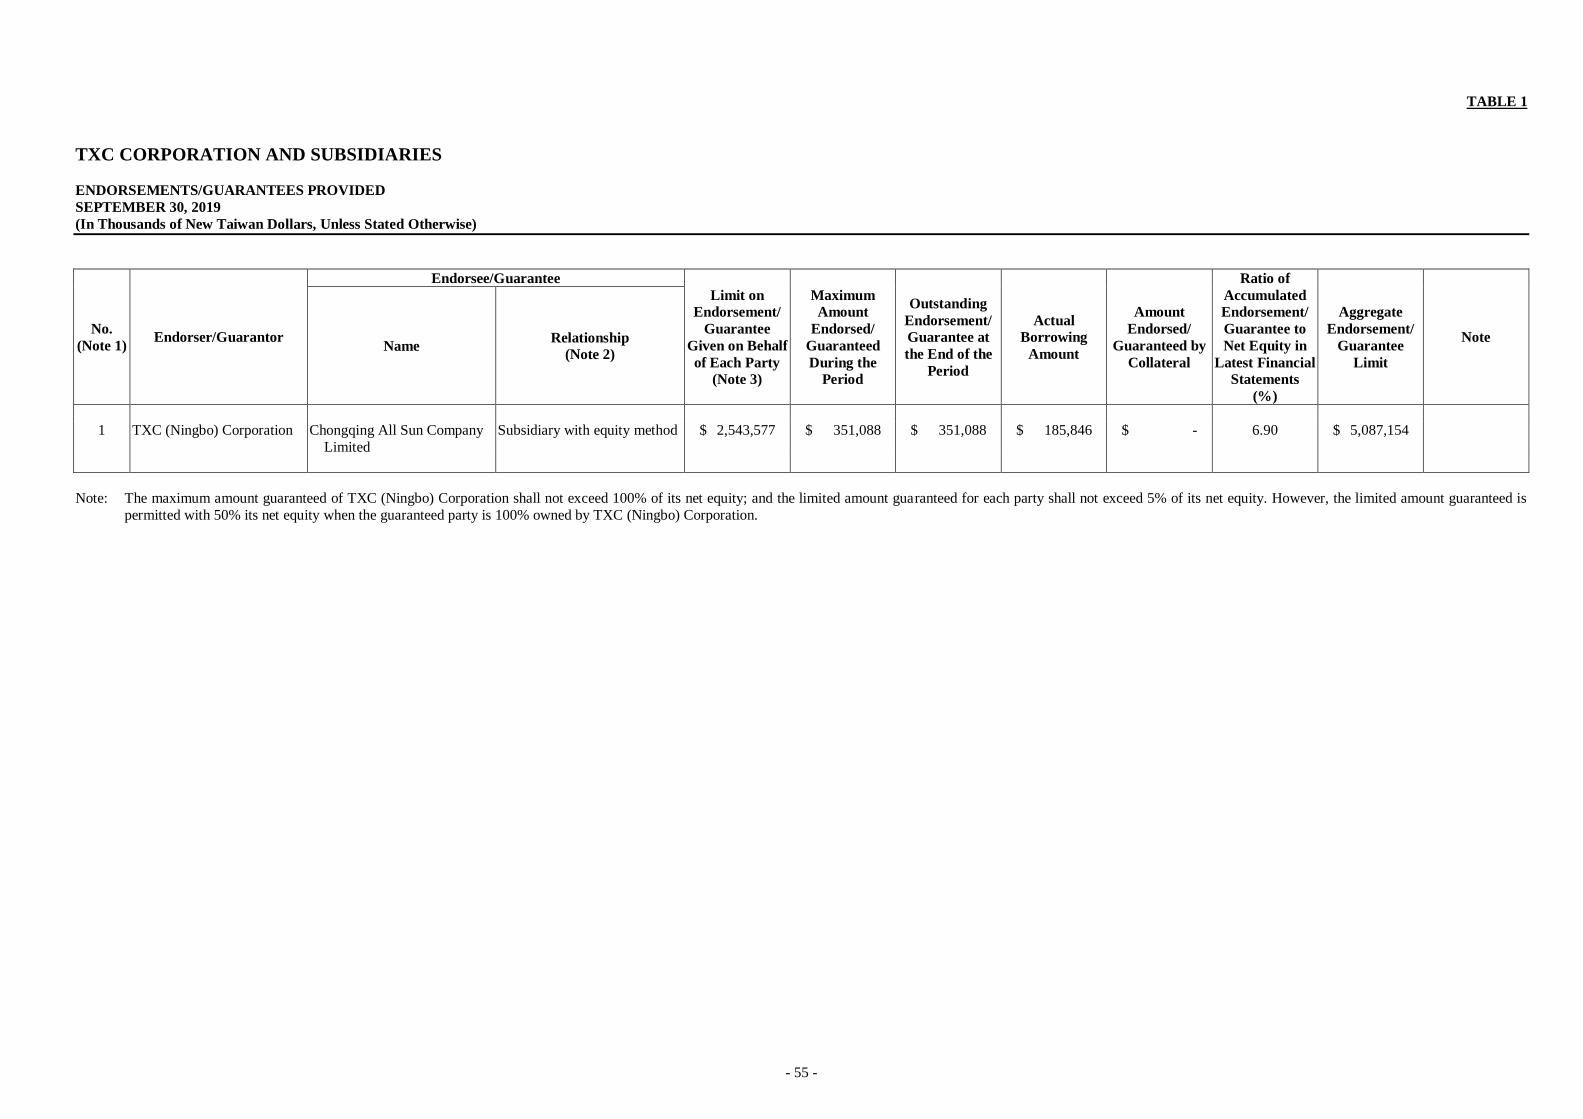
- 55 -
TABLE 1
TXC CORPORATION AND SUBSIDIARIES
ENDORSEMENTS/GUARANTEES PROVIDED
SEPTEMBER 30, 2019
(In Thousands of New Taiwan Dollars, Unless Stated Otherwise)
No.
(Note 1) Endorser/Guarantor
Endorsee/Guarantee
Limit on
Endorsement/
Guarantee
Given on Behalf
of Each Party
(Note 3)
Maximum
Amount
Endorsed/
Guaranteed
During the
Period
Outstanding
Endorsement/
Guarantee at
the End of the
Period
Actual
Borrowing
Amount
Amount
Endorsed/
Guaranteed by
Collateral
Ratio of
Accumulated
Endorsement/
Guarantee to
Net Equity in
Latest Financial
Statements
(%)
Aggregate
Endorsement/
Guarantee
Limit
Note Name
Relationship
(Note 2)
1 TXC (Ningbo) Corporation Chongqing All Sun Company
Limited
Subsidiary with equity method $ 2,543,577 $ 351,088 $ 351,088 $ 185,846 $ - 6.90 $ 5,087,154
Note: The maximum amount guaranteed of TXC (Ningbo) Corporation shall not exceed 100% of its net equity; and the limited amount guaranteed for each party shall not exceed 5% of its net equity. However, the limited amount guaranteed is
permitted with 50% its net equity when the guaranteed party is 100% owned by TXC (Ningbo) Corporation.
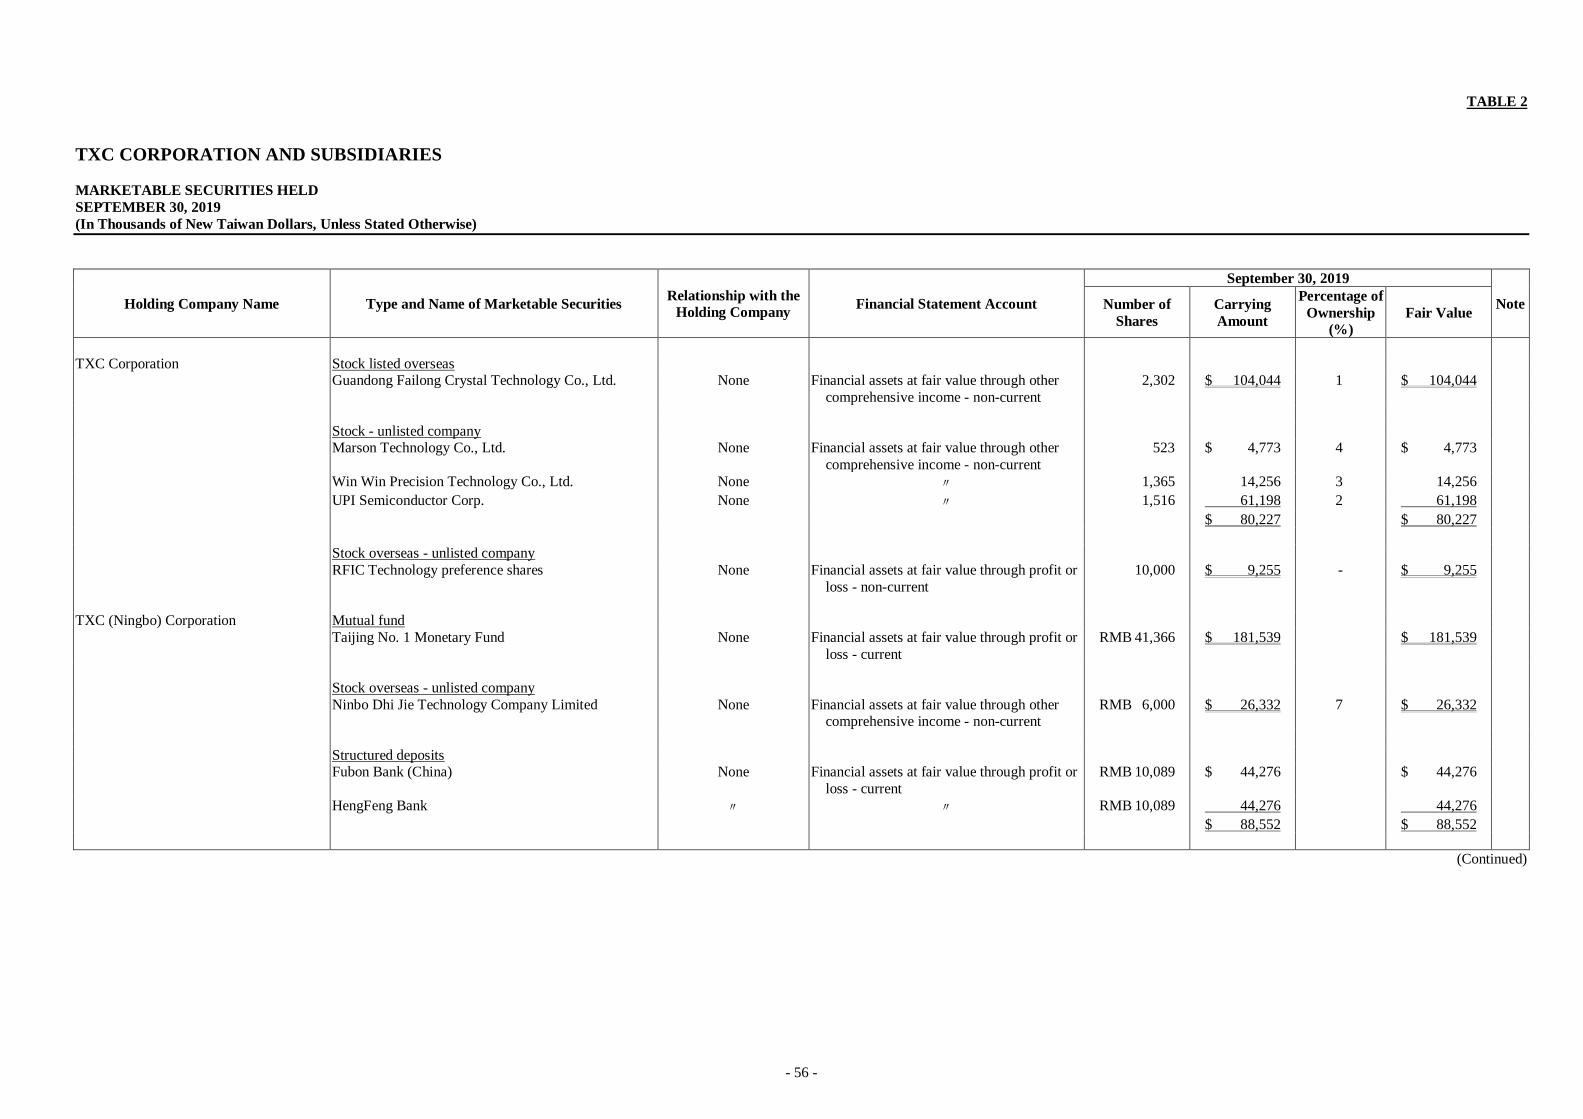
- 56 -
TABLE 2
TXC CORPORATION AND SUBSIDIARIES
MARKETABLE SECURITIES HELD
SEPTEMBER 30, 2019
(In Thousands of New Taiwan Dollars, Unless Stated Otherwise)
Holding Company Name Type and Name of Marketable Securities Relationship with the
Holding Company Financial Statement Account
September 30, 2019
Note Number of
Shares
Carrying
Amount
Percentage of
Ownership
(%) Fair Value
TXC Corporation Stock listed overseas Guandong Failong Crystal Technology Co., Ltd. None Financial assets at fair value through other
comprehensive income - non-current
2,302 $ 104,044 1 $ 104,044
Stock - unlisted company Marson Technology Co., Ltd. None Financial assets at fair value through other
comprehensive income - non-current
523 $ 4,773 4 $ 4,773
Win Win Precision Technology Co., Ltd. None 〃 1,365 14,256 3 14,256
UPI Semiconductor Corp. None 〃 1,516 61,198 2 61,198
$ 80,227 $ 80,227
Stock overseas - unlisted company
RFIC Technology preference shares None Financial assets at fair value through profit or
loss - non-current
10,000 $ 9,255 - $ 9,255
TXC (Ningbo) Corporation Mutual fund
Taijing No. 1 Monetary Fund None Financial assets at fair value through profit or
loss - current
RMB 41,366 $ 181,539 $ 181,539
Stock overseas - unlisted company
Ninbo Dhi Jie Technology Company Limited None Financial assets at fair value through other comprehensive income - non-current
RMB 6,000 $ 26,332 7 $ 26,332
Structured deposits Fubon Bank (China) None Financial assets at fair value through profit or
loss - current
RMB 10,089 $ 44,276 $ 44,276
HengFeng Bank 〃 〃 RMB 10,089 44,276 44,276
$ 88,552 $ 88,552
(Continued)
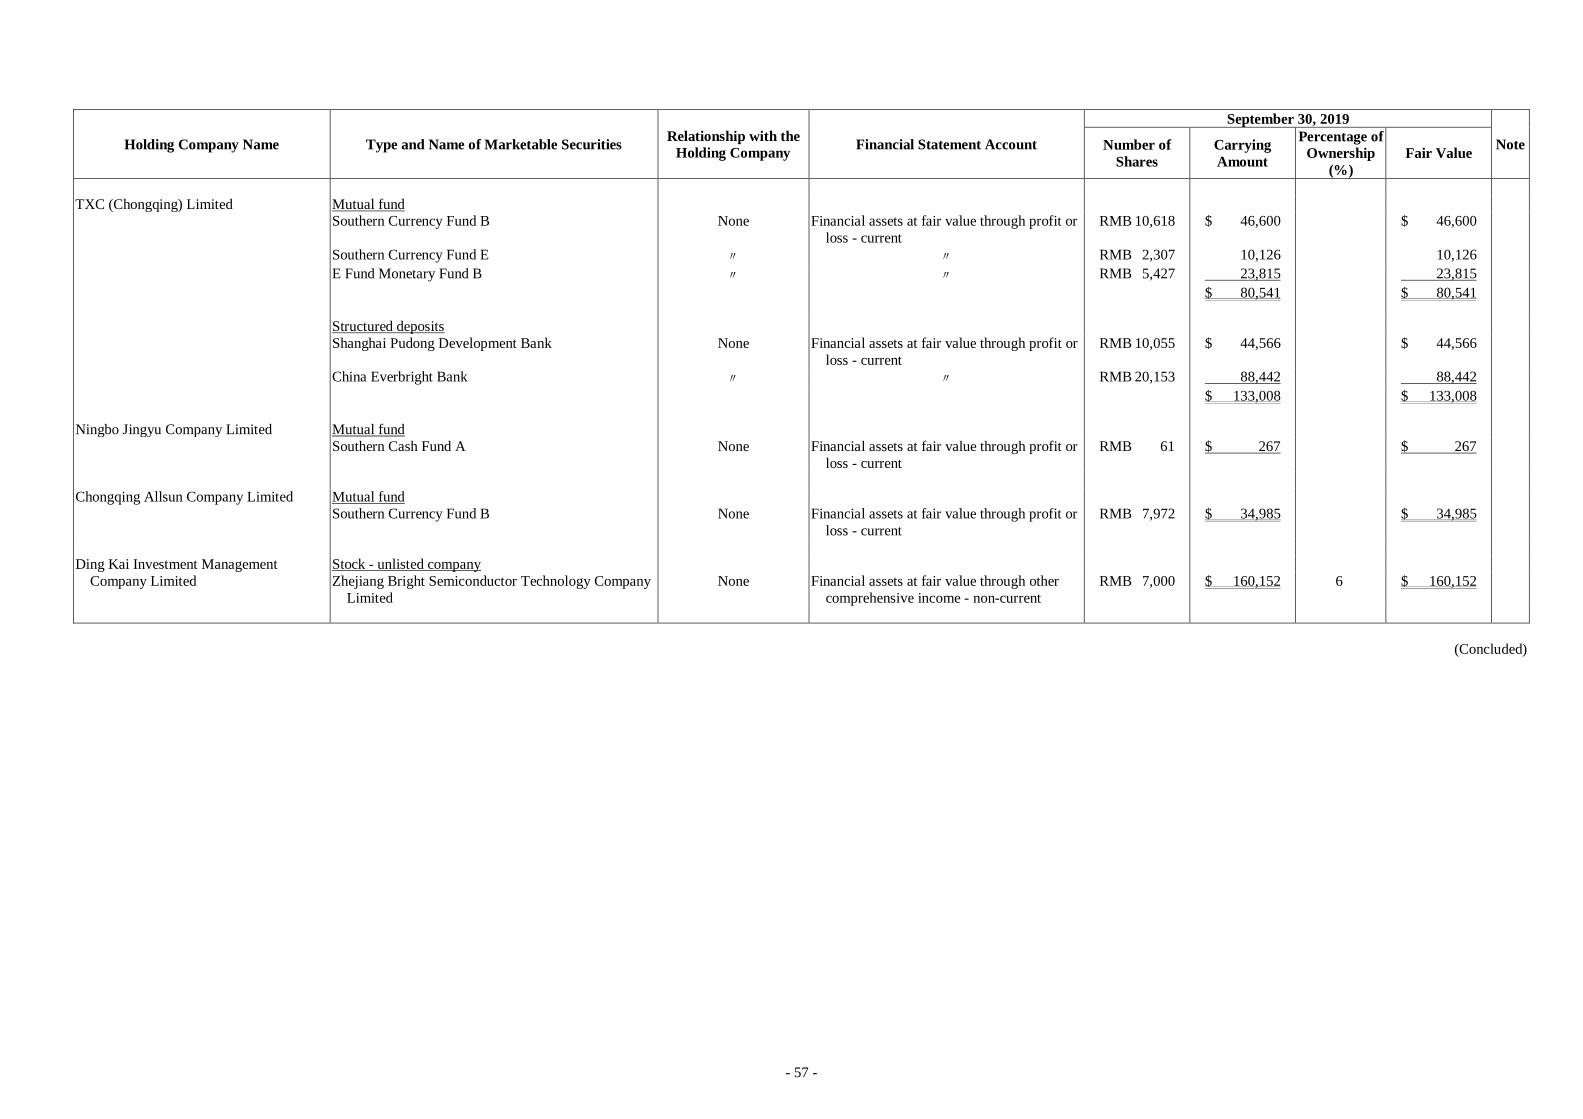
- 57 -
Holding Company Name Type and Name of Marketable Securities Relationship with the
Holding Company Financial Statement Account
September 30, 2019
Note Number of
Shares
Carrying
Amount
Percentage of
Ownership
(%)
Fair Value
TXC (Chongqing) Limited Mutual fund Southern Currency Fund B None Financial assets at fair value through profit or
loss - current
RMB 10,618 $ 46,600 $ 46,600
Southern Currency Fund E 〃 〃 RMB 2,307 10,126 10,126
E Fund Monetary Fund B 〃 〃 RMB 5,427 23,815 23,815
$ 80,541 $ 80,541
Structured deposits
Shanghai Pudong Development Bank None Financial assets at fair value through profit or
loss - current
RMB 10,055 $ 44,566 $ 44,566
China Everbright Bank 〃 〃 RMB 20,153 88,442 88,442
$ 133,008 $ 133,008
Ningbo Jingyu Company Limited Mutual fund
Southern Cash Fund A None Financial assets at fair value through profit or
loss - current
RMB 61 $ 267 $ 267
Chongqing Allsun Company Limited Mutual fund
Southern Currency Fund B None Financial assets at fair value through profit or
loss - current
RMB 7,972 $ 34,985 $ 34,985
Ding Kai Investment Management Stock - unlisted company
Company Limited Zhejiang Bright Semiconductor Technology Company
Limited
None Financial assets at fair value through other
comprehensive income - non-current
RMB 7,000 $ 160,152 6 $ 160,152
(Concluded)
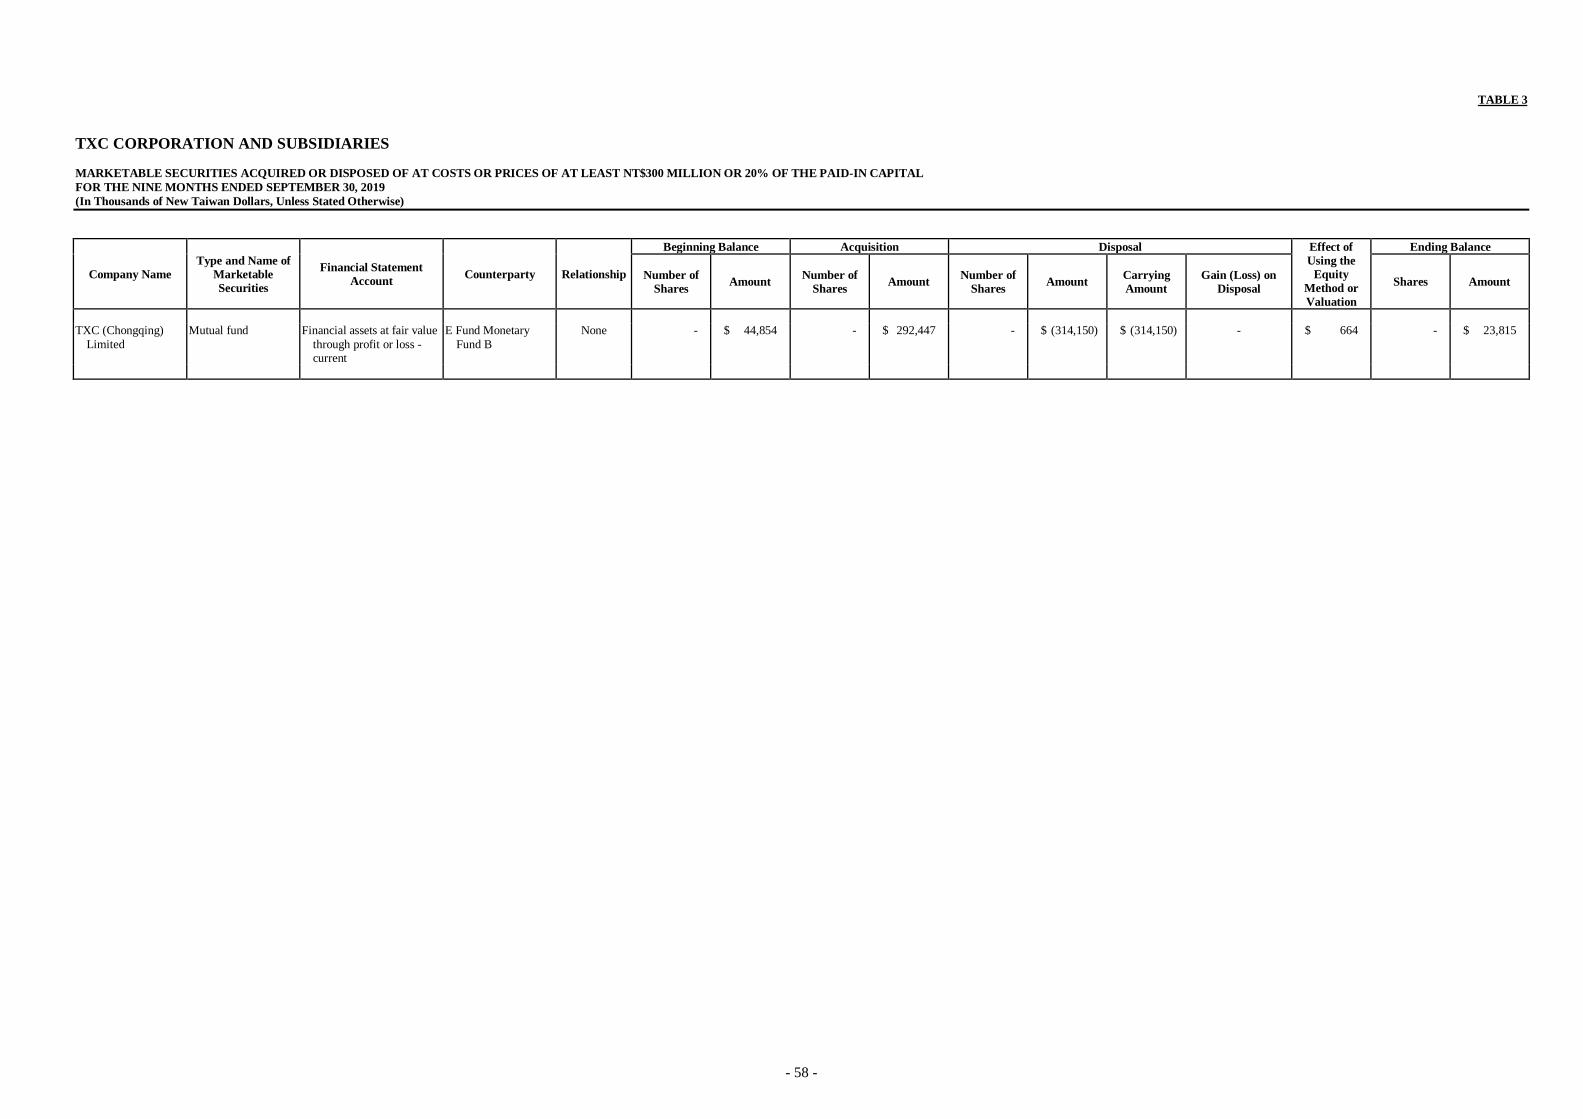
- 58 -
TABLE 3
TXC CORPORATION AND SUBSIDIARIES
MARKETABLE SECURITIES ACQUIRED OR DISPOSED OF AT COSTS OR PRICES OF AT LEAST NT$300 MILLION OR 20% OF THE PAID-IN CAPITAL
FOR THE NINE MONTHS ENDED SEPTEMBER 30, 2019
(In Thousands of New Taiwan Dollars, Unless Stated Otherwise)
Company Name
Type and Name of
Marketable
Securities
Financial Statement
Account Counterparty Relationship
Beginning Balance Acquisition Disposal Effect of
Using the
Equity
Method or
Valuation
Ending Balance
Number of
Shares Amount
Number of
Shares Amount
Number of
Shares Amount
Carrying
Amount
Gain (Loss) on
Disposal Shares Amount
TXC (Chongqing)
Limited
Mutual fund Financial assets at fair value
through profit or loss - current
E Fund Monetary
Fund B
None - $ 44,854 - $ 292,447 - $ (314,150) $ (314,150) - $ 664 - $ 23,815
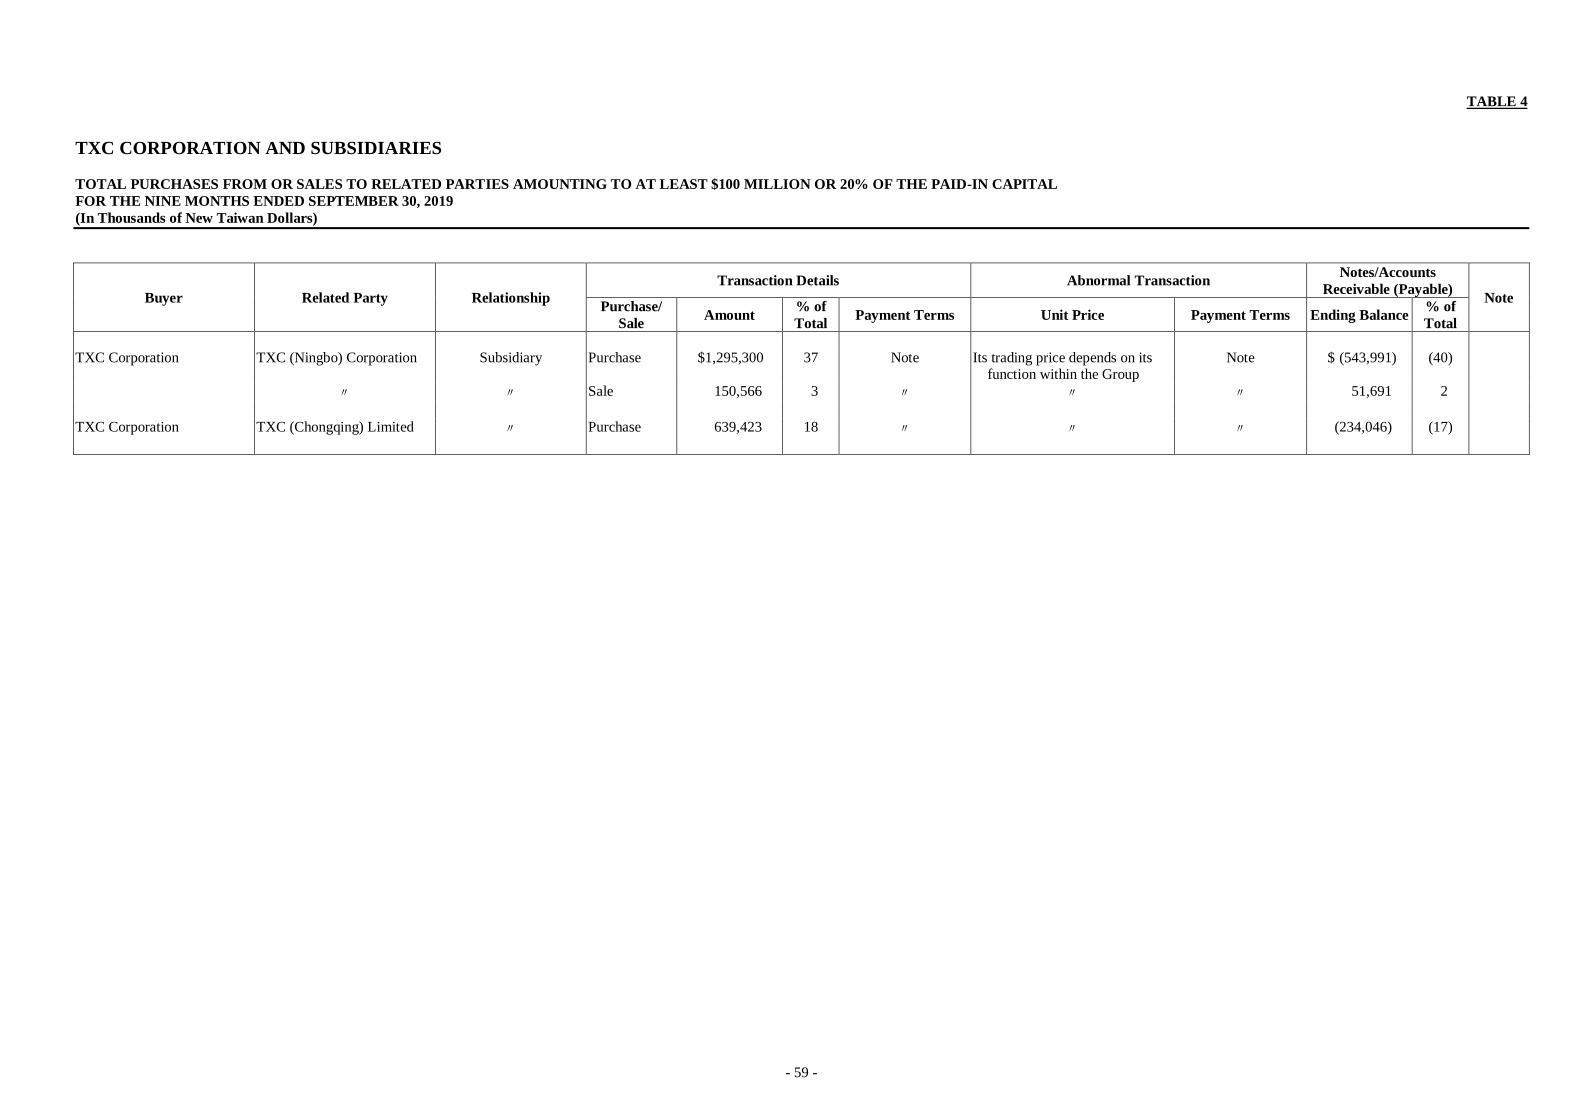
- 59 -
TABLE 4
TXC CORPORATION AND SUBSIDIARIES
TOTAL PURCHASES FROM OR SALES TO RELATED PARTIES AMOUNTING TO AT LEAST $100 MILLION OR 20% OF THE PAID-IN CAPITAL
FOR THE NINE MONTHS ENDED SEPTEMBER 30, 2019
(In Thousands of New Taiwan Dollars)
Buyer Related Party Relationship
Transaction Details Abnormal Transaction Notes/Accounts
Receivable (Payable) Note
Purchase/
Sale Amount
% of
Total Payment Terms Unit Price Payment Terms Ending Balance
% of
Total
TXC Corporation TXC (Ningbo) Corporation Subsidiary Purchase $1,295,300 37 Note Its trading price depends on its function within the Group
Note $ (543,991) (40)
〃 〃 Sale 150,566 3 〃 〃 〃 51,691 2
TXC Corporation TXC (Chongqing) Limited 〃 Purchase 639,423 18 〃 〃 〃 (234,046) (17)
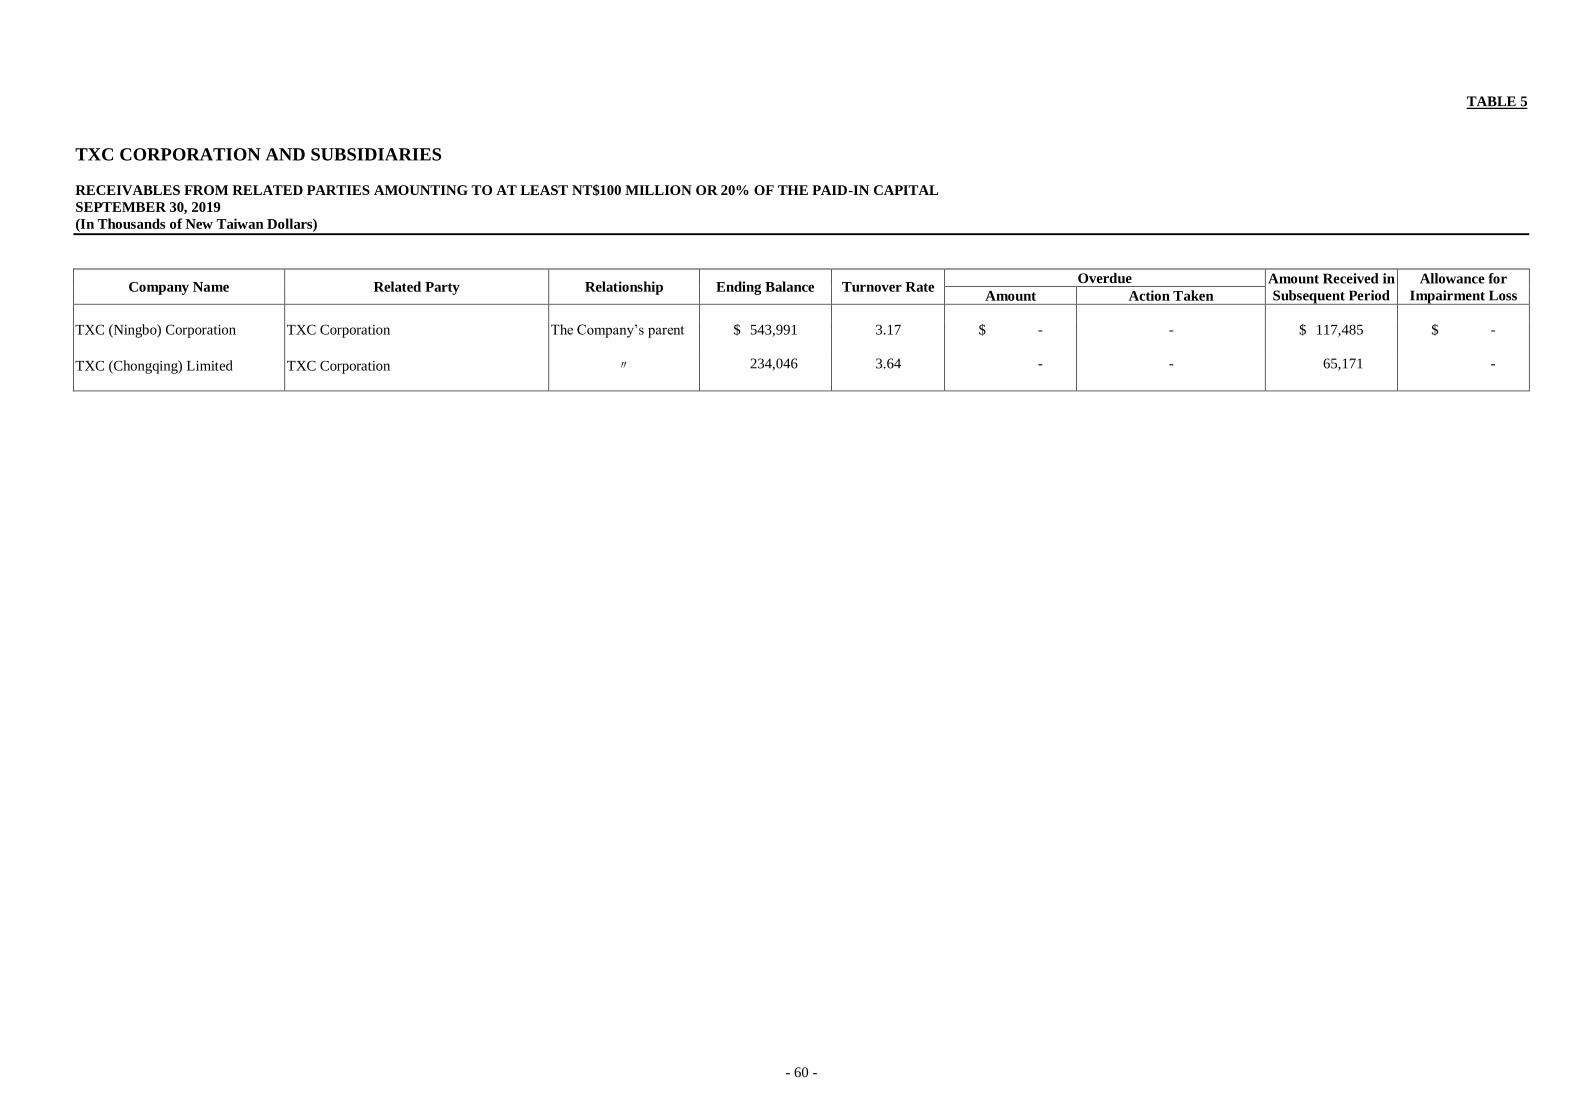
- 60 -
TABLE 5
TXC CORPORATION AND SUBSIDIARIES
RECEIVABLES FROM RELATED PARTIES AMOUNTING TO AT LEAST NT$100 MILLION OR 20% OF THE PAID-IN CAPITAL
SEPTEMBER 30, 2019
(In Thousands of New Taiwan Dollars)
Company Name Related Party Relationship Ending Balance Turnover Rate Overdue Amount Received in
Subsequent Period
Allowance for
Impairment Loss Amount Action Taken
TXC (Ningbo) Corporation TXC Corporation The Company’s parent $ 543,991 3.17 $ - - $ 117,485 $ -
TXC (Chongqing) Limited TXC Corporation 〃 234,046 3.64 - - 65,171 -
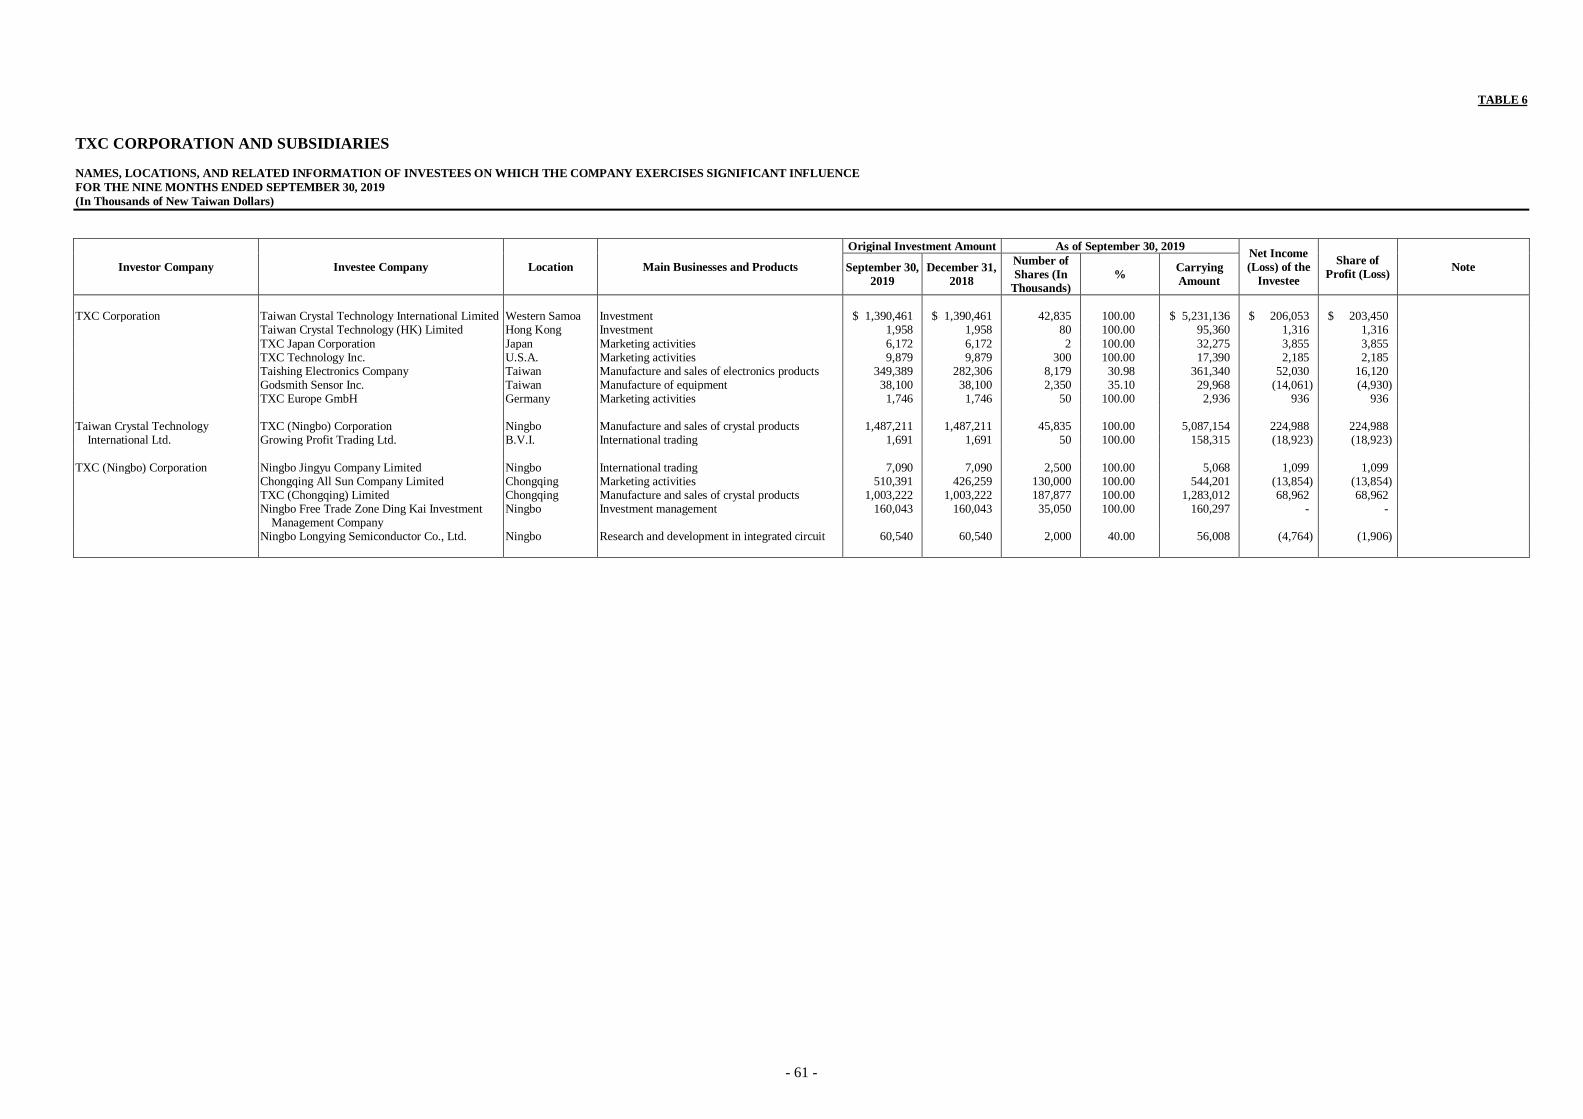
- 61 -
TABLE 6
TXC CORPORATION AND SUBSIDIARIES
NAMES, LOCATIONS, AND RELATED INFORMATION OF INVESTEES ON WHICH THE COMPANY EXERCISES SIGNIFICANT INFLUENCE
FOR THE NINE MONTHS ENDED SEPTEMBER 30, 2019
(In Thousands of New Taiwan Dollars)
Investor Company Investee Company Location Main Businesses and Products
Original Investment Amount As of September 30, 2019 Net Income
(Loss) of the
Investee
Share of
Profit (Loss) Note September 30,
2019
December 31,
2018
Number of
Shares (In
Thousands)
% Carrying
Amount
TXC Corporation Taiwan Crystal Technology International Limited Western Samoa Investment $ 1,390,461 $ 1,390,461 42,835 100.00 $ 5,231,136 $ 206,053 $ 203,450 Taiwan Crystal Technology (HK) Limited Hong Kong Investment 1,958 1,958 80 100.00 95,360 1,316 1,316
TXC Japan Corporation Japan Marketing activities 6,172 6,172 2 100.00 32,275 3,855 3,855 TXC Technology Inc. U.S.A. Marketing activities 9,879 9,879 300 100.00 17,390 2,185 2,185 Taishing Electronics Company Taiwan Manufacture and sales of electronics products 349,389 282,306 8,179 30.98 361,340 52,030 16,120 Godsmith Sensor Inc. Taiwan Manufacture of equipment 38,100 38,100 2,350 35.10 29,968 (14,061) (4,930) TXC Europe GmbH Germany Marketing activities 1,746 1,746 50 100.00 2,936 936 936 Taiwan Crystal Technology TXC (Ningbo) Corporation Ningbo Manufacture and sales of crystal products 1,487,211 1,487,211 45,835 100.00 5,087,154 224,988 224,988 International Ltd. Growing Profit Trading Ltd. B.V.I. International trading 1,691 1,691 50 100.00 158,315 (18,923) (18,923)
TXC (Ningbo) Corporation Ningbo Jingyu Company Limited Ningbo International trading 7,090 7,090 2,500 100.00 5,068 1,099 1,099 Chongqing All Sun Company Limited Chongqing Marketing activities 510,391 426,259 130,000 100.00 544,201 (13,854) (13,854) TXC (Chongqing) Limited Chongqing Manufacture and sales of crystal products 1,003,222 1,003,222 187,877 100.00 1,283,012 68,962 68,962 Ningbo Free Trade Zone Ding Kai Investment
Management Company Ningbo Investment management 160,043 160,043 35,050 100.00 160,297 - -
Ningbo Longying Semiconductor Co., Ltd. Ningbo Research and development in integrated circuit 60,540 60,540 2,000 40.00 56,008 (4,764) (1,906)
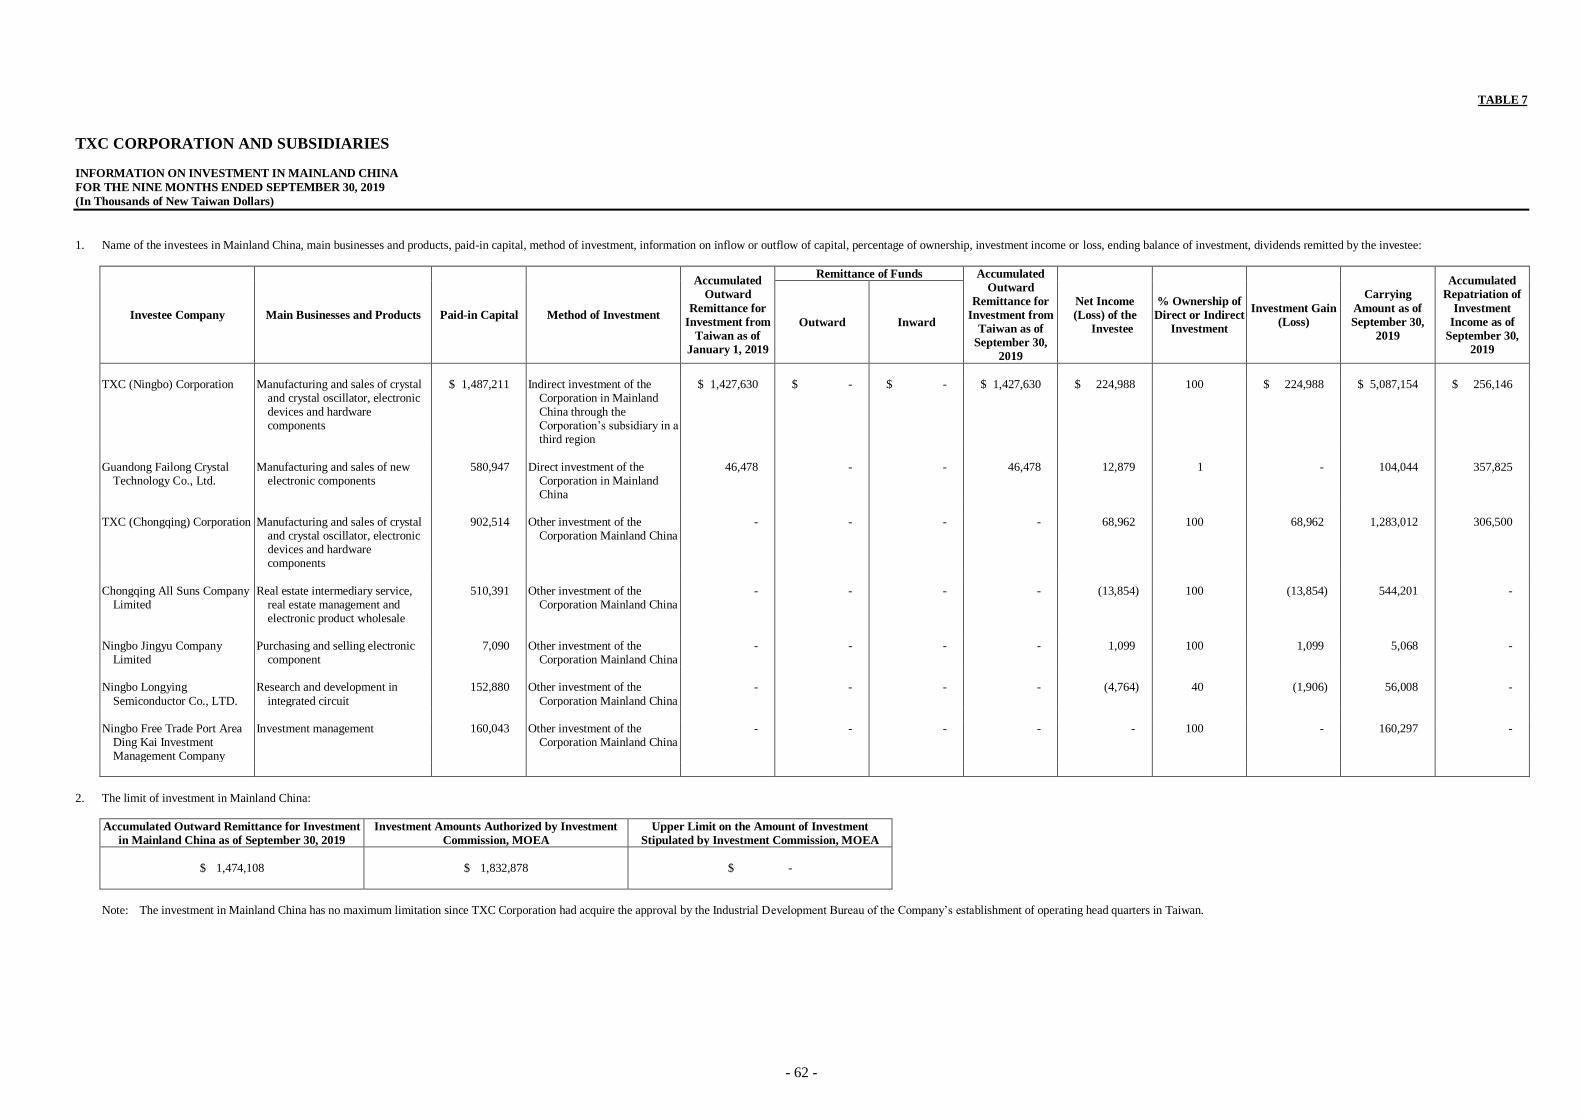
- 62 -
TABLE 7
TXC CORPORATION AND SUBSIDIARIES
INFORMATION ON INVESTMENT IN MAINLAND CHINA
FOR THE NINE MONTHS ENDED SEPTEMBER 30, 2019
(In Thousands of New Taiwan Dollars)
1. Name of the investees in Mainland China, main businesses and products, paid-in capital, method of investment, information on inflow or outflow of capital, percentage of ownership, investment income or loss, ending balance of investment, dividends remitted by the investee:
Investee Company Main Businesses and Products Paid-in Capital Method of Investment
Accumulated
Outward
Remittance for
Investment from
Taiwan as of
January 1, 2019
Remittance of Funds Accumulated
Outward
Remittance for
Investment from
Taiwan as of
September 30,
2019
Net Income
(Loss) of the
Investee
% Ownership of
Direct or Indirect
Investment
Investment Gain
(Loss)
Carrying
Amount as of
September 30,
2019
Accumulated
Repatriation of
Investment
Income as of
September 30,
2019
Outward Inward
TXC (Ningbo) Corporation Manufacturing and sales of crystal
and crystal oscillator, electronic devices and hardware components
$ 1,487,211 Indirect investment of the Corporation in Mainland China through the Corporation’s subsidiary in a third region
$ 1,427,630 $ - $ - $ 1,427,630 $ 224,988 100 $ 224,988 $ 5,087,154 $ 256,146
Guandong Failong Crystal Technology Co., Ltd.
Manufacturing and sales of new electronic components
580,947 Direct investment of the Corporation in Mainland China
46,478 - - 46,478 12,879 1 - 104,044 357,825
TXC (Chongqing) Corporation Manufacturing and sales of crystal
and crystal oscillator, electronic devices and hardware components
902,514 Other investment of the Corporation Mainland China
- - - - 68,962 100 68,962 1,283,012 306,500
Chongqing All Suns Company Limited
Real estate intermediary service, real estate management and electronic product wholesale
510,391 Other investment of the Corporation Mainland China
- - - - (13,854) 100 (13,854) 544,201 -
Ningbo Jingyu Company
Limited Purchasing and selling electronic
component 7,090 Other investment of the
Corporation Mainland China - - - - 1,099 100 1,099 5,068 -
Ningbo Longying
Semiconductor Co., LTD.
Research and development in
integrated circuit
152,880 Other investment of the
Corporation Mainland China
- - - - (4,764) 40 (1,906) 56,008 -
Ningbo Free Trade Port Area
Ding Kai Investment Management Company
Investment management 160,043 Other investment of the Corporation Mainland China
- - - - - 100 - 160,297 -
2. The limit of investment in Mainland China:
Accumulated Outward Remittance for Investment
in Mainland China as of September 30, 2019 Investment Amounts Authorized by Investment
Commission, MOEA Upper Limit on the Amount of Investment
Stipulated by Investment Commission, MOEA
$ 1,474,108 $ 1,832,878 $ -
Note: The investment in Mainland China has no maximum limitation since TXC Corporation had acquire the approval by the Industrial Development Bureau of the Company’s establishment of operating head quarters in Taiwan.
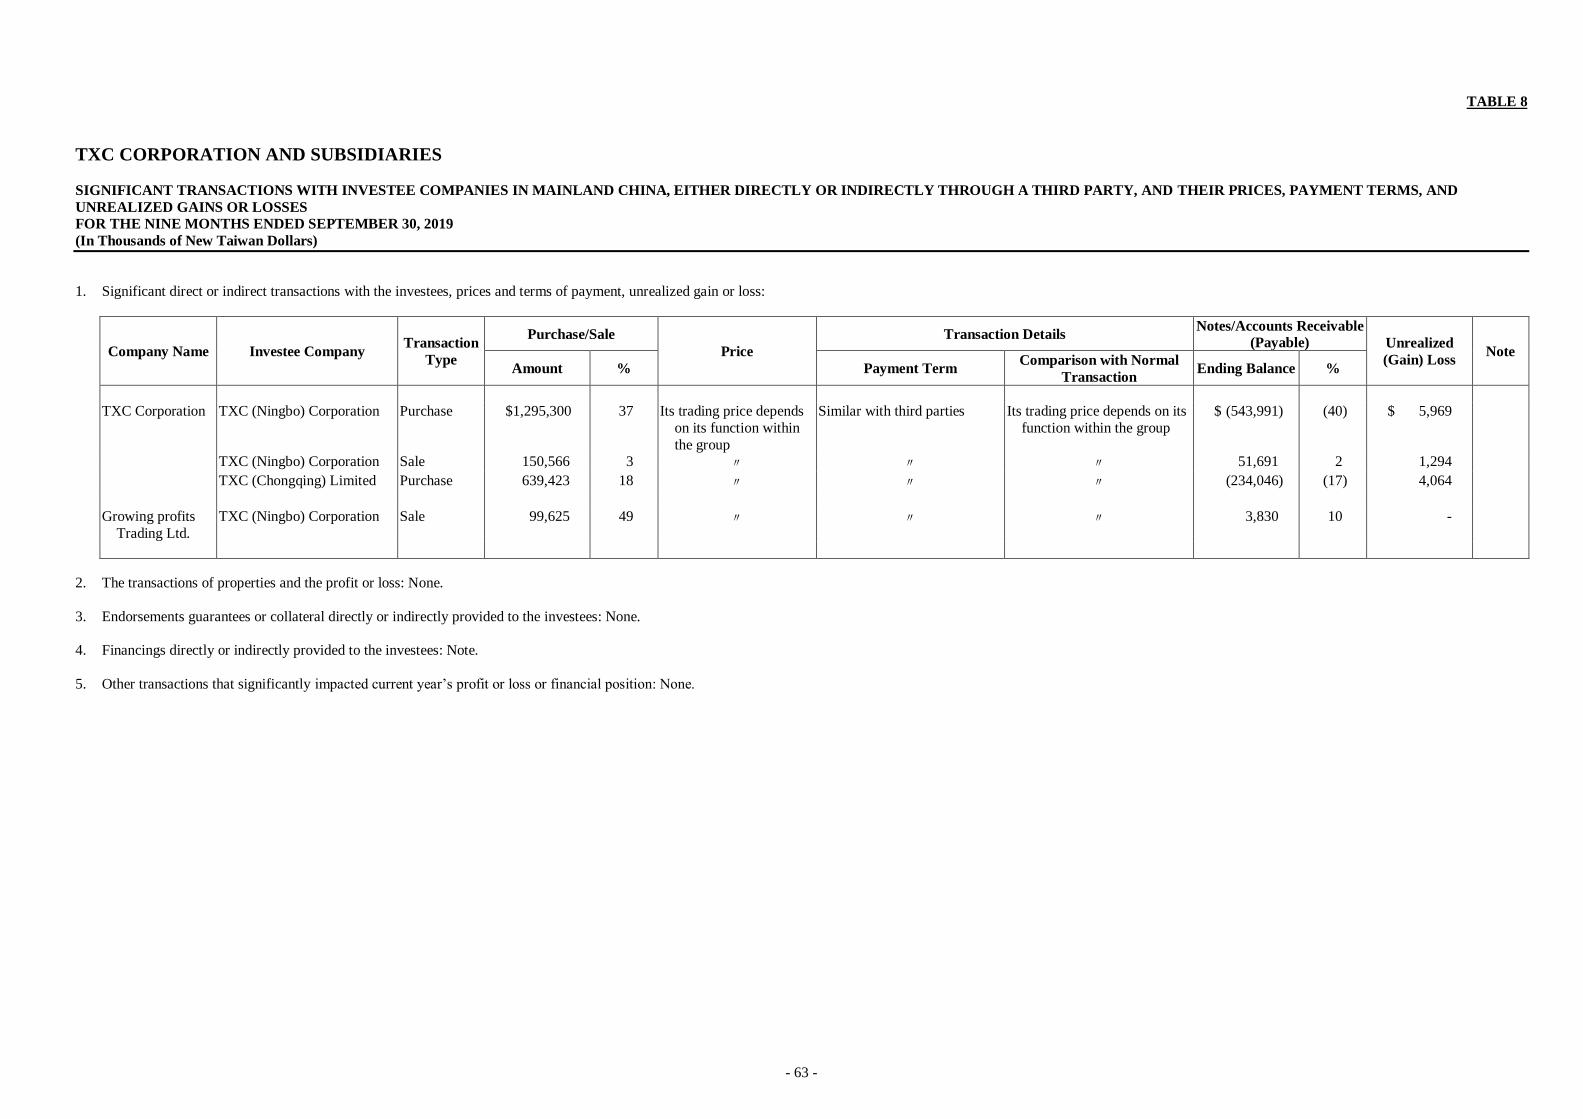
- 63 -
TABLE 8
TXC CORPORATION AND SUBSIDIARIES
SIGNIFICANT TRANSACTIONS WITH INVESTEE COMPANIES IN MAINLAND CHINA, EITHER DIRECTLY OR INDIRECTLY THROUGH A THIRD PARTY, AND THEIR PRICES, PAYMENT TERMS, AND
UNREALIZED GAINS OR LOSSES
FOR THE NINE MONTHS ENDED SEPTEMBER 30, 2019
(In Thousands of New Taiwan Dollars)
1. Significant direct or indirect transactions with the investees, prices and terms of payment, unrealized gain or loss:
Company Name Investee Company Transaction
Type
Purchase/Sale
Price
Transaction Details Notes/Accounts Receivable
(Payable) Unrealized
(Gain) Loss Note
Amount % Payment Term Comparison with Normal
Transaction Ending Balance %
TXC Corporation TXC (Ningbo) Corporation Purchase $1,295,300 37 Its trading price depends
on its function within
the group
Similar with third parties Its trading price depends on its
function within the group
$ (543,991) (40) $ 5,969
TXC (Ningbo) Corporation Sale 150,566 3 〃 〃 〃 51,691 2 1,294
TXC (Chongqing) Limited Purchase 639,423 18 〃 〃 〃 (234,046) (17) 4,064
Growing profits
Trading Ltd.
TXC (Ningbo) Corporation Sale 99,625 49 〃 〃 〃 3,830 10 -
2. The transactions of properties and the profit or loss: None.
3. Endorsements guarantees or collateral directly or indirectly provided to the investees: None.
4. Financings directly or indirectly provided to the investees: Note.
5. Other transactions that significantly impacted current year’s profit or loss or financial position: None.
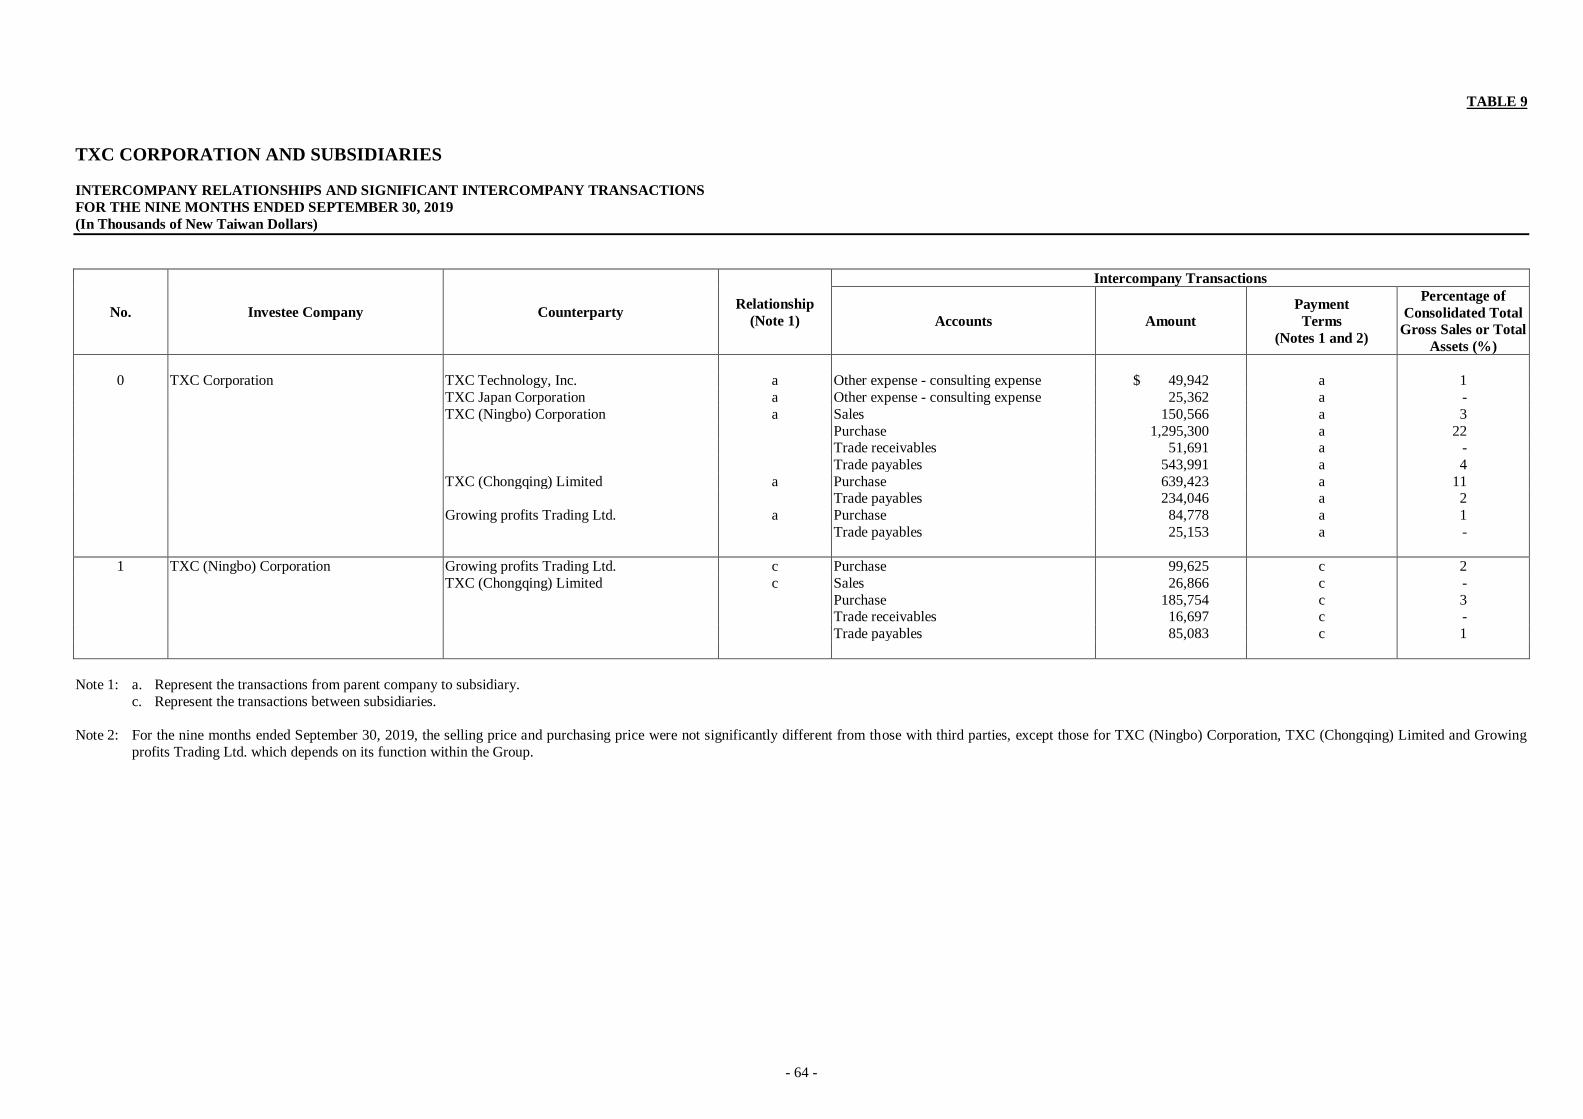
- 64 -
TABLE 9
TXC CORPORATION AND SUBSIDIARIES
INTERCOMPANY RELATIONSHIPS AND SIGNIFICANT INTERCOMPANY TRANSACTIONS
FOR THE NINE MONTHS ENDED SEPTEMBER 30, 2019
(In Thousands of New Taiwan Dollars)
No. Investee Company Counterparty Relationship
(Note 1)
Intercompany Transactions
Accounts Amount
Payment
Terms
(Notes 1 and 2)
Percentage of
Consolidated Total
Gross Sales or Total
Assets (%)
0 TXC Corporation TXC Technology, Inc. a Other expense - consulting expense $ 49,942 a 1
TXC Japan Corporation a Other expense - consulting expense 25,362 a -
TXC (Ningbo) Corporation a Sales 150,566 a 3
Purchase 1,295,300 a 22 Trade receivables 51,691 a -
Trade payables 543,991 a 4
TXC (Chongqing) Limited a Purchase 639,423 a 11 Trade payables 234,046 a 2
Growing profits Trading Ltd. a Purchase 84,778 a 1
Trade payables 25,153 a -
1 TXC (Ningbo) Corporation Growing profits Trading Ltd. c Purchase 99,625 c 2
TXC (Chongqing) Limited c Sales 26,866 c -
Purchase 185,754 c 3 Trade receivables 16,697 c -
Trade payables 85,083 c 1
Note 1: a. Represent the transactions from parent company to subsidiary.
c. Represent the transactions between subsidiaries.
Note 2: For the nine months ended September 30, 2019, the selling price and purchasing price were not significantly different from those with third parties, except those for TXC (Ningbo) Corporation, TXC (Chongqing) Limited and Growing
profits Trading Ltd. which depends on its function within the Group.