Embed Size (px)
Citation preview

drewry.co.uk
Two steps away from liner paradise?
S P O T L I G H T R E P O R T | July 2017
Drewry Maritime Advisors | S P O T L I G H T R E P O R T July 2017
Page 2
© Drewry Shipping Consultants Ltd 2017
Table of Contents
About Drewry Maritime Advisors 3
Introduction 5
An assessment of the fundamentals 5
The six problems preventing carriers from reaching liner paradise: 6
1. Economies of scale 6
2. & 3. Perishability and High operational gearing 6
4. Commoditised service offering 7
5. Fragmented industry 7
6. Inelastic industry demand curve 7
The path to liner paradise 8
Are economies of scale running out? 8
Consolidation creates a stable concentrated market 9
Consolidation creates a stable concentrated market 10
Risks to spoil the party 13
Container handling revolution 13
Consolidation grinds to a halt 14
Excess shipbuilding capacity 14
What happens next… 15
Shippers 15
Lessors 15
Terminals 15
Investors 15
Regulators 15
About the authors 16
Drewry Maritime Advisors | S P O T L I G H T R E P O R T July 2017
Page 3
© Drewry Shipping Consultants Ltd 2017
About Drewry Maritime Advisors
Rigorous analysis, practical advice
Drewry Maritime Advisors provide expert advice to Owners, Operators,
Financial Institutions, Port Authorities, Terminal Operators and Governments
covering the full spectrum of commercial and technical facets across all
maritime and shipping sectors.
Our professionals include a mix of senior executives, industry veterans,
economists and technical experts who between them have a wealth of
practical industry experience.
We provide sector-based expertise from strategic planning, market analysis,
financial modelling and analysis to operational assessment and commercial
due diligence.
Market sectors covered:
Dry bulk shipping
Chemical shipping
Oil tanker shipping
Gas shipping
Ports and terminals
Container shipping
Shipyards
Offshore
Car carriers
Ro-Ro
Areas of expertise include:
Strategic planning and analysis
Operational assessments
Commercial due diligence
Financial modelling and analysis
Investment and divestment
appraisals
Market studies and forecasting
Technical due diligence
Vessel acquisition strategies
Vessel valuations
For further information on our range of sector-based advisory services, email us at [email protected]

Drewry Maritime Advisors | S P O T L I G H T R E P O R T July 2017
Page 4
© Drewry Shipping Consultants Ltd 2017
Two steps away from liner paradise?
S P O T L I G H T R E P O R T
July 2017
Two changes to liner shipping’s fundamentals means that the
industry could finally be on the verge of attaining sustainable
profitability.
Drewry Maritime Advisors | S P O T L I G H T R E P O R T July 2017
Page 5
© Drewry Shipping Consultants Ltd 2017
Introduction
“With useless endeavour Forever, forever, Is Sisyphus rolling His stone up the mountain!”
Henry Wadsworth Longfellow (1807–1882)
Liner profitability follows a familiar pattern: a short period of acceptable results
followed by a return to gloom. Why should an industry that has contributed so
much to the trade-driven prosperity of the modern world be consigned to the
fate of Sisyphus; to roll its stone up the mountain only to stumble just before the
summit and descend once more into the depths below?
An assessment of the fundamentals
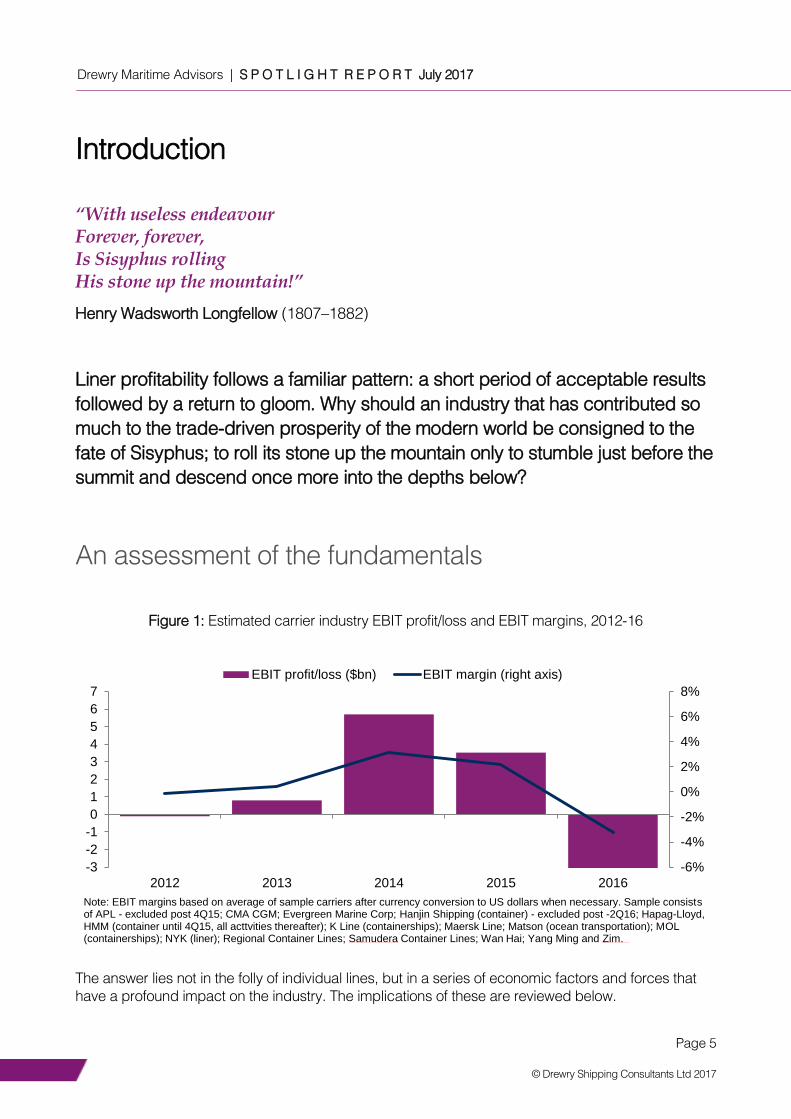
Figure 1: Estimated carrier industry EBIT profit/loss and EBIT margins, 2012-16
The answer lies not in the folly of individual lines, but in a series of economic factors and forces that
have a profound impact on the industry. The implications of these are reviewed below.
-6%
-4%
-2%
0%
2%
4%
6%
8%
-3
-2
-1
0
1
2
3
4
5
6
7
2012 2013 2014 2015 2016
EBIT profit/loss ($bn) EBIT margin (right axis)
Note: EBIT margins based on average of sample carriers after currency conversion to US dollars when necessary. Sample consists of APL - excluded post 4Q15; CMA CGM; Evergreen Marine Corp; Hanjin Shipping (container) - excluded post -2Q16; Hapag-Lloyd, HMM (container until 4Q15, all acttvities thereafter); K Line (containerships); Maersk Line; Matson (ocean transportation); MOL (containerships); NYK (liner); Regional Container Lines; Samudera Container Lines; Wan Hai; Yang Ming and Zim.

Drewry Maritime Advisors | S P O T L I G H T R E P O R T July 2017
Page 6
© Drewry Shipping Consultants Ltd 2017
Table 1: An assessment of the fundamentals driving the market
FACTOR EFFECT COMMENTS
Economies of scale Structural overcapacity Lines always build bigger vessels to exploit economies of scale. This leads to continual overcapacity
Perishability Push for short-run contribution – rate erosion
Unused capacity cannot be stored. Lines cut rates in order to boost utilisation
High operational gearing Push for short-run contribution – rate erosion
Lines’ networks represent a high fixed cost burden. The logical response is to maximise utilisation
Commoditised service offering Limited differentiation of product; price competition
Price is the principal competitive weapon
Fragmented industry No coordination of capacity development, intense competition
Too many carriers and no dominant carriers to establish market stability
Inelastic demand curve Falling rates have a limited effect on demand
Seafreight is a negligible element in the landed cost of manufactured goods and makes no difference to end market demand
The six problems preventing carriers from reaching liner
paradise:
1. Economies of scale
The biggest problem that gets in the way of sustainable carrier profitability is the general acceptance
that to survive carriers must seek economies of scale. This has a very important consequence:
industries that are characterised by economies of scale tend to suffer from structural overcapacity.
The container shipping industry is no exception to the rule and until very recently has been engaged
in an arms-race for ever larger ships. Orders for newbuilds have since ceased, primarily because
there is such an over-supply of ships on the water that carriers are now forced to constantly juggle
their biggest assets from trade-to –trade to prop up utilisation, while an increasing number of smaller
vessels are either being idled or scrapped to facilitate the cascade.
2. & 3. Perishability and High operational gearing
Problem number two is perishability. In common with most service industries, liner shipping cannot
store its product; when a vessel sails, unused capacity goes to waste. This would be less important
without the impact of problem three: high operational gearing. By definition, liner services are
scheduled and regular and an individual sailing forms part of a complex and carefully crafted
network. This has two consequences: first, the vessel cannot be delayed in the hope that additional
cargo will materialise to fill spare capacity; second, by establishing a liner network, the carrier
commits itself to substantial fixed costs. Therefore, once the network is set up, the role of the trade
lane manager is to maximise contribution to these fixed costs.
The combination of perishability and high fixed costs lead to continuous erosion of freight rates when
overcapacity exists. What this means in practice can be illustrated by a short example:
Drewry Maritime Advisors | S P O T L I G H T R E P O R T July 2017
Page 7
© Drewry Shipping Consultants Ltd 2017
A line has 500 TEU of spare capacity on a particular sailing. It is approached by a customer who
offers 100 TEU of cargo for the sailing, provided that a rate reduction of US$ 50/TEU is offered. The
trade lane manager calculates that, after the rate reduction is given, this parcel of cargo will generate
a contribution to fixed costs of US$ 30,000. In these circumstances, the logical action is to reduce the
rate to secure the shipment.
4. Commoditised service offering
Lines work very hard to differentiate themselves, but the reality is that their core product, the point-to-
point move of a container, is now highly commoditised. This commoditisation has been reinforced by
an overall rise in operational standards and the pervasiveness of the large vessel sharing alliances.
The scope for differentiation now lies in the rates offered and the logistics and e-business services
provided by the leading lines, which are often only loosely coupled with the point-to-point move.
5. Fragmented industry
Until the recent wave of carrier M&A (mergers and acquisitions) it was a source of continued surprise
that the supply side of the liner market remained so fragmented with no shortage of competition on
any given trade route.
In such a perfectly competitive market, the seller is a price-taker and can have no individual influence
on the market. It can sell as much as it likes (the demand curve for the individual firm is perfectly
elastic) at the market price, but not above it.
Even in the era of supposedly confidential service contracts, there is a high degree of transparency in
the market. Lines are familiar with each other’s customer base and are often able to discover the
terms of any service contracts or special rate arrangements.
6. Inelastic industry demand curve
The industry is far from perfectly elastic with respect to price; falling freight rates do not stimulate a
counterbalancing rise in demand.
This should come as no surprise; the demand for shipping only arises because of demand for the
goods being shipped and therefore depends primarily on the volume of trade in these goods. The
availability of substitutes (air, sea-air and rail freight for example) has an effect too, but much smaller.
The degree to which the price of shipping can affect the demand for the goods depends largely on
the proportion of total landed costs that it constitutes. For consumer goods on the dominant legs out
of Asia, for example, this is very low.
For these commodities, changes in the freight cost will clearly have no impact on the retail price of the
item in the store. In other words, freight rates can be cut to ribbons with no effect on demand at all;
demand is completely inelastic and the normal price equilibrium mechanism, where demand rises as
price falls, does not work.

Drewry Maritime Advisors | S P O T L I G H T R E P O R T July 2017
Page 8
© Drewry Shipping Consultants Ltd 2017
The path to liner paradise In the environment outlined above, lines will only ever make money when trade volumes grow to such
an extent that total capacity is filled – at least on the dominant legs of trade routes; it is only under
these circumstances that the downward pressure on rates is released. Crucially, in the current market
structure, these circumstances will only ever arise by chance.
However, recent changes to these previously entrenched liner fundamentals are changing the rules of
the game. In Drewry’s opinion, by fixing just two of the six problems - economies of scale and
fragmented industry - carriers can reach the liner paradise of sustainable profitability. There is
evidence that the repair work is being carried out.
Are economies of scale running out?
Last year, Drewry carried out a simulation study of the operational and financial impacts on lines,
terminal operators, ports and other supply chain stakeholders as vessel size increases up to and
beyond 18,000 teu. The study results suggest that the economies of scale in vessel size, that have
been a key feature of the liner industry, may be running out.
Crucially, this would mean that future vessel ordering will no longer be driven by the need to secure
economies of scale but will instead be based on lines’ assessment of future demand growth, leading
eventually to closer harmonisation of supply and demand.
The Drewry study found that scale economies from megaships only work for the total supply chain if
terminals can increase productivity in line with increases in vessel size. Larger vessels place greater
demands on ports, where channels have to cater for deeper draughts and on terminals, which need
to upgrade equipment, yard facilities and manning levels to effectively handle increased peak cargo
volumes.
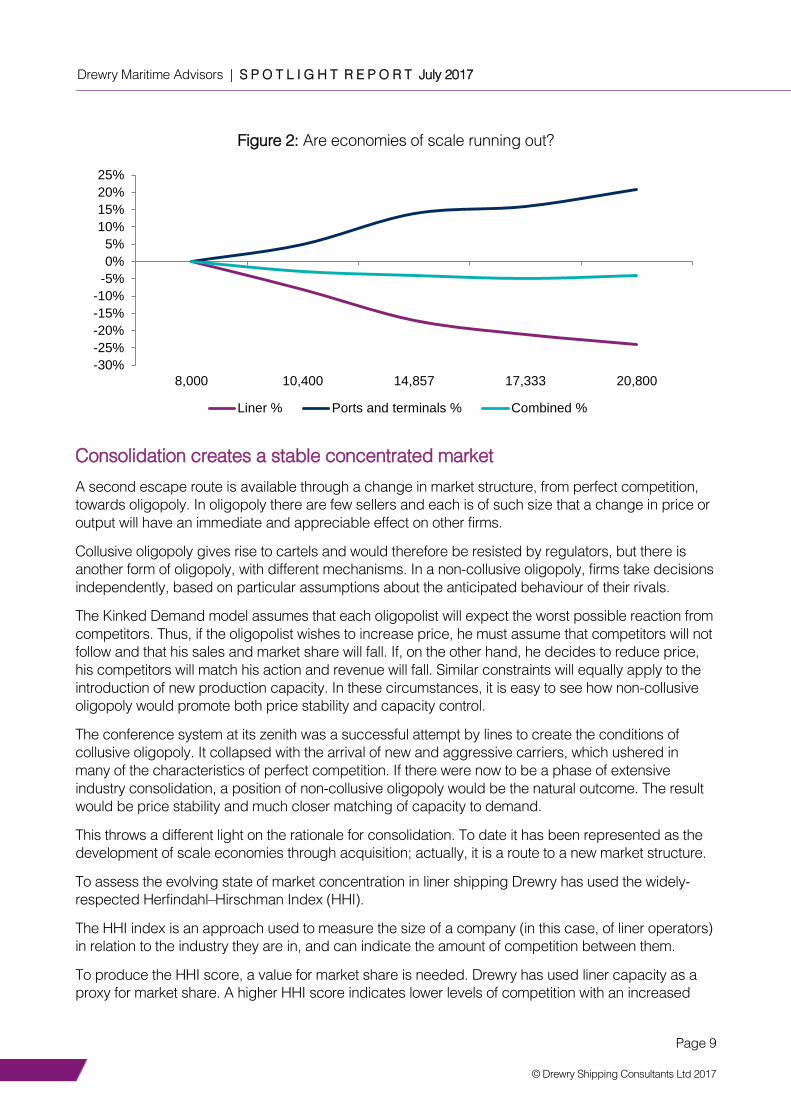
Figure 2 shows the combined shipping line and port ‘total system’ cost savings peak at only 5% of
total network costs and economies of scale diminish as vessel sizes rise beyond 18,000 teu.
The consequence of such a reduction in the scope for further economies of scale will be to reduce the
industry’s propensity for ordering ever larger ships to reduce unit costs ( irrespective of demand
requirements), and generating structural overcapacity, the prime cause of poor and uncertain
profitability.
Drewry Maritime Advisors | S P O T L I G H T R E P O R T July 2017
Page 9
© Drewry Shipping Consultants Ltd 2017
Figure 2: Are economies of scale running out?
Consolidation creates a stable concentrated market
A second escape route is available through a change in market structure, from perfect competition,
towards oligopoly. In oligopoly there are few sellers and each is of such size that a change in price or
output will have an immediate and appreciable effect on other firms.
Collusive oligopoly gives rise to cartels and would therefore be resisted by regulators, but there is
another form of oligopoly, with different mechanisms. In a non-collusive oligopoly, firms take decisions
independently, based on particular assumptions about the anticipated behaviour of their rivals.
The Kinked Demand model assumes that each oligopolist will expect the worst possible reaction from
competitors. Thus, if the oligopolist wishes to increase price, he must assume that competitors will not
follow and that his sales and market share will fall. If, on the other hand, he decides to reduce price,
his competitors will match his action and revenue will fall. Similar constraints will equally apply to the
introduction of new production capacity. In these circumstances, it is easy to see how non-collusive
oligopoly would promote both price stability and capacity control.
The conference system at its zenith was a successful attempt by lines to create the conditions of
collusive oligopoly. It collapsed with the arrival of new and aggressive carriers, which ushered in
many of the characteristics of perfect competition. If there were now to be a phase of extensive
industry consolidation, a position of non-collusive oligopoly would be the natural outcome. The result
would be price stability and much closer matching of capacity to demand.
This throws a different light on the rationale for consolidation. To date it has been represented as the
development of scale economies through acquisition; actually, it is a route to a new market structure.
To assess the evolving state of market concentration in liner shipping Drewry has used the widely-
respected Herfindahl–Hirschman Index (HHI).
The HHI index is an approach used to measure the size of a company (in this case, of liner operators)
in relation to the industry they are in, and can indicate the amount of competition between them.
To produce the HHI score, a value for market share is needed. Drewry has used liner capacity as a
proxy for market share. A higher HHI score indicates lower levels of competition with an increased
-30%
-25%
-20%
-15%
-10%
-5%
0%
5%
10%
15%
20%
25%
8,000 10,400 14,857 17,333 20,800
Liner % Ports and terminals % Combined %

Drewry Maritime Advisors | S P O T L I G H T R E P O R T July 2017
Page 10
© Drewry Shipping Consultants Ltd 2017
market power; a low HHI score indicates high levels of competition, high levels of fragmentation and
less market power.
Consolidation is creating a more concentrated and stable market
Figure 3: HHI Index Assessment: Liner consolidation progress
The good news for carriers is that the industry has embarked on another round on major M&A
(mergers and acquisitions) in the past year or so, following a 10-year hiatus. This has pushed market
concentration up to the high fragmentation boundary. Further concentration beyond present levels will
increase carriers’ ability to manage capacity effectively.
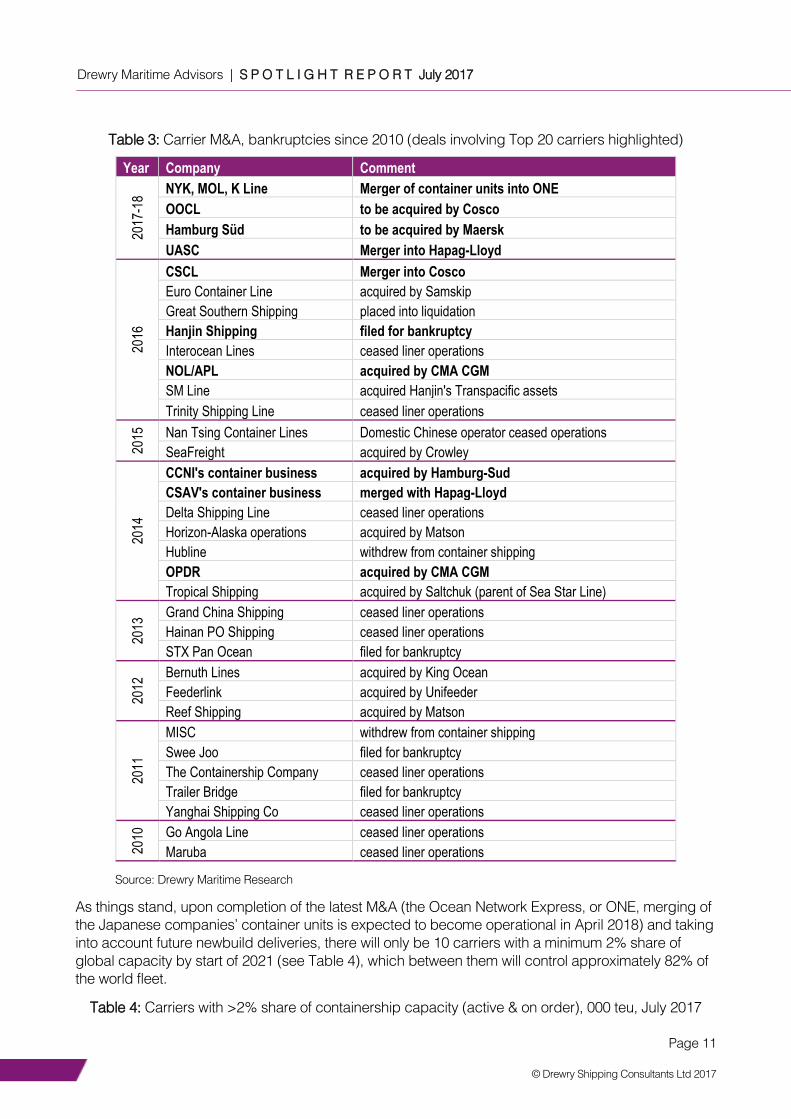
Table 3 presents all of the deals and bankruptcies since 2010. As can be seen the focus of late has
been at the upper end of the carrier rankings, which has far greater impact on industry consolidation.
0.0
0.1
0.2
0.3
0.4
0.5
0.6
0.7
1 2 3 4 5 6 7 8 9 10 11 12 13 14 15 16 17 18 19 20 21
HH
I In
dex
Number of competitors
Liner consolidation (HHI)
Minimum HHI Low fragmentation boundary High fragmentation boundary
Drewry Maritime Advisors | S P O T L I G H T R E P O R T July 2017
Page 11
© Drewry Shipping Consultants Ltd 2017
Table 3: Carrier M&A, bankruptcies since 2010 (deals involving Top 20 carriers highlighted)
Year Company Comment
2017
-18
NYK, MOL, K Line Merger of container units into ONE
OOCL to be acquired by Cosco
Hamburg Süd to be acquired by Maersk
UASC Merger into Hapag-Lloyd
2016
CSCL Merger into Cosco
Euro Container Line acquired by Samskip
Great Southern Shipping placed into liquidation
Hanjin Shipping filed for bankruptcy
Interocean Lines ceased liner operations
NOL/APL acquired by CMA CGM
SM Line acquired Hanjin's Transpacific assets
Trinity Shipping Line ceased liner operations
2015
Nan Tsing Container Lines Domestic Chinese operator ceased operations
SeaFreight acquired by Crowley
2014
CCNI's container business acquired by Hamburg-Sud
CSAV's container business merged with Hapag-Lloyd
Delta Shipping Line ceased liner operations
Horizon-Alaska operations acquired by Matson
Hubline withdrew from container shipping
OPDR acquired by CMA CGM
Tropical Shipping acquired by Saltchuk (parent of Sea Star Line)
2013
Grand China Shipping ceased liner operations
Hainan PO Shipping ceased liner operations
STX Pan Ocean filed for bankruptcy
2012
Bernuth Lines acquired by King Ocean
Feederlink acquired by Unifeeder
Reef Shipping acquired by Matson
2011
MISC withdrew from container shipping
Swee Joo filed for bankruptcy
The Containership Company ceased liner operations
Trailer Bridge filed for bankruptcy
Yanghai Shipping Co ceased liner operations
2010
Go Angola Line ceased liner operations
Maruba ceased liner operations
Source: Drewry Maritime Research
As things stand, upon completion of the latest M&A (the Ocean Network Express, or ONE, merging of
the Japanese companies’ container units is expected to become operational in April 2018) and taking
into account future newbuild deliveries, there will only be 10 carriers with a minimum 2% share of
global capacity by start of 2021 (see Table 4), which between them will control approximately 82% of
the world fleet.
Table 4: Carriers with >2% share of containership capacity (active & on order), 000 teu, July 2017

Drewry Maritime Advisors | S P O T L I G H T R E P O R T July 2017
Page 12
© Drewry Shipping Consultants Ltd 2017
Carrier group Active ships Orderbook Total Share (%)
Maersk Line 3,828 410 4,238 18.4%
MSC 2,916 187 3,104 13.5%
Cosco-OOCL 2,185 698 2,883 12.5%
CMA CGM 2,168 225 2,393 10.4%
Ocean Network Express (ONE) 1,378 340 1,719 7.5%
Hapag-Lloyd 1,533 40 1,573 6.8%
Evergreen 984 324 1,308 5.7%
Yang Ming 596 112 708 3.1%
PIL 358 144 502 2.2%
HMM 458 0 458 2.0%
Zim 308 11 319 1.4%
Wan Hai 235 15 250 1.1%
Notes: Includes all recent M&A deals, including CMA CGM's impending 4Q17 purchase of Mercosul Line from Maersk Line;
Data is subject to change. Source: Drewry Maritime Research
This scenario does not account for any future M&A, but the accelerating trend towards oligopolisation
in container shipping is clear. As Figure 4 highlights, as recently as 2015 there were 17 carriers with
at least a 2% share.
Even within the future Top 10 there is a wide gap between the top 4 carriers (sharing 55% of the world
fleet), the three lines ranked five to seven (20%) and the last three lines (7%). Inevitably, as the gap
between the leading four carriers and everyone else beneath gets wider speculation will mount about
whether the smaller players can keep up and remain cost-competitive, opening up further potential
M&A opportunities to get the industry closer to the magic HHI low-fragmented line.
Figure 4: No. carriers with min 2% share of world containership fleet capacity
Note: *Post M&A and currently scheduled newbuild deliveries. Source: Drewry Maritime Research
If these two developments (falling scale economies returns and industry consolidation) were to
coincide, the pressures arising from structural overcapacity and market structure would greatly
reduce. Sustained liner profitability would no longer be an unattainable dream but a solid reality.
0
2
4
6
8
10
12
14
16
18
20
2005 2006 2007 2008 2009 2010 2011 2012 2013 2014 2015 2016 2017 2018 2021*
Drewry Maritime Advisors | S P O T L I G H T R E P O R T July 2017
Page 13
© Drewry Shipping Consultants Ltd 2017
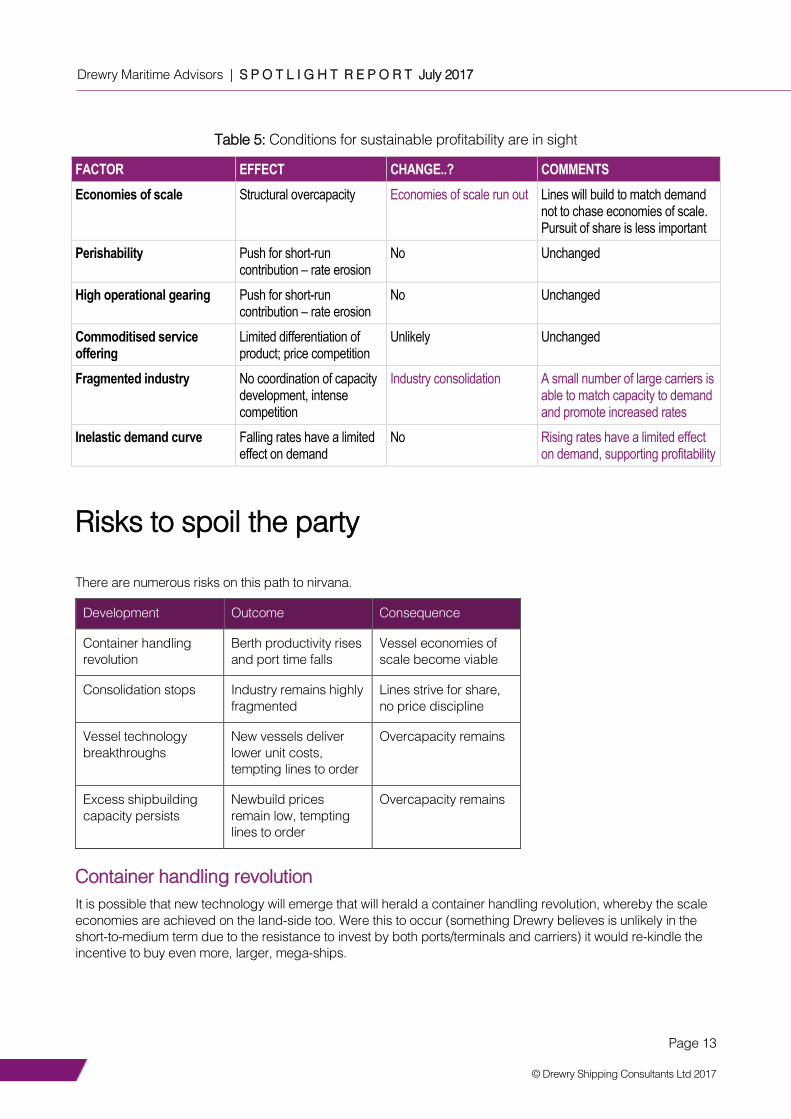
Table 5: Conditions for sustainable profitability are in sight
FACTOR EFFECT CHANGE..? COMMENTS
Economies of scale Structural overcapacity Economies of scale run out Lines will build to match demand not to chase economies of scale. Pursuit of share is less important
Perishability Push for short-run contribution – rate erosion
No Unchanged
High operational gearing Push for short-run contribution – rate erosion
No Unchanged
Commoditised service offering
Limited differentiation of product; price competition
Unlikely Unchanged
Fragmented industry No coordination of capacity development, intense competition
Industry consolidation A small number of large carriers is able to match capacity to demand and promote increased rates
Inelastic demand curve Falling rates have a limited effect on demand
No Rising rates have a limited effect on demand, supporting profitability
Risks to spoil the party
There are numerous risks on this path to nirvana.
Development Outcome Consequence
Container handling
revolution
Berth productivity rises
and port time falls
Vessel economies of
scale become viable
Consolidation stops Industry remains highly
fragmented
Lines strive for share,
no price discipline
Vessel technology
breakthroughs
New vessels deliver
lower unit costs,
tempting lines to order
Overcapacity remains
Excess shipbuilding
capacity persists
Newbuild prices
remain low, tempting
lines to order
Overcapacity remains
Container handling revolution
It is possible that new technology will emerge that will herald a container handling revolution, whereby the scale
economies are achieved on the land-side too. Were this to occur (something Drewry believes is unlikely in the
short-to-medium term due to the resistance to invest by both ports/terminals and carriers) it would re-kindle the
incentive to buy even more, larger, mega-ships.

Drewry Maritime Advisors | S P O T L I G H T R E P O R T July 2017
Page 14
© Drewry Shipping Consultants Ltd 2017
Consolidation grinds to a halt
Shippers are getting used to consolidation in the container industry. That doesn’t mean they have to like it. As
their pool of carriers shrinks they are more likely to lobby competition regulators to step in. Recent container
M&A such as Maersk Line’s takeover of Hamburg Süd and the proposed ONE merger of Japanese carriers have
encountered minor regulatory issues so any future deals may have to contend with conditions being applied that
make them less attractive to conclude. The onus will be on carriers to disprove any form of collusive oligopoly is
occurring.
The $6.3 billion sale of OOIL/OOCL to Cosco means there aren’t many other really attractive takeover candidates
left on the shelf. OOIL and its container unit OOCL have a good track record for above-average profits in a
challenging market and a reputation for being a very well-run company, earning the moniker “The Perfect Bride”
by Drewry Maritime Financial Research. The same cannot be said for any other target line. This was reflected in
the substantial price-to-book premium of 1.4x, which is a fair bit above OOIL’s historical average P/B of 0.8x.
Takeover-hungry carriers might find more resistance as the pressure to sell will be lower now that the industry is
expected to return to profit from 2Q17 onwards, which could force any purchaser to pay above market value.
Additionally, while the number of global carriers with scale is contracting and those that remain have locked-
down big trades such as Asia-Europe, there still remain a lot of smaller operators in other routes. With cheap
steel, low charter rates and rising freight rates the barriers to entry for new players are low. For example, new
entrant SM Line emerged out of the ashes of Hanjin in the Transpacific trade so as one carrier went another
stepped in, at least in one corridor. This means the level of fragmentation will always vary from trade to trade.
Another potential barrier is the high-degree of state involvement in liner shipping that can see decisions made for
other reasons than purely commercial. Governments often see shipping lines as strategic assets and have in the
past been less inclined to sell or wind down failing companies.
Excess shipbuilding capacity
At present nobody is ordering vessels, of any type, and pretty soon yards across the world will find themselves
with little to keep them occupied. The vulnerable position of shipyards has given containership operator-owners
a window of opportunity to smooth out the delivery of the newbuilds to which they are committed and to
massage the supply/demand balance more in their favour. Maersk Line and CMA CGM are two carriers that
have pushed back deliveries from this year into 2018.
However, with governments (particularly South Korea) taking measures to save the shipbuilding industry there is
a risk that shipowners will be tempted by heavy discounts to make orders the industry doesn’t need. That could
be what two state-backed carriers with publically announced expansion plans, IRISL and HMM, are waiting for.
The path to liner paradise is clearly laid out for carriers but for it to happen they must ensure that they continue to
consolidate and avoid the temptation to add to the over-capacity burden.

Drewry Maritime Advisors | S P O T L I G H T R E P O R T July 2017
Page 15
© Drewry Shipping Consultants Ltd 2017
What happens next… How will we know whether or not our hypothesis is right? Here are a few leading indicators:
The LOA of the largest newbuild vessels does not exceed 400 metres;
Berth productivity in leading terminals stays at around 150 moves per hour;
There is further consolidation among global container shipping lines.
If we see these indicators, we will know that liner paradise is in sight. When it is reached, there will be important
implications for many stakeholders.
Shippers
The first impact will be on shippers who will have to pay freight rates that generate a reasonable return on equity
to the lines; we can easily imagine rates being 50% more than they are now. For most shippers this will be
irritating rather than damaging; seafreight constitutes a small proportion of total delivered costs for most
headhaul cargo. Shippers will also (they are experiencing this already) have a smaller pool of carriers to choose
from.
While these two outcomes will doubtless cause anxiety, there may be a silver lining in the form of reduced rate
volatility.
Lessors
The container and vessel leasing industries have been, on the whole, beneficiaries of lines’ erratic profitability,
allowing lines to grow and to achieve economies of scale by leasing both vessels and containers. If lines’
balance sheets become stronger, they may decide to finance growth from their own resources and reduce
scope for leasing companies.
Terminals
Terminals are already grappling with the new concentrated alliance structure and consolidation among lines and
with the operational difficulties of handling ultra-large containerships. While further concentration of carrier
buying power is a challenge that needs to be addressed (consolidation and alliances among terminals is a
possible response) the end of vessel upsizing would be a considerable relief.
Investors
As we head towards sustainable profitability, market caps will rise and debt yields will drop. Equity price volatility
will be driven more by the macro economy and less by the historical vagaries of the liner industry.
Regulators
In a fragmented market of poor profitability, the regulator’s job is relatively easy: looking out for blatant collusion
on price. In the more concentrated market that is emerging where a non-collusive oligopoly could arise,
regulators will be under pressure from shipper bodies to increase scrutiny to ensure that increased market
power is not abused.
The truth is that, if all this happens, liner shipping will become more like a normal industry and one that can earn
a fair return for providing the infrastructure that enables so much of world trade. That seems fair to us.

Drewry Maritime Advisors | S P O T L I G H T R E P O R T July 2017
Page 16
© Drewry Shipping Consultants Ltd 2017
About the authors
Tim Power
Managing Director, Head of
Drewry Maritime Advisors
Simon Heaney
Senior Manager, Drewry Supply
Chains Research
Tim is Managing Director of Drewry, responsible for
the implementation of company strategy and the
operational Head of Maritime Advisors. He has more
than 33 years’ strategic and operational experience in
shipping, ports and supply chain management.
A principal author of Drewry’s popular weekly update
on the container shipping sector, Container Insight
Weekly. Simon has nearly two decades experience
covering the container shipping market and works
within Drewry’s Container Research division.

drewry.co.uk
For further information on our range of sector-based advisory and research services, email us at [email protected] The primary source of independent market insight, analysis and advice - trusted by a global audience of maritime and shipping industry stakeholders.
UK 15-17 Christopher Street London EC2A 2BS United Kingdom
India 4th Floor, Tower C Pioneer Urban Square Sector 62, Gurugram Haryana122002 India
Singapore #13-02 Tower Fifteen 15 Hoe Chiang Road Singapore 089316
China Unit D01 Level 10 Shinmay Union Square Tower 2 506 Shangcheng Road Pudong, Shanghai China, 200120
T +44 20 7538 0191 T +91 124 497 4979 T +65 6220 9890 T +86 (0) 21 5081 0508


![CWS ParadiseLine. · 2019-04-02 · 12 ] Paradise Air Bar 13 ] Paradise Seatcleaner 14 ] Paradise Toiletpaper 15 ] Paradise Superroll 16 ] Paradise Paper Bin 17 ] Paradise Ladycare](https://img.pdfslide.us/doc/110x75/5f4d115eb47f9811753b5af9/cws-2019-04-02-12-paradise-air-bar-13-paradise-seatcleaner-14-paradise.jpg)