Embed Size (px)
Citation preview
Twin Cities Ramp MeterEvaluation
executivesummary
prepared for
Minnesota Department of TransportationPursuant to Laws 2000: Chapter 479, HF2891
prepared by
Cambridge Systematics, Inc.
with
SRF Consulting Group, Inc.N.K. Friedrichs Consulting, Inc.
February 1, 2001
executive summary
Twin Cities Ramp Meter Evaluation
prepared for
Minnesota Department of TransportationPursuant to Laws 2000: Chapter 479, HF2891
prepared by
Cambridge Systematics, Inc.1300 Clay Street, Suite 1010Oakland, California 94612
February 1, 2001

Twin Cities Ramp Meter Evaluation – Executive Summary
Cambridge Systematics, Inc. ES-1
Executive Summary
The Minnesota Department of Transportation (Mn/DOT) uses ramp meters to managefreeway access on approximately 210 miles of freeways in the Twin Cities metropolitanarea. Mn/DOT first tested ramp meters in 1969 as a method to optimize freeway safetyand efficiency in the metro area. Since then, approximately 430 ramp meters have beeninstalled and used to help merge traffic onto freeways and to manage the flow of trafficthrough bottlenecks.
While ramp meters have a long history of use by Mn/DOT as a traffic management strat-egy, some members of the public have recently questioned the effectiveness of the strat-egy. A bill passed in the Year 2000 session by the Minnesota Legislature requiredMn/DOT to study the effectiveness of ramp meters in the Twin Cities Region by con-ducting a shutdown study before the next legislative session [Laws 2000: Chapter 479,HF2891].
In response to the Legislative mandate, Mn/DOT formed two committees to represent thepublic and ensure the credibility and objectivity of the study, including the Advisory andTechnical Committees. The two committees provided policy oversight and input into theconsultant selection process, the proposed study work plan, measures of effectiveness,and evaluation measures. The committees also provided technical guidance, expertise,and quality control throughout the conduct of the study.
The study occurred in the fall of 2000, with the results presented to the Legislature and thepublic in early 2001. The goal of the study was to evaluate and report any relevant facts,comparisons, or statistics concerning traffic flow and safety impacts associated with deac-tivating system ramp meters for a predetermined amount of time. This study was com-pleted at a cost of $651,600.
The study was conducted by a team of consultants led by Cambridge Systematics, Inc.(CS). Joining Cambridge Systematics on the evaluation team were SRF Consulting Group,N.K. Friedrichs Consulting, and a panel of nationally-recognized experts in the field oframp metering and transportation evaluations. The panel members included Dolf Mayfrom the University of California, Tim Lomax from the Texas Transportation Institute, andHoward Preston from Howard R. Green Company.
This document presents the Executive Summary developed for the study by the CS teamwith significant input from the Technical and Advisory Committees. This summary pres-ents the evaluation conclusions, supporting evaluation findings, and recommendations.Two separate documents (the Final Report and the Appendix to the Final Report) presentadditional detail on the evaluation objectives and performance measures, evaluationmethodologies, field evaluation results, traveler perceptions, benefit/cost analysis, andsecondary research.

Twin Cities Ramp Meter Evaluation – Executive Summary
ES-2 Cambridge Systematics, Inc.
���� Evaluation Methodology
The goals of the evaluation of ramp meter effectiveness in the Twin Cities included:
• The determination of whether the benefits of ramp metering outweigh the impacts andassociated costs;
• The identification of other ramp metering impacts on surface streets and transit operations;
• The assessment of public attitudes toward ramp metering; and
• A comparison of the Twin Cities’ system against ramp meter systems in other regions.
For each of the broad evaluation goals, several detailed objectives and performance meas-ures were identified for the evaluation, including:
• Travel time;
• Reliability of travel time;
• Traffic volume and throughput;
• Crashes; and
• Transit operations.
Appropriate data were collected relating to each of these measures to provide the oppor-tunity for assessment against the evaluation objectives and goals. The measures of effec-tiveness were focused on the incremental change observed between the two evaluationscenarios – “with” (meters on) and “without” (meters off). The evaluation measures werealso designed to be “neutral” and not pre-suppose any outcome of the ramp meter test.
Data related to the measures of effectiveness were collected during two periods in the fallof year 2000. Data collected during the first period were used to assess the baseline or“with ramp meters” scenario. In this scenario, the ramp meters were operated accordingto established Mn/DOT practices. These data were used to establish a baseline for thepurpose of identifying the incremental change occurring in the “without ramp meters”scenario.
Data collected during a second period were used to evaluate the “without ramp meters”scenario. In this scenario, all ramp meters were deactivated system-wide. The deacti-vated ramp meters were set to “flashing yellow” mode – consistent with their normaloperation during off-peak periods. It is important to note that although the rampmetering system was effectively shut down, all other congestion management systemcapabilities were fully operational during the “without meters” period, including trafficsurveillance and detection, incident management, and traveler information (variable mes-sage signs).
Although all ramp meters throughout the system were deactivated during the test, thedata collection effort was focused on four selected corridors, which included sections of

Twin Cities Ramp Meter Evaluation – Executive Summary
Cambridge Systematics, Inc. ES-3
I-494, I-94, I-35W, and I-35E. These corridors were selected as representative of other cor-ridors throughout the metropolitan region. In addition to the freeway corridors them-selves, several parallel arterials were also identified to provide data on surface streetconditions during the “with” and “without” scenarios. The four corridors selected for thestudy are shown in Figure ES.1. Other system-wide data were collected during thisperiod to allow for the normalization of data collected in the selected corridors.
Figure ES.1 Twin Cities Corridors Selected for Detailed Evaluation
In parallel with the field traffic data collection, a series of market research studies wereconducted. This effort included both focus groups and surveys conducted during boththe “with” and “without” scenarios.
Data collection occurred over a five-week period during both the “with” and “without”scenarios. “With ramp meter” data collection occurred between September 11th (followingthe Labor Day holiday and the return of normal fall business and school activity) andOctober 15th, 2000. The ramp meters were deactivated from October 16th throughDecember 8th, thereby enabling data collection to conclude prior to the onset of the
Twin Cities Ramp Meter Evaluation – Executive Summary
ES-4 Cambridge Systematics, Inc.
Holiday shopping season. Traffic data were not collected during the first week followingdeactivation to allow traffic patterns to adjust to the change.
Following the conclusion of the “without” scenario test, data analysis was conducted toisolate the incremental impact observed between the two scenarios. These incrementalimpacts were then extrapolated and combined with other data to support the region-wideanalysis of ramp meter effectiveness.
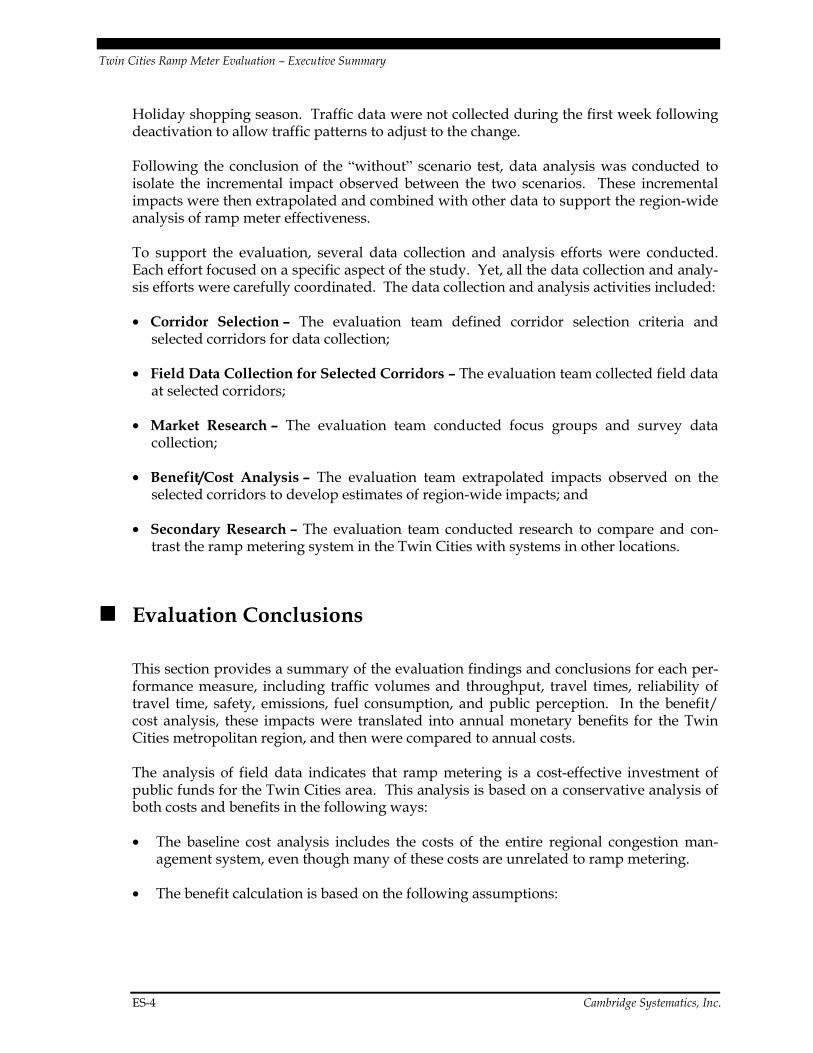
To support the evaluation, several data collection and analysis efforts were conducted.Each effort focused on a specific aspect of the study. Yet, all the data collection and analy-sis efforts were carefully coordinated. The data collection and analysis activities included:
• Corridor Selection – The evaluation team defined corridor selection criteria andselected corridors for data collection;
• Field Data Collection for Selected Corridors – The evaluation team collected field dataat selected corridors;
• Market Research – The evaluation team conducted focus groups and survey datacollection;
• Benefit/Cost Analysis – The evaluation team extrapolated impacts observed on theselected corridors to develop estimates of region-wide impacts; and
• Secondary Research – The evaluation team conducted research to compare and con-trast the ramp metering system in the Twin Cities with systems in other locations.
���� Evaluation Conclusions
This section provides a summary of the evaluation findings and conclusions for each per-formance measure, including traffic volumes and throughput, travel times, reliability oftravel time, safety, emissions, fuel consumption, and public perception. In the benefit/cost analysis, these impacts were translated into annual monetary benefits for the TwinCities metropolitan region, and then were compared to annual costs.
The analysis of field data indicates that ramp metering is a cost-effective investment ofpublic funds for the Twin Cities area. This analysis is based on a conservative analysis ofboth costs and benefits in the following ways:
• The baseline cost analysis includes the costs of the entire regional congestion man-agement system, even though many of these costs are unrelated to ramp metering.
• The benefit calculation is based on the following assumptions:

Twin Cities Ramp Meter Evaluation – Executive Summary
Cambridge Systematics, Inc. ES-5
− The value of time lost in unexpected delay (i.e., reliability of travel time) is valuedthe same as routine travel time, even though the literature suggests it could be val-ued three times higher;
− The impact of delays on long trips originating beyond the test corridors is notcaptured; and
− The impact of more erratic acceleration/deceleration on freeways resulting fromslower speeds, more congestion, and less predictable traffic conditions is not cap-tured in the analysis of fuel consumption and emissions.
A summary of the annual benefits of ramp metering is provided as follows:
• Traffic Volumes and Throughput: After the meters were turned off, there was anaverage nine percent traffic volume reduction on freeways and no significant trafficvolume change on parallel arterials included in the study. Also, during peak trafficconditions, freeway mainline throughput declined by an average of 14 percent in the“without meters” condition.
• Travel Time: Without meters, the decline in travel speeds on freeway facilities morethan offsets the elimination of ramp delays. This results in annual systemwide savingsof 25,121 hours of travel time with meters.
• Travel Time Reliability: Without ramp metering, freeway travel time is almost twiceas unpredictable as with ramp metering. The ramp metering system produces anannual reduction of 2.6 million hours of unexpected delay.
• Safety: In the absence of metering and after accounting for seasonal variations, peak-period crashes on previously metered freeways and ramps increased by 26 percent.Ramp metering results in annual savings of 1,041 crashes or approximately fourcrashes per day.
• Emissions: Ramp metering results in a net annual savings of 1,160 tons of emissions.
• Fuel Consumption: Ramp metering results in an annual increase of 5.5 million gallonsof fuel consumed. This was the only criteria category which was worsened by rampmetering.
• Benefit/Cost Analysis: Ramp metering results in annual savings of approximately$40 million to the Twin Cities traveling public. The benefits of ramp metering out-weigh the costs by a significant margin and result in a net benefit of $32 to $37 millionper year. The benefit/cost ratio indicates that benefits are approximately five timesgreater than the cost of entire congestion management system and over 15 timesgreater than the cost of the ramp metering system alone.
Traffic Volumes and Throughput
After the meters were turned off, the evaluation team observed an average nine percenttraffic volume reduction on freeways. No significant traffic volume change was observed

Twin Cities Ramp Meter Evaluation – Executive Summary
ES-6 Cambridge Systematics, Inc.
on the parallel arterials which were studied by the evaluation team. There was somediversion to other time periods and no significant diversion to transit. The reduced free-way traffic volume most likely was diverted to earlier or later time periods and to localstreets not under observation by the evaluation team. Figure ES.2 shows an example offreeway traffic volume reduction along with evidence of travel starting earlier in the peakperiod after the meters were turned off. Figure ES.3 shows another example of freewaytraffic volume reduction along with small changes in parallel arterial traffic volumes.
During peak traffic conditions, freeway mainline throughput (measured by vehicle milestraveled) declined by an average of 14 percent in the meters-off condition. This declinewas partially due to degradation in the freeway mainline speed in the absence of rampmetering (i.e., with higher speeds, more vehicles are able to travel in the same freewaysegment during a given amount of time). The throughput decline is also due to theabsence of ramp metering, which makes for smoother traffic flow on the freeway mainlinewith less speed variability and better merging of ramp traffic – thus improving the practi-cal capacity of the mainline.
Figure ES.2 I-94 Eastbound Afternoon – Example of Freeway Traffic VolumeReduction and Earlier Departures
0
200
400
600
800
1,000
1,200
1,400
1,600
1,800
2:00
PM
2:30
PM
3:00
PM
3:30
PM
4:00
PM
4:30
PM
5:00
PM
5:30
PM
6:00
PM
6:30
PM
7:00
PM
7:30
PM
Time
Tra
ffic
Vol
um
e - V
ehic
les
Per
Hou
r P
er L
ane
With Ramp MeteringWithout Ramp Metering
Travel Time
With meters on, the evaluation team observed a 2.3 minute average per vehicle wait atmetered on-ramps during the peak period. On average, in the absence of metering, free-way speeds decreased by approximately seven miles per hour in the peak period and by
Earlier Departures

Twin Cities Ramp Meter Evaluation – Executive Summary
Cambridge Systematics, Inc. ES-7
Figure ES.3 I-35E Southbound Morning – Example of Traffic Volume Reduction
AverageVolumes I-35E Rice Edgerton
With Ramp 14,552 1,652 1,395Metering
Without 12,140 1,538 1,742RampMetering
18 miles per hour during the peak hour. This corresponds to an increase of freeway traveltime of 22 percent (2.5 minutes per vehicle) during the peak period on the tested corridorsegments (which averaged about nine miles in length and about 12 minutes of traveltime). In the without meters condition, the wait at on-ramps was essentially eliminated.However, the decline in freeway speed more than outweighed the gain in travel timerealized by the elimination of ramp queues. It should also be noted that the increase inoverall regional travel time was actually longer than indicated by this analysis, because:
• Not all travelers encountered meters and hence experienced a reduction in travel timedue to their absence. Based on the market research data, only 54 percent of peakperiod travelers in the test corridors routinely encounter an operational (red/green)ramp meter during their commute. The other 46 percent experience flashing yellowmeters, no meters (because their trips originate outside of the meter system), or use theHOV bypass lanes.
• Many travelers have trips longer than the nine-mile corridor test segments and wouldthus have experienced a longer absolute increase in travel time than the 2.5 minutesindicated by the test travel time runs. Again based on the market research data, theaverage freeway trip length in the test corridors ranged from 20 to 24 minutes, or morethan twice as long as the test corridor trips. Therefore, the average commuter wouldexperience an increase in travel time of at least five minutes.

Twin Cities Ramp Meter Evaluation – Executive Summary
ES-8 Cambridge Systematics, Inc.
In addition to the increase in travel times observed on the test corridors during the “with-out meters” period, significant increases in congestion were reported on some non-metered freeways outside of the corridors observed by the evaluation team. This findingis consistent with the travel survey data in which travelers reported that traffic conditionsworsened furthest from the urban core. Also, isolated reports were received regardingchanges in arterial travel times and speeds (both positive and negative); however, no sta-tistically significant impacts were observed for the arterials included in the data collectioneffort. These reported impacts on non-metered freeways and arterials were not includedin the accounting of benefits presented in this report.
Figure ES.4 shows an example of reduced freeway travel speeds and increased speed vari-ability in the absence of metering. The solid lines represent the average travel speed; thedashed lines represent the typical range of observed travel speeds.
Figure ES.4 I-494 Southbound Morning Speed – Example of Reduced FreewaySpeed and Increased Speed Variability
0
10
20
30
40
50
60
70
80
WeaverLk
Fish LkInterchg
Fish Lk Bass Lk 49th Rockford TH-55 CR-6 Carlsononramp
GleasonLk
CarlsonTowers
Segment
Sp
eed
(mp
h)
Average SpeedBefore = 54.1 mphAfter = 42.7 mphSpeed RangeBefore = +/- 8.9 mphAfter = +/- 16.3 mph
LEGEND-------- With Ramp Metering-------- Without Ramp
Travel Time Reliability
Travel time reliability is a measure of the expected range in travel time and provides aquantitative measure of the predictability of travel time. Reliability of travel time is a sig-nificant benefit to travelers as individuals are better able to predict their travel times and,therefore, budget less time for the trip. While the travel time performance measure pre-sented above quantifies changes in travel time on average or “normal” travel days, traveltime reliability is a more appropriate quantification of the unexpected non-recurringdelays that occur due to incidents, special events, bad weather, or excessive congestion.Being on time for day care, a meeting, a flight, or a delivery are typical examples of com-muter expectations for reliable travel time.
Twin Cities Ramp Meter Evaluation – Executive Summary
Cambridge Systematics, Inc. ES-9
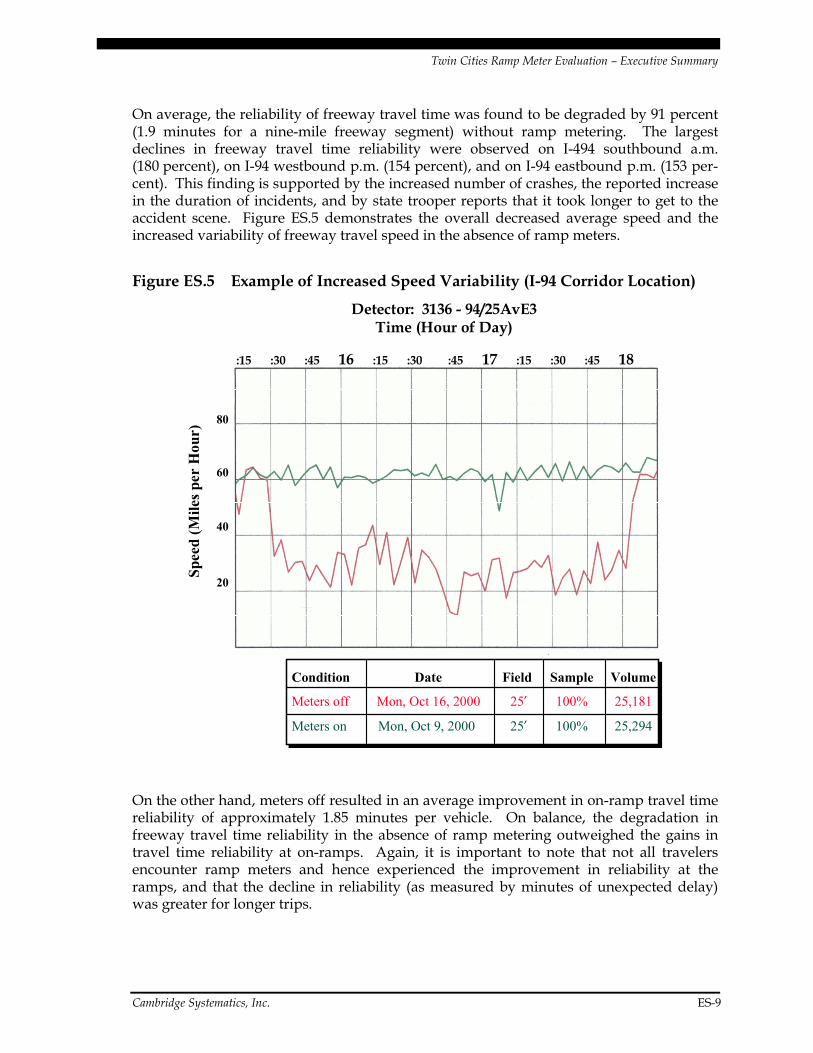
On average, the reliability of freeway travel time was found to be degraded by 91 percent(1.9 minutes for a nine-mile freeway segment) without ramp metering. The largestdeclines in freeway travel time reliability were observed on I-494 southbound a.m.(180 percent), on I-94 westbound p.m. (154 percent), and on I-94 eastbound p.m. (153 per-cent). This finding is supported by the increased number of crashes, the reported increasein the duration of incidents, and by state trooper reports that it took longer to get to theaccident scene. Figure ES.5 demonstrates the overall decreased average speed and theincreased variability of freeway travel speed in the absence of ramp meters.
Figure ES.5 Example of Increased Speed Variability (I-94 Corridor Location)
Detector: 3136 - 94/25AvE3Time (Hour of Day)
:15 :30 :45 16 :15 :30 :45 17 :15 :30 :45 18
80
60
40
20
Spee
d (M
iles p
er H
our)
Condition Date Field Sample Volume
Meters off Mon, Oct 16, 2000 25’ 100% 25,181
Meters on Mon, Oct 9, 2000 25’ 100% 25,294
On the other hand, meters off resulted in an average improvement in on-ramp travel timereliability of approximately 1.85 minutes per vehicle. On balance, the degradation infreeway travel time reliability in the absence of ramp metering outweighed the gains intravel time reliability at on-ramps. Again, it is important to note that not all travelersencounter ramp meters and hence experienced the improvement in reliability at theramps, and that the decline in reliability (as measured by minutes of unexpected delay)was greater for longer trips.

Twin Cities Ramp Meter Evaluation – Executive Summary
ES-10 Cambridge Systematics, Inc.
Safety
In the absence of metering and after accounting for seasonal variations, peak-periodcrashes on metered freeways and ramps increased by 26 percent. With meters on, therewere 261 crashes on metered freeways; with meters off, there were 476 crashes on thesame freeways and during the same amount of time (an increase of 82 percent). Based onhistorical seasonal variations (there were more crashes in the October/November meters-off period than in the September/October meters-on period due to the shortening daylightand onset of bad weather), the crashes in the “without” period would be expected toincrease by only 116 crashes to 377 total crashes. The analysis shows that, in the absenceof ramp metering, the number of crashes increased by 26.2 percent above the increasenormally expected due to seasonal variation. Figure ES.6 depicts the increase in crashes inthe absence of metering.
Figure ES.6 Crash Occurrence in the “With Meters” and “Without Meters”Study Periods (for Metered Freeways in the Morning andAfternoon Peak Periods)
0
100
200
300
400
500
1998-1999 2000
Study Period WithRamp MeteringStudy Period WithoutRamp Metering
The expected annual increase in crashes caused by the absence of metering amounts to atotal of 1,041 additional crashes per year, or approximately four additional crashes perday. The analysis of crashes by type revealed that “rear-end” crashes increased by15 percent, “side-swipes” increased by 200 percent, and “ran-off road” crashes increasedby 60 percent. These types of accidents could be related to the change in merge conditionsresulting from the absence of metering, which functions to break up platoons of vehiclesentering a freeway.
Annual Benefits of Ramp Metering
The four corridors selected for focused field data collection were used to provide esti-mates of performance impacts on varying types of metered corridors. Other metered cor-ridors in the region were then categorized according to the similarities in performance and

Twin Cities Ramp Meter Evaluation – Executive Summary
Cambridge Systematics, Inc. ES-11
geometric characteristics shared with the selected corridors. This process allowed forextrapolation of field evaluation results to the entire Twin Cities metered transportationsystem.
The observed changes in facility speed, vehicle travel time, travel time variability, andnumber of accidents were then summed across all metered corridors, along all directions,and all periods of operation (a.m. and p.m. peak period). Additionally, changes in emis-sions and fuel use were calculated based on the overall observed changes in facilityspeeds. Established per unit dollar values based on national and Twin Cities data werethen applied to the sum of the changes. The dollar values for each impact category werethen summed to estimate the average annual impact value for the entire ramp meteringsystem. This annual benefit figure forms the basis for comparison with the ramp meteringsystem costs.
The benefit analysis found that ramp metering results in annual savings of approximately$40 million to the Twin Cities traveling public. The annual benefits of ramp metering aresummarized in Table ES.1.
Table ES.1 Annual Benefits of the Ramp Metering System(Year 2000 Dollars)
Performance Measure Annual Benefit Annual $ Savings
Travel time 25,121 hours of travel time saved $247,000
Travel time reliability 2,583,620 hours of unexpected delayavoided
$25,449,000
Crashes 1,041 crashes avoided $18,198,000
Emissions 1,161 tons of pollutants saved $4,101,000
Fuel consumption 5.5 million gallons of fuel depleted ($7,967,000)
Total annual benefit $40,028,000
The annual benefits of ramp metering are broken down by performance measure as follows:
• Travel Time: With meters off, degraded travel speeds on freeway facilities more thanoffset the lack of ramp delays. This results in annual system-wide savings of25,121 hours of travel time or $0.25 million.
• Travel Time Reliability: Without ramp metering, freeway travel time is almost twiceas unpredictable as with ramp metering. This produces annual savings of 2.6 millionhours of unexpected delay or $25 million. This is a conservative estimate becauseunexpected delays were valued at the same level as recurrent delays; typically, unex-pected delays are valued at a rate three times higher than recurrent congestion. This

Twin Cities Ramp Meter Evaluation – Executive Summary
ES-12 Cambridge Systematics, Inc.
finding is collaborated by the amount of incident delay caused by the increased num-ber of freeway crashes.
• Safety: Ramp metering results in annual savings of 1,041 crashes (four crashes per day)or $18 million.
• Emissions: Ramp metering results in annual savings of 1,160 tons of emissions or$4 million. This is a conservative estimate because the analysis did not take intoaccount potential additional savings resulting from reduced vehicle acceleration anddeceleration during stop-and-go traffic in the “with meters” condition compared to the“without meters” condition.
• Fuel Consumption: Ramp metering results in an annual increase of 5.5 million gallonsof fuel consumed or an annual loss of $8 million. This also is a conservative estimatebecause the analysis did not take into account the smoothing of travel speed variabilityobserved during meter operation. Increased acceleration and deceleration observed inthe without meters scenario would be expected to result in increased fuel consumptionand a reduced disbenefit. The analysis as is shows a disbenefit for metering, becausethe reduction in freeway speed in the meters-off condition actually results in a fuelsavings.
Annual Costs of Ramp Metering
The annual capital costs associated with the ramp metering system were estimated bydividing the capital equipment costs associated with ramp metering by the useful life ofthe equipment required for deployment and operation of ramp meters. Annual operatingand maintenance (O&M) costs were then added to estimate the total annual expenditurenecessary to provide and operate the system. Operational costs include personnel, elec-tricity, and communications, while maintenance costs include field personnel, replace-ment equipment, etc. This method provides a snapshot of costs for the current yearsuitable for comparison with the estimation of benefits for the same year.
The cost analysis found that the total annual cost of the entire congestion managementsystem is approximately $8 million. The cost of the ramp metering system alone isapproximately $2.6 million annually. Table ES.2 provides detail on the system costs.
The estimation of the precise cost of the ramp metering system deployed in the TwinCities is complex, because many of the system components were deployed as part of anintegrated congestion management system. Congestion management capabilities, such asthe loop detection system and the camera surveillance system, support a number of otherfunctions such as incident detection and traveler information. Further complicating thisissue is the fact that many of these systems share equipment with the ramp metering sys-tem. Although some of this shared equipment would need to be installed even in theabsence of the ramp metering system, the evaluation team took a conservative approachby comparing the total cost of the congestion management system plus the costs for HOVbypass lanes with the benefits of only ramp metering.

Twin Cities Ramp Meter Evaluation – Executive Summary
Cambridge Systematics, Inc. ES-13
Table ES.2 Annual Congestion Management and Ramp Metering SystemCosts (Year 2000 Dollars)
Cost Item
All CongestionManagementCapabilities
AmountRelated to Ramp
Metering
Annual capital costs
Congestion management/ramp metering $5,035,950 $745,667HOV ramp bypass $730,000 $730,000Subtotal $5,765,950 $1,475,677
Annual operating and maintenance costs
Operations costs $893,836 $431,879
Maintenance costs $967,489 $464,395Research costs $250,000* $250,000
Subtotal $2,111,325 $1,146,274
Total annual cost $7,877,275 $2,621,950
*Represents only those research activities related to ramp metering.
Comparison of Ramp Metering Benefits and Costs
The benefit/cost analysis provides a “snapshot” of the current benefits and costs related toramp metering. The benefits identified in this study are shown to greatly outweigh thecosts of the ramp metering system. The analysis used the most conservative estimate ofcosts by taking into account the full cost of the Twin Cities congestion management sys-tem, even though many of these costs are not directly related to ramp metering.
The results from the comparison of ramp metering benefits and the costs of the congestionmanagement system are presented in Table ES.3. The benefits of ramp metering outweighthe costs by a significant margin and result in a net benefit of approximately $32 to$37 million per year. The benefit/cost ratio indicates that benefits are approximately fivetimes greater than the cost of the system. Although the congestion management systemcontains many cost items that are not directly related to the ramp metering system, theestimated benefits still outweighed costs by a ratio of five to one.
This result is validated favorably when compared to ramp meter benefits estimated atother metropolitan areas. Actually, the five-to-one benefit/cost ratio is low when com-pared to other ramp meter evaluation studies. This is because conservative assumptionswere employed in the estimation of both benefits and costs in the Twin Cities. Theseassumptions notwithstanding, ramp metering in the Twin Cities is found to be a goodinvestment of public funds.

Twin Cities Ramp Meter Evaluation – Executive Summary
ES-14 Cambridge Systematics, Inc.
Table ES.3 Comparison of Annual Costs and Benefits
Measure Value
Annual ramp metering benefits $40,028,000
Annual costs for entire congestion management system $7,877,000
Annual net benefit $32,151,000
Benefit/cost ratio 5:1
When the benefits of the ramp metering system are compared with only those costsdirectly related to providing ramp metering capabilities, the benefit/cost ratio increasessignificantly to 15:1. This benefit/cost ratio is more consistent with those estimated forother ramp metering systems.
Results from the Traveler Surveys and Focus Groups
In parallel to the field data collection and analysis, the evaluation team conducted travelersurveys and focus groups to elicit travelers’ overall perception of the operation of rampmeters in the Twin Cities’ roadway system, and the impact of shutting down the rampmeters on travelers’ general travel patterns.
Four focus group sessions were held among individuals who traveled on one or more ofthe four test corridors. In order to qualify for participation, individuals had to travel thetest routes during the a.m. and p.m. peak periods, when ramp meters were in operation.Separate focus groups were conducted based on the frequency of travel, including “light”and “heavy” ramp and corridor users.
The surveys included both a random sample of area travelers, as well as four corridor-specific samples that focused on the area’s freeway corridors for which traffic and traveltime data were also collected. These surveys were fielded twice, both before and duringthe ramp meter shutdown. A total of 1,500 telephone surveys were conducted for pur-poses of this analysis. The total sample size was equally split between the two waves of“with meters” and “without meters” field data collection.
The results from the analysis of the traveler surveys and focus groups are summarized asfollows:
• Respondents reported experiencing average wait times at ramps in the “with meters”survey of four to nine minutes depending on the corridor, but mainly between five tosix minutes. This is consistent with the observed field data for the peak hour only, andis about twice as long as for the peak period. It is typical of travelers to perceive waittimes as being about double what they are in reality.
Twin Cities Ramp Meter Evaluation – Executive Summary
Cambridge Systematics, Inc. ES-15
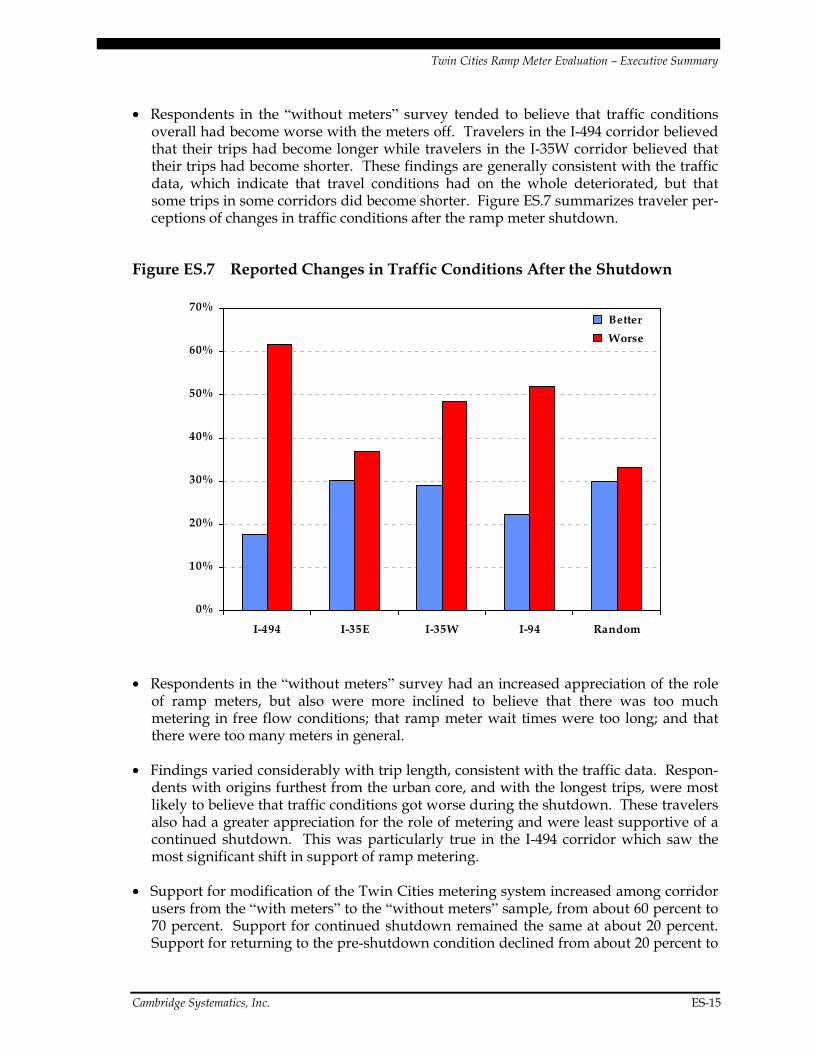
• Respondents in the “without meters” survey tended to believe that traffic conditionsoverall had become worse with the meters off. Travelers in the I-494 corridor believedthat their trips had become longer while travelers in the I-35W corridor believed thattheir trips had become shorter. These findings are generally consistent with the trafficdata, which indicate that travel conditions had on the whole deteriorated, but thatsome trips in some corridors did become shorter. Figure ES.7 summarizes traveler per-ceptions of changes in traffic conditions after the ramp meter shutdown.
Figure ES.7 Reported Changes in Traffic Conditions After the Shutdown
0%
10%
20%
30%
40%
50%
60%
70%
I-494 I-35E I-35W I-94 Random
Better
Worse
• Respondents in the “without meters” survey had an increased appreciation of the roleof ramp meters, but also were more inclined to believe that there was too muchmetering in free flow conditions; that ramp meter wait times were too long; and thatthere were too many meters in general.
• Findings varied considerably with trip length, consistent with the traffic data. Respon-dents with origins furthest from the urban core, and with the longest trips, were mostlikely to believe that traffic conditions got worse during the shutdown. These travelersalso had a greater appreciation for the role of metering and were least supportive of acontinued shutdown. This was particularly true in the I-494 corridor which saw themost significant shift in support of ramp metering.
• Support for modification of the Twin Cities metering system increased among corridorusers from the “with meters” to the “without meters” sample, from about 60 percent to70 percent. Support for continued shutdown remained the same at about 20 percent.Support for returning to the pre-shutdown condition declined from about 20 percent to

Twin Cities Ramp Meter Evaluation – Executive Summary
ES-16 Cambridge Systematics, Inc.
10 percent. Figure ES.8 summarizes the travelers’ view of the future of ramp meteringin the Twin Cities.
• The most commonly supported modifications were to shorten the wait times; toincrease green time when freeway flow at the ramp was light; to shorten hours of meteroperation; and, to reduce the number of meters and limit them to areas of high trafficcongestion.
Figure ES.8 Travelers’ View of the Future of Ramp Metering
I-35E
18%55%
27%
I-494
13%64%
23%
I-35W
13%64%
23%
I-94
32%
54% 14%
17%
64%
19%
Continue Meter Operation "As Is"Modify Meter OperationShut Down Meters Permanently
6%74%
20%
8%72%
20%
13%72%
15%
“With Ramp Metering” (N=508)
“Without Ramp Metering” (N=507)
���� Secondary Research
The benefits and disadvantages of ramp metering described in this report are similar tothose experienced elsewhere in the country.
• This study’s finding of 22 percent savings in freeway travel time is well within theseven percent to 91 percent range observed in other areas (average of 25 percent traveltime savings for 13 observations). The 22 percent travel time savings is also within therange of prior studies conducted on ramp metering within the Twin Cities (14 to26 percent).

Twin Cities Ramp Meter Evaluation – Executive Summary
Cambridge Systematics, Inc. ES-17
• Systemwide crashes for the Twin Cities increased by 26 percent without rampmetering. The average across eight other ramp meter evaluation studies reviewed bythe evaluation team is 32 percent reduction in crashes. The range of values for reduc-tions in crashes due to ramp metering is from five percent to 50 percent. In areas withmore than 50 meters, the average crash reduction is 29 percent.
• This evaluation shows that there is a 14 percent increase in freeway throughput due toramp metering. The average for the 12 other studies reviewed by the evaluation teamis 18 percent, with a range from zero percent to 86 percent. Long Island, Phoenix,Portland, and Seattle (cities with more than 50 meters) show an average of 38 percentincrease in freeway throughput.
• Other evaluation studies have limited impact information related to emissions impactsof ramp metering. Three other metropolitan areas (Denver, Detroit, Long Island),which evaluated emissions as part of their ramp meter study, showed some improve-ment in overall emissions due to ramp metering. Long Island showed a 6.7 percentincrease in NOx, and the improvements in CO and HC of 17.4 and 13.1 percent,respectively.
• Four areas which evaluated fuel consumption impacts of ramp metering showed sav-ings due to ramp metering ranging from about six percent to 13 percent. However, asmentioned in Section 7.0 of this report, the fuel consumption analysis used in thisevaluation used a simple straight-line estimation technique which does not address thetempering of flow typically due to ramp metering, by smoothing the travel speed vari-ability (less acceleration and deceleration).
• There is limited information on benefit/cost ratios of ramp metering evaluations. Thiscurrent study’s benefit/cost ratio of 5:1 for the entire congestion management systemand 15:1 for the ramp metering costs only are within the ranges seen for other areas.For five areas (Abilene, Atlanta, Phoenix, Seattle, and previous Minneapolis/St. Paulevaluation efforts), the range of benefit/cost ratios is from 4:1 to 62:1, with an averageof 20:1.
���� Recommendations
The analysis of field data indicates that ramp metering is a cost-effective investment ofpublic funds for the Twin Cities area. This finding notwithstanding, the Twin Cities usersof the highway system support the need for modifications toward an efficient but morepublicly acceptable operation of ramp meters. The combination of these two factorspoints towards the adoption of an overriding principle regarding the operation of rampmeters in the Twin Cities: This principle would seek to “balance the efficiency of movingas much traffic during the rush hours as possible, consistent with safety concerns andpublic consensus regarding queue length at meters.”
In light of this “new balance” and pending the development of a general policy for opti-mizing ramp meter operation, several steps were taken soon after the evaluation data col-

Twin Cities Ramp Meter Evaluation – Executive Summary
ES-18 Cambridge Systematics, Inc.
lection was completed, including reducing the operating timeframe of ramp meters,allowing meters to change more quickly from red to green, and keeping several meters atflashing yellow. Until a policy for optimizing ramp meter operation is developed, it isrecommended that Mn/DOT continues to monitor ramp wait times, freeway travel timeand its reliability, crashes, and conduct market research to identify changing travelerperceptions.
A critical recommendation for the medium-term is to develop a policy for optimizingramp meter operation that is based on the lessons learned from the evaluation. It is rec-ommended that in coordination with key stakeholders, Mn/DOT define a new set ofobjectives, constraints and criteria for ramp meter application and operation. This policywould be based on a thorough investigation of efficiency, safety, equity, and other criteriafor the evaluation of ramp metering strategies. Criteria may involve variables such assafety, ramp wait times and ramp storage capacities, target freeway peak-period speeds,maximum metering rates, and commute differences between different origins and desti-nations in the Twin Cities metropolitan area.
An additional recommendation points toward the establishment of a systematic processfor developing long-range recommendations for ramp meter operation and modifications.This process will emerge by identifying, evaluating and recommending methods fordeveloping and testing long-range ramp metering strategies. This process would alsoinclude the creation of a forum for public input into the continued evolution of the rampmetering system, and the development of a plan for continued evaluation of rampmetering strategies after their implementation. It is also recommended that Mn/DOTresponds to the public’s need for information on traffic management strategies.
Finally, it should be recognized that ramp metering is but a single traffic managementstrategy which cannot by itself solve the problems of growing congestion in the regionbrought about by rapid economic growth in the 1990s and the lack of major investments innew transportation system capacity. The future of ramp metering strategies in the regionshould be discussed in this larger context.