Embed Size (px)
Citation preview
AN EVALUATION OF RAMP-UP TO READINESS PROGRAM: STUDENT SURVEY RESULTS
July 2019
Prepared by: Kate LaVelle, PhD
Center for Applied Research and Educational Improvement, University of Minnesota i
Research, Development and Engagement to Improve Education
How to Cite this Report LaVelle, K. (2019). An Evaluation of Ramp-Up to Readiness Program: Student Survey Results. St. Paul, MN: University of Minnesota, College of Education and Human Development, Center for Applied Research and Educational Improvement.
Contact Information Kate LaVelle, PhD Research Associate Center for Applied Research and Educational Improvement College of Education and Human Development University of Minnesota 1954 Buford Avenue, Suite 425 Saint Paul, MN 55108 Telephone: (612) 625-1464 Email: [email protected]

Center for Applied Research and Educational Improvement, University of Minnesota ii
Table of Contents Introduction .................................................................................................................................................. 1
Overview of Ramp-Up to Readiness Program........................................................................................... 1
Evaluation of the Ramp-Up to Readiness Program................................................................................... 1
Methods ........................................................................................................................................................ 2
Study Sample ............................................................................................................................................. 2
Survey Instrument and Administration ..................................................................................................... 2
Data Analysis ............................................................................................................................................. 3
Results ........................................................................................................................................................... 4
Response Rates ......................................................................................................................................... 4
Student Survey Demographics .................................................................................................................. 4
Self-Reported Participation in Ramp-Up Program Activities .................................................................... 6
Overall Perceptions across Readiness Domains ....................................................................................... 6
Item-level Student Results by Readiness Domain..................................................................................... 7
Student Comments about Ramp-Up Program Benefits .......................................................................... 17
Summary ..................................................................................................................................................... 20
References .................................................................................................................................................. 21
Appendix A: Factor Loadings of Survey Items ............................................................................................. 22
Appendix B: Sample Sizes by School and Grade ......................................................................................... 23
Appendix C: Readiness Domain Means and Standard Deviations, Overall and by Grade .......................... 24
Appendix D: Item-Level Responses by Domain, Overall ............................................................................. 25
Appendix E: Item-Level Responses by Domain and Grade ......................................................................... 26
List of Tables
Table 1. Self-Reported Student Demographics by Grade ............................................................................ 5
Table 2. Student Perceptions of Ramp-Up Program Benefits…………………………………………………………………17
List of Figures
Figure 1. Self-Reported Student Program Participation, Overall and by Grade .......................................... 6
Figure 2. Readiness Domain Means, Overall and by Grade ......................................................................... 7
Figure 3. Academic Readiness Item-level Responses, Overall and by Grade .............................................. 9

Center for Applied Research and Educational Improvement, University of Minnesota iii
Figure 4. College Readiness Item-level Responses, Overall and by Grade………………………………………………11
Figure 5. Career Readiness Item-level Responses, Overall and by Grade……………………………………………….13
Figure 6. Financial Readiness Item-level Responses, Overall and by Grade……………………………………………14
Figure 7. Social Emotional Readiness Item-level Responses, Overall and by Grade……………………………….16
Center for Applied Research and Educational Improvement, University of Minnesota 1
Introduction
Overview of Ramp-Up to Readiness Program Ramp-Up to Readiness1 (Ramp-Up) is a school-wide advisory program, developed by the College Readiness Consortium (CRC) at the University of Minnesota, that helps students in Grades 6 through 12 master the knowledge, skills and habits for success in a high-quality college program. Ramp-Up provides schools with structured lessons and resources that target five key areas of college-readiness: academic, college admissions, career, financial, and social-emotional readiness. Students in Ramp-Up participate in weekly, 30-minute advisory activities. Teacher leaders are provided with lessons and materials that help them guide students through the activities. In addition to weekly activities, students participate in one workshop each year. Workshops last for an entire class period and allow students to engage in each area of readiness more deeply. In addition, students are expected to take tangible steps towards planning for postsecondary success. As part of the Ramp-Up program, students use three tools to help them plan for and track progress towards postsecondary success: the Postsecondary Plan, the Readiness Rubric and the Personal Readiness Evaluation for Postsecondary (PREP) Survey. The Postsecondary Plan connects career, postsecondary, and academic planning as students move from one grade to the next. The Readiness Rubric tool is completed multiple times during the year and helps students track their progress towards their postsecondary goals. Finally, the PREP survey is given to students early in the Ramp-Up to Readiness sequence and measures students’ developmental readiness for postsecondary education. Results from the PREP surveys are used to identify students for whom early intervention may increase their likelihood of postsecondary success. Ramp-Up is designed to help all students within a school understand how and why their actions in middle and high school will impact their post-secondary options and future success. Ramp-Up is based on the notion that students who are more likely to engage with college-going resources at their schools will be more likely to attend and complete college. During the 2017-2018 school year, Ramp-Up to Readiness was implemented in 220 schools throughout seven states and served approximately 123,000 students.
Evaluation of the Ramp-Up to Readiness Program The College Readiness Consortium (CRC) requested that the Center for Applied Research and Educational Improvement (CAREI) evaluate the impact of Ramp-Up to Readiness on student outcomes across each of program’s five pillars of readiness: academic, college admissions, career, financial, and social-emotional. In this report, we describe the results of an online student survey that was designed to examine students’ perceptions and experiences in the Ramp-Up program during the 2018–19 school year. The student survey results presented address the evaluation question: To what extent do students report that Ramp-Up to Readiness improved their academic, college admissions, career, financial, and social-emotional readiness? This report is intended to provide Ramp-Up administrators and school program coordinators with information on program effectiveness and improvement.
1 Ramp-Up to Readiness program website, available at https://www.rampuptoreadiness.org/
Center for Applied Research and Educational Improvement, University of Minnesota 2
Methods
Study Sample
Sampling procedure. CAREI evaluators collaborated with Ramp-Up to Readiness program administrators to identify a convenience sample of schools throughout Minnesota that were willing to participate in the study. The primary purpose of the survey was to collect data on the perceptions of students as this perspective had not been closely examined prior to the current study. Therefore, it was important to identify schools that had an adequate number of students who had experienced the Ramp-Up program. The sample was intentionally limited to schools that had implemented the Ramp-Up program for four or more years. This was done because a minimum of three years of program exposure is typically needed to show a program’s expected effects. The sampling process helped make sure that the sample included students who had likely been exposed to at least three years of program. For example, by including schools that had implemented the program across all grades for 4 or more years, we were more confident that the sample would include students in Grades 9-12 who had sufficient exposure to Ramp-Up over time. Ramp-Up program administrators helped identify potential schools for inclusion in the study. CAREI evaluators then confirmed the length of program implementation for each school during phone conversations with school site coordinators. In the end, the final study sample included five school districts across Minnesota (including both middle and high schools) that volunteered to gather surveys from students in Grade 6 through 12.
Participating schools. The five school districts that participated in the study were located in both rural regions of the the state, as well as in the Twin-Cities metro area. All schools were public schools and they ranged in size from 220 to 2083 students.2 Four out of the five participating school districts had a majority of students who identified as White, and one school that had a majority of students who identified as Asian. The high school 4-year graduation rate ranged from 84% to 96% for students graduating in 2017-18 across the participating schools, according to the most recent Minnesota Department of Education (MDE) information. The percent of teachers with three or more years of teaching experience ranged from 68% to 98% across the schools. The average number of students per licensed teachers across the schools included in the study was 15:1.
Survey Instrument and Administration The Ramp-Up to Readiness Student Survey was designed to gather feedback from students about their perception of their own college readiness as a result of participating in the program. Since all schools included in the study had implemented Ramp-Up for four or more years, the majority of the students taking the survey had likely participated in the program for between 1 year (e.g., students in Grade 6) and up to 5 or more years (e.g., students in Grade 12 who entered the program in middle school). Thus, the length of program exposure varied among students based on when they entered the program and when their school started program implementation. Survey questions asked students about their level of knowledge of and preparation for areas of college readiness, including study habits and academic commitment, the admissions process and college financing, career planning, and future goal setting. Two demographic questions (race/ethnicity and gender) were also included in the survey. The survey included both closed-ended and open-ended survey items and was administered via Qualtrics, an online survey tool, in December 2018 - January 2 Minnesota Report Card, Student Demographics, available at http://rc.education.state.mn.us
Center for Applied Research and Educational Improvement, University of Minnesota 3
2019. The survey was sent to approximately 4607 students in Grades 6-12 across the five school districts that participated in the Ramp-Up program during the 2018–19 school year. Ramp-Up program coordinators or school administrators at each school served as the study point person and managed the survey data collection process. The site coordinator managed survey administration logistics, including communicating the purpose of the survey to teachers, arranging the time for survey administration during the school day, and distributing the online survey link to students. The survey was voluntary and student responses were kept strictly confidential.
Data Analysis
Data cleaning. Quantitative survey data were reviewed according to a set of criteria to determine if the responses met a minimum standard of reliability. Surveys with less than 50% of items answered (i.e., only 0-9 items were answered out of 19) were removed from the analysis (n=122). Additionally, surveys in which students provided identical responses across all items were removed from the survey. The final survey sample included 2771 students in Grades 6 through 12 across all participating school districts.
Exploratory factor analysis. Once the final survey sample was established, an exploratory factor analysis (EFA) was conducted with the overall sample (i.e., data from all of the schools included in the study; n=2771). The EFA was conducted to be sure that the survey instrument was functioning as expected, as well as that the survey participants were distinguishing between the major constructs the survey was designed to measure. The factor analysis examined 19 survey items to determine the degree to which the items could be grouped together for subsequent analysis. Kaiser-Myer-Olkin (KMO) and Bartlett’s analyses found that the data supported the EFA (KMO=0.970; Bartlett=0.000). The factor analysis showed two large groupings of items (Eigenvalues>1; individual item loadings>.40) which we are describing as factors. The first factor was made up of items related to academic and social emotional readiness, and the items explained 57% of the variance. The second factor was made up of items related to college, career and financial readiness, and it explained an additional 8% of the variance. Together, the two factors explained 65% of the variance in the overall sample of students (n=2554). Appendix A presents information on the specific items that comprised each factor and the factor item loadings.
The results of the EFA support the construct validity of the survey instrument because all of the items loaded on the two factors and only two items loaded onto both factors (Factor 1= academic and social-emotional readiness; Factor 2= career, college and financial readiness). The factors can be discussed as smaller sub-factors, in spite of the common variance explained by the Oblimin Rotation procedure. Thus, the exploratory factor analysis conducted for the survey instrument suggests it is a promising measure of students’ perceptions within these two factor groupings of the Ramp-Up program. Future exploration of this survey tool, such as confirmatory factor analysis or comparing results from this survey with other similar instruments, could assist in establishing its construct validity.
Quantitative data analysis. The results of the quantitative survey items are presented based on the Ramp-Up program’s five domains of readiness: academic, college (or admissions), career, financial, and social emotional. We calculated and present in this report the number (sample size) and percent of students selecting each response category (strongly disagree to strongly agree) for all 19 closed-ended items on the survey. Findings are displayed to facilitate the comparison of results across grade levels (6-12) as well as for all students combined. Note that percentages in figures and tables may not add up to 100% due to rounding error.
Center for Applied Research and Educational Improvement, University of Minnesota 4
Qualitative data analysis. For the two open-ended survey questions, we analyzed all responses and reported on the themes that emerged across the five readiness domains of the Ramp-Up program. In some instances, the information provided by students fit into multiple themes. Quotations chosen in this report are representative of the pool of responses and are presented in italics (omitted text is represented by ellipses). In some cases, we have made small edits to quotations in order to improve readability without changing the context of the respondent.
Results
Response Rates Students in Grades 6 through 12 who were enrolled in the Ramp-Up program during the survey administration period in December 2018 – January 2019 were invited to complete the online survey. The survey was voluntary and students indicated their consent to participate by selecting Yes or No on the first screen of the online survey. Of the students who initiated the online survey (n=3593), 17% (n=615) indicated they did not consent to participate and a few individuals left the survey without answering the consent question (n=26). The final survey sample was 2771 individuals in Grades 6 through 12, which corresponded to a response rate of 60% (n=2771/4607). The percentage of all surveys collected by grade level was: 14% for Grade 6 (n=395), 15% for Grade 7 (n=424), 17% for Grade 8 (n=463), 15% for Grade 9 (n=423), 16% for Grade 10 (n=441), 12% for Grade 11 (n=343), and 10% for Grade 12 (n=282). In general, there was a relatively similar number of students across grade levels included in the survey analysis. Appendix B presents the number of students included in the analysis and response rates across the five participating school districts.
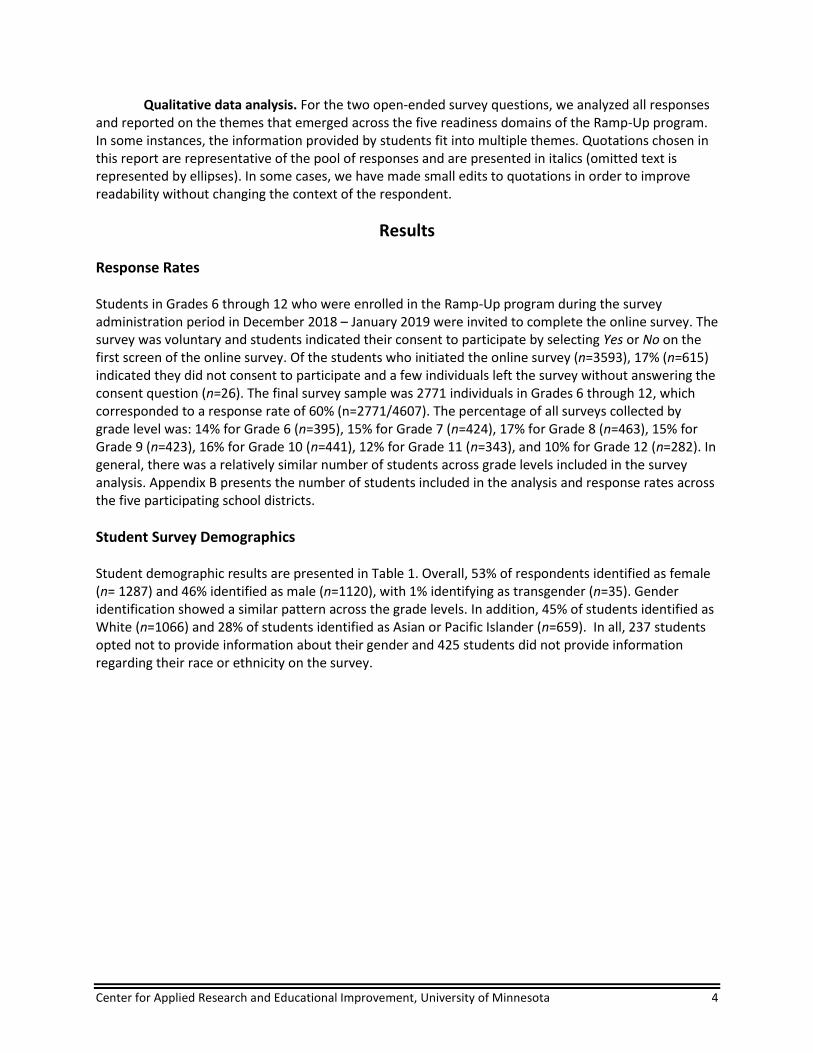
Student Survey Demographics Student demographic results are presented in Table 1. Overall, 53% of respondents identified as female (n= 1287) and 46% identified as male (n=1120), with 1% identifying as transgender (n=35). Gender identification showed a similar pattern across the grade levels. In addition, 45% of students identified as White (n=1066) and 28% of students identified as Asian or Pacific Islander (n=659). In all, 237 students opted not to provide information about their gender and 425 students did not provide information regarding their race or ethnicity on the survey.
Center for Applied Research and Educational Improvement, University of Minnesota 5
Table 1. Self-Reported Student Demographics by Grade Grade 6 Grade 7 Grade 8 Grade 9 Grade 10 Grade 11 Grade 12 Overall
n % n % n % n % n % n % n % n %
Total Respondents
395 14% 424 15% 463 17% 423 15% 441 16% 343 13% 282 10% 2771 100%
Gendera Male 163 48% 157 44% 211 51% 161 44% 189 47% 130 43% 109 43% 1120 46%
Female 177 51% 191 53% 199 48% 200 54% 214 53% 165 55% 141 56% 1287 53%
Transgender * * * * * * * * * * * * * * 35 1%
Overall 343 100% 358 100% 414 100% 370 100% 406 100% 300 100% 251 100% 2442 100%
Race/Ethnicityb
American Indian or Alaskan Native
11 3% * * * * * * * * * * * * 26 1%
Asian or
Pacific Islander
80 26% 111 35% 114 28% 90 24% 114 29% 75 26% 75 30% 659 28%
Black or
African
American
24 8% 37 12% 31 8% 21 6% 26 6% 21 7% 15 6% 175 8%
Hispanic 15 5% 20 6% 30 8% 16 4% 26 6% 13 4% 15 6% 135 6%
White 128 41% 100 31% 171 42% 202 54% 188 48% 145 50% 132 52% 1066 45%
Other 16 5% * * 14 3% * * 12 3% 12 4% * * 73 3%
More than
one race
37 12% 39 12% 42 10% 33 9% 25 6% 23 8% 13 5% 212 9%
Overall 311 100% 318 100% 407 100% 372 100% 392 100% 292 100% 254 100% 2346 100%
Note. Information is only reported in the Overall column when sample sizes within cells are less than 10, denoted by an asterisk (*). a. An additional option for gender was “prefer not to respond,” which was selected by 138 respondents. Gender information was not provided by 99
respondents. b. An additional option for race/ethnicity was “prefer not to respond,” which was selected by 233 respondents. Race/ethnicity information was not provided
by 192 respondents.
Center for Applied Research and Educational Improvement, University of Minnesota 6
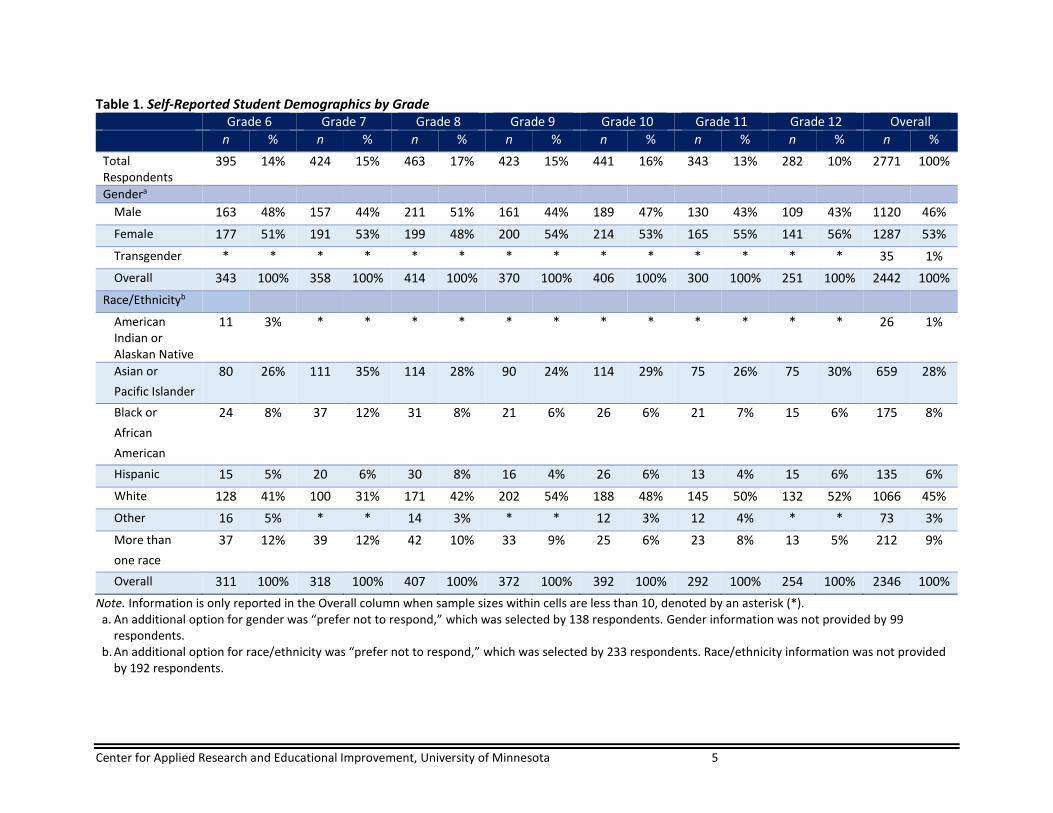
Self-Reported Participation in Ramp-Up Program Activities Students were asked whether they participated in Ramp-Up activities regularly. The majority (61%) of students reported regular participation (n=1690/2771), while fewer students were unsure (28%, n=763/2771) or reported inconsistent participation (11%, n=318/2771), as shown in Figure 1. Note that students’ account of program participation is self-reported and that an examination of additional data sources, such as program attendance records, to triangulate information would determine student participation rates with greater accuracy.
Figure 1. Self-Reported Student Program Participation, Overall and by Grade
Overall Perceptions across Readiness Domains
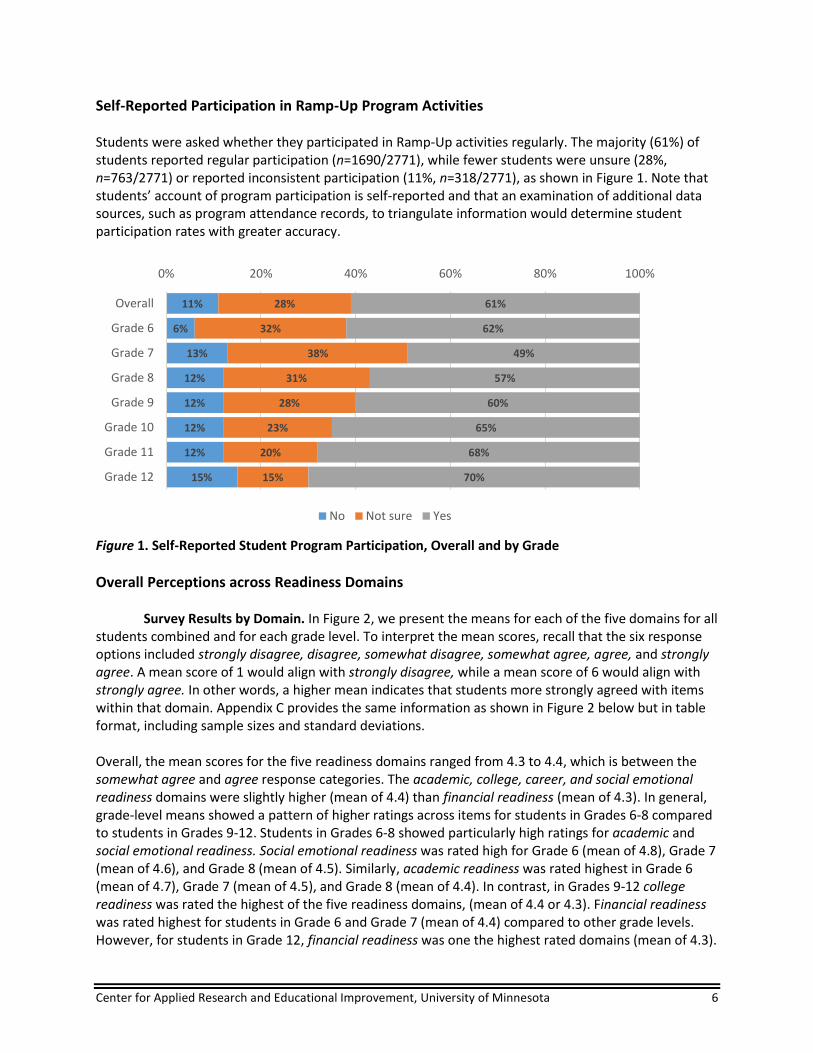
Survey Results by Domain. In Figure 2, we present the means for each of the five domains for all students combined and for each grade level. To interpret the mean scores, recall that the six response options included strongly disagree, disagree, somewhat disagree, somewhat agree, agree, and strongly agree. A mean score of 1 would align with strongly disagree, while a mean score of 6 would align with strongly agree. In other words, a higher mean indicates that students more strongly agreed with items within that domain. Appendix C provides the same information as shown in Figure 2 below but in table format, including sample sizes and standard deviations.
Overall, the mean scores for the five readiness domains ranged from 4.3 to 4.4, which is between the somewhat agree and agree response categories. The academic, college, career, and social emotional readiness domains were slightly higher (mean of 4.4) than financial readiness (mean of 4.3). In general, grade-level means showed a pattern of higher ratings across items for students in Grades 6-8 compared to students in Grades 9-12. Students in Grades 6-8 showed particularly high ratings for academic and social emotional readiness. Social emotional readiness was rated high for Grade 6 (mean of 4.8), Grade 7 (mean of 4.6), and Grade 8 (mean of 4.5). Similarly, academic readiness was rated highest in Grade 6 (mean of 4.7), Grade 7 (mean of 4.5), and Grade 8 (mean of 4.4). In contrast, in Grades 9-12 college readiness was rated the highest of the five readiness domains, (mean of 4.4 or 4.3). Financial readiness was rated highest for students in Grade 6 and Grade 7 (mean of 4.4) compared to other grade levels. However, for students in Grade 12, financial readiness was one the highest rated domains (mean of 4.3).
11%
6%
13%
12%
12%
12%
12%
15%
28%
32%
38%
31%
28%
23%
20%
15%
61%
62%
49%
57%
60%
65%
68%
70%
0% 20% 40% 60% 80% 100%
Overall
Grade 6
Grade 7
Grade 8
Grade 9
Grade 10
Grade 11
Grade 12
No Not sure Yes
Center for Applied Research and Educational Improvement, University of Minnesota 7
Figure 2. Readiness Domain Means, Overall and by Grade
Item-level Student Results by Readiness Domain
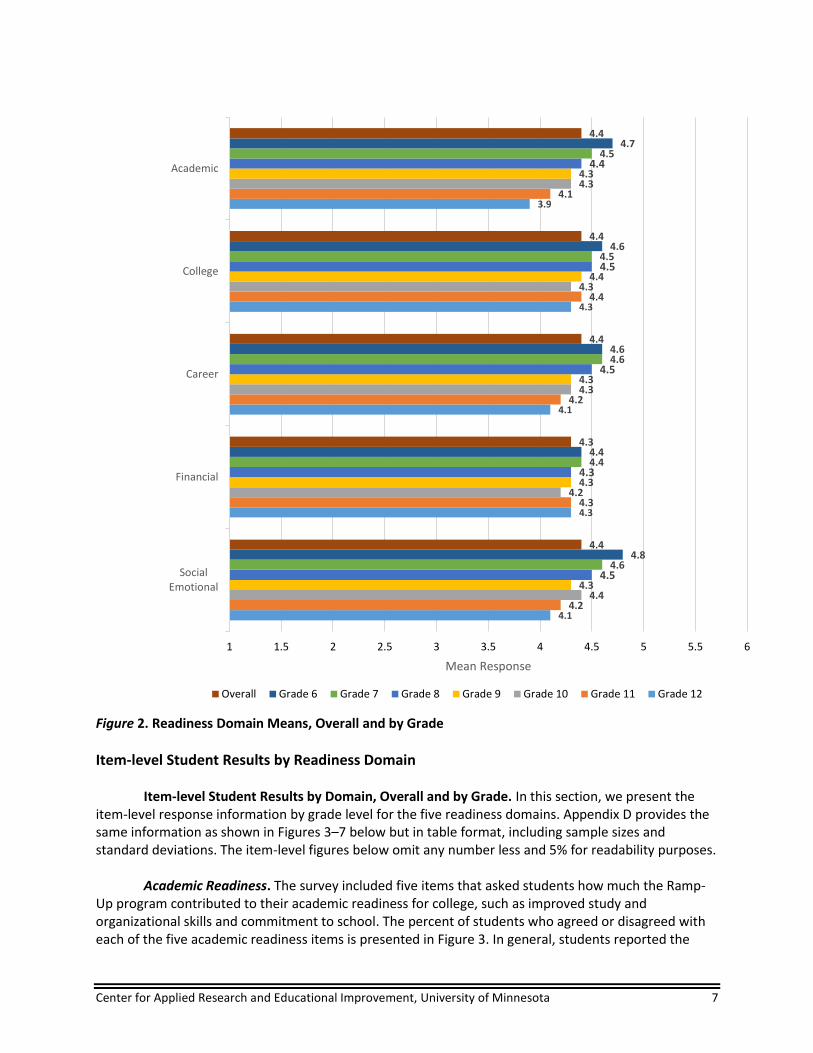
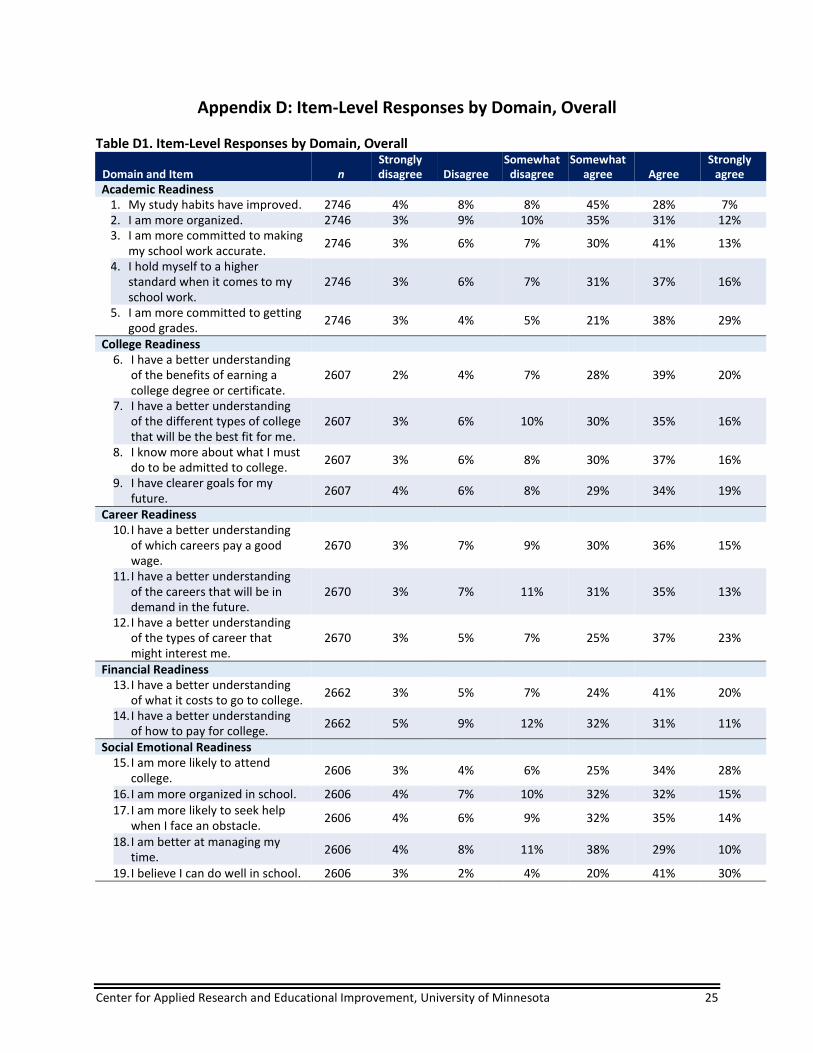
Item-level Student Results by Domain, Overall and by Grade. In this section, we present the item-level response information by grade level for the five readiness domains. Appendix D provides the same information as shown in Figures 3–7 below but in table format, including sample sizes and standard deviations. The item-level figures below omit any number less and 5% for readability purposes.
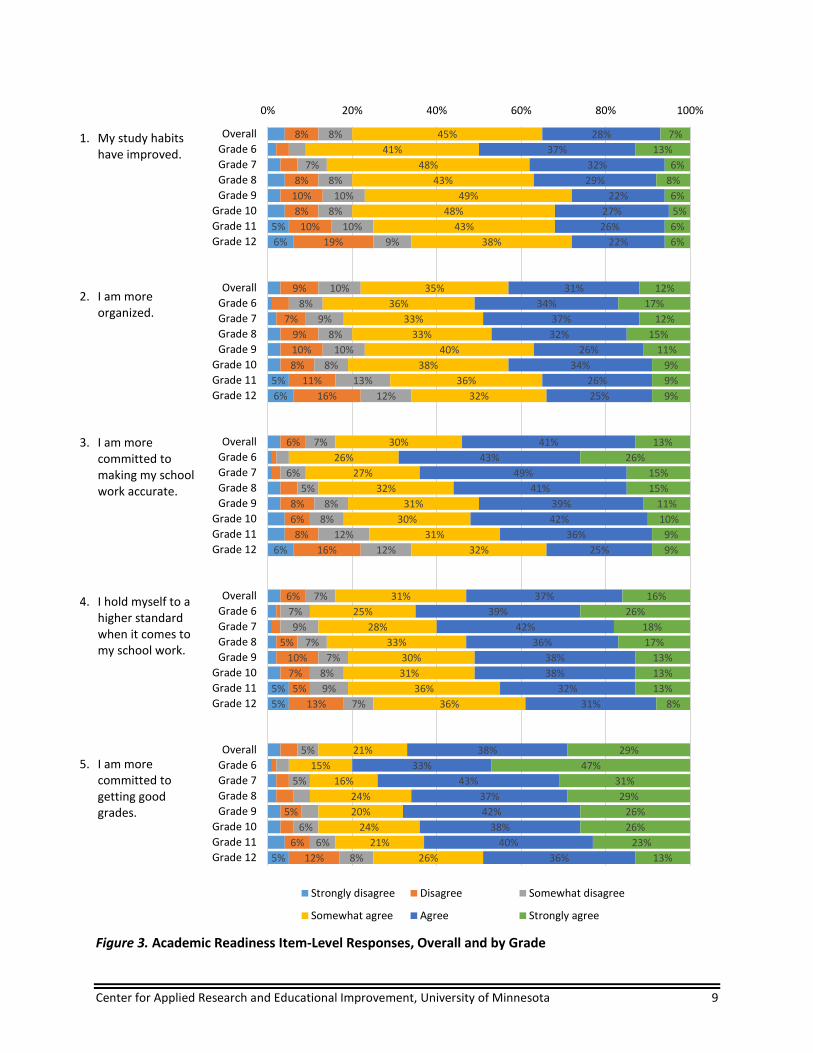
Academic Readiness. The survey included five items that asked students how much the Ramp-Up program contributed to their academic readiness for college, such as improved study and organizational skills and commitment to school. The percent of students who agreed or disagreed with each of the five academic readiness items is presented in Figure 3. In general, students reported the
4.1
4.3
4.1
4.3
3.9
4.2
4.3
4.2
4.4
4.1
4.4
4.2
4.3
4.3
4.3
4.3
4.3
4.3
4.4
4.3
4.5
4.3
4.5
4.5
4.4
4.6
4.4
4.6
4.5
4.5
4.8
4.4
4.6
4.6
4.7
4.4
4.3
4.4
4.4
4.4
1 1.5 2 2.5 3 3.5 4 4.5 5 5.5 6
SocialEmotional
Financial
Career
College
Academic
Mean Response
Overall Grade 6 Grade 7 Grade 8 Grade 9 Grade 10 Grade 11 Grade 12

Center for Applied Research and Educational Improvement, University of Minnesota 8
highest agreement (strongly agree, agree or somewhat agree) with the statements “I am more committed to getting good grades.” (88%), “I am more committed to making my school work accurate.” (84%), and “I hold myself to a higher standard when it comes to my school work.” (84%). Grade-level analysis showed such that students in Grades 6, 7, and 8 reported the strongest agreement with the academic items, and students in Grades 11 and 12 reported the lowest agreement. For example, 95% of students in Grade 6 and 90% of students in Grade 7 reported agreement with the item “I am more committed to getting good grades.” compared to 75% for students in Grade 12. Similarly, approximately 91% of students in Grade 6 and 86% in Grade 7 indicated agreement with the item “My study habits have improved.” compared to 66% for students in Grade 12. However, over three-quarters of students in Grades 11 (81%) and 12 (75%) reported “I hold myself to a higher standard when it comes to my school work.” which shows higher personal expectations for success in school among high school students participating in the Ramp-Up program.
Center for Applied Research and Educational Improvement, University of Minnesota 9
Figure 3. Academic Readiness Item-Level Responses, Overall and by Grade
5%
6%
5%
6%
6%
5%
5%
5%
8%
8%
10%
8%
10%
19%
9%
7%
9%
10%
8%
11%
16%
6%
8%
6%
8%
16%
6%
5%
10%
7%
5%
13%
5%
6%
12%
8%
7%
8%
10%
8%
10%
9%
10%
8%
9%
8%
10%
8%
13%
12%
7%
6%
5%
8%
8%
12%
12%
7%
7%
9%
7%
7%
8%
9%
7%
5%
5%
6%
6%
8%
45%
41%
48%
43%
49%
48%
43%
38%
35%
36%
33%
33%
40%
38%
36%
32%
30%
26%
27%
32%
31%
30%
31%
32%
31%
25%
28%
33%
30%
31%
36%
36%
21%
15%
16%
24%
20%
24%
21%
26%
28%
37%
32%
29%
22%
27%
26%
22%
31%
34%
37%
32%
26%
34%
26%
25%
41%
43%
49%
41%
39%
42%
36%
25%
37%
39%
42%
36%
38%
38%
32%
31%
38%
33%
43%
37%
42%
38%
40%
36%
7%
13%
6%
8%
6%
5%
6%
6%
12%
17%
12%
15%
11%
9%
9%
9%
13%
26%
15%
15%
11%
10%
9%
9%
16%
26%
18%
17%
13%
13%
13%
8%
29%
47%
31%
29%
26%
26%
23%
13%
0% 20% 40% 60% 80% 100%
Overall
Grade 6
Grade 7
Grade 8
Grade 9
Grade 10
Grade 11
Grade 12
Overall
Grade 6
Grade 7
Grade 8
Grade 9
Grade 10
Grade 11
Grade 12
Overall
Grade 6
Grade 7
Grade 8
Grade 9
Grade 10
Grade 11
Grade 12
Overall
Grade 6
Grade 7
Grade 8
Grade 9
Grade 10
Grade 11
Grade 12
Overall
Grade 6
Grade 7
Grade 8
Grade 9
Grade 10
Grade 11
Grade 12
Strongly disagree Disagree Somewhat disagree
Somewhat agree Agree Strongly agree
1. My study habits have improved.
2. I am more organized.
3. I am more committed to making my school work accurate.
4. I hold myself to a higher standard when it comes to my school work.
5. I am more committed to getting good grades.
Center for Applied Research and Educational Improvement, University of Minnesota 10
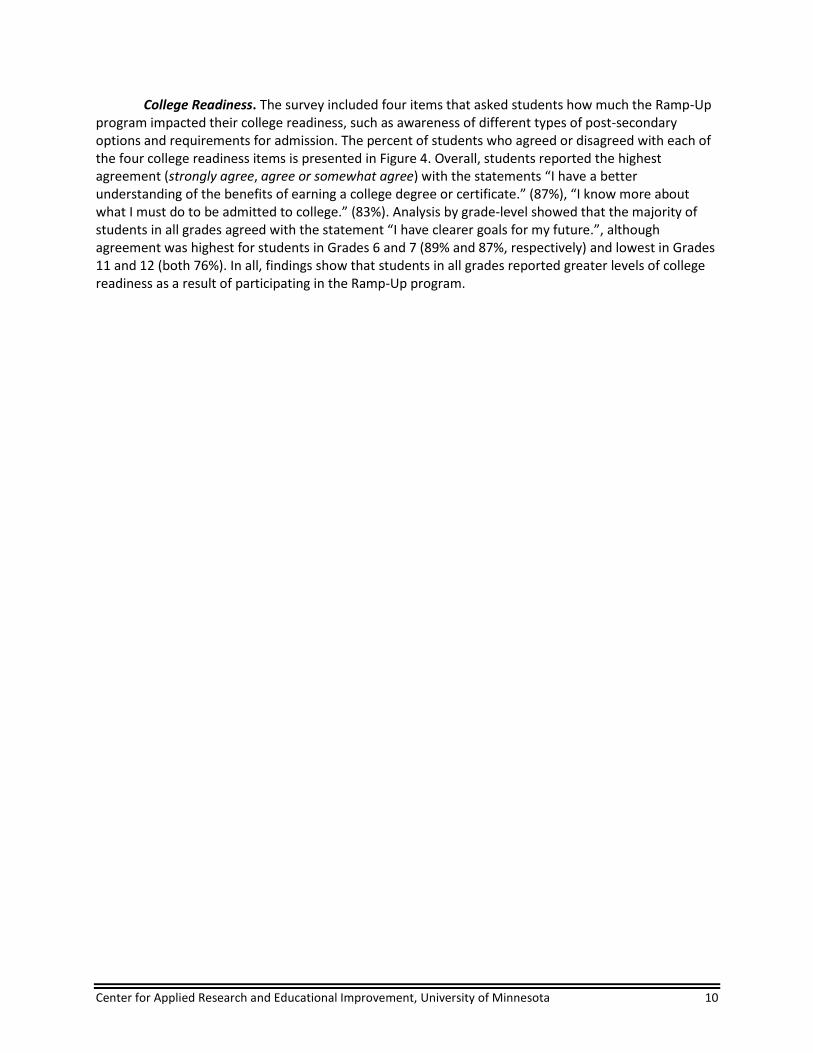
College Readiness. The survey included four items that asked students how much the Ramp-Up program impacted their college readiness, such as awareness of different types of post-secondary options and requirements for admission. The percent of students who agreed or disagreed with each of the four college readiness items is presented in Figure 4. Overall, students reported the highest agreement (strongly agree, agree or somewhat agree) with the statements “I have a better understanding of the benefits of earning a college degree or certificate.” (87%), “I know more about what I must do to be admitted to college.” (83%). Analysis by grade-level showed that the majority of students in all grades agreed with the statement “I have clearer goals for my future.”, although agreement was highest for students in Grades 6 and 7 (89% and 87%, respectively) and lowest in Grades 11 and 12 (both 76%). In all, findings show that students in all grades reported greater levels of college readiness as a result of participating in the Ramp-Up program.
Center for Applied Research and Educational Improvement, University of Minnesota 11
Figure 4. College Readiness Item-Level Responses, Overall and by Grade
5%
7%
6%
7%
5%
6%
6%
6%
6%
8%
6%
6%
6%
5%
8%
6%
7%
6%
5%
5%
7%
7%
8%
11%
7%
6%
7%
6%
7%
8%
8%
7%
10%
10%
11%
10%
8%
10%
10%
7%
8%
7%
10%
7%
8%
9%
7%
7%
8%
4%
7%
8%
10%
7%
9%
12%
28%
25%
29%
27%
26%
34%
26%
28%
30%
28%
33%
29%
31%
31%
27%
29%
30%
29%
31%
31%
30%
30%
28%
28%
29%
22%
30%
30%
31%
32%
32%
28%
39%
39%
36%
41%
41%
38%
39%
39%
35%
33%
33%
35%
38%
34%
37%
39%
37%
34%
35%
37%
38%
36%
40%
41%
34%
37%
37%
35%
36%
32%
30%
28%
20%
25%
23%
21%
19%
14%
20%
15%
16%
19%
16%
17%
14%
14%
17%
13%
16%
23%
15%
17%
17%
14%
15%
12%
19%
30%
20%
19%
13%
17%
14%
16%
0% 20% 40% 60% 80% 100%
Overall
Grade 6
Grade 7
Grade 8
Grade 9
Grade 10
Grade 11
Grade 12
Overall
Grade 6
Grade 7
Grade 8
Grade 9
Grade 10
Grade 11
Grade 12
Overall
Grade 6
Grade 7
Grade 8
Grade 9
Grade 10
Grade 11
Grade 12
Overall
Grade 6
Grade 7
Grade 8
Grade 9
Grade 10
Grade 11
Grade 12
Strongly disagree Disagree Somewhat disagree
Somewhat agree Agree Strongly agree
6. I have a better understanding of the benefits of earning a college degree or certificate.
7. I have a better understanding of the different types of college that will be the best fit for me.
8. I know more about what I must do to be admitted to college.
9. I have clearer
goals for my future.
Center for Applied Research and Educational Improvement, University of Minnesota 12
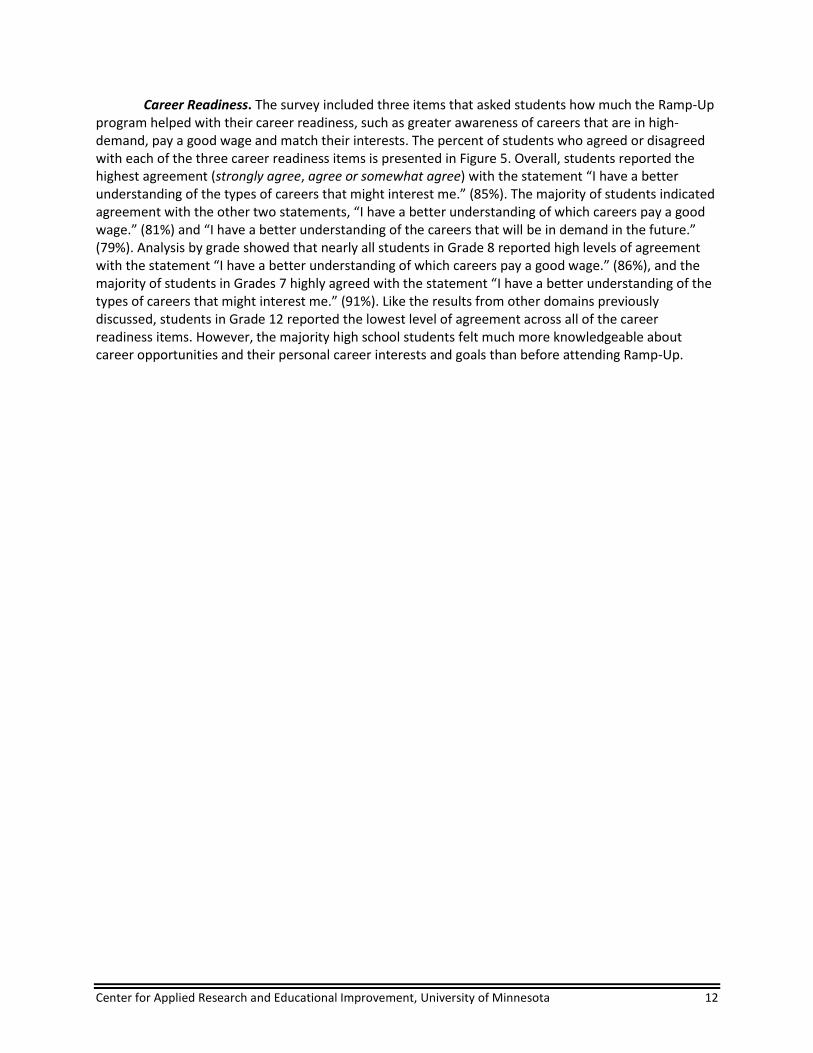
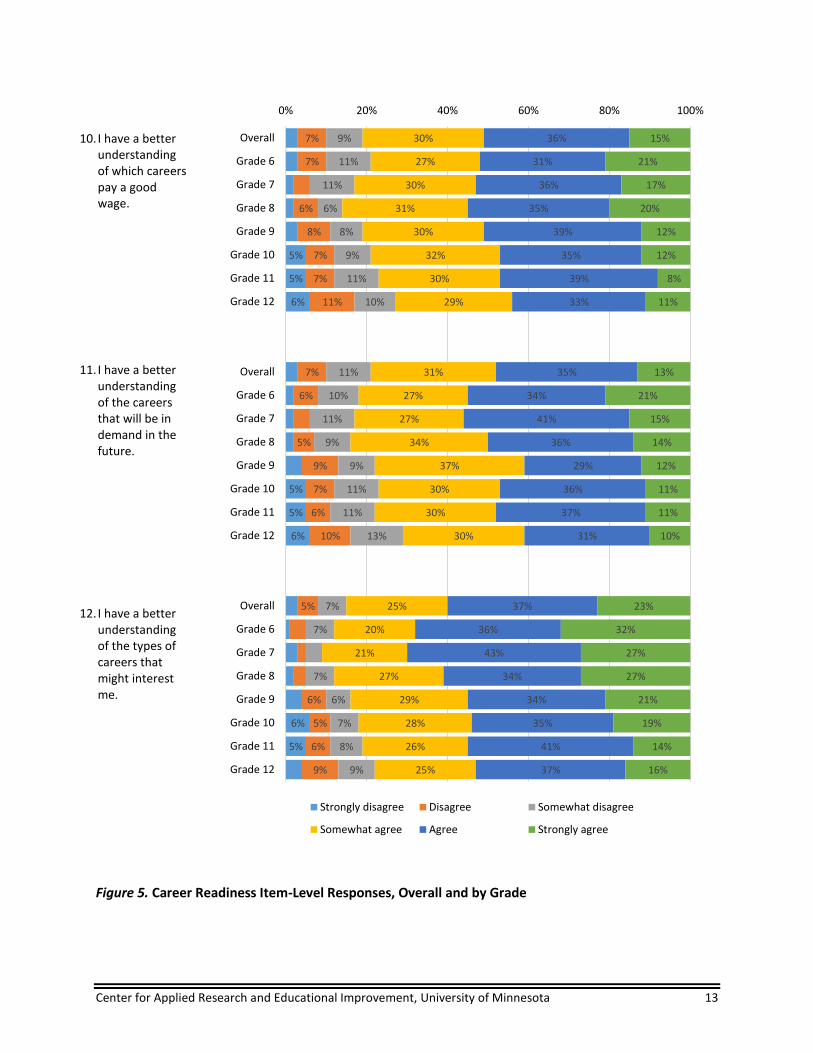
Career Readiness. The survey included three items that asked students how much the Ramp-Up program helped with their career readiness, such as greater awareness of careers that are in high-demand, pay a good wage and match their interests. The percent of students who agreed or disagreed with each of the three career readiness items is presented in Figure 5. Overall, students reported the highest agreement (strongly agree, agree or somewhat agree) with the statement “I have a better understanding of the types of careers that might interest me.” (85%). The majority of students indicated agreement with the other two statements, “I have a better understanding of which careers pay a good wage.” (81%) and “I have a better understanding of the careers that will be in demand in the future.” (79%). Analysis by grade showed that nearly all students in Grade 8 reported high levels of agreement with the statement “I have a better understanding of which careers pay a good wage.” (86%), and the majority of students in Grades 7 highly agreed with the statement “I have a better understanding of the types of careers that might interest me.” (91%). Like the results from other domains previously discussed, students in Grade 12 reported the lowest level of agreement across all of the career readiness items. However, the majority high school students felt much more knowledgeable about career opportunities and their personal career interests and goals than before attending Ramp-Up.
Center for Applied Research and Educational Improvement, University of Minnesota 13
Figure 5. Career Readiness Item-Level Responses, Overall and by Grade
5%
5%
6%
5%
5%
6%
6%
5%
7%
7%
6%
8%
7%
7%
11%
7%
6%
5%
9%
7%
6%
10%
5%
6%
5%
6%
9%
9%
11%
11%
6%
8%
9%
11%
10%
11%
10%
11%
9%
9%
11%
11%
13%
7%
7%
7%
6%
7%
8%
9%
30%
27%
30%
31%
30%
32%
30%
29%
31%
27%
27%
34%
37%
30%
30%
30%
25%
20%
21%
27%
29%
28%
26%
25%
36%
31%
36%
35%
39%
35%
39%
33%
35%
34%
41%
36%
29%
36%
37%
31%
37%
36%
43%
34%
34%
35%
41%
37%
15%
21%
17%
20%
12%
12%
8%
11%
13%
21%
15%
14%
12%
11%
11%
10%
23%
32%
27%
27%
21%
19%
14%
16%
0% 20% 40% 60% 80% 100%
Overall
Grade 6
Grade 7
Grade 8
Grade 9
Grade 10
Grade 11
Grade 12
Overall
Grade 6
Grade 7
Grade 8
Grade 9
Grade 10
Grade 11
Grade 12
Overall
Grade 6
Grade 7
Grade 8
Grade 9
Grade 10
Grade 11
Grade 12
Strongly disagree Disagree Somewhat disagree
Somewhat agree Agree Strongly agree
10. I have a better understanding of which careers pay a good wage.
11. I have a better understanding of the careers that will be in demand in the future.
12. I have a better understanding of the types of careers that might interest me.
Center for Applied Research and Educational Improvement, University of Minnesota 14
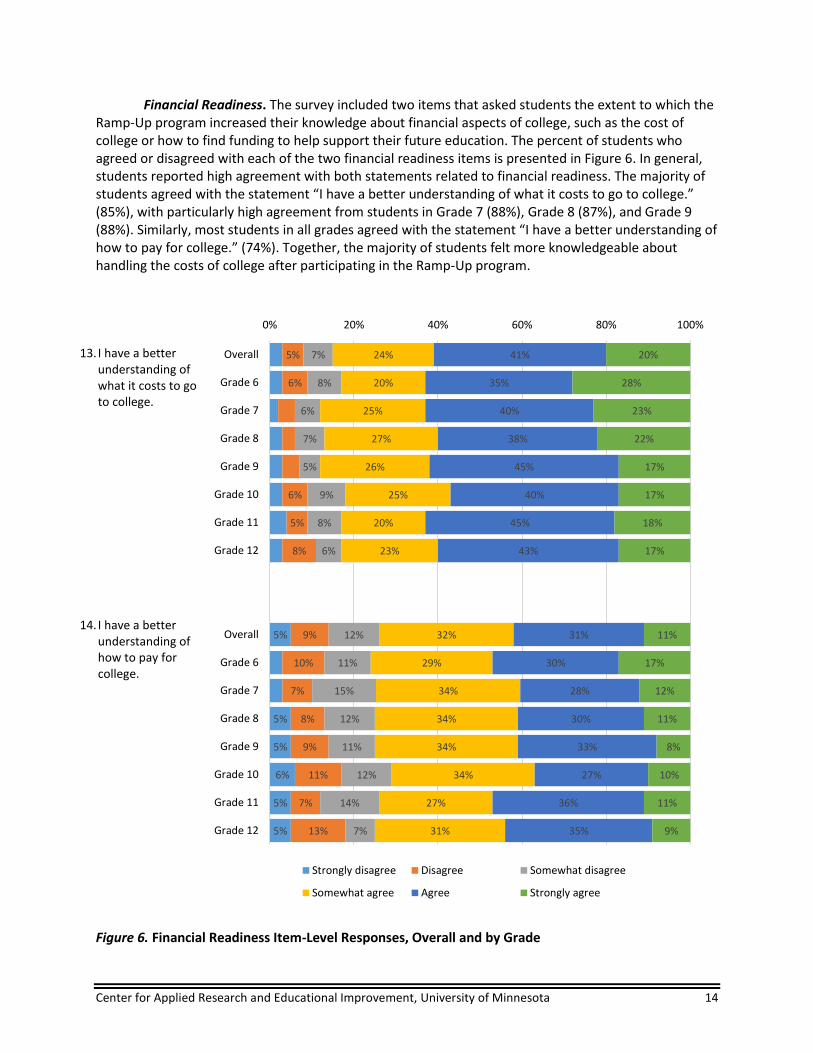
Financial Readiness. The survey included two items that asked students the extent to which the Ramp-Up program increased their knowledge about financial aspects of college, such as the cost of college or how to find funding to help support their future education. The percent of students who agreed or disagreed with each of the two financial readiness items is presented in Figure 6. In general, students reported high agreement with both statements related to financial readiness. The majority of students agreed with the statement “I have a better understanding of what it costs to go to college.” (85%), with particularly high agreement from students in Grade 7 (88%), Grade 8 (87%), and Grade 9 (88%). Similarly, most students in all grades agreed with the statement “I have a better understanding of how to pay for college.” (74%). Together, the majority of students felt more knowledgeable about handling the costs of college after participating in the Ramp-Up program.
Figure 6. Financial Readiness Item-Level Responses, Overall and by Grade
5%
5%
5%
6%
5%
5%
5%
6%
6%
5%
8%
9%
10%
7%
8%
9%
11%
7%
13%
7%
8%
6%
7%
5%
9%
8%
6%
12%
11%
15%
12%
11%
12%
14%
7%
24%
20%
25%
27%
26%
25%
20%
23%
32%
29%
34%
34%
34%
34%
27%
31%
41%
35%
40%
38%
45%
40%
45%
43%
31%
30%
28%
30%
33%
27%
36%
35%
20%
28%
23%
22%
17%
17%
18%
17%
11%
17%
12%
11%
8%
10%
11%
9%
0% 20% 40% 60% 80% 100%
Overall
Grade 6
Grade 7
Grade 8
Grade 9
Grade 10
Grade 11
Grade 12
Overall
Grade 6
Grade 7
Grade 8
Grade 9
Grade 10
Grade 11
Grade 12
Strongly disagree Disagree Somewhat disagree
Somewhat agree Agree Strongly agree
13. I have a better understanding of what it costs to go to college.
14. I have a better understanding of how to pay for college.

Center for Applied Research and Educational Improvement, University of Minnesota 15
Social Emotional Readiness. The survey included five items that asked students how much the Ramp-Up program influenced aspects of their personal growth and social or emotional development, such as positive beliefs about their abilities in school and tendency to seek support when faced with difficulty. The percent of students who agreed or disagreed with each of the five social emotional readiness items is presented in Figure 7. Overall, students reported the highest agreement (strongly agree, agree or somewhat agree) with the statements “I believe I can do well in school.” (91%), “I am more likely to attend college” (87%), and “I am more likely to seek help when I face an obstacle.” (81%). The results showed a grade-level pattern such that students in Grades 6-8 rated two items higher than students in high school, specifically “I am more likely to attend college” and “I am more likely to seek help when I face an obstacle.” In fact, ratings were highest across all social emotional readiness items for students in Grade 6. Results indicated that students in Grades 11 and 12 tended rated themselves higher on items related to having confidence in their abilities and their college and future plans, such as “I believe I can do well in school” (87% and 85%, respectively). However, students in Grade 11 and 12 rated themselves relatively lower in terms of organizational and time management skills, such as “I am more organized in school” (71% and 69%, respectively) and “I am better at managing my time” (68% and 67%, respectively) compared to other grade levels. In general, most students felt that participating in Ramp-Up benefited them socially and personally by encouraging them to seek support when facing difficulties and have greater confidence in their own abilities in school.

Center for Applied Research and Educational Improvement, University of Minnesota 16
Figure 7. Social Emotional Item-Level Responses, Overall and by Grade
5%
5%
7%
5%
6%
5%
5%
8%
5%
5%
6%
9%
7%
5%
6%
10%
6%
9%
15%
6%
5%
5%
7%
6%
5%
12%
8%
5%
8%
10%
9%
10%
15%
11%
5%
5%
6%
6%
6%
7%
6%
6%
6%
10%
7%
9%
10%
9%
8%
13%
12%
9%
5%
10%
7%
10%
10%
10%
10%
11%
10%
8%
11%
13%
13%
14%
13%
6%
5%
7%
25%
22%
20%
28%
24%
24%
26%
28%
32%
30%
31%
29%
35%
35%
31%
34%
32%
28%
30%
31%
34%
32%
36%
35%
38%
32%
42%
36%
40%
38%
35%
40%
20%
11%
16%
24%
21%
23%
19%
25%
34%
34%
35%
29%
36%
37%
34%
32%
32%
32%
37%
33%
30%
34%
31%
27%
35%
40%
36%
38%
36%
34%
33%
26%
29%
34%
31%
32%
25%
28%
26%
21%
41%
42%
36%
38%
43%
43%
44%
41%
28%
37%
34%
31%
24%
25%
23%
20%
15%
25%
16%
19%
12%
13%
9%
8%
14%
24%
15%
16%
9%
14%
10%
12%
10%
17%
10%
10%
7%
8%
7%
6%
30%
43%
37%
31%
26%
24%
24%
19%
0% 20% 40% 60% 80% 100%
Overall
Grade 6
Grade 7
Grade 8
Grade 9
Grade 10
Grade 11
Grade 12
Overall
Grade 6
Grade 7
Grade 8
Grade 9
Grade 10
Grade 11
Grade 12
Overall
Grade 6
Grade 7
Grade 8
Grade 9
Grade 10
Grade 11
Grade 12
Overall
Grade 6
Grade 7
Grade 8
Grade 9
Grade 10
Grade 11
Grade 12
Overall
Grade 6
Grade 7
Grade 8
Grade 9
Grade 10
Grade 11
Grade 12
Strongly disagree Disagree Somewhat disagree
Somewhat agree Agree Strongly agree
15. I am more likely to attend college.
16. I am more organized in school.
17. I am more likely to seek help when I face an obstacle.
18. I am better at managing my time.
19. I believe I can do well in school.

Center for Applied Research and Educational Improvement, University of Minnesota 17
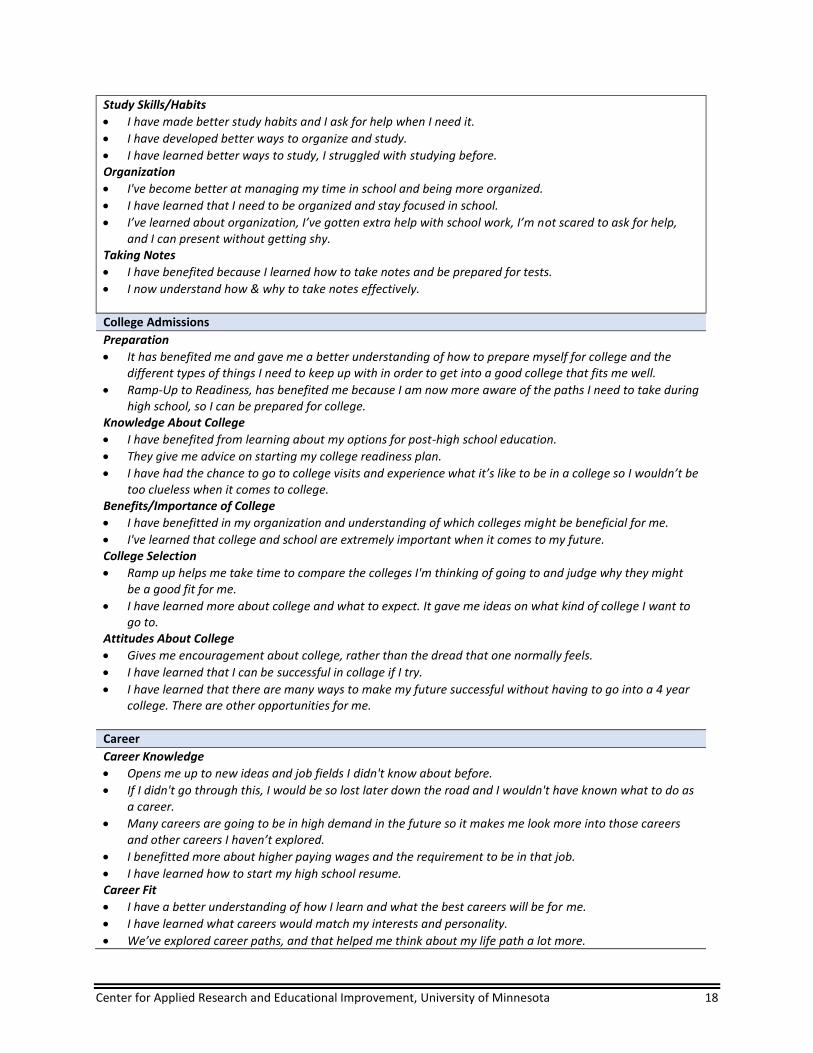
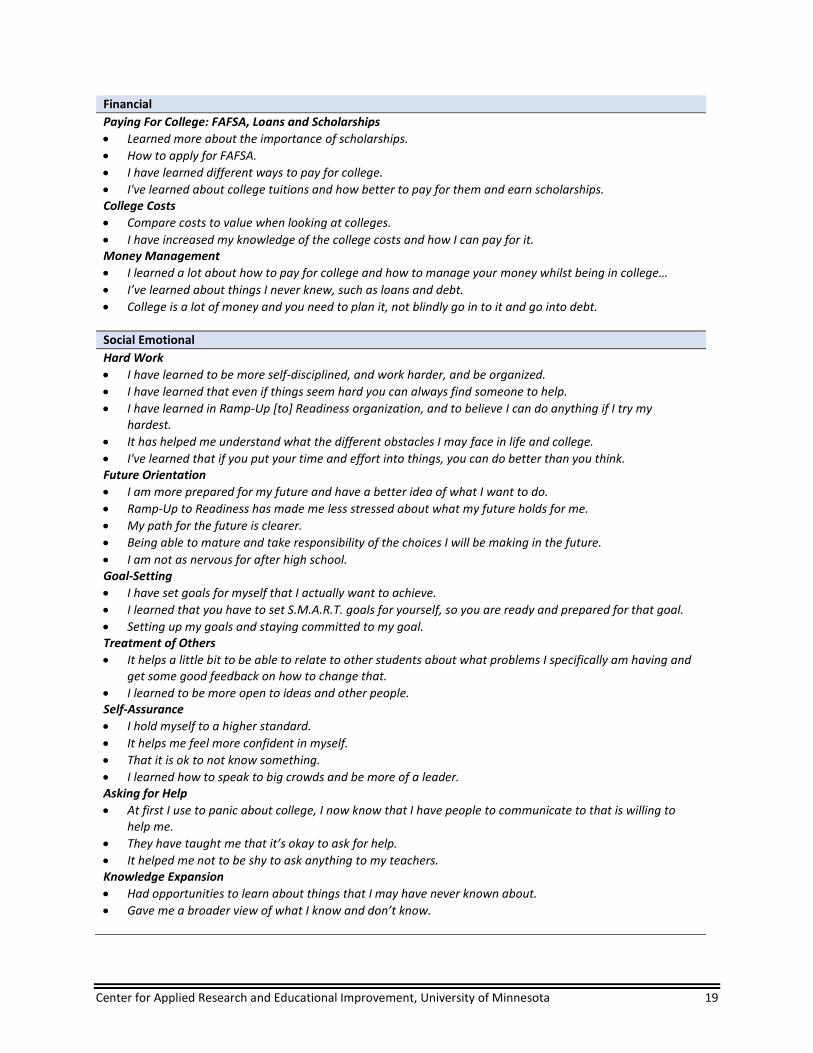
Student Comments about Ramp-Up Program Benefits Students were asked two open-ended questions about their perceptions of how the Ramp-Up program benefited them and what they learned through their participation. The comments were qualitatively analyzed by grouping them into the five readiness domains of the Ramp-Up program – academic, admission/college, career, financial, and social emotional readiness. Two evaluators independently coded the qualitative responses to determine inter-rater reliability. The coding process resulted in 97.3% agreement across all data. Any discrepancies were reviewed and consistently resolved. Survey comments were categorized into five domains of readiness. There were comments related to college and admissions readiness (n=941), followed by academic (n=634), social emotional (n=612), financial (n=254), and career readiness (n=196). Many of the comments that were provided related to multiple program areas and, therefore, were included in more than one category. For example, the comment “Ramp-Up helps me get ready for college and helps me decide what type of career I want in the future” would be coded as both college and career readiness. Table 2 below provides a sample of representative student quotes and the sub-themes within each readiness domain that emerged through analysis. The themes that emerged related to academic benefits included greater focus and motivation to do well in school (e.g., better grades), the development of good study habits and organizational skills (e.g., time management, using a planner, effective note taking), improved communication and public presentation skills, and asking for help from others more often. Themes that surfaced from the data regarding college readiness included being more knowledgeable about the process of preparing for college, such as applications and scholarships, as well as feeling more encouraged and excited to attend college. In addition, the comments revealed that students felt the Ramp-Up program helped them expand their awareness of the different types of colleges available to them, as well as reflect on which post-secondary options might be a good fit for their educational and career interests. Students shared that the program also benefited them by teaching about options for paying for college and how to apply for financial aid, such as scholarships and Free Application for Federal Students Aid (FAFSA), as well as general money management skills. In terms of their personal growth, students expressed benefits of learning to interact positively with their peers and support one another, as well as setting goals and having greater clarity about their future path. Table 2. Sample of Student Comments about Ramp-Up Program Benefits
Academic
Academic Motivation
I am more determined to do better academically.
I learned that I can do better in school if I try.
[Ramp Up] has helped me feel I can do [well] in school.
I have learned from Ramp-Up to Readiness that you have to be open to new challenges and accept that failure can help you improve. I have learned that you need to try your very best in school which will later on benefit you in college.
Grades
[Ramp Up] has made me more motivated to keep up good grades for the future.
My grades and self-motivation have both improved.
I've learned that to get good grades an important habit is to stay organized.
[My] grades went up and Act score increased.
Center for Applied Research and Educational Improvement, University of Minnesota 18
Study Skills/Habits
I have made better study habits and I ask for help when I need it.
I have developed better ways to organize and study.
I have learned better ways to study, I struggled with studying before. Organization
I've become better at managing my time in school and being more organized.
I have learned that I need to be organized and stay focused in school.
I’ve learned about organization, I’ve gotten extra help with school work, I’m not scared to ask for help, and I can present without getting shy.
Taking Notes
I have benefited because I learned how to take notes and be prepared for tests.
I now understand how & why to take notes effectively.
College Admissions
Preparation
It has benefited me and gave me a better understanding of how to prepare myself for college and the different types of things I need to keep up with in order to get into a good college that fits me well.
Ramp-Up to Readiness, has benefited me because I am now more aware of the paths I need to take during high school, so I can be prepared for college.
Knowledge About College
I have benefited from learning about my options for post-high school education.
They give me advice on starting my college readiness plan.
I have had the chance to go to college visits and experience what it’s like to be in a college so I wouldn’t be too clueless when it comes to college.
Benefits/Importance of College
I have benefitted in my organization and understanding of which colleges might be beneficial for me.
I've learned that college and school are extremely important when it comes to my future. College Selection
Ramp up helps me take time to compare the colleges I'm thinking of going to and judge why they might be a good fit for me.
I have learned more about college and what to expect. It gave me ideas on what kind of college I want to go to.
Attitudes About College
Gives me encouragement about college, rather than the dread that one normally feels.
I have learned that I can be successful in collage if I try.
I have learned that there are many ways to make my future successful without having to go into a 4 year college. There are other opportunities for me.
Career
Career Knowledge
Opens me up to new ideas and job fields I didn't know about before.
If I didn't go through this, I would be so lost later down the road and I wouldn't have known what to do as a career.
Many careers are going to be in high demand in the future so it makes me look more into those careers and other careers I haven’t explored.
I benefitted more about higher paying wages and the requirement to be in that job.
I have learned how to start my high school resume. Career Fit
I have a better understanding of how I learn and what the best careers will be for me.
I have learned what careers would match my interests and personality.
We’ve explored career paths, and that helped me think about my life path a lot more.
Center for Applied Research and Educational Improvement, University of Minnesota 19
Financial
Paying For College: FAFSA, Loans and Scholarships
Learned more about the importance of scholarships.
How to apply for FAFSA.
I have learned different ways to pay for college.
I've learned about college tuitions and how better to pay for them and earn scholarships. College Costs
Compare costs to value when looking at colleges.
I have increased my knowledge of the college costs and how I can pay for it. Money Management
I learned a lot about how to pay for college and how to manage your money whilst being in college…
I’ve learned about things I never knew, such as loans and debt.
College is a lot of money and you need to plan it, not blindly go in to it and go into debt.
Social Emotional
Hard Work
I have learned to be more self-disciplined, and work harder, and be organized.
I have learned that even if things seem hard you can always find someone to help.
I have learned in Ramp-Up [to] Readiness organization, and to believe I can do anything if I try my hardest.
It has helped me understand what the different obstacles I may face in life and college.
I've learned that if you put your time and effort into things, you can do better than you think. Future Orientation
I am more prepared for my future and have a better idea of what I want to do.
Ramp-Up to Readiness has made me less stressed about what my future holds for me.
My path for the future is clearer.
Being able to mature and take responsibility of the choices I will be making in the future.
I am not as nervous for after high school. Goal-Setting
I have set goals for myself that I actually want to achieve.
I learned that you have to set S.M.A.R.T. goals for yourself, so you are ready and prepared for that goal.
Setting up my goals and staying committed to my goal. Treatment of Others
It helps a little bit to be able to relate to other students about what problems I specifically am having and get some good feedback on how to change that.
I learned to be more open to ideas and other people. Self-Assurance
I hold myself to a higher standard.
It helps me feel more confident in myself.
That it is ok to not know something.
I learned how to speak to big crowds and be more of a leader. Asking for Help
At first I use to panic about college, I now know that I have people to communicate to that is willing to help me.
They have taught me that it’s okay to ask for help.
It helped me not to be shy to ask anything to my teachers. Knowledge Expansion
Had opportunities to learn about things that I may have never known about.
Gave me a broader view of what I know and don’t know.
Center for Applied Research and Educational Improvement, University of Minnesota 20
Summary
This report describes findings from an examination of students’ perceptions of the benefits of participating in the Ramp-Up to Readiness program, developed by the College Readiness Consortium (CRC) at the University of Minnesota. The primary purpose of this study was to measure the extent to which students in middle and high school attributed their participation in the Ramp-Up program to greater readiness for postsecondary education and careers. The study involved five school districts in Minnesota that provided the Ramp-Up program to all students throughout middle and high school. School districts that had been implementing Ramp-Up school-wide for four years or more were selected for the study so that students were more likely to have multiple years of exposure to the program activities and lessons. The survey instrument used in this study was developed by CAREI evaluators and program administrators to systematically measure student outcomes across the five readiness pillars of the Ramp-Up program: academic, college admissions, career, financial, and social emotional. The survey included 19 scale items and two open-ended questions asking about ways in which the program might have helped students. The final survey sample included 2771 students in Grades 6 through 12, which provided a sufficient sample size to detect any potential program effects. In addition, an exploratory factor analysis (EFA) was conducted to ensure that the survey measure was functioning as expected, and that students were distinguishing between the major constructs that the survey was designed to measure. Results of the EFA confirmed that the survey instrument measured the domains of readiness as intended for the Ramp-Up program. Thus, the study findings are discussed in terms of students’ academic, college, career, financial, and social emotional readiness outcomes. Overall, survey results showed that students in middle and high school, on average, reported considerably higher levels of college and career readiness because of participating in the Ramp-Up program. In fact, 91% of all students agreed with the statement “I believe I can do well in school,” and 88% agreed with the statement “I am more committed to getting good grades.” based on their experience in Ramp-Up. In addition to academic and school benefits, students also perceived having greater awareness of the advantages of postsecondary education, with 87% agreeing with the statement “I have a better understanding of the benefits of earning a college degree or certificate.” As many as 87% of students had higher college expectations and viewed themselves as college-bound individuals, as shown by 87% agreeing with the statement “I am more likely to attend college.” These findings suggest that Ramp-Up is contributing to greater academic motivation and educational aspirations of students, which is associated with educational and employment attainment later in life (Byun, Meece, & Irvin, 2012). Additionally, results showed that the Ramp-Up program bolstered students’ “college knowledge” by increasing their access to information about college admission requirements, the various types of colleges that exist, and the cost of attending. For instance, 81% of students agreed with the statement “I have a better understanding of the different types of colleges that will be the best fit for me.” and 83% agreed with “I know more about what I must do to be admitted to college.” Further, 85% of students agreed with the statement “I have a better understanding of what it costs to go to college.” These results are notable because of the college knowledge gap within Minnesota such that students from underrepresented groups (e.g., low socio-economic status, first generation college-going, or racial/ethnic minorities) tend to not enroll in postsecondary institutions that best align with their skills and interests (Djurovich & Fergus, 2017). In addition, concern about the cost of college has been identified in the literature as a primary barrier for students in pursuing postsecondary education
Center for Applied Research and Educational Improvement, University of Minnesota 21
(Molefe, Burke, Collins, Sparks, & Hoyer, 2017). Finally, lack of access to college can also have serious economic consequences because individuals with higher levels of postsecondary education are more likely to obtain employment and earn a higher income (Baum, Ma, & Payea, 2013; Sommers & Morisi, 2012). The analysis also revealed grade level differences such that students in younger grades (6-8) reported higher ratings of readiness compared to students in older grades (9-12). This difference between grades was most evident within the area of academic readiness (e.g., study and organizational skills). For example, on average 91% of students in Grade 6 reported agreement with the statement “My study habits have improved,” as a result of attending Ramp-Up, compared to 75% of students in Grade 12. Similarly, the majority of students in Grade 6 (87%) and Grade 7 (84%) agreed with “I am more organized in school,” whereas agreement was lower for Grade 11 (71%) and Grade 12 (69%). Future examination of this grade level pattern might reveal whether differences among students are related to certain factors, such as greater perceived growth for younger students who recently enter the program or greater demands on older students to stay organized and manage time due to increased workload and rigor of coursework. Taken together, the findings in this report suggest that the Ramp-Up program is benefiting students across all grade levels in this sample of middle and high school, and that the program positively impacts multiple, inter-related areas of students’ readiness for educational and career success.
References
Baum, S., Ma, J., & Payea, K. (2013). Education pays 2013: The benefits of higher education for individuals and society. New York: The College Board. Retrieved from https://trends.collegeboard.org/sites/default/files/education-pays-2013-full-report.pdf Byun, S., Meece, J.L., Irvin, M. J. (2012). Rural-nonrual disparities in postsecondary educational attainment revisited. American Educational Research Journal, 49(3), 412-437. Djurovich, A., & Fergus, M. (2017). Minnesota measures: A 2017 report on higher education performance. Saint Paul, MN: Minnesota Office of Higher Education. Retrieved from http://www.ohe.state.mn.us/pdf/MinnesotaMeasures2017.pdf Molefe, A., Burke, M.R., Collins, N., Sparks, D., & Hoyer, K. (2017). Postsecondary education expectations and attainment of rural and nonrural students. Washington, DC: U.S. Department of Education, Institute of Education Sciences, National Center for Education Evaluation and Regional Assistance, Regional Educational Laboratory Midwest. Retrieved from https://ies.ed.gov/ncee/edlabs/regions/midwest/pdf/REL_2017257.pdf Sommers, D., & Morisi, T. L. (2012). Employment projections through the lens of education and training. Monthly Labor Review. Washington, DC: U.S. Department of Labor, Bureau of Labor Statistics. Retrieved from https://www.bls.gov/opub/mlr/2012/04/art2full.pdf

Center for Applied Research and Educational Improvement, University of Minnesota 22
Appendix A: Factor Loadings of Survey Items
Table A1. Factor Loadings for Principal Factors Extraction and Oblimin Rotation on Survey Items Survey Item Factor 1 Factor 2
1. I am more committed to making my school work accurate. .91
2. I hold myself to a higher standard when it comes to my school work. .90
3. I am more committed to getting good grades. .90
4. I am more organized. .86
5. I am more organized in school. .85
6. My study habits have improved. .83
7. I am better at managing my time. .72
8. I am more likely to seek help when I face an obstacle. .68
9. I believe I can do well in school. .67
10. I am more likely to attend college. .47 .34
11. I have clearer goals for my future. .43 .43
12. I have a better understanding of what it costs to go to college. .87
13. I know more about what I must do to be admitted to college. .84
14. I have a better understanding of the different types of college that will be the best fit for me. .83
15. I have a better understanding of which careers pay a good wage. .83
16. I have a better understanding of how to pay for college. .79
17. I have a better understanding of the careers that will be in demand in the future. .79
18. I have a better understanding of the benefits of earning a college degree or certificate. .67
19. I have a better understanding of the types of career that might interest me. .67
Center for Applied Research and Educational Improvement, University of Minnesota 23
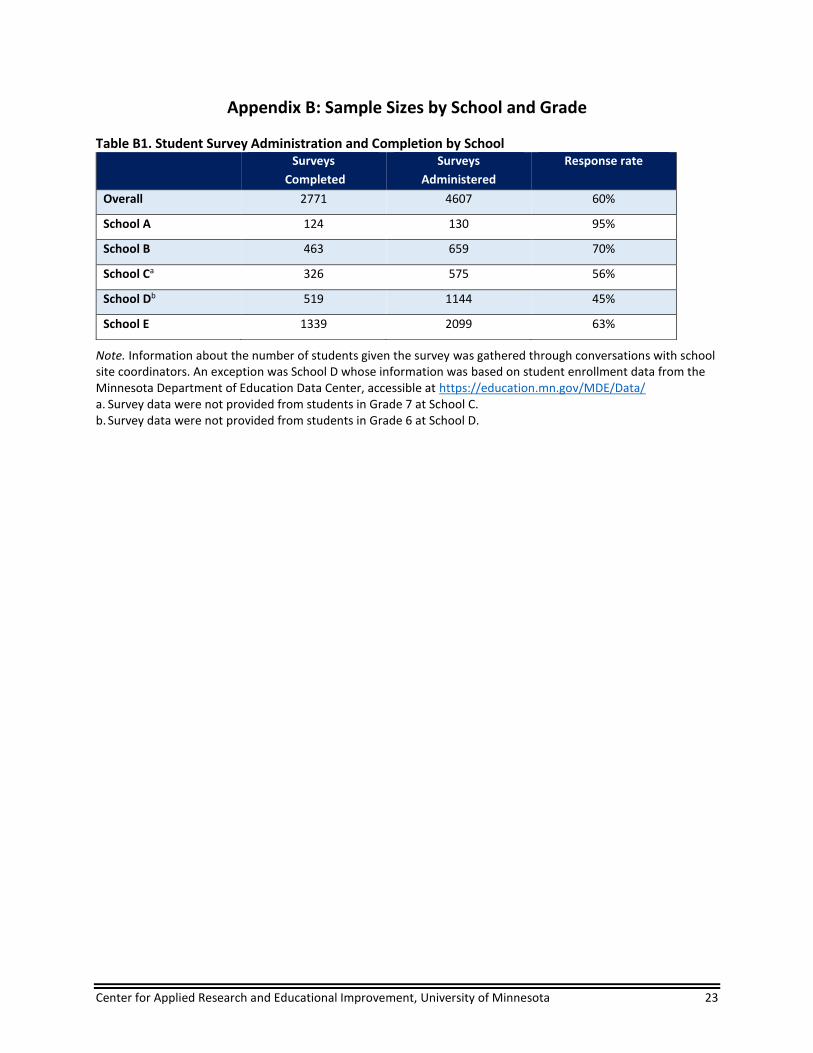
Appendix B: Sample Sizes by School and Grade
Table B1. Student Survey Administration and Completion by School
Note. Information about the number of students given the survey was gathered through conversations with school site coordinators. An exception was School D whose information was based on student enrollment data from the Minnesota Department of Education Data Center, accessible at https://education.mn.gov/MDE/Data/ a. Survey data were not provided from students in Grade 7 at School C. b. Survey data were not provided from students in Grade 6 at School D.
Surveys
Completed
Surveys
Administered
Response rate
Overall 2771 4607 60%
School A 124 130 95%
School B 463 659 70%
School Ca 326 575 56%
School Db 519 1144 45%
School E 1339 2099 63%
Center for Applied Research and Educational Improvement, University of Minnesota 24
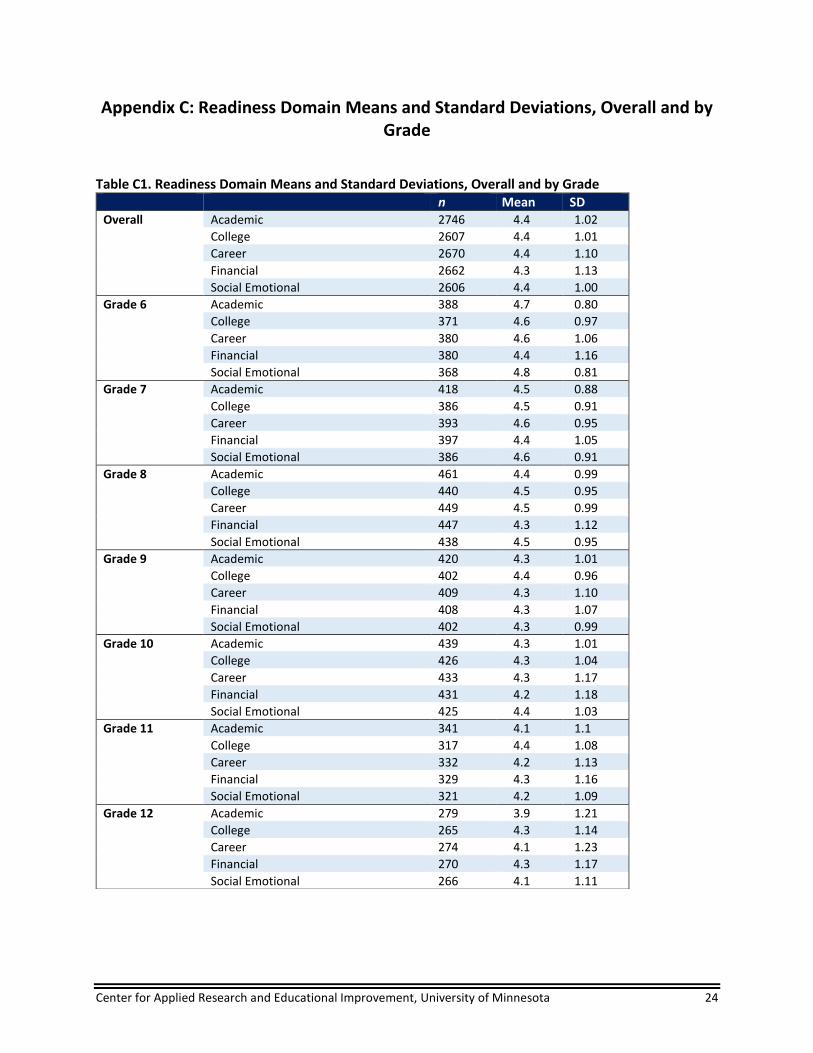
Appendix C: Readiness Domain Means and Standard Deviations, Overall and by Grade
Table C1. Readiness Domain Means and Standard Deviations, Overall and by Grade
n Mean SD Overall Academic 2746 4.4 1.02
College 2607 4.4 1.01
Career 2670 4.4 1.10
Financial 2662 4.3 1.13
Social Emotional 2606 4.4 1.00
Grade 6 Academic 388 4.7 0.80
College 371 4.6 0.97
Career 380 4.6 1.06
Financial 380 4.4 1.16
Social Emotional 368 4.8 0.81
Grade 7 Academic 418 4.5 0.88
College 386 4.5 0.91
Career 393 4.6 0.95
Financial 397 4.4 1.05
Social Emotional 386 4.6 0.91
Grade 8 Academic 461 4.4 0.99
College 440 4.5 0.95
Career 449 4.5 0.99
Financial 447 4.3 1.12
Social Emotional 438 4.5 0.95
Grade 9 Academic 420 4.3 1.01
College 402 4.4 0.96
Career 409 4.3 1.10
Financial 408 4.3 1.07
Social Emotional 402 4.3 0.99
Grade 10 Academic 439 4.3 1.01
College 426 4.3 1.04
Career 433 4.3 1.17
Financial 431 4.2 1.18
Social Emotional 425 4.4 1.03
Grade 11 Academic 341 4.1 1.1
College 317 4.4 1.08
Career 332 4.2 1.13
Financial 329 4.3 1.16
Social Emotional 321 4.2 1.09
Grade 12 Academic 279 3.9 1.21
College 265 4.3 1.14
Career 274 4.1 1.23
Financial 270 4.3 1.17
Social Emotional 266 4.1 1.11
Center for Applied Research and Educational Improvement, University of Minnesota 25
Appendix D: Item-Level Responses by Domain, Overall
Table D1. Item-Level Responses by Domain, Overall
Domain and Item n Strongly disagree Disagree
Somewhat disagree
Somewhat agree Agree
Strongly agree
Academic Readiness 1. My study habits have improved. 2746 4% 8% 8% 45% 28% 7%
2. I am more organized. 2746 3% 9% 10% 35% 31% 12% 3. I am more committed to making
my school work accurate. 2746 3% 6% 7% 30% 41% 13%
4. I hold myself to a higher standard when it comes to my school work.
2746 3% 6% 7% 31% 37% 16%
5. I am more committed to getting good grades.
2746 3% 4% 5% 21% 38% 29%
College Readiness 6. I have a better understanding
of the benefits of earning a college degree or certificate.
2607 2% 4% 7% 28% 39% 20%
7. I have a better understanding of the different types of college that will be the best fit for me.
2607 3% 6% 10% 30% 35% 16%
8. I know more about what I must do to be admitted to college.
2607 3% 6% 8% 30% 37% 16%
9. I have clearer goals for my future.
2607 4% 6% 8% 29% 34% 19%
Career Readiness 10. I have a better understanding
of which careers pay a good wage.
2670 3% 7% 9% 30% 36% 15%
11. I have a better understanding of the careers that will be in demand in the future.
2670 3% 7% 11% 31% 35% 13%
12. I have a better understanding of the types of career that might interest me.
2670 3% 5% 7% 25% 37% 23%
Financial Readiness 13. I have a better understanding
of what it costs to go to college. 2662 3% 5% 7% 24% 41% 20%
14. I have a better understanding of how to pay for college.
2662 5% 9% 12% 32% 31% 11%
Social Emotional Readiness 15. I am more likely to attend
college. 2606 3% 4% 6% 25% 34% 28%
16. I am more organized in school. 2606 4% 7% 10% 32% 32% 15% 17. I am more likely to seek help
when I face an obstacle. 2606 4% 6% 9% 32% 35% 14%
18. I am better at managing my time.
2606 4% 8% 11% 38% 29% 10%
19. I believe I can do well in school. 2606 3% 2% 4% 20% 41% 30%

Center for Applied Research and Educational Improvement, University of Minnesota 26
Appendix E: Item-Level Responses by Domain and Grade
Table E1. Item-Level Responses by Domain, Grade 6
Domain and Item n Strongly disagree Disagree
Somewhat disagree
Somewhat agree Agree
Strongly agree
Academic Readiness 20. My study habits have improved. 388 2% 3% 4% 41% 37% 13%
21. I am more organized. 388 2% 4% 8% 35% 34% 17% 22. I am more committed to making
my school work accurate. 388 1% 1% 3% 26% 43% 26%
23. I hold myself to a higher standard when it comes to my school work.
388 2% 1% 7% 25% 39% 26%
24. I am more committed to getting good grades.
388 1% 1% 3% 15% 33% 47%
College Readiness 25. I have a better understanding
of the benefits of earning a college degree or certificate.
371 2% 3% 6% 25% 39% 25%
26. I have a better understanding of the different types of college that will be the best fit for me.
371 3% 7% 10% 28% 33% 19%
27. I know more about what I must do to be admitted to college.
371 1% 6% 7% 29% 34% 23%
28. I have clearer goals for my future.
371 3% 5% 3% 22% 37% 30%
Career Readiness 29. I have a better understanding
of which careers pay a good wage.
380 3% 7% 11% 27% 31% 21%
30. I have a better understanding of the careers that will be in demand in the future.
380 2% 6% 10% 27% 34% 21%
31. I have a better understanding of the types of career that might interest me.
380 1% 4% 7% 20% 36% 32%
Financial Readiness 32. I have a better understanding
of what it costs to go to college. 705 3% 6% 8% 20% 35% 28%
33. I have a better understanding of how to pay for college.
696 3% 10% 11% 29% 30% 17%
Social Emotional Readiness 34. I am more likely to attend
college. 368 2% 1% 4% 22% 34% 37%
35. I am more organized in school. 368 3% 3% 7% 30% 32% 25% 36. I am more likely to seek help
when I face an obstacle. 368 1% 2% 5% 28% 40% 24%
37. I am better at managing my time.
368 3% 4% 10% 32% 34% 17%
38. I believe I can do well in school. 368 1% 11% 2% 11% 42% 43%

Center for Applied Research and Educational Improvement, University of Minnesota 27
Table E2. Item-Level Responses by Domain, Grade 7
Domain and Item n Strongly disagree Disagree
Somewhat disagree
Somewhat agree Agree
Strongly agree
Academic Readiness 1. My study habits have
improved. 418 3% 4% 7% 48% 32% 6%
2. I am more organized. 418 2% 6% 9% 34% 37% 12% 3. I am more committed to
making my school work accurate.
418 1% 2% 6% 27% 49% 15%
4. I hold myself to a higher standard when it comes to my school work.
418 1% 2% 9% 28% 42% 18%
5. I am more committed to getting good grades.
418 2% 3% 5% 16% 43% 31%
College Readiness 6. I have a better understanding
of the benefits of earning a college degree or certificate.
386 1% 4% 7% 29% 36% 23%
7. I have a better understanding of the different types of college that will be the best fit for me.
386 2% 5% 11% 33% 33% 16%
8. I know more about what I must do to be admitted to college.
386 3% 6% 10% 31% 35% 15%
9. I have clearer goals for my future.
386 2% 4% 7% 30% 37% 20%
Career Readiness 10. I have a better understanding
of which careers pay a good wage.
393 2% 4% 11% 30% 36% 17%
11. I have a better understanding of the careers that will be in demand in the future.
393 2% 4% 11% 27% 41% 15%
12. I have a better understanding of the types of career that might interest me.
393 3% 2% 4% 21% 43% 27%
Financial Readiness 13. I have a better understanding
of what it costs to go to college.
397 2% 4% 6% 25% 40% 23%
14. I have a better understanding of how to pay for college.
397 3% 7% 15% 34% 28% 12%
Social Emotional Readiness 15. I am more likely to attend
college. 386 3% 2% 6% 20% 35% 34%
16. I am more organized in school. 386 2% 5% 9% 31% 37% 16% 17. I am more likely to seek help
when I face an obstacle. 386 4% 5% 10% 30% 36% 15%
18. I am better at managing my time.
386 4% 5% 8% 42% 31% 10%
19. I believe I can do well in school.
386 3% 2% 6% 16% 36% 37%

Center for Applied Research and Educational Improvement, University of Minnesota 28
Table E3. Item-Level Responses by Domain, Grade 8
Domain and Item n Strongly disagree Disagree
Somewhat disagree
Somewhat agree Agree
Strongly agree
Academic Readiness 1. My study habits have
improved. 461 4% 8% 8% 43% 29% 8%
2. I am more organized. 461 3% 9% 8% 33% 32% 15% 3. I am more committed to
making my school work accurate.
461 3% 4% 5% 32% 41% 15%
4. I hold myself to a higher standard when it comes to my school work.
461 2% 5% 7% 33% 36% 17%
5. I am more committed to getting good grades.
461 2% 4% 4% 24% 37% 29%
College Readiness 6. I have a better understanding
of the benefits of earning a college degree or certificate.
440 2% 3% 6% 27% 41% 21%
7. I have a better understanding of the different types of college that will be the best fit for me.
440 3% 6% 10% 29% 35% 17%
8. I know more about what I must do to be admitted to college.
440 3% 5% 7% 31% 37% 17%
9. I have clearer goals for my future.
440 3% 5% 8% 30% 35% 19%
Career Readiness 10. I have a better understanding
of which careers pay a good wage.
449 2% 6% 6% 31% 35% 20%
11. I have a better understanding of the careers that will be in demand in the future.
449 2% 5% 9% 34% 36% 14%
12. I have a better understanding of the types of career that might interest me.
449 2% 3% 7% 27% 34% 27%
Financial Readiness 13. I have a better understanding
of what it costs to go to college.
447 3% 3% 7% 27% 38% 22%
14. I have a better understanding of how to pay for college.
447 5% 8% 12% 34% 30% 11%
Social Emotional Readiness 15. I am more likely to attend
college. 438 3% 3% 6% 28% 29% 31%
16. I am more organized in school. 438 3% 6% 10% 29% 33% 19% 17. I am more likely to seek help
when I face an obstacle. 438 3% 5% 7% 31% 38% 16%
18. I am better at managing my time.
438 3% 8% 11% 36% 32% 10%
19. I believe I can do well in school.
438 2% 2% 3% 24% 38% 31%

Center for Applied Research and Educational Improvement, University of Minnesota 29
Table E4. Item-Level Responses by Domain, Grade 9
Domain and Item n Strongly disagree Disagree
Somewhat disagree
Somewhat agree Agree
Strongly agree
Academic Readiness 1. My study habits have
improved. 420 3% 10% 10% 49% 22% 6%
2. I am more organized. 420 4% 10% 10% 39% 26% 11% 3. I am more committed to
making my school work accurate.
420 3% 8% 8% 31% 39% 11%
4. I hold myself to a higher standard when it comes to my school work.
420 2% 10% 7% 30% 38% 13%
5. I am more committed to getting good grades.
420 3% 5% 4% 20% 42% 26%
College Readiness 6. I have a better understanding
of the benefits of earning a college degree or certificate.
440 2% 5% 7% 26% 41% 19%
7. I have a better understanding of the different types of college that will be the best fit for me.
440 3% 6% 8% 31% 38% 14%
8. I know more about what I must do to be admitted to college.
440 3% 4% 8% 30% 38% 17%
9. I have clearer goals for my future.
440 3% 7% 10% 31% 36% 13%
Career Readiness 10. I have a better understanding
of which careers pay a good wage.
409 3% 8% 8% 30% 39% 12%
11. I have a better understanding of the careers that will be in demand in the future.
409 4% 9% 9% 37% 29% 12%
12. I have a better understanding of the types of career that might interest me.
409 4% 6% 6% 29% 34% 21%
Financial Readiness 13. I have a better understanding
of what it costs to go to college.
408 3% 4% 5% 26% 45% 17%
14. I have a better understanding of how to pay for college.
408 5% 9% 11% 34% 33% 8%
Social Emotional Readiness 15. I am more likely to attend
college. 402 4% 5% 7% 24% 36% 24%
16. I am more organized in school. 402 4% 10% 9% 35% 30% 12% 17. I am more likely to seek help
when I face an obstacle. 402 5% 7% 10% 34% 36% 9%
18. I am better at managing my time.
402 5% 10% 13% 40% 25% 7%
19. I believe I can do well in school.
402 3% 3% 4% 21% 43% 26%

Center for Applied Research and Educational Improvement, University of Minnesota 30
Table E5. Item-Level Responses by Domain, Grade 10
Domain and Item n Strongly disagree Disagree
Somewhat disagree
Somewhat agree Agree
Strongly agree
Academic Readiness 1. My study habits have
improved. 439 4% 8% 8% 48% 27% 5%
2. I am more organized. 439 3% 8% 8% 38% 34% 9% 3. I am more committed to
making my school work accurate.
439 4% 6% 8% 30% 42% 10%
4. I hold myself to a higher standard when it comes to my school work.
439 3% 7% 8% 31% 38% 13%
5. I am more committed to getting good grades.
439 3% 3% 6% 24% 38% 26%
College Readiness 6. I have a better understanding
of the benefits of earning a college degree or certificate.
402 4% 3% 8% 34% 38% 14%
7. I have a better understanding of the different types of college that will be the best fit for me.
402 5% 6% 10% 31% 34% 14%
8. I know more about what I must do to be admitted to college.
402 3% 8% 9% 30% 36% 14%
9. I have clearer goals for my future.
402 3% 7% 10% 31% 36% 13%
Career Readiness 10. I have a better understanding
of which careers pay a good wage.
433 5% 7% 9% 32% 35% 12%
11. I have a better understanding of the careers that will be in demand in the future.
433 5% 7% 11% 30% 36% 11%
12. I have a better understanding of the types of career that might interest me.
433 6% 5% 7% 28% 35% 19%
Financial Readiness 13. I have a better understanding
of what it costs to go to college.
431 3% 6% 9% 25% 40% 17%
14. I have a better understanding of how to pay for college.
431 6% 11% 12% 34% 27% 10%
Social Emotional Readiness 15. I am more likely to attend
college. 425 4% 4% 6% 24% 37% 25%
16. I am more organized in school. 425 4% 6% 8% 35% 34% 13% 17. I am more likely to seek help
when I face an obstacle. 425 4% 6% 10% 32% 34% 14%
18. I am better at managing my time.
425 4% 9% 13% 38% 28% 8%
19. I believe I can do well in school.
425 4% 2% 4% 23% 43% 24%

Center for Applied Research and Educational Improvement, University of Minnesota 31
Table E6. Item-Level Responses by Domain, Grade 11
Domain and Item n Strongly disagree Disagree
Somewhat disagree
Somewhat agree Agree
Strongly agree
Academic Readiness 1. My study habits have
improved. 341 5% 10% 10% 43% 26% 6%
2. I am more organized. 341 5% 11% 13% 36% 26% 9% 3. I am more committed to
making my school work accurate.
341 4% 8% 12% 31% 36% 9%
4. I hold myself to a higher standard when it comes to my school work.
341 5% 5% 9% 36% 32% 13%
5. I am more committed to getting good grades.
341 4% 6% 6% 21% 40% 23%
College Readiness 6. I have a better understanding
of the benefits of earning a college degree or certificate.
317 3% 4% 8% 26% 39% 20%
7. I have a better understanding of the different types of college that will be the best fit for me.
317 3% 6% 10% 27% 37% 17%
8. I know more about what I must do to be admitted to college.
317 4% 6% 7% 28% 40% 15%
9. I have clearer goals for my future.
317 7% 8% 9% 32% 30% 14%
Career Readiness 10. I have a better understanding
of which careers pay a good wage.
332 5% 7% 11% 30% 39% 8%
11. I have a better understanding of the careers that will be in demand in the future.
332 5% 6% 11% 30% 37% 11%
12. I have a better understanding of the types of career that might interest me.
332 5% 6% 8% 26% 41% 14%
Financial Readiness 13. I have a better understanding
of what it costs to go to college.
329 4% 5% 8% 20% 45% 18%
14. I have a better understanding of how to pay for college.
329 5% 7% 14% 27% 36% 11%
Social Emotional Readiness 15. I am more likely to attend
college. 321 5% 6% 6% 26% 34% 23%
16. I am more organized in school. 321 7% 9% 13% 31% 31% 9% 17. I am more likely to seek help
when I face an obstacle. 321 6% 5% 10% 36% 33% 10%
18. I am better at managing my time.
321 8% 10% 14% 35% 26% 7%
19. I believe I can do well in school.
321 3% 5% 5% 19% 44% 24%
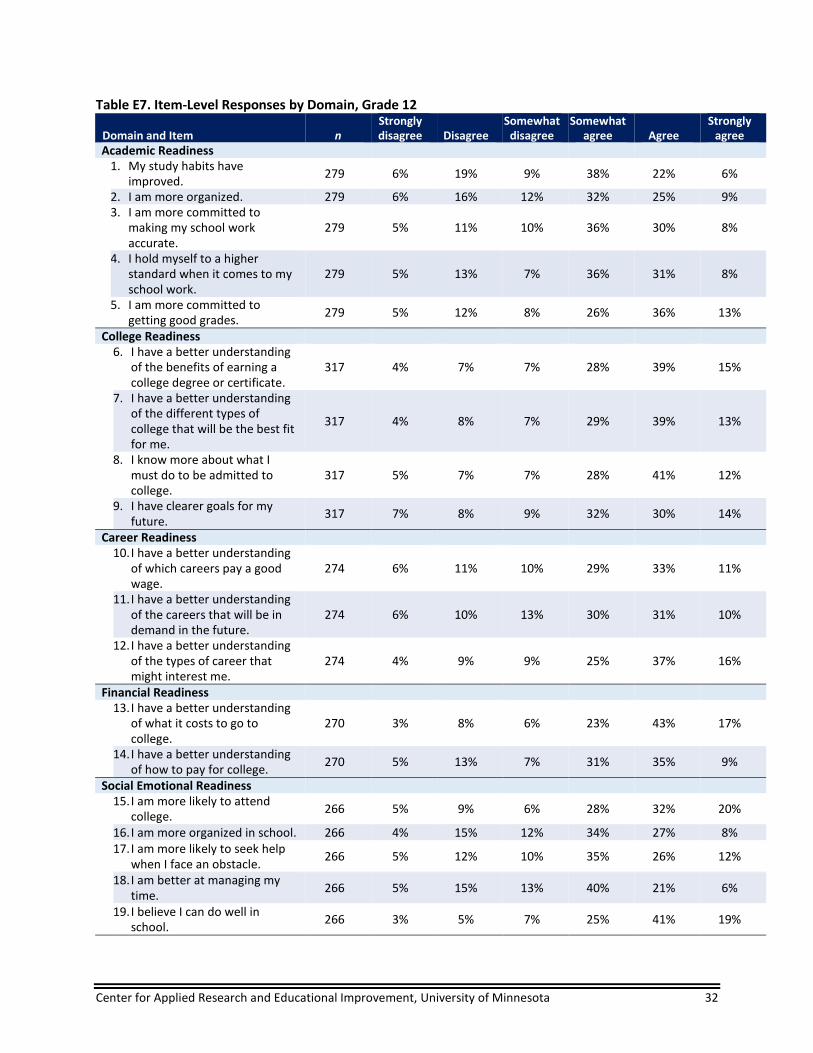
Center for Applied Research and Educational Improvement, University of Minnesota 32
Table E7. Item-Level Responses by Domain, Grade 12
Domain and Item n Strongly disagree Disagree
Somewhat disagree
Somewhat agree Agree
Strongly agree
Academic Readiness 1. My study habits have
improved. 279 6% 19% 9% 38% 22% 6%
2. I am more organized. 279 6% 16% 12% 32% 25% 9% 3. I am more committed to
making my school work accurate.
279 5% 11% 10% 36% 30% 8%
4. I hold myself to a higher standard when it comes to my school work.
279 5% 13% 7% 36% 31% 8%
5. I am more committed to getting good grades.
279 5% 12% 8% 26% 36% 13%
College Readiness 6. I have a better understanding
of the benefits of earning a college degree or certificate.
317 4% 7% 7% 28% 39% 15%
7. I have a better understanding of the different types of college that will be the best fit for me.
317 4% 8% 7% 29% 39% 13%
8. I know more about what I must do to be admitted to college.
317 5% 7% 7% 28% 41% 12%
9. I have clearer goals for my future.
317 7% 8% 9% 32% 30% 14%
Career Readiness 10. I have a better understanding
of which careers pay a good wage.
274 6% 11% 10% 29% 33% 11%
11. I have a better understanding of the careers that will be in demand in the future.
274 6% 10% 13% 30% 31% 10%
12. I have a better understanding of the types of career that might interest me.
274 4% 9% 9% 25% 37% 16%
Financial Readiness 13. I have a better understanding
of what it costs to go to college.
270 3% 8% 6% 23% 43% 17%
14. I have a better understanding of how to pay for college.
270 5% 13% 7% 31% 35% 9%
Social Emotional Readiness 15. I am more likely to attend
college. 266 5% 9% 6% 28% 32% 20%
16. I am more organized in school. 266 4% 15% 12% 34% 27% 8% 17. I am more likely to seek help
when I face an obstacle. 266 5% 12% 10% 35% 26% 12%
18. I am better at managing my time.
266 5% 15% 13% 40% 21% 6%
19. I believe I can do well in school.
266 3% 5% 7% 25% 41% 19%