Embed Size (px)
Citation preview

Twin Cities Focus Groups (St Joseph and Benton Harbor)
Community Asset Ranking September 24, 2018
October 1, 2018 January 24, 2019
Three focus groups were conducted on September 24 and October 1 2018, and January 24, 2019 as part of the Twin Cities visioning charrettes. In these focus group, Q Methodology was used to determine the ranking of community assets by individuals in both their present community and looking into the future of their community.
Participants were given a community assets sheet and sixteen different community asset cards. Participants were then asked to rank what community assets are most preset in your community currently? Each individual then sorted their community assets using the assets sheet and discussed their results as a group. After discussion, participants were asked to rank What community assets are most important to you in the future of your community? They then repeated the sorting exercise and discussed the results as a group. This activity generated two sorts on the community assets sheet per participant (first sort and second sort). The results of this activity informed the design process that culminated in the work-in-progress preferred alternative that was presented on October 11. The fourteen sorts are included in Appendix A.
On September 24th, seven participants attended for a total of fourteen different sorts. Based on the responses to the First Sort, the three community assets that were ranked as most present currently were Recreation, followed by Quality of Life and Tourism. The three community assets ranked as least present currently were Transportation System, Environmental Sustainability and Citizen Agency & Empowerment. Based on the responses to the Second Sort, the three community assets that were ranked as most important in the future were Public Access to Waterfront, Business Opportunities and Employment. The three community assets ranked as least important in the future were Social Networks, Citizen Agency & Empowerment, and Transparent Governance. (Appendix A)
On October 1st, eleven participants attended, but only four completed the second sort activity giving a total of fifteen different sorts. Based on the responses to the First Sort, the three community assets that were ranked as most present currently were Quality of Life, Recreation and Tourism. The three community assets ranked as least present currently were Transportation System, Population and Equity & Inclusion. Based on the responses to the Second Sort, the three community assets that were ranked as most important in the future were Transparent Governance, Quality of Life and Public Access to Waterfront. The three community assets ranked as least important in the future were Social Networks, Citizen Agency & Empowerment and Transportation System. (Appendix B)
On January 24th, eight participants attended for a total of sixteen different sorts. Based on the responses to the First Sort, the three community assets that were ranked as most present currently were Quality of Life,

Employment and Recreation / Social Networks (a tie). The three community assets ranked as least present currently were Transparent Governance, Citizen Agency and Empowerment and Tourism. Based on the responses to the Second Sort, the three community assets that were ranked as most important in the future were Quality of Life, Employment and Recreation / Social networks (a tie). The three community assets ranked as least important in the future were Citizen Agency & Empowerment, Transparent Governance and Tourism. (Appendix C)

Q Methodology is a participatory technique used to identify individual as well as shared values, attitudes, and beliefs. The following excerpt is from Shinebourne, P. (2009). Using Q method in qualitative research. International Journal of Qualitative Methods, 8(1), 93-97: “The Q method is considered particularly suitable for researching the range and diversity of subjective experiences, perspectives, and beliefs. At the same time, it facilitates the identification of similarities, the construction of broad categories of the phenomenon being investigated and the exploration of patterns and relationships within and between these categories. Participants are asked to sort a set of statements representing a broad diversity of opinions and perspectives on the phenomenon being investigated. Items for the Q set can be gathered from a variety of sources; for example, direct quotes and themes from interviews with participants, and statements originating from academic literature and popular media in addition to interviews.” The OGL Social Metrics project used the following timeline and script in a series of focus groups:
• Intros (10min) - Script: This is a water town. As such, we’re interested in the ways that water impacts
you and your experience living here. 1 • Individual Q-sort about personal perception of ranking community assets (10min)
Prompt: The most important impacts of water for me are… what community assets are most preset in your community currently?
- - Script: “Placed on the table before you is a diamond shaped grid and 16 community
asset cards. We would like each of you to individually rank how water can contribute to our lives and our places based on the values listed on the cards. the community assets most present in your community currently. There is one blank card for you to fill in anything in case we’ve missed it. Your highest values go in the top and bottom points of the diamond. The values with less importance to you go in the middle. There are absolutely no right or wrong answers. The assets most present currently go at the top; the assets least present currently go at the bottom. Please fill in all of the spaces. Don’t worry about placement left to right within a row. All that matters for the ranking is the vertical placement. If you think an asset is missing from the selected options, use the plank card to write it in. These are personal responses that have meaning to you and your experience alone. All of these assets are important! That’s a wonderful thing. Applying our values in practice in the world, though, requires that we prioritize them, and that’s what this activity helps us do. You do not have to stay within the bounds of the grid, but it’s helpful if you do.”
- Take pictures of final grids • Short discussion (15min)
- Ask participants to talk about their top three assets as well as the asset they have at the bottom, including what prompted them to place those assets where they did
• Individual Q-sort about perceived community values about water (10min) - Prompt: The most important impacts of water for the Alpena/Manistee/Port
Huron/Sault St. Marie community are… What community assets are most important to you in the future of your community?
- Script: “We’re going to repeat the same ranking process that you just completed, but this time, we’re interested in how you perceive the value of water for your community more widely. The most important community assets in the future of your community.”
1 Highlighted in yellow are original prompts for value sort. Highlighted in blue are the revisions for the Twin Cities Focus Groups.

- Take pictures of final grids • Short discussion (15min)
- Ask participants to talk about their top three values as well as the value they have at the bottom, including what prompted them to place those values where they did
- If there are substantial differences between the first and second sort, ask participants to talk about why that is
• Group sort about future visions related to water restoration priorities for the community (30min)
- Prompt: In the future, water restoration projects in your community should prioritize… - Script: “This is the same process as you’ve done on your own, but this time, we’d like
you to have a discussion about your perceived community values related to water and collectively envision some priorities for which values should be emphasized in water restoration - beaches, boardwalks, habitat remediation, wetland restoration, etc. – projects in the future. What do you want your town to look and feel like in the future, and how can water play a role in realizing that vision?”
- Take pictures of final grids • Final discussion (10min) (did not do a third sort)

The community assets listed on the Q-sort cards (Table 1), are based on the findings from a literature review on natural resources values and interviews. Table 1 Q Sort Cards
Community Asset Definition 1 Business Opportunities Ability to attract / retain entrepreneurship & investments in income-
generating opportunities
2 Citizen Agency & Empowerment Ability to influence or create change at the local level
3 Community Engagement Individuals & groups working collaboratively to achieve collective goals 4 Education & Training Opportunities for formal & informal learning & skill-building
5 Employment Jobs & income-generating opportunities related to the provision of local goods and services
6 Environmental Sustainability
Factors & practices that contribute to the long-term quality of the environment
7 Equity & Inclusion Fair, respectful, & inclusive treatment of all residents 8 Population Ability to attract / retain residents, especially younger generations
9 Public Access to Waterfront Ability to approach & interact with local water resources
10 Quality of Life The standard of health, comfort, and happiness experienced by residents
11 Recreation Outdoor leisure activities done for enjoyment during non-work time
12 Social Networks Opportunities to connect & build relationships with other people & communities
13 Tourism Attraction of a place as a welcoming destination for visitors
14 Transparent Governance Publicly available, reliable information about policy decisions used to engage citizens & stakeholders
15 Transportation System Accessible modes of transportation, including public / private as well as motorized / non-motorized
16 (Blank) Filled in by the participant for any value not represented
Write-ins for Blank Cards
Community Asset Participant ID Focus Group Date 1 Housing JCS2 September 24, 2018 2 Public Access to Waterfront by Boat EJ1 & EJ2 October 1, 2018

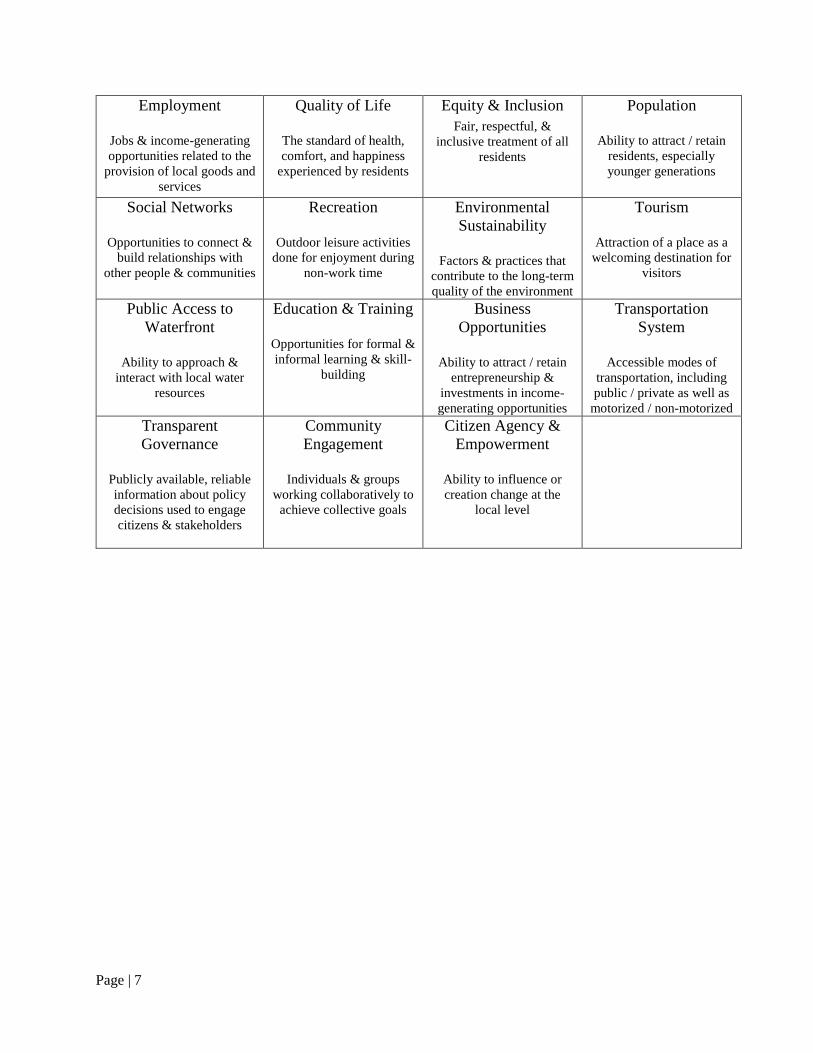
Community Assets Sheet
Please use the Community Asset Statements to fill in the pyramid below. The assets most present currently or important to you go at the top; the assets least present currently or least important to you go at the bottom. Please fill in all of the spaces. Don’t worry about placement left to right within a row. All that matters for the ranking is the vertical placement of the values cards. If you think an asset is missing from the selected options, use blank card to write it in.
Least
Most important
Most
Page | 7
Employment
Jobs & income-generating opportunities related to the
provision of local goods and services
Quality of Life
The standard of health, comfort, and happiness
experienced by residents
Equity & Inclusion Fair, respectful, &
inclusive treatment of all residents
Population
Ability to attract / retain residents, especially younger generations
Social Networks
Opportunities to connect & build relationships with
other people & communities
Recreation
Outdoor leisure activities done for enjoyment during
non-work time
Environmental Sustainability
Factors & practices that
contribute to the long-term quality of the environment
Tourism
Attraction of a place as a welcoming destination for
visitors
Public Access to Waterfront
Ability to approach &
interact with local water resources
Education & Training
Opportunities for formal & informal learning & skill-
building
Business Opportunities
Ability to attract / retain
entrepreneurship & investments in income-generating opportunities
Transportation System
Accessible modes of
transportation, including public / private as well as
motorized / non-motorized Transparent Governance
Publicly available, reliable information about policy decisions used to engage citizens & stakeholders
Community Engagement
Individuals & groups
working collaboratively to achieve collective goals
Citizen Agency & Empowerment
Ability to influence or creation change at the
local level

Page | 8
Date September 24 October 1 January 24 Sort First Second First Second First Second
Top Three
Recreation Public Access to Waterfront
Quality of Life
Transparent Governance
Quality of Life
Quality of Life
Quality of Life Employment Recreation Quality of Life Employment Employment
Tourism Business Opportunities Tourism Public Access
to Waterfront Equity & Inclusion
Recreation / Social Networks
Bottom Three
Transportation System
Social Networks
Transportation System
Social Networks
Transparent Governance
Citizen Agency & Empowerment
Environmental Sustainability
Citizen Agency & Empowerment
Population Citizen Agency & Empowerment
Citizen Agency & Empowerment
Transparent Governance
Citizen Agency & Empowerment
Transparent Governance
Equity & Inclusion
Transportation System Tourism Tourism

Page | 9
Appendix A – September 24, 2018 Focus Group First & Second Sort by Individual

Page | 10
Figure 1 – September 24, 2018 Focus Group Activity – First Sort Participant LG

Page | 11
Figure 2 – September 24, 2018 Focus Group Activity – Second Sort Participant LG

Page | 12
Figure 3 – September 24, 2018 Focus Group Activity – First Sort Participant BG

Page | 13
Figure 4 – September 24, 2018 Focus Group Activity – Second Sort Participant BG

Page | 14
Figure 5 – September 24, 2018 Focus Group Activity – First Sort Participant DK

Page | 15
Figure 6 – September 24, 2018 Focus Group Activity – Second Sort Participant DK

Page | 16
Figure 7 – September 24, 2018 Focus Group Activity – First Sort Participant CS

Page | 17
Figure 8 – September 24, 2018 Focus Group Activity – Second Sort Participant CS

Page | 18
Figure 9 – September 24, 2018 Focus Group Activity – First Sort Participant JCS

Page | 19
Figure 10 – September 24, 2018 Focus Group Activity – Second Sort Participant JCS

Page | 20
Figure 11 – September 24, 2018 Focus Group Activity – First sort Participant JA
Page | 21
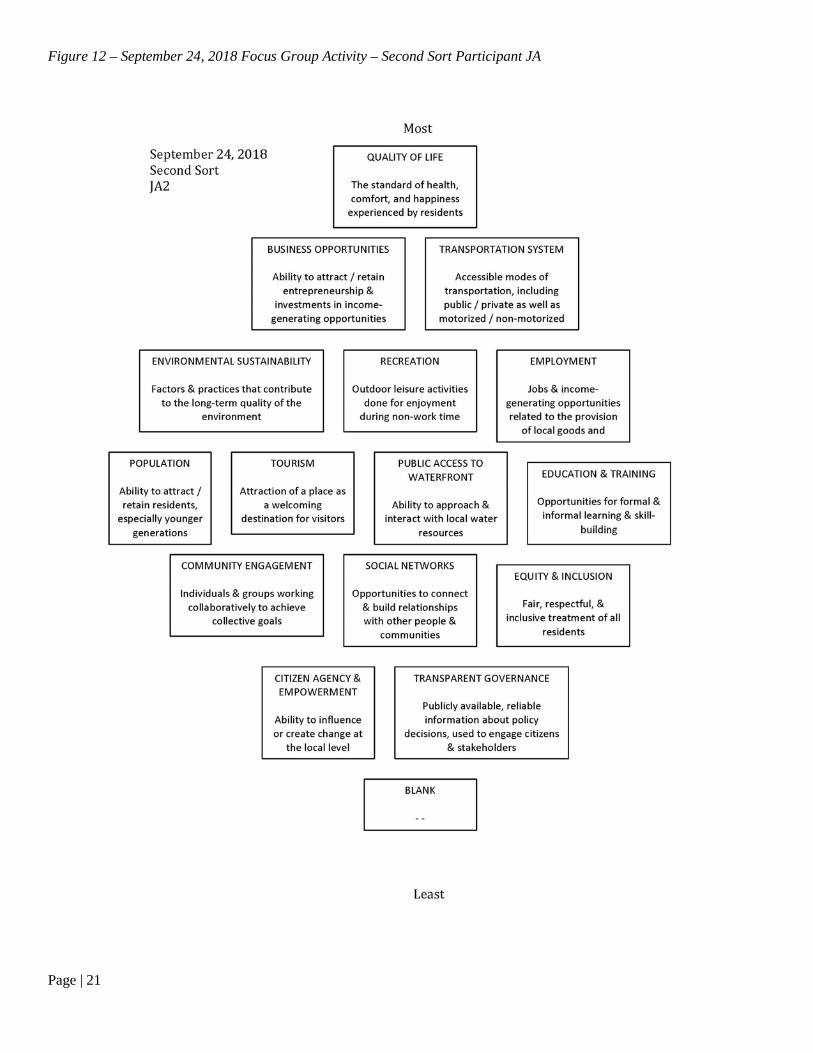
Figure 12 – September 24, 2018 Focus Group Activity – Second Sort Participant JA

Page | 22
Figure 13 – September 24, 2018 Focus Group Activity – First Sort Participant RJR

Page | 23
Figure 14 – September 24, 2018 Focus Group Activity – Second Sort Participant RJR

Page | 24
Appendix B – October 1, 2018 Focus Group First & Second Sort by Individual

Page | 25
Figure 15 – October 1, 2018 Focus Group Activity – First Sort Participant EJ

Page | 26
Figure 16 – October 1, 2018 Focus Group Activity – Second Sort Participant EJ

Page | 27
Figure 17 – October 1, 2018 Focus Group Activity – First Sort Participant KM

Page | 28
Figure 18 – October 1, 2018 Focus Group Activity – Second Sort Participant KM

Page | 29
Figure 19 – October 1, 2018 Focus Group Activity – First Sort Participant TC

Page | 30
Figure 20 – October 1, 2018 Focus Group Activity – Second Sort Participant TC

Page | 31
Figure 21 – October 1, 2018 Focus Group Activity – First Sort Participant CM

Page | 32
Figure 22 – October 1, 2018 Focus Group Activity – Second Sort Participant CM

Page | 33
Figure 23 – October 1, 2018 Focus Group Activity – First Sort Participant AP

Page | 34
Figure 24 – October 1, 2018 Focus Group Activity – First Sort Participant HB/PB

Page | 35
Figure 25 – October 1, 2018 Focus Group Activity – First Sort Participant JJK

Page | 36
Figure 26 – October 1, 2018 Focus Group Activity – First Sort Participant PWJ

Page | 37
Figure 27 – October 1, 2018 Focus Group Activity – First Sort Participant RM

Page | 38
Figure 28 – October 1, 2018 Focus Group Activity – First Sort Participant TK

Page | 39
Appendix C – January 24, 2019 Focus Group First & Second Sort by Individual

Page | 40
Figure 29 – January 24, 2019 Focus Group Activity – First Sort Participant AW

Page | 41
Figure 30 – January 24, 2019 Focus Group Activity – Second Sort Participant AW

Page | 42
Figure 31 – January 24, 2019 Focus Group Activity – First Sort Participant JAS / JJK

Page | 43
Figure 32 – January 24, 2019 Focus Group Activity – Second Sort Participant JAS / JJK

Page | 44
Figure 33 – January 24, 2019 Focus Group Activity – First Sort Participant KC

Page | 45
Figure 34 – January 24, 2019 Focus Group Activity – Second Sort Participant KC

Page | 46
Figure 35 – January 24, 2019 Focus Group Activity – First Sort Participant KJH

Page | 47
Figure 36 – January 24, 2019 Focus Group Activity – Second Sort Participant KJH

Page | 48
Figure 37 – January 24, 2019 Focus Group Activity – First Sort Participant KMM

Page | 49
Figure 38 – January 24, 2019 Focus Group Activity – Second Sort Participant KMM

Page | 50
Figure 39 – January 24, 2019 Focus Group Activity – First Sort Participant (NO NAME)

Page | 51
Figure 40 – January 24, 2019 Focus Group Activity – Second Sort Participant (NO NAME)

Page | 52
Figure 41 – January 24, 2019 Focus Group Activity – First Sort Participant SL

Page | 53
Figure 42 – January 24, 2019 Focus Group Activity – Second Sort Participant SL

Page | 54
Figure 43 – January 24, 2019 Focus Group Activity – First Sort Participant TJ
Page | 55
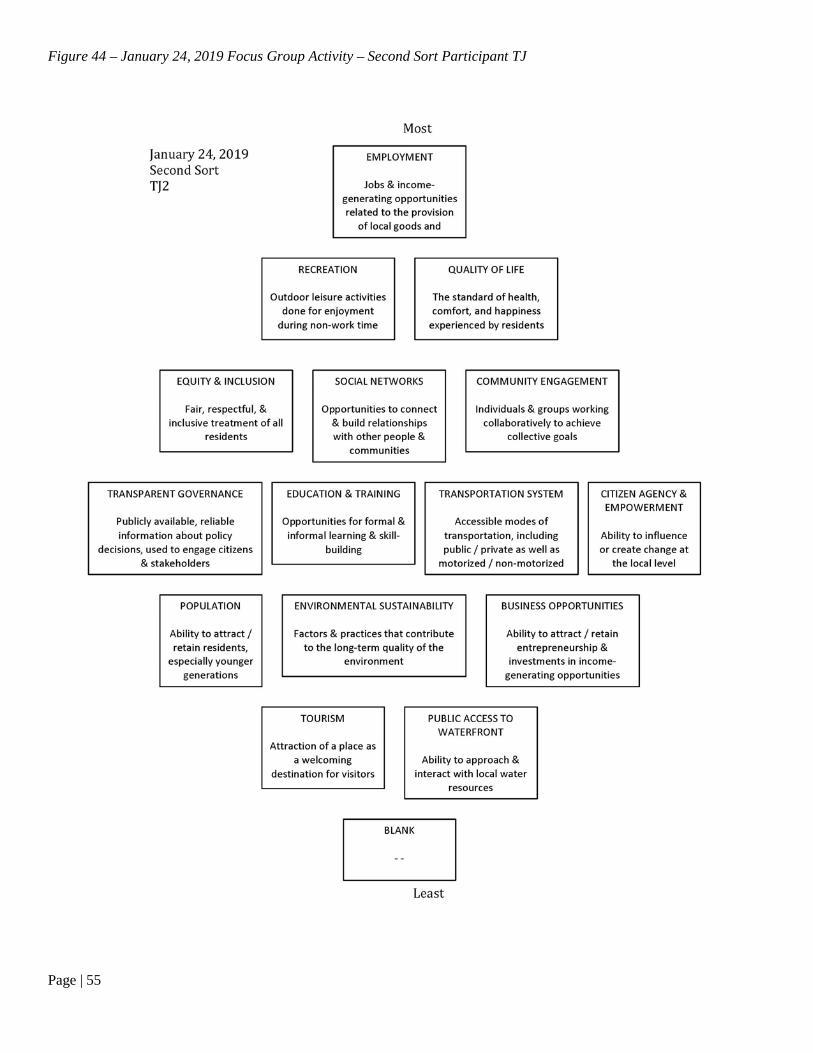
Figure 44 – January 24, 2019 Focus Group Activity – Second Sort Participant TJ


![Twin Cities Catholic [March 2013]](https://img.pdfslide.us/doc/110x75/568bf1221a28ab8933921384/twin-cities-catholic-march-2013.jpg)