Embed Size (px)
Citation preview
TWENTY16A N N U A L R E P O R T
saia.com

Saia, Inc. (NASDAQ: SAIA) offers
customers a wide range of less-
than-truckload, non-asset truckload,
expedited and logistics services. Saia
LTL Freight operates 148 terminals in 34
states. With headquarters in Georgia,
Saia employs 9,000 people. For more
information on Saia, Inc. visit the Investor
Relations section at www.saiacorp.com.
26 Consecutive Quarters of Yield Improvement
$1.2 Billion in Revenue
9,000 Non-union Employees
Saia LTL Freight’s Direct Coverage Area
States Served: 34
Terminals: 148
Average Length of Haul: 787 miles
TWENTY16
Saia, Inc. 2016 Annual Report
Investing in our People, Processes and Technology
training, resulting in our drivers being
honored with two fi rst-place awards
for their excellent safety records by the
American Trucking Associations.
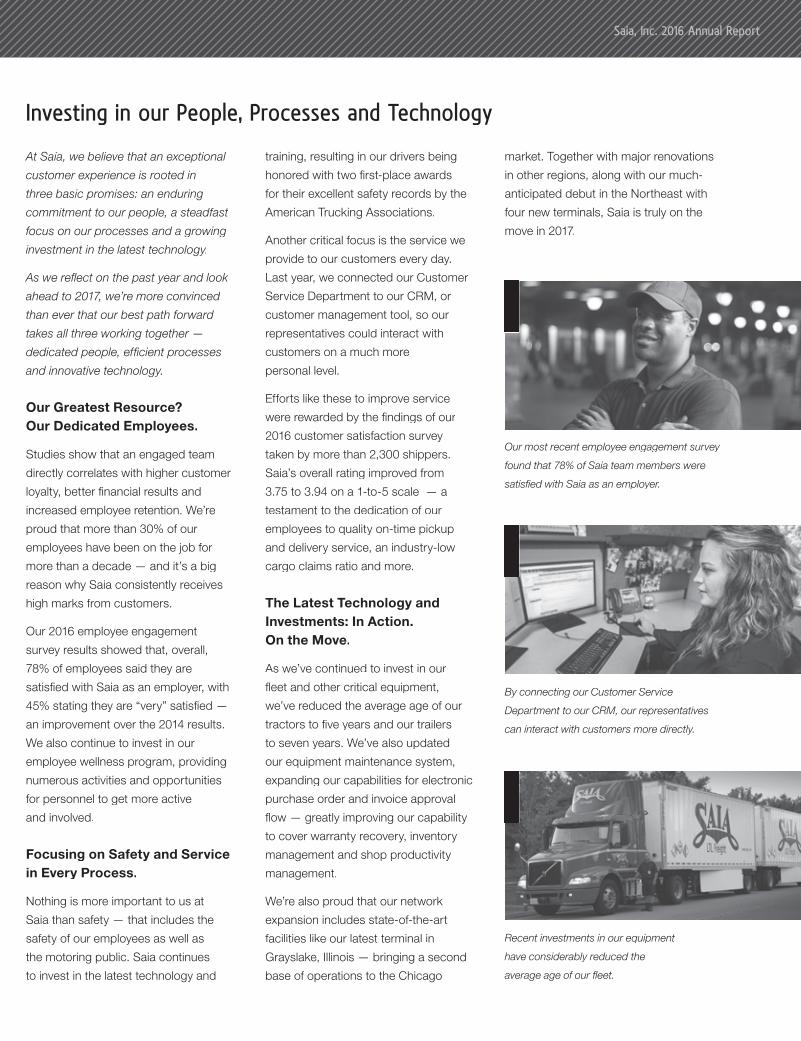
Another critical focus is the service we
provide to our customers every day.
Last year, we connected our Customer
Service Department to our CRM, or
customer management tool, so our
representatives could interact with
customers on a much more
personal level.
Efforts like these to improve service
were rewarded by the fi ndings of our
2016 customer satisfaction survey
taken by more than 2,300 shippers.
Saia’s overall rating improved from
3.75 to 3.94 on a 1-to-5 scale — a
testament to the dedication of our
employees to quality on-time pickup
and delivery service, an industry-low
cargo claims ratio and more.
The Latest Technology and Investments: In Action.On the Move.
As we’ve continued to invest in our
fl eet and other critical equipment,
we’ve reduced the average age of our
tractors to fi ve years and our trailers
to seven years. We’ve also updated
our equipment maintenance system,
expanding our capabilities for electronic
purchase order and invoice approval
fl ow — greatly improving our capability
to cover warranty recovery, inventory
management and shop productivity
management.
We’re also proud that our network
expansion includes state-of-the-art
facilities like our latest terminal in
Grayslake, Illinois — bringing a second
base of operations to the Chicago
At Saia, we believe that an exceptional
customer experience is rooted in
three basic promises: an enduring
commitment to our people, a steadfast
focus on our processes and a growing
investment in the latest technology.
As we refl ect on the past year and look
ahead to 2017, we’re more convinced
than ever that our best path forward
takes all three working together —
dedicated people, effi cient processes
and innovative technology.
Our Greatest Resource? Our Dedicated Employees.
Studies show that an engaged team
directly correlates with higher customer
loyalty, better fi nancial results and
increased employee retention. We’re
proud that more than 30% of our
employees have been on the job for
more than a decade — and it’s a big
reason why Saia consistently receives
high marks from customers.
Our 2016 employee engagement
survey results showed that, overall,
78% of employees said they are
satisfi ed with Saia as an employer, with
45% stating they are “very” satisfi ed —
an improvement over the 2014 results.
We also continue to invest in our
employee wellness program, providing
numerous activities and opportunities
for personnel to get more active
and involved.
Focusing on Safety and Servicein Every Process.
Nothing is more important to us at
Saia than safety — that includes the
safety of our employees as well as
the motoring public. Saia continues
to invest in the latest technology and
market. Together with major renovations
in other regions, along with our much-
anticipated debut in the Northeast with
four new terminals, Saia is truly on the
move in 2017.
Our most recent employee engagement survey
found that 78% of Saia team members were
satisfi ed with Saia as an employer.
By connecting our Customer Service
Department to our CRM, our representatives
can interact with customers more directly.
Recent investments in our equipment
have considerably reduced the
average age of our fl eet.
Dear Fellow Stockholder,
We are pleased to report that 2016 was another very
productive year for our company. We exited 2016 having
reported our 26th consecutive quarter of year-over-year LTL
yield improvement. For the full year, we grew our yield by 3.2%.
Our ability to continue to improve our pricing is a testament to
the continuous improvements in quality and customer service
that we deliver. While fi nancial results did not match the record
performance of 2015, we invested heavily in our business while
simultaneously lowering debt and strengthening our balance
sheet. Over the past fi ve years, we have grown operating
income and earnings per share by a compounded annual
rate of 23% and 32%, respectively.
In 2016, we maintained our goal of providing 98% on-time
service and reduced the number of cargo claims fi led by our
customers by 12%. Satisfying the customer and meeting
their service needs are the focus of everyone here at Saia.
To support further performance improvements, we continue
to invest in our business. In 2016, we invested slightly more
than $150 million in equipment, technology and real estate
across our network of 148 terminals. Investments in our fl eet of
tractors, trailers and forklifts yield savings in the form of lower
maintenance costs and improved fuel economy. The average
age of tractors in our fl eet has been reduced to approximately
fi ve years from a high of approximately eight years a few short
years ago, greatly enhancing reliability. Our new tractors also
come equipped with some of the most advanced accident
avoidance and safety technology available.
Stock price performance for any company does not always
match underlying company performance, and so it was for
Saia over the past couple of years. In 2015, in the midst of
record company earnings, Saia’s share price declined by 60%.
In 2016, Saia’s share price rose by 98% and was among the
best performing transport stocks.
Turning our eyes towards 2017 and beyond, our organization
is energized by our announcement in the fourth quarter that
we will expand our service territory into the northeast this
year. We estimate that the northeastern U.S. LTL market is an
Herbert A. Trucksess, IIIChairman
Rick O’DellPresident and CEO
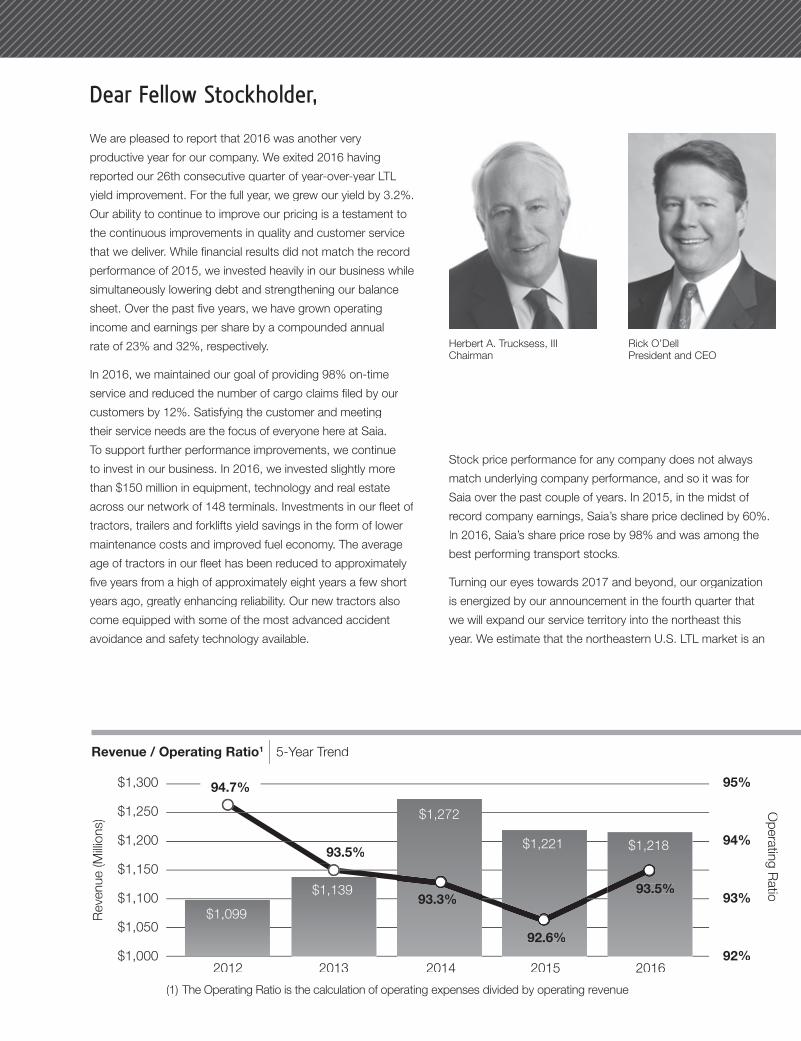
(1) The Operating Ratio is the calculation of operating expenses divided by operating revenue
$1,300
$1,250
$1,200
$1,150
$1,100
$1,050
$1,0002012 2013 2014 2015
95%
94%
93%
92%
Reve
nue (M
illio
ns)
Reve
nue
(Millio
ns)
Oi
Ri
Op
era
ting R
atio
Revenue / Operating Ratio1 | 5-Year Trend
2016
93 %93.5%
9 %94.7%
$1,099
$1,139
$1,272
93.3%
$1,221
92.6%
$1,218
93.5%
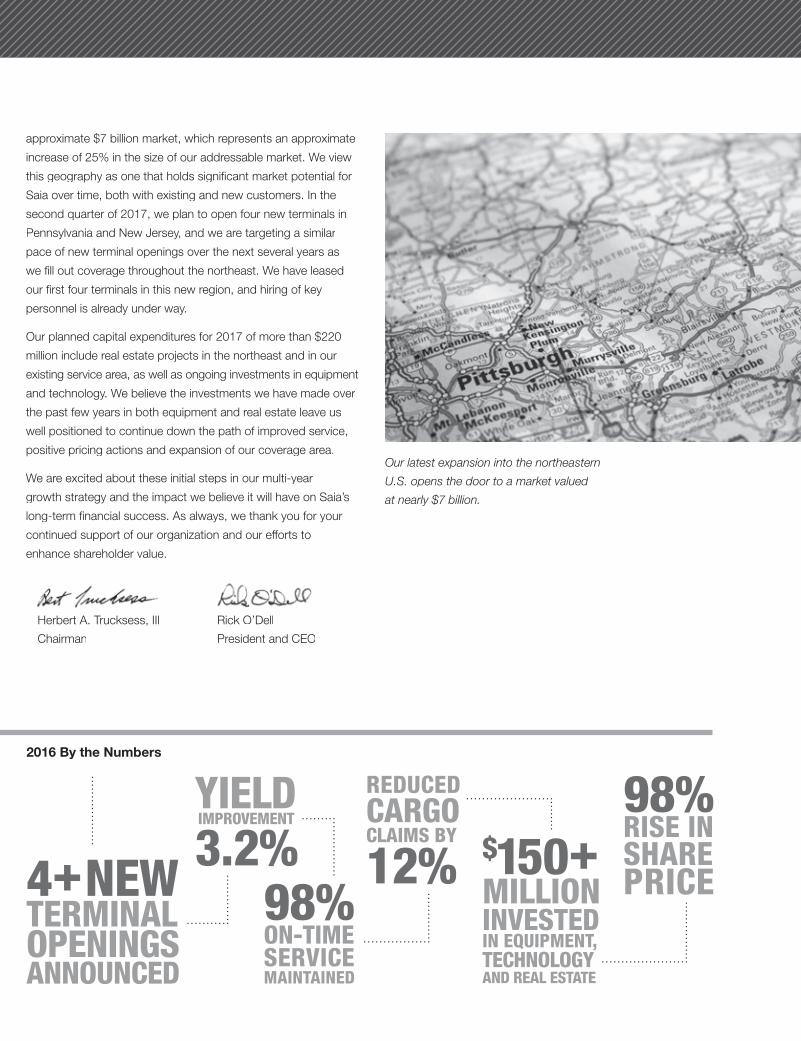
approximate $7 billion market, which represents an approximate
increase of 25% in the size of our addressable market. We view
this geography as one that holds signifi cant market potential for
Saia over time, both with existing and new customers. In the
second quarter of 2017, we plan to open four new terminals in
Pennsylvania and New Jersey, and we are targeting a similar
pace of new terminal openings over the next several years as
we fi ll out coverage throughout the northeast. We have leased
our fi rst four terminals in this new region, and hiring of key
personnel is already under way.
Our planned capital expenditures for 2017 of more than $220
million include real estate projects in the northeast and in our
existing service area, as well as ongoing investments in equipment
and technology. We believe the investments we have made over
the past few years in both equipment and real estate leave us
well positioned to continue down the path of improved service,
positive pricing actions and expansion of our coverage area.
We are excited about these initial steps in our multi-year
growth strategy and the impact we believe it will have on Saia’s
long-term fi nancial success. As always, we thank you for your
continued support of our organization and our efforts to
enhance shareholder value.
Herbert A. Trucksess, IIIH b t A T k III
Chairman
Rick O’Dell
President and CEO
Our latest expansion into the northeastern
U.S. opens the door to a market valued
at nearly $7 billion.
2016 By the Numbers
YIELD IMPROVEMENT
3.2%98%ON-TIMESERVICE MAINTAINED
REDUCEDCARGO CLAIMS BY
12% $150+MILLIONINVESTEDIN EQUIPMENT,TECHNOLOGYAND REAL ESTATE
98%RISE INSHAREPRICE4+ NEW
TERMINALOPENINGSANNOUNCED
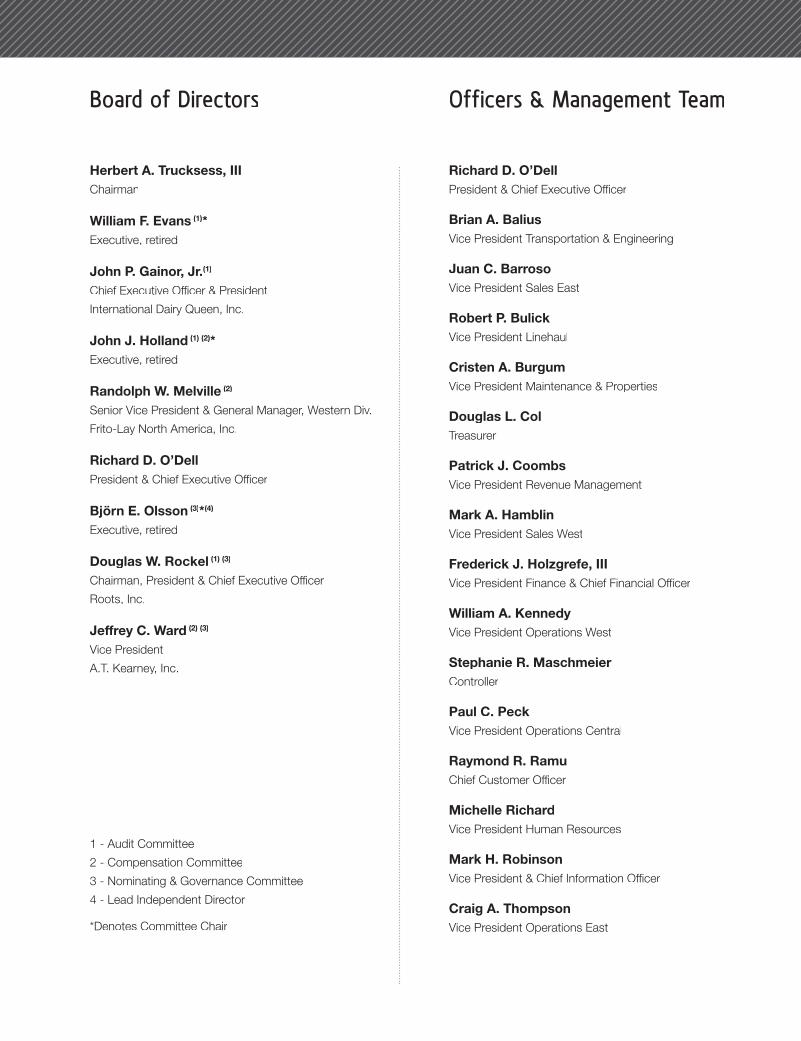
Board of Directors
Herbert A. Trucksess, IIIChairman
William F. Evans (1)*Executive, retired
John P. Gainor, Jr.(1)
Chief Executive Offi cer & President
International Dairy Queen, Inc.
John J. Holland (1) (2)*Executive, retired
Randolph W. Melville (2)
Senior Vice President & General Manager, Western Div.
Frito-Lay North America, Inc.
Richard D. O’DellPresident & Chief Executive Offi cer
Björn E. Olsson (3)*(4)
Executive, retired
Douglas W. Rockel (1) (3)
Chairman, President & Chief Executive Offi cer
Roots, Inc.
Jeffrey C. Ward (2) (3)
Vice President
A.T. Kearney, Inc.
1 - Audit Committee
2 - Compensation Committee
3 - Nominating & Governance Committee
4 - Lead Independent Director
*Denotes Committee Chair
Officers & Management Team
Richard D. O’DellPresident & Chief Executive Offi cer
Brian A. BaliusVice President Transportation & Engineering
Juan C. BarrosoVice President Sales East
Robert P. BulickVice President Linehaul
Cristen A. BurgumVice President Maintenance & Properties
Douglas L. ColTreasurer
Patrick J. CoombsVice President Revenue Management
Mark A. HamblinVice President Sales West
Frederick J. Holzgrefe, IIIVice President Finance & Chief Financial Offi cer
William A. KennedyVice President Operations West
Stephanie R. MaschmeierController
Paul C. PeckVice President Operations Central
Raymond R. RamuChief Customer Offi cer
Michelle RichardVice President Human Resources
Mark H. RobinsonVice President & Chief Information Offi cer
Craig A. ThompsonVice President Operations East
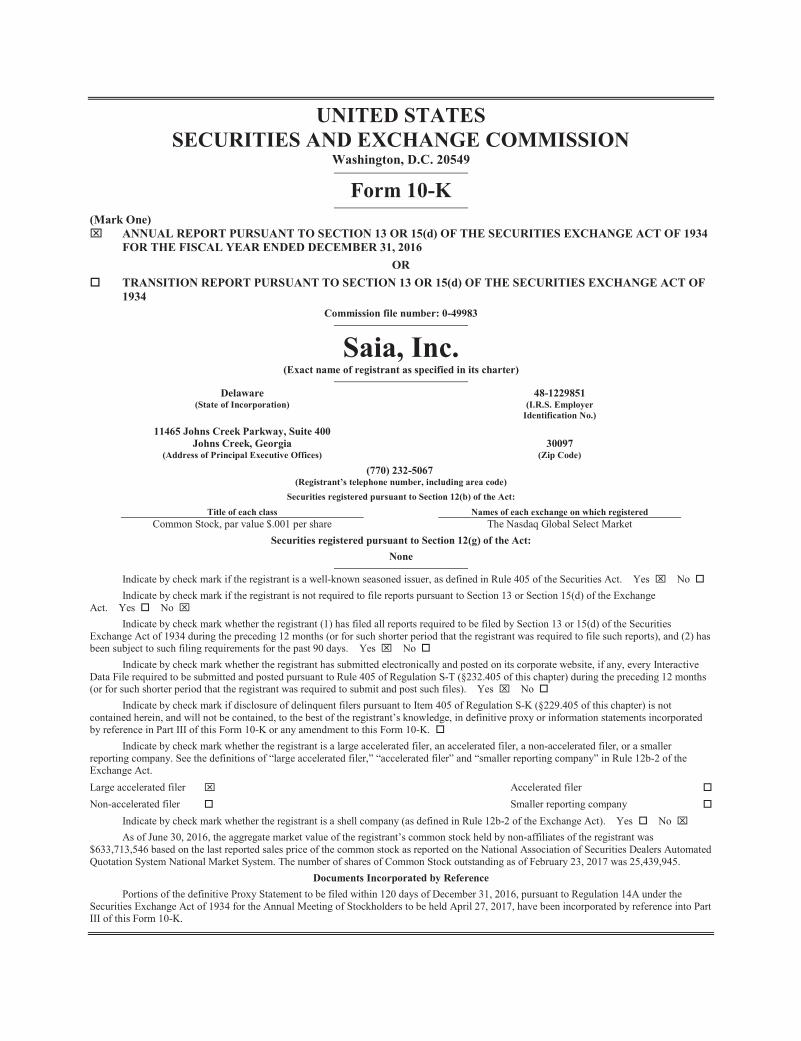
UNITED STATES SECURITIES AND EXCHANGE COMMISSION
Washington, D.C. 20549
Form 10-K
(Mark One) ANNUAL REPORT PURSUANT TO SECTION 13 OR 15(d) OF THE SECURITIES EXCHANGE ACT OF 1934
FOR THE FISCAL YEAR ENDED DECEMBER 31, 2016 OR
TRANSITION REPORT PURSUANT TO SECTION 13 OR 15(d) OF THE SECURITIES EXCHANGE ACT OF 1934
Commission file number: 0-49983
Saia, Inc. (Exact name of registrant as specified in its charter)
Delaware 48-1229851 (State of Incorporation)
(I.R.S. Employer
Identification No.)
11465 Johns Creek Parkway, Suite 400 Johns Creek, Georgia 30097
(Address of Principal Executive Offices) (Zip Code)
(770) 232-5067 (Registrant’s telephone number, including area code)
Securities registered pursuant to Section 12(b) of the Act:
Title of each class Names of each exchange on which registered Common Stock, par value $.001 per share The Nasdaq Global Select Market
Securities registered pursuant to Section 12(g) of the Act: None
Indicate by check mark if the registrant is a well-known seasoned issuer, as defined in Rule 405 of the Securities Act. Yes No Indicate by check mark if the registrant is not required to file reports pursuant to Section 13 or Section 15(d) of the Exchange
Act. Yes No Indicate by check mark whether the registrant (1) has filed all reports required to be filed by Section 13 or 15(d) of the Securities
Exchange Act of 1934 during the preceding 12 months (or for such shorter period that the registrant was required to file such reports), and (2) has been subject to such filing requirements for the past 90 days. Yes No
Indicate by check mark whether the registrant has submitted electronically and posted on its corporate website, if any, every Interactive Data File required to be submitted and posted pursuant to Rule 405 of Regulation S-T (§232.405 of this chapter) during the preceding 12 months (or for such shorter period that the registrant was required to submit and post such files). Yes No
Indicate by check mark if disclosure of delinquent filers pursuant to Item 405 of Regulation S-K (§229.405 of this chapter) is not contained herein, and will not be contained, to the best of the registrant’s knowledge, in definitive proxy or information statements incorporated by reference in Part III of this Form 10-K or any amendment to this Form 10-K.
Indicate by check mark whether the registrant is a large accelerated filer, an accelerated filer, a non-accelerated filer, or a smaller reporting company. See the definitions of “large accelerated filer,” “accelerated filer” and “smaller reporting company” in Rule 12b-2 of the Exchange Act.
Large accelerated filer Accelerated filer
Non-accelerated filer Smaller reporting company
Indicate by check mark whether the registrant is a shell company (as defined in Rule 12b-2 of the Exchange Act). Yes No As of June 30, 2016, the aggregate market value of the registrant’s common stock held by non-affiliates of the registrant was
$633,713,546 based on the last reported sales price of the common stock as reported on the National Association of Securities Dealers Automated Quotation System National Market System. The number of shares of Common Stock outstanding as of February 23, 2017 was 25,439,945.
Documents Incorporated by Reference Portions of the definitive Proxy Statement to be filed within 120 days of December 31, 2016, pursuant to Regulation 14A under the
Securities Exchange Act of 1934 for the Annual Meeting of Stockholders to be held April 27, 2017, have been incorporated by reference into Part III of this Form 10-K.
2
SAIA, INC. AND SUBSIDIARIES INDEX
Page PART I. Item 1. Business ............................................................................................................................................ 3 Additional Information ..................................................................................................................... 8 Executive Officers............................................................................................................................. 9Item 1A. Risk Factors ...................................................................................................................................... 9Item 1B. Unresolved Staff Comments ............................................................................................................. 20Item 2. Properties .......................................................................................................................................... 21Item 3. Legal Proceedings ............................................................................................................................. 21Item 4. Mine Safety Disclosures ................................................................................................................... 21
PART II.
Item 5. Market for Registrant’s Common Equity, Related Stockholder Matters and Issuer Purchases of Equity Securities .................................................................................................................................... 22
Item 6. Selected Financial Data ..................................................................................................................... 24Item 7. Management’s Discussion and Analysis of Financial Condition and Results of Operations ............ 25Item 7A. Quantitative and Qualitative Disclosures About Market Risk .......................................................... 36Item 8. Financial Statements and Supplementary Data ................................................................................. 37Item 9. Changes in and Disagreements with Accountants on Accounting and Financial Disclosure ............ 59Item 9A. Controls and Procedures ................................................................................................................... 59Item 9B. Other Information ............................................................................................................................. 60
PART III.
Item 10. Directors, Executive Officers and Corporate Governance ................................................................ 60Item 11. Executive Compensation ................................................................................................................... 60Item 12. Security Ownership of Certain Beneficial Owners and Management and Related Stockholder
Matters ............................................................................................................................................ 60Item 13. Certain Relationships and Related Transactions, and Director Independence .................................. 61Item 14. Principal Accountant Fees and Services ........................................................................................... 61
PART IV.
Item 15. Exhibits, Financial Statement Schedules .......................................................................................... 61
EXHIBITS Exhibit Index ..................................................................................................................................................... 63
3
PART I.
Item 1. Business
Overview
Saia, Inc., through its wholly-owned subsidiaries, is a transportation company headquartered in Johns Creek, Georgia (Saia, Inc. together with its subsidiaries, the Company or Saia). We provide regional and interregional less-than-truckload (LTL) services through a single integrated organization. While more than 99% of our revenue historically has been derived from transporting LTL shipments across 34 states, we also offer customers a wide range of other value-added services, including non-asset truckload, expedited and logistics services across the United States.
None of our approximately 8,900 employees is represented by a union. In 2016, Saia generated revenue of $1.22 billion and operating income of $79.1 million. In 2015, Saia generated revenue of $1.22 billion and operating income of $90.0 million.
Saia LTL Freight
Founded in 1924, Saia Motor Freight Line, LLC (Saia LTL Freight) is a leading LTL carrier that serves 34 states in the South, Southwest, Midwest, Pacific Northwest and West. The Company has announced plans to commence operations in portions of the Northeast commencing in 2017. Saia LTL Freight specializes in offering its customers a range of regional and interregional LTL services including time-definite and expedited options. Saia LTL Freight primarily provides its customers with solutions for shipments between 100 and 10,000 pounds, but also provides truckload services.
Saia LTL Freight has invested substantially in technology, training and business processes to enhance its ability to monitor and manage customer service, operations and profitability. These process and data capabilities enable Saia LTL Freight to provide its trademarked Customer Service Indicators® (CSI) program, allowing customers to monitor service performance on a wide array of metrics most important to them. Customers can access the information via the Company’s website (www.saia.com) to help manage their shipments. The CSIs measure the following: on-time pickup; on-time delivery; claim-free shipments; claims settled within 30 days; exception free delivery; and invoicing accuracy. The CSIs provide both Saia LTL Freight and the customer with a report card of overall service levels.
As of December 31, 2016, Saia LTL Freight operated a network comprised of 151 owned and leased locations. In 2016, the average Saia LTL Freight shipment weighed approximately 1,118 pounds and traveled an average distance of approximately 787 miles.
Industry
The trucking industry consists of three segments including private fleets and two “for-hire” carrier groups. The private carrier segment consists of fleets owned and operated by shippers who move their own goods. The two “for-hire” carrier groups, truckload and LTL, are based on the typical shipment sizes handled by transportation service companies. Truckload refers to providers generally transporting shipments greater than 10,000 pounds and LTL refers to providers generally transporting shipments less than 10,000 pounds. Saia is primarily an LTL carrier.
LTL transportation providers typically consolidate numerous shipments, generally ranging from 100 to 10,000 pounds, from businesses in different locations at carrier-operated service facilities within a certain radius and then transport the shipments from the origin location to the carrier-operated destination location and then to the ultimate delivery destination. As a result, LTL carriers require expansive networks of pickup and delivery operations around local service facilities and shipments are moved between origin and destination often through an intermediate distribution or “breakbulk” facility. Depending on the distance shipped, the LTL segment historically was classified into three subgroups:
Regional — Average shipment distance is typically less than 1,200 miles with a focus on one- and two-day markets. Regional transportation companies can move shipments directly to their respective
4
destination location which increases service reliability and avoids costs associated with intermediate handling.
Interregional — Average shipment distance is usually between 1,200 and 1,500 miles with a focus on serving two- and three-day markets.
National — Average shipment distance is typically in excess of 1,500 miles with a focus on service in three- to five-day markets. National providers rely on intermediate shipment handling through hub and spoke networks, which require numerous satellite service facilities, multiple distribution facilities and a relay network. To gain service and cost advantages, national providers occasionally ship directly between service facilities reducing intermediate handling or utilize the rail system.
Throughout the years, there has been a blurring of the above subgroups as individual companies are increasingly serving multiple markets. Today, Saia LTL Freight, as well the vast majority of the LTL capacity, services all three areas.
The truckload segment is the largest portion of the “for-hire” truck transportation market. Truckload carriers primarily transport large shipments from origin to destination with no intermediate handling. Although a full truckload can weigh over 40,000 pounds, it is common for carriers to haul two or three shipments exceeding 10,000 pounds each at one time making multiple delivery stops.
Because truckload carriers do not require an expansive network to provide point-to-point service, the overall cost structure of truckload participants is typically lower and more variable relative to LTL service providers. However, the lack of a network subjects their drivers to extended periods away from home thus resulting in higher driver turnover and periodic driver shortages. The truckload segment is comprised of several major carriers and numerous small entrepreneurial players. At the most basic level, a truckload company can be started with capital for rolling stock (a tractor and a trailer), insurance, a driver and little else. As size becomes a factor, capital is needed for technology infrastructure and some limited facilities. Saia LTL Freight participates in the truckload market as a means to fill empty miles in lanes that are not at capacity. Saia’s sales representatives also sell truckload and expedited offerings of its non-asset operations.
Capital requirements are significantly different in the traditional LTL segment versus the truckload segment. In the LTL sector, substantial amounts of capital are required for a network of service facilities, shipment handling equipment and revenue equipment (both for city pick-up, delivery and linehaul). In addition, investment in technology has become increasingly important in the LTL segment largely due to the number of transactions and number of customers served on a daily basis. Saia LTL Freight picks up approximately 25,000 shipments per day, each of which has a shipper and consignee, and sometimes a third party payor, all of whom need access to information in a timely manner. More importantly, technology plays a key role in improving customer service, operations efficiency and compliance, safety and yield management. As a result of the significant infrastructure required to operate an LTL carrier, the LTL segment is more concentrated than the truckload segment with the largest players in the national and regional markets. Driver turnover in the LTL sector is low relative to the truckload sector. Midsize “niche” carriers serve the regional markets.
Business Strategy
Saia has grown historically through a combination of organic growth and geographic integration or “tuck-in” of smaller trucking and logistics companies acquired by Saia. Saia integrated WestEx and Action Express in 2001, Clark Bros. in 2004, The Connection in 2006 and Madison Freight Systems in 2007. In 2012, Saia acquired Robart Transportation, Inc. and its subsidiary, The RL Services Group, LLC (the Robart Companies) which provide customers with non-asset truckload full service and logistics solutions. In 2012, the Company rebranded Robart Transportation, Inc. as Saia TL Plus, LLC (Saia TL Plus) and The RL Services Group, LLC as Saia Logistics Services, LLC (Saia Logistics Services). In February 2015, Saia acquired LinkEx, Inc. (LinkEx), a diversified, non-asset, third party logistics provider based in Dallas, Texas. The acquisition of LinkEx grew the Company’s existing portfolio of non-asset services. See Note 11 of the accompanying audited consolidated financial statements for further information on the acquisition of LinkEx.
5
Key elements of our business strategy include:
Continue to focus on operating safely.
Our most valuable resource is our employees. It is a corporate priority to continually emphasize the importance of safe operations and to reduce both the frequency and severity of injuries and accidents. This emphasis on safe operations is not only appropriate to protect our employees and our communities but with the continued escalation of commercial insurance and healthcare costs, it is important to maintain and improve stockholder returns. Management expects governmental safety regulations and related enforcement initiatives to increase in the future.
Manage yields and business mix.
This element of our business strategy involves managing both the pricing process and the mix of customers’ freight in ways that allow our network to operate more profitably. Improvements in the economy coupled with the tightening of available capacity in the industry over the last several years allowed the Company to implement numerous pricing initiatives to increase yield significantly.
Increase density in existing geographies.
We gain operating leverage by growing volume and density within existing geography. Depending on pricing and the specific lanes, we estimate that the potential incremental profitability on growth in current markets can be 20 percent or even higher. This improves margins, asset turnover and return on capital. We actively monitor opportunities to add service facilities where we have sufficient density. We see potential for future volume growth at Saia from improvements in the general economy, industry consolidation, geographic expansion and strategic acquisitions, as well as specific sales and marketing initiatives.
Continue focus on delivering best-in-class service.
The foundation of Saia’s growth strategy is consistent delivery of high-quality service. Commitment to service quality is valued by customers and allows us to gain fair compensation for our services and positions us to improve market share.
Continue focus on improving operating efficiencies.
Saia has operating initiatives focused on continuing to improve efficiency. These initiatives help offset a variety of structural cost increases like wages, healthcare benefits, workers compensation claims, parts and maintenance expense as well as casualty insurance. We believe Saia continues to be well positioned to manage costs and utilize assets. We believe we will continue to see new opportunities for cost savings.
Prepare the organization for future growth.
Our primary focus within organizational development is maintaining strong relationships with our employees. We invest in our employees through internal communication, training programs, recognition programs and providing competitive wages and benefits. We also invest in succession planning initiatives.
We believe it is also important to invest in technology capabilities and strategic real estate which are designed to position our Company for future growth to meet the increasing demands of the marketplace. We also believe it is important to invest in our tractor and trailer fleet to gain access to new technologies, lower maintenance expenses, achieve improved fuel economy, improve brand image and gain other operating efficiencies.
Expand portfolio of services in the non-asset market
While our immediate priority is to improve profitability in our existing portfolio of services, we may pursue additional services to complement our existing non-asset market because it promotes profitability growth and improves our customer value proposition over time.
6
Expand geographic footprint.
While our immediate priority is to improve profitability in our existing geography, we plan to pursue additional geographic expansion into portions of the Northeastern United States to promote profitable growth and improve our customer value proposition over time. Not only do we plan to invest in new terminals and equipment, but we intend to invest in certain areas of our existing network so that we will be able to handle the increased freight flows we anticipate to and from the new market.
In addition to direct expansion through opening of new facilities, management may consider acquisitions from time to time to help expand geographic reach and density while gaining the business base of the acquired entity. Management believes integration of acquisitions is a core competency and it has developed a repeatable process from its successful experience, including Saia’s integration of WestEx, Action Express, Clark Bros., the Connection and Madison Freight. Collectively, these integrations increased Saia’s footprint from 12 to 34 states.
Seasonality
Our revenues are subject to seasonal variations. Customers tend to reduce shipments after the winter holiday season and operating expenses tend to be higher as a percent of revenue in the winter months primarily due to lower capacity utilization and weather effects. Generally, the first quarter is the weakest quarter while the second and third quarters are the strongest quarters in terms of revenue and profit. Quarterly profitability is also impacted by the timing of salary and wage increases and general rate increases which have varied over the years.
Labor
Most LTL companies, including Saia, and virtually all truckload companies are not subject to collective bargaining agreements.
In recent years, due to competition for quality employees, the compensation divide between union and non-union carriers has closed dramatically. However, there are still significant differences in benefit costs and work rule flexibility. Benefit costs for union carriers remain significantly above those paid by non-union carriers and union carriers may be subject to certain contingent unfunded multi-employer pension liabilities. In addition, non-union carriers have more work rule flexibility with respect to work schedules, routes and other similar items. Work rule flexibility is a major consideration in the regional LTL sector as flexibility is important to meet the service levels required by customers.
Our employees are not represented by a collective bargaining unit. We believe this provides for better communications and employee relations, stronger future growth prospects, improved efficiencies and customer service capabilities.
Competition
Although there has been some tightening of capacity and some industry consolidation, shippers continue to have a wide range of choices. We believe that service quality, price, variety of services offered, geographic coverage, responsiveness and flexibility are the important competitive differentiators.
Saia focuses primarily on regional and interregional business and operates in a highly competitive environment against a wide range of transportation service providers. These competitors include a small number of large, national transportation service providers in the long haul and two-day markets and a larger number of shorter-haul or regional transportation companies in the two-day and overnight markets. Saia also competes in and against several modes of transportation, including LTL, truckload and private fleets. The larger the service area, the greater the barriers to entry into the LTL trucking segment due to the need for additional equipment and operational facilities associated with this coverage. The level of technology investment required and density needed to provide adequate labor and asset utilization make larger-scale entry into the LTL market difficult. Saia also competes with small package carriers, railroads and air freight carriers.
7
Regulation
Over the past 37 years, the trucking industry has been substantially deregulated and rates and services are largely free of regulatory controls. Nevertheless, the trucking industry remains subject to regulation by many federal and state governmental agencies, and these authorities have broad powers over matters ranging from the authority to engage in motor carrier operations, motor carrier registration, driver hours of service, safety and fitness of transportation equipment and drivers, insurance requirements, fuel efficiency and emissions standards, and the transportation and handling of hazardous materials.
Key areas of regulatory activity include:
Department of Homeland Security.
The trucking industry is working closely with government agencies to define and implement improved security processes. Federal, state and municipal authorities have implemented and continue to implement anti-terrorism measures, including checkpoints and travel restrictions on large trucks. The Transportation Security Administration (TSA) continues to focus on trailer security, driver identification, security clearance and border-crossing procedures. These and other safety and security measures, such as rules for transportation of hazardous materials, could increase the cost of operations, reduce the number of qualified drivers and disrupt or impede the timing of our deliveries to customers.
Department of Transportation.
Motor carrier and freight brokerage operations are subject to safety, insurance and bonding requirements prescribed by the U.S. Department of Transportation (DOT) and various state agencies.
Within the DOT, the Federal Motor Carrier Safety Administration (FMCSA) has issued rules including hours of service regulations that limit the maximum number of hours a driver may be on duty between mandatory off-duty hours. These rules could impact our operations, further tighten the market for qualified drivers and put additional upward pressure on driver wages and purchased transportation costs.
Additionally, the FMCSA’s Compliance Safety Accountability Program (CSA) could adversely affect our results and ability to maintain or grow our fleet. CSA is an enforcement and compliance model that involves assessments of a motor carrier’s on-road performance and investigation results for a 24-month period using roadside stops and inspections, resulting in safety and performance ratings in the following categories: unsafe driving; hours-of-service compliance; driver fitness; controlled substances/alcohol; vehicle maintenance; hazardous material compliance; and crash indicators. The evaluations are used to rank carriers and individual drivers and to select carriers for audit and other interventions. In January 2016, the FMCSA proposed to revise the current methodology for issuance of a safety fitness determination for motor carriers. The proposed new methodologies would determine when a motor carrier is not fit to operate commercial motor vehicles based on the carrier’s on-road safety data in relation to industry data, an investigation or a combination of on-road safety data and investigation information and would evaluate carriers monthly. A supplemental notice of proposed rulemaking was announced in January 2017. While the ultimate impact of CSA is not yet known, it is possible that these measurements could adversely impact our ability to attract and retain drivers which would adversely affect our results and cash flows.
The FMCSA issued a final rule requiring electronic driver logs be monitored by Electronic Log Devices (ELDs) for many in-state-only drivers and most interstate commercial motor vehicle drivers by no later than December 18, 2017. Drivers voluntarily using a compliant automatic on-board recording device by the December 18, 2017, deadline will be “grandfathered” for two years to give providers time to update their systems to be compliant with the ELD standards. While such regulations could increase the cost of technology, capital equipment and maintenance expenses across our industry, we implemented ELDs company-wide in 2014 prior to the effective date of the ELD standard. In addition, the implementation of the ELD final rule is being contested in federal court by parties opposed to the rule.
The FMCSA and the NHTSA proposed regulations that would require vehicles of a certain size to be equipped with a speed limiting device set to a specified speed in August 2016. There can be no guarantee as to
8
whether a final rule requiring speed limiting devices will be implemented, and if so the nature of any such rule and its impact on our fleet and operations. While such regulations could increase the cost of technology, capital equipment and maintenance expenses across our industry, we expect that all our tractors will have the necessary on-board technology systems in place to capture this data by the time the regulations take effect.
Environmental Protection Agency.
The EPA has issued regulations reducing sulfur content of diesel fuel and reducing engine emissions. These regulations increased the cost of replacing and maintaining trucks. Future environmental laws in this area could further increase our costs and impact our operations.
Our operations are subject to environmental laws and regulations dealing with the handling of hazardous materials, underground fuel storage tanks and discharge and retention of storm water. We operate in industrial areas where truck terminals and other industrial activities are located and where groundwater or other forms of environmental contamination may have occurred. Our operations involve the risks of fuel spillage or seepage, environmental damage and hazardous waste disposal, among others. Although we have programs in place designed to monitor and control environmental risks and to promote compliance with applicable environmental laws and regulations, violations of applicable environmental laws or regulations or spills or other accidents involving hazardous substances can still occur and may subject us to cleanup costs, liabilities not covered by insurance, substantial fines or penalties and to civil and criminal liability, any of which could adversely affect our financial condition, results of operations, liquidity and cash flows.
In October 2016, the EPA and the NHTSA published the final rule for Phase 2 of the greenhouse gas (GHG) emissions and fuel efficiency vehicle and engine performance standards. The rule covers model years 2018-2027 for semi-trucks, large pickup trucks and all types and sizes of work trucks. While the impact of these regulations cannot be ascertained at this time, such regulations could increase the cost of capital equipment and maintenance expenses, which could have a material adverse effect on our financial condition, results of operations, liquidity and cash flows.
Food and Drug Administration.
As a transportation provider of foodstuffs, we are subject to rules issued by the Food and Drug Administration (FDA) to provide for the security of food and foodstuffs throughout the supply chain. The Sanitary Food Transportation Act (SFTA) shifted responsibility for the regulation of food transportation from the DOT to the FDA. Effective June 6, 2016, the FDA issued a final rule to establish requirements under SFTA for vehicles and transportation equipment, transportation operations, training, recordkeeping and waivers. The rule is designed to continue the use of best practices in the industry concerning cleaning, inspection, maintenance, loading and unloading of, and operation of vehicles. Carriers are required to develop and implement written procedures subject to recordkeeping that specify its practices for cleaning, sanitizing, and inspecting vehicles and transportation equipment. Although we already strive to adhere to such best practices, the impact of the final rule is uncertain and compliance may cause us to incur additional expenses and affect our operations.
Trademarks and Patents
We have registered several service marks and trademarks in the United States Patent and Trademark Office, including Saia Guaranteed Select®, Saia Customer Service Indicators® and Saia Xtreme Guarantee®. We believe these service marks and trademarks are important components of our marketing strategy.
Additional Information
Saia has an internet website that is located at www.saia.com. Saia makes available, free of charge through its internet website, all filings with the Securities and Exchange Commission (SEC) as soon as reasonably practicable after making such filings with the SEC.
9
Executive Officers
Information regarding executive officers of Saia is as follows (included herein pursuant to Instruction 3 to Item 401(b) of Regulation S-K and General Instruction G(3) of Form 10-K): Name Age Positions Held Richard D. O’Dell.............................. 55 President and Chief Executive Officer of Saia, Inc. since January 1,
2007, having served as President of Saia, Inc. since July 2006.Previously, Mr. O’Dell served as President and Chief ExecutiveOfficer of Saia LTL Freight since November 1999. Mr. O’Dell hasbeen a member of the Board of Directors of Saia, Inc. since July 2006.
Frederick J. Holzgrefe, III ................. 49 Vice President of Finance and Chief Financial Officer of Saia, Inc.since September 2014. Prior to joining Saia, Mr. Holzgrefe was VicePresident of Business Development and Vice President and Chief Financial Officer for Golden Peanut Company.
Mark H. Robinson ............................. 58 Vice President and Chief Information Officer of Saia, Inc. sinceAugust 2005 having served as Vice President of InformationTechnology for Saia LTL Freight since 1999.
Brian A. Balius .................................. 55 Vice President of Transportation and Engineering of Saia LTLFreight since 2007.
Raymond R. Ramu ............................ 48 Chief Customer Officer of Saia, Inc. since May 2015. Mr. Ramu joined Saia LTL Freight in December 1997 having served as Vice President of Sales - East from April 2007 to May 2015.
Stephanie R. Maschmeier .................. 44 Controller of Saia, Inc. since October 2007. Mrs. Maschmeier, a certified public accountant, joined Saia, Inc. in July 2002 asCorporate Financial Reporting Manager.
Officers are elected by the Board of Directors of Saia, Inc. (the Board) and serve at the discretion of the
Board. With the exception of Mr. O’Dell, none of the officers of the Company are subject to an employment agreement with the Company. There are no family relationships between any executive officer and any other executive officer or director of Saia or its subsidiaries. Item 1A. Risk Factors
Saia stockholders should be aware of certain risks, including those described below and elsewhere in this Form 10-K, which could adversely affect the value of their holdings and could cause our actual results to differ materially from those projected in any forward looking statements.
We are subject to general economic conditions that are largely out of our control, any of which could adversely affect our business.
Our business is subject to a number of general economic conditions that may have a material adverse effect on our financial condition, the results of operations, liquidity and cash flows, many of which are largely out of our control. These include recessionary economic cycles and downturns in customer business cycles. Economic conditions may adversely affect the business levels of our customers, the amount of transportation services they need and their ability to pay for our services.
10
We operate in a highly competitive industry and our business will be adversely impacted if we are unable to adequately address potential downward pricing pressures and other factors.
Numerous competitive factors could impair our ability to maintain our current profitability. These factors include the following:
competition with many other transportation service providers of varying types including competitor LTL carriers and non-asset based logistics and freight brokerage companies, some of which have moreequipment, a broader coverage network, a wider range of services and greater capital resources thanwe do or have other competitive advantages;
transportation companies periodically reduce their prices to gain business, especially during economicrecessions or times of reduced growth rates in the economy which may limit our ability to maintain orincrease prices or achieve significant growth in our business;
many customers reduce the number of carriers they use by selecting approved transportation serviceproviders, periodically accepting bids from multiple carriers for their shipping needs, or by developingtheir own or using alternative delivery mechanisms, and these practices may depress prices or result inthe loss of business;
the trend towards consolidation in the surface transportation industry may create other large carrierswith greater financial resources than us and other competitive advantages due to their size;
disruptive technologies entering the industry may radically alter historical business models;
the trend toward increased sales in the ecommerce sector as opposed to the traditional brick andmortar store model could adversely impact our revenue; and
technological advances require increased investments to remain competitive, and we may not utilize enough advanced technology, select the correct technology solutions or convince our customers to accept higher prices to cover the cost of these investments.
The transportation industry is affected by business risks that are largely out of our control.
Businesses operating in the transportation industry are affected by risks that are largely out of their control, any of which could have a material adverse effect on our financial condition, results of operations, liquidity and cash flows. These factors include health of the economy, weather and other seasonal factors, excess capacity in the transportation industry, supply chain disruptions, acts of terrorism, interest rates, fuel costs, fuel taxes, license and registration fees, healthcare costs and insurance premiums. In particular, harsh weather or acts of terrorism can affect our operations by increasing operational costs, introducing infrastructure instability and disrupting advance route and load planning.
We are dependent on cost and availability of qualified drivers and purchased transportation.
There is significant competition for qualified drivers within the trucking industry and attracting and retaining drivers has become more challenging. Regulatory requirements, including the Federal Motor Carrier Safety Administration’s (FMCSA) data-driven safety and compliance enforcement initiative, Compliance, Safety, Accountability (CSA), have contributed to the reduction in the number of eligible drivers and may continue to do so in the future. We may periodically experience shortages of qualified drivers that could result in us not meeting customer demands, upward pressure on driver wages and benefits, underutilization of our truck fleet and/or use of higher cost purchased transportation which could have a material adverse effect on our financial condition, results of operations, liquidity and cash flows. There is also significant competition for quality purchased transportation within the trucking industry. We may periodically experience shortages of quality purchased transportation that could result in higher costs for these services or prevent us from meeting customer demands which could have a material adverse effect on our financial condition, results of operations, liquidity and cash flows.
11
We are dependent on cost and availability of fuel.
Fuel is a significant operating expense and its availability is vital to daily operations. We do not hedge against the risk of fuel price increases. Global political events, acts of terrorism, federal, state and local laws and regulations, natural disasters and other external factors could adversely affect the cost and availability of fuel. In the past, we have been able to obtain fuel from various sources and in the desired quantities, but there can be no assurance that this will continue to be the case in the future and any shortage or interruption in the supply or distribution of fuel could have a material adverse effect on our financial condition, results of operations, liquidity and cash flows. To the extent not offset by fuel surcharges or other customer price changes, volatility in fuel prices or significant increases in fuel taxes resulting from these economic or regulatory changes could have a material adverse effect on our financial condition, results of operations, liquidity and cash flows. Historically, we have been able to offset significant fuel price volatility through fuel surcharges and other pricing adjustments but we cannot be certain that we will be able to do so in the future. In recent years, given the significance of fuel surcharges, the negotiation of customer price increases has become commingled with fuel surcharges. We have experienced increases in other operating costs as a result of volatility in fuel prices; however, the total impact of volatility in fuel prices on other non-fuel related expenses is difficult to determine. Fluctuations in our fuel surcharge recovery may result in fluctuations in our revenue. Rapid and significant fluctuations in diesel fuel prices would reduce our profitability until we make the appropriate adjustments to our pricing strategy.
We may face risks related to our expansion into the Northeastern United States.
We plan to expand our service geography into the Northeastern United States in 2017. Beginning in the second quarter of 2017, we plan to open four to six terminals targeting major markets in Pennsylvania and New Jersey and plan to add new markets in the Northeastern United States at a similar pace in 2018. There is no assurance that we will be successful at adding new markets as planned or that such markets will be profitable. This expansion will require investments in purchased or leased terminals, equipment (including the purchase of new tractors and trailers), technology, employees and other related start-up costs to facilitate our growth plans. Additionally, we plan to invest in certain areas of our existing network so that we will be able to handle the increased freight flows we anticipate to and from the new markets. The Northeastern market is extremely competitive and there is no assurance that we will generate revenues sufficient to cover our costs of expanding there. Expansion into the Northeast could cause disruptions in our existing geography or require management to devote excessive time and effort to managing the expansion, which could adversely affect our business operations and profitability. Operation in the Northeast may increase the possibility of one or more union organizing efforts. In addition, harsh winter weather in the Northeast may increase our risk of weather-related expenses. A delay between the outlay of expenditures to expand our geographic footprint and generation of new revenue or higher than anticipated costs or lower than expected revenues from the expansion could adversely affect our financial condition, results of operations, liquidity and cash flows. We may experience decreased profitability until we are able to fully realize the benefits of the investment, if ever.
Ongoing insurance and claims expenses could significantly reduce and cause volatility to our earnings.
We are regularly subject to claims resulting from cargo loss, personal injury, property damage, group healthcare and workers’ compensation and we maintain insurance deductibles for these claims in amounts ranging from $250,000 to $2 million per claim. We also maintain insurance with licensed insurance companies (rated excellent or better) above these self-insured retention limits. If the number or severity of future claims increases, claim expenses might exceed historical levels or could exceed the amounts of our insurance coverage or the amount of our reserves for self-insured claims, which would adversely affect our financial condition, results of operations, liquidity and cash flows. Deterioration in safety experience could cause customers to switch business to competitors.
In recent years, several insurance companies have stopped offering coverage to trucking companies as a result of increases in the severity of automobile liability claims and higher costs of settlements and verdicts. This trend could adversely affect our ability to obtain suitable insurance coverage or could significantly increase our cost for obtaining such coverage, which would adversely affect our financial condition, results of operations, liquidity and cash flows.
Furthermore, insurance companies, as well as certain states, require collateral in the form of letters of credit or surety bonds for the estimated exposure of claims within our self-insured retentions. Their estimate of our future
12
exposure as well as external market conditions could influence the amount and costs of additional letters of credit required under our insurance programs and thereby reduce capital available for future growth or adversely affect our financial condition, results of operations, liquidity and cash flows. In addition, insurance companies are increasingly encouraging or requiring trucking companies to increase the level of technology and safety measures used in their fleet, which could increase the costs of our fleet in order to obtain acceptable coverage or avoid rate hikes.
We face litigation risks that could have a material adverse effect on the operation of our business.
We face litigation risks regarding a variety of issues, including without limitation, accidents involving our trucks and employees, alleged violations of federal and state labor and employment laws, securities laws, environmental liability and other matters. These proceedings may be time-consuming, expensive and disruptive to normal business operations. The defense of such lawsuits could result in significant expense and the diversion of our management’s time and attention from the operation of our business. In recent years, several insurance companies have stopped offering coverage to trucking companies as a result of increases in the severity of automobile liability claims and higher costs of settlements and verdicts. This trend could adversely affect our ability to obtain suitable insurance coverage or could significantly increase our cost for obtaining such coverage, which would adversely affect our financial condition, results of operations, liquidity and cash flows. Costs we incur to defend or to satisfy a judgment or settlement of these claims may not be covered by insurance or could exceed the amount of that coverage or increase our insurance costs and could have a material adverse effect on our financial condition, results of operations, liquidity and cash flows.
Employees of Saia are non-union. The ability of Saia to compete could be impaired if operations were to become unionized.
None of our employees are currently subject to a collective bargaining agreement. We have in the past been the subject of unionization efforts which have been defeated. However, the U.S. Congress could pass labor legislation, such as the formerly proposed Employee Free Choice Act, or the National Labor Relations Board or other federal agencies could issue regulations or administrative changes, which could make it significantly easier for unionization efforts to be successful. If this bill or a variation of it is enacted in the future or if federal regulations regarding labor relations are changed, it could have an adverse impact on our financial condition, results of operations, liquidity and cash flows. Our proposed expansion into portions of the Northeast commencing in 2017 could increase our overall risk of unionization. While Saia believes its current relationship with its employees is good, there can be no assurance that further unionization efforts will not occur in the future and that such efforts will be defeated. The non-union status of Saia is an important factor in our ability to compete in our markets, and if all or a portion of our workforce becomes unionized it could increase our costs and subject us to workplace rules, which would have an adverse impact on our financial condition, results of operations, liquidity and cash flows.
We must test our goodwill and other intangible assets for impairment at least annually, which could result in a material, non-cash write-down of goodwill and other intangible assets and could have a material adverse impact on our business.
Goodwill and indefinite-lived intangible assets are subject to impairment assessments at least annually (or more frequently when events or changes in circumstances indicate that an impairment may have occurred) by applying a fair-value based test. Our principal intangible assets are goodwill and other intangible assets. A loss of significant customers or a decrease in our market capitalization or profitability increases the risk of goodwill impairment. An impairment charge could have a material adverse impact on our financial results of operations.
Demand for new and used revenue equipment and limited supply of suitable real estate may adversely affect our business.
Investment in new revenue equipment is a significant part of our annual capital expenditures. We may have difficulty in purchasing new trucks due to decreased supply, increased demand and restrictions on the availability of capital. The price of such equipment may increase as a result of regulations on newly manufactured tractors, such as the Environmental Protection Agency (EPA) and various state regulations requiring progressive reductions in exhaust emissions. These regulations have increased prices for tractors and increased maintenance costs. In addition,
13
as we purchase new revenue equipment as part of our normal replacement cycle each year, we rely on the used equipment market to dispose of our older equipment. Oversupply in the transportation industry as well as adverse economic conditions can negatively impact the demand for used equipment and, therefore, reduce the value we can obtain for our used equipment. If we are unable to sell our older equipment at or above our salvage value, the resulting losses could have a significant impact on our financial condition, results of operations, liquidity and cash flows.
Our business model is also dependent on cost and availability of terminal facilities in key metropolitan areas. Shortages in the availability of suitable real estate or delays in construction due to difficulties in obtaining permits or approvals may result in significant additional investment in leasing, purchasing or building facilities, increase our operating expenses and/or prevent us from efficiently serving certain markets. In addition, we may not realize sufficient revenues or profits from our infrastructure investments.
The engines in our newer tractors are subject to new emissions-control regulations which could substantially increase operating expenses and future regulations concerning emissions or fuel-efficiency may have an adverse impact on our business.
Tractor engines that comply with the EPA emission-control design requirements have generally been less fuel-efficient and have increased maintenance costs compared to engines in tractors manufactured before these requirements became effective. If we are unable to offset resulting increases in fuel expenses or maintenance costs with higher freight rates or improved fuel economy, our financial condition, results of operations, liquidity and cash flows could be adversely affected.
Future strengthening of EPA or other regulatory requirements regarding fuel-efficiency of tractors could also result in increases in the cost of capital equipment and maintenance. While savings on fuel costs resulting from the use of more fuel-efficient equipment could mitigate these additional expenses in part, the impact of future regulations cannot be projected at this time.
In October 2016, the EPA and the National Highway Traffic Safety Administration (NHTSA) published the final rule for Phase 2 of the greenhouse gas (GHG) emissions and fuel efficiency vehicle and engine performance standards. The rule covers model years 2018-2027 for semi-trucks, large pickup trucks and all types and sizes of work trucks. While the impact of these regulations cannot be ascertained at this time, such regulations could increase the cost of capital equipment and maintenance expenses, which could have a material adverse effect on our financial condition, results of operations, liquidity and cash flows.
Our Company-specific performance improvement initiatives, including management of the cost structure to match shifts in customer volume levels, may not be effective.
Operating performance improvement at Saia is dependent on the implementation and/or the continuation of various performance improvement initiatives. There can be no assurance that Saia will be successful in implementing these performance improvement initiatives or that Saia’s historical performance trend will be representative of future performance. In addition, we are capital intensive with a relatively high fixed-cost structure that is difficult to adjust to match shifting volume levels. Failure to achieve performance improvement initiatives could have a material adverse impact on our financial condition, results of operations, liquidity and cash flows.
We operate in a highly regulated and highly taxed industry. Costs of compliance with or liability for violation of existing or future regulations may adversely affect our business.
The Department of Transportation (DOT) and various state agencies exercise broad powers over our business, generally governing such activities as authorization to engage in motor carrier operations, safety and financial reporting. We may also become subject to new or more restrictive regulations imposed by the DOT, the Occupational Safety and Health Administration (OSHA) or other authorities relating to engine exhaust emissions, safety performance and measurements, driver hours of service, drug and alcohol testing, security, ergonomics, as well as other unforeseen matters. Compliance with such regulations could substantially impair equipment productivity and increase our costs. Various federal and state authorities impose significant operating taxes on the
14
transportation industry, including fuel taxes, tolls, excise and other taxes. There can be no assurance such taxes will not substantially increase or that new forms of operating taxes will not be imposed on the industry.
The FMCSA rules on motor carrier driver hours of service limit the maximum number of hours a driver may be on duty between mandatory off-duty hours. Our operations were adjusted to comply with these rules, and while our base operations were not materially affected, we did experience deterioration in the cost, availability and reliability of purchased transportation. Revisions to these rules, as a result of pending or future legal challenges or any future requirements for on-board recorders, could further impact our operations, further tighten the market for qualified drivers and put additional pressure on driver wages and purchased transportation costs.
The Transportation Security Administration (TSA) continues to focus on trailer security, driver identification and security clearance and border crossing procedures. These and other safety and security measures, such as rules for transportation of hazardous materials could increase the cost of operations, reduce the number of qualified drivers and disrupt or impede the timing of our deliveries for our customers.
The Food and Drug Administration (FDA) issues rules for carriers of foodstuffs like us to provide for the security of food and foodstuffs throughout the supply chain. The Sanitary Food Transportation Act (SFTA) shifted responsibility for the regulation of food transportation from the DOT to the FDA. Effective June 6, 2016, the FDA issued a final rule to establish requirements under SFTA for vehicles and transportation equipment, transportation operations, training, recordkeeping and waivers. The rule is designed to continue the use of best practices in the industry concerning cleaning, inspection, maintenance, loading and unloading of, and operation of vehicles. Carriers are required to develop and implement written procedures subject to recordkeeping that specify its practices for cleaning, sanitizing, and inspecting vehicles and transportation equipment. Although we already strive to adhere to such best practices, the impact of the final rule is uncertain and compliance may cause us to incur additional expenses and affect our operations.
Historically, the EPA has issued regulations that require progressive reductions in exhaust emissions from diesel engines. These regulations increased the cost of replacing and maintaining trucks and increased fuel costs by reducing miles per gallon. These regulations have the potential to reduce availability of fuel and reduce productivity which could have a material adverse effect on our financial condition, results of operations, liquidity and cash flows.
In December 2015, the FMCSA issued a final rule related to mandatory use of Electronic Log Devices (ELD). The rule requires many in-state-only drivers and most interstate commercial motor vehicle drivers to be compliant by no later than December 18, 2017. Drivers voluntarily using a compliant automatic on-board recording device by the December 18, 2017, deadline will be “grandfathered” for two years to give providers time to update their systems to be compliant with the ELD standards. While such regulations could increase the cost of technology, capital equipment and maintenance expenses across our industry, we implemented ELDs company-wide in 2014 prior to the effective date of the ELD standard. Despite our current company-wide use of ELDs, there can be no guarantee that our understanding of the new regulations will be the same as that of the government in all aspects. In addition, the implementation of the ELD final rule is being contested in federal court by parties opposed to the rule.
In August 2016, the NHTSA and FMSCA proposed regulations that would require vehicles of a certain size to be equipped with a speed limiting device set to a specified speed. There can be no guarantee as to whether a final rule requiring speed limiting devices will be implemented, and if so the nature of any such rule and its impact on our fleet and operations.
In October 2016, the EPA and NHTSA published the final rule for Phase 2 of the GHG emissions and fuel efficiency vehicle and engine performance standards. The rule covers model years 2018-2027 for semi-trucks, large pickup trucks and all types and sizes of work trucks. While the impact of these regulations cannot be ascertained at this time, such regulations could increase the cost of capital equipment and maintenance expenses, which could have a material adverse effect on our financial condition, results of operations, liquidity and cash flows.
15
We are subject to various environmental laws and regulations. Costs of compliance with or liabilities for violations of existing or future regulations could have a material adverse effect on our business. We are also subject to increasing customer sensitivity to sustainability issues.
Our operations are subject to environmental laws and regulations dealing with the handling of hazardous materials, underground fuel storage tanks and discharge and retention of storm water. We operate in industrial areas where truck terminals and other industrial activities are located and where groundwater or other forms of environmental contamination may have occurred. Our operations involve the risks of fuel spillage or seepage, environmental damage and hazardous waste disposal, among others. Although we have programs in place designed to monitor and control environmental risks and to promote compliance with applicable environmental laws and regulations, violations of applicable environmental laws or regulations or spills or other accidents involving hazardous substances can still occur and may subject us to cleanup costs, liabilities not covered by insurance, substantial fines or penalties and to civil and criminal liability, any of which could adversely affect our financial condition, results of operations, liquidity and cash flows.
In addition, as climate change concerns become more prevalent, federal, state and local governments and our customers are increasingly sensitive to these issues. This increased focus on sustainability may result in new regulations and customer requirements that could negatively affect us. This could cause us to incur additional direct costs or to make changes to our operations in order to comply with any new regulations and customer requirements. We could also lose revenue if our customers divert business from us because we have not complied with their sustainability requirements. These costs, changes and loss of revenue could have a material adverse effect on our financial condition, results of operations, liquidity and cash flows.
CSA could adversely affect our results of operations and ability to maintain or grow our business.
CSA is an enforcement and compliance model required by the FMCSA that involves assessments of a motor carrier’s on-road performance and investigation results for a 24-month period using roadside stops and inspections, resulting in safety and performance ratings in the following categories: unsafe driving; hours-of-service compliance; driver fitness; controlled substances/alcohol; vehicle maintenance; hazardous material compliance; and crash indicators.
In addition, the safety standards prescribed in CSA could change and our ability to maintain an acceptable score could be adversely impacted. In January 2016, the FMCSA proposed to revise the current methodology for issuance of a safety fitness determination for motor carriers. The proposed new methodologies would determine when a motor carrier is not fit to operate commercial motor vehicles based on the carrier’s on-road safety data in relation to industry data, an investigation or a combination of on-road safety data and investigation information and would evaluate carriers monthly. A supplemental notice of proposed rulemaking was announced in January 2017.
The CSA evaluations are used to rank carriers and individual drivers and to select carriers for audit and other interventions. Public disclosure of certain CSA scores was restricted through the enactment of the Fixing America’s Surface Transportation Act of 2015 (the FAST Act) on December 4, 2015; however, the FAST Act does not restrict public disclosure of all data collected by the FMSCA. If we receive unacceptable CSA scores, and this data is made available to the public, our relationships with our customers could be damaged, which could result in decreased demand for our services. The requirements of CSA could also shrink the industry’s pool of drivers as those with unfavorable scores could leave the industry. While the ultimate impact of CSA is not yet known, it is possible that future CSA rulemaking could adversely impact our ability to attract and retain drivers which would adversely affect our financial condition, results of operations, liquidity and cash flows.
We may face risks related to the geographic concentration of our customers.
We have operations throughout the South, Southwest, Midwest, Pacific Northwest and West and we plan to begin serving portions of the Northeast starting in 2017. As a result, changes in the economic climate, consumer trends, market fluctuations or supply shortages in these regions could decrease demand for our services in these regions and may adversely affect our financial condition, results of operations, liquidity and cash flows. For example, the energy sector is important to local economies in several of these regions. If the recent declines in oil
16
and gas prices continue, this could reduce the demand for our services in these regions, which could also adversely affect our financial condition, results of operations, liquidity and cash flows.
Anti-terrorism measures and terrorist events may disrupt our business.
Federal, state and municipal authorities have implemented and are continuing to implement various anti-terrorism measures, including checkpoints and travel restrictions on large trucks. If additional security measures disrupt or impede the timing of our deliveries, we may fail to meet requirements of our customers or incur increased expenses to do so. There can be no assurance that new anti-terrorism measures will not be implemented and that such measures will not have a material adverse effect on our financial condition, results of operations, liquidity and cash flows. Terrorism events that disrupt our operations or the operations of our customers could also materially impact our financial condition, results of operations, liquidity and cash flows.
Our logistics and non-asset truckload business faces risk from customer concentration and the loss of certain primary customers may have a material adverse effect on those operations.
Our non-asset operations are subject to the risk of customer concentration because of the relative importance of their largest customers and the ability of those customers to negotiate aggressive pricing and other customer-favorable terms, including termination for convenience. Although we aim to broaden and diversify the customer base of our logistics and non-asset truckload business, a significant portion of our revenue from these subsidiaries is derived from a small number of large and sophisticated customers and a loss of business from, the bankruptcy or insolvency of, or adverse performance by, these major customers may have a material adverse effect on our financial condition, results of operations, liquidity and cash flows. Similarly, the renegotiation of these customer contracts may also have an adverse effect on us.
We have significant ongoing cash requirements that could limit our growth and affect profitability if we are unable to generate sufficient cash from operations or obtain sufficient financing on favorable terms.
Our business is highly capital intensive. Our net capital expenditures for 2016 were approximately $152 million inclusive of equipment acquired with capital leases. Additionally, we anticipate net capital expenditures in 2017 of approximately $220 million. We depend on cash flows from operations, borrowings under our credit facilities and operating and capital leases. If we are unable to generate sufficient cash from operations and obtain sufficient financing on favorable terms in the future, we may have to limit our growth, enter into less favorable financing arrangements or operate our trucks and trailers for longer periods. The amount and timing of capital investments depend on various factors, including anticipated volume levels and the price and availability of appropriate-use property for service facilities and newly manufactured tractors. If anticipated service facilities and/or fleet requirements differ materially from actual usage, we may have too much or too little capacity. Any of these could have a material adverse effect on our financial condition, results of operations, liquidity and cash flows.
Under our current credit facilities, we are subject to certain debt covenants and prepayment penalties. Those debt covenants prohibit the payment of dividends, provide limits on our ability to repurchase our stock, and require maintenance of certain maximum leverage and minimum fixed charge coverage ratios, among other restrictions, that could limit availability of capital to meet our future growth.
Our ability to repay or refinance our indebtedness will depend upon our future operating performance which will be affected by general economic, financial, competitive, legislative, regulatory and other factors beyond our control.
Our credit and debt agreements contain financial and other restrictive covenants and we may be unable to comply with these covenants. A default could cause a material adverse effect on our business.
We must maintain certain financial and other restrictive covenants under our credit and debt agreements, including among others, covenants requiring maintenance of minimum fixed charge coverage and maximum leverage ratios. If we fail to comply with any of the covenants under our credit and debt agreements, we will be in default under the relevant agreement which could cause cross-defaults under other financial arrangements. In the
17
event of any such default, if we fail to obtain replacement financing, amendments to or waivers under the applicable financing arrangements, our financing sources could cease making further advances, cease issuing letters of credit required under our insurance programs or declare our debt to be immediately due and payable. If acceleration occurs, we may have difficulty in borrowing sufficient additional funds to refinance the accelerated debt or obtain required letters of credit, or we may have to issue securities which would dilute stock ownership. Even if new financing is made available to us, it may not be available on acceptable terms. A default under our credit and debt agreements could cause a material adverse effect on our financial condition, results of operations, liquidity and cash flows.
If we are unable to retain our key employees, our business could be adversely impacted.
We depend on the efforts and abilities of our senior management. The future success of our business will continue to depend in part on our ability to retain our current management team and to attract and retain qualified personnel in the future. Competition for senior management is intense, and, with the exception of Mr. O’Dell, members of our senior management do not have employment agreements. Certain members of senior management are subject to non-compete and non-solicitation agreements; however, there is no assurance that such agreements will be enforced as written or that they will be effective to prevent members of senior management from working for a competitor or soliciting our customers. Inadequate succession planning or the unexpected departure of a member of senior management would require our remaining executive officers to divert immediate and substantial attention to fulfilling the duties of the departing executive and to seeking a replacement. The inability to adequately fill vacancies in our senior management positions on a timely basis could negatively affect our ability to implement our business strategy and thus impact our results of operations.
Changes to our compensation and benefits could adversely affect our ability to attract and retain employees.
The compensation we offer our employees is subject to market conditions that may require increases in employee compensation, which becomes more likely as economic conditions improve. If we are unable to attract and retain a sufficient number of employees, we could be required to adjust our compensation packages, or reduce our operations and face difficulty meeting customer demands, any of which could adversely affect our financial condition, results of operations, liquidity and cash flows.
An increase in the cost of healthcare benefits administration could have a negative impact on our business.
We maintain and sponsor health insurance for our employees and their dependents and offer a competitive healthcare program to attract and retain our employees. It is possible that healthcare benefits and administration costs could become increasingly cost prohibitive, either forcing us to reduce our benefits program (making it more difficult to retain of qualified employees) or require us to pay the higher costs. Either outcome could negatively impact our financial condition, results of operations, liquidity and cash flows.
The legislation on healthcare and related regulations could affect the healthcare benefits required to be provided by the Company and cause our compensation costs to increase.
Under the comprehensive U.S. healthcare reform law enacted in 2010, the Affordable Care Act (ACA), and changes that became effective in 2014, and especially the employer mandate and employer penalties that became effective January 1, 2015, our labor costs could significantly increase in future years. In any event, implementing the requirements of the ACA has imposed additional administrative costs on us, and those costs may increase over time. The costs and other effects of these new healthcare requirements cannot be determined with certainty, particularly in light of the potential amendment or repeal of all or parts of the ACA as a result of the 2016 U.S. presidential election, but they may have a material adverse effect on our financial condition, results of operations, liquidity and cash flows.
Our business may adversely be impacted by potential future changes in accounting practices.
Future changes in accounting standards or practices, and related legal and regulatory interpretations of those changes, may adversely impact public companies in general, the transportation industry or our operations
18
specifically. New accounting standards or requirements, such as a conversion from U.S. generally accepted accounting principles to International Financial Reporting Standards, could change the way we record revenues, expenses, assets and/or liabilities or could be costly to implement. These types of regulations could have a negative impact on our financial position, results of operations, liquidity and cash flows.
Weakness or a loss of confidence in financial markets could adversely impact demand for our services.
Weakness or a loss of confidence in the financial markets could cause broader economic downturns and impact the ability of our customers to access the capital or credit markets which may lead to lower demand for our services, increased incidence of customers’ inability to pay their accounts, or insolvency of our customers, any of which could adversely affect our financial condition, results of operations, liquidity and cash flows.
Disruptions in the credit markets, including in the availability and cost of short-term funds for liquidity and letter of credit requirements may adversely affect our business and our ability to meet long-term commitments.
If internal funds are not available from our operations, we may be required to rely on the capital and credit markets to meet our financial commitments and short-term liquidity needs. Disruptions in the capital and credit markets could adversely affect our ability to draw on our bank revolving credit facility and obtain letters of credit required for our insurance programs. Our access to funds and letters of credit under that credit facility is dependent on the ability of the banks that are parties to the facility to meet their funding commitments. Those banks may not be able to meet their funding commitments to us if they experience shortages of capital and liquidity or if they experience excessive volumes of borrowing requests from other borrowers within a short period of time.
Longer term disruptions in the capital and credit markets as a result of uncertainty, changing or increased regulation, reduced alternatives or failures of significant financial institutions could adversely affect our access to liquidity needed for our business. Any disruption could require us to take measures to conserve cash until the markets stabilize or until alternative credit arrangements or other funding for our business needs can be arranged.
We rely heavily on technology to operate our business and cyber-security threats or other disruptions to our technology infrastructure could harm our business.
Our ability to attract and retain customers and compete effectively depends in part upon reliability of our technology network including our ability to provide services that are important to our customers. Any disruption to our technology infrastructure (including services provided to us for use in our business by outside providers), including those impacting our computer systems and website, could adversely impact our customer service and revenues and result in increased risk of litigation or costs. While we have invested and continue to invest in technology security initiatives and disaster recovery plans, these measures cannot fully protect us from technology disruptions that could have a material adverse effect on our financial condition, results of operations, liquidity and cash flows.
Our dependence on electronic data storage, automated systems and technology gives rise to cyber-security risks. Although we and our third-party providers have preventive systems and processes in place designed to protect against the risk of system failure and cyber-attacks, a security breach of our systems or those of our third-party providers may cause a disruption of our business or expose us to a loss of information or litigation and could have a material adverse effect on our financial condition, reputation and results of operations.
Our business depends in part on our strong reputation.
We believe that Saia’s corporate reputation is a valuable asset. As use of social media becomes more prevalent, our susceptibility to risks related adverse publicity, whether or not justified, increases. While we have implemented a social media policy to provide our employees with guidance for sharing information in a way that is beneficial to us, the immediacy of certain social media outlets precludes us from having real-time control over postings related to Saia, whether matters of fact or opinion. Information distributed via social media could result in immediate unfavorable publicity for which we, like our competitors, do not have the ability to reverse. This unfavorable publicity could result in damage to our reputation and therefore negatively impact our operations and profitability.
19
Certain provisions of our governing documents and Delaware law could have anti-takeover effects.
As a Delaware corporation, we are subject to certain Delaware anti-takeover provisions. Under Delaware law, a corporation may not engage in a business combination with any holder of 15% or more of its capital stock unless the holder has held the stock for three years or, among other things, the Board of Directors has approved the transaction. Our Board of Directors could rely on Delaware law to prevent or delay an acquisition of us.
Our Restated Certificate of Incorporation and By-laws contain certain provisions which may have the effect of delaying, deferring or preventing a change of control of the Company. Such provisions include, for example, provisions classifying our Board of Directors, a prohibition on shareholder action by written consent, authorization of the Board of Directors to issue preferred stock in series with the terms of each series to be fixed by the Board of Directors and an advance notice procedure for shareholder proposals and nominations to the Board of Directors. These provisions may inhibit fluctuations in the market price of our common stock that could result from takeover attempts.
We may not make future acquisitions or, if we do, we may not realize the anticipated benefits of future acquisitions and integration of these acquisitions may disrupt our business and management.
We may acquire additional businesses and operations in the future. However, there is no assurance that we will be successful in identifying, negotiating, consummating or integrating any future acquisitions. Additionally, we may not realize the anticipated benefits of any future acquisitions. Each acquisition has numerous risks including:
difficulty in integrating the operations and personnel of the acquired company or unanticipated coststo support new business lines or separate legal entities;
disruption of our ongoing business, distraction of our management and employees from otheropportunities and challenges due to integration issues;
additional indebtedness or the issuance of additional equity to finance future acquisitions, which couldbe dilutive to our stockholders;
potential loss of key customers or employees of acquired companies;
temporary depression in prices we charge certain customers in order to match existing customerpricing in the acquired company’s markets;
inability to achieve the financial and strategic goals for the acquired and combined businesses;
potential impairment of tangible and intangible assets and goodwill acquired as a result ofacquisitions; and
potential failure of the due diligence processes to identify significant issues with legal and financialcontingencies, among other things.
In the event that we do not realize the anticipated benefits of an acquisition or if the acquired business is not successfully integrated, there could be a material adverse effect on our financial condition, results of operations, liquidity and cash flows.
If we raise additional capital in the future, stockholders’ ownership in us could be diluted.
Any issuance of equity we may undertake in the future to raise additional capital could cause the price of our common stock to decline, or require us to issue shares at a price that is lower than that paid by holders of our common stock in the past, which would result in those newly issued shares being dilutive. If we obtain funds through a credit facility or through the issuance of debt or preferred securities, these obligations and securities would likely have rights senior to those of common shareholders, which could impair the value of our common stock.
We face risks related to the creditworthiness of our customers and their ability to pay for services.
If one or more of our customers experiences financial difficulties, including filing for bankruptcy, it may negatively affect our business due to the decreased demand for our services from these customers, or the
20
potential inability of these companies to make full payment on amounts owed to us. Customer bankruptcies also entail the risk of potential recovery by the bankruptcy estate of amounts previously paid to us that are deemed a preference under bankruptcy laws. We do not carry insurance against the risk of customer default on their payment obligations to us or against bankruptcy preference claims. The risks associated with these matters will likely increase in the event of an economic downturn. The loss of revenue from these customers or payment of preference claims could have a material adverse effect on our financial condition, results of operations, liquidity and cash flows.
The market value of our common stock may fluctuate and could be substantially affected by various factors.
The price of our common stock on the NASDAQ Global Select Market constantly changes. We expect that the market price of our common stock will continue to fluctuate and the fluctuations may be unrelated to our financial performance. Our share price may fluctuate as a result of a variety of factors, many of which are beyond our control. Factors that could cause fluctuation of our stock price include, but are not limited to, the following:
Actual or anticipated variations in our earnings, financial or operating performance or liquidity, orthose of other companies in our industry;
Changes in recommendations or projections of research analysts who follow our stock or the stock of other companies in our industry;
Failure to meet the earnings projections of research analysts who follow our stock;
Changes in general economic and capital market conditions, including general market price declines or market volatility;
Reactions to our regulatory filings and announcements related to our business;
Operating and stock performance of other companies in our industry;
Actions by government regulators;
Litigation involving our company, our general industry or both;
News reports or trends, concerns and other issues related to us or our industry, including changes inregulations; and
Other factors described in this “Risk Factors” section.
Our financial condition, results of operations, liquidity and cash flows could be adversely affected by an unfavorable outcome resulting from these risks and uncertainties.
Item 1B. Unresolved Staff Comments
None.
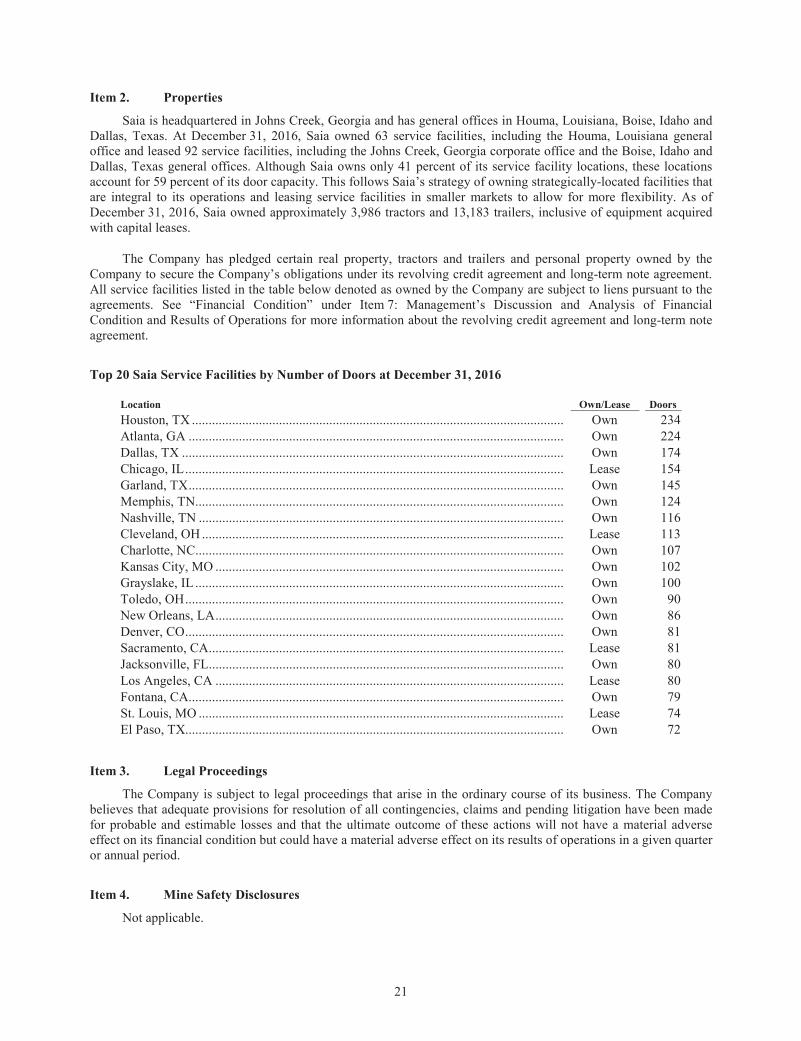
21
Item 2. Properties
Saia is headquartered in Johns Creek, Georgia and has general offices in Houma, Louisiana, Boise, Idaho and Dallas, Texas. At December 31, 2016, Saia owned 63 service facilities, including the Houma, Louisiana general office and leased 92 service facilities, including the Johns Creek, Georgia corporate office and the Boise, Idaho and Dallas, Texas general offices. Although Saia owns only 41 percent of its service facility locations, these locations account for 59 percent of its door capacity. This follows Saia’s strategy of owning strategically-located facilities that are integral to its operations and leasing service facilities in smaller markets to allow for more flexibility. As of December 31, 2016, Saia owned approximately 3,986 tractors and 13,183 trailers, inclusive of equipment acquired with capital leases.
The Company has pledged certain real property, tractors and trailers and personal property owned by the Company to secure the Company’s obligations under its revolving credit agreement and long-term note agreement. All service facilities listed in the table below denoted as owned by the Company are subject to liens pursuant to the agreements. See “Financial Condition” under Item 7: Management’s Discussion and Analysis of Financial Condition and Results of Operations for more information about the revolving credit agreement and long-term note agreement.
Top 20 Saia Service Facilities by Number of Doors at December 31, 2016
Location Own/Lease DoorsHouston, TX ............................................................................................................... Own 234Atlanta, GA ................................................................................................................ Own 224Dallas, TX .................................................................................................................. Own 174Chicago, IL ................................................................................................................. Lease 154Garland, TX ................................................................................................................ Own 145Memphis, TN.............................................................................................................. Own 124Nashville, TN ............................................................................................................. Own 116Cleveland, OH ............................................................................................................ Lease 113Charlotte, NC.............................................................................................................. Own 107Kansas City, MO ........................................................................................................ Own 102Grayslake, IL .............................................................................................................. Own 100Toledo, OH ................................................................................................................. Own 90New Orleans, LA ........................................................................................................ Own 86Denver, CO ................................................................................................................. Own 81Sacramento, CA .......................................................................................................... Lease 81Jacksonville, FL .......................................................................................................... Own 80Los Angeles, CA ........................................................................................................ Lease 80Fontana, CA................................................................................................................ Own 79St. Louis, MO ............................................................................................................. Lease 74El Paso, TX................................................................................................................. Own 72
Item 3. Legal Proceedings
The Company is subject to legal proceedings that arise in the ordinary course of its business. The Company believes that adequate provisions for resolution of all contingencies, claims and pending litigation have been made for probable and estimable losses and that the ultimate outcome of these actions will not have a material adverse effect on its financial condition but could have a material adverse effect on its results of operations in a given quarter or annual period.
Item 4. Mine Safety Disclosures
Not applicable.
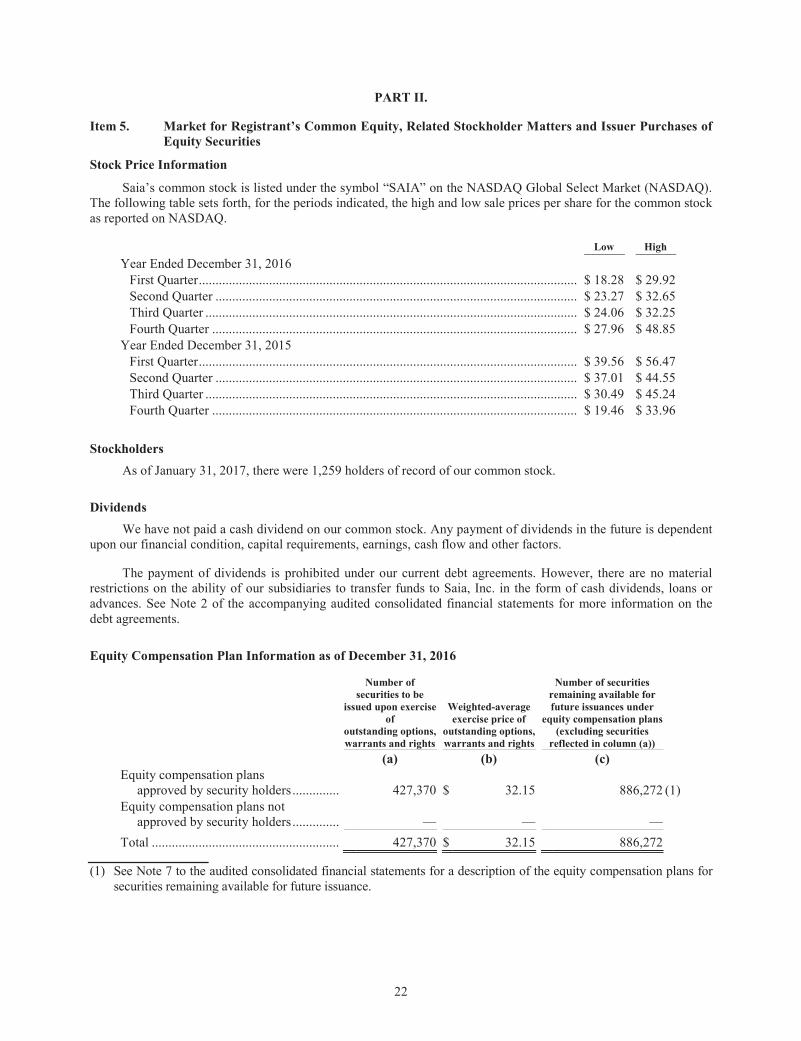
22
PART II.
Item 5. Market for Registrant’s Common Equity, Related Stockholder Matters and Issuer Purchases of Equity Securities
Stock Price Information
Saia’s common stock is listed under the symbol “SAIA” on the NASDAQ Global Select Market (NASDAQ). The following table sets forth, for the periods indicated, the high and low sale prices per share for the common stock as reported on NASDAQ.
Low High Year Ended December 31, 2016
First Quarter ................................................................................................................. $ 18.28 $ 29.92 Second Quarter ............................................................................................................ $ 23.27 $ 32.65 Third Quarter ............................................................................................................... $ 24.06 $ 32.25 Fourth Quarter ............................................................................................................. $ 27.96 $ 48.85
Year Ended December 31, 2015 First Quarter ................................................................................................................. $ 39.56 $ 56.47 Second Quarter ............................................................................................................ $ 37.01 $ 44.55 Third Quarter ............................................................................................................... $ 30.49 $ 45.24 Fourth Quarter ............................................................................................................. $ 19.46 $ 33.96
Stockholders As of January 31, 2017, there were 1,259 holders of record of our common stock.
Dividends We have not paid a cash dividend on our common stock. Any payment of dividends in the future is dependent
upon our financial condition, capital requirements, earnings, cash flow and other factors.
The payment of dividends is prohibited under our current debt agreements. However, there are no material restrictions on the ability of our subsidiaries to transfer funds to Saia, Inc. in the form of cash dividends, loans or advances. See Note 2 of the accompanying audited consolidated financial statements for more information on the debt agreements.
Equity Compensation Plan Information as of December 31, 2016
Number of securities to be
issued upon exercise of
outstanding options, warrants and rights
Weighted-average exercise price of
outstanding options, warrants and rights
Number of securities remaining available for future issuances under
equity compensation plans (excluding securities
reflected in column (a)) (a) (b) (c) Equity compensation plans approved by security holders .............. 427,370 $ 32.15 886,272 (1)Equity compensation plans not approved by security holders .............. — — —
Total ........................................................ 427,370 $ 32.15 886,272
(1) See Note 7 to the audited consolidated financial statements for a description of the equity compensation plans for securities remaining available for future issuance.
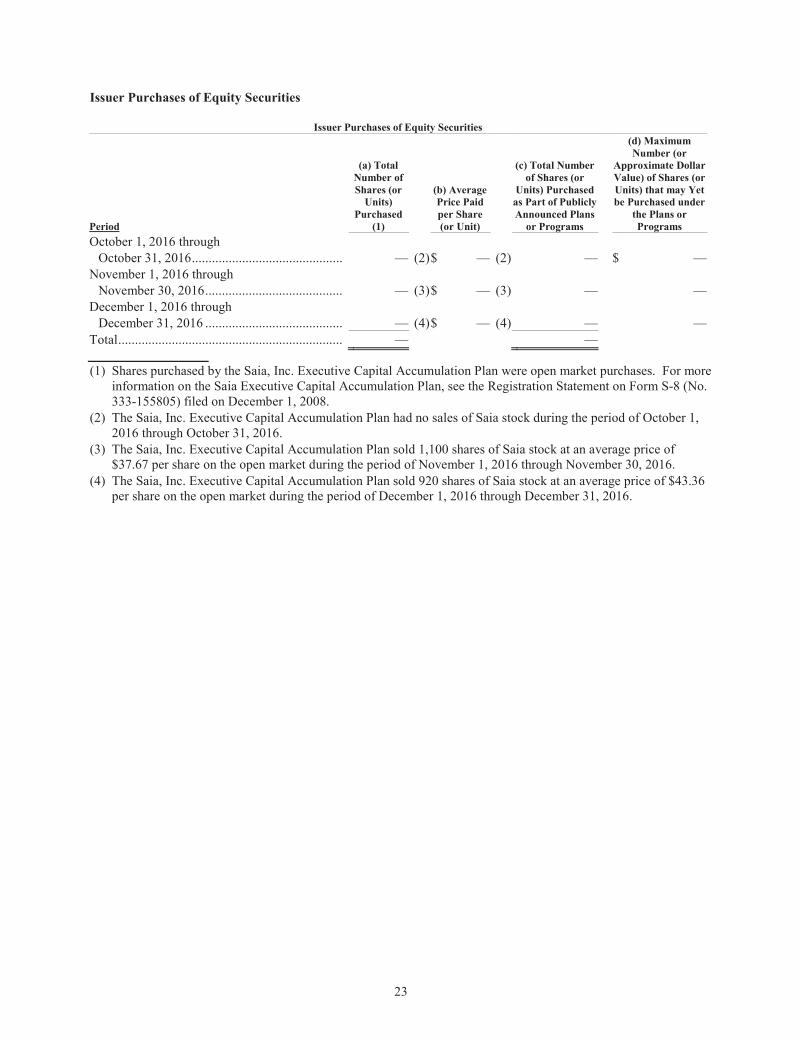
23
Issuer Purchases of Equity Securities
Issuer Purchases of Equity Securities
Period
(a) Total Number of Shares (or
Units) Purchased
(1)
(b) Average Price Paid per Share (or Unit)
(c) Total Number of Shares (or
Units) Purchased as Part of Publicly Announced Plans
or Programs
(d) Maximum Number (or
Approximate Dollar Value) of Shares (or Units) that may Yet be Purchased under
the Plans or Programs
October 1, 2016 through October 31, 2016 ............................................. — (2)$ — (2) — $ —
November 1, 2016 through November 30, 2016 ......................................... — (3)$ — (3) — —
December 1, 2016 through December 31, 2016 ......................................... — (4)$ — (4) — —
Total ................................................................... — —
(1) Shares purchased by the Saia, Inc. Executive Capital Accumulation Plan were open market purchases. For more information on the Saia Executive Capital Accumulation Plan, see the Registration Statement on Form S-8 (No. 333-155805) filed on December 1, 2008.
(2) The Saia, Inc. Executive Capital Accumulation Plan had no sales of Saia stock during the period of October 1, 2016 through October 31, 2016.
(3) The Saia, Inc. Executive Capital Accumulation Plan sold 1,100 shares of Saia stock at an average price of $37.67 per share on the open market during the period of November 1, 2016 through November 30, 2016.
(4) The Saia, Inc. Executive Capital Accumulation Plan sold 920 shares of Saia stock at an average price of $43.36 per share on the open market during the period of December 1, 2016 through December 31, 2016.
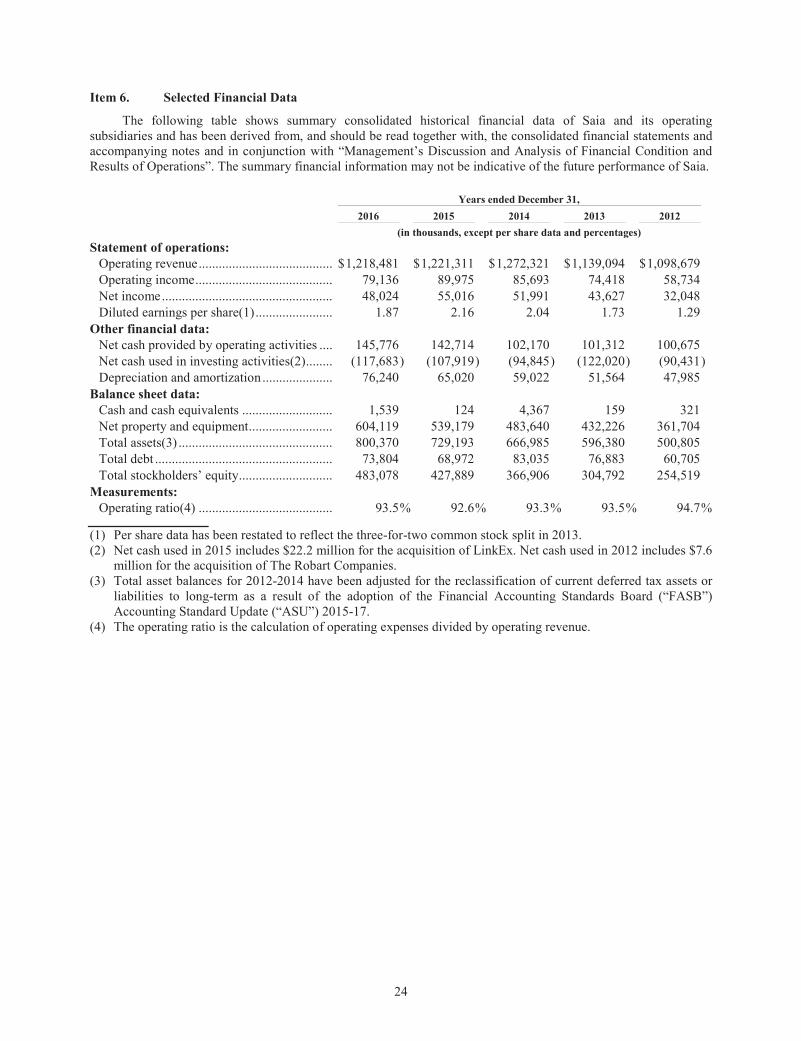
24
Item 6. Selected Financial Data
The following table shows summary consolidated historical financial data of Saia and its operating subsidiaries and has been derived from, and should be read together with, the consolidated financial statements and accompanying notes and in conjunction with “Management’s Discussion and Analysis of Financial Condition and Results of Operations”. The summary financial information may not be indicative of the future performance of Saia. Years ended December 31, 2016 2015 2014 2013 2012 (in thousands, except per share data and percentages) Statement of operations:
Operating revenue ......................................... $1,218,481 $1,221,311 $1,272,321 $ 1,139,094 $ 1,098,679 Operating income .......................................... 79,136 89,975 85,693 74,418 58,734 Net income .................................................... 48,024 55,016 51,991 43,627 32,048 Diluted earnings per share(1) ........................ 1.87 2.16 2.04 1.73 1.29
Other financial data: Net cash provided by operating activities ..... 145,776 142,714 102,170 101,312 100,675 Net cash used in investing activities(2) ......... (117,683) (107,919) (94,845) (122,020 ) (90,431) Depreciation and amortization ...................... 76,240 65,020 59,022 51,564 47,985
Balance sheet data: Cash and cash equivalents ............................ 1,539 124 4,367 159 321 Net property and equipment .......................... 604,119 539,179 483,640 432,226 361,704 Total assets(3) ............................................... 800,370 729,193 666,985 596,380 500,805 Total debt ...................................................... 73,804 68,972 83,035 76,883 60,705 Total stockholders’ equity ............................. 483,078 427,889 366,906 304,792 254,519
Measurements: Operating ratio(4) ......................................... 93.5% 92.6% 93.3% 93.5 % 94.7%
(1) Per share data has been restated to reflect the three-for-two common stock split in 2013. (2) Net cash used in 2015 includes $22.2 million for the acquisition of LinkEx. Net cash used in 2012 includes $7.6
million for the acquisition of The Robart Companies. (3) Total asset balances for 2012-2014 have been adjusted for the reclassification of current deferred tax assets or
liabilities to long-term as a result of the adoption of the Financial Accounting Standards Board (“FASB”) Accounting Standard Update (“ASU”) 2015-17.
(4) The operating ratio is the calculation of operating expenses divided by operating revenue.
25
Item 7. Management’s Discussion and Analysis of Financial Condition and Results of Operations
Forward-Looking Statements
The Securities and Exchange Commission (the SEC) encourages companies to disclose forward-looking information so that investors can better understand the future prospects of a company and make informed investment decisions. This Annual Report on Form 10-K, including “Management’s Discussion and Analysis of Financial Condition and Results of Operations,” contains these types of statements, which are forward-looking within the meaning of the Private Securities Litigation Reform Act of 1995. Words such as “anticipate,” “estimate,” “expect,” “project,” “intend,” “may,” “plan,” “predict,” “believe,” “should” and similar words or expressions are intended to identify forward-looking statements. Investors should not place undue reliance on forward-looking statements, and the Company undertakes no obligation to publicly update or revise any forward-looking statements. All forward-looking statements reflect the present expectation of future events of our management as of the date of this Annual Report on Form 10-K and are subject to a number of important factors, risks, uncertainties and assumptions that could cause actual results to differ materially from those described in any forward-looking statements. These factors, risks, assumptions and uncertainties include, but are not limited to, the following:
general economic conditions including downturns in the business cycle;
effectiveness of Company-specific performance improvement initiatives, including management of the cost structure to match shifts in customer volume levels;
the creditworthiness of our customers and their ability to pay for services;
failure to achieve acquisition synergies;
failure to operate and grow acquired businesses in a manner that supports the value allocated to these acquired businesses, including their goodwill;
economic declines in the geographic regions or industries in which our customers operate;
competitive initiatives and pricing pressures, including in connection with fuel surcharge;
loss of significant customers;
the Company’s need for capital and uncertainty of the credit markets;
the possibility of defaults under the Company’s debt agreements (including violation of financial covenants);
possible issuance of equity which would dilute stock ownership;
integration risks;
the effect of litigation including class action lawsuits;
cost and availability of qualified drivers, fuel, purchased transportation, real property, revenue equipment and other assets;
governmental regulations, including but not limited to Hours of Service, engine emissions, the Compliance, Safety, Accountability (CSA) initiative, compliance with legislation requiring companies to evaluate their internal control over financial reporting, Homeland Security, environmental regulations and the FDA;
changes in interpretation of accounting principles;
dependence on key employees;
inclement weather;
labor relations, including the adverse impact should a portion of the Company’s workforce become unionized;
terrorism risks;
self-insurance claims and other expense volatility;
26
cost and availability of insurance coverage;
increased costs of healthcare benefits and administration, including as a result of healthcare legislation;
social media risk;
failure to successfully execute the strategy to expand the Company’s service geography into the Northeastern United States;
cyber security risk; and
other financial, operational and legal risks and uncertainties detailed from time to time in the Company’s SEC filings.
These factors and risks are more completely described in Part I, Item 1A. “Risk Factors” of this Annual Report on Form 10-K.
As a result of these and other factors, no assurance can be given as to our future results and achievements. Accordingly, a forward-looking statement is neither a prediction nor a guarantee of future events or circumstances and those future events or circumstances may not occur. You should not place undue reliance on the forward-looking statements, which speak only as of the date of this Form 10-K. We are under no obligation, and we expressly disclaim any obligation, to update or alter any forward-looking statements, whether as a result of new information, future events or otherwise.
Executive Overview
The Company’s business is highly correlated to non-service sectors of the general economy. The Company’s strategy is to improve profitability by increasing yield while also increasing volumes to build density in existing geography and to expand our service geography into the Northeastern United States. The Company’s business is labor intensive, capital intensive and service sensitive. The Company looks for opportunities to improve cost effectiveness, safety and asset utilization (primarily tractors and trailers). Pricing initiatives have had a positive impact on yield and profitability. The Company continues to execute targeted sales and marketing programs along with initiatives to align costs with volumes and improve customer satisfaction. Technology continues to be an important investment that is facilitating operational efficiencies and improving Company image.
The Company’s operating revenue decreased by 0.2 percent in 2016 compared to 2015. The decrease resulted primarily from decreased tonnage, shipments and fuel surcharges, partially offset by yield management.
Consolidated operating income was $79.1 million for 2016 compared to consolidated operating income of $90.0 million in 2015. The decrease in 2016 operating income resulted primarily from shipment and tonnage decreases and increases in accident claims expense, depreciation and compensation expense partially offset by yield management and savings in expenses realized from Company initiatives.
The Company generated $145.8 million in cash provided by operating activities in 2016 versus $142.7 million in 2015. The Company used $117.7 million of net cash in investing activities during 2016 compared to $107.9 million during 2015.
The Company’s Fifth Amended and Restated Credit Agreement provides a $250 million revolving credit facility and expires in March 2020. The facility also has an accordion feature that allows for an additional $75 million in availability, subject to lender approval. The facility provides for a LIBOR rate margin range from 112.5 basis points to 225 basis points, base rate margins from minus 12.5 basis points to plus 50 basis points, an unused portion fee from 20 basis points to 30 basis points and letter of credit fees from 112.5 basis points to 225 basis points, in each case based on the Company’s leverage ratio.
The Company used $26.7 million of net cash in financing activities during 2016 compared to $39.0 million during 2015. The Company had a $15.9 million decrease in net cash repayments under its revolving credit agreement during 2016 and made scheduled principal payments of Senior Notes and capital lease obligations of $7.1
27
million and $8.2 million, respectively, during 2016. Outstanding letters of credit were $41.2 million and the cash and cash equivalents balance was $1.5 million as of December 31, 2016. The Company had $210.6 million in remaining availability under its revolving credit agreement, $7.1 million outstanding in Senior Notes and $66.7 million in obligations under capital leases at December 31, 2016. The Company was in compliance with the debt covenants under its debt agreements at December 31, 2016. See “Financial Condition” for a more complete discussion of these agreements.
General
The following Management’s Discussion and Analysis describes the principal factors affecting the results of operations, liquidity and capital resources, as well as the critical accounting policies of Saia, Inc. and its wholly-owned subsidiaries (together, the Company or Saia). This discussion should be read in conjunction with the accompanying audited consolidated financial statements which include additional information about our significant accounting policies, practices and the transactions that underlie our financial results.
Saia is a transportation company headquartered in Johns Creek, Georgia that provides regional and interregional less-than-truckload (LTL) services through a single integrated organization. While more than 99% of its revenue historically has been derived from transporting LTL shipments across 34 states, the Company also offers customers a wide range of other value-added services, including non-asset truckload, expedited and logistics services across the United States. The Chief Operating Decision Maker is the Chief Executive Officer who manages the business, regularly reviews financial information and allocates resources. The Company has one operating segment.
Our business is highly correlated to non-service sectors of the general economy. It also is impacted by a number of other factors as discussed under “Forward Looking Statements” and Part I, Item 1A. “Risk Factors.” The key factors that affect our operating results are the volumes of shipments transported through our network, as measured by our average daily shipments and tonnage; the prices we obtain for our services, as measured by revenue per hundredweight (a measure of yield) and revenue per shipment; our ability to manage our cost structure for capital expenditures and operating expenses such as salaries, wages and benefits; purchased transportation; claims and insurance expense; fuel and maintenance; and our ability to match operating costs to shifting volume levels.
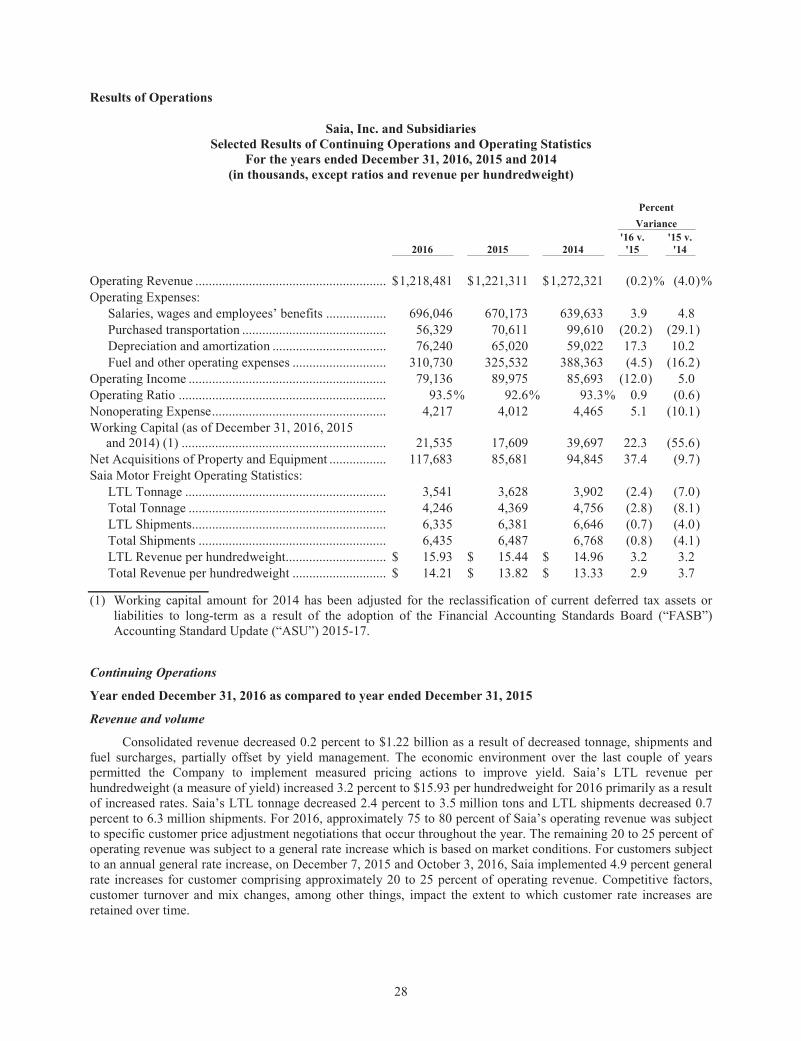
28
Results of Operations
Saia, Inc. and Subsidiaries Selected Results of Continuing Operations and Operating Statistics
For the years ended December 31, 2016, 2015 and 2014 (in thousands, except ratios and revenue per hundredweight)
Percent
Variance
2016 2015 2014 '16 v.
'15 '15 v.
'14 Operating Revenue ......................................................... $1,218,481 $1,221,311 $1,272,321 (0.2 )% (4.0)%Operating Expenses:
Salaries, wages and employees’ benefits .................. 696,046 670,173 639,633 3.9 4.8 Purchased transportation ........................................... 56,329 70,611 99,610 (20.2 ) (29.1) Depreciation and amortization .................................. 76,240 65,020 59,022 17.3 10.2 Fuel and other operating expenses ............................ 310,730 325,532 388,363 (4.5 ) (16.2)
Operating Income ........................................................... 79,136 89,975 85,693 (12.0 ) 5.0 Operating Ratio .............................................................. 93.5% 92.6% 93.3 % 0.9 (0.6) Nonoperating Expense .................................................... 4,217 4,012 4,465 5.1 (10.1) Working Capital (as of December 31, 2016, 2015
and 2014) (1) ............................................................. 21,535 17,609 39,697 22.3 (55.6) Net Acquisitions of Property and Equipment ................. 117,683 85,681 94,845 37.4 (9.7) Saia Motor Freight Operating Statistics:
LTL Tonnage ............................................................ 3,541 3,628 3,902 (2.4 ) (7.0) Total Tonnage ........................................................... 4,246 4,369 4,756 (2.8 ) (8.1) LTL Shipments.......................................................... 6,335 6,381 6,646 (0.7 ) (4.0) Total Shipments ........................................................ 6,435 6,487 6,768 (0.8 ) (4.1) LTL Revenue per hundredweight.............................. $ 15.93 $ 15.44 $ 14.96 3.2 3.2 Total Revenue per hundredweight ............................ $ 14.21 $ 13.82 $ 13.33 2.9 3.7
(1) Working capital amount for 2014 has been adjusted for the reclassification of current deferred tax assets or liabilities to long-term as a result of the adoption of the Financial Accounting Standards Board (“FASB”) Accounting Standard Update (“ASU”) 2015-17.
Continuing Operations
Year ended December 31, 2016 as compared to year ended December 31, 2015
Revenue and volume
Consolidated revenue decreased 0.2 percent to $1.22 billion as a result of decreased tonnage, shipments and fuel surcharges, partially offset by yield management. The economic environment over the last couple of years permitted the Company to implement measured pricing actions to improve yield. Saia’s LTL revenue per hundredweight (a measure of yield) increased 3.2 percent to $15.93 per hundredweight for 2016 primarily as a result of increased rates. Saia’s LTL tonnage decreased 2.4 percent to 3.5 million tons and LTL shipments decreased 0.7 percent to 6.3 million shipments. For 2016, approximately 75 to 80 percent of Saia’s operating revenue was subject to specific customer price adjustment negotiations that occur throughout the year. The remaining 20 to 25 percent of operating revenue was subject to a general rate increase which is based on market conditions. For customers subject to an annual general rate increase, on December 7, 2015 and October 3, 2016, Saia implemented 4.9 percent general rate increases for customer comprising approximately 20 to 25 percent of operating revenue. Competitive factors, customer turnover and mix changes, among other things, impact the extent to which customer rate increases are retained over time.
29
Operating revenue includes fuel surcharge revenue from the Company’s fuel surcharge program. That program is designed to reduce the Company’s exposure to fluctuations in fuel prices by adjusting total freight charges to account for changes in the price of fuel. The Company’s fuel surcharge is generally based on the average national price for diesel fuel and is reset weekly. Fuel surcharges have remained in effect for several years, are widely accepted in the industry and are a significant component of revenue and pricing. Fuel surcharges are an integral part of customer contract negotiations but represent only one portion of overall customer price negotiations as customers may negotiate increase in base rates instead of increases in fuel surcharges or vice versa. Saia revised its fuel surcharge program effective January 18, 2016 to better align with its competitors. Fuel surcharge revenue decreased to 9.7% of operating revenue for the year ended December 31, 2016 compared to 11.7% for the year ended December 31, 2015 primarily as a result of reductions in the cost of fuel.
Operating expenses and margin
Consolidated operating income was $79.1 million in 2016 compared to $90.0 million in 2015. In summary, the operations were unfavorably impacted in 2016 by shipment and tonnage decreases and claims, depreciation and compensation expense increases, which were partially offset by higher yield and continued cost optimization initiatives throughout our network. The 2016 operating ratio (operating expenses divided by operating revenue) was 93.5 percent as compared to 92.6 percent for 2015.
Salaries, wages and benefit expense increased $25.9 million largely in 2016 compared to 2015 due to higher wages associated with increased headcount in 2016 and wage increases in July 2015 and 2016, increased internal driver utilization and higher healthcare benefit costs. Fuel, operating expenses and supplies decreased $31.0 million during 2016 compared to 2015 largely due to lower fuel costs, improved fuel efficiency, lower maintenance costs from a newer fleet and increased internal maintenance asset utilization, and reduced costs of other operating expenses and supplies. Claims and insurance expense in 2016 was $12.8 million higher than 2015 largely due to increased accident frequency and severity in 2016, negative development of older claims and higher insurance premiums, partially offset by decreased cargo claims. The Company can experience volatility in accident expense as a result of its self-insurance structure and $2.0 million retention limits per occurrence. Depreciation expense increased $11.2 million in 2016 compared to 2015 primarily due to revenue equipment, real estate and technology investments in late 2015 and 2016. Purchased transportation expense decreased $14.3 million in 2016 compared to 2015 primarily due to increased utilization of internal assets, a decline in fuel costs charged by carriers and favorable carrier rates and mix of transportation modes utilized.
Other
Substantially all non-operating expenses represent interest expense. Interest expense in 2016 was $0.3 million greater than 2015 due to increased average borrowings resulting from the $9.8 million increase in investing activities in 2016. The effective tax rate was 35.9 percent and 36.0 percent for the years ended December 31, 2016 and 2015, respectively. The 2016 and 2015 effective tax rates included approximately $1.0 million in alternative fuel tax credits. See Note 9 to the Company’s audited consolidated financial statements for an analysis of the income tax provision and the effective tax rate.
Working capital/capital expenditures
Working capital at December 31, 2016 was $21.5 million which increased from working capital at December 31, 2015 of $17.6 million. This increase is primarily due to an increase in accounts receivable and decrease in accounts payable, partially offset by a decrease in income tax receivable and increases in claims and insurance accruals and current portion of long-term debt from capital leases used to finance certain revenue equipment. Cash flows from operating activities were $145.8 million for 2016 versus $142.7 million for 2015. For 2016, cash used in investing activities was $117.7 million versus $107.9 million in 2015 primarily due to higher capital expenditures for revenue equipment and real estate during 2016. Cash used in financing activities was $26.7 million in 2016 versus $39.0 million for 2015 primarily driven by a decrease in the net repayment of our revolving credit facility by $15.9 million from 2016 compared to 2015.
30
Year ended December 31, 2015 as compared to year ended December 31, 2014
Revenue and volume
Consolidated revenue decreased 4.0 percent to $1.22 billion as a result of decreased tonnage, shipments and fuel surcharges, partially offset by yield management. The economic environment permitted the Company to implement measured pricing actions to improve yield. Saia’s LTL revenue per hundredweight (a measure of yield) increased 3.2 percent to $15.44 per hundredweight for 2015 primarily as a result of increased rates. Saia’s LTL tonnage decreased 7.0 percent to 3.6 million tons and LTL shipments decreased 4.0 percent to 6.4 million shipments. For 2014 and 2015, approximately 75 to 80 percent of Saia’s operating revenue was subject to specific customer price adjustment negotiations that occur throughout the year. The remaining 20 to 25 percent of operating revenue was subject to a general rate increase which is based on market conditions. For customers subject to general rate increases, on January 5, 2015 and December 7, 2015, Saia implemented 4.9 percent general rate increases. Competitive factors, customer turnover and mix changes, among other things, impact the extent to which customer rate increases are retained over time.
Operating revenue includes fuel surcharge revenue from the Company’s fuel surcharge program. That program is designed to reduce the Company’s exposure to fluctuations in fuel prices by adjusting total freight charges to account for changes in the price of fuel. The Company’s fuel surcharge is generally based on the average national price for diesel fuel and is reset weekly. Fuel surcharges have remained in effect for several years, are widely accepted in the industry and are a significant component of revenue and pricing. Fuel surcharges are an integral part of customer contract negotiations, but represent only one portion of overall customer price negotiations as customers may negotiate increases in base rates instead of increases in fuel surcharges or vice versa. Saia revised its fuel surcharge program effective February 2, 2015 to better align with its competitors. Fuel surcharge revenue decreased to 11.7% of operating revenue for the year ended December 31, 2015 compared to 16.6% for the year ended December 31, 2014 primarily as a result of reductions in the cost of fuel.
Operating expenses and margin
Consolidated operating income was $90.0 million in 2015 compared to $85.7 million in 2014. In summary, the operations were favorably impacted in 2015 by yield management and continued cost optimization initiatives throughout our network, which more than offset the shipment and tonnage decreases and compensation expense increase from 2014 to 2015. The 2015 operating ratio (operating expenses divided by operating revenue) was 92.6 percent as compared to 93.3 percent for 2014.
Salaries, wages and benefit expense increased $30.5 million from 2014 to 2015 largely due to wage increases in July 2015, higher wages associated with increased headcount in 2015 and higher healthcare benefit costs. Claims and insurance expense in 2015 was $10.7 million lower than 2014 largely due to decreased accident frequency and severity in 2015 along with decreased cargo claims. The Company can experience volatility in accident expense as a result of its self-insurance structure and $2.0 million retention limits per occurrence. Depreciation expense increased $6.0 million in 2015 compared to 2014 primarily due to revenue equipment and technology investments in late 2014 and 2015. Purchased transportation expense decreased $29.0 million in 2015 compared to 2014 primarily due to a decline in fuel costs charged by carriers, favorable carrier rates and mix of transportation modes utilized, and increased utilization of the internal assets.
Other
Substantially all non-operating expenses represent interest expense. Interest expense in 2015 was $0.5 million less than 2014 due to lower borrowings and interest rates in 2015. The effective tax rate was 36.0 percent for the years ended December 31, 2015 and 2014. The 2015 and 2014 effective tax rates included approximately $1.0 million in alternative fuel tax credits. The notes to the consolidated financial statements provide an analysis of the income tax provision and the effective tax rate.
31
Working capital/capital expenditures
Working capital at December 31, 2015 was $17.6 million which decreased from working capital at December 31, 2014 of $39.7 million primarily due to decreases in accounts receivable and income tax receivable and an increase in accounts payable. Cash flows from operating activities were $142.7 million for 2015 versus $102.2 million for 2014 driven by increased profitability and working capital changes. For 2015, cash used in investing activities was $107.9 million versus $94.8 million in 2014 primarily due to $22.2 million in cash used in business acquisitions during 2015. Cash used in financing activities was $39.0 million in 2015 versus $3.1 million for 2014 due to the net repayment of $30.5 million of our revolving credit facility during 2015.
Outlook
Our business remains highly correlated to non-service sectors of the general economy and competitive pricing pressures, as well as the success of Company-specific improvement initiatives. There remains uncertainty as to the strength of economic conditions. We are continuing initiatives to increase yield, reduce costs and improve productivity. We focus on providing top quality service and improving safety performance. Planned revenue initiatives include, but are not limited to, building density in our current geography, targeted marketing initiatives to grow revenue in more profitable segments, expanding our service geography into the Northeastern United States, as well as pricing and yield management. On October 3, 2016, Saia implemented a 4.9 percent general rate increase for customers comprising approximately 20 to 25 percent of Saia’s operating revenue. The extent of success of these revenue initiatives is impacted by what proves to be the underlying economic trends, competitor initiatives and other factors discussed under “Forward-Looking Statements” and Part I, Item 1A. “Risk Factors.”
Effective July 1, 2016, the Company implemented a salary and wage increase for all of its employees. The cost of the compensation increase is expected to be approximately $16 million annually, and the Company anticipates the impact will be partially offset by further continued productivity and efficiency gains. The Company also anticipates market competitive wage increases in 2017.
If the Company builds market share, there are numerous operating leverage cost benefits. Conversely, should the economy soften from present levels, the Company plans to match resources and capacity to shifting volume levels to lessen unfavorable operating leverage. The success of cost improvement initiatives is also impacted by the cost and availability of drivers and purchased transportation, fuel, insurance claims, regulatory changes, successful expansion of our service geography into the Northeastern United States and other factors discussed under “Forward-Looking Statements” and Part I, Item 1A. “Risk Factors.”
See “Forward-Looking Statements” and Part I, Item 1A. “Risk Factors” for a more complete discussion of potential risks and uncertainties that could materially affect our future performance.
New Accounting Pronouncements Not Yet Adopted
In May 2014, the Financial Accounting Standards Board (“FASB”) issued Accounting Standards Update (“ASU”) No. 2014-09, Revenue from Contracts with Customers, which requires an entity to recognize the amount of revenue to which it expects to be entitled for the transfer of promised goods or services. The ASU will replace most existing revenue recognition guidance in U.S. generally accepted accounting principles when it becomes effective. In July 2015, the FASB updated ASU No. 2014-09 to defer the effective date by one year. The new standard is effective for the Company on January 1, 2018, at which point the Company plans to adopt this standard. The standard permits the use of either the retrospective or cumulative effect transition method. The Company is evaluating the effect that ASU No. 2014-09 will have on its consolidated financial statements and related disclosures. The Company has not yet selected a transition method nor has it completed its evaluation of the effect of the standard on its ongoing financial reporting. While the Company has adopted a timeline for implementation and identified its revenue streams and contracts subject to the standard, the Company has not yet completed its evaluation of these. Based on the Company’s current analysis, it expects the revenue recognition of its non-asset truckload and logistics business to change to upon delivery of the shipment or completion of the services. However, the Company does not anticipate a significant change to other areas of its business.
32
In February 2016, the FASB issued ASU 2016-02, Leases (Topic 842), a leasing standard for both lessees and lessors. Under its core principle, a lessee will recognize lease assets and liabilities on the balance sheet for all arrangements with terms longer than 12 months. Lessor accounting remains largely consistent with existing U.S. generally accepted accounting principles. The new standard is effective for the Company on January 1, 2019. Early adoption is permitted. The standard requires the use of a modified retrospective transition method. The Company is evaluating the effect that ASU No. 2016-02 will have on its consolidated financial statements and related disclosures. While the Company has not completed its evaluation of the effect of the standard on its ongoing financial reporting, it believes the most significant changes relate to the recognition of new lease assets and liabilities on its balance sheet.
In March 2016, the FASB issued ASU 2016-09, Improvements to Employee Share-Based Payment Accounting. The new standard is effective for the Company on January 1, 2017, at which point the Company plans to adopt this standard, and it will be implemented prospectively. As a result of adoption, excess tax benefits and certain tax deficiencies will be recorded as income tax expense or benefit, as opposed to additional paid-in capital, and the windfall tax benefit will be removed from the Company’s diluted shares calculation. The Company will classify all excess tax benefits related to share-based payments as operating activity instead of financing activity on the Consolidated Statement of Cash Flows. The Company plans to continue to use an estimated forfeiture rate for recording stock compensation expense.
Financial Condition
The Company’s liquidity needs arise primarily from capital investment in new equipment, land and structures, information technology and letters of credit required under insurance programs, as well as funding working capital requirements.
The Company is party to a revolving credit agreement (the Restated Credit Agreement) with a group of banks to fund capital investments, letters of credit and working capital needs. The Company is also a party to a long-term note agreement (the Restated Master Shelf Agreement). The Company has pledged certain land and structures, tractors and trailers, accounts receivable and other assets to secure indebtedness under both agreements.
Restated Credit Agreement
The Restated Credit Agreement is a revolving credit facility for up to $250 million expiring in March 2020. The Restated Credit Agreement also has an accordion feature that allows for an additional $75 million in availability, subject to lender approval. The Restated Credit Agreement provides for a LIBOR rate margin range from 112.5 basis points to 225 basis points, base rate margins from minus 12.5 basis points to plus 50 basis points, an unused portion fee from 20 basis points to 30 basis points and a letter of credit fee range from 112.5 basis points to 225 basis points, in each case based on the Company’s leverage ratio.
Under the Restated Credit Agreement, the Company must maintain certain financial covenants including a minimum fixed charge coverage ratio and a maximum leverage ratio, among others. The Restated Credit Agreement also provides for a pledge by the Company of certain land and structures, certain tractors, trailers and other personal property and accounts receivable, as defined in the Restated Credit Agreement.
At December 31, 2016, the Company had no outstanding borrowings and outstanding letters of credit of $39.4 million under the Restated Credit Agreement. At December 31, 2015, the Company had borrowings of $14.5 million and outstanding letters of credit of $44.8 million under the Restated Credit Agreement. The available portion of the Restated Credit Agreement may be used for general corporate purposes, including future capital expenditures, working capital and letter of credit requirements as needed.
Restated Master Shelf Agreement
In 2002, the Company issued $100 million in Senior Notes under a $125 million (amended to $150 million in April 2005) Master Shelf Agreement with Prudential Investment Management, Inc. and certain of its affiliates. The Company issued another $25 million in Senior Notes on November 30, 2007 and $25 million in Senior Notes on January 31, 2008 under the same Master Shelf Agreement.
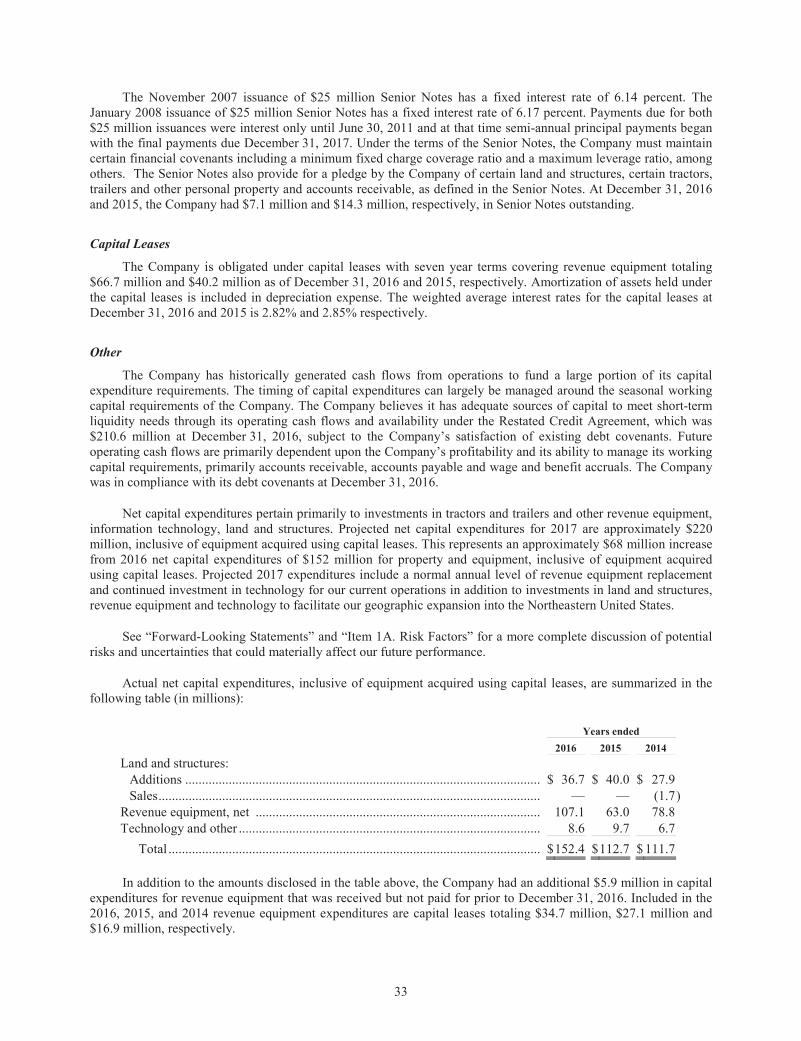
33
The November 2007 issuance of $25 million Senior Notes has a fixed interest rate of 6.14 percent. The January 2008 issuance of $25 million Senior Notes has a fixed interest rate of 6.17 percent. Payments due for both $25 million issuances were interest only until June 30, 2011 and at that time semi-annual principal payments began with the final payments due December 31, 2017. Under the terms of the Senior Notes, the Company must maintain certain financial covenants including a minimum fixed charge coverage ratio and a maximum leverage ratio, among others. The Senior Notes also provide for a pledge by the Company of certain land and structures, certain tractors, trailers and other personal property and accounts receivable, as defined in the Senior Notes. At December 31, 2016 and 2015, the Company had $7.1 million and $14.3 million, respectively, in Senior Notes outstanding.
Capital Leases
The Company is obligated under capital leases with seven year terms covering revenue equipment totaling $66.7 million and $40.2 million as of December 31, 2016 and 2015, respectively. Amortization of assets held under the capital leases is included in depreciation expense. The weighted average interest rates for the capital leases at December 31, 2016 and 2015 is 2.82% and 2.85% respectively.
Other
The Company has historically generated cash flows from operations to fund a large portion of its capital expenditure requirements. The timing of capital expenditures can largely be managed around the seasonal working capital requirements of the Company. The Company believes it has adequate sources of capital to meet short-term liquidity needs through its operating cash flows and availability under the Restated Credit Agreement, which was $210.6 million at December 31, 2016, subject to the Company’s satisfaction of existing debt covenants. Future operating cash flows are primarily dependent upon the Company’s profitability and its ability to manage its working capital requirements, primarily accounts receivable, accounts payable and wage and benefit accruals. The Company was in compliance with its debt covenants at December 31, 2016.
Net capital expenditures pertain primarily to investments in tractors and trailers and other revenue equipment, information technology, land and structures. Projected net capital expenditures for 2017 are approximately $220 million, inclusive of equipment acquired using capital leases. This represents an approximately $68 million increase from 2016 net capital expenditures of $152 million for property and equipment, inclusive of equipment acquired using capital leases. Projected 2017 expenditures include a normal annual level of revenue equipment replacement and continued investment in technology for our current operations in addition to investments in land and structures, revenue equipment and technology to facilitate our geographic expansion into the Northeastern United States.
See “Forward-Looking Statements” and “Item 1A. Risk Factors” for a more complete discussion of potential risks and uncertainties that could materially affect our future performance.
Actual net capital expenditures, inclusive of equipment acquired using capital leases, are summarized in the following table (in millions):
Years ended 2016 2015 2014 Land and structures:
Additions .......................................................................................................... $ 36.7 $ 40.0 $ 27.9 Sales .................................................................................................................. — — (1.7)
Revenue equipment, net ..................................................................................... 107.1 63.0 78.8 Technology and other .......................................................................................... 8.6 9.7 6.7
Total ............................................................................................................... $152.4 $ 112.7 $ 111.7
In addition to the amounts disclosed in the table above, the Company had an additional $5.9 million in capital
expenditures for revenue equipment that was received but not paid for prior to December 31, 2016. Included in the 2016, 2015, and 2014 revenue equipment expenditures are capital leases totaling $34.7 million, $27.1 million and $16.9 million, respectively.
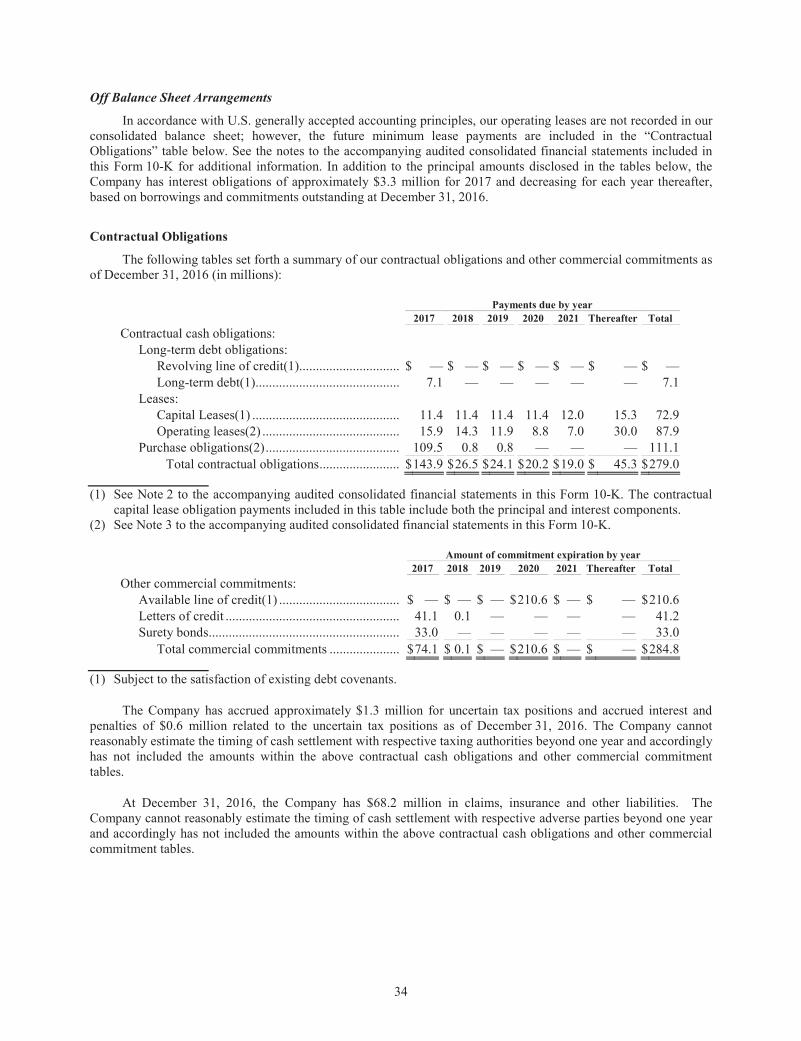
34
Off Balance Sheet Arrangements
In accordance with U.S. generally accepted accounting principles, our operating leases are not recorded in our consolidated balance sheet; however, the future minimum lease payments are included in the “Contractual Obligations” table below. See the notes to the accompanying audited consolidated financial statements included in this Form 10-K for additional information. In addition to the principal amounts disclosed in the tables below, the Company has interest obligations of approximately $3.3 million for 2017 and decreasing for each year thereafter, based on borrowings and commitments outstanding at December 31, 2016.
Contractual Obligations
The following tables set forth a summary of our contractual obligations and other commercial commitments as of December 31, 2016 (in millions):
Payments due by year 2017 2018 2019 2020 2021 Thereafter Total Contractual cash obligations:
Long-term debt obligations: Revolving line of credit(1).............................. $ — $ — $ — $ — $ — $ — $ —Long-term debt(1)........................................... 7.1 — — — — — 7.1
Leases: Capital Leases(1) ............................................ 11.4 11.4 11.4 11.4 12.0 15.3 72.9Operating leases(2) ......................................... 15.9 14.3 11.9 8.8 7.0 30.0 87.9
Purchase obligations(2) ........................................ 109.5 0.8 0.8 — — — 111.1Total contractual obligations ........................ $143.9 $26.5 $24.1 $20.2 $19.0 $ 45.3 $279.0
(1) See Note 2 to the accompanying audited consolidated financial statements in this Form 10-K. The contractual capital lease obligation payments included in this table include both the principal and interest components.
(2) See Note 3 to the accompanying audited consolidated financial statements in this Form 10-K.
Amount of commitment expiration by year 2017 2018 2019 2020 2021 Thereafter Total Other commercial commitments:
Available line of credit(1) .................................... $ — $ — $ — $210.6 $ — $ — $210.6Letters of credit .................................................... 41.1 0.1 — — — — 41.2Surety bonds......................................................... 33.0 — — — — — 33.0
Total commercial commitments ..................... $74.1 $ 0.1 $ — $210.6 $ — $ — $284.8
(1) Subject to the satisfaction of existing debt covenants.
The Company has accrued approximately $1.3 million for uncertain tax positions and accrued interest and penalties of $0.6 million related to the uncertain tax positions as of December 31, 2016. The Company cannot reasonably estimate the timing of cash settlement with respective taxing authorities beyond one year and accordingly has not included the amounts within the above contractual cash obligations and other commercial commitment tables.
At December 31, 2016, the Company has $68.2 million in claims, insurance and other liabilities. The Company cannot reasonably estimate the timing of cash settlement with respective adverse parties beyond one year and accordingly has not included the amounts within the above contractual cash obligations and other commercial commitment tables.
35
Critical Accounting Policies and Estimates
The Company makes estimates and assumptions in preparing the consolidated financial statements that affect reported amounts and disclosures therein. In the opinion of management, the accounting policies that generally have the most significant impact on the financial position and results of operations of the Company include:
Claims and Insurance Accruals. The Company has self-insured retention limits generally ranging from $250,000 to $2 million per claim for medical, workers’ compensation, auto liability, casualty and cargo claims. The liabilities associated with the risk retained by the Company are estimated in part based on historical experience, third-party actuarial analysis with respect to workers’ compensation claims, demographics, nature and severity, and other assumptions. The liabilities for self-funded retention are included in claims and insurance reserves based on claims incurred with liabilities for unsettled claims and claims incurred but not yet reported being actuarially determined with respect to workers’ compensation claims and with respect to all other liabilities, estimated based on management’s evaluation of the nature and severity of individual claims and historical experience. However, these estimated accruals could be significantly affected if the actual costs of the Company differ from these assumptions. A significant number of these claims typically take several years to develop and even longer to ultimately settle. These estimates tend to be reasonably accurate over time; however, assumptions regarding severity of claims, medical cost inflation, as well as specific case facts can create short-term volatility in estimates.
Revenue Recognition and Related Allowances. Revenue is recognized on a percentage-of-completion basis for shipments in transit while expenses are recognized as incurred. In addition, estimates included in the recognition of revenue and accounts receivable include estimates of shipments in transit and estimates of future adjustments to revenue and accounts receivable for billing adjustments and collectability.
Revenue is recognized in a systematic process whereby estimates of shipments in transit are based upon actual shipments picked up, scheduled day of delivery and current trend in average rates charged to customers. Since the cycle for pickup and delivery of shipments is generally 1-3 days, typically less than 5 percent of a total month’s revenue is in transit at the end of any month. Estimates for credit losses and billing adjustments are based upon historical experience of credit losses, adjustments processed and trends of collections. Billing adjustments are primarily made for discounts and billing corrections. These estimates are continuously evaluated and updated; however, changes in economic conditions, pricing arrangements and other factors can significantly impact these estimates.
Depreciation and Capitalization of Assets. Under the Company’s accounting policy for property and equipment, management establishes appropriate depreciable lives and salvage values for the Company’s revenue equipment (tractors and trailers) based on their estimated useful lives and estimated residual values to be received when the equipment is sold or traded in. These estimates are routinely evaluated and updated when circumstances warrant. However, actual depreciation and residual values could differ from these assumptions based on market conditions and other factors.
Long-lived assets, such as property, plant and equipment, and purchased intangible assets subject to amortization, are reviewed for impairment whenever events or changes in circumstances indicate that the carrying amount of an asset may not be recoverable. If circumstances require a long-lived asset or asset group to be tested for possible impairment, the Company compares undiscounted cash flows expected to be generated by that asset or asset group to its carrying value. If the carrying value of the long-lived asset or asset group is not recoverable on an undiscounted cash flow basis, impairment is recognized to the extent that the carrying value exceeds its fair value. Fair value is determined through various valuation techniques including discounted cash flow models, quoted market values and third-party independent appraisals, as deemed necessary.
Accounting for Income Taxes. Significant management judgment is required to determine (i) the provision for income taxes, (ii) whether deferred income taxes will be realized in full or in part and (iii) the liability for unrecognized tax benefits related to uncertain tax positions. Income tax expense is equal to the current year’s liability for income taxes and a provision for deferred income taxes. Deferred tax assets and liabilities are recorded for the future tax effects attributable to temporary differences
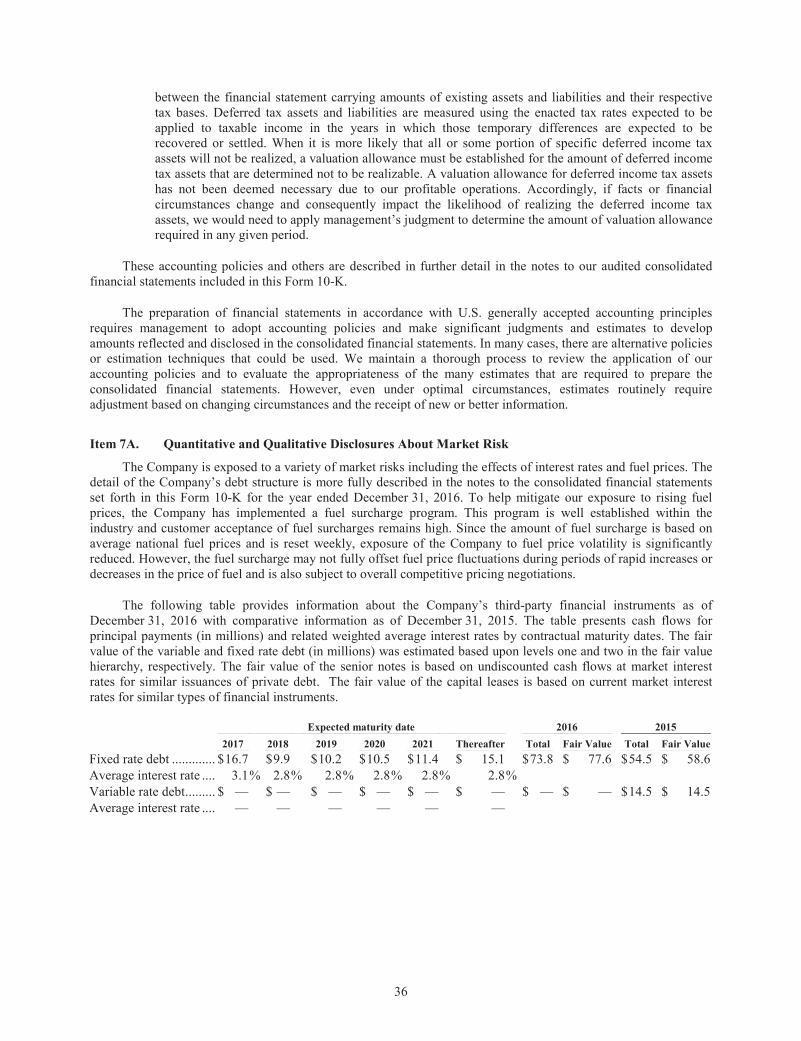
36
between the financial statement carrying amounts of existing assets and liabilities and their respective tax bases. Deferred tax assets and liabilities are measured using the enacted tax rates expected to be applied to taxable income in the years in which those temporary differences are expected to be recovered or settled. When it is more likely that all or some portion of specific deferred income tax assets will not be realized, a valuation allowance must be established for the amount of deferred income tax assets that are determined not to be realizable. A valuation allowance for deferred income tax assets has not been deemed necessary due to our profitable operations. Accordingly, if facts or financial circumstances change and consequently impact the likelihood of realizing the deferred income tax assets, we would need to apply management’s judgment to determine the amount of valuation allowance required in any given period.
These accounting policies and others are described in further detail in the notes to our audited consolidated financial statements included in this Form 10-K.
The preparation of financial statements in accordance with U.S. generally accepted accounting principles requires management to adopt accounting policies and make significant judgments and estimates to develop amounts reflected and disclosed in the consolidated financial statements. In many cases, there are alternative policies or estimation techniques that could be used. We maintain a thorough process to review the application of our accounting policies and to evaluate the appropriateness of the many estimates that are required to prepare the consolidated financial statements. However, even under optimal circumstances, estimates routinely require adjustment based on changing circumstances and the receipt of new or better information.
Item 7A. Quantitative and Qualitative Disclosures About Market Risk
The Company is exposed to a variety of market risks including the effects of interest rates and fuel prices. The detail of the Company’s debt structure is more fully described in the notes to the consolidated financial statements set forth in this Form 10-K for the year ended December 31, 2016. To help mitigate our exposure to rising fuel prices, the Company has implemented a fuel surcharge program. This program is well established within the industry and customer acceptance of fuel surcharges remains high. Since the amount of fuel surcharge is based on average national fuel prices and is reset weekly, exposure of the Company to fuel price volatility is significantly reduced. However, the fuel surcharge may not fully offset fuel price fluctuations during periods of rapid increases or decreases in the price of fuel and is also subject to overall competitive pricing negotiations.
The following table provides information about the Company’s third-party financial instruments as of December 31, 2016 with comparative information as of December 31, 2015. The table presents cash flows for principal payments (in millions) and related weighted average interest rates by contractual maturity dates. The fair value of the variable and fixed rate debt (in millions) was estimated based upon levels one and two in the fair value hierarchy, respectively. The fair value of the senior notes is based on undiscounted cash flows at market interest rates for similar issuances of private debt. The fair value of the capital leases is based on current market interest rates for similar types of financial instruments.
Expected maturity date 2016 2015 2017 2018 2019 2020 2021 Thereafter Total Fair Value Total Fair Value
Fixed rate debt ............. $ 16.7 $ 9.9 $ 10.2 $10.5 $11.4 $ 15.1 $73.8 $ 77.6 $ 54.5 $ 58.6Average interest rate .... 3.1 % 2.8 % 2.8% 2.8% 2.8% 2.8% Variable rate debt ......... $ — $ — $ — $ — $ — $ — $ — $ — $ 14.5 $ 14.5Average interest rate .... — — — — — —
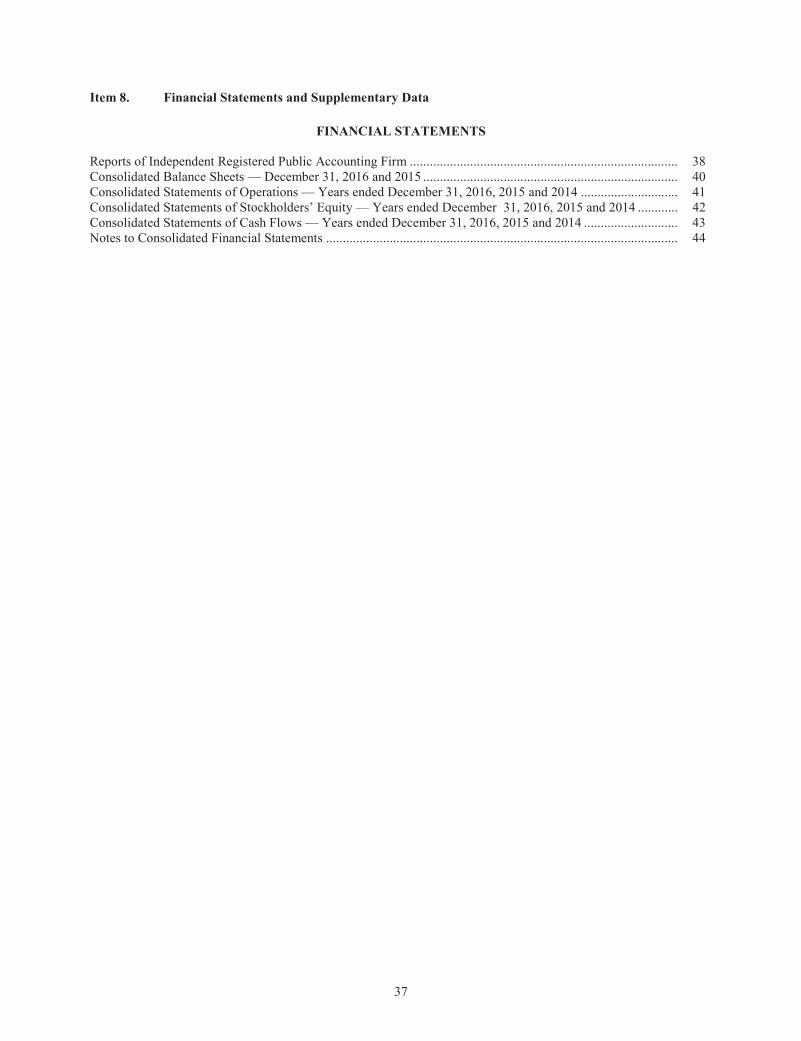
37
Item 8. Financial Statements and Supplementary Data
FINANCIAL STATEMENTS Reports of Independent Registered Public Accounting Firm ................................................................................ 38 Consolidated Balance Sheets — December 31, 2016 and 2015 ............................................................................ 40 Consolidated Statements of Operations — Years ended December 31, 2016, 2015 and 2014 ............................. 41 Consolidated Statements of Stockholders’ Equity — Years ended December 31, 2016, 2015 and 2014 ............ 42 Consolidated Statements of Cash Flows — Years ended December 31, 2016, 2015 and 2014 ............................ 43 Notes to Consolidated Financial Statements ......................................................................................................... 44
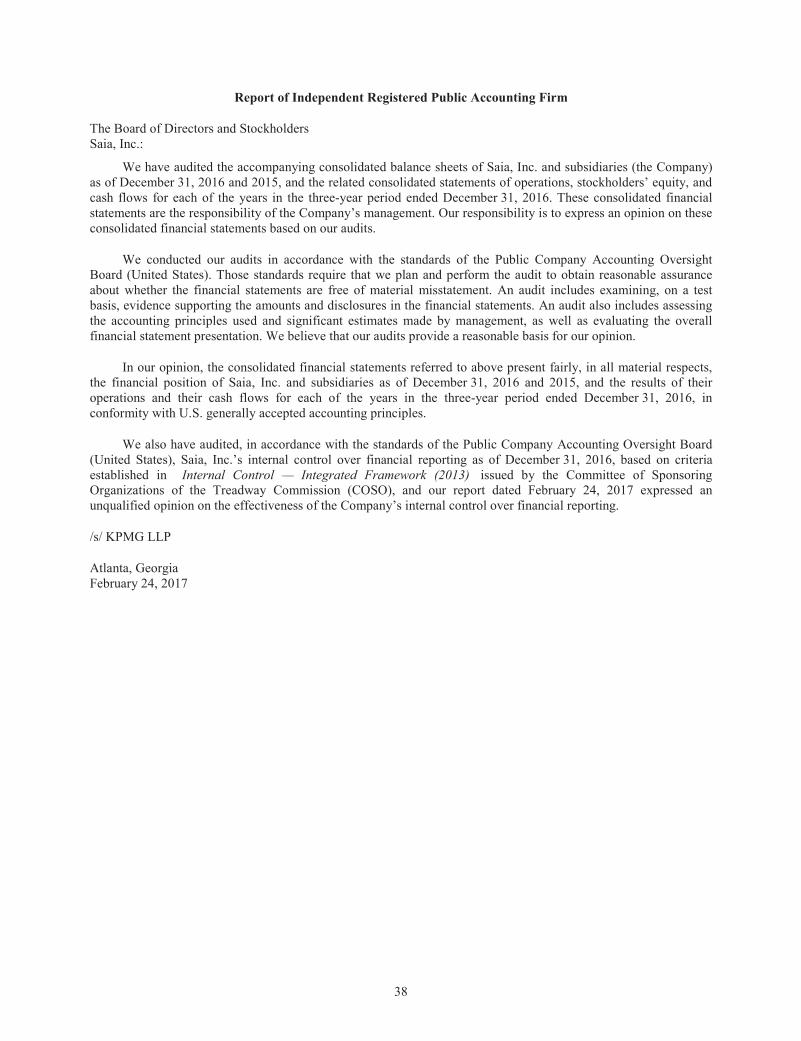
38
Report of Independent Registered Public Accounting Firm
The Board of Directors and Stockholders Saia, Inc.:
We have audited the accompanying consolidated balance sheets of Saia, Inc. and subsidiaries (the Company) as of December 31, 2016 and 2015, and the related consolidated statements of operations, stockholders’ equity, and cash flows for each of the years in the three-year period ended December 31, 2016. These consolidated financial statements are the responsibility of the Company’s management. Our responsibility is to express an opinion on these consolidated financial statements based on our audits.
We conducted our audits in accordance with the standards of the Public Company Accounting Oversight Board (United States). Those standards require that we plan and perform the audit to obtain reasonable assurance about whether the financial statements are free of material misstatement. An audit includes examining, on a test basis, evidence supporting the amounts and disclosures in the financial statements. An audit also includes assessing the accounting principles used and significant estimates made by management, as well as evaluating the overall financial statement presentation. We believe that our audits provide a reasonable basis for our opinion.
In our opinion, the consolidated financial statements referred to above present fairly, in all material respects, the financial position of Saia, Inc. and subsidiaries as of December 31, 2016 and 2015, and the results of their operations and their cash flows for each of the years in the three-year period ended December 31, 2016, in conformity with U.S. generally accepted accounting principles.
We also have audited, in accordance with the standards of the Public Company Accounting Oversight Board (United States), Saia, Inc.’s internal control over financial reporting as of December 31, 2016, based on criteria established in Internal Control — Integrated Framework (2013) issued by the Committee of Sponsoring Organizations of the Treadway Commission (COSO), and our report dated February 24, 2017 expressed an unqualified opinion on the effectiveness of the Company’s internal control over financial reporting.
/s/ KPMG LLP
Atlanta, Georgia February 24, 2017
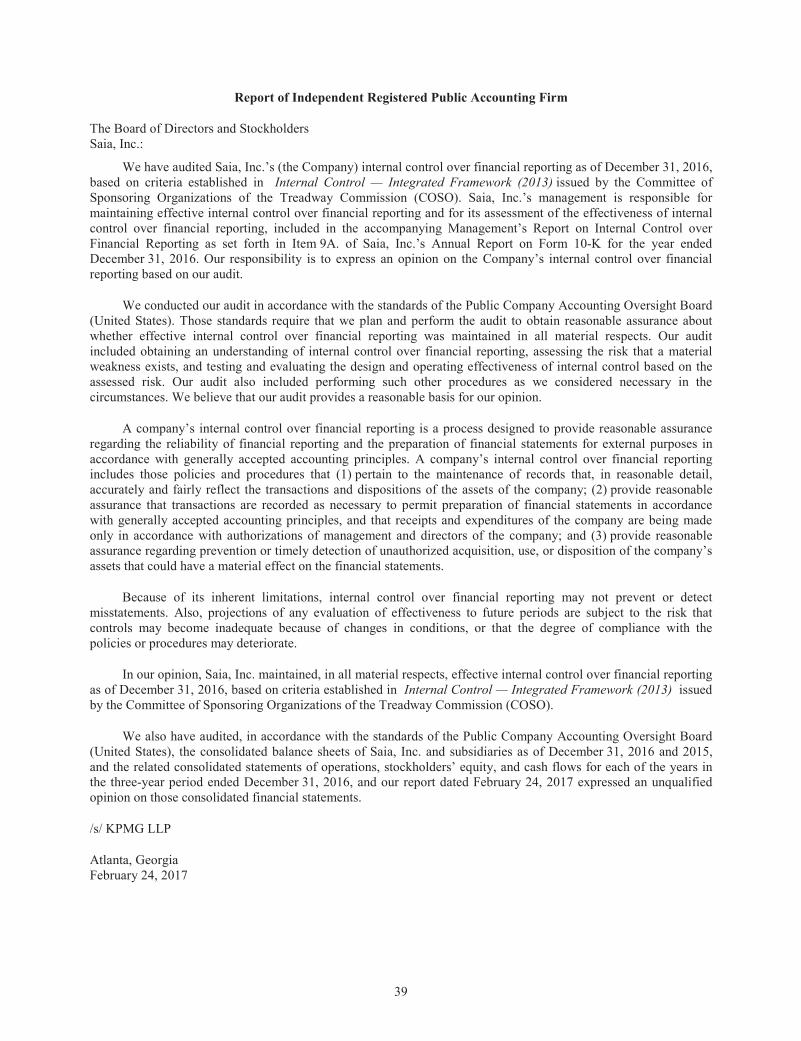
39
Report of Independent Registered Public Accounting Firm
The Board of Directors and Stockholders Saia, Inc.:
We have audited Saia, Inc.’s (the Company) internal control over financial reporting as of December 31, 2016, based on criteria established in Internal Control — Integrated Framework (2013) issued by the Committee of Sponsoring Organizations of the Treadway Commission (COSO). Saia, Inc.’s management is responsible for maintaining effective internal control over financial reporting and for its assessment of the effectiveness of internal control over financial reporting, included in the accompanying Management’s Report on Internal Control over Financial Reporting as set forth in Item 9A. of Saia, Inc.’s Annual Report on Form 10-K for the year ended December 31, 2016. Our responsibility is to express an opinion on the Company’s internal control over financial reporting based on our audit.
We conducted our audit in accordance with the standards of the Public Company Accounting Oversight Board (United States). Those standards require that we plan and perform the audit to obtain reasonable assurance about whether effective internal control over financial reporting was maintained in all material respects. Our audit included obtaining an understanding of internal control over financial reporting, assessing the risk that a material weakness exists, and testing and evaluating the design and operating effectiveness of internal control based on the assessed risk. Our audit also included performing such other procedures as we considered necessary in the circumstances. We believe that our audit provides a reasonable basis for our opinion.
A company’s internal control over financial reporting is a process designed to provide reasonable assurance regarding the reliability of financial reporting and the preparation of financial statements for external purposes in accordance with generally accepted accounting principles. A company’s internal control over financial reporting includes those policies and procedures that (1) pertain to the maintenance of records that, in reasonable detail, accurately and fairly reflect the transactions and dispositions of the assets of the company; (2) provide reasonable assurance that transactions are recorded as necessary to permit preparation of financial statements in accordance with generally accepted accounting principles, and that receipts and expenditures of the company are being made only in accordance with authorizations of management and directors of the company; and (3) provide reasonable assurance regarding prevention or timely detection of unauthorized acquisition, use, or disposition of the company’s assets that could have a material effect on the financial statements.
Because of its inherent limitations, internal control over financial reporting may not prevent or detect misstatements. Also, projections of any evaluation of effectiveness to future periods are subject to the risk that controls may become inadequate because of changes in conditions, or that the degree of compliance with the policies or procedures may deteriorate.
In our opinion, Saia, Inc. maintained, in all material respects, effective internal control over financial reporting as of December 31, 2016, based on criteria established in Internal Control — Integrated Framework (2013) issued by the Committee of Sponsoring Organizations of the Treadway Commission (COSO).
We also have audited, in accordance with the standards of the Public Company Accounting Oversight Board (United States), the consolidated balance sheets of Saia, Inc. and subsidiaries as of December 31, 2016 and 2015, and the related consolidated statements of operations, stockholders’ equity, and cash flows for each of the years in the three-year period ended December 31, 2016, and our report dated February 24, 2017 expressed an unqualified opinion on those consolidated financial statements.
/s/ KPMG LLP
Atlanta, Georgia February 24, 2017
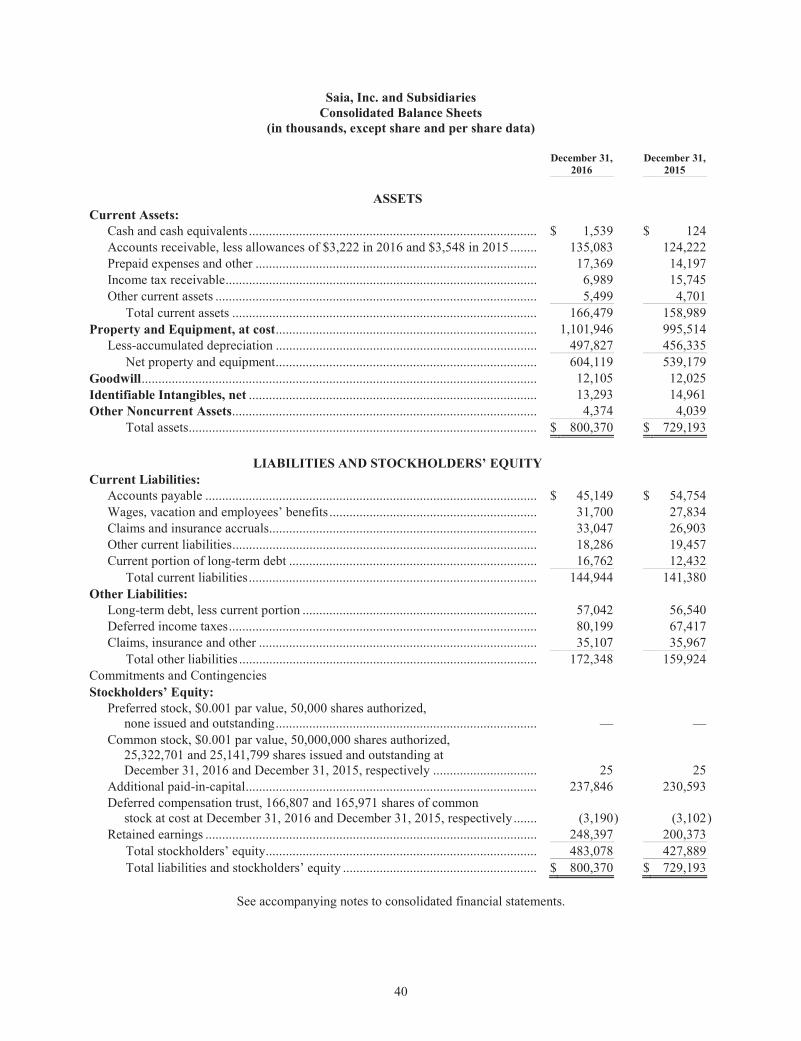
40
Saia, Inc. and Subsidiaries Consolidated Balance Sheets
(in thousands, except share and per share data)
December 31,
2016 December 31,
2015
ASSETS Current Assets:
Cash and cash equivalents ...................................................................................... $ 1,539 $ 124 Accounts receivable, less allowances of $3,222 in 2016 and $3,548 in 2015 ........ 135,083 124,222 Prepaid expenses and other .................................................................................... 17,369 14,197 Income tax receivable ............................................................................................. 6,989 15,745 Other current assets ................................................................................................ 5,499 4,701
Total current assets ........................................................................................... 166,479 158,989 Property and Equipment, at cost .............................................................................. 1,101,946 995,514
Less-accumulated depreciation .............................................................................. 497,827 456,335 Net property and equipment .............................................................................. 604,119 539,179
Goodwill ...................................................................................................................... 12,105 12,025 Identifiable Intangibles, net ...................................................................................... 13,293 14,961 Other Noncurrent Assets ........................................................................................... 4,374 4,039
Total assets ........................................................................................................ $ 800,370 $ 729,193
LIABILITIES AND STOCKHOLDERS’ EQUITY Current Liabilities:
Accounts payable ................................................................................................... $ 45,149 $ 54,754 Wages, vacation and employees’ benefits .............................................................. 31,700 27,834 Claims and insurance accruals................................................................................ 33,047 26,903 Other current liabilities ........................................................................................... 18,286 19,457 Current portion of long-term debt .......................................................................... 16,762 12,432
Total current liabilities ...................................................................................... 144,944 141,380 Other Liabilities:
Long-term debt, less current portion ...................................................................... 57,042 56,540 Deferred income taxes ............................................................................................ 80,199 67,417 Claims, insurance and other ................................................................................... 35,107 35,967
Total other liabilities ......................................................................................... 172,348 159,924 Commitments and Contingencies Stockholders’ Equity:
Preferred stock, $0.001 par value, 50,000 shares authorized, none issued and outstanding .............................................................................. — — Common stock, $0.001 par value, 50,000,000 shares authorized, 25,322,701 and 25,141,799 shares issued and outstanding at December 31, 2016 and December 31, 2015, respectively ............................... 25 25 Additional paid-in-capital ....................................................................................... 237,846 230,593 Deferred compensation trust, 166,807 and 165,971 shares of common stock at cost at December 31, 2016 and December 31, 2015, respectively ....... (3,190 ) (3,102)Retained earnings ................................................................................................... 248,397 200,373
Total stockholders’ equity ................................................................................. 483,078 427,889 Total liabilities and stockholders’ equity .......................................................... $ 800,370 $ 729,193
See accompanying notes to consolidated financial statements.
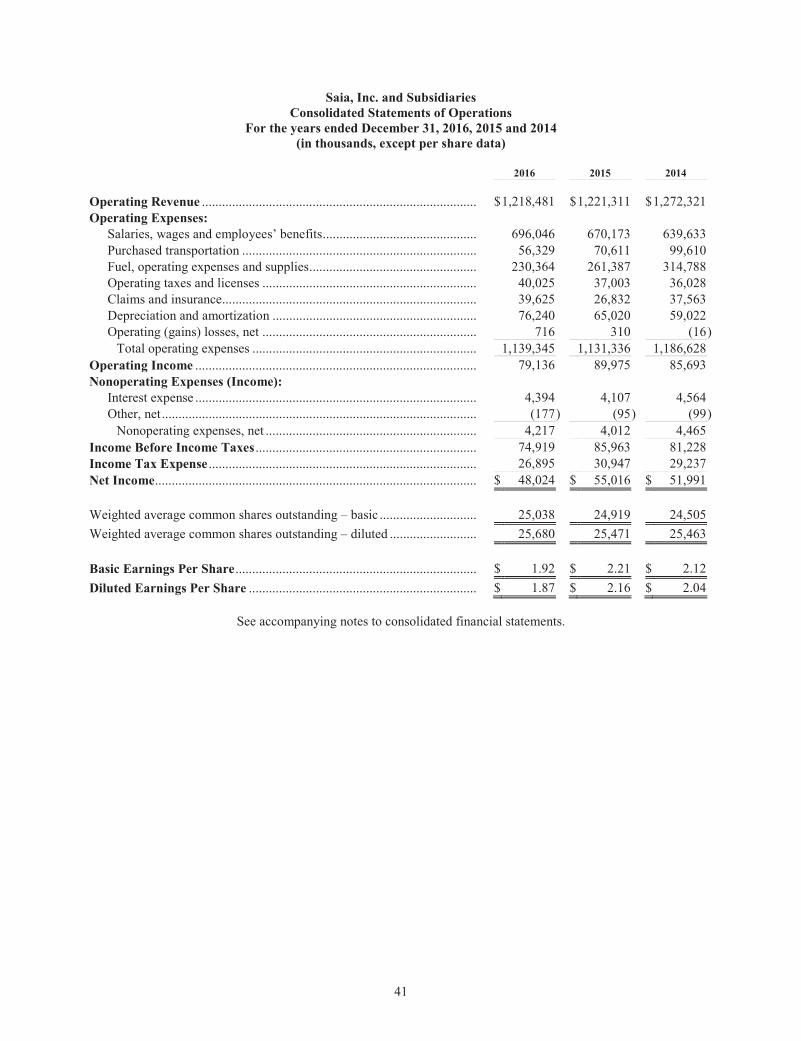
41
Saia, Inc. and Subsidiaries Consolidated Statements of Operations
For the years ended December 31, 2016, 2015 and 2014 (in thousands, except per share data)
2016 2015 2014 Operating Revenue .................................................................................. $1,218,481 $ 1,221,311 $1,272,321 Operating Expenses:
Salaries, wages and employees’ benefits .............................................. 696,046 670,173 639,633 Purchased transportation ...................................................................... 56,329 70,611 99,610 Fuel, operating expenses and supplies .................................................. 230,364 261,387 314,788 Operating taxes and licenses ................................................................ 40,025 37,003 36,028 Claims and insurance............................................................................ 39,625 26,832 37,563 Depreciation and amortization ............................................................. 76,240 65,020 59,022 Operating (gains) losses, net ................................................................ 716 310 (16)
Total operating expenses ................................................................... 1,139,345 1,131,336 1,186,628 Operating Income .................................................................................... 79,136 89,975 85,693 Nonoperating Expenses (Income):
Interest expense .................................................................................... 4,394 4,107 4,564 Other, net .............................................................................................. (177) (95 ) (99)
Nonoperating expenses, net ............................................................... 4,217 4,012 4,465 Income Before Income Taxes .................................................................. 74,919 85,963 81,228 Income Tax Expense ................................................................................ 26,895 30,947 29,237 Net Income ................................................................................................ $ 48,024 $ 55,016 $ 51,991 Weighted average common shares outstanding – basic ............................. 25,038 24,919 24,505 Weighted average common shares outstanding – diluted .......................... 25,680 25,471 25,463 Basic Earnings Per Share ........................................................................ $ 1.92 $ 2.21 $ 2.12 Diluted Earnings Per Share .................................................................... $ 1.87 $ 2.16 $ 2.04
See accompanying notes to consolidated financial statements.
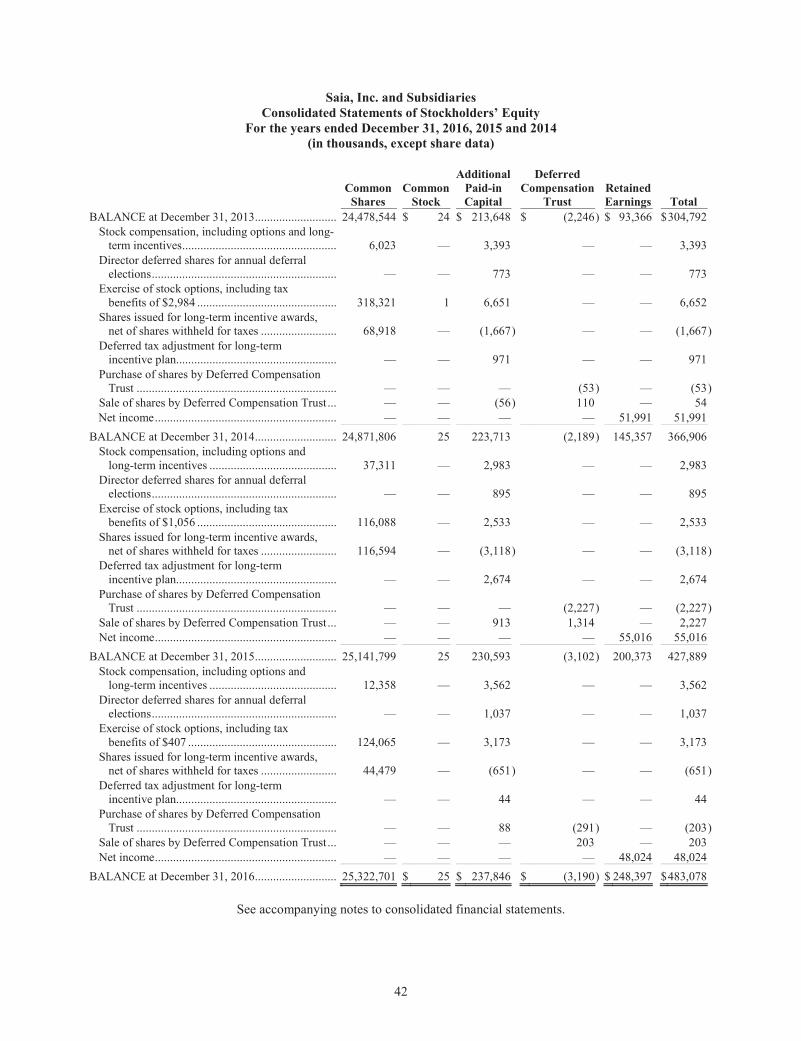
42
Saia, Inc. and Subsidiaries Consolidated Statements of Stockholders’ Equity
For the years ended December 31, 2016, 2015 and 2014 (in thousands, except share data)
Common
Shares Common
Stock
Additional Paid-in Capital
Deferred Compensation
Trust Retained Earnings Total
BALANCE at December 31, 2013 ........................... 24,478,544 $ 24 $ 213,648 $ (2,246 ) $ 93,366 $304,792 Stock compensation, including options and long-
term incentives ................................................... 6,023 — 3,393 — — 3,393 Director deferred shares for annual deferral
elections ............................................................. — — 773 — — 773 Exercise of stock options, including tax
benefits of $2,984 .............................................. 318,321 1 6,651 — — 6,652 Shares issued for long-term incentive awards,
net of shares withheld for taxes ......................... 68,918 — (1,667) — — (1,667)Deferred tax adjustment for long-term
incentive plan..................................................... — — 971 — — 971 Purchase of shares by Deferred Compensation
Trust .................................................................. — — — (53 ) — (53)Sale of shares by Deferred Compensation Trust ... — — (56) 110 — 54 Net income ............................................................ — — — — 51,991 51,991
BALANCE at December 31, 2014 ........................... 24,871,806 25 223,713 (2,189 ) 145,357 366,906 Stock compensation, including options and
long-term incentives .......................................... 37,311 — 2,983 — — 2,983 Director deferred shares for annual deferral
elections ............................................................. — — 895 — — 895 Exercise of stock options, including tax
benefits of $1,056 .............................................. 116,088 — 2,533 — — 2,533 Shares issued for long-term incentive awards,
net of shares withheld for taxes ......................... 116,594 — (3,118) — — (3,118)Deferred tax adjustment for long-term
incentive plan..................................................... — — 2,674 — — 2,674 Purchase of shares by Deferred Compensation
Trust .................................................................. — — — (2,227 ) — (2,227)Sale of shares by Deferred Compensation Trust ... — — 913 1,314 — 2,227 Net income ............................................................ — — — — 55,016 55,016
BALANCE at December 31, 2015 ........................... 25,141,799 25 230,593 (3,102 ) 200,373 427,889 Stock compensation, including options and
long-term incentives .......................................... 12,358 — 3,562 — — 3,562 Director deferred shares for annual deferral
elections ............................................................. — — 1,037 — — 1,037 Exercise of stock options, including tax
benefits of $407 ................................................. 124,065 — 3,173 — — 3,173 Shares issued for long-term incentive awards,
net of shares withheld for taxes ......................... 44,479 — (651) — — (651)Deferred tax adjustment for long-term
incentive plan..................................................... — — 44 — — 44 Purchase of shares by Deferred Compensation
Trust .................................................................. — — 88 (291 ) — (203)Sale of shares by Deferred Compensation Trust ... — — — 203 — 203 Net income ............................................................ — — — — 48,024 48,024
BALANCE at December 31, 2016 ........................... 25,322,701 $ 25 $ 237,846 $ (3,190 ) $ 248,397 $483,078
See accompanying notes to consolidated financial statements.
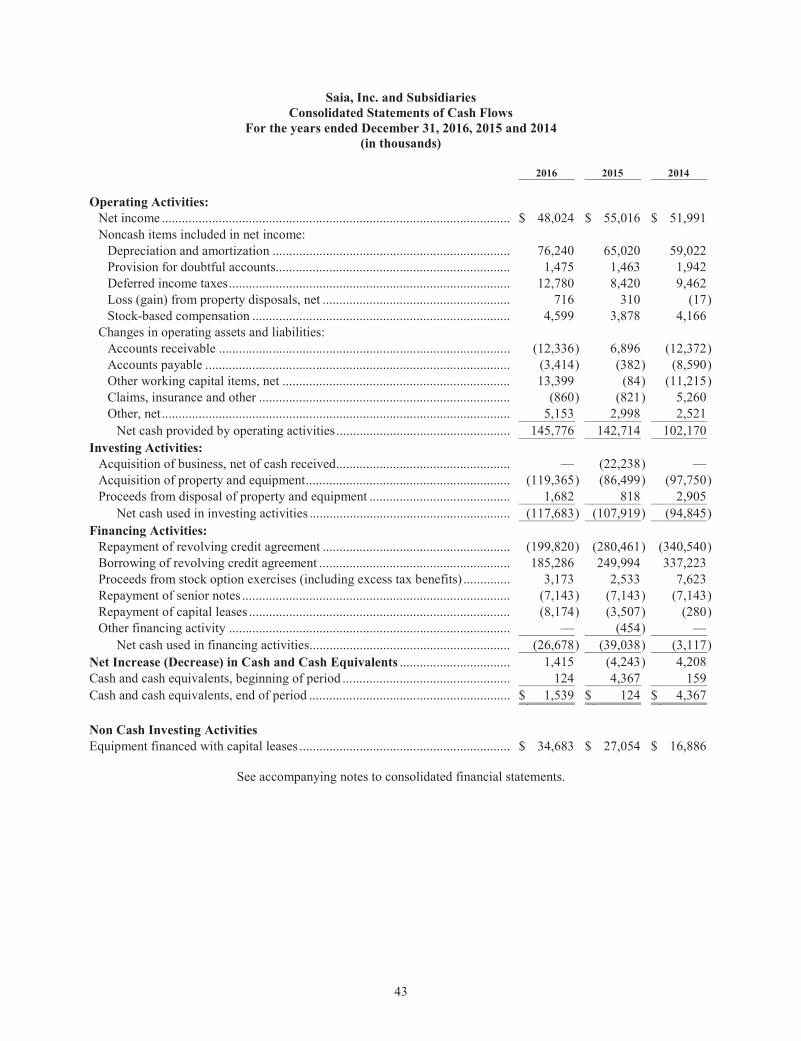
43
Saia, Inc. and Subsidiaries Consolidated Statements of Cash Flows
For the years ended December 31, 2016, 2015 and 2014 (in thousands)
2016 2015 2014
Operating Activities: Net income ........................................................................................................ $ 48,024 $ 55,016 $ 51,991 Noncash items included in net income:
Depreciation and amortization ....................................................................... 76,240 65,020 59,022 Provision for doubtful accounts...................................................................... 1,475 1,463 1,942 Deferred income taxes .................................................................................... 12,780 8,420 9,462 Loss (gain) from property disposals, net ........................................................ 716 310 (17)Stock-based compensation ............................................................................. 4,599 3,878 4,166
Changes in operating assets and liabilities: Accounts receivable ....................................................................................... (12,336 ) 6,896 (12,372)Accounts payable ........................................................................................... (3,414 ) (382 ) (8,590)Other working capital items, net .................................................................... 13,399 (84 ) (11,215)Claims, insurance and other ........................................................................... (860 ) (821 ) 5,260 Other, net ........................................................................................................ 5,153 2,998 2,521
Net cash provided by operating activities .................................................... 145,776 142,714 102,170 Investing Activities:
Acquisition of business, net of cash received.................................................... — (22,238 ) — Acquisition of property and equipment ............................................................. (119,365 ) (86,499 ) (97,750)Proceeds from disposal of property and equipment .......................................... 1,682 818 2,905
Net cash used in investing activities ............................................................ (117,683 ) (107,919 ) (94,845)Financing Activities:
Repayment of revolving credit agreement ........................................................ (199,820 ) (280,461 ) (340,540)Borrowing of revolving credit agreement ......................................................... 185,286 249,994 337,223 Proceeds from stock option exercises (including excess tax benefits) .............. 3,173 2,533 7,623 Repayment of senior notes ................................................................................ (7,143 ) (7,143 ) (7,143)Repayment of capital leases .............................................................................. (8,174 ) (3,507 ) (280)Other financing activity .................................................................................... — (454 ) —
Net cash used in financing activities............................................................ (26,678 ) (39,038 ) (3,117)Net Increase (Decrease) in Cash and Cash Equivalents ................................. 1,415 (4,243 ) 4,208 Cash and cash equivalents, beginning of period .................................................. 124 4,367 159 Cash and cash equivalents, end of period ............................................................ $ 1,539 $ 124 $ 4,367
Non Cash Investing Activities Equipment financed with capital leases ............................................................... $ 34,683 $ 27,054 $ 16,886
See accompanying notes to consolidated financial statements.
44
Saia, Inc. and Subsidiaries Notes to Consolidated Financial Statements
December 31, 2016, 2015 and 2014
1. Description of Business and Summary of Accounting Policies
Description of Business
Saia, Inc. and its subsidiaries (Saia or the Company) are headquartered in Johns Creek, Georgia. Saia is a leading, less-than-truckload (“LTL”) motor carrier with more than 99% of its revenue historically derived from transporting LTL shipments for customers. In addition to the core LTL services provided in 34 states, the Company also offers customers a wide range of other value-added services, including non-asset truckload, expedited and logistics services across the United States through its wholly-owned subsidiaries.
The Chief Operating Decision Maker is the Chief Executive Officer who manages the business, regularly reviews financial information and allocates resources. The Company has one operating segment.
Basis of Presentation
The accompanying consolidated financial statements include the accounts of Saia, Inc. and its wholly-owned subsidiaries. All significant intercompany accounts and transactions have been eliminated in the consolidated financial statements.
Use of Estimates
Management makes estimates and assumptions when preparing the consolidated financial statements in conformity with U.S. generally accepted accounting principles. These estimates and assumptions affect the amounts reported in the consolidated financial statements and footnotes. Actual results could differ from those estimates.
Accounting Pronouncements Not Yet Adopted
In May 2014, the Financial Accounting Standards Board (“FASB”) issued Accounting Standards Update (“ASU”) 2014-09, Revenue from Contracts with Customers, which requires an entity to recognize the amount of revenue to which it expects to be entitled for the transfer of promised goods or services. The ASU will replace most existing revenue recognition guidance in U.S. generally accepted accounting principles when it becomes effective. In July 2015, the FASB updated ASU No. 2014-09 to defer the effective date by one year. The new standard is effective for the Company on January 1, 2018, at which point the Company plans to adopt this standard. The standard permits the use of either the retrospective or cumulative effect transition method. The Company is evaluating the effect that ASU No. 2014-09 will have on its consolidated financial statements and related disclosures. The Company has not yet selected a transition method nor has it completed its evaluation of the effect of the standard on its ongoing financial reporting. While the Company has adopted a timeline for implementation and identified its revenue streams and contracts subject to the standard, the Company has not yet completed its evaluation of these. Based on the Company’s current analysis, it expects the revenue recognition of its non-asset truckload and logistics business to change to upon delivery of the shipment or completion of the services. However, the Company does not anticipate a significant change to other areas of its business.
In February 2016, the FASB issued ASU 2016-02, Leases (Topic 842), a leasing standard for both lessees and lessors. Under its core principle, a lessee will recognize lease assets and liabilities on the balance sheet for all arrangements with terms longer than 12 months. Lessor accounting remains largely consistent with existing U.S. generally accepted accounting principles. The new standard is effective for the Company on January 1, 2019. Early adoption is permitted. The standard requires the use of a modified retrospective transition method. The Company is evaluating the effect that ASU No. 2016-02 will have on its consolidated financial statements and related disclosures. While the Company has not completed its evaluation of the effect of the standard on its ongoing financial reporting, it believes the most significant changes relate to the recognition of new lease assets and liabilities on its balance sheet.
45
In March 2016, the FASB issued ASU 2016-09, Improvements to Employee Share-Based Payment Accounting. The new standard is effective for the Company on January 1, 2017, at which point the Company plans to adopt this standard, and it will be implemented prospectively. As a result of adoption, excess tax benefits and certain tax deficiencies will be recorded as income tax expense or benefit, as opposed to additional paid-in capital, and the windfall tax benefit will be removed from the Company’s diluted shares calculation. The Company will classify all excess tax benefits related to share-based payments as operating activity instead of financing activity on the Consolidated Statement of Cash Flows. The Company plans to continue to use an estimated forfeiture rate for recording stock compensation expense.
Summary of Accounting Policies
Major accounting policies and practices used in the preparation of the accompanying consolidated financial statements not covered in other notes to the consolidated financial statements are as follows:
Cash and Cash Equivalents and Checks Outstanding: Cash and cash equivalents in excess of current operating requirements are invested in short-term interest bearing instruments purchased with original maturities of three months or less and are stated at cost, which approximates market. Checks outstanding in excess of cash on deposit are classified in accounts payable on the accompanying consolidated balance sheets and in operating activities in the accompanying consolidated statements of cash flows.
Parts, fuel and operating supplies: Parts, fuel and operating supplies are carried at average cost and included in other current assets. To mitigate the Company’s risk to rising fuel prices, the Company has implemented fuel surcharge programs and considers effects of these fuel surcharge programs in customer pricing negotiations.
Property and Equipment Including Repairs and Maintenance: Property and equipment are carried at cost less accumulated depreciation. Depreciation is computed using the straight-line method based on the following service lives:
Years Structures .............................................................................................................................. 20 to 25 Tractors ................................................................................................................................. 6 to 10 Trailers ................................................................................................................................. 10 to 14 Other revenue equipment ..................................................................................................... 10 to 14 Technology equipment and software .................................................................................... 3 to 5 Other ..................................................................................................................................... 3 to 10
At December 31, property and equipment consisted of the following (in thousands):
2016 2015 Land ................................................................................................................ $ 69,115 $ 57,506 Structures ........................................................................................................ 196,843 181,769 Tractors ........................................................................................................... 350,737 314,326 Trailers ........................................................................................................... 279,393 256,494 Other revenue equipment ............................................................................... 38,050 36,828 Technology equipment and software .............................................................. 80,342 72,707 Other ............................................................................................................... 87,466 75,884
Total property and equipment, at cost ....................................................... $1,101,946 $ 995,514
Maintenance and repairs are charged to operations while replacements and improvements that extend the
asset’s life are capitalized. The Company’s investment in technology equipment and software consists primarily of systems to support customer service, maintenance and freight management. Depreciation was $74.5 million, $63.4 million and $58.4 million for the years ended December 31, 2016, 2015 and 2014, respectively. Depreciation and amortization expense includes amortization of assets under capital lease. At December 31, 2016, trailers acquired under capital leases had a gross carrying value of $72.8 million and accumulated depreciation of $6.8 million. At
46
December 31, 2015, trailers acquired under capital leases had a gross carrying value of $40.9 million and accumulated depreciation of $2.2 million.
Computer Software Developed or Obtained for Internal Use: The Company capitalizes certain costs associated with developing or obtaining internal-use software. Capitalizable costs include external direct costs of materials and services utilized in developing or obtaining the software and payroll and payroll-related costs for employees directly associated with the development of the project. For the years ended December 31, 2016, 2015, and 2014, the Company capitalized $1.6 million, $2.2 million, and $1.0 million, respectively, of primarily payroll-related costs.
Claims and Insurance Accruals: Claims and insurance accruals, both current and long-term, reflect the estimated cost of claims for workers’ compensation (discounted to present value), cargo loss and damage, and bodily injury and property damage not covered by insurance. These costs are included in claims and insurance expense, except for workers’ compensation, which is included in employees’ benefits expense. The liabilities for self-funded retention are included in claims and insurance reserves based on estimates of claims incurred. Liabilities for unsettled claims and claims incurred but not yet reported are actuarially determined with respect to workers’ compensation claims and with respect to all other liabilities, estimated based on management’s evaluation of the nature and severity of individual claims and past experience. The former parent of Saia provides letters of credit for claims in certain self-insured states incurred prior to March 1, 2000 (See Note 3 for more information regarding the guarantees).
Risk retention amounts per occurrence during the three years ended December 31, 2016, were as follows:
Workers’ compensation ........................................................................................................ $ 1,000,000 Bodily injury and property damage ...................................................................................... 2,000,000 Employee medical and hospitalization ................................................................................. 350,000 Cargo loss and damage ......................................................................................................... 250,000
The Company’s insurance accruals are presented net of amounts receivable from insurance companies that
provide coverage above the Company’s retention.
Income Taxes: Income taxes are accounted for under the asset and liability method. Deferred tax assets and liabilities are recognized for the future tax consequences attributable to differences between the financial statement carrying amounts of existing assets and liabilities and their respective tax bases and operating loss and tax credit carry forwards. Deferred tax assets and liabilities are measured using enacted tax rates expected to apply to taxable income in the years in which those temporary differences are expected to be recovered or settled. The effect on deferred tax assets and liabilities of a change in tax rates is recognized in income in the period that includes the enactment date. As required by FASB Accounting Standards Codification (“ASC”) 740, Income Taxes, the Company follows this guidance which defines the threshold for recognizing the benefits of tax-filing positions in the financial statements as “more-likely-than-not” to be sustained by the tax authority. ASC 740 also prescribes a method for computing the tax benefit of such tax positions to be recognized in the financial statements. In addition, it provides guidance on derecognition, classification, interest and penalties, accounting in interim periods, disclosure and transition.
Revenue Recognition: Revenue is recognized on a percentage-of-completion basis for shipments in transit while expenses are recognized as incurred. Non-asset truckload services engage in some transactions wherein they act as agents. Revenue from these transactions is recorded on a net basis. Net revenue includes billings to customers less third-party charges.
Stock-Based Compensation: The Company accounts for its employee stock-based compensation awards in accordance with ASC 718, Compensation-Stock Compensation. ASC 718 requires that all employee stock-based compensation is recognized as an expense in the financial statements and that for equity-classified awards such expenses are measured at the grant date fair value of the award.
47
Stock options are accounted for in accordance with ASC 718 with the expense amortized over the three-year vesting period using a Black-Sholes-Merton model to estimate the fair value of stock options granted to employees.
Stock-based Performance Unit Awards are accounted for in accordance with ASC 718 with the expense amortized over the three-year vesting period using a Monte Carlo model to estimate fair value at the date the awards are granted.
Credit Risk: The Company routinely grants credit to its customers. The risk of significant loss in trade receivables is substantially mitigated by the Company’s credit evaluation process, short collection terms, low revenue per transaction and services performed for a large number of customers with no single customer representing more than 6.0 percent of consolidated operating revenue. Allowances for potential credit losses are based on historical loss experience, current economic environment, expected trends and customer specific factors.
Impairment of Long-Lived Assets: As required by ASC 360, Property, Plant, and Equipment, long-lived assets, such as property, plant and equipment, and purchased intangible assets subject to amortization, are reviewed for impairment whenever events or changes in circumstances indicate that the carrying amount of an asset may not be recoverable. If circumstances require a long-lived asset or asset group be tested for possible impairment, the Company first compares undiscounted cash flows expected to be generated by that asset or asset group to its carrying value. If the carrying value of the long-lived asset or asset group is not recoverable on an undiscounted cash flow basis, impairment is recognized to the extent that the carrying value exceeds its fair value. Fair value is determined through various valuation techniques including discounted cash flow models, quoted market values and third-party independent appraisals, as deemed necessary.
The Company has adopted ASU 2011-08, Testing Goodwill for Impairment. In accordance with ASC 350, Intangibles – Goodwill and Other, the Company first performs a qualitative assessment to determine whether it is necessary to perform the two-step goodwill impairment test required by the standard. The Company is not required to estimate the fair value of a reporting unit unless the Company determines, based on qualitative assessment, that it is more likely than not that its fair value is less than its carrying amount.
Advertising: The costs of advertising are expensed as incurred. Advertising costs charged to expense were $1.2 million, $1.7 million, and $1.9 million in 2016, 2015 and 2014, respectively.
Financial Instruments
The carrying amounts of financial instruments including cash and cash equivalents, accounts receivable, accounts payable and short-term debt approximated fair value as of December 31, 2016 and 2015, because of the relatively short maturity of these instruments. See Note 2 for fair value disclosures related to long-term debt. 2. Debt and Financing Arrangements
At December 31, debt consisted of the following (in thousands):
December 31,
2016 December 31,
2015 Credit Agreement with Banks, described below ............................................. $ — $ 14,534Senior Notes under a Master Shelf Agreement, described below.................... 7,143 14,286Capital Leases, described below ...................................................................... 66,661 40,152
Total debt ................................................................................................... 73,804 68,972Less: current portion of long-term debt ........................................................... 16,762 12,432
Long-term debt, less current portion .......................................................... $ 57,042 $ 56,540
The Company’s liquidity needs arise primarily from capital investment in new equipment, land and structures,
information technology and letters of credit required under insurance programs, as well as funding working capital requirements.
48
The Company is party to a revolving credit agreement with a group of banks to fund capital investments, letters of credit and working capital needs. On March 6, 2015, the Company entered into the Fifth Amended and Restated Credit Agreement with its banking group (as amended, the Restated Credit Agreement). The Restated Credit Agreement increased the revolving credit facility availability from $200 million to $250 million and extended the term until March 2020. The Restated Credit Agreement also reduced the interest rate pricing grid and eliminated both the borrowing base and the minimum tangible net worth covenant. On the same date, the Company also entered into the Second Amended and Restated Master Shelf Agreement with its long term note holders (as amended, the Restated Master Shelf Agreement) that made changes to this agreement to conform to certain changes in the Restated Credit Agreement. The Company has pledged certain real estate and facilities, tractors and trailers, accounts receivable and other assets to secure indebtedness under both agreements.
Restated Credit Agreement
The Restated Credit Agreement is a revolving credit facility for up to $250 million expiring in March 2020. The Restated Credit Agreement also has an accordion feature that allows for an additional $75 million of availability, subject to lender approval. The Restated Credit Agreement provides for a LIBOR rate margin range from 112.5 basis points to 225 basis points, base rate margins from minus 12.5 basis points to plus 50 basis points, an unused portion fee from 20 basis points to 30 basis points and a letter of credit fee range from 112.5 basis points to 225 basis points in each case based on the Company’s leverage ratio.
Under the Restated Credit Agreement, the Company must maintain certain financial covenants including a minimum fixed charge coverage ratio and a maximum leverage ratio, among others. The Restated Credit Agreement also provides for a pledge by the Company of certain land and structures, certain tractors, trailers and other personal property and accounts receivable, as defined in the Restated Credit Agreement.
At December 31, 2016, the Company had no outstanding borrowings and outstanding letters of credit of $39.4 million under the Restated Credit Agreement. At December 31, 2015, the Company had borrowings of $14.5 million and outstanding letters of credit of $44.8 million under the Restated Credit Agreement. The available portion of the Restated Credit Agreement may be used for general corporate purposes, including future capital expenditures, working capital and letter of credit requirements as needed.
Restated Master Shelf Agreement
In 2002, the Company issued $100 million in Senior Notes under a $125 million (amended to $150 million in April 2005) Master Shelf Agreement with Prudential Investment Management, Inc. and certain of its affiliates. The Company issued another $25 million in Senior Notes on November 30, 2007 and $25 million in Senior Notes on January 31, 2008 under the same Master Shelf Agreement.
The November 2007 issuance of $25 million Senior Notes has a fixed interest rate of 6.14 percent. The January 2008 issuance of $25 million Senior Notes has a fixed interest rate of 6.17 percent. Payments due for both $25 million issuances were interest only until June 30, 2011 and at that time semi-annual principal payments began with the final payments due December 31, 2017. Under the terms of the Senior Notes, the Company must maintain certain financial covenants including a minimum fixed charge coverage ratio and a maximum leverage ratio, among others. The Senior Notes also provide for a pledge by the Company of certain land and structures, certain tractors, trailers and other personal property and accounts receivable, as defined in the Senior Notes. At December 31, 2016 and 2015, the Company had $7.1 million and $14.3 million, respectively, in Senior Notes outstanding.
Capital Leases
The Company is obligated under capital leases with seven year terms which include obligations covering revenue equipment totaling $66.7 million and $40.2 million as of December 31, 2016 and 2015, respectively. Amortization of assets held under the capital leases is included in depreciation and amortization expense. The weighted average interest rate for the capital leases at December 31, 2016 and 2015 is 2.82% and 2.85%, respectively.
49
Other
The Company paid cash for interest of $2.4 million, $3.0 million, and $4.5 million for the years ended December 31, 2016, 2015 and 2014, respectively.
The estimated fair value of total debt at December 31, 2016 and 2015 is $77.6 million and $73.1 million, respectively. The carrying amount of debt related to the revolving credit facility approximated fair value as of December 31, 2016 and 2015 due to the existence of variable interest rates, which approximate market rates. The fair value of the senior notes is based on undiscounted cash flows at market interest rates for similar issuances of private debt which reflect Level 2 inputs in the fair value hierarchy. The fair value of the capital leases is based on current market interest rates for similar types of financial instruments which reflect Level 2 inputs.
Principal Maturities of Long-Term Debt
The principal maturities of long-term debt for the next five years (in thousands) are as follows:
Amount 2017 ...................................................................................................................................... $ 18,517 2018 ...................................................................................................................................... 11,374 2019 ...................................................................................................................................... 11,374 2020 ...................................................................................................................................... 11,374 2021 ...................................................................................................................................... 11,952 Thereafter ............................................................................................................................. 15,454 Total ..................................................................................................................................... 80,045 Less: Amounts Representing Interest on Capital Leases ...................................................... 6,241 Total ..................................................................................................................................... $ 73,804
3. Commitments, Contingencies and Uncertainties
The Company leases certain service facilities and equipment. Rent expense was $18.1 million, $17.9 million, and $17.1 million for the years ended December 31, 2016, 2015 and 2014, respectively.
At December 31, 2016, the Company was committed under non-cancellable operating lease agreements requiring minimum annual rentals payable as follows (in thousands):
Amount 2017 ....................................................................................................................................... $ 15,859 2018 ....................................................................................................................................... 14,322 2019 ....................................................................................................................................... 11,941 2020 ....................................................................................................................................... 8,848 2021 ....................................................................................................................................... 7,002 Thereafter .............................................................................................................................. 29,968 Total ...................................................................................................................................... $ 87,940
Management expects that in the normal course of business, leases will be renewed or replaced as they expire.
Capital expenditures committed were $107.6 million at December 31, 2016. As of December 31, 2016 and 2015, the Company had $5.9 million and $12.1 million, respectively, of capital expenditures in accounts payable.
Other.
The Company pays its pro rata share of the cost in connection with letters of credit outstanding for certain workers’ compensation claims incurred prior to March 1, 2000 that Saia’s former parent maintains for insurance programs. The Company’s pro rata share of these outstanding letters of credit was $1.8 million at December 31, 2016 and 2015.
50
The Company is subject to legal proceedings that arise in the ordinary course of its business. The Company believes that adequate provisions for resolution of all contingencies, claims and pending litigation have been made for probable and estimable losses and that the ultimate outcome of these actions will not have a material adverse effect on its financial condition but could have a material adverse effect on its results of operations in a given quarter or annual period. 4. Goodwill and Other Intangible Assets
The changes in gross carrying amounts of goodwill are as follows (in thousands): Goodwill December 31, 2014 .................................................................................................................................... $ 5,231 Goodwill acquired ..................................................................................................................................... 6,794 December 31, 2015 .................................................................................................................................... 12,025 Goodwill adjustment .................................................................................................................................. 80
December 31, 2016 .................................................................................................................................... $ 12,105
The Company assesses goodwill for impairment on an annual basis in the fourth quarter, or more frequently if
events or changes in circumstances indicate that the asset might be impaired.
The Company reviews other intangible assets, including customer relationships and non-compete agreements, for impairment whenever events or changes in circumstances indicate that the carrying amount of such assets may not be recoverable. Recoverability of long-lived assets is measured by a comparison of the carrying amount of the asset group to the future undiscounted net cash flows expected to be generated by those assets. If such assets are considered to be impaired, the impairment charge recognized is the amount by which the carrying amounts of the assets exceeds the fair value of the assets.
The gross amounts and accumulated amortization of identifiable intangible assets are as follows (in thousands): December 31, 2016 December 31, 2015
Gross Amount Accumulated
Amortization Gross Amount Accumulated
Amortization
Amortizable intangible assets: Customer relationships (useful life of 6-15 years) .................... $ 19,000 $ 7,439 $ 19,000 $ 6,086 Covenants not-to-compete (useful life of 4-6 years) ................. 4,425 4,001 4,425 3,786 Trademarks (useful life of 15 years) ......................................... 1,500 192 1,500 92
Total ............................................................................................. $ 24,925 $ 11,632 $ 24,925 $ 9,964
Amortization expense for intangible assets was $1.7 million, $1.6 million and $0.6 million for 2016, 2015 and
2014, respectively. Estimated amortization expense for the five succeeding years follows (in thousands):
Amount 2017 ........................................................................................................................................... $ 1,371 2018 ........................................................................................................................................... 1,363 2019 ........................................................................................................................................... 1,180 2020 ........................................................................................................................................... 1,163 2021 ........................................................................................................................................... 1,163
Total .......................................................................................................................................... $ 6,240
51
5. Computation of Earnings Per Share
The calculation of basic earnings per common share and diluted earnings per common share is as follows (in thousands except per share amounts): For The Years Ended December 31, 2016 2015 2014 Numerator: Net income ................................................................................................................. $48,024 $ 55,016 $51,991 Denominator: Denominator for basic earnings per share–weighted average common shares ........................................................................................ 25,038 24,919 24,505 Effect of dilutive stock options .................................................................................. 51 93 239 Effect of other common stock equivalents ................................................................. 591 459 719 Denominator for diluted earnings per share–adjusted weighted average common shares ........................................................................ 25,680 25,471 25,463
Basic Earnings Per Share ........................................................................................ $ 1.92 $ 2.21 $ 2.12
Diluted Earnings Per Share .................................................................................... $ 1.87 $ 2.16 $ 2.04
In 2016 and 2015, options and restricted stock for 402,770 and 206,756 shares of common stock, respectively,
were excluded from the calculation of diluted earnings per share because their effect was anti-dilutive. 6. Stockholders’ Equity
Deferred Compensation Trust
The Saia Executive Capital Accumulation Plan (the Capital Accumulation Plan) allows plan participants to make an irrevocable election to invest in the Company’s common stock. Upon distribution, the funds invested in the Company’s common stock will be paid out in Company stock rather than cash.
The following table summarizes the shares of the Company’s common stock that were purchased and sold by the Company’s Rabbi Trust, which holds the investments for the Capital Accumulation Plan:
For The Years Ended December 31, 2016 2015 2014 Shares of common stock purchased .................................................. 11,530 56,325 1,400 Aggregate purchase price of shares purchased ................................. $291,349 $2,226,675 $ 52,961 Shares of common stock sold ........................................................... 10,694 83,961 9,729 Aggregate sale price of shares sold .................................................. $322,928 $3,380,448 $ 53,962
Since the Capital Accumulation Plan provides for the obligation to be settled only in Company stock, the
deferred compensation obligation is classified as an equity instrument with no adjustments to operating results based on changes in fair value.
Directors’ Deferred Compensation
Under the Company’s Directors’ Deferred Fee Plan, non-employee directors may defer all or a portion of their annual fees and retainers which are otherwise payable. Such deferrals are converted into units equivalent to the value of the Company’s stock. Upon the director’s termination, death or disability, accumulated deferrals are distributed in the form of Company common stock. The Company has 253,413 and 229,679 shares reserved for issuance under the Directors’ Deferred Fee Plan at December 31, 2016 and 2015, respectively. The shares reserved for issuance under the Directors’ Deferred Fee Plan are treated as common stock equivalents in computing diluted earnings per share.
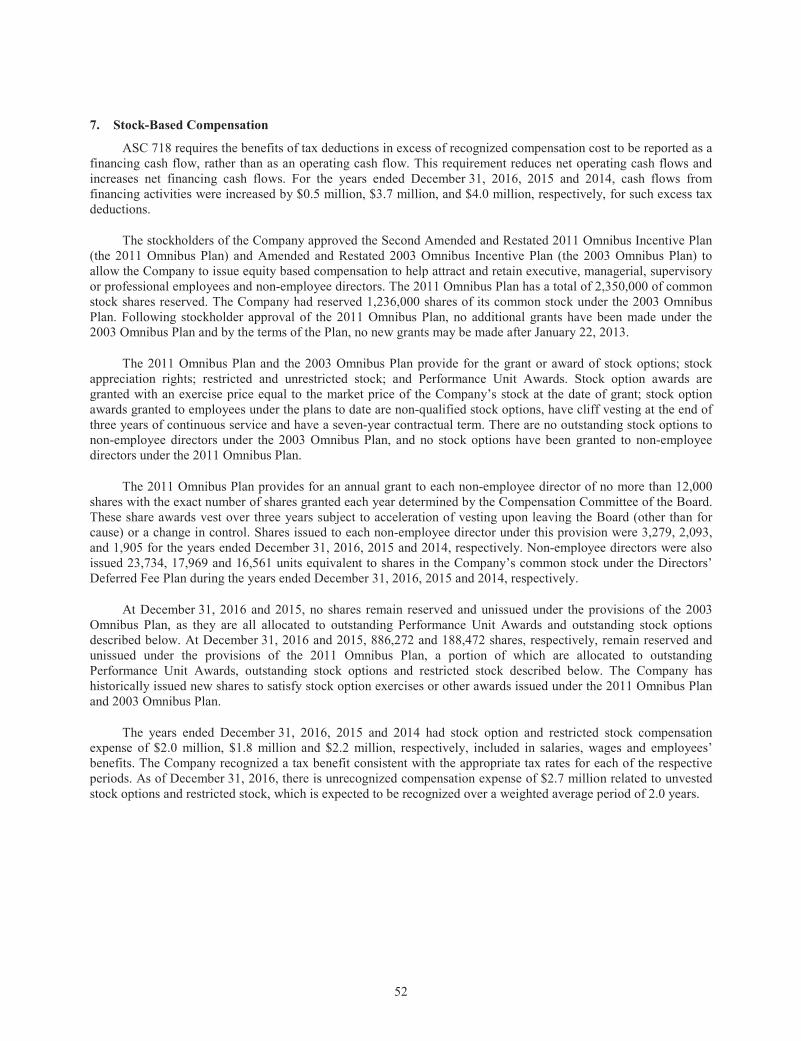
52
7. Stock-Based Compensation
ASC 718 requires the benefits of tax deductions in excess of recognized compensation cost to be reported as a financing cash flow, rather than as an operating cash flow. This requirement reduces net operating cash flows and increases net financing cash flows. For the years ended December 31, 2016, 2015 and 2014, cash flows from financing activities were increased by $0.5 million, $3.7 million, and $4.0 million, respectively, for such excess tax deductions.
The stockholders of the Company approved the Second Amended and Restated 2011 Omnibus Incentive Plan (the 2011 Omnibus Plan) and Amended and Restated 2003 Omnibus Incentive Plan (the 2003 Omnibus Plan) to allow the Company to issue equity based compensation to help attract and retain executive, managerial, supervisory or professional employees and non-employee directors. The 2011 Omnibus Plan has a total of 2,350,000 of common stock shares reserved. The Company had reserved 1,236,000 shares of its common stock under the 2003 Omnibus Plan. Following stockholder approval of the 2011 Omnibus Plan, no additional grants have been made under the 2003 Omnibus Plan and by the terms of the Plan, no new grants may be made after January 22, 2013.
The 2011 Omnibus Plan and the 2003 Omnibus Plan provide for the grant or award of stock options; stock appreciation rights; restricted and unrestricted stock; and Performance Unit Awards. Stock option awards are granted with an exercise price equal to the market price of the Company’s stock at the date of grant; stock option awards granted to employees under the plans to date are non-qualified stock options, have cliff vesting at the end of three years of continuous service and have a seven-year contractual term. There are no outstanding stock options to non-employee directors under the 2003 Omnibus Plan, and no stock options have been granted to non-employee directors under the 2011 Omnibus Plan.
The 2011 Omnibus Plan provides for an annual grant to each non-employee director of no more than 12,000 shares with the exact number of shares granted each year determined by the Compensation Committee of the Board. These share awards vest over three years subject to acceleration of vesting upon leaving the Board (other than for cause) or a change in control. Shares issued to each non-employee director under this provision were 3,279, 2,093, and 1,905 for the years ended December 31, 2016, 2015 and 2014, respectively. Non-employee directors were also issued 23,734, 17,969 and 16,561 units equivalent to shares in the Company’s common stock under the Directors’ Deferred Fee Plan during the years ended December 31, 2016, 2015 and 2014, respectively.
At December 31, 2016 and 2015, no shares remain reserved and unissued under the provisions of the 2003 Omnibus Plan, as they are all allocated to outstanding Performance Unit Awards and outstanding stock options described below. At December 31, 2016 and 2015, 886,272 and 188,472 shares, respectively, remain reserved and unissued under the provisions of the 2011 Omnibus Plan, a portion of which are allocated to outstanding Performance Unit Awards, outstanding stock options and restricted stock described below. The Company has historically issued new shares to satisfy stock option exercises or other awards issued under the 2011 Omnibus Plan and 2003 Omnibus Plan.
The years ended December 31, 2016, 2015 and 2014 had stock option and restricted stock compensation expense of $2.0 million, $1.8 million and $2.2 million, respectively, included in salaries, wages and employees’ benefits. The Company recognized a tax benefit consistent with the appropriate tax rates for each of the respective periods. As of December 31, 2016, there is unrecognized compensation expense of $2.7 million related to unvested stock options and restricted stock, which is expected to be recognized over a weighted average period of 2.0 years.
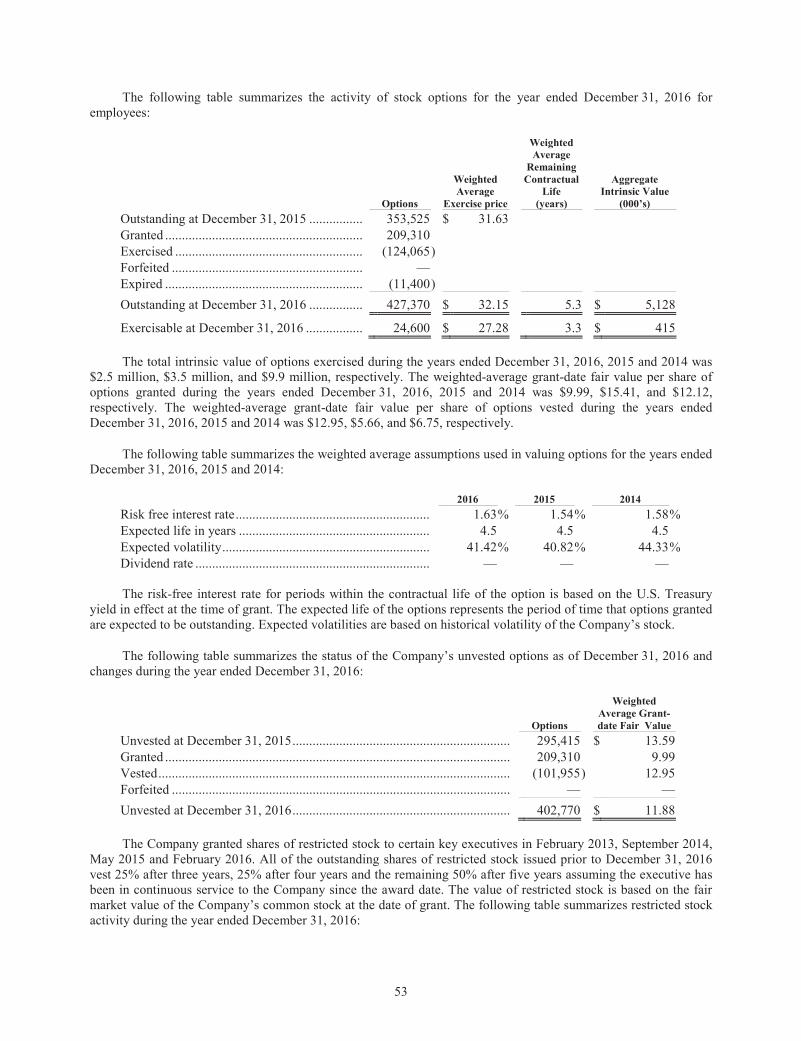
53
The following table summarizes the activity of stock options for the year ended December 31, 2016 for employees:
Options
Weighted Average
Exercise price
Weighted Average
Remaining Contractual
Life (years)
Aggregate Intrinsic Value
(000’s) Outstanding at December 31, 2015 ................ 353,525 $ 31.63 Granted ........................................................... 209,310 Exercised ........................................................ (124,065) Forfeited ......................................................... — Expired ........................................................... (11,400)
Outstanding at December 31, 2016 ................ 427,370 $ 32.15 5.3 $ 5,128
Exercisable at December 31, 2016 ................. 24,600 $ 27.28 3.3 $ 415
The total intrinsic value of options exercised during the years ended December 31, 2016, 2015 and 2014 was
$2.5 million, $3.5 million, and $9.9 million, respectively. The weighted-average grant-date fair value per share of options granted during the years ended December 31, 2016, 2015 and 2014 was $9.99, $15.41, and $12.12, respectively. The weighted-average grant-date fair value per share of options vested during the years ended December 31, 2016, 2015 and 2014 was $12.95, $5.66, and $6.75, respectively.
The following table summarizes the weighted average assumptions used in valuing options for the years ended December 31, 2016, 2015 and 2014:
2016 2015 2014 Risk free interest rate .......................................................... 1.63% 1.54 % 1.58%Expected life in years ......................................................... 4.5 4.5 4.5 Expected volatility .............................................................. 41.42% 40.82 % 44.33%Dividend rate ...................................................................... — — —
The risk-free interest rate for periods within the contractual life of the option is based on the U.S. Treasury
yield in effect at the time of grant. The expected life of the options represents the period of time that options granted are expected to be outstanding. Expected volatilities are based on historical volatility of the Company’s stock.
The following table summarizes the status of the Company’s unvested options as of December 31, 2016 and changes during the year ended December 31, 2016:
Options
Weighted Average Grant-date Fair Value
Unvested at December 31, 2015 ................................................................. 295,415 $ 13.59 Granted ....................................................................................................... 209,310 9.99 Vested ......................................................................................................... (101,955 ) 12.95 Forfeited ..................................................................................................... — —
Unvested at December 31, 2016 ................................................................. 402,770 $ 11.88
The Company granted shares of restricted stock to certain key executives in February 2013, September 2014,
May 2015 and February 2016. All of the outstanding shares of restricted stock issued prior to December 31, 2016 vest 25% after three years, 25% after four years and the remaining 50% after five years assuming the executive has been in continuous service to the Company since the award date. The value of restricted stock is based on the fair market value of the Company’s common stock at the date of grant. The following table summarizes restricted stock activity during the year ended December 31, 2016:
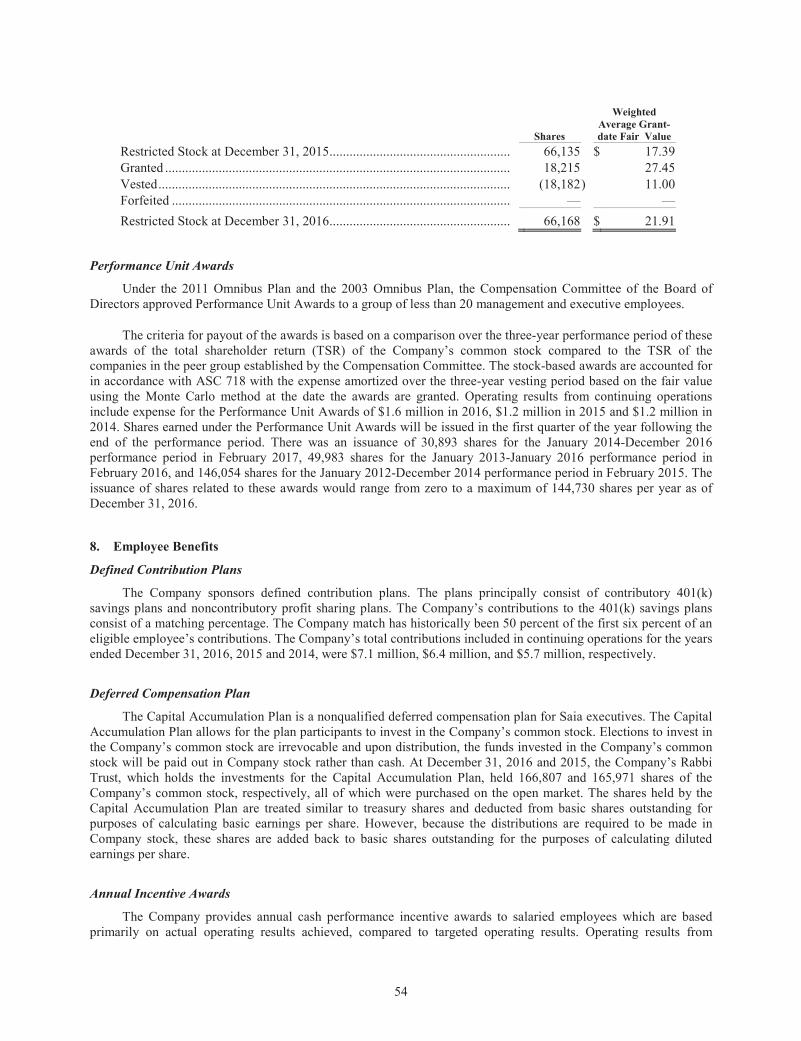
54
Shares
Weighted Average Grant-date Fair Value
Restricted Stock at December 31, 2015 ...................................................... 66,135 $ 17.39 Granted ....................................................................................................... 18,215 27.45 Vested ......................................................................................................... (18,182 ) 11.00 Forfeited ..................................................................................................... — —
Restricted Stock at December 31, 2016 ...................................................... 66,168 $ 21.91
Performance Unit Awards
Under the 2011 Omnibus Plan and the 2003 Omnibus Plan, the Compensation Committee of the Board of Directors approved Performance Unit Awards to a group of less than 20 management and executive employees.
The criteria for payout of the awards is based on a comparison over the three-year performance period of these awards of the total shareholder return (TSR) of the Company’s common stock compared to the TSR of the companies in the peer group established by the Compensation Committee. The stock-based awards are accounted for in accordance with ASC 718 with the expense amortized over the three-year vesting period based on the fair value using the Monte Carlo method at the date the awards are granted. Operating results from continuing operations include expense for the Performance Unit Awards of $1.6 million in 2016, $1.2 million in 2015 and $1.2 million in 2014. Shares earned under the Performance Unit Awards will be issued in the first quarter of the year following the end of the performance period. There was an issuance of 30,893 shares for the January 2014-December 2016 performance period in February 2017, 49,983 shares for the January 2013-January 2016 performance period in February 2016, and 146,054 shares for the January 2012-December 2014 performance period in February 2015. The issuance of shares related to these awards would range from zero to a maximum of 144,730 shares per year as of December 31, 2016. 8. Employee Benefits
Defined Contribution Plans
The Company sponsors defined contribution plans. The plans principally consist of contributory 401(k) savings plans and noncontributory profit sharing plans. The Company’s contributions to the 401(k) savings plans consist of a matching percentage. The Company match has historically been 50 percent of the first six percent of an eligible employee’s contributions. The Company’s total contributions included in continuing operations for the years ended December 31, 2016, 2015 and 2014, were $7.1 million, $6.4 million, and $5.7 million, respectively.
Deferred Compensation Plan
The Capital Accumulation Plan is a nonqualified deferred compensation plan for Saia executives. The Capital Accumulation Plan allows for the plan participants to invest in the Company’s common stock. Elections to invest in the Company’s common stock are irrevocable and upon distribution, the funds invested in the Company’s common stock will be paid out in Company stock rather than cash. At December 31, 2016 and 2015, the Company’s Rabbi Trust, which holds the investments for the Capital Accumulation Plan, held 166,807 and 165,971 shares of the Company’s common stock, respectively, all of which were purchased on the open market. The shares held by the Capital Accumulation Plan are treated similar to treasury shares and deducted from basic shares outstanding for purposes of calculating basic earnings per share. However, because the distributions are required to be made in Company stock, these shares are added back to basic shares outstanding for the purposes of calculating diluted earnings per share.
Annual Incentive Awards
The Company provides annual cash performance incentive awards to salaried employees which are based primarily on actual operating results achieved, compared to targeted operating results. Operating results from
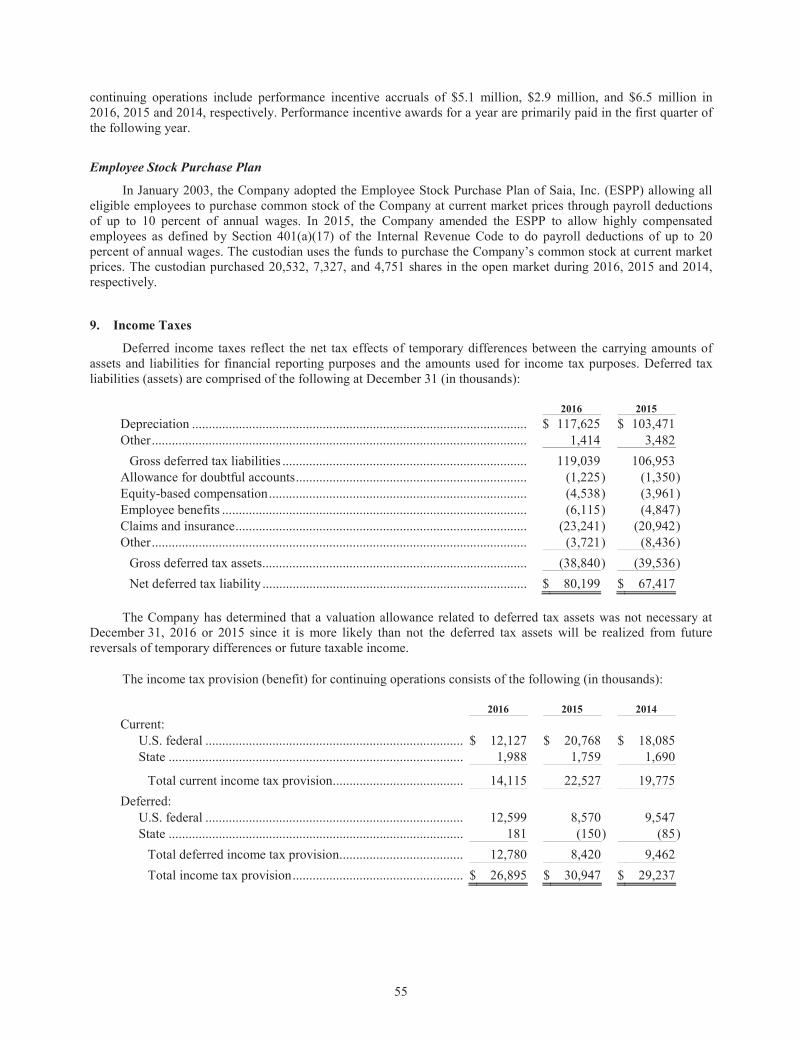
55
continuing operations include performance incentive accruals of $5.1 million, $2.9 million, and $6.5 million in 2016, 2015 and 2014, respectively. Performance incentive awards for a year are primarily paid in the first quarter of the following year.
Employee Stock Purchase Plan
In January 2003, the Company adopted the Employee Stock Purchase Plan of Saia, Inc. (ESPP) allowing all eligible employees to purchase common stock of the Company at current market prices through payroll deductions of up to 10 percent of annual wages. In 2015, the Company amended the ESPP to allow highly compensated employees as defined by Section 401(a)(17) of the Internal Revenue Code to do payroll deductions of up to 20 percent of annual wages. The custodian uses the funds to purchase the Company’s common stock at current market prices. The custodian purchased 20,532, 7,327, and 4,751 shares in the open market during 2016, 2015 and 2014, respectively. 9. Income Taxes
Deferred income taxes reflect the net tax effects of temporary differences between the carrying amounts of assets and liabilities for financial reporting purposes and the amounts used for income tax purposes. Deferred tax liabilities (assets) are comprised of the following at December 31 (in thousands):
2016 2015 Depreciation .................................................................................................... $ 117,625 $ 103,471 Other ................................................................................................................ 1,414 3,482
Gross deferred tax liabilities ......................................................................... 119,039 106,953 Allowance for doubtful accounts ..................................................................... (1,225 ) (1,350)Equity-based compensation ............................................................................. (4,538 ) (3,961)Employee benefits ........................................................................................... (6,115 ) (4,847)Claims and insurance ....................................................................................... (23,241 ) (20,942)Other ................................................................................................................ (3,721 ) (8,436)
Gross deferred tax assets............................................................................... (38,840 ) (39,536)
Net deferred tax liability ............................................................................... $ 80,199 $ 67,417
The Company has determined that a valuation allowance related to deferred tax assets was not necessary at
December 31, 2016 or 2015 since it is more likely than not the deferred tax assets will be realized from future reversals of temporary differences or future taxable income.
The income tax provision (benefit) for continuing operations consists of the following (in thousands):
2016 2015 2014 Current:
U.S. federal ............................................................................. $ 12,127 $ 20,768 $ 18,085 State ........................................................................................ 1,988 1,759 1,690
Total current income tax provision ....................................... 14,115 22,527 19,775
Deferred: U.S. federal ............................................................................. 12,599 8,570 9,547 State ........................................................................................ 181 (150 ) (85)
Total deferred income tax provision ..................................... 12,780 8,420 9,462
Total income tax provision ................................................... $ 26,895 $ 30,947 $ 29,237
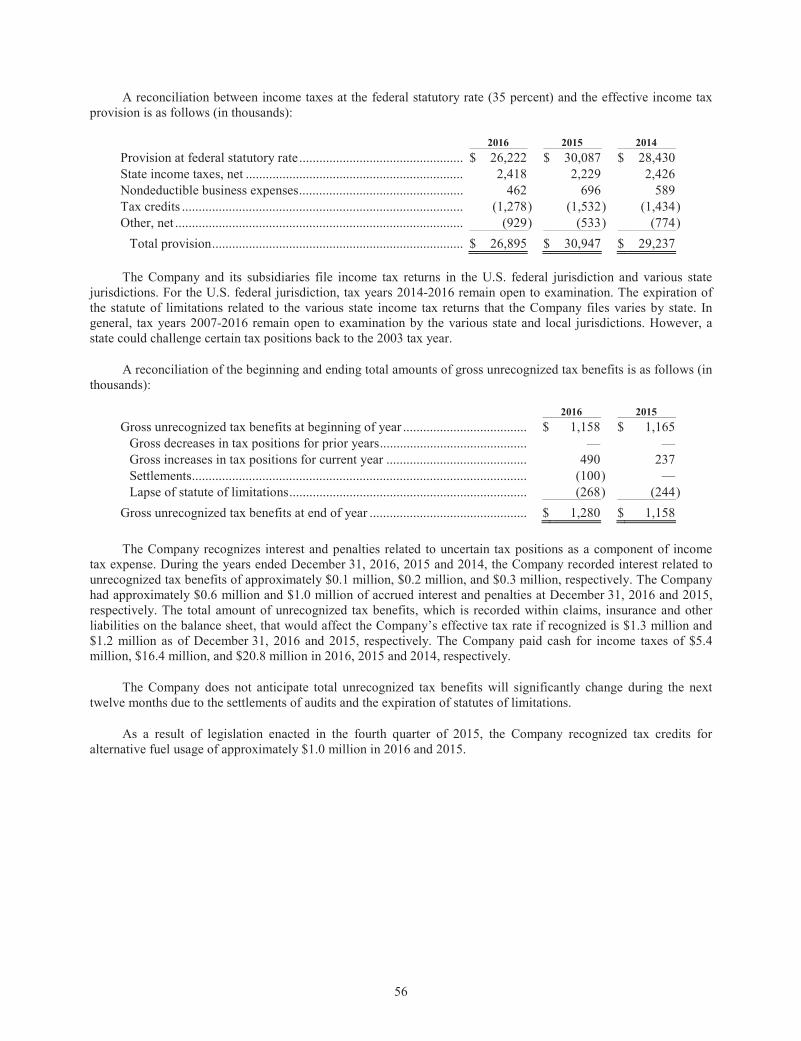
56
A reconciliation between income taxes at the federal statutory rate (35 percent) and the effective income tax provision is as follows (in thousands):
2016 2015 2014 Provision at federal statutory rate ................................................. $ 26,222 $ 30,087 $ 28,430 State income taxes, net ................................................................. 2,418 2,229 2,426 Nondeductible business expenses ................................................. 462 696 589 Tax credits .................................................................................... (1,278) (1,532 ) (1,434)Other, net ...................................................................................... (929) (533 ) (774)
Total provision ........................................................................... $ 26,895 $ 30,947 $ 29,237
The Company and its subsidiaries file income tax returns in the U.S. federal jurisdiction and various state
jurisdictions. For the U.S. federal jurisdiction, tax years 2014-2016 remain open to examination. The expiration of the statute of limitations related to the various state income tax returns that the Company files varies by state. In general, tax years 2007-2016 remain open to examination by the various state and local jurisdictions. However, a state could challenge certain tax positions back to the 2003 tax year.
A reconciliation of the beginning and ending total amounts of gross unrecognized tax benefits is as follows (in thousands):
2016 2015 Gross unrecognized tax benefits at beginning of year ..................................... $ 1,158 $ 1,165
Gross decreases in tax positions for prior years ............................................ — — Gross increases in tax positions for current year .......................................... 490 237 Settlements .................................................................................................... (100 ) — Lapse of statute of limitations ....................................................................... (268 ) (244)
Gross unrecognized tax benefits at end of year ............................................... $ 1,280 $ 1,158
The Company recognizes interest and penalties related to uncertain tax positions as a component of income
tax expense. During the years ended December 31, 2016, 2015 and 2014, the Company recorded interest related to unrecognized tax benefits of approximately $0.1 million, $0.2 million, and $0.3 million, respectively. The Company had approximately $0.6 million and $1.0 million of accrued interest and penalties at December 31, 2016 and 2015, respectively. The total amount of unrecognized tax benefits, which is recorded within claims, insurance and other liabilities on the balance sheet, that would affect the Company’s effective tax rate if recognized is $1.3 million and $1.2 million as of December 31, 2016 and 2015, respectively. The Company paid cash for income taxes of $5.4 million, $16.4 million, and $20.8 million in 2016, 2015 and 2014, respectively.
The Company does not anticipate total unrecognized tax benefits will significantly change during the next twelve months due to the settlements of audits and the expiration of statutes of limitations.
As a result of legislation enacted in the fourth quarter of 2015, the Company recognized tax credits for alternative fuel usage of approximately $1.0 million in 2016 and 2015.

57
10. Summary of Quarterly Operating Results (unaudited)
(Amounts in thousands, except per share data) Three months ended, 2016 March 31 June 30 September 30 December 31 Operating revenue ................................................ $ 289,911 $ 311,905 $ 316,442 $ 300,223 Operating income ................................................. 17,584 21,721 22,644 17,187 Net income ........................................................... 10,575 13,275 13,826 10,348
Basic earnings per share ...................................... $ 0.42 $ 0.53 $ 0.55 $ 0.41
Diluted earnings per share ................................... $ 0.42 $ 0.52 $ 0.54 $ 0.40
Three months ended, 2015 March 31 June 30 September 30 December 31 Operating revenue ................................................ $ 293,022 $ 323,480 $ 317,199 $ 287,610 Operating income ................................................. 21,233 31,281 19,845 17,616 Net income ........................................................... 12,605 19,247 11,777 11,387
Basic earnings per share ...................................... $ 0.51 $ 0.77 $ 0.47 $ 0.46
Diluted earnings per share ................................... $ 0.49 $ 0.75 $ 0.46 $ 0.45
11. Acquisition
On February 2, 2015, the Company acquired 100% of the interests of LinkEx, Inc. (LinkEx), a non-asset third party logistics business based in Dallas, Texas. The Company believes this acquisition is a future growth opportunity for its portfolio of services in the non-asset market. This acquisition fits into the Company’s strategic goal of diversifying Saia’s portfolio of service offerings. Pursuant to the terms of the purchase agreement, the Company paid $22.2 million at the acquisition date with a potential earn-out of up to $3 million subject to meeting profit targets. The Company concluded that LinkEx will not likely meet these profit targets and, thus, did not record a liability related to contingent consideration as of the acquisition date.
During the fourth quarter of 2015, the Company finalized its purchase accounting related to the acquisition of LinkEx as indicated below (in thousands). The goodwill, customer lists and other identifiable intangible assets associated with the acquisition will be deductible for federal and state income tax purposes ratably over a 15 year period. The weighted-average useful life for the identified intangible assets is 14.4 years.
Consideration: Cash, net of cash received ........................................................................................................ $ (22,238)
Fair value of total consideration transferred .......................................................................... $ (22,238)
Acquisition related costs included in SG&A ............................................................................ $ 300 Recognized amounts of identifiable assets acquired and liabilities assumed: Current assets ........................................................................................................................... $ 4,337 Property and equipment ............................................................................................................ 430 Customer lists ........................................................................................................................... 11,300 Other identifiable intangible assets ........................................................................................... 2,300 Other non-current assets ........................................................................................................... 9 Current liabilities ...................................................................................................................... (2,900)Non-current liabilities ............................................................................................................... (32)
Total identifiable net assets assumed ..................................................................................... $ 15,444 Goodwill ................................................................................................................................... 6,794
Total ....................................................................................................................................... $ 22,238
58
Results of LinkEx are included in the accompanying Consolidated Statements of Operations commencing on the date of acquisition. The Company accounted for the acquisition using the acquisition method of accounting, which requires, among other things, that the assets acquired and liabilities assumed be recognized at the acquisition date fair values, with any excess of the consideration transferred over the estimated fair values of the identifiable net assets acquired recorded as goodwill. Goodwill is an asset representing operational synergies and future economic benefits arising from other assets acquired in a business combination that are not individually identified and separately recognized. 12. Valuation and Qualifying Accounts
For the Years Ended December 31, 2016, 2015 and 2014
(in thousands) Additions
Balance,
beginning of period
Charged to costs and expenses
Charged to other accounts
Deductions(1)
Balance, end of period
Year ended December 31, 2016: Deducted from asset account – Allowance for uncollectible
accounts ................................................................................ $ 3,451 $ 1,475 — $ (1,704) $ 3,222Year ended December 31, 2015:
Deducted from asset account – Allowance for uncollectible accounts ................................................................................ 3,868 1,463 — (1,880) 3,451
Year ended December 31, 2014: Deducted from asset account – Allowance for uncollectible
accounts ................................................................................ 3,737 1,942 — (1,811) 3,868
(1) Primarily uncollectible accounts written off — net of recoveries.
59
Item 9. Changes in and Disagreements with Accountants on Accounting and Financial Disclosure
None.
Item 9A. Controls and Procedures
Annual Controls Evaluation and Related CEO and CFO Certifications
As of the end of the period covered by this Annual Report on Form 10-K, the Company conducted an evaluation of the effectiveness of the design and operation of its “disclosure controls and procedures” (Disclosure Controls). The Disclosure Controls evaluation was performed under the supervision and with the participation of management, including the Company’s Chief Executive Officer (CEO) and Chief Financial Officer (CFO).
Based upon the controls evaluation, the Company’s CEO and CFO have concluded that, as of the end of the period covered by this Annual Report on Form 10-K, the Company’s Disclosure Controls are effective to ensure that information the Company is required to disclose in reports that the Company files or submits under the Securities Exchange Act of 1934, as amended (the Exchange Act), is recorded, processed, summarized and reported within the time periods specified in SEC rules and forms.
During the fourth quarter of 2016 covered by this Form 10-K, there were no changes in internal control over financial reporting that materially affected, or that are reasonably likely to materially affect, the Company’s internal control over financial reporting. Attached as Exhibits 31.1 and 31.2 to this Annual Report are certifications of the CEO and the CFO, which are required in accordance with Rule 13a-14 of the Exchange Act. This Controls and Procedures section includes the information concerning the controls evaluation referred to in the certifications and it should be read in conjunction with the certifications.
Definition of Disclosure Controls
Disclosure Controls are controls and procedures designed to ensure that information required to be disclosed in the Company’s reports filed under the Exchange Act is recorded, processed, summarized and reported timely. Disclosure Controls are also designed to ensure that such information is accumulated and communicated to the Company’s management, including the CEO and CFO, as appropriate to allow timely decisions regarding required disclosure. The Company’s Disclosure Controls include components of its internal control over financial reporting which consists of control processes designed to provide reasonable assurance regarding the reliability of the Company’s financial reporting and the preparation of financial statements in accordance with U.S. generally accepted accounting principles.
Limitations on the Effectiveness of Controls
The Company’s management, including the CEO and CFO, does not expect that its Disclosure Controls or its internal control over financial reporting will prevent all errors and all fraud. A control system, no matter how well designed and operated, can provide only reasonable, not absolute, assurance that the control system’s objectives will be met. Further, the design of a control system must reflect the fact that there are resource constraints and the benefits of controls must be considered relative to their costs. Because of the inherent limitations in all control systems, no evaluation of controls can provide absolute assurance that all control issues and instances of fraud, if any, within the Company have been detected. These inherent limitations include the realities that judgments in decision-making can be faulty and that breakdowns can occur because of simple error or mistake. Controls can also be circumvented by the individual acts of some persons, by collusion of two or more people or by management override of the controls. Because of the inherent limitations in a cost-effective control system, misstatements due to error or fraud may occur and not be detected.
60
Management’s Report on Internal Control Over Financial Reporting
The management of Saia, Inc. and its subsidiaries is responsible for establishing and maintaining adequate internal control over financial reporting, as such term is defined in Rule 13a-15(f) of the Securities Exchange Act of 1934.
All internal control systems, no matter how well designed, have inherent limitations. Therefore, even those systems determined to be effective can provide only reasonable assurance with respect to financial statement preparation and presentation. Because of its inherent limitations, internal control over financial reporting may not prevent or detect misstatements. Projections of any evaluation of effectiveness to future periods are subject to the risk that controls may become inadequate because of changes in conditions, or that the degree of compliance with the policies or procedures may deteriorate.
The Company’s management assessed the effectiveness of the Company’s internal control over financial reporting as of December 31, 2016. In making this assessment, the Company’s management used the criteria established in Internal Control — Integrated Framework (2013) issued by the Committee of Sponsoring Organizations of the Treadway Commission (COSO). The Company’s assessment included a review of the documentation of controls, evaluation of the design effectiveness of controls and testing of the effectiveness of controls. Based on this assessment, management has concluded that as of December 31, 2016, the Company’s internal control over financial reporting is effective based on those criteria.
The Company’s independent registered public accounting firm, KPMG LLP, has issued an attestation report on the Company’s internal control over financial reporting as of December 31, 2016, which report appears on page 39 of this Form 10-K.
Richard D. O’Dell President and Chief Executive Officer Frederick J. Holzgrefe, III Vice President and Chief Financial Officer (Principal Financial Officer)
Item 9B. Other Information
None.
PART III.
Item 10. Directors, Executive Officers and Corporate Governance
Information required by this Item 10 will be presented in the Company’s definitive proxy statement for its annual meeting of stockholders, which will be held on April 27, 2017, and is incorporated herein by reference. Certain information regarding executive officers of Saia is included above in Part I of this Form 10-K under the caption “Executive Officers” pursuant to Instruction 3 to Item 401(b) of Regulation S-K and General Instruction G(3) of Form 10-K.
Item 11. Executive Compensation
Information regarding executive compensation will be presented in the Company’s definitive proxy statement for its annual meeting of stockholders, which will be held on April 27, 2017, and is incorporated herein by reference.
Item 12. Security Ownership of Certain Beneficial Owners and Management and Related Stockholder Matters
Information regarding security ownership of certain beneficial owners and management and related stockholder matters will be presented in the Company’s definitive proxy statement for its annual meeting of stockholders, which will be held on April 27, 2017, and is incorporated herein by reference.
61
Item 13. Certain Relationships and Related Transactions, and Director Independence
Information regarding certain relationships, related party transactions and director independence will be presented in the Company’s definitive proxy statement for its annual meeting of stockholders, which will be held on April 27, 2017, and is incorporated herein by reference.
Item 14. Principal Accountant Fees and Services
Information regarding accounting fees and services will be presented in the Company’s definitive proxy statement for its annual meeting of stockholders, which will be held on April 27, 2017, and is incorporated herein by reference.
PART IV.
Item 15. Exhibits, Financial Statement Schedules
1. Financial Statements
The consolidated financial statements required by this item are included in Part II, Item 8, “Financial Statements and Supplementary Data” herein.
2. Financial Statement Schedules
The Schedule II — Valuation and Qualifying Accounts information is included in Note 12 to the consolidated financial statements contained herein. All other financial statement schedules have been omitted because they are not applicable.
3. Exhibits
See the Exhibit Index immediately following the signature page of this Annual Report on Form 10-K for the year ended December 31, 2016.

62
SIGNATURE
Pursuant to the requirements of Section 13 or 15 (d) of the Securities Exchange Act of 1934, the registrant has duly caused this report to be signed on its behalf by the undersigned thereunto duly authorized. SAIA, INC. Date: February 24, 2017 By: /s/ Frederick J. Holzgrefe, III
Frederick J. Holzgrefe, III Vice President of Finance and Chief Financial Officer
Pursuant to the requirements of the Securities Exchange Act of 1934, this report has been signed below by the
following persons on behalf of the registrant and in the capacities and on the dates indicated.
Signature Title Date
/s/ Richard D. O’Dell President and Chief Executive Officer, Saia, Inc. February 24, 2017Richard D. O’Dell
/s/ Frederick J. Holzgrefe, III Vice President of Finance and Chief Financial February 24, 2017Frederick J. Holzgrefe, III Officer, Saia, Inc. (Principal Financial Officer)
/s/ Stephanie R. Maschmeier Controller, Saia, Inc. (Principal Accounting Officer) February 24, 2017Stephanie R. Maschmeier
/s/ Herbert A. Trucksess, III Chairman, Saia, Inc. February 24, 2017Herbert A. Trucksess, III
/s/ William F. Evans Director February 24, 2017William F. Evans
/s/ John P. Gainor, Jr. Director February 24, 2017John P. Gainor, Jr.
/s/ John J. Holland Director February 24, 2017John J. Holland
/s/ Randolph W. Melville Director February 24, 2017Randolph W. Melville
/s/ Bjorn E. Olsson Director February 24, 2017Bjorn E. Olsson
/s/ Douglas W. Rockel Director February 24, 2017Douglas W. Rockel
/s/ Jeffrey C. Ward Director February 24, 2017Jeffrey C. Ward
63
EXHIBIT INDEX Exhibit Number Description of Exhibit
3.1
Restated Certificate of Incorporation of Saia, Inc., as amended (incorporated herein by reference to Exhibit3.1 of Saia, Inc.’s Form 8-K (File No. 0-49983) filed on July 26, 2006).
3.2
Amended and Restated By-laws of Saia, Inc., as amended (incorporated herein by reference to Exhibit 3.1 of Saia, Inc.’s Form 8-K (File No. 0-49983) filed on July 29, 2008).
3.3
Certificate of Elimination filed with the Delaware Secretary of State on December 16, 2010 (incorporatedherein by reference to Exhibit 3.1 of Saia, Inc.’s Form 8-K (File 0-49983) filed on December 20, 2010).
10.1
Master Separation and Distribution Agreement between Yellow Corporation (n/k/a Yellow WorldwideInc.) and Saia, Inc. dated as of September 30, 2002 (incorporated herein by reference to Exhibit 10.3 of Saia, Inc.’s Form 10-Q (File No. 0-49983) for the quarter ended September 30, 2002).
10.2.1
Fourth Amended and Restated Credit Agreement, dated as of November 30, 2011, by and among Saia, Inc.,BOKF, NA dba Bank of Oklahoma, N.A., as Administrative Agent, Collateral Agent and Joint LeadArranger, SunTrust Bank, as Documentation Agent, SunTrust Robinson Humphrey, Inc., as Joint LeadArranger, and the Banks named therein (incorporated herein by reference to Exhibit 10.1 of Saia’s Form 8-K (File No. 0-49983) filed on December 6, 2011).
10.2.2
First Amendment To Fourth Amended and Restated Credit Agreement, dated as of June 28, 2013, by andamong Saia, Inc., BOKF, NA dba Bank of Oklahoma, N.A., as Administrative Agent and Collateral Agent, and the Banks named therein (incorporated herein by reference to Exhibit 10.1 of Saia, Inc.’s Form 8-K (File No. 0-49983) filed on July 5, 2013).
10.2.3
Fifth Amended and Restated Credit Agreement, dated as of March 6, 2015, by and among Saia, Inc., BOKF, NA dba Bank of Oklahoma, N.A., as Administrative Agent and Collateral Agent, and the Banksnamed therein (incorporated herein by reference to Exhibit 10.1 of Saia, Inc.’s Form 8-K (File No. 0-49983) filed on March 9, 2015).
10.3.1
Amended and Restated Master Shelf Agreement dated as of June 26, 2009, between Saia, Inc., PrudentialInvestment Management, Inc., The Prudential Insurance Company of America, Pruco Life InsuranceCompany and the Purchasers named therein (incorporated herein by reference to Exhibit 10.2 of Saia, Inc.’s Form 8-K (File No. 0-49938) filed on June 30, 2009).
10.3.2
First Amendment to Amended and Restated Master Shelf Agreement dated as of December 22, 2009 between Saia Inc., The Prudential Insurance Company of America and the note holders named therein(incorporated herein by reference to Exhibit 10.4 of Saia, Inc.’s Form 8-K (File No. 0-49983) filed on December 22, 2009).
10.3.3
Second Amendment to Amended and Restated Master Shelf Agreement, dated as of November 30, 2011,between Saia, Inc., The Prudential Insurance Company of America and other Noteholders named therein (incorporated herein by reference to Exhibit 10.2 of Saia’s Form 8-K (File No. 0-49983) filed on December 6, 2011).
10.3.4
Third Amendment to Amended and Restated Master Shelf Agreement, dated as of June 28, 2013, betweenSaia, Inc., The Prudential Insurance Company of America and other Noteholders named therein(incorporated herein by reference to Exhibit 10.2 of Saia, Inc.’s Form 8-K (File No. 0-49983) filed on July 5, 2013).
10.3.5
Second Amended and Restated Master Shelf Agreement, dated as of March 6, 2015, between Saia, Inc.,The Prudential Insurance Company of America and other Noteholders named therein (incorporated herein by reference to Exhibit 10.2 of Saia, Inc.’s Form 8-K (File No. 0-49983) filed on March 9, 2015).
10.4
Form of Executive Severance Agreement (incorporated herein by reference to Exhibit 10.9 of Saia, Inc.’s Form 10-K (File No. 0-49983) for the year ended December 31, 2002).*
64
Exhibit Number Description of Exhibit
10.5.1
Employment Agreement between Saia, Inc. and Herbert A. Trucksess, III dated as of November 20, 2002(incorporated herein by reference to Exhibit 10.5 of Saia, Inc.’s Form 10-K (File No. 0-49983) for the year ended December 31, 2002).*
10.5.2
Amendment to Employment Agreement between Saia, Inc. and Herbert A. Trucksess, III dated as ofDecember 4, 2003 (incorporated herein by reference to Exhibit 10.11 of Saia, Inc.’s Form 10-K (File No. 0-49983) for the year ended December 31, 2003).*
10.5.3
Modification of Employment Agreement dated November 20, 2002, as amended, between Saia, Inc. andHerbert A. Trucksess, III dated as of December 7, 2006 (incorporated herein by reference to Exhibit 10.1 of Saia, Inc.’s Form 8-K (File No. 0-49983) filed on December 13, 2006).*
10.5.4
Amendment to Employment Agreement dated as of October 23, 2008 between Saia, Inc. and Herbert A.Trucksess, III (incorporated herein by reference to Exhibit 10.3 of Saia, Inc.’s Form 8-K (File No. 0-49983) filed on October 29, 2008).*
10.6.1
Employment Agreement between Saia, Inc. and Richard D. O’Dell dated as of October 24, 2006(incorporated herein by reference to Exhibit 10.1 of Saia, Inc.’s Form 8-K (File No. 0-49983) filed on October 30, 2006).*
10.6.2
Amendment to Employment Agreement dated as of October 23, 2008 between Saia, Inc. and Richard D. O’Dell (incorporated herein by reference to Exhibit 10.1 of Saia, Inc.’s Form 8-K (File No. 0-49983) filed on October 29, 2008).*
10.6.3 Second Amendment to Employment Agreement dated as of April 1, 2009 between Saia, Inc. and RichardD. O’Dell (incorporated herein by reference to Exhibit 10.1 of Saia’s Form 8-K (File No. 0-49983) filed on April 7, 2009).*
10.7.1
Amended and Restated Executive Severance Agreement between Saia, Inc. and Richard D. O’Dell dated asof October 24, 2006 (incorporated herein by reference to Exhibit 10.3 of Saia, Inc.’s Form 8-K (File No. 0-49983) filed on October 30, 2006).*
10.7.2
Amendment to Amended and Restated Executive Severance Agreement dated as of October 23, 2008between Saia, Inc. and Richard D. O’Dell (incorporated herein by reference to Exhibit 10.4 of Saia, Inc.’s Form 8-K (File No. 0-49983) filed on October 29, 2008).*
10.8
Amendment to Executive Severance Agreement dated as of October 23, 2008 between Saia, Inc. and MarkH. Robinson (incorporated herein by reference to Exhibit 10.7 of Saia, Inc.’s Form 8-K (File No. 0-49983) filed on October 29, 2008).*
10.9
Form of Indemnification Agreement (incorporated by reference to Exhibit 10.2 of Saia, Inc.’s Form 8-K (File No. 0-49983) filed on December 13, 2006).*
10.10.1
Saia, Inc. Amended and Restated 2003 Omnibus Incentive Plan (incorporated by reference to Exhibit 10.29 of Saia, Inc.’s Form 10-K (File No. 0-49983) for the year ended December 31, 2007).*
10.10.2
Amendment to the Saia, Inc. Amended and Restated 2003 Omnibus Incentive Plan (incorporated by reference to Exhibit 10.30 of Saia, Inc.’s Form 10-K (File No. 0-49983) for the year ended December 31, 2007).*
10.10.3
Amendment to the Saia, Inc. Amended and Restated 2003 Omnibus Incentive Plan (incorporated by reference to Exhibit 10.1 of Saia, Inc.’s Form 10-Q (File No. 0-49983) for the quarter ended June 30, 2008).*
10.10.4
Amendment to the Saia, Inc. Amended and Restated 2003 Omnibus Incentive Plan (incorporated byreference to Exhibit 10.1 of Saia’s Form 8-K (File No. 0-49983) filed on February 2, 2011).*
10.11
Form of Performance Unit Award Agreement under the Saia, Inc. Amended and Restated 2003 OmnibusIncentive Plan (incorporated herein by reference to Exhibit 10.18 of Saia Inc.’s Form 10-K (File No. 0-49983) for the year ended December 31, 2009).*
65
Exhibit Number Description of Exhibit
10.12
Restricted Stock Agreement dated February 1, 2008 between Saia, Inc. and Richard D. O’Dell(incorporated by reference to Exhibit 10.1 of Saia, Inc.’s Form 8-K (File No. 0-49983) filed on February 6, 2008).*
10.13
Form of Employee Nonqualified Stock Option Agreement under the SCS Transportation, Inc. Amendedand Restated 2003 Omnibus Incentive Plan (incorporated herein by reference to Exhibit 10.1 of Saia Inc.’s Form 8-K (File No. 0-49983) filed on January 31, 2006).*
10.14
SCS Transportation, Inc. Directors’ Deferred Fee Plan as adopted December 11, 2003 (incorporated hereinby reference to Exhibit 10.15 of Saia, Inc.’s Form 10-K (File No. 0-49983) for the year ended December 31, 2003).*
10.15
First Amended and Restated Saia, Inc. 2011 Omnibus Incentive Plan (incorporated herein by reference toExhibit A of Saia’s Definitive Proxy Statement (File No. 0-49983) filed on March 22, 2013).*
10.16
Form of Employee Nonqualified Stock Option Agreement under the Saia, Inc. 2011 Omnibus IncentivePlan (incorporated herein by reference to Exhibit 10.1 of Saia’s Form 8-K (File No. 0-49983) filed on May 6, 2011).*
10.17
Form of Performance Unit Award Agreement under the Saia, Inc. 2011 Omnibus Incentive Plan(incorporated herein by reference to Exhibit 10.2 of Saia’s Form 8-K (File No. 0-49983) filed on May 6, 2011).*
10.18
Form of Restricted Stock Agreement under the Saia, Inc. 2011 Omnibus Incentive Plan (incorporated herein by reference to Exhibit 10.25 of Saia Inc.’s Form 10-K (File No. 0-49983) for the year ended December 31, 2011).*
10.19
Form of Employee Nonqualified Stock Option Agreement (incorporated herein by reference to Exhibit 10.1 of Saia’s Form 8-K (File No. 0-49983) filed on February 9, 2015).*
10.20
Form of Employee Nonqualified Stock Option Agreement for Richard D. O’Dell (incorporated herein by reference to the executed agreement originally filed as Exhibit 10.2 of Saia’s Form 8-K (File No. 0-49983) filed on February 9, 2015).*
10.21
Form of Employee Nonqualified Stock Option Agreement for Frederick J. Holzgrefe, III (incorporated herein by reference to the executed agreement originally filed as Exhibit 10.3 of Saia’s Form 8-K (File No. 0-49983) filed on February 9, 2015).*
10.22
Form of Severance Agreement (incorporated herein by reference to Exhibit 10.4 of Saia’s Form 8-K (File No. 0-49983) filed on February 9, 2015).*
10.23
Severance Agreement, dated as of February 3, 2015, between Saia, Inc., and Frederick J. Holzgrefe, III(incorporated herein by reference to Exhibit 10.5 of Saia’s Form 8-K (File No. 0-49983) filed on February 9, 2015).*
14.1
Code of Business Conduct and Ethics (incorporated by reference to Exhibit 14.1 of Saia’s Form 10-K (File No. 0-49983) for the year ended December 31, 2014).
21.1 Subsidiaries of Registrant.
23.1 Consent of KPMG LLP, Independent Registered Public Accounting Firm.
31.1 Certification of Principal Executive Officer pursuant to Exchange Act Rule 13a-15(e).
31.2 Certification of Principal Financial Officer pursuant to Exchange Act Rule 13a-15(e).
32.1
Certification of Principal Executive Officer, furnished pursuant to 18 U.S.C. Section 1350, as adopted pursuant to Section 906 of the Sarbanes-Oxley Act of 2002.
32.2
Certification of Principal Financial Officer, furnished pursuant to 18 U.S.C. Section 1350, as adopted pursuant to Section 906 of the Sarbanes-Oxley Act of 2002.
66
Exhibit Number Description of Exhibit
101
The following financial information from Saia, Inc.’s Annual Report on Form 10-K for the year ended December 31, 2016, formatted in XBRL (Extensible Business Reporting Language) includes: (i)Consolidated Balance Sheets as of December 31, 2016 and 2015, (ii) Consolidated Statements of Operations for the years ended December 31, 2016, 2015 and 2014, (iii) Consolidated Statements of Stockholders’ Equity for the years ended December 31, 2016, 2015 and 2014, (iv) Consolidated Statements of Cash Flows for the years ended December 31, 2016, 2015 and 2014, and (v) the Notes to the Consolidated Financial Statements.
* Management contract or compensatory plan or arrangement.

(This page intentionally left blank)

(This page intentionally left blank)
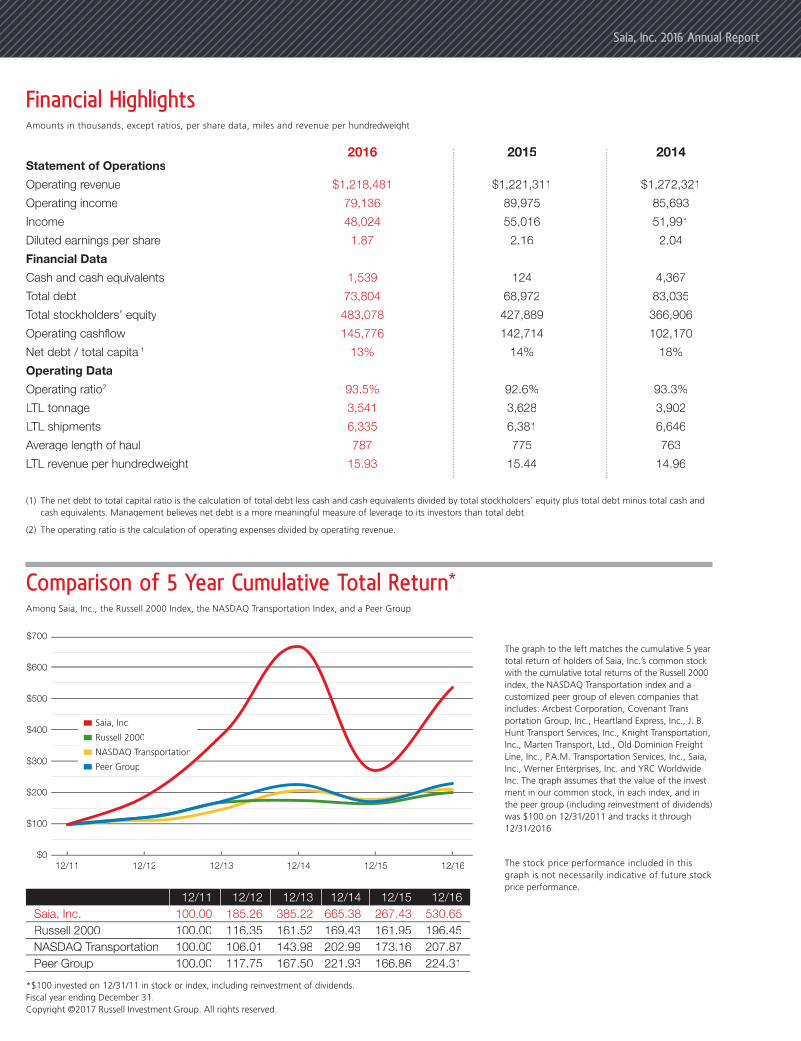
Saia, Inc. 2016 Annual Report
*$100 invested on 12/31/11 in stock or index, including reinvestment of dividends.Fiscal year ending December 31.Copyright ©2017 Russell Investment Group. All rights reserved.
12/11 12/12 12/13 12/14 12/15 12/16
Saia, Inc. 100.00 185.26 385.22 665.38 267.43 530.65
Russell 2000 100.00 116.35 161.52 169.43 161.95 196.45
NASDAQ Transportation 100.00 106.01 143.98 202.99 173.16 207.87
Peer Group 100.00 117.75 167.50 221.93 166.86 224.31
Financial HighlightsAmounts in thousands, except ratios, per share data, miles and revenue per hundredweight
2016 2015 2014Statement of Operations
Operating revenue $1,218,481 $1,221,311 $1,272,321
Operating income 79,136 89,975 85,693
Income 48,024 55,016 51,991
Diluted earnings per share 1.87 2.16 2.04
Financial Data
Cash and cash equivalents 1,539 124 4,367
Total debt 73,804 68,972 83,035
Total stockholders’ equity 483,078 427,889 366,906
Operating cashflow 145,776 142,714 102,170
Net debt / total capital1 13% 14% 18%
Operating Data
Operating ratio2 93.5% 92.6% 93.3%
LTL tonnage 3,541 3,628 3,902
LTL shipments 6,335 6,381 6,646
Average length of haul 787 775 763
LTL revenue per hundredweight 15.93 15.44 14.96
(1) The net debt to total capital ratio is the calculation of total debt less cash and cash equivalents divided by total stockholders’ equity plus total debt minus total cash andcash equivalents. Management believes net debt is a more meaningful measure of leverage to its investors than total debt.
(2) The operating ratio is the calculation of operating expenses divided by operating revenue.
Comparison of 5 Year Cumulative Total Return*
Among Saia, Inc., the Russell 2000 Index, the NASDAQ Transportation Index, and a Peer Group
The graph to the left matches the cumulative 5 yeartotal return of holders of Saia, Inc.’s common stockwith the cumulative total returns of the Russell 2000index, the NASDAQ Transportation index and acustomized peer group of eleven companies thatincludes: Arcbest Corporation, Covenant Trans-portation Group, Inc., Heartland Express, Inc., J. B.Hunt Transport Services, Inc., Knight Transportation,Inc., Marten Transport, Ltd., Old Dominion FreightLine, Inc., P.A.M. Transportation Services, Inc., Saia,Inc., Werner Enterprises, Inc. and YRC WorldwideInc. The graph assumes that the value of the invest-ment in our common stock, in each index, and inthe peer group (including reinvestment of dividends) was $100 on 12/31/2011 and tracks it through12/31/2016.
The stock price performance included in thisgraph is not necessarily indicative of future stock price performance.
12/11 12/12 12/13 12/14 12/15 12/16
$700
$600
$500
$400
$300
$200
$100
$0
Saia, Inc.
Russell 2000
NASDAQ TransportationNASDAQ Transportation
Peer Group
saia.com
Corporate Headquarters11465 Johns Creek Parkway
Suite 400
Johns Creek, GA 30097
Tel: 800.765.7242
Fax: 770.232.4066
NASDAQ SymbolSAIA
Independent Registered Public Accounting FirmKPMG LLP
303 Peachtree Street, N.E.
Suite 2000
Atlanta, GA 30308
Transfer Agent and RegistrarComputershare Trust Company, N.A.
250 Royall Street
Canton, MA 02021
Tel: 800.884.4225
www.computershare.com
Annual MeetingApril 27, 2017 at
10:30 a.m. (ET)
Renaissance Concourse
Atlanta Airport Hotel
One Hartsfield Centre Parkway
Atlanta, GA 30354
Investor Information11465 Johns Creek Parkway
Suite 400
Johns Creek, GA 30097
Tel: 800.765.7242
Fax: 678.542.3916
Email: [email protected]
Corporate Websitewww.saiacorp.com