Embed Size (px)
Citation preview
TVCG SUBMISSION 1
GEViTRec: Data Reconnaissance ThroughRecommendation Using a Domain-Specific
Visualization Prevalence Design SpaceAnamaria Crisan, Shannah E. Fisher, Jennifer L. Gardy, and Tamara Munzner, Senior Member, IEEE
Abstract—Genomic Epidemiology (genEpi) is a branch of public health that uses many different data types including tabular, network,genomic, and geographic, to identify and contain outbreaks of deadly diseases. Due to the volume and variety of data, it is challengingfor genEpi domain experts to conduct data reconnaissance; that is, have an overview of the data they have and make assessmentstoward its quality, completeness, and suitability. We present an algorithm for data reconnaissance through automatic visualizationrecommendation, GEViTRec. Our approach handles a broad variety of dataset types and automatically generates visually coherentcombinations of charts, in contrast to existing systems that primarily focus on singleton visual encodings of tabular datasets. Weautomatically detect linkages across multiple input datasets by analyzing non-numeric attribute fields, creating a data source graphwithin which we analyze and rank paths. For each high-ranking path, we specify chart combinations with positional and coloralignments between shared fields, using a gradual binding approach to transform initial partial specifications of singleton charts tocomplete specifications that are aligned and oriented consistently. A novel aspect of our approach is its combination ofdomain-agnostic elements with domain-specific information that is captured through a domain-specific visualization prevalence designspace. Our implementation is applied to both synthetic data and real Ebola outbreak data. We compare GEViTRec’s output to whatprevious visualization recommendation systems would generate, and to manually crafted visualizations used by practitioners. Weconducted formative evaluations with ten genEpi experts to assess the relevance and interpretability of our results.
Code, Data, and Study Materials Availability: https://github.com/amcrisan/GEVitRec
Index Terms—Heterogeneous Data, Multiple Coordinated Views, Data Reconnaissance, Bioinformatics.
F
1 INTRODUCTION
DATA reconnaissance is the process of exploring a groupof datasets that are not yet understood by a specific
person; we recently defined data recon and proposed an iter-ative four-stage process of acquire, view, assess, pursue as aconceptual framework to reason about it [1]. Although thevisualization literature covers many systems designed forinvestigative exploration, where a specific existing datasetis transformed and analyzed in depth, the goal of veryquickly understanding potential linkages between unfamil-iar datasets remains difficult when using existing systems.
We posit that visualization recommendation systemshave great promise for operationalizing the goal of datarecon through a concrete algorithm that quickly and auto-matically computes reasonable visual encodings with mini-mal input from a user. A recommender system could speedup the view stage of the data recon process, in contrast toany kind of design or selection process for visual encodingthat involves human judgement. The aim of data recon is toquickly assess whether the current collection of datasets issuitable for some intended analysis question, and if not to
• A. Crisan is with Tableau Research. Email: [email protected].
• S. Fisher and T. Munzner are with the University of British Columbia.Email: [email protected], [email protected].
• J. Gardy is with the Gates Foundation. Email: [email protected]
Manuscript received September 15, 2020; revised 14 July 2021.
pursue additional data. After the recon process concludeswhen an appropriate collection of datasets has been ac-quired, a more lengthly analysis process with traditionalinvestigative exploration visualization tools could occur.
Prior work takes a one-size-fits-all approach based solelyon domain-agnostic perceptual effectiveness rankings, fromthe foundational APT system [2] to Tableau’s ShowMe [3]to recent activity including Voyager [4] and Draco [5]. Suchsystems can help users rapidly understand their datasetsby automatically suggesting suitable encodings based ondata characteristics and the efficacy of different chart types.However, these systems primarily focus on encoding asingle dataset of tabular data type. They fall short for twokey requirements for the data recon use case: the ability toboth find and show linkages between multiple datasets, andthe ability to handle a broad variety of data types as inputand a broad variety of chart types as output.
A novel feature of our approach is that we tailor therecommendation for a specific domain, to tame the combi-natorial explosion of possibilities that arise from a broadvariety of input data types and output chart types. Weleverage the knowledge encapsulated in a recent domain-specific visualization prevalence design space (VPDS), wherevisual design collections used by experts in a particulardomain are both characterized and enumerated [6]. We usethis domain-specific information in a few targeted stagesof our recommender algorithm, in conjunction with manydomain-agnostic decision procedures. The GEViT [6] VPDS
TVCG SUBMISSION 2
that we proposed in previous work arises from genomicepidemiology (genEpi), a very appropriate exemplar domainfor data recon with a diverse and heterogeneous set of inputdata types and output chart types; genEpi analysts oftengrapple with unfamiliar collections of datasets in situationswhere access is tightly controlled due to sensitive personallyidentifiable information.
The main contribution of our work is the design andimplementation of GEViTRec, an end-to-end recommenderalgorithm to support the data recon process that computespotential linkages between datasets and automatically gen-erates visually coherent combinations of charts to illustratethem. The visual coherence between charts is achievedthrough an automatic coordination of positional and colorencoding channels of the individual charts. The resultingspecification is rendered into a single static image of thevisually coherent combination that allows the linkages be-tween data sources to be immediately perceived, withoutrequiring any kind of time-consuming interactive explo-ration [7]. Many stages of our proposed recommender al-gorithm feature domain-agnostic computations while somestages leverage domain-specific prevalence information. Wevalidate our approach by comparing our results to existinggenEpi visualization dashboards created by careful humancuration. We also conducted an evaluative interview studywith ten genEpi experts to verify the interpretability andutility of GEViTRec’s results.
2 DOMAIN-SPECIFIC PREVALENCE FOR GENOMICEPIDEMIOLOGY
Visualization has historically been a prominent componentof epidemiological research and practice since John Snow’sfamous 1854 cholera map. More recently there has beenan influx of new, heterogeneous, and multidimensionalsources of data, including whole genome sequencing dataand pulsed-field gel electrophoresis for DNA fingerprint-ing, that has birthed a new field: genomic epidemiology(genEpi) [8]. Genomic data can be difficult to integrate withother data sources, including tabular data from electronichealth records, network data from contact tracing, and spa-tial data [9], [10]. The volume and variety of data at playin the genEpi domain make it an excellent exemplar for theutility of a domain-specific visualization prevalence designspace in a proof-of-concept system. Moreover, there is aclear need for data recon in genEpi analysis contexts. Thesensitivity of clinical health data leads to stringent accesscontrols, so multiple rounds of acquire, view, assess, andpursue are often required to gather the requisite collectionof datasets to answer any specific analysis question. Also,epidemiological analysis frequently takes place in an urgentcontext, particularly in pandemic times.
2.1 Genomic Epidemiology Visualization Typology
Our prior study characterized and enumerated a domain-specific data visualization collection assembled in such away so as to be reflective of visualization designs cur-rently used by genEpi experts [6]. It proposed a GenomicEpidemiology Visualization Typology (GEViT) that brokedown how visualizations were constructed through chart
types, enhancements, and combinations. The typology en-compasses 25 unique chart types grouped within 8 cate-gories (common statistical charts, color, relational, temporal,spatial, tree, genomic, and other), four types of chart com-binations (positionally aligned, color aligned, small mul-tiples, and unaligned), and two primary mechanisms ofenhancements (adding or re-encoding marks). GEViT wasdeveloped using a corpus of approximately 18,000 researcharticles pertaining to genomic epidemiology that was rep-resentatively sampled to yield a set of 800 figures thatinformed the typology generation. Text mining techniqueswere applied to the titles and abstracts of all articles toderive a notion of the creation context for the sampledset of figures, so that connections between different datatypes and domain-specific attributes to data visualizationsin the form of individual charts and chart combinationscould be harvested. Most importantly, the representativesampling strategy also enabled the enumeration of thesedifferent visual design collections, providing a quantitativemeasure of their relevance and importance to genEpi. TheGEViT collection also captures the year of use, providinglongitudinal data about how and whether approaches todata visualization design might change over time.
This information exactly constitutes a domain-specificvisualization prevalence design space (VPDS), although thatspecific term is introduced here and was not used that work.
2.2 Visualization Prevalence Design Spaces
The fundamental idea behind our approach is to injectdomain relevance into a visualization recommendation al-gorithm based on an analysis of the visualization designspace in use in that domain. The term design space is usedbroadly within the visualization research literature withmany shades of meaning, and the GEViT approach that weleverage is one of many possible strategies for generating avisualization design space. The collection of visualizationsassembled in the GEViT study was categorized along threecross-cutting axes to delineate a design space: chart types,chart combinations, and encoding enhancements.
Our approach has a similar spirit to the pioneering workby Card and Mackinlay to capture the structure of a visual-ization design space [11] by breaking down visual encodingchoices along cross-cutting axes. A difference is that we gen-erated a typology, whereas they defined visual vocabulary.Another interesting divergence is that Card and Mackinlaytook a deductive approach, defining a vocabulary first andthen using it to characterize a visualization design space;through GEViT we took an inductive approach starting withthe analysis and characterization of existing visualizationsand using that to construct our descriptive typology, and byextension the design space. Other examples of design spacesinclude SetVis [12] and TreeVis [13], focused on specific datatypes.
One very valuable property of the GEViT approach isthat it captures visualizations made from many data typesand with many different systems, crucially including man-ual post-processing adjustments made by users with imagecreation and processing tools. Design spaces derived fromanalyzing visualizations made with only a single system,such as Tableau Public [14] or ManyEyes [15], would not
TVCG SUBMISSION 3
capture such a broad diversity of visualization designs andtheir prevalence. Also, in contrast to these other designspace examples, the construction of a design space viathe sampling approach of GEViT allows us actually derivecomputable metrics from prevalence data, which we can useas inputs to visualization recommendation.
To differentiate our approach from past work, we definea domain-specific design space as the result of analyzing acollection of visual encodings that are produced by experts insome domain. We define a domain-specific visualization preva-lence design space, or just (VPDS), as one that both capturesthe full scope (within reason) of visual encodings used bysome definable set of experts and includes a quantitativeestimate for prevalence of different visual encoding strate-gies within the domain. We use this quantitative prevalenceinformation in our algorithm to derive relevance scores fordifferent visual encodings. We leverage the genEpi VPDSfrom the GEViT study in our proposed recommendationalgorithm; the extension of our prior design space workto recommendation systems is a novel contribution of ourpresent work, and it can transfer to domains beyond genEpi.
The specific implementation of the GEViT design spacedraws visualizations from research articles, which are aninstance of expert-to-expert presentation. We posit that sucha design space is nevertheless suitable for generating visu-alization recommendations. First, we can frame a recom-mendation algorithm as making choices of how to presentdata to experts to facilitate data recon. Second, even if datarecon is considered closer to exploration than presentation,the overlap between design spaces for presentation andexploration is very substantial [16].
2.3 The Importance of Visual Cohesiveness
The quantification from the GEViT VPDS allowed us to ob-serve the high prevalence of using shared position and colorchannels to encode common information. The design spaceaxis of chart combinations categorizes these approaches aspositional and color chart combinations (see Section 2.1).Instituting a visual cohesiveness across multiple chart typesthrough the process of coordinating these encoding channelswas a common practice, and we hypothesize it requiredsignificant manual labour.
The importance of ensuring visual coherence betweenmultiple static charts, a scenario that represents a large por-tion of real-world use of data visualization, has been docu-mented by multiple authors [6], [17], [18], [19]. However, theuse and construction of static views has been understudiedby the research community [20]. Instead, coordination hascome to connote interactive techniques that link across charttypes, which excludes other important methods for showingrelationships between charts, such as layouts with sharedpositional axes. Although there are many ways that inter-action can complement data visualizations [21], interactiveapproaches do have notable limitations such as technicaland perceptual costs [7], [22]. For example, Battle et al. [23]found that specific types of interactions involved in reason-ing about data can have high costs. Moreover, even whenpresent, interaction capabilities are not always discovered orused [24]. While these limitations do not negate the benefitsof interaction, they do suggest we take the opportunity to
consider alternative and complementary modes for coordi-nating information between charts that do not rely primarilyon interaction. Here, we use the terminology of visuallycoherent chart combinations to reflect the visual coordinationof shared information between charts with respect to layoutand consistency among visual channels, and to differentiatefrom the term coordinated views that may imply the use ofinteraction techniques.
Despite the heavy focus of the visualization researchcommunity on interaction as a means for coordinatingshared information between multiple charts, prior researchdoes suggest many benefits from coordinated layouts. Forexample, juxtaposed or superimposed charts have beendeemed useful for comparison [17]. Kehre et al. [25] sim-ilarly demonstrated the importance of coordinated visualmapping accomplished via shared axes or color paletteson a single chart, a process they called data fusion, along-side interaction techniques for heterogeneous data. L’Yi etal. [18] also found that visually linking charts via juxtaposedlayouts helped people orient themselves in a visualizationeven when systems had affordances for interactive linking ofviews. This prior work echoes findings by Qu et. al [19] whoalso demonstrated the importance of coordinating visual in-formation between charts to keep multiple views consistent.While this research emphasizes the importance of visualcohesiveness, it does not address the challenges of creatingvisually coherent chart combinations across multiple datasources. This challenge is especially salient in genEpi, wherestatic means of reporting findings, either through publi-cations or through electronic health records [10] precludereaping the benefits of interaction. Here, we take up thischallenge by examining how to create visually coherentchart combinations, through leveraging the VPDS. We notethat visual coherence and interaction are complementaryapproaches rather than a mutually exclusive dichotomy. Wefocus on the former, to advance the state of art for the auto-matic support of visual coherence through non-interactivechart-wise coordination; despite evidence of its potentialutility, the problem of providing automatic support for ithas been largely overlooked in previous work.
3 RELATED WORK
We survey related work on visualisation recommendation,on integrating and visualizing heterogenous data, and onchart coordination and combinations.
3.1 Visualization Recommendation
Automated recommendations of visual encodings are away to help users explore datasets, and have been pur-sued by both the research and practitioner communities.A number of visualization recommender systems use rulebased approaches that generate recommendations with thecombination of a user’s specifications and the types of dataattributes (i.e. numeric, categorical, and nominal) [2]. TheShowMe [3] and Voyager [4], [26] systems also rank visualencodings according to manually predetermined scores ofgraphical perception efficacy; highest ranked visualizationsare prioritized and shown to the user, while lower rankedvisualizations are accessible through interactions with the

TVCG SUBMISSION 4
data visualization systems. Draco takes this ranking ap-proach further by learning the efficacy scores automaticallyfrom the results of graphical perception experiments [5].
Beyond perceptual ranking of visualizations, other toolshave also explored leveraging the properties of the data torecommend visualizations. Zenvisage [27] allows users toquickly generate and curate a set of visualizations, and pro-poses the ZQL language to algebraically express visual pat-terns in hopes of making it easier to explore data. The ZQLlanguage is complementary to the VizQL and COMPASS-QL languages the underlie the specification, used in theShowMe and Voyager/Draco systems respectively.
SeeDB [28] proposes a mechanism for surfacing high-utility visualizations based upon user queries and the se-lection of a set of views with high variances; that is, theyuse a measure of deviation from a baseline to return viewsthat represent a diverse view of the data. Our research issimilarity interested in capturing a diversity of views, butunlike SeeDB we anchor our recommendations on diversityof data types as opposed to singleton view distributions.The VizDeck [29] system also leverages statistical propertiesof the data to recommend visualizations. Further, VizDeckuses the card metaphor to allow users to manually constructmultiple views of the data. Foresight [30] treats visualizationrecommendation as a optimization over an insight searchspace; it builds upon earlier Rank-by-Feature [31] and Auto-Vis [32] approaches, which propose mechanisms for users tosteer the ranking of automatically generated visualizations.
More recent systems, such as Data2Vis [33] andVizML [34], also attempt to learn the associations betweendifferent types of data and visual encodings. Both systemsanalyze datasets themselves, not just attribute types, anddiscover the kinds of associations that users generate “in thewild” from publicly available resources. These learned asso-ciations are then used to automatically generate data visual-izations. Another class of prior systems attempt to developa semantic understanding of data and use this knowledgein the recommendation processes, including SemViz [35]and Cammarano’s schema matching technique [36]. Suchtechniques have not been expanded upon, likely due tothe difficulties of developing and maintaining ontologies.A final class of systems attempts to infer user preferencesvia collaborative filtering [37].
These various approaches are not mutually exclusiveand can be combined. While we take inspiration from thesesystems, all of them are limited to recommending visual-izations for essentially a single source of tabular data. Ourtechnique extends beyond their capabilities in supportinga wider variety of data types and visual encodings, andin supporting the automatic creation of visually coherentcombinations of visual encodings.
3.2 Integrating and Visualizing Heterogeneous Data
Heterogeneous data sources can be challenging for analyststo work with because they mix different data types such astrees, tabular, and spatial data. Graph data structures haveemerged as a primary means of integrating and visualizingthese diverse data. Initial work by Cammarano et al. [36]demonstrated the utility of these techniques for semanticweb data. More recent work by Kairam et al. [38] and
Xie et al. [39] demonstrates the utility of this approachfor other data types. The Refinery system proposed byKairam et al. [38] goes further to demonstrate how graphstructures can be used to support associative browsing thatcan help a user drill down to a data point of interest quickly.However, these approaches supporting heterogeneous datahave not been applied to biomedical data, where systems areconstrained to pre-existing views of the data. For example,Angelelli et al. [40] demonstrate how users can interactivelyexplore heterogeneous data from patient records along with3D spatial MRI images and Lineage [41] integrates bothtree and tabular data. The primary limitation of such toolsis only allowing users to integrate a limited set of datasources. The Domino system [42] straddles the bespokevisualization requirements of biomedical data with someof the graph-based integration requirements. From a singlesource dataset, Domino allows analysts to generate linkedviews of multiple subsets by allowing the user to generate‘subset blocks’ and then linking these blocks according tothe strength of their associations.
There are also many options for integrating and vi-sualizing genomic epidemiology data specifically. GenEpistakeholders can currently either develop their own solo orcombined data visualizations using one of several chartinglibraries, or can use previously curated visualizations inpublicly deployed dashboards and other interactive sys-tems. We identified the charting libraries in common use:TreeViewer (stand-alone, [43]), Baltic (python, [44]), ape (R,[45]), ggplot (R, [46]), and ggtree (R, [47]). Since manuallygenerating data visualizations is a time consuming andpotentially wasteful activity in the midst of serious epi-demiological crises, people have also developed interactivesystems and dashboards with manually pre-curated setsof visualizations that are updated as outbreaks evolve. Wehave identified Nextstrain [48] and Microreact [49] as twosuch widely used and state of the art systems, and comparethe results of GEViTRec to them.
While all of these tools support the integration andvisualization of heterogeneous data, these systems still placea major burden on the analyst to provide systems with speci-fications for generating visualizations. We seek to lower thisburden by integrating and visualizing heterogeneous datasources with minimal specifications from users.
3.3 Chart Coordination and CombinationCoordinating shared information amongst different chartsis essential for visualization of many data types includingbiomedical data [25], [50]. Coordinated visual encodingsare beneficial for highlighting shared attributes across acollection of datasets. Substantial previous work is devotedto interactive methods for linking views through sharedinformation, particularly for juxtaposed views with linkedhighlighting [16], [51]. Visualization authoring systems in-cluding Improvise [52], Lyra [53], Data Illustrator [54], andCharticulator [55] and visualization libraries like D3 [56],ggplot [46], and Vega [57] (which underpins both Draco andVoyager) are able to support visually coherent combinationsof charts, including small multiples, aligned color palettes,and unaligned combinations. It is possible to generate andmanually coordinate single charts with commercial applica-tions such as Tableau, PowerBI, or Excel.
TVCG SUBMISSION 5
Despite the flexibility and popularity of manual coordi-nation of static charts for visual coherence, and prior workon grammars for facilitating visually coherent combinationssuch as HiVE [58] and ATOM [59], constructing effectivecombinations automatically remains a challenging proposi-tion in practice [19]. No prior visualization recommendationsystems attempts to do so; GEViTRec treats visually coher-ent combinations as first class citizens with full support.
To facilitate a consistent interface for combining visuallycoherent charts, our recommendation algorithm includes aspecification syntax inspired by the GEViT [6] typology.
4 RECOMMENDATION ALGORITHM
Algorithm 1 GEViTRec (H , D, A, T , Fusers)Input: Datasets H , Design Space D, Alignable Positional
Combinations (A), Chart Templates T , User SpecifiedFields Fusers
1: (F,M)← explodeFields(H)2: G← generateDataSourceGraph(F )3: Rp ← rankPaths(G,D)4: V← generateVisSpecs(Rp,M, F, Fusers, A, T )5: layoutAndRender(V )
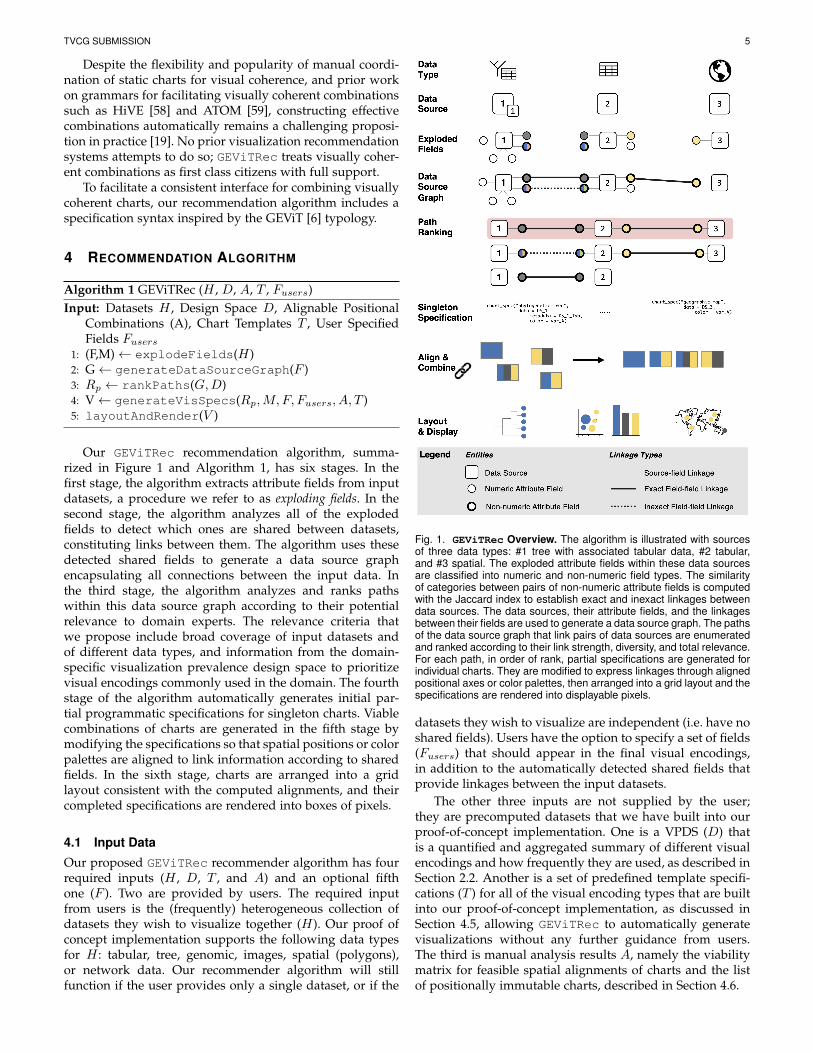
Our GEViTRec recommendation algorithm, summa-rized in Figure 1 and Algorithm 1, has six stages. In thefirst stage, the algorithm extracts attribute fields from inputdatasets, a procedure we refer to as exploding fields. In thesecond stage, the algorithm analyzes all of the explodedfields to detect which ones are shared between datasets,constituting links between them. The algorithm uses thesedetected shared fields to generate a data source graphencapsulating all connections between the input data. Inthe third stage, the algorithm analyzes and ranks pathswithin this data source graph according to their potentialrelevance to domain experts. The relevance criteria thatwe propose include broad coverage of input datasets andof different data types, and information from the domain-specific visualization prevalence design space to prioritizevisual encodings commonly used in the domain. The fourthstage of the algorithm automatically generates initial par-tial programmatic specifications for singleton charts. Viablecombinations of charts are generated in the fifth stage bymodifying the specifications so that spatial positions or colorpalettes are aligned to link information according to sharedfields. In the sixth stage, charts are arranged into a gridlayout consistent with the computed alignments, and theircompleted specifications are rendered into boxes of pixels.
4.1 Input Data
Our proposed GEViTRec recommender algorithm has fourrequired inputs (H , D, T , and A) and an optional fifthone (F ). Two are provided by users. The required inputfrom users is the (frequently) heterogeneous collection ofdatasets they wish to visualize together (H). Our proof ofconcept implementation supports the following data typesfor H : tabular, tree, genomic, images, spatial (polygons),or network data. Our recommender algorithm will stillfunction if the user provides only a single dataset, or if the
Fig. 1. GEViTRec Overview. The algorithm is illustrated with sourcesof three data types: #1 tree with associated tabular data, #2 tabular,and #3 spatial. The exploded attribute fields within these data sourcesare classified into numeric and non-numeric field types. The similarityof categories between pairs of non-numeric attribute fields is computedwith the Jaccard index to establish exact and inexact linkages betweendata sources. The data sources, their attribute fields, and the linkagesbetween their fields are used to generate a data source graph. The pathsof the data source graph that link pairs of data sources are enumeratedand ranked according to their link strength, diversity, and total relevance.For each path, in order of rank, partial specifications are generated forindividual charts. They are modified to express linkages through alignedpositional axes or color palettes, then arranged into a grid layout and thespecifications are rendered into displayable pixels.
datasets they wish to visualize are independent (i.e. have noshared fields). Users have the option to specify a set of fields(Fusers) that should appear in the final visual encodings,in addition to the automatically detected shared fields thatprovide linkages between the input datasets.
The other three inputs are not supplied by the user;they are precomputed datasets that we have built into ourproof-of-concept implementation. One is a VPDS (D) thatis a quantified and aggregated summary of different visualencodings and how frequently they are used, as described inSection 2.2. Another is a set of predefined template specifi-cations (T ) for all of the visual encoding types that are builtinto our proof-of-concept implementation, as discussed inSection 4.5, allowing GEViTRec to automatically generatevisualizations without any further guidance from users.The third is manual analysis results A, namely the viabilitymatrix for feasible spatial alignments of charts and the listof positionally immutable charts, described in Section 4.6.
TVCG SUBMISSION 6
4.2 Exploding Fields from Data SourcesFor each input dataset in H , all of its fields are exploded;that is, they are extracted for easy comparison regardless ofthe original data type of the source. For each input data set,Hi, its fields are denoted F = (f1, f2, ..., fn). For each fieldin F , GEViTRec also determines whether it is numeric ornon-numeric, and the cardinality of the non-numeric fields.
The automatic extraction of fields requires analysis ofhow attribute fields are stored in each supported data type.For tabular data types, these fields are simply the attributecolumns. For other data types, these fields can be stored indifferent ways: for example, fields in tree data types maybe stored within a plain text flat file that also describesthe tree’s structure. The attribute fields of non-tabular datatypes could be identifiers that link to an associated tabulardataset, or may contain important data as a complex con-catenated string of data that needs to be parsed.
4.3 Generating the Data Source GraphOur algorithm conducts a pairwise analysis of all non-numeric exploded fields between data sources to identifypotential linkages between data sources. It computes theset similarity for all pairwise comparisons of non-numericfields between data sources using the Jaccard Index. Fora pair of attribute fields A and B, the Jaccard index isJ(A,B) = A
⋂B/A
⋃B, where J(A,B) ∈ [0, 1]. When
J(A,B) = 1 there is an an exact match between all uniquecategories in the two fields, J(A,B) = 0 indicates nomatches, and 0 < J(A,B) < 1 is an inexact match indi-cating that some but not all values are in common.
The Jaccard index is used to derive a data source graph Gof data sources and their associated attribute fields, shownin Figure 1. GEViTRec visualizes the resulting data sourcegraph using a hub and spoke model (Figure 1, Figure 4).Rectangular hubs correspond to a data source ( ) andcircular spokes correspond to attribute fields ( ). Thestrength of the connection between data sources, via field-field linkages, is shown using thick solid lines for exactmatches and dashed lines for inexact matches. Thin solidlines denote linkages between sources and fields.
We limit the linkage check to non-numeric fields becausenumeric fields lack context to be robustly joined using thisset similarity approach: they tend to have so many uniquevalues that matching them to other fields is not straight-forward. Extending GEViTRec to handle linkages betweennumeric fields robustly would be possible and interestingfuture work, but is beyond the scope of this initial research.
One immediately obvious limitation of this approach togenerating the data source graph is that messy or noisydata may require users to undertake a clean-up process.Consider two datasets with a field for viral sample IDsthat would be expected to have an exact match. If thereare typographic errors or missed entries, the Jaccard Indexwould be sensitive to these issues: rather than an exactmatch, the linkage would be computed with a lower value(< 1). However, this situation still provides a useful insightto surface to the expert. The hub and spoke data sourcegraph visualization allows experts to assess the strength ofconnections and do a targeted investigation into expectedconnections that failed to materialize. Moreover, since the
Jaccard Index is a continuous value, experts can quicklytriage their investigations into data quality by, for example,prioritizing those that have lower Jaccard Index values.Even with messy data, our recommendation algorithm willstill produce and prioritize visualizations; performance willsimply degrade in that fewer visually coherent combina-tions of charts will be generated.
4.4 Ranking Graph PathsAfter generating a data source graph, the next stage of thealgorithm generates and ranks paths between paired groupsof data sources. Since data sources may not all be connectedto each other, GEViTRec generates paths within individualconnected components in the graph. A single connectedcomponent of the data source graph could contain any-where between a single dataset and all input data sources,so the number of paths per component can vary from 1 tobeyond
(NH
2
), where NH is the total number of data sources.
Algorithm 2 rankPaths(G,D)Input: Data Source Graph G, Design Space DOutput: List of Ranked Paths, Rp
1: rankedPaths Rp ← new Array2: for each component C in G do3: Cp = enumeratePaths(Gc) . Dijkstra’s algorithm4: for each path P in Cp do5: Ps ← calculatePathStrength(P )6: Pd ← calculatePathDiversity(P )7: Pvr ← calculatePathVisRelevance(P )8: add Ps, Pd, Pvr as a row to Rp
9: Rp ← columnNormalize(Rp)10: pathScore← score(Rp)11: sort Rp by pathScore12: return sorted Rp
We rank paths in each component of the data sourcegraph with a relevance rank that incorporates three metricsthat we developed: the strength of the connections betweendata sources (link strength), the diversity of data types(data type diversity), and the cumulative relevance of visualencodings that could be generated from those data types(visual encoding relevance). The visual encoding relevancemetric is how we incorporate domain-specific visualiza-tion practices into the path ranking criteria, specifically thegenEpi visualization prevalence design space available fromthe GEViT study [6].
We summarize our approach to path ranking in Algo-rithm 2. The link strength (Ps) of a path is the normalizedsum of edge weights (ei):
Ps =
∑Ne
i=1 eiNe
(1)
where Ne is the total number of edges on that path and eiis the Jaccard index of the ith edge, and finally Ps ∈ [0, 1].A value of Ps = 1 indicates that data sources are linkedentirely by exact matches, whereas Ps = 0 indicates thatthere is only one data set in that path.
Data type diversity (Pd) is calculated by summing thenumber of unique data types in a path. Each data source isclassified as belonging to one of the supported data types;
TVCG SUBMISSION 7
in the implementation, this calculation is done at runtimewhen the user loads the input data into GEViTRec. A diver-sity value of 1 indicates that every data source appearing onthe path is the same data type, for example tabular data. Themaximum possible diversity value of NH , the total numberof input sources, would indicate that each data source is adifferent data type. The objective of the diversity metric isto include a number of different data sources, but also toprioritize visualizing data across a variety of data types.
Finally, we compute the visual encoding relevance (Pvr)of a path by summing the relevance scores of the uniquevisual encodings that can be produced from the differentdata sources along the path. We have pre-computed a scaledvisual encoding relevance (R′) using the results of our prioranalysis of visualization practices in genomic epidemiol-ogy [6]. The R′ value is derived from a quantification for vi-sual encoding (V ) usage within a domain-specific visualiza-tion prevalence design space (V PDS), where R′ ∈ [1, 10].We compute R as follows:
R =Y∑y
Ny∑n=1
Vi,n × wy (2)
where Vi is an individual visual encoding in the form ofa chart (i.e. scatter chart, map, phylogenetic tree). A simplerelevance metric score would just quantify how often somevisual encoding (Vi) is used in some design space (V PDS);for the prior GEViT study [6], this number captures howmany papers a chart type appears in.
We sought to give greater weight to more recent vi-sual encodings, reasoning that best practices were likely toevolve over time. Thus, we create a penalty term (wy) thatdown-weights counts from older years, a possible compu-tation since the GEViT VPDS includes information aboutthe year of use Y . This approach sums the occurrence ofindividual visual encodings, while giving greater weight tovisual encodings that domain experts used most recently.
For consistency across evolving design spaces, we re-scale the visual encoding relevance (R) as follows:
R′ =
(Vi
max(R)
)× 10 (3)
The above equation identifies the visual encoding (Vi)that is used most frequently in this design space (R). All thevisual encodings in the design space are scaled as a fractionof R. We include a scaling factor of 10 for interpretabilityand ease of computing; other scaling factors could havebeen used. The scaled relevance score ranges between 1(least common) and 10 (most common). It is designed toproduce non-linear quantitative values to emphasize therelative importance of different types of visual encodings,not simply an ordering of the elements.
For example, a phylogenetic tree is the most used visualencoding in genEpi and the next most common visualencoding is a bar chart. Our scaling produces scores of 10and 4 respectively for these charts, rather than scores like 10and 9, to capture the relative importance of a phylogenetictree compared to all other encodings.
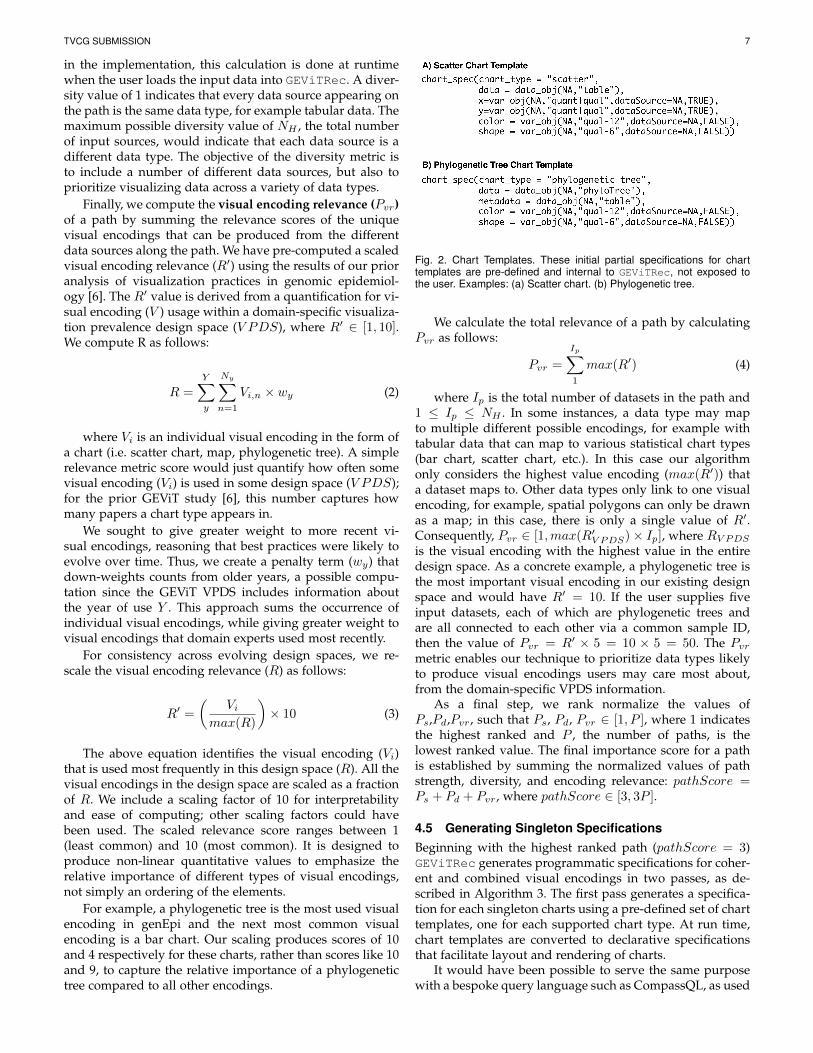
Fig. 2. Chart Templates. These initial partial specifications for charttemplates are pre-defined and internal to GEViTRec, not exposed tothe user. Examples: (a) Scatter chart. (b) Phylogenetic tree.
We calculate the total relevance of a path by calculatingPvr as follows:
Pvr =
Ip∑1
max(R′) (4)
where Ip is the total number of datasets in the path and1 ≤ Ip ≤ NH . In some instances, a data type may mapto multiple different possible encodings, for example withtabular data that can map to various statistical chart types(bar chart, scatter chart, etc.). In this case our algorithmonly considers the highest value encoding (max(R′)) thata dataset maps to. Other data types only link to one visualencoding, for example, spatial polygons can only be drawnas a map; in this case, there is only a single value of R′.Consequently, Pvr ∈ [1,max(R′
V PDS)× Ip], where RV PDS
is the visual encoding with the highest value in the entiredesign space. As a concrete example, a phylogenetic tree isthe most important visual encoding in our existing designspace and would have R′ = 10. If the user supplies fiveinput datasets, each of which are phylogenetic trees andare all connected to each other via a common sample ID,then the value of Pvr = R′ × 5 = 10 × 5 = 50. The Pvr
metric enables our technique to prioritize data types likelyto produce visual encodings users may care most about,from the domain-specific VPDS information.
As a final step, we rank normalize the values ofPs,Pd,Pvr, such that Ps, Pd, Pvr ∈ [1, P ], where 1 indicatesthe highest ranked and P , the number of paths, is thelowest ranked value. The final importance score for a pathis established by summing the normalized values of pathstrength, diversity, and encoding relevance: pathScore =Ps + Pd + Pvr, where pathScore ∈ [3, 3P ].
4.5 Generating Singleton SpecificationsBeginning with the highest ranked path (pathScore = 3)GEViTRec generates programmatic specifications for coher-ent and combined visual encodings in two passes, as de-scribed in Algorithm 3. The first pass generates a specifica-tion for each singleton charts using a pre-defined set of charttemplates, one for each supported chart type. At run time,chart templates are converted to declarative specificationsthat facilitate layout and rendering of charts.
It would have been possible to serve the same purposewith a bespoke query language such as CompassQL, as used
TVCG SUBMISSION 8
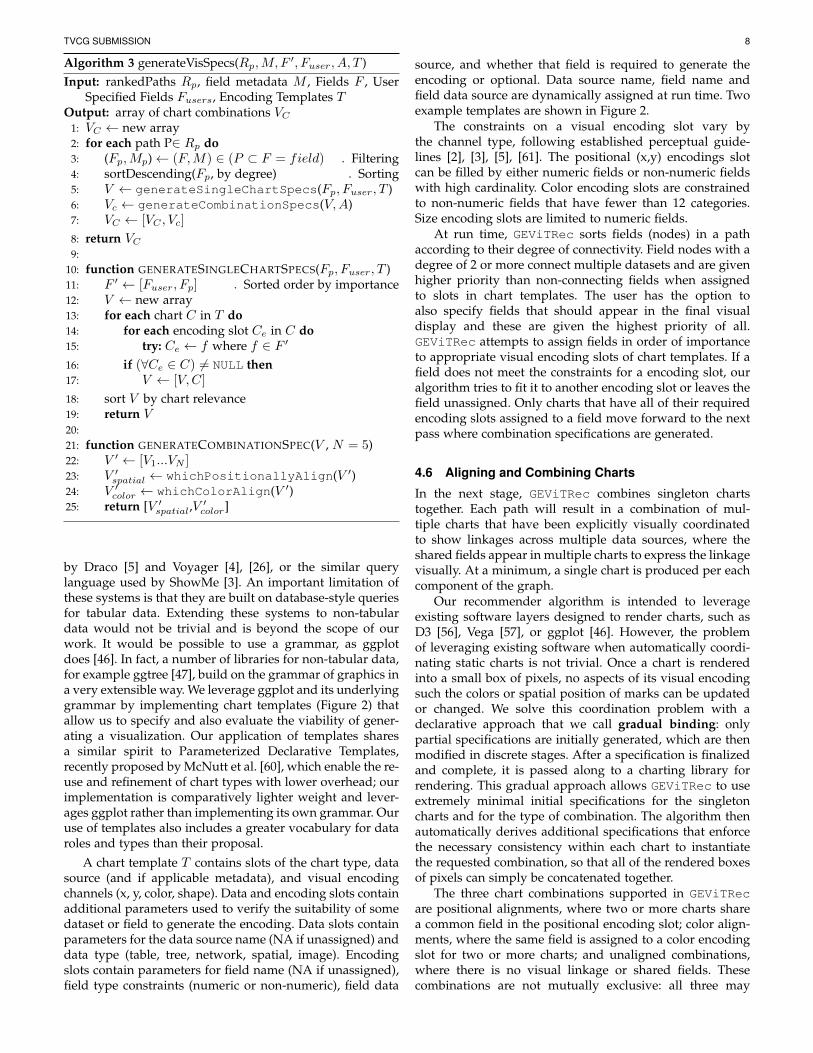
Algorithm 3 generateVisSpecs(Rp,M, F ′, Fuser, A, T )Input: rankedPaths Rp, field metadata M , Fields F , User
Specified Fields Fusers, Encoding Templates TOutput: array of chart combinations VC
1: VC ← new array2: for each path P∈ Rp do3: (Fp,Mp)← (F,M) ∈ (P ⊂ F = field) . Filtering4: sortDescending(Fp, by degree) . Sorting5: V ← generateSingleChartSpecs(Fp, Fuser, T )6: Vc ← generateCombinationSpecs(V,A)7: VC ← [VC , Vc]
8: return VC
9:10: function GENERATESINGLECHARTSPECS(Fp, Fuser, T )11: F ′ ← [Fuser, Fp] . Sorted order by importance12: V ← new array13: for each chart C in T do14: for each encoding slot Ce in C do15: try: Ce ← f where f ∈ F ′
16: if (∀Ce ∈ C) 6= NULL then17: V ← [V,C]
18: sort V by chart relevance19: return V20:21: function GENERATECOMBINATIONSPEC(V , N = 5)22: V ′ ← [V1...VN ]23: V ′
spatial ← whichPositionallyAlign(V ′)24: V ′
color ← whichColorAlign(V ′)25: return [V ′
spatial,V′color]
by Draco [5] and Voyager [4], [26], or the similar querylanguage used by ShowMe [3]. An important limitation ofthese systems is that they are built on database-style queriesfor tabular data. Extending these systems to non-tabulardata would not be trivial and is beyond the scope of ourwork. It would be possible to use a grammar, as ggplotdoes [46]. In fact, a number of libraries for non-tabular data,for example ggtree [47], build on the grammar of graphics ina very extensible way. We leverage ggplot and its underlyinggrammar by implementing chart templates (Figure 2) thatallow us to specify and also evaluate the viability of gener-ating a visualization. Our application of templates sharesa similar spirit to Parameterized Declarative Templates,recently proposed by McNutt et al. [60], which enable the re-use and refinement of chart types with lower overhead; ourimplementation is comparatively lighter weight and lever-ages ggplot rather than implementing its own grammar. Ouruse of templates also includes a greater vocabulary for dataroles and types than their proposal.
A chart template T contains slots of the chart type, datasource (and if applicable metadata), and visual encodingchannels (x, y, color, shape). Data and encoding slots containadditional parameters used to verify the suitability of somedataset or field to generate the encoding. Data slots containparameters for the data source name (NA if unassigned) anddata type (table, tree, network, spatial, image). Encodingslots contain parameters for field name (NA if unassigned),field type constraints (numeric or non-numeric), field data
source, and whether that field is required to generate theencoding or optional. Data source name, field name andfield data source are dynamically assigned at run time. Twoexample templates are shown in Figure 2.
The constraints on a visual encoding slot vary bythe channel type, following established perceptual guide-lines [2], [3], [5], [61]. The positional (x,y) encodings slotcan be filled by either numeric fields or non-numeric fieldswith high cardinality. Color encoding slots are constrainedto non-numeric fields that have fewer than 12 categories.Size encoding slots are limited to numeric fields.
At run time, GEViTRec sorts fields (nodes) in a pathaccording to their degree of connectivity. Field nodes with adegree of 2 or more connect multiple datasets and are givenhigher priority than non-connecting fields when assignedto slots in chart templates. The user has the option toalso specify fields that should appear in the final visualdisplay and these are given the highest priority of all.GEViTRec attempts to assign fields in order of importanceto appropriate visual encoding slots of chart templates. If afield does not meet the constraints for a encoding slot, ouralgorithm tries to fit it to another encoding slot or leaves thefield unassigned. Only charts that have all of their requiredencoding slots assigned to a field move forward to the nextpass where combination specifications are generated.
4.6 Aligning and Combining Charts
In the next stage, GEViTRec combines singleton chartstogether. Each path will result in a combination of mul-tiple charts that have been explicitly visually coordinatedto show linkages across multiple data sources, where theshared fields appear in multiple charts to express the linkagevisually. At a minimum, a single chart is produced per eachcomponent of the graph.
Our recommender algorithm is intended to leverageexisting software layers designed to render charts, such asD3 [56], Vega [57], or ggplot [46]. However, the problemof leveraging existing software when automatically coordi-nating static charts is not trivial. Once a chart is renderedinto a small box of pixels, no aspects of its visual encodingsuch the colors or spatial position of marks can be updatedor changed. We solve this coordination problem with adeclarative approach that we call gradual binding: onlypartial specifications are initially generated, which are thenmodified in discrete stages. After a specification is finalizedand complete, it is passed along to a charting library forrendering. This gradual approach allows GEViTRec to useextremely minimal initial specifications for the singletoncharts and for the type of combination. The algorithm thenautomatically derives additional specifications that enforcethe necessary consistency within each chart to instantiatethe requested combination, so that all of the rendered boxesof pixels can simply be concatenated together.
The three chart combinations supported in GEViTRecare positional alignments, where two or more charts sharea common field in the positional encoding slot; color align-ments, where the same field is assigned to a color encodingslot for two or more charts; and unaligned combinations,where there is no visual linkage or shared fields. Thesecombinations are not mutually exclusive: all three may
TVCG SUBMISSION 9
simultaneously occur. The GEViT study [6] also identifiedsmall multiples as a common combination within genEpi.Our algorithm does not support that combination type, tokeep the scope of GEViTRec tractable; handling coordina-tion seamlessly between all three of these combination typesis an open research challenge that we leave for future work.We use the term alignment here to refer to the general idea ofaligning ranges, when building visualization specificationsfrom paths in the data source graphs, that by definitionshare common domains. The mechanisms of alignment aredifferent between color and positional alignments.
Color aligned combinations will automatically applya common color palette for shared attribute fields acrossmultiple chart types. Color alignment is only facilitatedbetween charts that have a common field assigned to theircolor encoding. At run time, GEViTRec recognizes this com-monality and enforces a common color palette across theindividual charts. Although the automatic coordination ofcolor between views is supported in many existing systemsfor small multiples, most previous systems do not supportthis capability across multiple and diverse chart types.
For combinations facilitated by positional alignments,GEViTRec must ensure that charts have a common posi-tional axis (x or y) along either the horizontal or verticaldirection. The two considerations are whether it is feasibleto positionally align charts, and if so how to orient them.
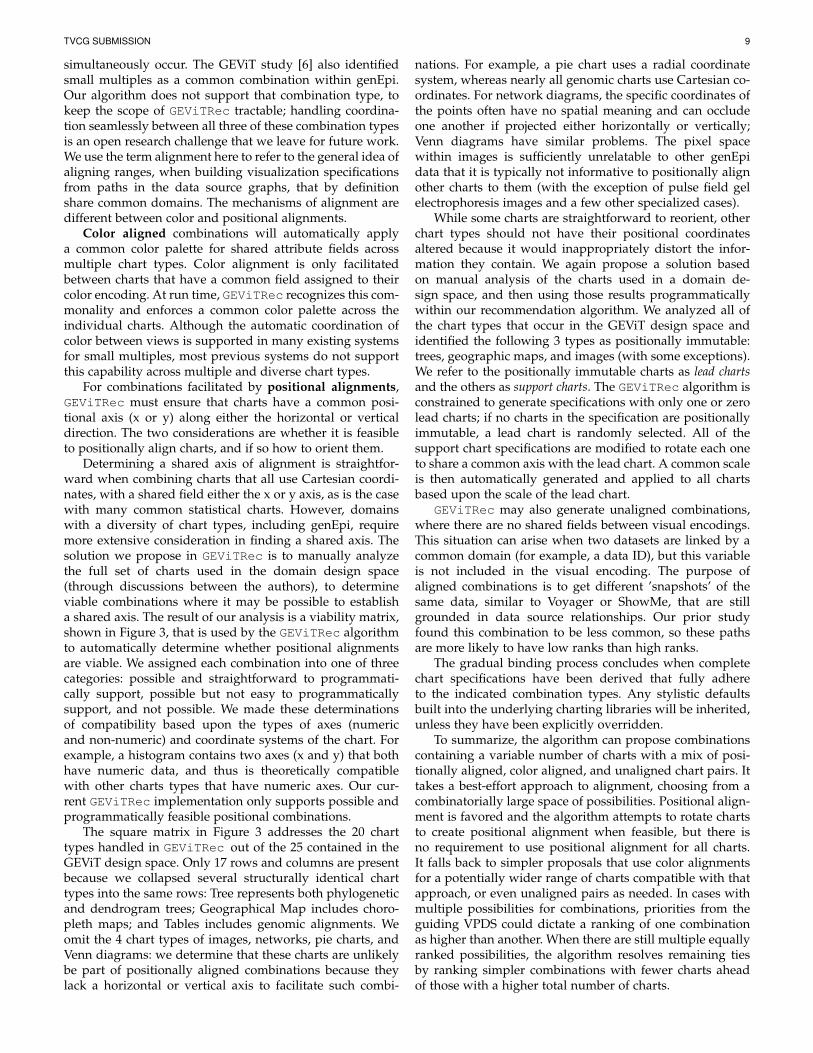
Determining a shared axis of alignment is straightfor-ward when combining charts that all use Cartesian coordi-nates, with a shared field either the x or y axis, as is the casewith many common statistical charts. However, domainswith a diversity of chart types, including genEpi, requiremore extensive consideration in finding a shared axis. Thesolution we propose in GEViTRec is to manually analyzethe full set of charts used in the domain design space(through discussions between the authors), to determineviable combinations where it may be possible to establisha shared axis. The result of our analysis is a viability matrix,shown in Figure 3, that is used by the GEViTRec algorithmto automatically determine whether positional alignmentsare viable. We assigned each combination into one of threecategories: possible and straightforward to programmati-cally support, possible but not easy to programmaticallysupport, and not possible. We made these determinationsof compatibility based upon the types of axes (numericand non-numeric) and coordinate systems of the chart. Forexample, a histogram contains two axes (x and y) that bothhave numeric data, and thus is theoretically compatiblewith other charts types that have numeric axes. Our cur-rent GEViTRec implementation only supports possible andprogrammatically feasible positional combinations.
The square matrix in Figure 3 addresses the 20 charttypes handled in GEViTRec out of the 25 contained in theGEViT design space. Only 17 rows and columns are presentbecause we collapsed several structurally identical charttypes into the same rows: Tree represents both phylogeneticand dendrogram trees; Geographical Map includes choro-pleth maps; and Tables includes genomic alignments. Weomit the 4 chart types of images, networks, pie charts, andVenn diagrams: we determine that these charts are unlikelybe part of positionally aligned combinations because theylack a horizontal or vertical axis to facilitate such combi-
nations. For example, a pie chart uses a radial coordinatesystem, whereas nearly all genomic charts use Cartesian co-ordinates. For network diagrams, the specific coordinates ofthe points often have no spatial meaning and can occludeone another if projected either horizontally or vertically;Venn diagrams have similar problems. The pixel spacewithin images is sufficiently unrelatable to other genEpidata that it is typically not informative to positionally alignother charts to them (with the exception of pulse field gelelectrophoresis images and a few other specialized cases).
While some charts are straightforward to reorient, otherchart types should not have their positional coordinatesaltered because it would inappropriately distort the infor-mation they contain. We again propose a solution basedon manual analysis of the charts used in a domain de-sign space, and then using those results programmaticallywithin our recommendation algorithm. We analyzed all ofthe chart types that occur in the GEViT design space andidentified the following 3 types as positionally immutable:trees, geographic maps, and images (with some exceptions).We refer to the positionally immutable charts as lead chartsand the others as support charts. The GEViTRec algorithm isconstrained to generate specifications with only one or zerolead charts; if no charts in the specification are positionallyimmutable, a lead chart is randomly selected. All of thesupport chart specifications are modified to rotate each oneto share a common axis with the lead chart. A common scaleis then automatically generated and applied to all chartsbased upon the scale of the lead chart.
GEViTRec may also generate unaligned combinations,where there are no shared fields between visual encodings.This situation can arise when two datasets are linked by acommon domain (for example, a data ID), but this variableis not included in the visual encoding. The purpose ofaligned combinations is to get different ’snapshots’ of thesame data, similar to Voyager or ShowMe, that are stillgrounded in data source relationships. Our prior studyfound this combination to be less common, so these pathsare more likely to have low ranks than high ranks.
The gradual binding process concludes when completechart specifications have been derived that fully adhereto the indicated combination types. Any stylistic defaultsbuilt into the underlying charting libraries will be inherited,unless they have been explicitly overridden.
To summarize, the algorithm can propose combinationscontaining a variable number of charts with a mix of posi-tionally aligned, color aligned, and unaligned chart pairs. Ittakes a best-effort approach to alignment, choosing from acombinatorially large space of possibilities. Positional align-ment is favored and the algorithm attempts to rotate chartsto create positional alignment when feasible, but there isno requirement to use positional alignment for all charts.It falls back to simpler proposals that use color alignmentsfor a potentially wider range of charts compatible with thatapproach, or even unaligned pairs as needed. In cases withmultiple possibilities for combinations, priorities from theguiding VPDS could dictate a ranking of one combinationas higher than another. When there are still multiple equallyranked possibilities, the algorithm resolves remaining tiesby ranking simpler combinations with fewer charts aheadof those with a higher total number of charts.
TVCG SUBMISSION 10
Chart Type
Bar
Line
Scatter
Histogram
Density
Boxplot
Swarm
Category Stripe
Heatmap
Sankey
Stream Graph
Timeline
Geographic Map
Tree
Interior Map Image
Gel Image
Table
Legend Can positionally align Can positionally align, but complex (not supported) Cannot positionally align (not supported)
Fig. 3. Compatible chart types for positional alignments.
4.7 Arranging and Rendering Boxes of PixelsIn the final algorithm stage, arranging and rendering thecharts is straightforward because the finalized specifica-tions emerging from the previous stage have harmonizedalignments and orientations, as the outcome of the gradualbinding. The algorithm assumes access to a charting librarythat will take a complete specification and return a renderedbox of pixels. The only further requirement is to arrangethe boxes of pixels that represent rendered individual chartsinto a grid. By default, GEViTRec creates a 2×3 grid;that configuration is dynamically modifiable at run time.The arrangement depends upon the types of combinationsthat are feasible and any user specifications to modify thenumber of charts that compose a view. The final output ofthe recommender algorithm is a single large box of pixels,showing the complete combination of static visualizationswith linked information content.
5 RESULTS
We implemented GEViTRec as an end-to-end proof ofconcept system to investigate multiple datasets, compareto alternative tools, and finally to conduct an evaluationwith experts. Next, we use both real and synthetic genEpidata to assess GEViTRec’s performance. In this section,we briefly describe these datasets and show one examplechart combination for each. Due to limitations of space, weprovide an overview of the implementation; a detailed walkthrough vignettes is in the supplemental materials.
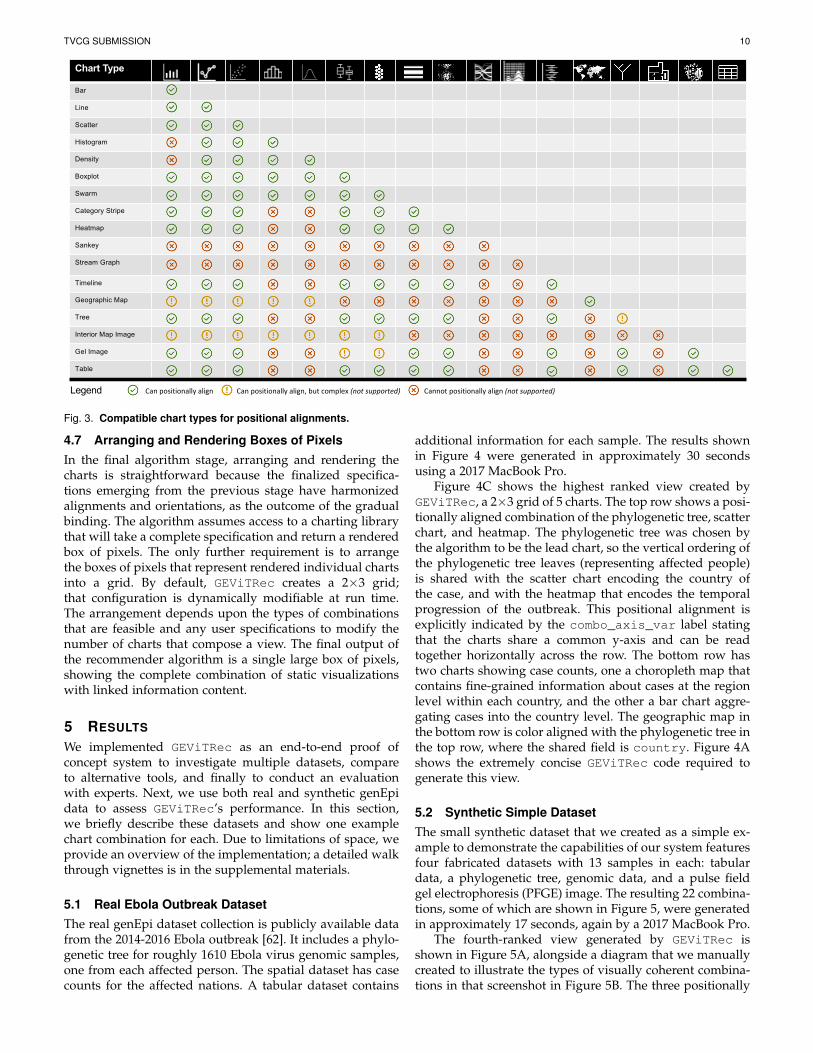
5.1 Real Ebola Outbreak DatasetThe real genEpi dataset collection is publicly available datafrom the 2014-2016 Ebola outbreak [62]. It includes a phylo-genetic tree for roughly 1610 Ebola virus genomic samples,one from each affected person. The spatial dataset has casecounts for the affected nations. A tabular dataset contains
additional information for each sample. The results shownin Figure 4 were generated in approximately 30 secondsusing a 2017 MacBook Pro.
Figure 4C shows the highest ranked view created byGEViTRec, a 2×3 grid of 5 charts. The top row shows a posi-tionally aligned combination of the phylogenetic tree, scatterchart, and heatmap. The phylogenetic tree was chosen bythe algorithm to be the lead chart, so the vertical ordering ofthe phylogenetic tree leaves (representing affected people)is shared with the scatter chart encoding the country ofthe case, and with the heatmap that encodes the temporalprogression of the outbreak. This positional alignment isexplicitly indicated by the combo_axis_var label statingthat the charts share a common y-axis and can be readtogether horizontally across the row. The bottom row hastwo charts showing case counts, one a choropleth map thatcontains fine-grained information about cases at the regionlevel within each country, and the other a bar chart aggre-gating cases into the country level. The geographic map inthe bottom row is color aligned with the phylogenetic tree inthe top row, where the shared field is country. Figure 4Ashows the extremely concise GEViTRec code required togenerate this view.
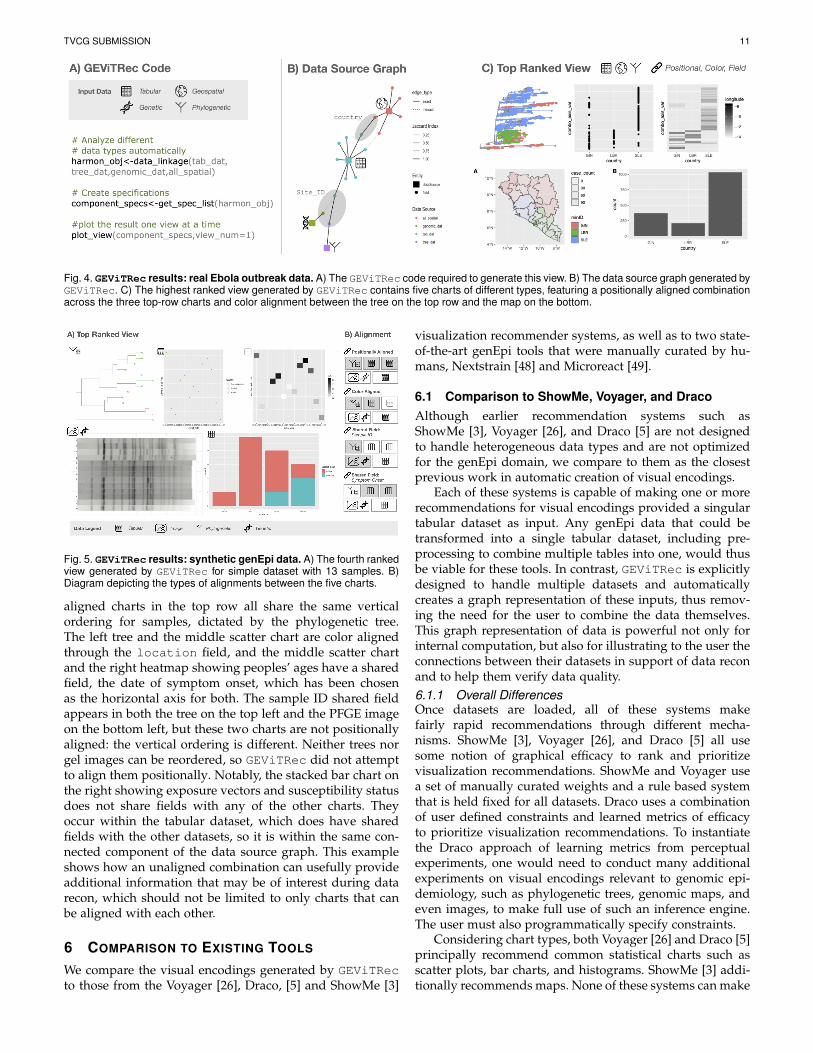
5.2 Synthetic Simple DatasetThe small synthetic dataset that we created as a simple ex-ample to demonstrate the capabilities of our system featuresfour fabricated datasets with 13 samples in each: tabulardata, a phylogenetic tree, genomic data, and a pulse fieldgel electrophoresis (PFGE) image. The resulting 22 combina-tions, some of which are shown in Figure 5, were generatedin approximately 17 seconds, again by a 2017 MacBook Pro.
The fourth-ranked view generated by GEViTRec isshown in Figure 5A, alongside a diagram that we manuallycreated to illustrate the types of visually coherent combina-tions in that screenshot in Figure 5B. The three positionally
TVCG SUBMISSION 11
Fig. 4. GEViTRec results: real Ebola outbreak data. A) The GEViTRec code required to generate this view. B) The data source graph generated byGEViTRec. C) The highest ranked view generated by GEViTRec contains five charts of different types, featuring a positionally aligned combinationacross the three top-row charts and color alignment between the tree on the top row and the map on the bottom.
Fig. 5. GEViTRec results: synthetic genEpi data. A) The fourth rankedview generated by GEViTRec for simple dataset with 13 samples. B)Diagram depicting the types of alignments between the five charts.
aligned charts in the top row all share the same verticalordering for samples, dictated by the phylogenetic tree.The left tree and the middle scatter chart are color alignedthrough the location field, and the middle scatter chartand the right heatmap showing peoples’ ages have a sharedfield, the date of symptom onset, which has been chosenas the horizontal axis for both. The sample ID shared fieldappears in both the tree on the top left and the PFGE imageon the bottom left, but these two charts are not positionallyaligned: the vertical ordering is different. Neither trees norgel images can be reordered, so GEViTRec did not attemptto align them positionally. Notably, the stacked bar chart onthe right showing exposure vectors and susceptibility statusdoes not share fields with any of the other charts. Theyoccur within the tabular dataset, which does have sharedfields with the other datasets, so it is within the same con-nected component of the data source graph. This exampleshows how an unaligned combination can usefully provideadditional information that may be of interest during datarecon, which should not be limited to only charts that canbe aligned with each other.
6 COMPARISON TO EXISTING TOOLS
We compare the visual encodings generated by GEViTRecto those from the Voyager [26], Draco, [5] and ShowMe [3]
visualization recommender systems, as well as to two state-of-the-art genEpi tools that were manually curated by hu-mans, Nextstrain [48] and Microreact [49].
6.1 Comparison to ShowMe, Voyager, and DracoAlthough earlier recommendation systems such asShowMe [3], Voyager [26], and Draco [5] are not designedto handle heterogeneous data types and are not optimizedfor the genEpi domain, we compare to them as the closestprevious work in automatic creation of visual encodings.
Each of these systems is capable of making one or morerecommendations for visual encodings provided a singulartabular dataset as input. Any genEpi data that could betransformed into a single tabular dataset, including pre-processing to combine multiple tables into one, would thusbe viable for these tools. In contrast, GEViTRec is explicitlydesigned to handle multiple datasets and automaticallycreates a graph representation of these inputs, thus remov-ing the need for the user to combine the data themselves.This graph representation of data is powerful not only forinternal computation, but also for illustrating to the user theconnections between their datasets in support of data reconand to help them verify data quality.6.1.1 Overall DifferencesOnce datasets are loaded, all of these systems makefairly rapid recommendations through different mecha-nisms. ShowMe [3], Voyager [26], and Draco [5] all usesome notion of graphical efficacy to rank and prioritizevisualization recommendations. ShowMe and Voyager usea set of manually curated weights and a rule based systemthat is held fixed for all datasets. Draco uses a combinationof user defined constraints and learned metrics of efficacyto prioritize visualization recommendations. To instantiatethe Draco approach of learning metrics from perceptualexperiments, one would need to conduct many additionalexperiments on visual encodings relevant to genomic epi-demiology, such as phylogenetic trees, genomic maps, andeven images, to make full use of such an inference engine.The user must also programmatically specify constraints.
Considering chart types, both Voyager [26] and Draco [5]principally recommend common statistical charts such asscatter plots, bar charts, and histograms. ShowMe [3] addi-tionally recommends maps. None of these systems can make
TVCG SUBMISSION 12
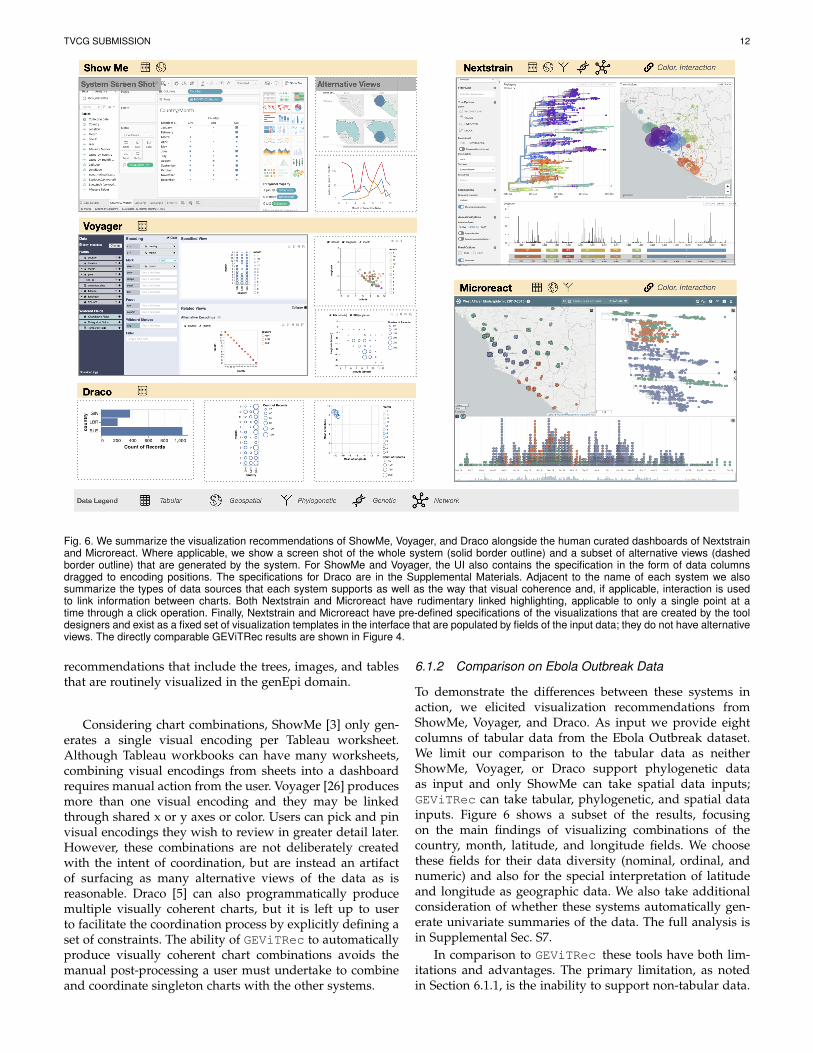
Fig. 6. We summarize the visualization recommendations of ShowMe, Voyager, and Draco alongside the human curated dashboards of Nextstrainand Microreact. Where applicable, we show a screen shot of the whole system (solid border outline) and a subset of alternative views (dashedborder outline) that are generated by the system. For ShowMe and Voyager, the UI also contains the specification in the form of data columnsdragged to encoding positions. The specifications for Draco are in the Supplemental Materials. Adjacent to the name of each system we alsosummarize the types of data sources that each system supports as well as the way that visual coherence and, if applicable, interaction is usedto link information between charts. Both Nextstrain and Microreact have rudimentary linked highlighting, applicable to only a single point at atime through a click operation. Finally, Nextstrain and Microreact have pre-defined specifications of the visualizations that are created by the tooldesigners and exist as a fixed set of visualization templates in the interface that are populated by fields of the input data; they do not have alternativeviews. The directly comparable GEViTRec results are shown in Figure 4.
recommendations that include the trees, images, and tablesthat are routinely visualized in the genEpi domain.
Considering chart combinations, ShowMe [3] only gen-erates a single visual encoding per Tableau worksheet.Although Tableau workbooks can have many worksheets,combining visual encodings from sheets into a dashboardrequires manual action from the user. Voyager [26] producesmore than one visual encoding and they may be linkedthrough shared x or y axes or color. Users can pick and pinvisual encodings they wish to review in greater detail later.However, these combinations are not deliberately createdwith the intent of coordination, but are instead an artifactof surfacing as many alternative views of the data as isreasonable. Draco [5] can also programmatically producemultiple visually coherent charts, but it is left up to userto facilitate the coordination process by explicitly defining aset of constraints. The ability of GEViTRec to automaticallyproduce visually coherent chart combinations avoids themanual post-processing a user must undertake to combineand coordinate singleton charts with the other systems.
6.1.2 Comparison on Ebola Outbreak Data
To demonstrate the differences between these systems inaction, we elicited visualization recommendations fromShowMe, Voyager, and Draco. As input we provide eightcolumns of tabular data from the Ebola Outbreak dataset.We limit our comparison to the tabular data as neitherShowMe, Voyager, or Draco support phylogenetic dataas input and only ShowMe can take spatial data inputs;GEViTRec can take tabular, phylogenetic, and spatial datainputs. Figure 6 shows a subset of the results, focusingon the main findings of visualizing combinations of thecountry, month, latitude, and longitude fields. We choosethese fields for their data diversity (nominal, ordinal, andnumeric) and also for the special interpretation of latitudeand longitude as geographic data. We also take additionalconsideration of whether these systems automatically gen-erate univariate summaries of the data. The full analysis isin Supplemental Sec. S7.
In comparison to GEViTRec these tools have both lim-itations and advantages. The primary limitation, as notedin Section 6.1.1, is the inability to support non-tabular data.
TVCG SUBMISSION 13
A second limitation is that all of these systems require thespecification of both a data set and some field specifications,for example dragging pills to channels as is done withShowMe and Voyager, or writing programmatic code as isdone in Draco. An exception is Voyager’s automatic uni-variate summaries. By comparison, GEViTRec only requiresthat the user specify the data sources they wish to visualize;the user may also specify fields of interest to include in theoutputs, but these are not strictly required.
A third limitation is that these systems do not suggestvisually coherent chart combinations. The premise of ourresearch is that visual coherent combinations are impor-tant. While ShowMe, Voyager, and Draco primarily produceone visualization at a time, these systems do support thegeneration of alternative data visualizations. For example,ShowMe can suggest alternative chart types and even chartspecifications and uses a red outline in the suggestion panelto highlight a highly ranked chart (see Figure 6). Voyageralso generates alternative specifications automatically, andwill produce univariate summaries of each field in thedataset without any specifications from the user. Dracoallows the user to explore a potentially vast combinatorialspace of visualizations by allowing users to specify a set ofconstraints. Users can create dashboards using ShowMe’srecommendations, or they can pin results from Voyager’salternative suggestions; they may also specify constraintsfrom multiple chart types as well. ShowMe also supportsmultiple linked views through interaction. The functionalityto explore alternatives and compose multiple views approx-imates what GEViTRec does, but in these other systems anyvisual coherence is a side effect of deliberate choices theuser has made rather than being produced automatically.Achieving any visual coherence through manual processesis not trivial and requires a time commitment from theuser. Finally, the recommendations of these systems arebased on perceptual efficacy and do not encompass alter-native modes of ranking visualizations such as the domain-targeted VPDS. For tabular data alone, ShowMe, Voyager,and Draco may outperform GEViTRec, which extends thestate of the art in visualizing multiple data sources ofdifferent data types.
6.2 Comparison to Nextstrain and MicroreactWe now compare the results of GEViTRec to Nextstrain [48]and Microreact [49], two human-curated visualization dash-boards that have been developed by genEpi domain experts.While neither of these systems were explicitly created fordata reconnaissance, the overlap between the presentationand data recon design spaces means that they do offersome reconnaissance affordances. In contrast to ShowMe,Voyager, and Draco, the Nextstrain and Microreact systemsare able to support non-tabular input types, notably, ge-nomic, phylogenetic, and spatial data inputs. In Figure 6we indicate the different input types supported by all ofthese systems. GEViTRec also supports these non-tabulardata types as well as image data. Furthermore, Nextstrainand Microreact use visualization templates that are fullyspecified by the domain experts. ShowMe, Voyager, andDraco use a query language approach that theoreticallyallows them to flexibly generate a variety of visualizations,but these systems have not yet been demonstrated on
the types of visualizations that support genEpi analyses.Since query language approaches are highly optimized fordatabases, it is not obvious how they might extend to datathat cannot be easily represented in a tabular form. Whilethe chart template approach is less flexible than using aquery language, it enables the domain experts to visualizedata from multiple sources more easily. With GEViTRecwe sought to strike a balance, using templates to enablethe visualization of multiple data sources while introducingflexibility in the creation of visually coherent combinationsof their corresponding chart types.
Comparing the results of GEViTRec (Figure 4) toNextstrain and Microreact, we observe that all of thesesystems feature a phylogenetic tree and a map. GEViTRecassigns high priorities to these over other chart types basedupon the distribution of these chart types in the VPDS.Nextstrain also shows a genomic map, while Microreactshows a timeline. While GEViTRec adaptively responds toinput datasets, Nextstrain does not and relies on a specificanalysis stack; Microreact supports only two datatypes (tab-ular and tree) that can be loaded via the interface. Neithercan show any other visual encodings. Nextstrain also showsa limited hand-curated set of field attributes regardless ofthe dataset, while Microreact allows user to select somefields to visualize. Nextstrain and Microreact show coloraligned combinations, but these fields must be selected bythe user or are hard coded by the developers. Comparedto Nextstrain and Microreact, our current algorithm is par-simonious in its use of color channels and does not prior-itize redundant visual encodings. GEViTRec automaticallychooses attributes to encode based upon a combination ofdata linkage and user specification, and these will varyaccording to the input data. Also, data need not be loadedon external servers for GEViTRec to generate visualizations.Some of GEViTRec’s design choices are less effective thanNextstrain and Microreact, especially for encoding temporaldata. While GEViTRec does not reproduce all aspects of thehuman curated visual design, its automatically generatedrecommendations are much closer to these systems than theresults of ShowMe, Voyager, or Draco.
7 EVALUATION WITH GENEPI EXPERTS
We have conducted a qualitative study with genomic epi-demiology experts to evaluate the usefulness, interpretabil-ity, and actionability of GEViTRec’s visualization recom-mendations in a data recon setting. We remind the readerthat all study materials including anonymized study dataare available in the Supplemental Materials.
7.1 Study Procedures
Study participants were walked through GEViTRec’s vi-sualization recommendation procedures through a chauf-feured demonstration from the study administrator usingthe two datasets described in Section 5. The demonstra-tion is documented in Supplemental Sec. S3. Chauffeureddemonstrations showcasing both datasets were carried outusing the RStudio IDE and run within an R Notebookenvironment. Participants were shown the top five viewsgenerated by GEViTRec for each dataset and were askedto provide a more detailed assessment and interpretation of
TVCG SUBMISSION 14
the Ebola dataset views specifically. Participants could alsointerrupt the study administrator at any point in time to askfor clarification of either the algorithm’s procedures or thedata. Following the demonstration, participants were askedto complete an online questionnaire.
7.2 Data Collection and AnalysisWe recruited ten genEpi domain experts to participate in ourstudy. We verified that these individuals had a backgroundand expertise in genEpi by looking at their affiliations and,if applicable, their publication record. With the exceptionof two individuals, the participants were not known to theauthors prior, and those who were known to us were notcurrent collaborators on any active project. One participantwas a graduate student in genomic epidemiology and allothers were professionals who either consulted or workedwithin regional or national public health agencies. We didnot have an exclusion criterion on the basis of geogra-phy, but all of our participants were from either Canada,the United States, and the United Kingdom. We collecteddata through an online questionnaire, administrator sessionnotes, and audio session recordings; results from all threesources were analyzed together.
Domain experts had varying degrees of exposure togenomic data, but all participants routinely analyzed het-erogeneous data sources to conduct epidemiological inves-tigations. The majority of experts identified as bioinformati-cians and/or surveillance analysts. All experts had someexposure to the R language for statistical analysis and visu-alization (5 beginner, 4 intermediate, and 1 expert level ofself-reported proficiency). Nearly all participants frequentlydeveloped data visualizations to understand and commu-nicate their results. When visualizing data, the majority ofparticipants used R, Excel, Google Docs, or Tableau on adaily or monthly basis.
7.3 Findings and InterpretationSupplemental Sec. S4 contains all questionnaire results,Sec. S5 the study administrator notes, and Sec. S6 the tran-scripts of the session recordings. Here, we summarize par-ticipants’ assessment of result relevance and interpretability.� Usability Assessment of GEViTRecParticipants were asked to assess their perceived usabilityof GEViTRec from the chauffeured demonstration.Overall, participants had a positive impression. Partici-pants all strongly or somewhat agreed they could quicklyfind a useful data visualization from the set of suggestionsprovided by the system and that it was much more usefulfor the system to automatically come up with visualizationsthan for them to come up with visualizations themselves.Participants indicated that GEViTRec visualized the datain ways they would not have thought of, but also indicatedthat GEViTRec did not show some of the visualizations theyhad expected. Their satisfaction with GEViTRec’s resultsseemed to correlate with whether the participant felt theyhad a particular research question in mind: “I might havesome very specific question that I want to answer. As opposedto when I am the researcher thinking about what is genomic epiof this disease. I might have much broader question which areaddress by this earlier image”. Participants strongly agreed that
GEViTRec produced relevant visualizations that help themunderstand the data.The data source graph is valuable for understanding data.Participants also strongly or somewhat agreed that it wasunderstandable how the data connected together. In theirdiscussion with the study administrator and their textualresponses, they emphasized how the data source graph wasan especially useful way to understand their data: “it’s reallynice to see that visualization of how all of these different datasetscan connect together”. Participants indicated that they wouldlike the data source graph to have more interactivity andwould use it more centrally in their analyses. Their sug-gestions open the way to many potential future directionsas GEViTRec continue to evolve, to combine the power ofautomatically computed visual coherence of static views aswe present here and the power of interactivity as has beenheavily explored in previous work.GEViTRec is fast and simple. Participants were impressedwith the speed that data were linked and visualized. Theyalso indicated that the limited amount of coding was man-ageable, but many felt that a dedicated user interface wouldhave simplified it further and would increase its impact.Several participants also validated our claim that generatingan R-based tool was effective because of growing supportand infrastructure in their organizations for R as an analysisframework. As such, GEViTRec could fit easily with theirexisting workflows. Several participants asked about thedata quality required to generate the data visualizationsthey were shown in through the demonstration. They wereinformed that GEViTRec acts as a data viewer and willvisualize whatever quality of data is given. We suggestedto participants this quality-agnostic approach of GEViTRecwas a beneficial feature for data recon, especially when com-bined with the data source graph visualization, because itcould help participants triage and wrangle their data withinthe R environment. Participants agreed that this GEViTRecusage would also fit within their workflows.
� Interpretability and Relevance of GEViTRec OutputWe assessed the relevance and interpretability of GEViTRecresults by asking participants to interpret them on the Eboladataset for the top ranked view.Output and ordering is relevant and interpretable. All par-ticipants agreed that both the views generated by GEViTRecand the order they were presented in were useful andwould help them with their current analysis. One partici-pant stated that “these are all extremely useful visualizations.And having essentially a menu to choose from is fantastic’’. Theinterpretability of the views was further by validated by par-ticipants’ ability to dive into the interpretation of the Ebolaoutbreak data and begin answering questions of “when, howmuch, and where” the outbreak occurred. Some participantscommented on the redundancy of information between thechart types saying that the views could more effectivelycommunicate the diversity of data types and attributes.However, some participants stated that the redundancy ofinformation encoding in the charts was effective because itallowed them to “tease out different aspects of it [data] that youmight be interested in”.Addressing issues of data scale. The majority of participantsindicated the Ebola data was more difficult to interpret
TVCG SUBMISSION 15
than the synthetic data, a surprise to us due to the well-publicized nature of that outbreak. However, participantsindicated the amount of data and variety of chart typestogether was overwhelming: “It’s not as easy to process asthe sample [synthetic] data was, which you could take one lookat it and say, I totally understand everything that’s going on.This one would take me a few more minutes of just sitting andthinking and needing to digest a little bit.” Data aggregation, asDraco [5] or Voyager [4] does, is one potential solution, andGEViTRec does so for certain data and chart types suchas bar charts. However, aggregating procedures for morecomplex data types, like phylogenetic trees, are not trivial;domain expertise is currently required. Below, we discusshow layout, effective text summaries, and improved chartcoordination may help address these issues.
� Comparison to Nextstrain and MicroreactParticipants were shown the Ebola outbreak dataset onthe Nextstrain [48] and Microreact [49] applications andasked to discuss their perceived differences between humangenerated (Nextstrain, Microreact) and machine generated(GEViTRec) views.
Overall, participants felt that the Ebola data was over-whelming, regardless of the data visualization tool, and thatthey needed more help understanding how to approachand consume the information. However, participants ap-preciated that Nextstrain and Microreact had interactivecomponents that allowed them zoom in and filter the data.Future work to allow this ability for GEViTRec would bestraightforward with R/Shiny integration. Several partici-pants liked Nextstrain’s animation of disease transmission.They also felt that the human curated visualizations weremore aesthetically pleasing and more carefully coordinated,but those from GEViTRec contained information that thehuman generated views did not. Participants also felt thatboth Nextstrain and Microreact were suited for very specifictasks, and not helpful if you wanted to see a different viewof the data or had a different research questions :“phylogeog-raphy is not very interesting to what I am doing, so instantly one-third of that [...] visualization is not that useful”. Participantsindicated that it was important for data visualization toolsto adapt to different datasets as GEViTRec does.
� Layout and Summarizing of ResultsParticipants liked that different chart types were linkedby positional or color alignment, or by having commonattribute fields on the axes. However, they felt that datacould be presented more effectively to help them consumethe information. Several asked for text summaries thatdescribe the data and the type of visualization, a findingechoing our prior study on generating a report design forgenomic epidemiology data [10]. Participants also thoughtit could be helpful to lay out data in a ‘scrollytelling’ verticallayout, and one suggested that information could be furtherprioritized to show the simplest data first and more complexdata (and their attendant visualizations) later. Participantsalso indicated that different charts should be sized accordingto their data density and relative importance for a morejustifiable data-ink ratio. Optimizing the aspect ratio andsize of each chart relative to information content would beanother useful area for future research.
� Value for Data Reconnaissance
GEViTRec was designed to provide users with a quickfirst glance of the data so that they can assess its value orthe need to pursue additional datasets. Participants agreedthat GEViTRec fulfilled this intended data recon purpose:“This tool is extremely useful for data exploration, particularlywhere there are incomplete, or highly varied types of data thatmust be integrated and displayed. Very useful for public healthsurveillance and initial review of data.”
The boundary between data recon and standard dataanalysis is certainly not sharp, and GEViTRec may some-times be versatile enough to suffice for preliminary analysis.Participants repeatedly stated they saw GEViTRec as auseful hypothesis generation mechanism, helping them tosee multiple views of their data that they had not consid-ered. Many participants differentiated between GEViTRecfunctionality and the more targeted operation of creating aspecific data visualization to answer a specific question; es-sentially GEViTRec was seen as less effective for hypothesisverification. Hypothesis generation more closely aligns withthe goals of data recon than hypothesis verification, so itwould be fruitful to explore this particular tension in follow-on work. Ultimately, participants found value in being ableto both generate a specific visualization and see alternativevisualizations: “when you’re discovering things, then maybe itis good to have things that are generated without human input”.
� Further customization to participant backgroundAll participants wanted to use GEViTRec on their own dataand analyses. When queried about more specific datasetsthey would apply GEViTRec to, all participants identifieddata with a large number of samples, sourced from differentdata types, and with large numbers of diverse attributefields. However, several participants wanted further opti-mization of the relevance ranking to include participant’sbackground. Interestingly, participants also stated that theystill wanted to see the multiple views of the data to preservethe hypothesis generation and exploratory abilities that theyperceived GEViTRec afforded: “ relevance is very specific forthat [genEpi] person. [...] having that [research question] as acriteria [...] would be very helpful to target your visualizations.[...] there’s the counter point that it’s sometimes helpful to seethings that you are not asking the question for. So that the topranked view was more tailored to them, but that lower rankedviews needed not necessarily be.”
8 DISCUSSION
Heterogeneous and multidimensional data are already thenorm in many domains and stakeholders are increasinglyexpected to use these complex data to derive informedactions [63]. In our own collaborations we have seen stake-holders struggling to understand landscapes of heteroge-neous data. We believe that these challenges are not limitedto genEpi, but extend more broadly to other data scienceapplications. In prior work [1], we developed the termi-nology of data recon and a conceptual framework of howto tackle it to capture the challenges of these experts andto delineate their unmet needs. That framework identifieda four-phase iterative cycle for data recon (acquire, view,assess, pursue) and emphasized the importance of expertsbeing able to rapidly see visual encodings that provide
TVCG SUBMISSION 16
an overview of their data. While we had identified visu-alization recommender systems as a viable solution to thechallenges of data reconnaissance, we also identified thelimitations of previous systems that lessened their utilityto experts in genEpi and other domains with heterogeneousdata landscapes.
The algorithm that we present here is a significant ad-vance over the previous state of the art that addresses thechallenges of data recon in complex and diverse data land-scapes, accelerating the view stage of the data recon process.We demonstrate that the GEViTRec proof-of-concept imple-mentation provides rapid overviews across a wide variety ofdata types and produces actionable insights that experts caninterpret and integrate into their existing workflows. Ourevaluation provided evidence that our approach of usingvisually coherent combinations of static charts was a viableapproach to data recon, supporting very fast overviewcomprehension without requiring the time investment ofinteractivity.
8.1 Domains Beyond GenEpi
The GEViTRec algorithm has many domain-agnostic ele-ments, but also incorporates information from a domain-specific visualization prevalence design space (VPDS).While our specific implementation was in the genEpi do-main, we intended this approach to be transferrable to otherdomains as well. The future work needed to fully validateour claim of domain independence would be to deploy animplementation in another domain and assess its utility.However, one current bottleneck in doing so would be themanual effort currently required to generate a VPDS. Whilethe GEViT method for doing so requires a mix of automaticcomputation and human effort [6], a robust method thatis fully automatic would address that problem. We donot solve the technical problem of automatically generat-ing a VPDS in this work. Instead, what we demonstratehere is how a design space can be used to inject domainexpertise into recommendation systems. We hope that ourwork makes headway on this “chicken and egg” problem,motivating further work on automating the construction of aVPDS by showing the practical benefits that can be obtainedfrom having one available. Moreover, our current approachalso requires further manual analysis of VPDS results, suchas the chart combination viability matrix, which would alsobenefit from automation. A more prosaic barrier to extend-ing this work to other domains is the amount of tedious andtime-consuming work required to integrate domain-specificsoftware packages that visually encode new data types intoa software system. Our current GEViTRec implementationis a proof-of-concept that such an end-to-end system, wherethe input of multiple heterogeneous data sources resultsin the automatically generated output of domain-relevantvisually coherent combinations of charts, is viable and thatfurther automation would be a worthwhile investment toextend it to other domains.
8.2 The Relevance of Prevalence
Our algorithm is built to prioritize chart types according to arelevance metric that is built on domain-specific prevalence,namely examining the visual design collections commonly
created by domain experts, in contrast to the many existingrecommender systems use graphical perceptual effective-ness to rank visual encodings. We point out the concern thatrelying on perceptual effectiveness as the sole ranking mech-anism may not be sustainable at scale because of the largenumber of studies that would be necessary even to assesssingle charts, in light of the full range of visual encodingspossible for a heterogeneous array of data types. Moreover,it is even more challenging to fully assess the perceptualimplications of combinations of charts, because they intro-duce perceptual questions that are challenging to isolate inan experiment. Using information from a domain-specificVPDS does not preclude incorporating efficacy judgements.It would be fruitful future work to examine the trade-offs be-tween perceptual effectiveness and domain prevalence, andhow to combine them. If perceptual experiments provideadequate coverage for any specific visualization prevalencedesign space, then it would be possible to penalize relevantvisualizations that are not perceptually effective.
One potential objection to defining relevance accordingto domain-specific prevalence is that domain experts lacka full awareness of the breadth of possible visualizationdesigns and the trade-offs between them. Although weagree that individual domain experts may not be fully awareof how to visualize their data, we have observed that thecollective strategies of a large group of experts can reveal acomplex combinatorial design space. We found that usingthis domain-specific prevalence information in a recom-mender system leads to generating visual encodings thatindividual experts find intriguing and informative, evenwhen they would not have generated them manually. Ourapproach represents only one of many possibilities; futurevisualization recommender systems may contain severaldifferent ranking metrics that may be optimized throughsome combination of machine learning and user input.
8.3 Future WorkIn the process of developing and implementing GEViTRecwe identified several areas of future work. We can continueto improve how GEViTRec lays out chart combinations,the aesthetic design of the charts themselves, and furthertailor visualization output to an expert’s context. We didnot prioritize full optimization of display aesthetics andof every possible design nuance in our proof-of-conceptimplementation. Some types of chart configurations pose anumber of research challenges on their own. For example,automatically resolving visual coherence for some of thenot-supported positional alignments in Figure 3 would notbe trivial. Another area for future exploration is support-ing more constraints on the specifications of visualizationcharts. For example, a hard constraint that a certain fieldmust be used for a specific encoding slot could be en-forced in a similar spirit to Draco’s use of hard and softconstraints [5], but tailored more precisely to the use caseof creating visually coherent combinations. The addition ofnarrative elements, such as text, or staged displays of thedata, could help to alleviate some challenges of interpret-ing visualizations containing a lot of data. In the longerterm, there remain several interesting and challenging is-sues in generating visually coherent combinations, includ-ing integrating more complex types of combinations and
TVCG SUBMISSION 17
incorporating interactivity. By implementing an end-to-endsystem we surfaced several limitations that were not fullyaddressed by our present research. For example, resolvingconflicts between potential chart combinations is handledin a straightforward way by our algorithm, and more so-phisticated approaches could be explored. We intend forthe detailed description of our technique, its use case, andthe GEViTRec proof of concept implementation to informfuture research objectives.
9 CONCLUSION
We have presented a novel algorithm for data reconnais-sance through visualization recommendation, GEViTRec,that automatically generates visually coherent combinationsof charts from multiple heterogeneous datasets. Our ap-proach includes many domain-agnostic components, butalso incorporates information about the prevalence of vi-sualization usage within a specific target domain, in ourcase genomic epidemiology. We created a proof-of-conceptimplementation to demonstrate its capabilities using bothreal and synthetic data, and conducted a thorough quali-tative evaluation with ten domain experts to validate ourclaims that our method quickly produces relevant and in-terpretable views of data.
ACKNOWLEDGMENTS
We thank Madison Elliott, Steve Kasica, Zipeng Liu, MichaelOppermann, and Ben Shneiderman for their thoughtfulcomments and feedback. We also acknowledge and thankour study participants for their time and insights.
REFERENCES
[1] A. Crisan and T. Munzner, “Uncovering data landscapes throughdata reconnaissance and task wrangling,” in Proc. IEEE Conf. VIS(Short Papers), 2019.
[2] J. Mackinlay, “Automating the design of graphical presentationsof relational information,” ACM Trans. Graphics, vol. 5, no. 2, pp.110–141, Apr 1986.
[3] J. Mackinlay, P. Hanrahan, and C. Stolte, “Show Me: AutomaticPresentation for Visual Analysis,” IEEE Trans. Visualization & Com-puter Graphics, vol. 13, no. 6, pp. 1137–1144, Nov. 2007.
[4] K. Wongsuphasawat, Z. Qu, D. Moritz, R. Chang, F. Ouk,A. Anand, J. Mackinlay, B. Howe, and J. Heer, “Voyager 2: Aug-menting visual analysis with partial view specifications,” in Proc.ACM Conf. Human Factors in Computing Systems (CHI), 2017, pp.2648–2659.
[5] D. Moritz, C. Wang, G. Nelson, H. Lin, A. M. Smith, B. Howe,and J. Heer, “Formalizing visualization design knowledge as con-straints: Actionable and extensible models in Draco,” IEEE Trans.Visualization & Computer Graphics, vol. 25, no. 1, pp. 438–448, Jan2019.
[6] A. Crisan, J. L. Gardy, and T. Munzner, “A Systematic Methodfor Surveying Data Visualizations and a Resulting Genomic Epi-demiology Visualization Typology: GEViT,” Bioinformatics, vol. 35,no. 10, pp. 1668–1676, 09 2018.
[7] H. Lam, “A framework of interaction costs in information visu-alization,” IEEE Trans. Visualization & Computer Graphics, vol. 14,no. 6, pp. 1149–1156, 2008.
[8] J. L. Gardy and N. J. Loman, “Towards a Genomics-informed,Real-time, Global Pathogen Surveillance system,” Nature ReviewsGenetics, vol. 19, no. 1, pp. 9–20, 2018.
[9] A. Crisan, J. L. Gardy, and T. Munzner, “On regulatory andorganizational constraints in visualization design and evaluation,”Proc. Workshop Beyond Time and Errors: Novel Evaluation Methods forVisualization, vol. 1, pp. 1–9, 2016.
[10] A. Crisan, G. McKee, T. Munzner, and J. L. Gardy, “Evidence-baseddesign and evaluation of a whole genome sequencing clinicalreport for the reference microbiology laboratory,” PeerJ, vol. 6, p.e4218, Jan. 2018.
[11] S. K. Card and J. Mackinlay, “The structure of the informationvisualization design space,” in Proc. IEEE Symp. Information Visu-alization (InfoVis), 1997, p. 92.
[12] B. Alsallakh, L. Micallef, W. Aigner, H. Hauser, S. Miksch, andP. Rodgers, “Visualizing sets and set-typed data: State-of-the-artand future challenges,” in EuroVis State of the Art Report. TheEurographics Association, 2014.
[13] H.-J. Schulz, “Treevis.net: A Tree Visualization Reference,” IEEEComputer Graphics & Applications, vol. 31, no. 6, pp. 11–15, Nov2011.
[14] K. Morton, M. Balazinska, D. Grossman, R. Kosara, and J. Mackin-lay, “Public data and visualizations: How are Many Eyes andTableau Public used for collaborative analytics?” ACM SIGMODRec., vol. 43, no. 2, pp. 17–22, 2014.
[15] F. B. Viegas, M. Wattenberg, F. van Ham, J. Kriss, and M. McKeon,“ManyEyes: a site for visualization at internet scale,” IEEE Trans.Visualization & Computer Graphics, vol. 13, no. 6, pp. 1121–1128,2007.
[16] T. Munzner, Visualization Analysis and Design, ser. A.K. PetersVisualization Series. Boca Raton, Florida: CRC Press, 2015.
[17] M. Gleicher, D. Albers, R. Walker, I. Jusufi, C. D. Hansen, andJ. C. Roberts, “Visual comparison for information visualization,”Information Visualization, vol. 10, no. 4, pp. 289–309, 2011.
[18] S. L’Yi, J. Jo, and J. Seo, “Comparative layouts revisited: Designspace, guidelines, and future directions,” IEEE Trans. Visualization& Computer Graphics, pp. 1–1, 2020.
[19] Z. Qu and J. Hullman, “Keeping multiple views consistent: Con-straints, validations, and exceptions in visualization authoring,”IEEE Trans. Visualization & Computer Graphics, vol. 24, no. 1, pp.468–477, 2018.
[20] A. Sarikaya, M. Correll, L. Bartram, M. Tory, and D. Fisher, “Whatdo we talk about when we talk about dashboards?” IEEE Trans.Visualization & Computer Graphics, vol. 25, no. 1, pp. 682–692, Jan2019.
[21] E. Dimara and C. Perin, “What is interaction for data visualiza-tion?” IEEE Trans. Visualization & Computer Graphics, vol. 26, no. 1,pp. 119–129, 2020.
[22] J. J. van Wijk, “Views on visualization,” IEEE Trans. Visualization &Computer Graphics, vol. 12, no. 4, pp. 421–432, 2006.
[23] L. Battle and J. Heer, “Characterizing Exploratory Visual Analysis:A Literature Review and Evaluation of Analytic Provenance inTableau,” Computer Graphics Forum, vol. 38, no. 3, pp. 145–159,2019.
[24] J. Boy, L. Eveillard, F. Detienne, and J. Fekete, “Suggested inter-activity: Seeking perceived affordances for information visualiza-tion,” IEEE Trans. Visualization & Computer Graphics, vol. 22, no. 1,pp. 639–648, 2016.
[25] J. Kehrer and H. Hauser, “Visualization and visual analysis ofmultifaceted scientific data: A survey,” IEEE Trans. Visualization& Computer Graphics, vol. 19, no. 3, pp. 495–513, 2013.
[26] K. Wongsuphasawat, D. Moritz, A. Anand, J. Mackinlay, D. Howe,and J. Heer, “Voyager: Exploratory analysis via faceted browsingof visualization recommendations,” IEEE Trans. Visualization &Computer Graphics, vol. 22, no. 1, pp. 649–658, Jan 2016.
[27] T. Siddiqui, A. Kim, J. Lee, K. Karahalios, and A. Parameswaran,“Effortless data exploration with Zenvisage: An expressive andinteractive visual analytics system,” Proc. VLDB Endow., vol. 10,no. 4, p. 457468, Nov. 2016.
[28] M. Vartak, S. Rahman, S. Madden, A. Parameswaran, and N. Poly-zotis, “SeeDB: Efficient data-driven visualization recommenda-tions to support visual analytics,” Proc. VLDB Endow., vol. 8,no. 13, p. 21822193, Sep. 2015.
[29] A. Key, B. Howe, D. Perry, and C. Aragon, “VizDeck: Self-organizing dashboards for visual analytics,” in Proc. ACM Intl.Conf. Management of Data (SIGMOD 2012), 2012, p. 681684.
[30] C. Demiralp, P. J. Haas, S. Parthasarathy, and T. Pedapati, “Fore-sight: Rapid data exploration through guideposts,” in Proc. IEEEWorkshop Data Systems for Interactive Analysis (DSIA), 2017.
[31] J. Seo and B. Shneiderman, “A rank-by-feature framework for un-supervised multidimensional data exploration using low dimen-sional projections,” in Proc. IEEE Symp. Information Visualization,2004, pp. 65–72.
TVCG SUBMISSION 18
[32] G. Wills and L. Wilkinson, “AutoVis: Automatic visualization,”Information Visualization, vol. 9, no. 1, p. 4769, 2010.
[33] V. Dibia and C. Demiralp, “Data2Vis: Automatic generation ofdata visualizations using sequence-to-sequence recurrent neuralnetworks,” IEEE Computer Graphics & Applications, vol. 39, no. 5,pp. 33–46, 2019.
[34] K. Hu, M. A. Bakker, S. Li, T. Kraska, and C. Hidalgo, “VizML: Amachine learning approach to visualization recommendation,” inProc. ACM Conf. Human Factors in Computing Systems (CHI), 2019,pp. 128:1–128:12.
[35] O. Gilson, N. Silva, P. W. Grant, and M. Chen, “From web datato visualization via ontology mapping,” in Proc. Eurographics/IEEEConf. Visualization (EuroVis), 2008, pp. 959–966.
[36] M. Cammarano, X. Dong, B. Chan, J. Klingner, J. Talbot, A. Halevy,and P. Hanrahan, “Visualization of heterogeneous data,” IEEETrans. Visualization & Computer Graphics, vol. 13, pp. 1200–1207,2007.
[37] B. Mutlu, E. Veas, and C. Trattner, “Vizrec: Recommending per-sonalized visualizations,” ACM Trans. Interact. Intell. Syst., vol. 6,no. 4, pp. 31:1–31:39, Nov. 2016.
[38] S. Kairam, N. H. Riche, S. Drucker, R. Fernandez, and J. Heer,“Refinery: Visual exploration of large, heterogeneous networksthrough associative browsing,” Comput. Graph. Forum, vol. 34,no. 3, p. 301310, 2015.
[39] C. Xie, W. Zhong, W. Xu, and K. Mueller, “Visual analytics of het-erogeneous data using hypergraph learning,” ACM Trans. Intell.Syst. Technol., vol. 10, no. 1, 2018.
[40] P. Angelelli, S. Oeltze, J. Hasz, C. Turkay, E. Hodneland, A. Lun-dervold, A. J. Lundervold, B. Preim, and H. Hauser, “Interactivevisual analysis of heterogeneous cohort-study data,” IEEE Com-puter Graphics and Applications, vol. 34, no. 5, pp. 70–82, 2014.
[41] C. Nobre, N. Gehlenborg, H. Coon, and A. Lex, “Lineage: Visual-izing multivariate clinical data in genealogy graphs,” IEEE Trans.Visualization & Computer Graphics, vol. 25, no. 3, pp. 1543–1558,2019.
[42] S. Gratzl, N. Gehlenborg, A. Lex, H. Pfister, and M. Streit,“Domino: Extracting, comparing, and manipulating subsets acrossmultiple tabular datasets,” IEEE Trans. Visualization & ComputerGraphics, vol. 20, no. 12, pp. 2023–2032, 2014.
[43] J. Huerta-Cepas, F. Serra, and P. Bork, “ETE 3: Reconstruction,Analysis, and Visualization of Phylogenomic Data,” MolecularBiology and Evolution, vol. 33, no. 6, pp. 1635–1638, June 2016.
[44] G. Dudas, “Baltic,” https://github.com/evogytis/baltic, 2019, ac-cessed: 2019-03-25.
[45] E. Paradis and K. Schliep, “ape 5.0: an environment for modernphylogenetics and evolutionary analyses in R,” Bioinformatics,vol. 35, pp. 526–528, 2018.
[46] H. Wickham, ggplot2: Elegant Graphics for Data Analysis. NewYork, NY: Springer-Verlag, 2016.
[47] G. Yu, D. K. Smith, H. Zhu, Y. Guan, and T. T.-Y. Lam, “ggtree: anr package for visualization and annotation of phylogenetic treeswith their covariates and other associated data,” Methods in Ecologyand Evolution, vol. 8, no. 1, pp. 28–36, 2017.
[48] J. Hadfield, C. Megill, S. M. Bell, J. Huddleston, B. Potter, C. Cal-lender, P. Sagulenko, T. Bedford, and R. A. Neher, “Nextstrain:Real-time tracking of pathogen evolution,” Bioinformatics, vol. 34,no. 23, pp. 4121–4123, Dec 2018.
[49] S. Argimon, K. Abudahab, R. J. E. Goater, A. Fedosejev, J. Bhai,C. Glasner, E. J. Feil, M. T. G. Holden, C. A. Yeats, H. Grundmann,B. G. Spratt, and D. M. Aanensen, “Microreact: Visualizing andSharing Data for Genomic Epidemiology and Phylogeography,”Microbial Genomics, vol. 2, 2016.
[50] A. Cruz, J. P. Arrais, and P. Machado, “Interactive and coordinatedvisualization approaches for biological data analysis,” Briefings inBioinformatics, vol. 20, no. 4, pp. 1513–1523, 03 2018.
[51] J. C. Roberts, “State of the art: Coordinated multiple views inexploratory visualization,” in Intl. Conf. Coordinated and MultipleViews in Exploratory Visualization (CMV), July 2007, pp. 61–71.
[52] C. Weaver, “Building highly-coordinated visualizations in impro-vise,” in IEEE Symp. Information Visualization, Oct 2004, pp. 159–166.
[53] A. Satyanarayan and J. Heer, “Lyra: An interactive visualizationdesign environment,” Computer Graphics Forum (Proc. EuroVis),2014.
[54] Z. Liu, J. Thompson, A. Wilson, M. Dontcheva, J. Delorey, S. Grigg,B. Kerr, and J. Stasko, “Data illustrator: Augmenting vector designtools with lazy data binding for expressive visualization author-
ing,” in Proc. ACM Conf. Human Factors in Computing Systems(CHI), 2018, pp. 123:1–123:13.
[55] D. Ren, B. Lee, and M. Brehmer, “Charticulator: Interactive con-struction of bespoke chart layouts,” IEEE Trans. Visualization &Computer Graphics, vol. 25, no. 1, pp. 789–799, 2019.
[56] J. Heer and M. Bostock, “Crowdsourcing graphical perception:Using Mechanical Turk to assess visualization design,” in Proc.ACM Conf. Human Factors in Computing Systems (CHI), 2010, pp.203–212.
[57] A. Satyanarayan, D. Moritz, K. Wongsuphasawat, and J. Heer,“Vega-lite: A grammar of interactive graphics,” IEEE Trans. Vi-sualization & Computer Graphics, vol. 23, no. 1, pp. 341–350, 2017.
[58] A. Slingsby, J. Dykes, and J. Wood, “Configuring hierarchicallayouts to address research questions,” IEEE Trans. Visualization& Computer Graphics, vol. 15, no. 6, pp. 977–984, Nov 2009.
[59] D. Park, S. M. Drucker, R. Fernandez, and N. Elmqvist, “Atom:A grammar for unit visualizations,” IEEE Trans. Visualization &Computer Graphics, vol. 24, no. 12, pp. 3032–3043, 2018.
[60] A. M. McNutt, “Integrated visualization editing via parameterizeddeclarative templates,” Feb 2021. [Online]. Available: osf.io/cture
[61] W. S. Cleveland and R. McGill, “Graphical perception: Theory,experimentation, and application to the development of graphicalmethods,” Journ. American Statistical Association, vol. 79, no. 387,pp. 531–554, 1984.
[62] G. Dudas, L. M. . M. A. Carvalho, P. Lemey, and A. Rambaut,“Virus Genomes Reveal Factors that Spread and Sustained theEbola Epidemic,” Nature, vol. 544, p. 309, Apr 2017.
[63] T. Hey, S. Tansley, and K. Tolle, The Fourth Paradigm: Data-IntensiveScientific Discovery. Microsoft Research, 2009. [Online]. Avail-able: https://www.microsoft.com/en-us/research/publication/fourth-paradigm-data-intensive-scientific-discovery/
Anamaria Crisan is a Research Scientist atTableau. She completed her PhD in ComputerScience in 2019 at the University of BritishColumbia. Her research explores visualizationthrough the data analysis life cycle with an em-phasis on biomedical applications. Her work onthis project was supported by a Vanier Award.
Shannah E. Fisher conducted this work as anundergraduate student in Computer Science andCell and Developmental Biology at the Universityof British Columbia. She is now with the Univer-sity of Saskatchewan.
Jennifer L. Gardy is the deputy director, Surveil-lance, Data, and Epidemiology for the Malariateam at the Bill & Melinda Gates Foundation.Before that, she spent ten years at the BCCentre for Disease Control and the Universityof British Columbia’s School of Population andPublic Health, where she held the Canada Re-search Chair in Public Health Genomics. Herresearch focused on the use of genomics as atool to understand pathogen transmission.
Tamara Munzner is a professor at the Univer-sity of British Columbia, and holds a PhD fromStanford. She has co-chaired InfoVis and Euro-Vis, and received the IEEE VGTC VisualizationTechnical Achievement Award. She has workedon visualization projects in a broad range of ap-plication domains from genomics to journalism.Her book Visualization Analysis and Design ap-peared in 2014, and she co-edits the AK PetersVisualization book series with CRC Press.