Embed Size (px)
Citation preview
26/09/04CEA-SHFJ
MADIC
Tutorial MICCAI'04
fMRI data analysis: state of the art and future challenges
Jean-Baptiste PolinePhilippe CiuciuAlexis Roche
CEA/SHFJ, Orsay (France)
26/09/04CEA-SHFJ
MADIC
Goal of this tutorial and plan
I. Talk 1: will orientate you in the jungle of fMRI data analyses and associated questions in neurosciences
II. Talk 2: will teach you what you should know on the BOLD hemodynamic response and its models
III. Talk 3: will develop the specific challenges of group analyses
26/09/04CEA-SHFJ
MADIC
A road map of fMRI data analysis : from acquisition to publication
I. Introduction: what are fMRI data ? What are they used for ? Some background on neuroimaging
II.The standard fMRI analysis and « classical » activation detection
III. Emerging themes in fMRI
IV. Conclusion
26/09/04CEA-SHFJ
MADIC
Introduction: what are fMRI data ?
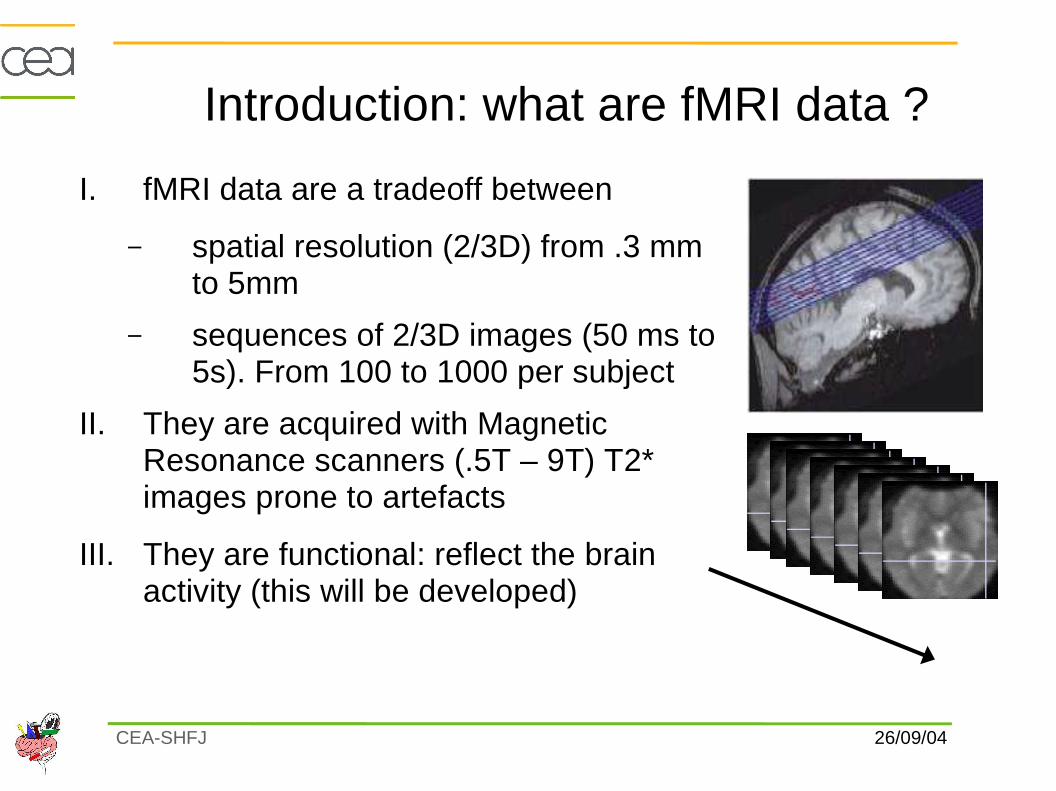
I. fMRI data are a tradeoff between
– spatial resolution (2/3D) from .3 mm to 5mm
– sequences of 2/3D images (50 ms to 5s). From 100 to 1000 per subject
II. They are acquired with Magnetic Resonance scanners (.5T – 9T) T2* images prone to artefacts
III. They are functional: reflect the brain activity (this will be developed)
time
26/09/04CEA-SHFJ
MADIC
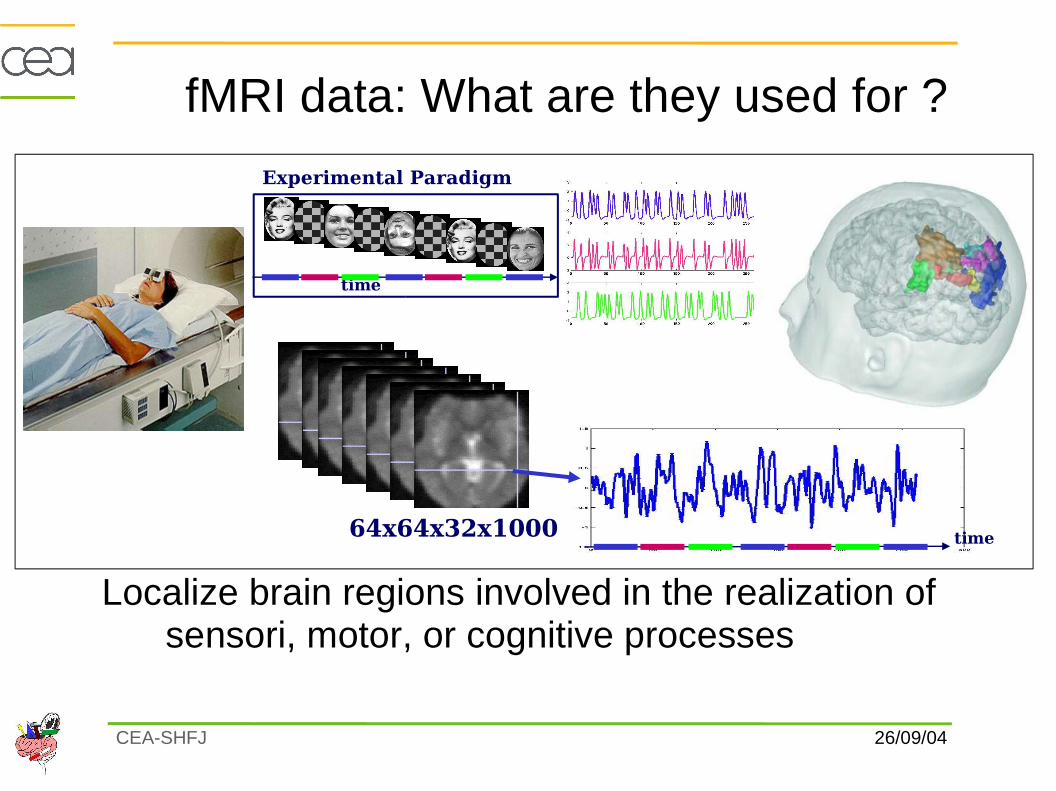
fMRI data: What are they used for ?
Localize brain regions involved in the realization of sensori, motor, or cognitive processes
time
Experimental Paradigm
64x64x32x1000 time
26/09/04CEA-SHFJ
MADIC
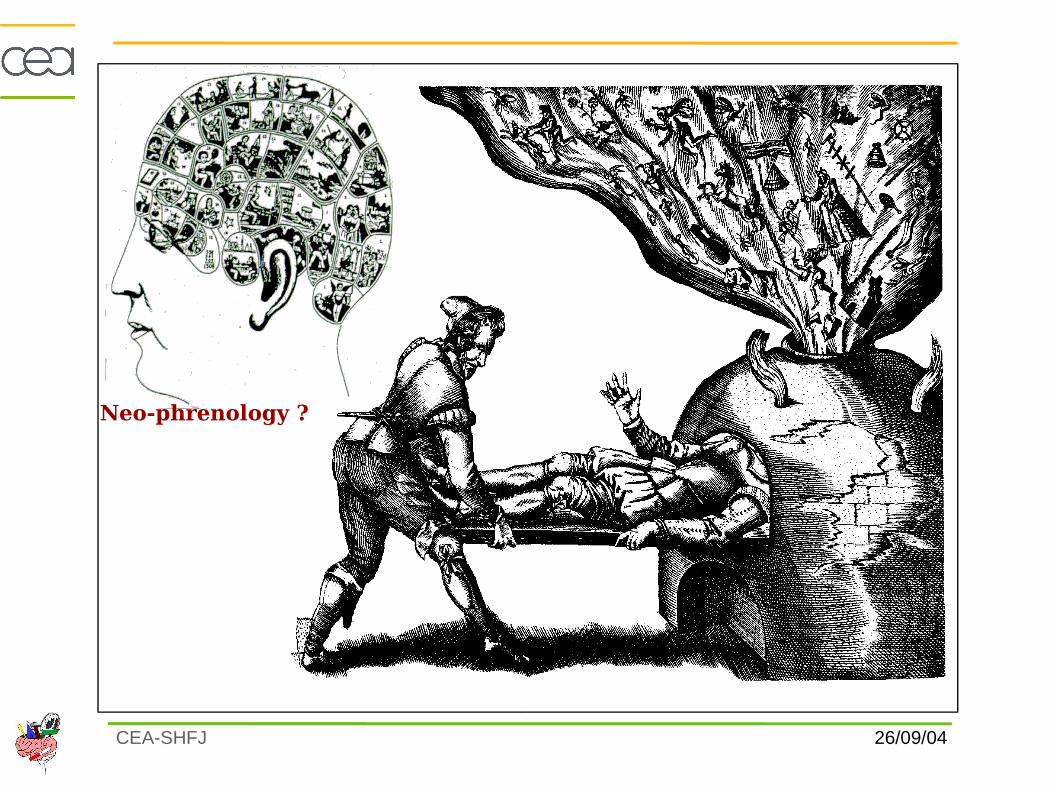
Neo-phrenology ?
26/09/04CEA-SHFJ
MADIC
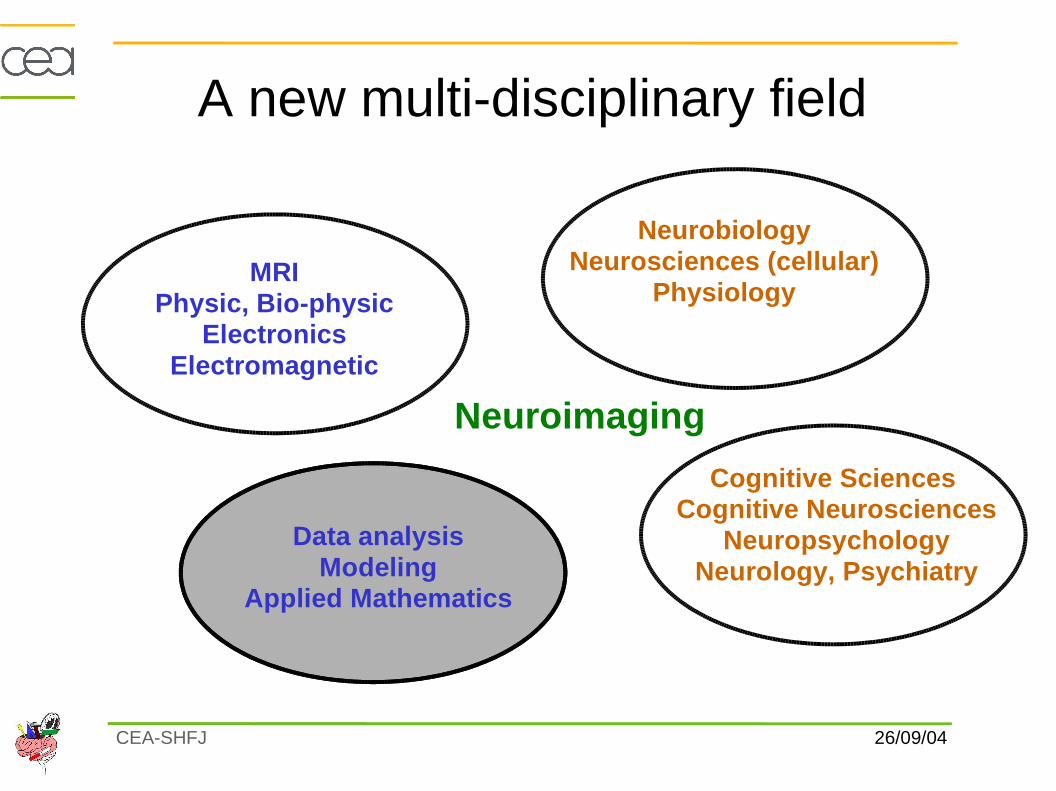
A new multi-disciplinary field
MRIPhysic, Bio-physic
ElectronicsElectromagnetic
NeurobiologyNeurosciences (cellular)
Physiology
Cognitive Sciences Cognitive Neurosciences
NeuropsychologyNeurology, Psychiatry
Data analysisModeling
Applied Mathematics
Neuroimaging
26/09/04CEA-SHFJ
MADIC
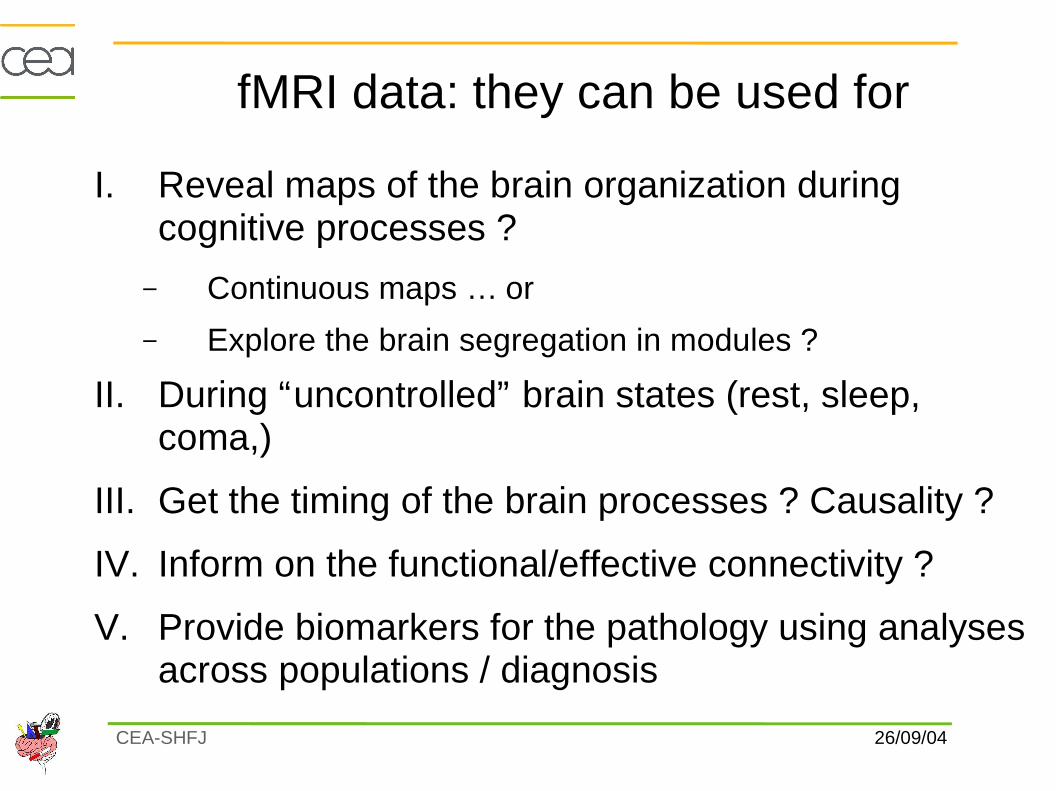
fMRI data: they can be used for
I. Reveal maps of the brain organization during cognitive processes ?
– Continuous maps … or
– Explore the brain segregation in modules ?
II. During “uncontrolled” brain states (rest, sleep, coma,)
III. Get the timing of the brain processes ? Causality ?
IV. Inform on the functional/effective connectivity ?
V. Provide biomarkers for the pathology using analyses across populations / diagnosis
26/09/04CEA-SHFJ
MADIC
Methods used in fMRI analyses
I. Simple voxel wise statistics (t, F, Chi2, …)
II. Multivariate Methods (PCA, PLS, CVA, ICA, pICA, IB, etc)
III. Wavelets (1D, 2D, 3D ?)
IV. Clustering (supervised, unsupervised, LDA, SVM, …)
V. Bayesian Statistics; PEB; Non parametric statistics
VI. Markov fields; Spatial models
VII. Information theory
VIII. Optimisation/Estimation (EM, MCMC, …)
IX. Graph theory, dynamical systems, …
26/09/04CEA-SHFJ
MADIC
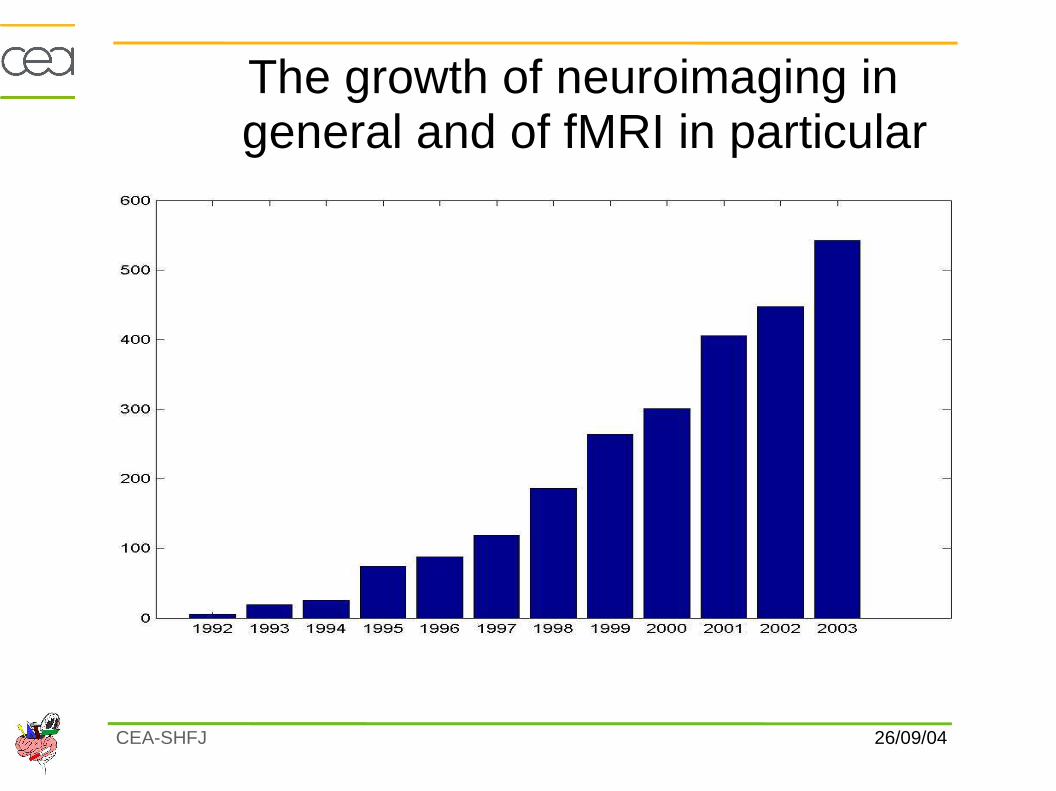
The growth of neuroimaging in general and of fMRI in particular
Number of published papers
Papers that contain fMRI in their titleSource : pubmed
26/09/04CEA-SHFJ
MADIC
Part II: Standard analyses
• The truth about fMRI data
• Modelling the experimental paradigm
i. Univariate
ii. Multivariate
• The Multiple comparison problem
Part II
Part I
26/09/04CEA-SHFJ
MADIC
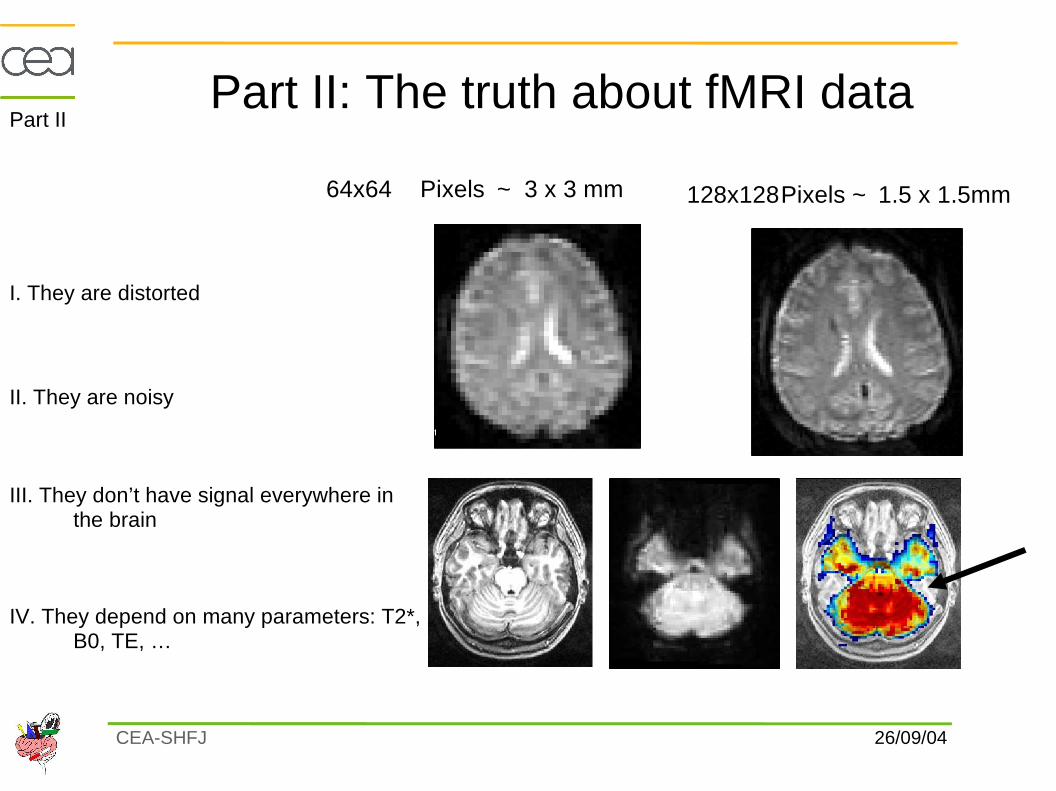
Part II: The truth about fMRI data
64x64 Pixels ~ 3 x 3 mm 128x128Pixels ~ 1.5 x 1.5mm
I. They are distorted
II. They are noisy
III. They don’t have signal everywhere in the brain
IV. They depend on many parameters: T2*, B0, TE, …
Part II
26/09/04CEA-SHFJ
MADIC
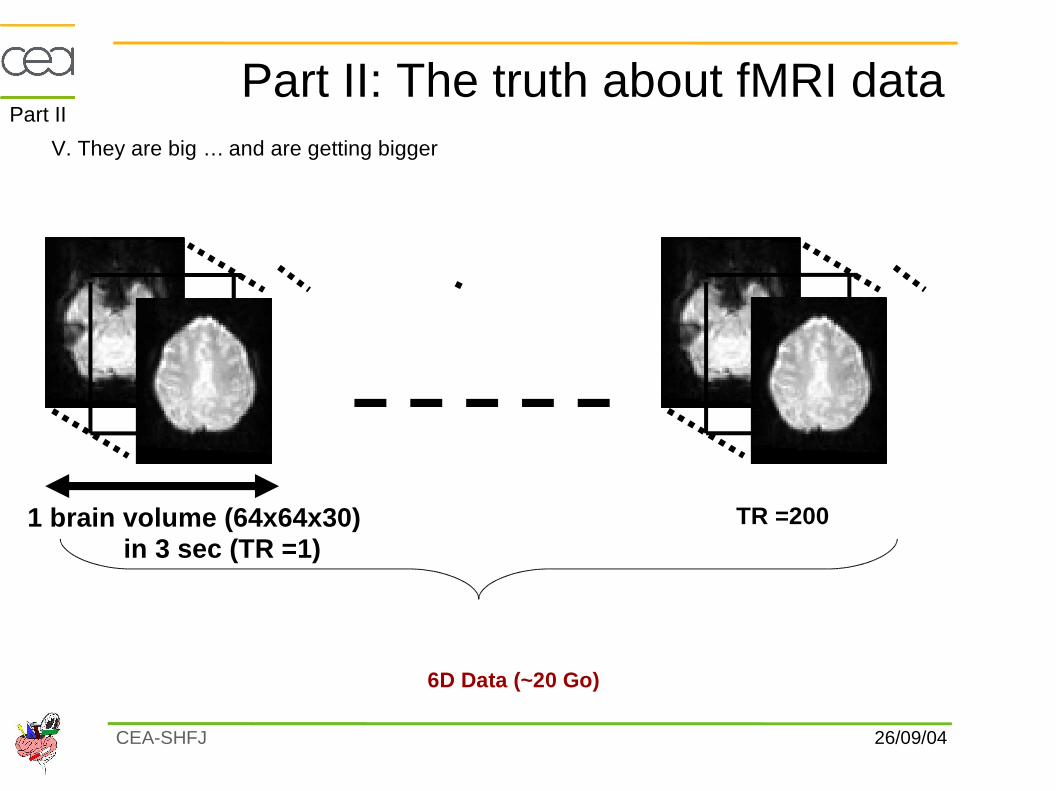
Part II: The truth about fMRI data
1 brain volume (64x64x30) in 3 sec (TR =1)
V. They are big … and are getting bigger
T=1T=2
T=30
T=1T=2
T=30
TR =200
T=1T=16
T=30
T=2
This is ONE run; often 3-8 runs X 15 subjects 6D Data (~20 Go)
Part II
26/09/04CEA-SHFJ
MADIC
Part II: The standard fMRI analysis and « classical » activation detection
I. A method used in 95% of the publications
II. Simple, fast, easy to understand for neuroscientists, found in most packages (SPM, FSL, AFNI, BrainVoyager, Rumba, etc …)
III. Developed in the framework of medical statistics (Analysis of Variance) and easily accepted by journals
Part II
26/09/04CEA-SHFJ
MADIC
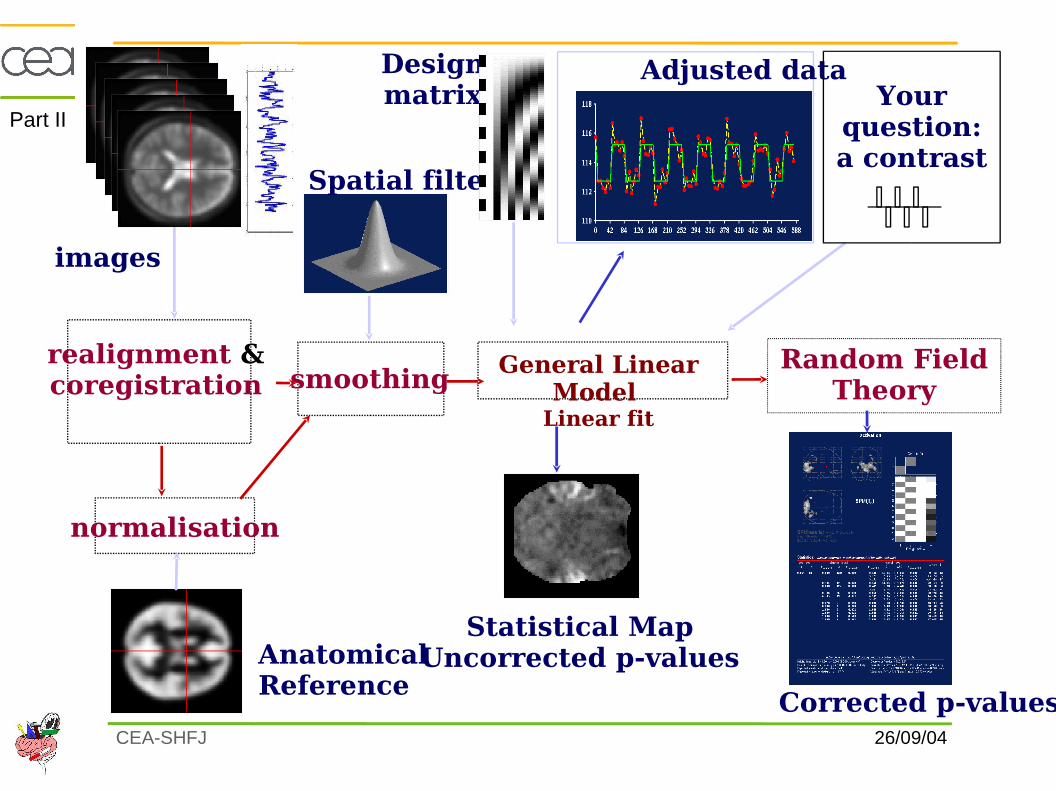
realignment &coregistration smoothing
normalisation
Corrected p-values
images
Adjusted dataDesignmatrix
Anatomical Reference
Spatial filter
Random Field Theory
Your question:a contrast
Statistical MapUncorrected p-values
General Linear Model
Linear fit
Part II
26/09/04CEA-SHFJ
MADIC
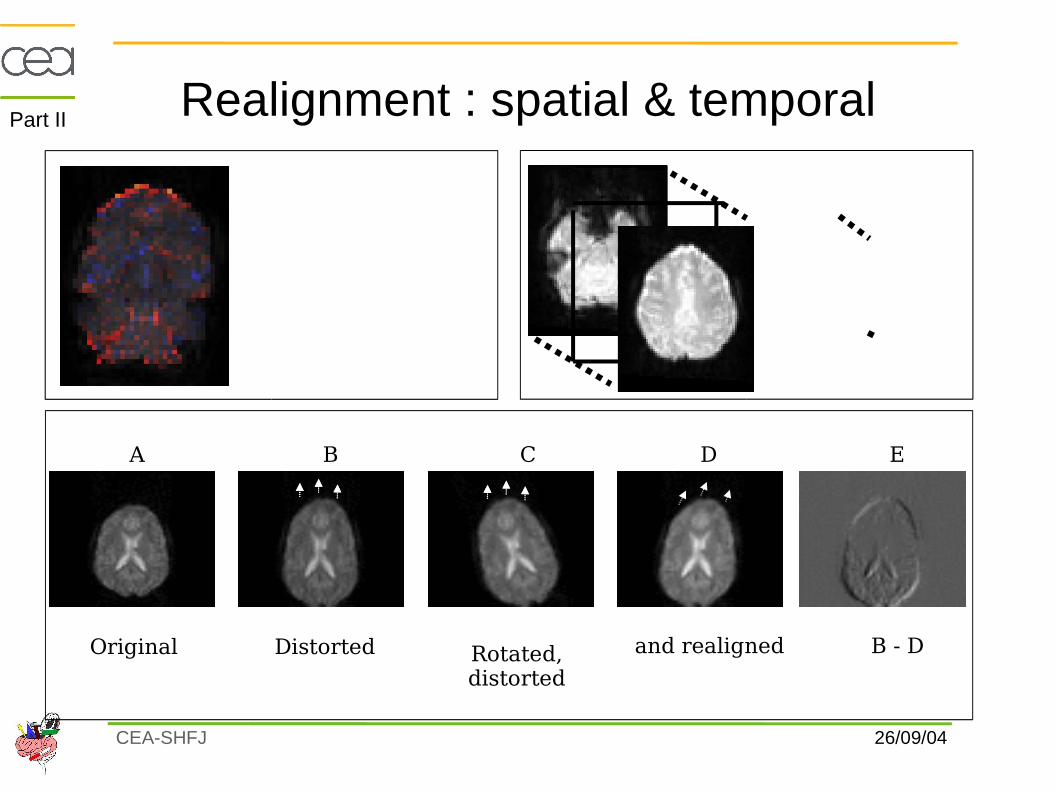
Realignment : spatial & temporal
Original Distorted Rotated, distorted
and realigned
A B C D E
B - D
1st eigenimage : loads of variance on the border
T=1T=2
T=30T=1T=16
T=30
T=2
Part II
26/09/04CEA-SHFJ
MADIC
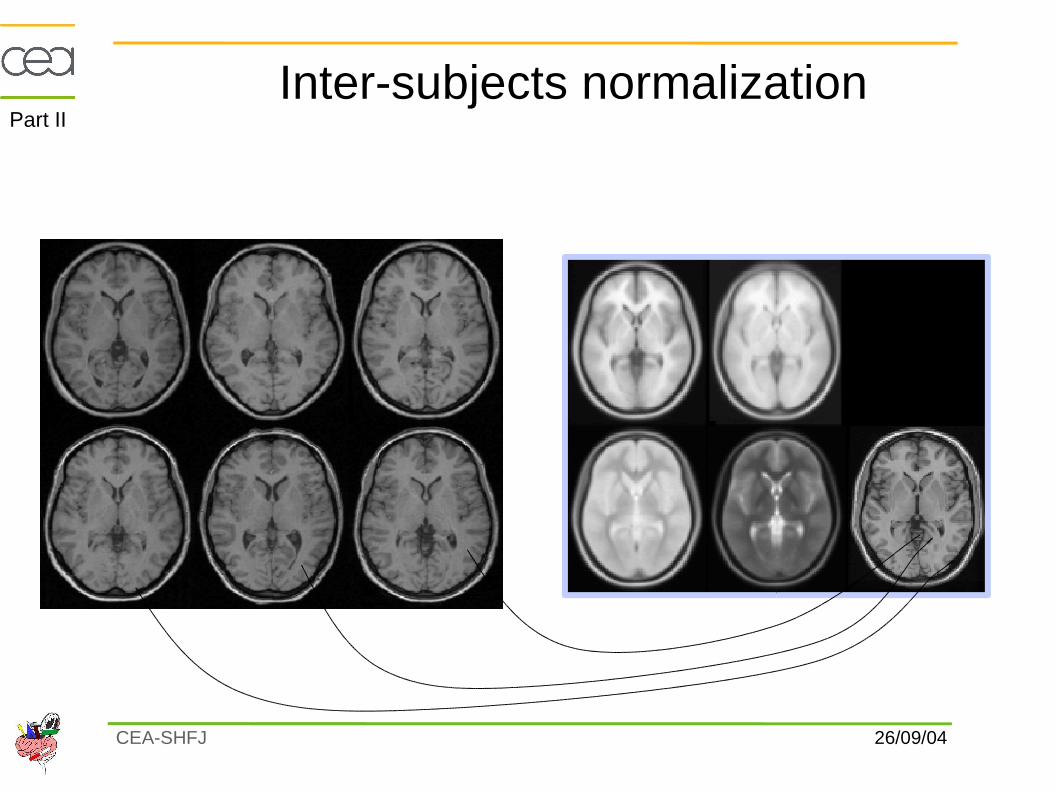
Inter-subjects normalization
Subj 1 Subj 2 Subj 3
Subj 4 Subj 5 Subj 6
Template / canonical brain
Part II
26/09/04CEA-SHFJ
MADIC
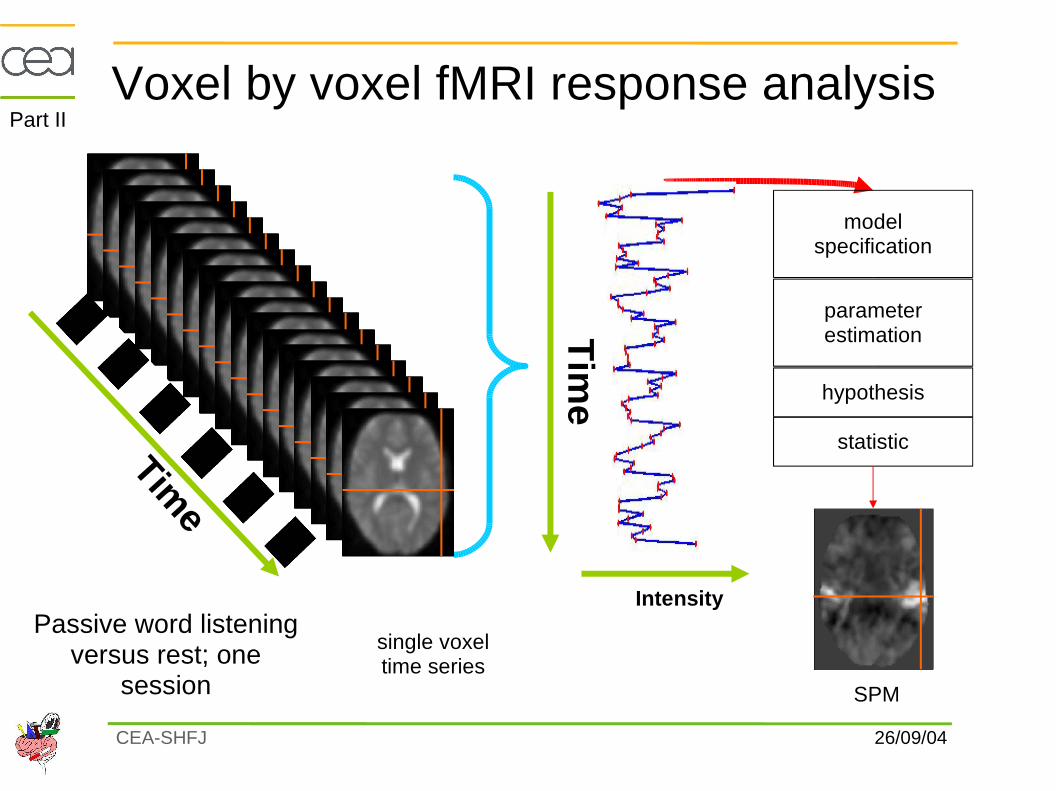
Time
Intensity
Tim
e
single voxeltime series
Voxel by voxel fMRI response analysis
modelspecification
parameterestimation
hypothesis
statistic
SPM
Passive word listeningversus rest; one
session
Part II
26/09/04CEA-SHFJ
MADIC
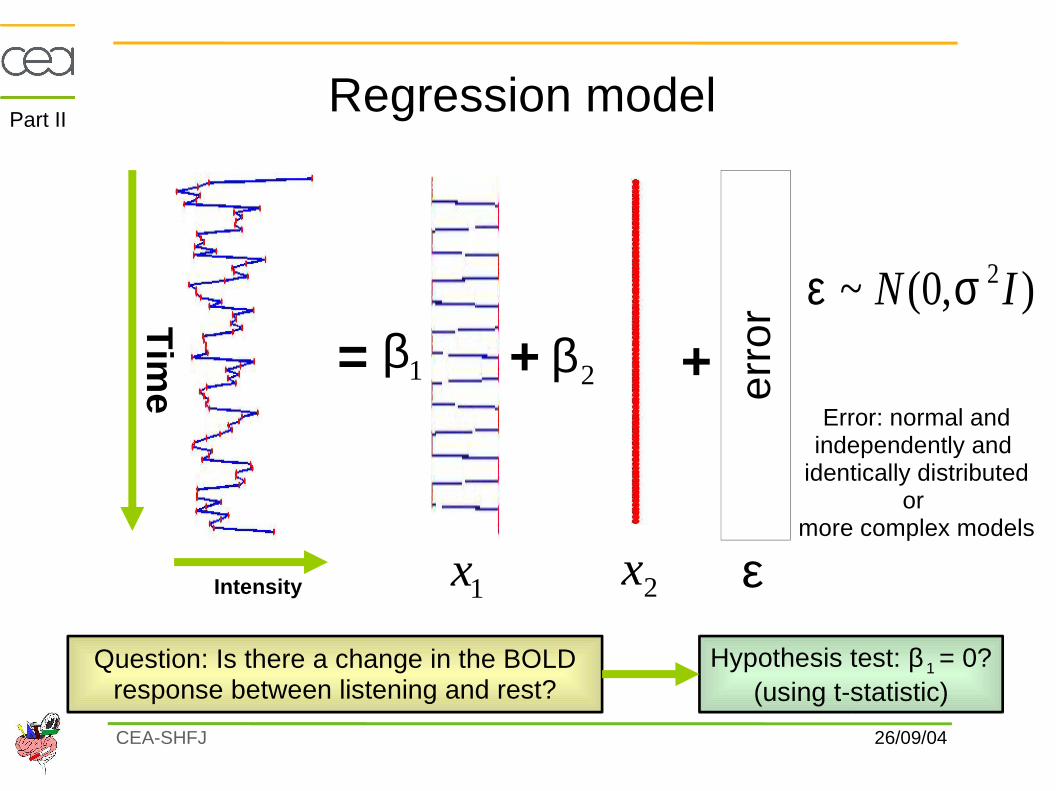
Intensity
Tim
e
Regression model
= + + erro
r
Error: normal andindependently and
identically distributedor
more complex models
Question: Is there a change in the BOLD response between listening and rest?
Hypothesis test: β 1 = 0?(using t-statistic)
1β2β
1x 2x ε
),0(~ 2IN σε
Part II
26/09/04CEA-SHFJ
MADIC
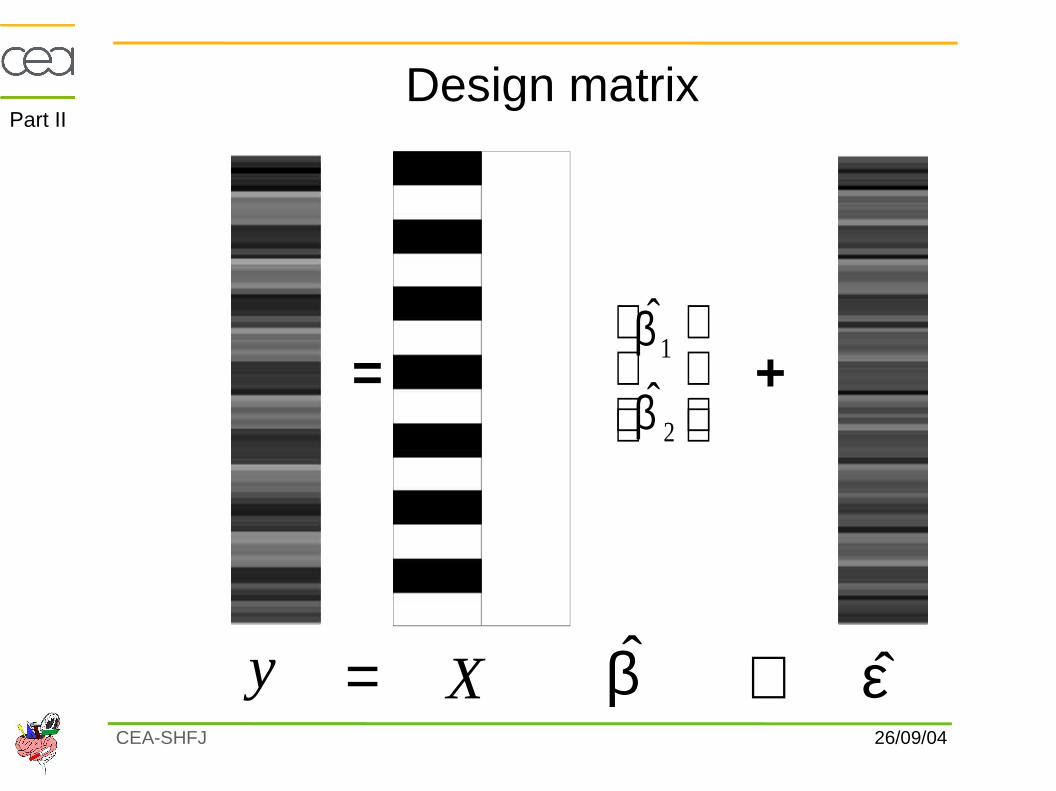
Design matrix
= +
2
1
ˆ
ˆ
β
β
y + ε= X β
Part II
26/09/04CEA-SHFJ
MADIC
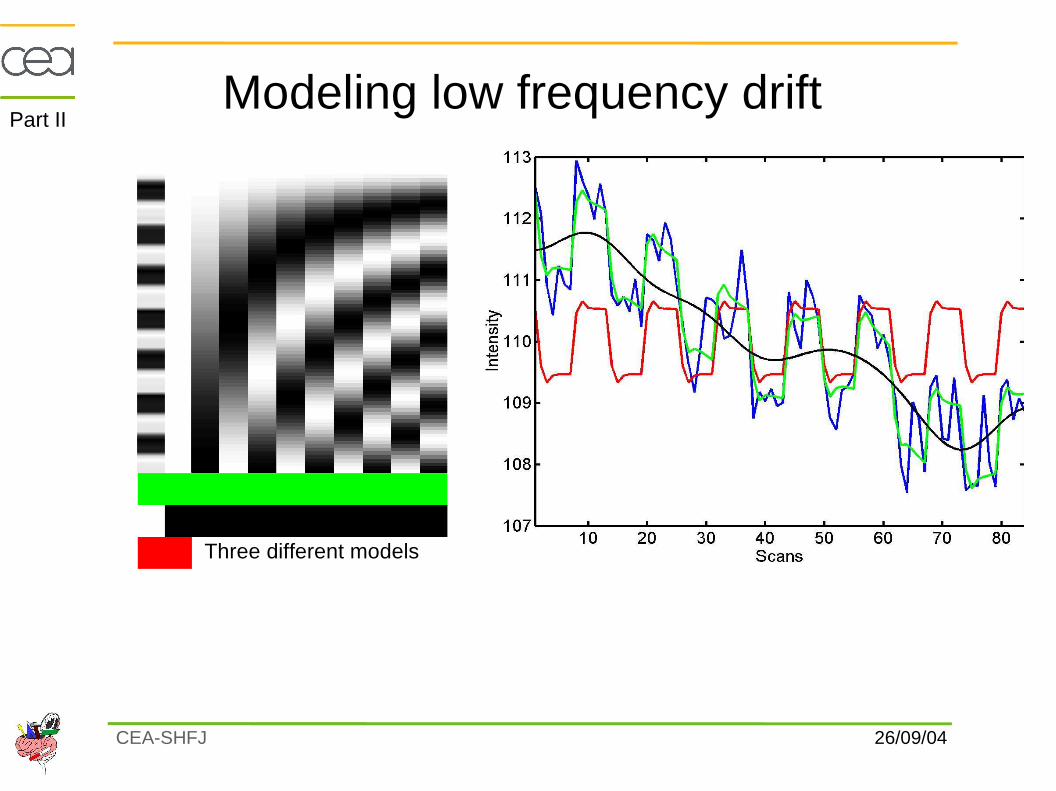
Modeling low frequency drift
Three different models
X:
The good: All sort of effect (measured or assumed) can be added The bad: We don’t know which one should be inThe ugly: Models are rarely checked, assumed constant across voxels,
assumed linearity
Part II
26/09/04CEA-SHFJ
MADIC
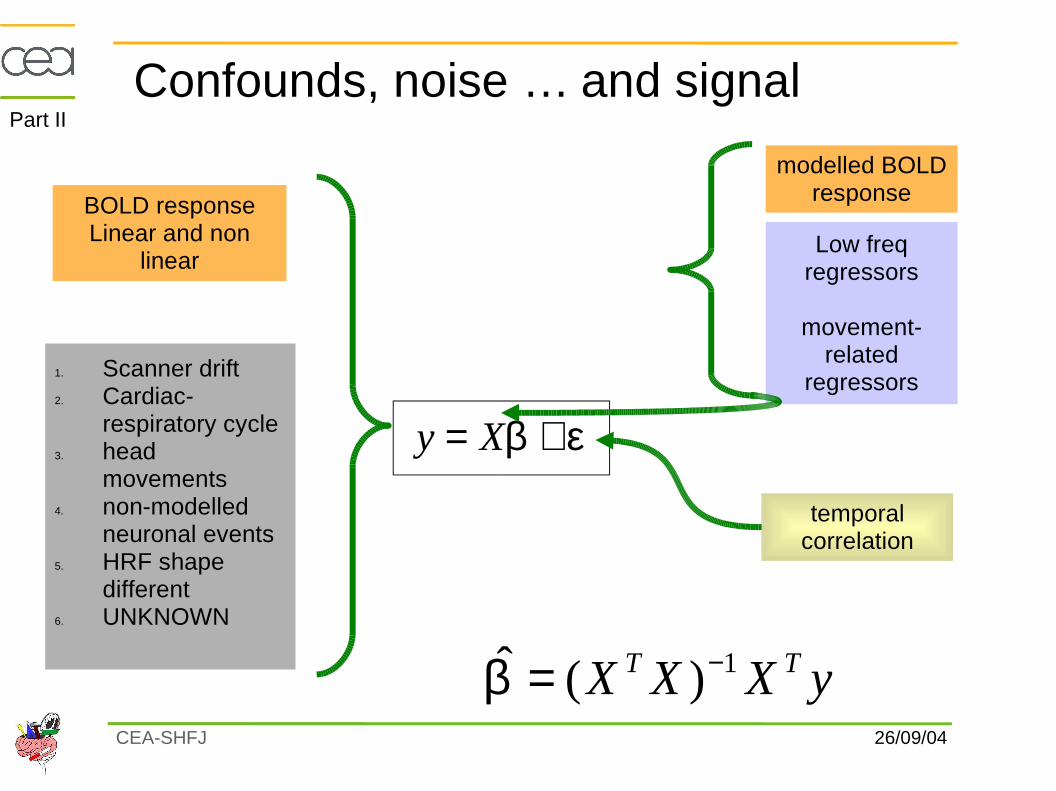
temporal correlation
Confounds, noise … and signal
1. Scanner drift2. Cardiac-
respiratory cycle3. head
movements4. non-modelled
neuronal events5. HRF shape
different6. UNKNOWN
BOLD responseLinear and non
linear
εβ += Xy
modelled BOLD response
Low freq regressors
movement-related
regressors
yXXX TT 1)(ˆ −=βParameter Estimation with OLS
Part II
26/09/04CEA-SHFJ
MADIC
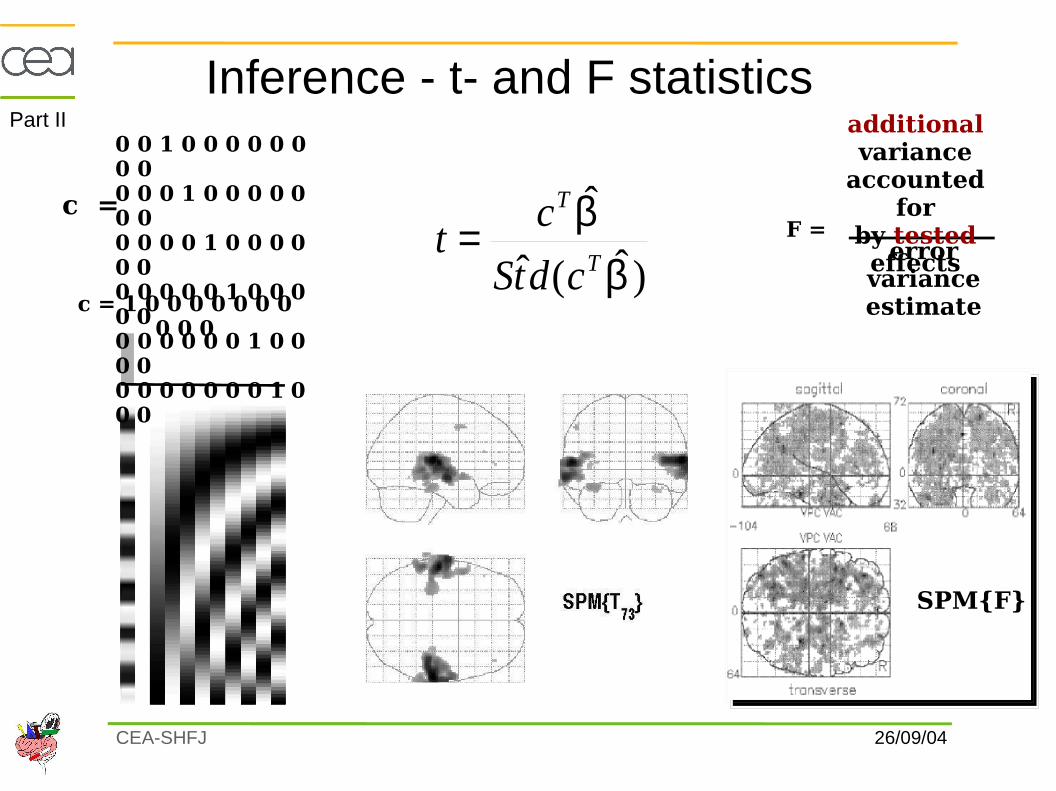
Inference - t- and F statistics
c = 1 0 0 0 0 0 0 0 0 0 0
)ˆ(ˆ
ˆ
ββ
T
T
cdtS
ct =
0 0 1 0 0 0 0 0 0 0 0 0 0 0 1 0 0 0 0 0 0 00 0 0 0 1 0 0 0 0 0 00 0 0 0 0 1 0 0 0 0 00 0 0 0 0 0 1 0 0 0 00 0 0 0 0 0 0 1 0 0 0
c =
SPMF
F = error
varianceestimate
additionalvariance
accounted for
by tested effects
Part II
26/09/04CEA-SHFJ
MADIC
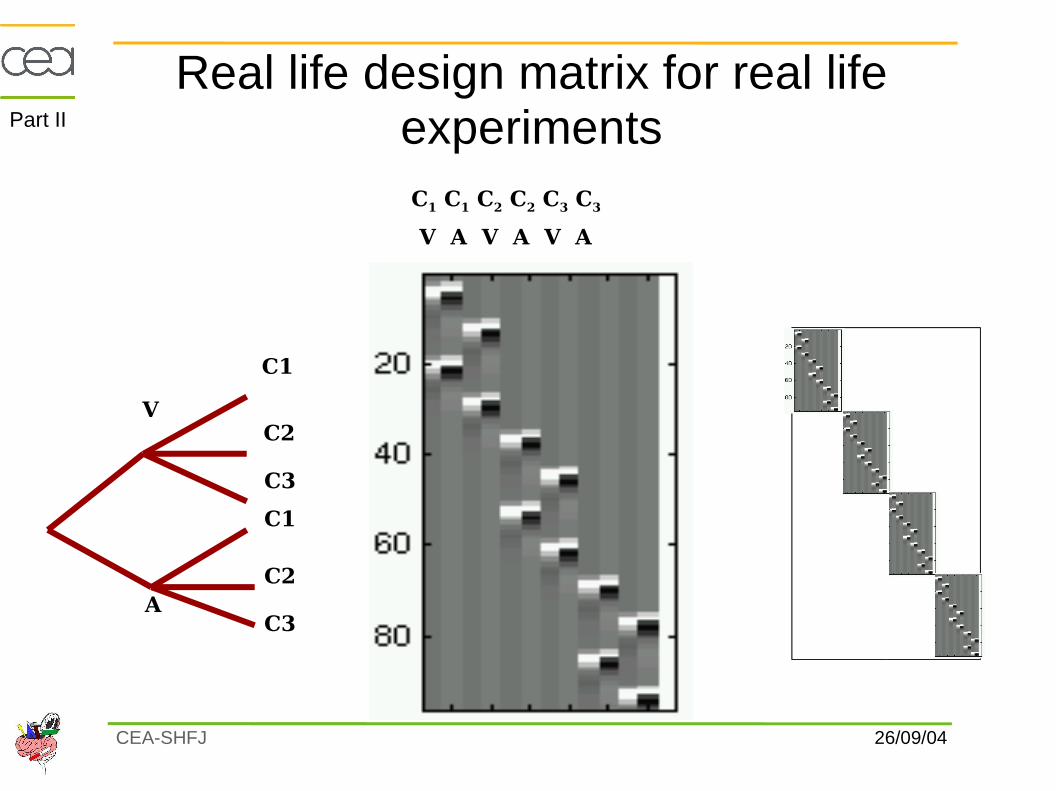
Real life design matrix for real life experiments
V A V A V A
C1 C1 C2 C2 C3 C3
V
A
C1
C2
C3
C1
C2
C3
Factorial Design2x2
Part II
26/09/04CEA-SHFJ
MADIC
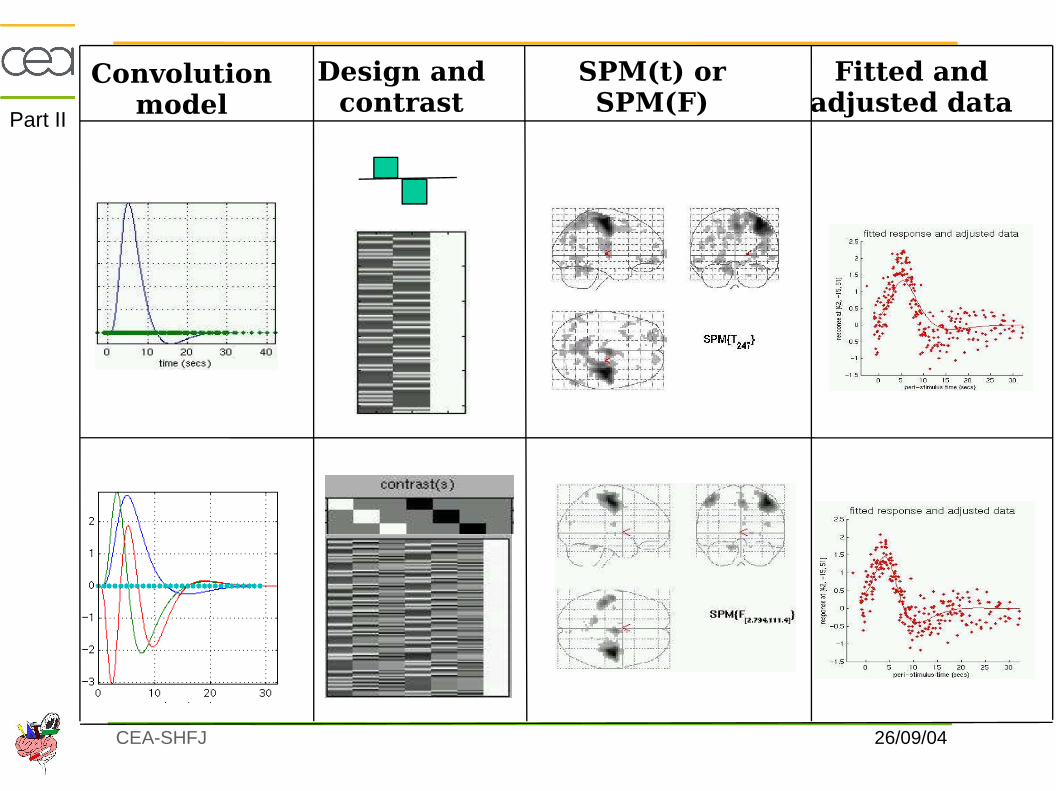
Convolution model
Design andcontrast
SPM(t) orSPM(F)
Fitted andadjusted data
Part II
26/09/04CEA-SHFJ
MADIC
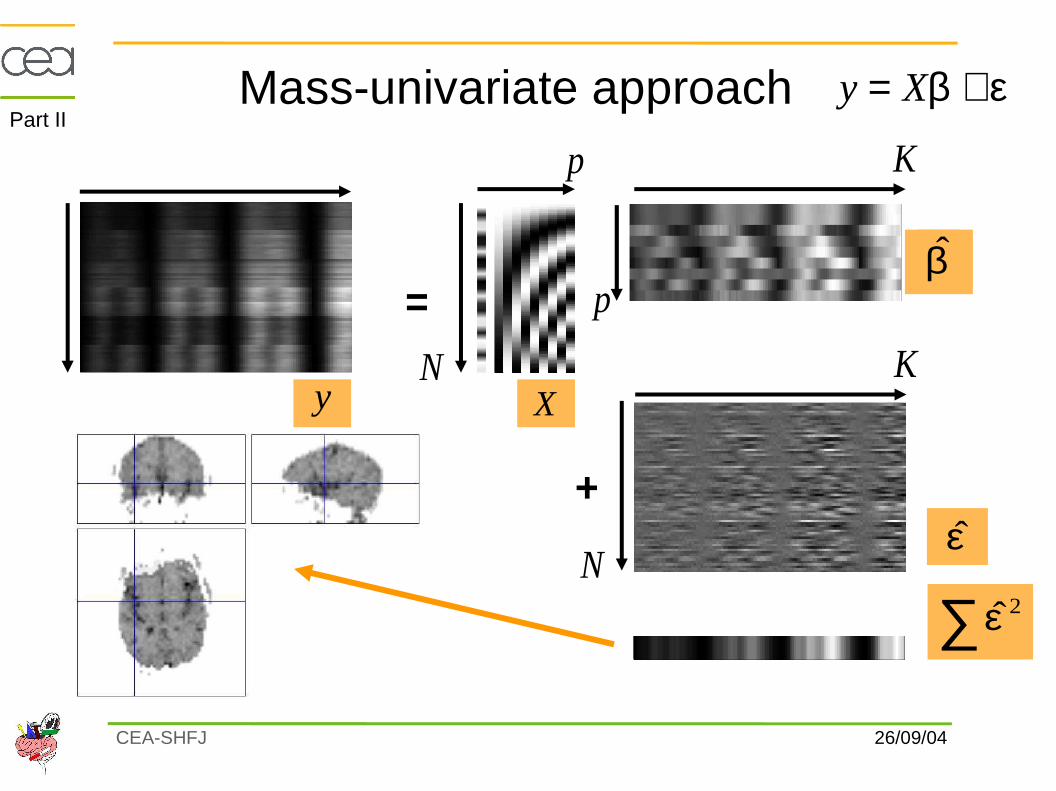
=
Mass-univariate approach
+
β
ε
N
p
p
K
εβ += Xy
K
N
y XN (time)
K (voxels)
∑ 2ε
Part II
26/09/04CEA-SHFJ
MADIC
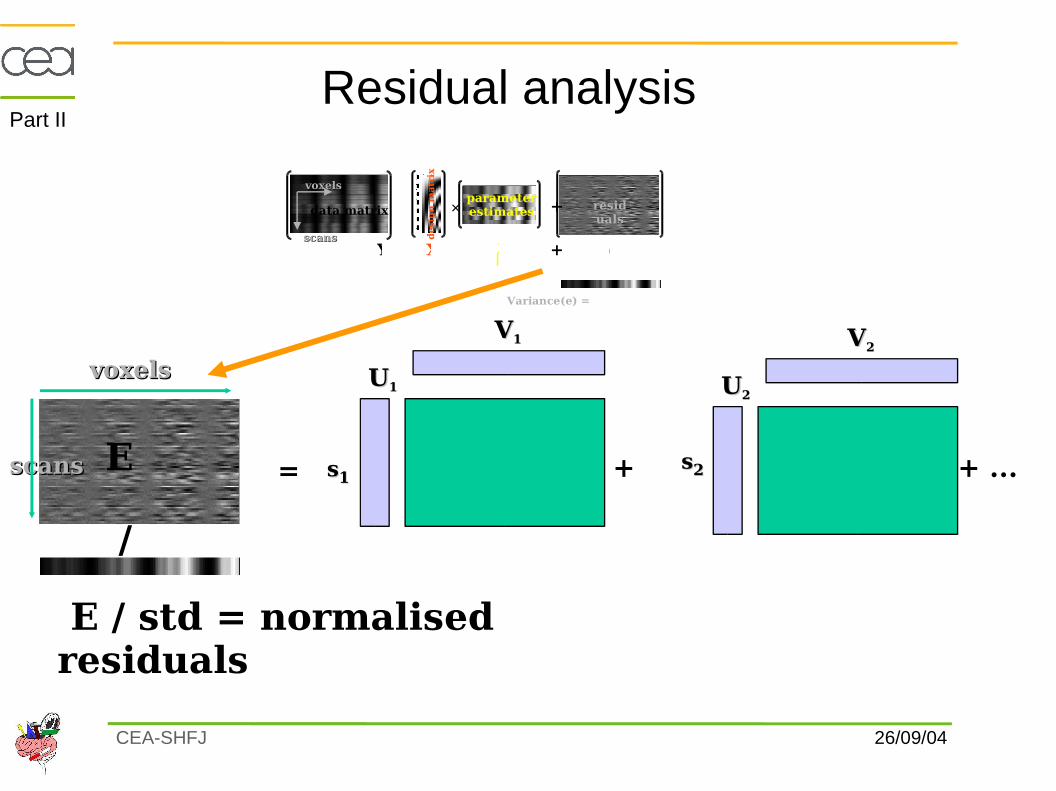
E
voxelsvoxels
scansscans
e
= +Y X
data matrix
desi
gn
matr
ix
+= ×voxelsvoxels
scansscans
β^
residuals
parameterestimates
Variance(e) =
= ss11
VV11
UU11
+ ss22
VV22
UU22
+ ...
/
E / std = normalised residuals
Residual analysis Part II
26/09/04CEA-SHFJ
MADIC
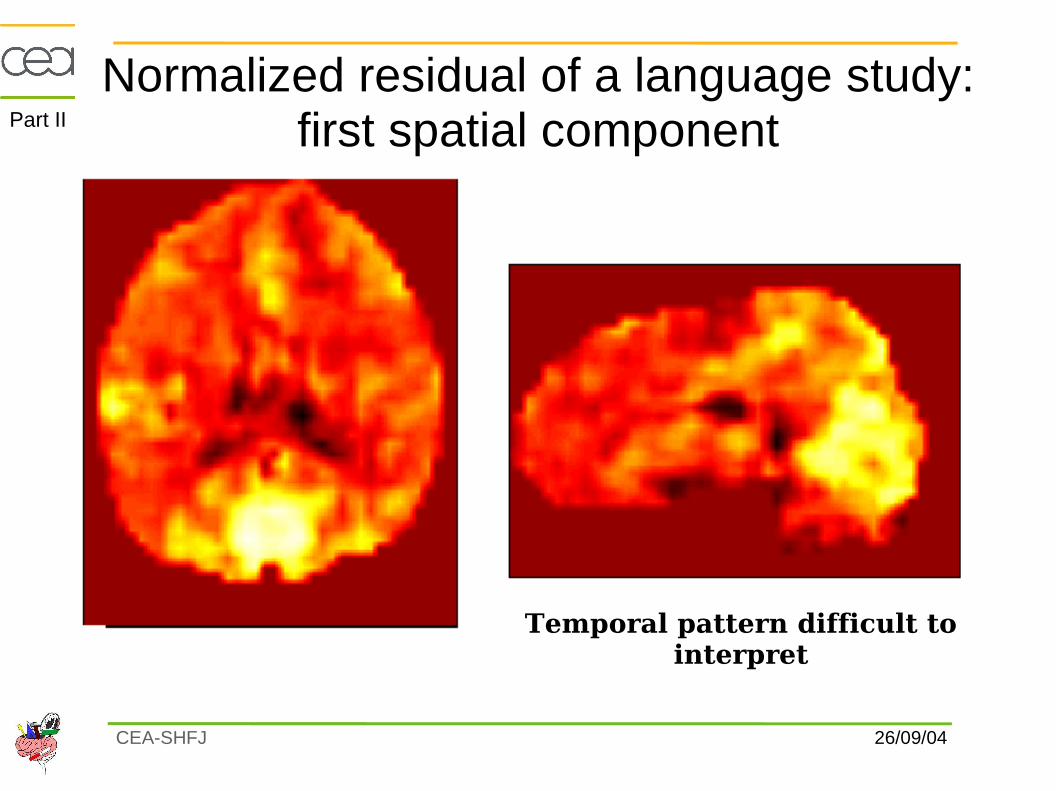
Temporal pattern difficult to interpret
Normalized residual of a language study: first spatial componentPart II
26/09/04CEA-SHFJ
MADIC
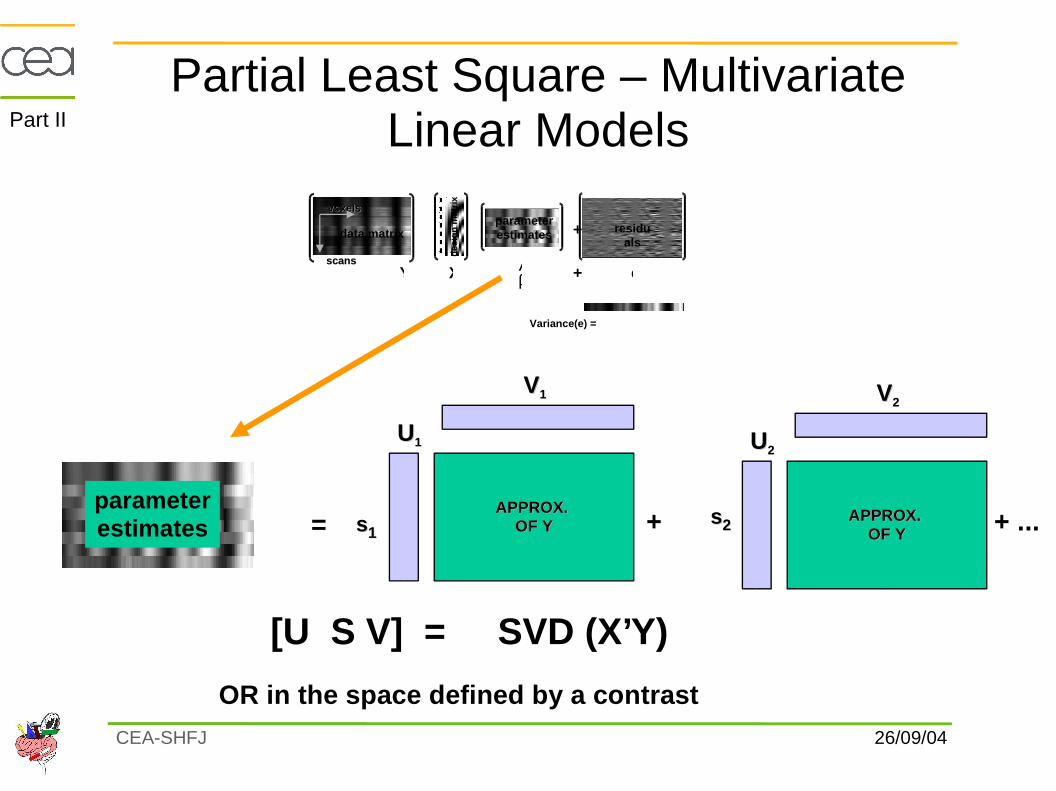
e
= +Y X
data matrix
des
ign
mat
rix
+=voxelsvoxels
scansscans
β^
residuals
parameterestimates
Variance(e) =
= APPROX. APPROX.
OF YOF Yss11
VV11
UU11
+ APPROX. APPROX. OF YOF Y
ss22
VV22
UU22
+ ...parameterestimates
[U S V] = SVD (X’Y)
OR in the space defined by a contrast
Partial Least Square – Multivariate Linear ModelsPart II
26/09/04CEA-SHFJ
MADIC
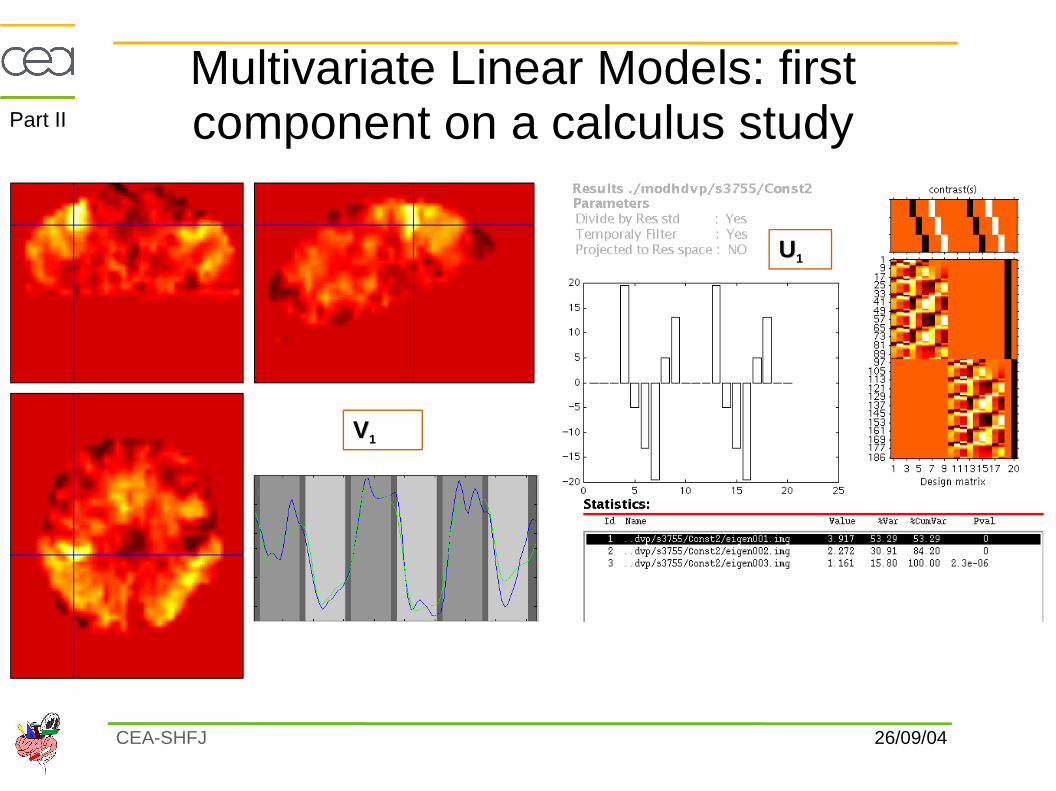
UU11
VV11
Multivariate Linear Models: first component on a calculus studyPart II
26/09/04CEA-SHFJ
MADIC
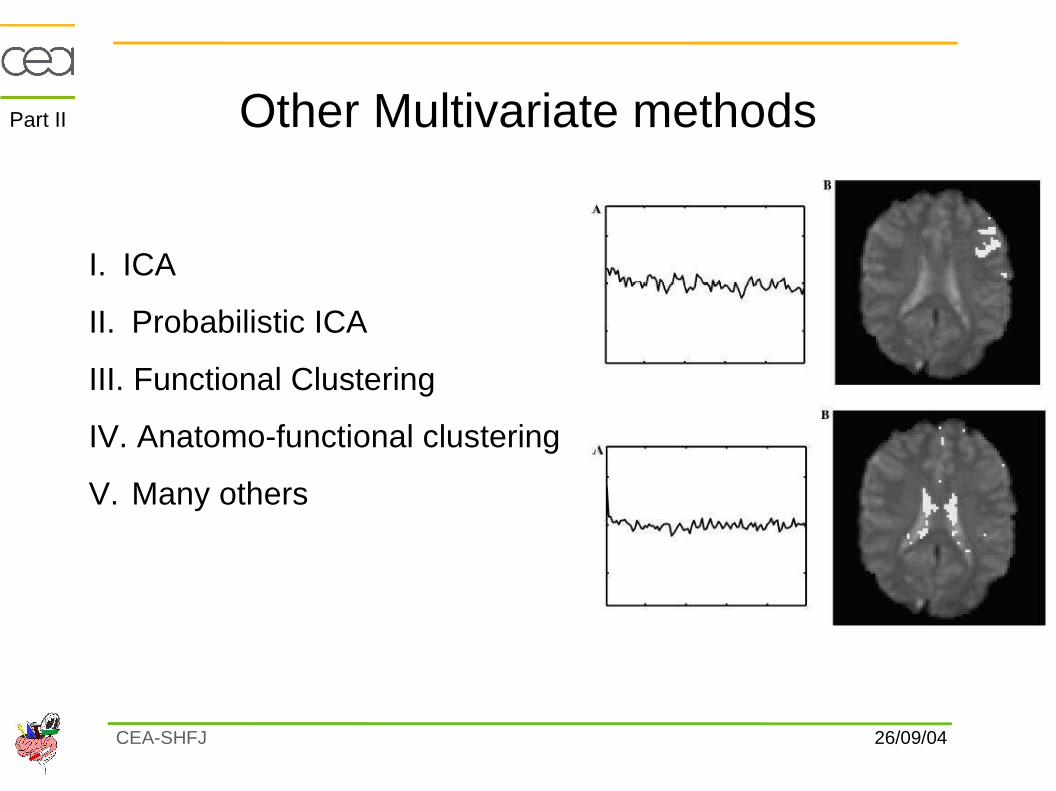
Other Multivariate methods
I. ICA
II. Probabilistic ICA
III. Functional Clustering
IV. Anatomo-functional clustering
V. Many others
Part II
Riesmann et al., 04
26/09/04CEA-SHFJ
MADIC
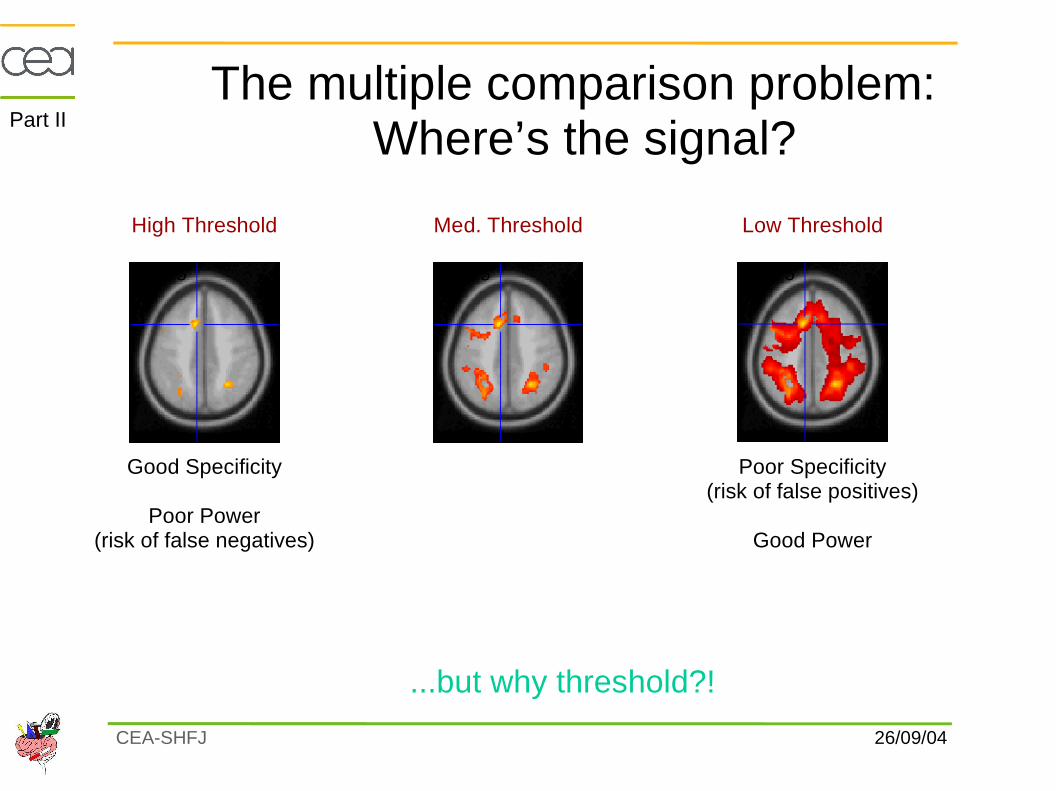
The multiple comparison problem: Where’s the signal?
t > 0.5t > 3.5t > 5.5
High Threshold Med. Threshold Low Threshold
Good Specificity
Poor Power(risk of false negatives)
Poor Specificity(risk of false positives)
Good Power
...but why threshold?!
Part II
26/09/04CEA-SHFJ
MADIC
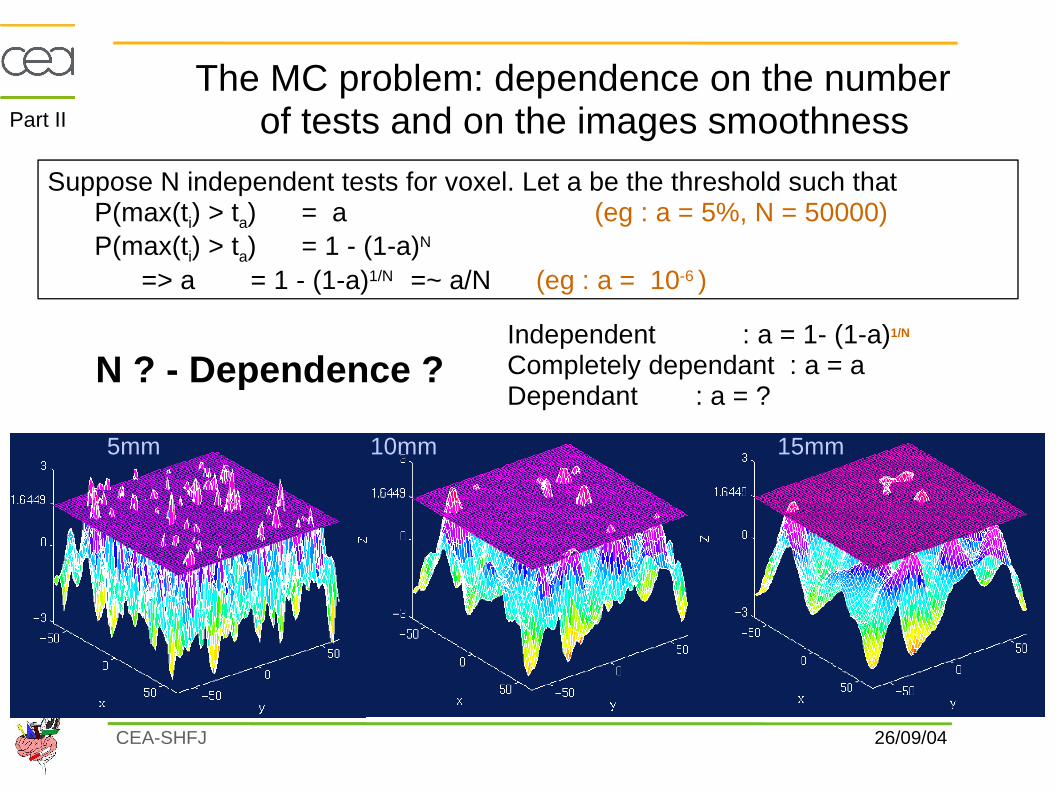
5mm 10mm 15mm
Suppose N independent tests for voxel. Let a be the threshold such that P(max(ti) > ta) = a (eg : a = 5%, N = 50000)P(max(ti) > ta) = 1 - (1-a)N
=> a = 1 - (1-a)1/N =~ a/N (eg : a = 10-6 )
Independent : a = 1- (1-a)1/N
Completely dependant : a = aDependant : a = ?
N ? - Dependence ?
The MC problem: dependence on the number of tests and on the images smoothnessPart II
26/09/04CEA-SHFJ
MADIC
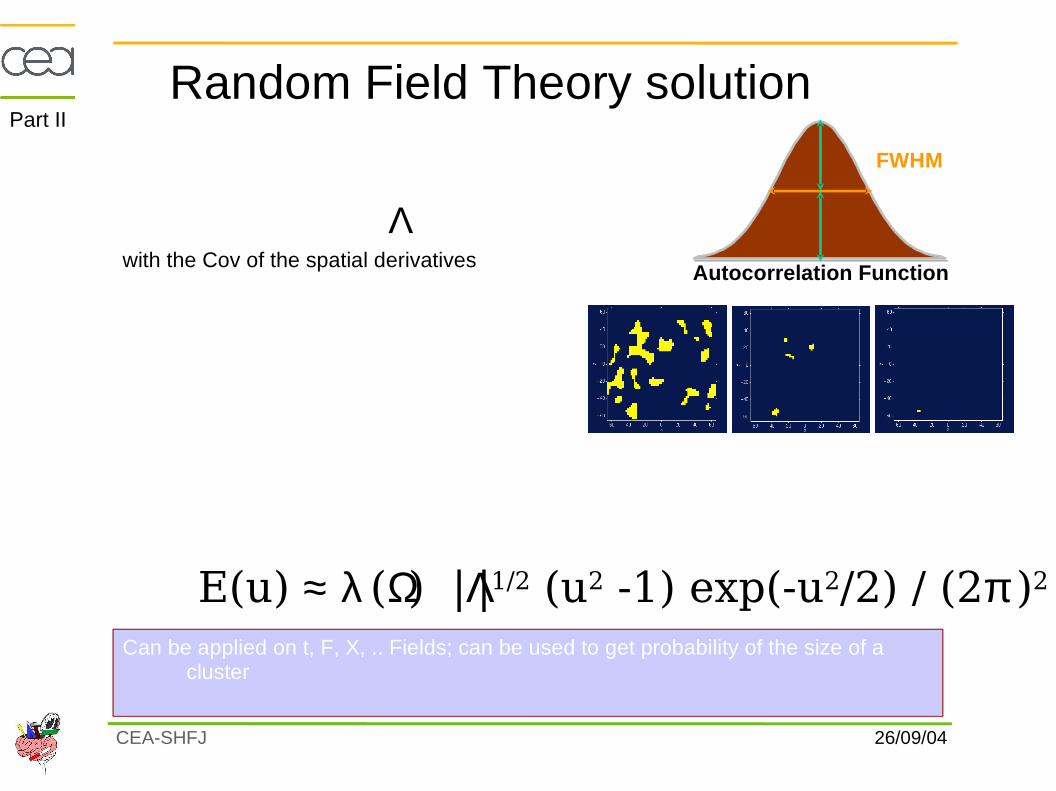
Random Field Theory solution
Autocorrelation Function
FWHM
1- Estimate field roughness Λwith the Cov of the spatial derivatives
2- Cut the field at threshold u
E(u) ≈ λ (Ω) |Λ|1/2 (u2 -1) exp(-u2/2) / (2π )2
3- Compute expected Euler characteristics that approximate prob. of the field to cross u :
Can be applied on t, F, X, .. Fields; can be used to get probability of the size of a cluster
Part II
26/09/04CEA-SHFJ
MADIC
This EPS image does not contain a screen preview.It will print correctly to a PostScript printer.File Name : recap_tests.epsTitle : recap_tests.epsCreator : CLARIS EPSF Export Filter V1.0CreationDate : 5/12/96 2:13:30 p.m.
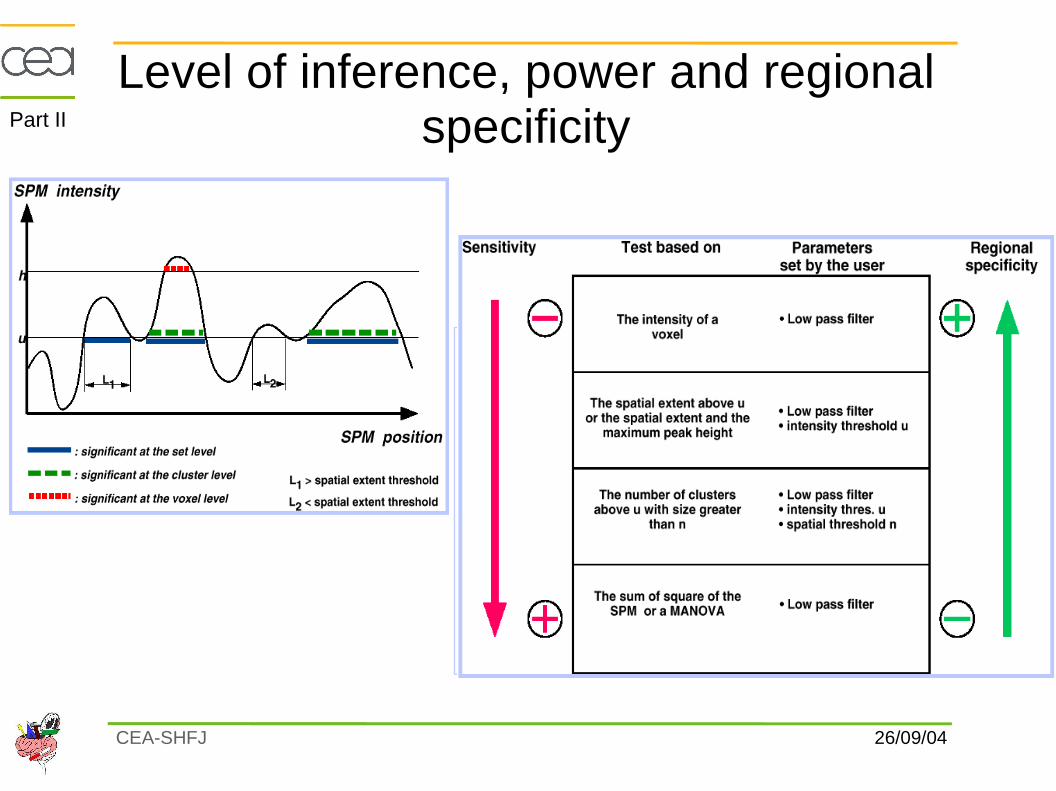
Level of inference, power and regional specificityPart II
26/09/04CEA-SHFJ
MADIC
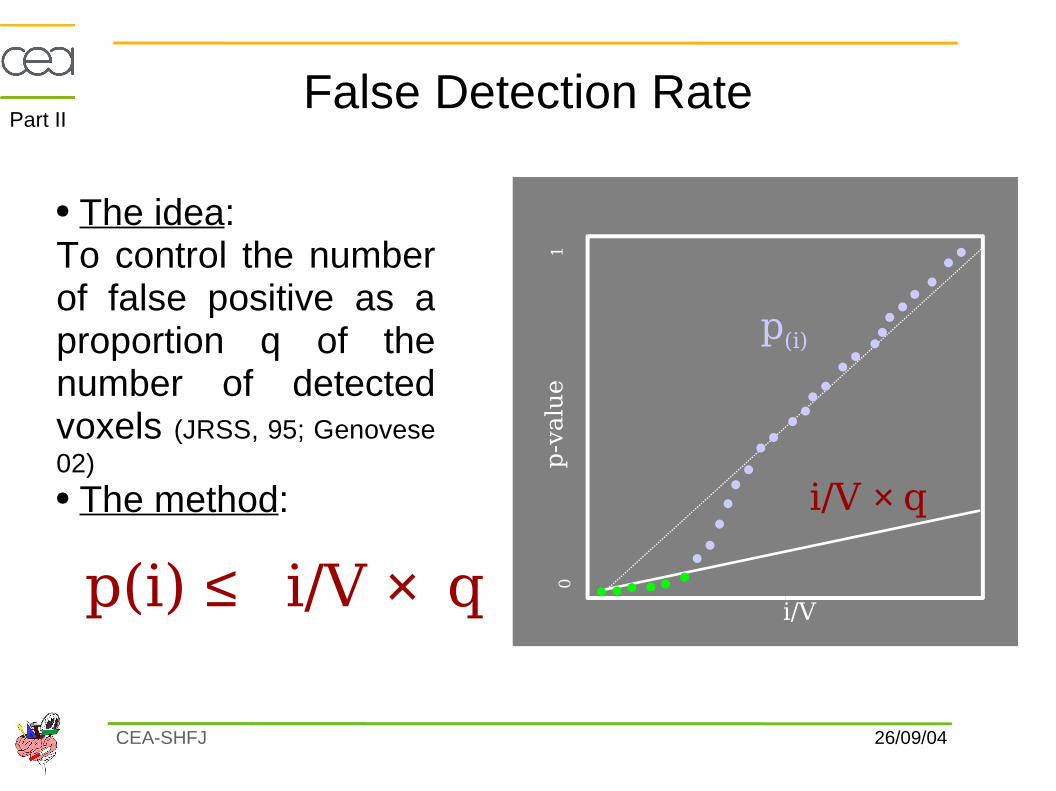
False Detection Rate
p(i) ≤ i/V × q
p(i)
i/V
i/V × qp-v
alu
e
0 1
01
The idea:To control the number of false positive as a proportion q of the number of detected voxels (JRSS, 95; Genovese 02) The method:
Part II
26/09/04CEA-SHFJ
MADIC
FWE
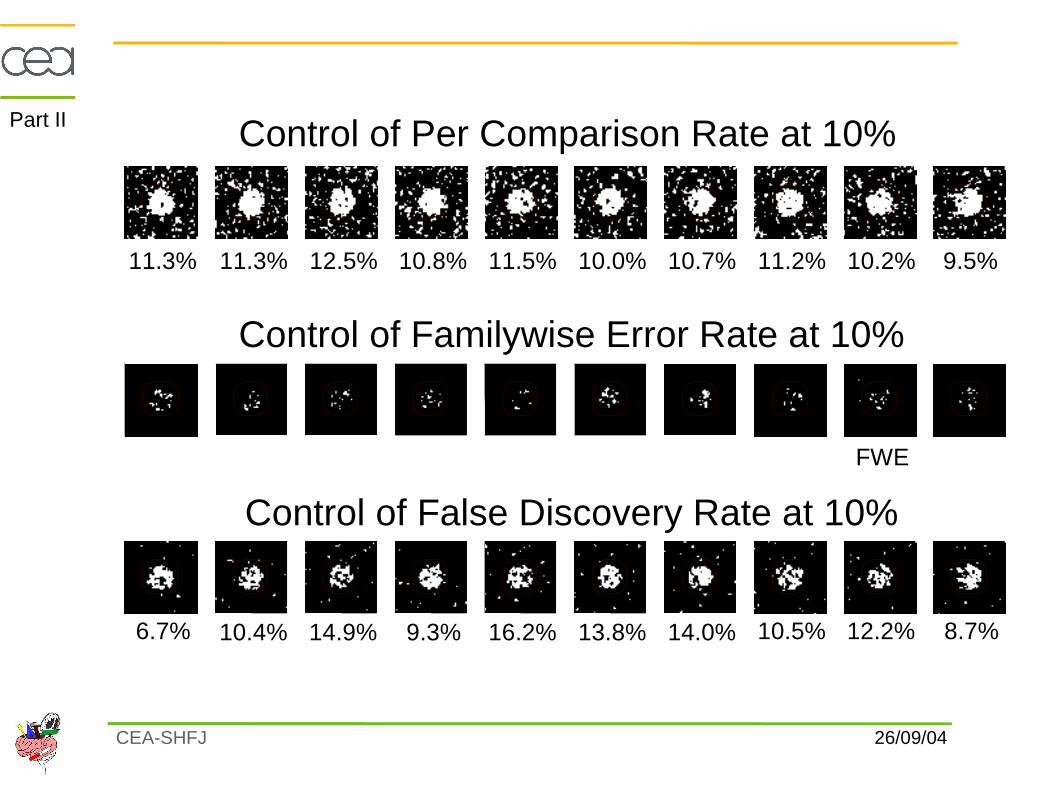
6.7% 10.4% 14.9% 9.3% 16.2% 13.8% 14.0% 10.5% 12.2% 8.7%
Control of Familywise Error Rate at 10%
11.3% 11.3% 12.5% 10.8% 11.5% 10.0% 10.7% 11.2% 10.2% 9.5%
Control of Per Comparison Rate at 10%
Control of False Discovery Rate at 10%
Courtesy of T. Nichols
Part II
26/09/04CEA-SHFJ
MADIC
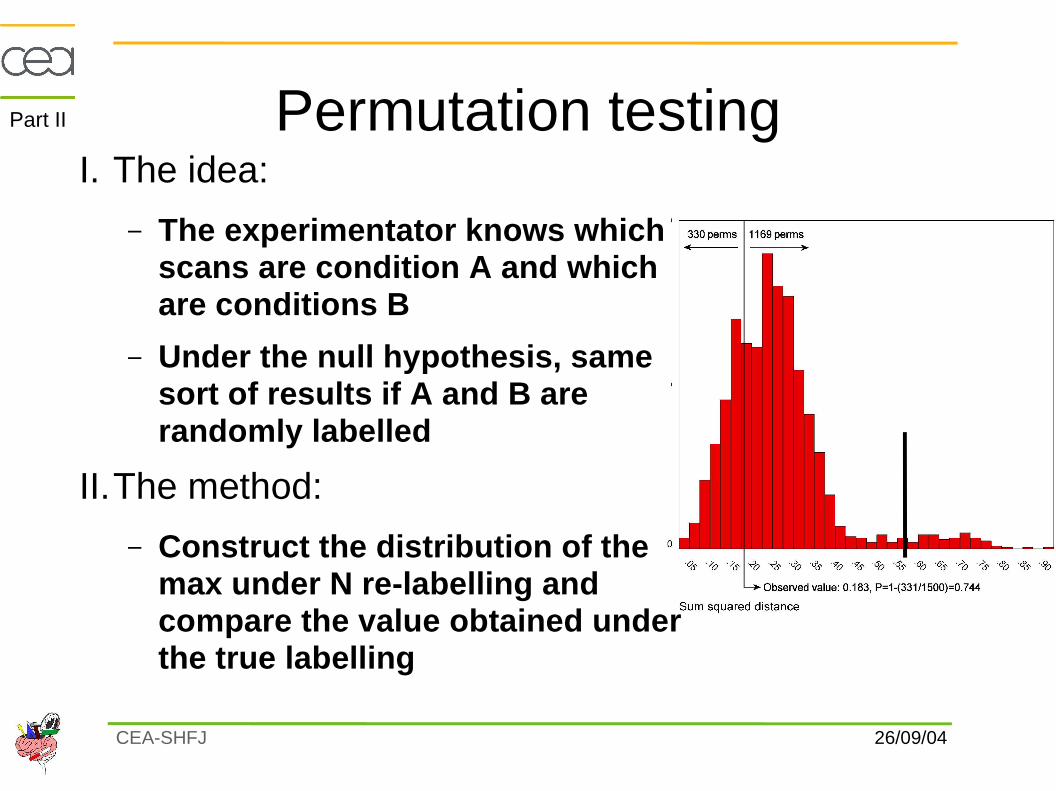
Permutation testing
Threshold 5% of the
I. The idea:
– The experimentator knows which scans are condition A and which are conditions B
– Under the null hypothesis, same sort of results if A and B are randomly labelled
II.The method:
– Construct the distribution of the max under N re-labelling and compare the value obtained under the true labelling
Part II
26/09/04CEA-SHFJ
MADIC
LikelihoodLikelihood PriorPriorPosteriorPosterior
SPMsSPMsPPMsPPMs
γ
θ
u
)(yft =
)0|( =θtp
)|( yp θ
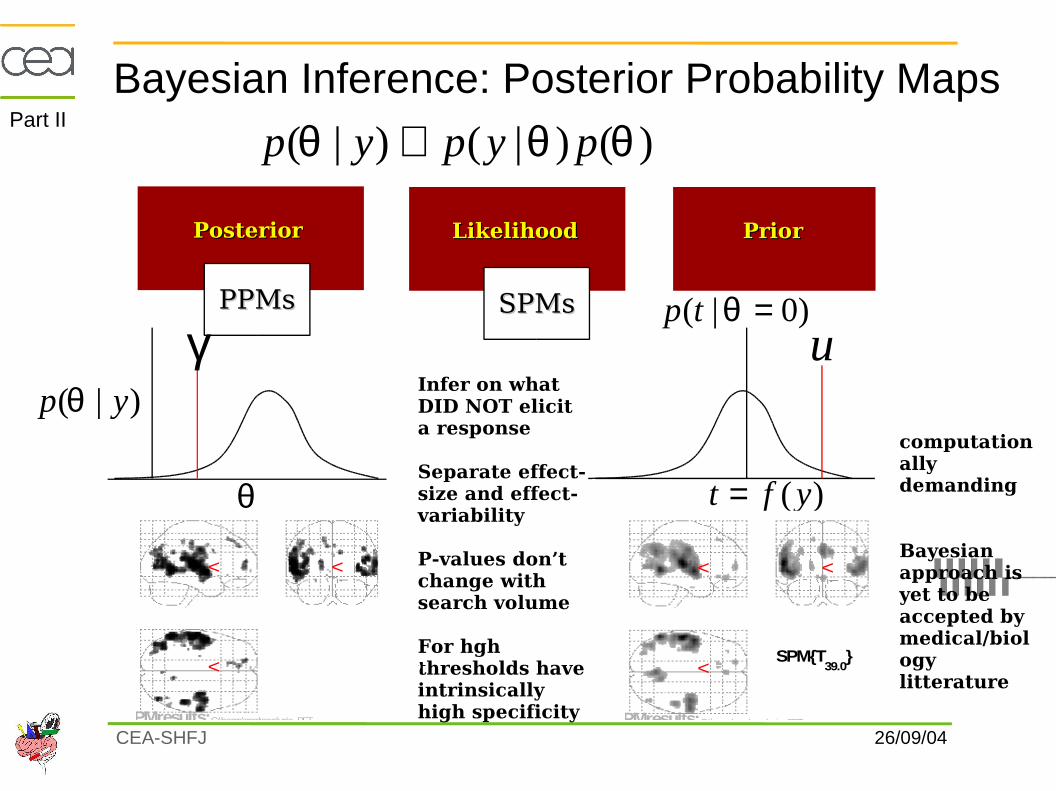
Bayesian Inference: Posterior Probability Maps
)()|()|( θθθ pypyp ∝SP
Mm
ip[0
, 0, 0
]
<
< <
PPM2.06
rest [2.06]
SPMresults:C:\home\spm\analysis_PET
Height threshold P = 0.95
Extent threshold k = 0 voxels
Design matrix1 4 7 10 13 16 19 22
147
1013161922252831343740434649525560
contrast(s)
4
SPM
mip
[0, 0, 0]
<
< <
SPMT39.0
rest
SPMresults:C:\home\spm\analysis_PET
Height threshold T = 5.50
Extent threshold k = 0 voxels
Design matrix1 4 7 10 13 16 19 22
147
1013161922252831343740434649525560
contrast(s)
3
Infer on what DID NOT elicit a response
Separate effect-size and effect-variability
P-values don’t change with search volume
For hgh thresholds have intrinsically high specificity
computationally demanding
Bayesian approach is yet to be accepted by medical/biology litterature
P(E >2) > .95
Part II
26/09/04CEA-SHFJ
MADIC
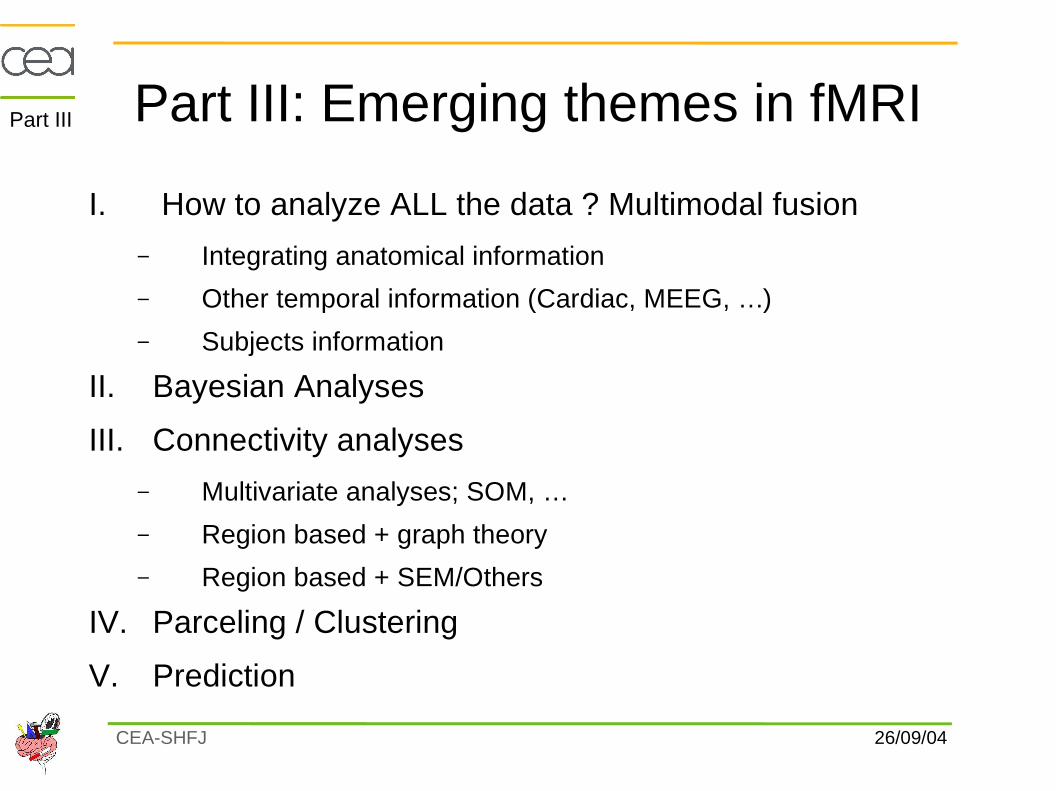
Part III: Emerging themes in fMRI
I. How to analyze ALL the data ? Multimodal fusion
– Integrating anatomical information
– Other temporal information (Cardiac, MEEG, …)
– Subjects information
II. Bayesian Analyses
III. Connectivity analyses
– Multivariate analyses; SOM, …
– Region based + graph theory
– Region based + SEM/Others
IV. Parceling / Clustering
V. Prediction
Part III
26/09/04CEA-SHFJ
MADIC
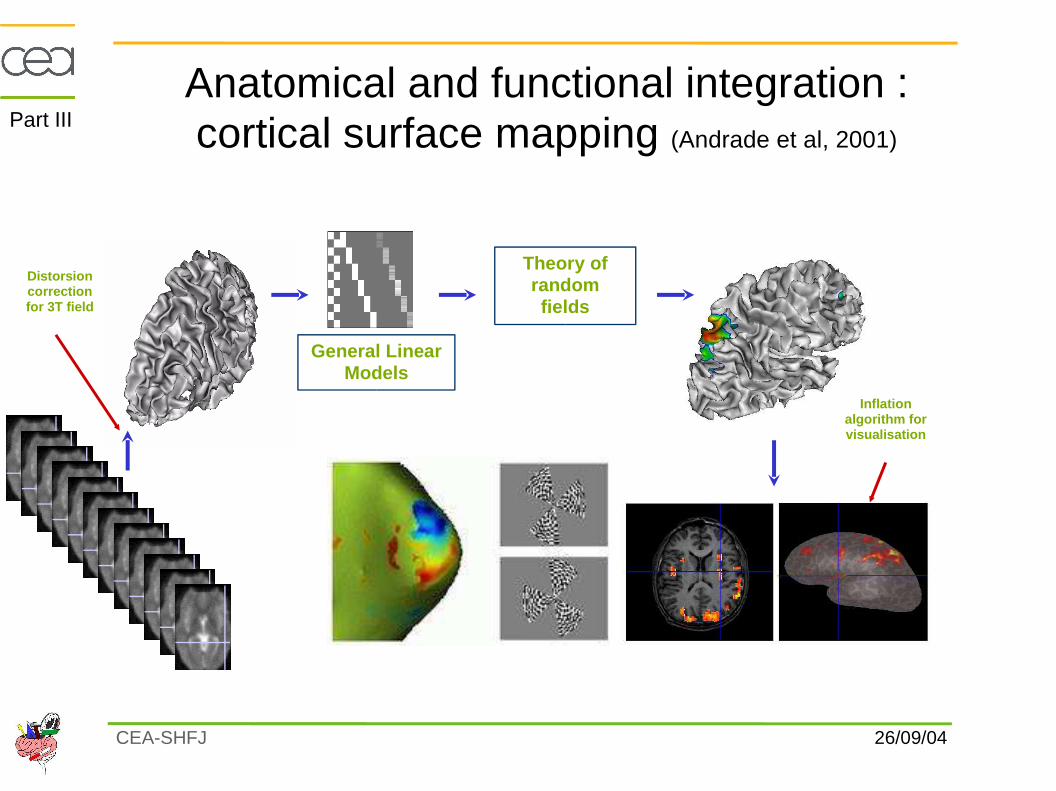
Anatomical and functional integration :cortical surface mapping (Andrade et al, 2001)
Theory of randomfields
General Linear Models
Distorsion correction for 3T field
Inflation algorithm for visualisation
Part III
26/09/04CEA-SHFJ
MADIC
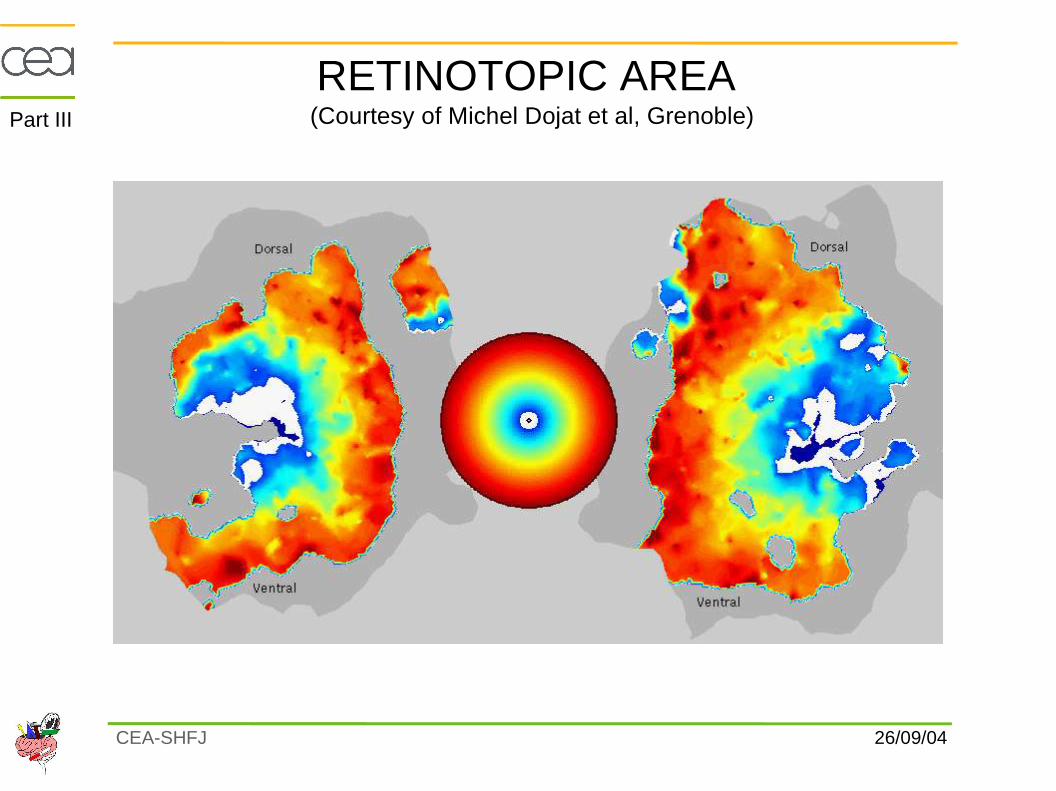
RETINOTOPIC AREA (Courtesy of Michel Dojat et al, Grenoble)Part III
26/09/04CEA-SHFJ
MADIC
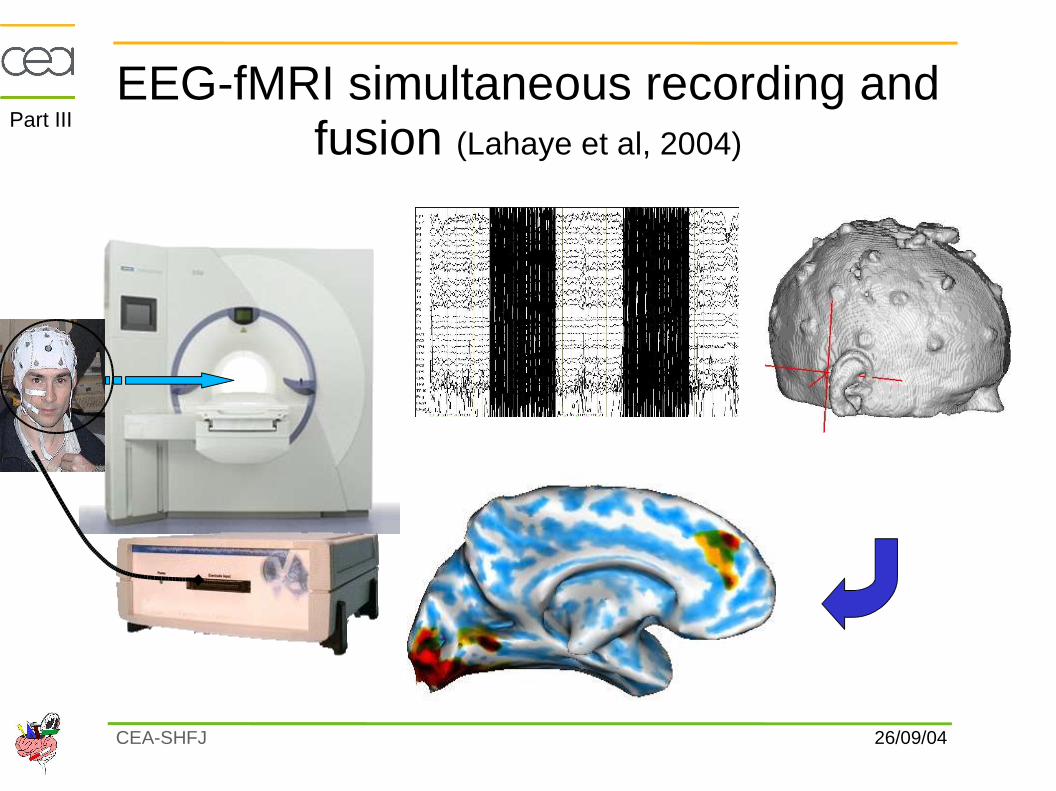
EEG-fMRI simultaneous recording and fusion (Lahaye et al, 2004)
Fusion Algorithm
Part III
26/09/04CEA-SHFJ
MADIC
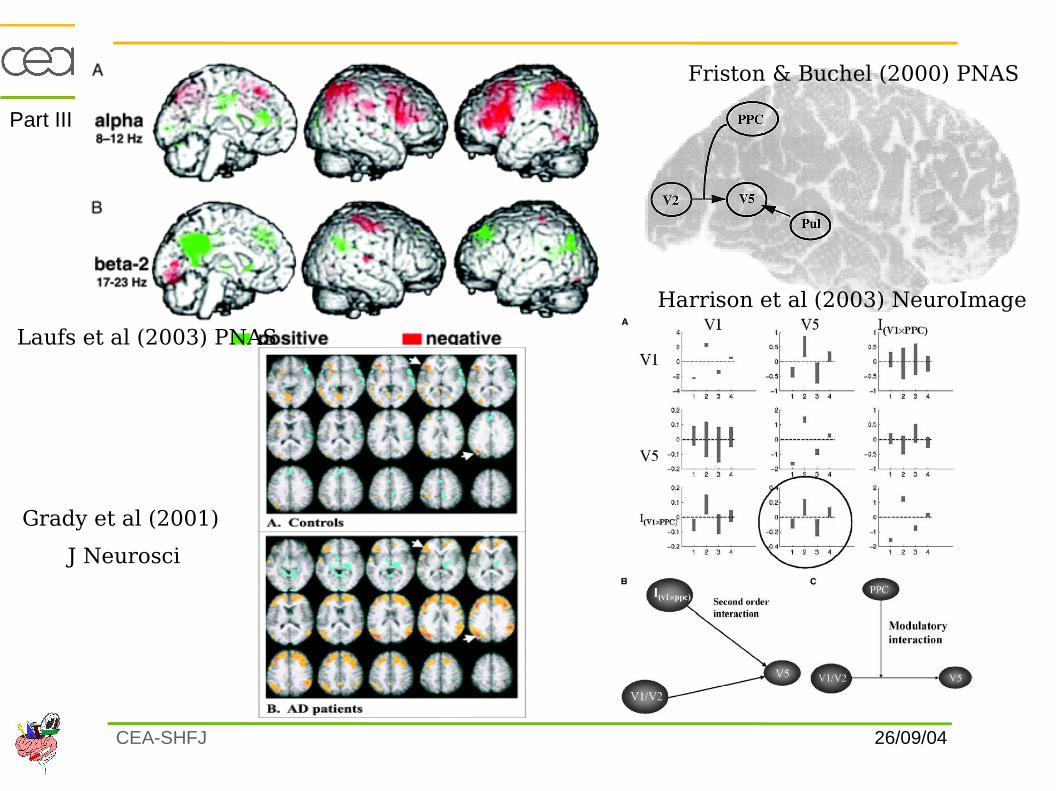
Harrison et al (2003) NeuroImage
Friston & Buchel (2000) PNAS
Laufs et al (2003) PNAS
Grady et al (2001)
J Neurosci
Part III
26/09/04CEA-SHFJ
MADIC
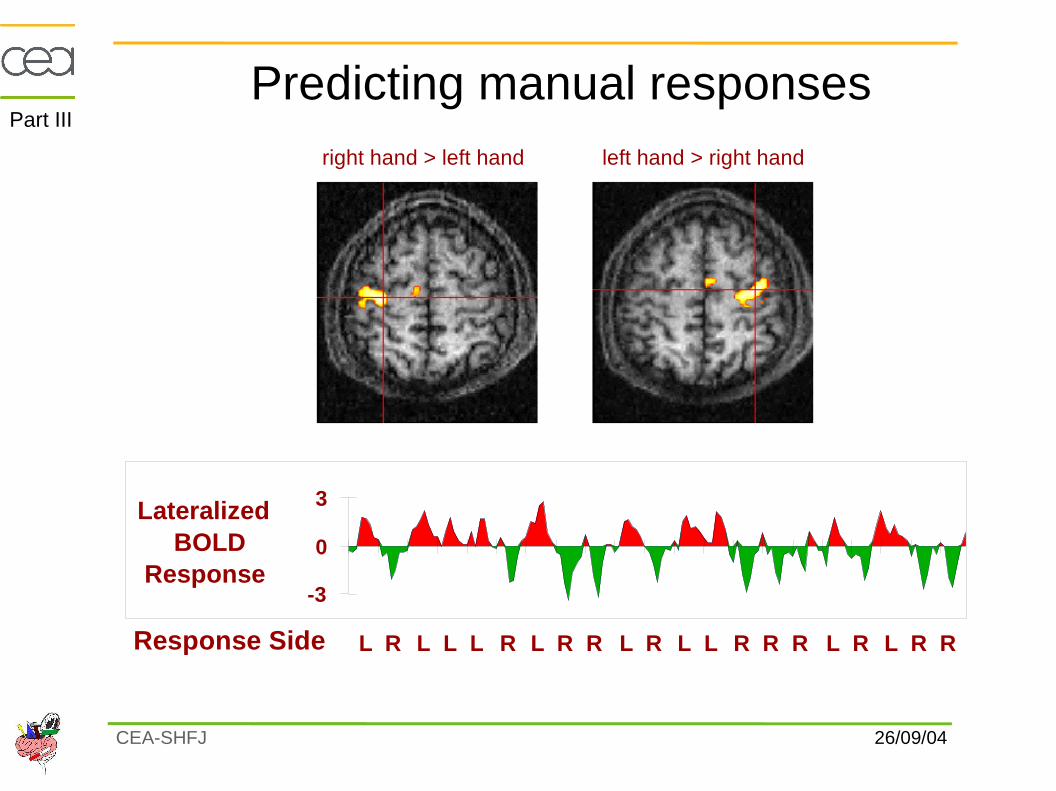
LateralizedBOLD
Response-3
0
3
L R L L L R L R R L R L L R R R L R L R RResponse Side
right hand > left hand left hand > right hand
Predicting manual responses
Dehaene et al, Nature neurosciences
Part III
26/09/04CEA-SHFJ
MADIC
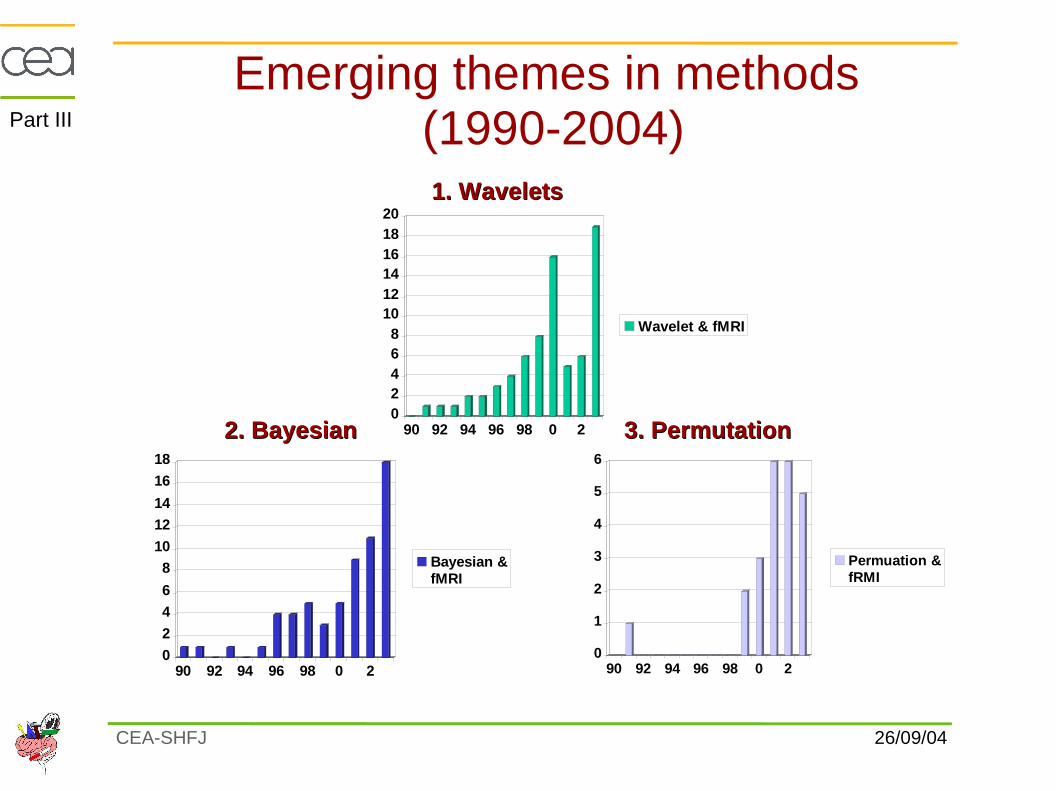
Emerging themes in methods (1990-2004)
0
1
2
3
4
5
6
90 92 94 96 98 0 2
Permuation &fRMI
02468
101214161820
90 92 94 96 98 0 2
Wavelet & fMRI
0
2
46
810
1214
16
18
90 92 94 96 98 0 2
Bayesian &fMRI
1. Wavelets1. Wavelets
3. Permutation3. Permutation2. Bayesian2. Bayesian
Part III
26/09/04CEA-SHFJ
MADIC
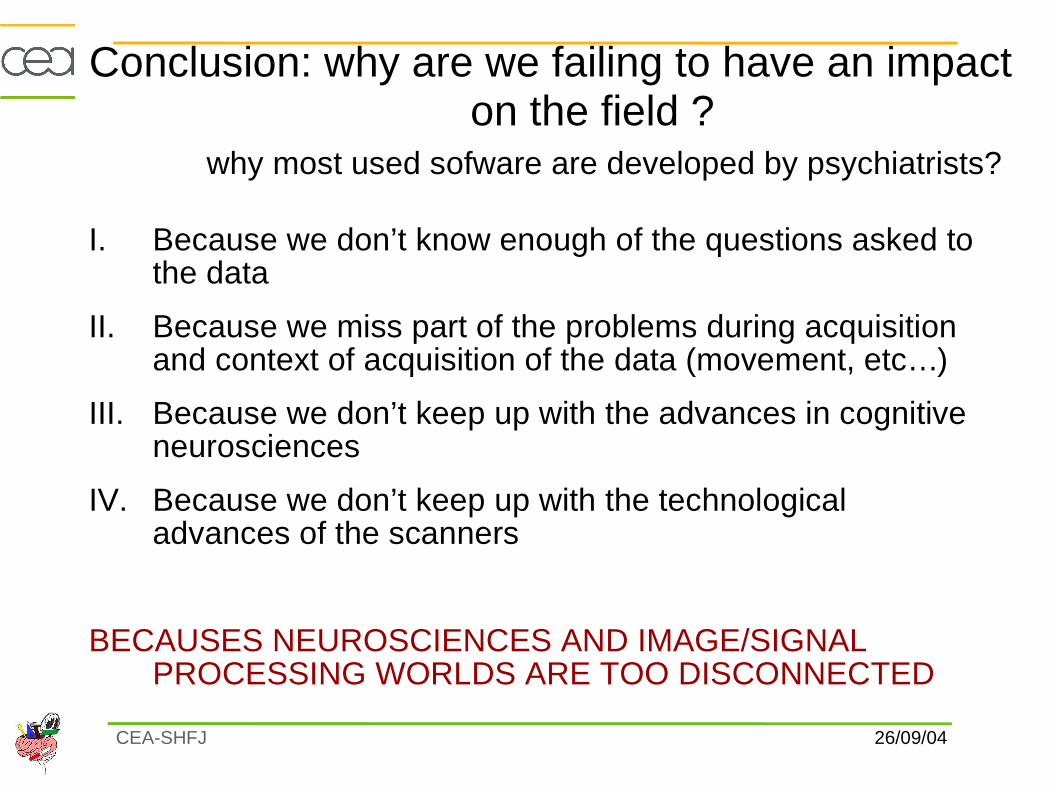
Conclusion: why are we failing to have an impact on the field ?
why most used sofware are developed by psychiatrists?
I. Because we don’t know enough of the questions asked to the data
II. Because we miss part of the problems during acquisition and context of acquisition of the data (movement, etc…)
III. Because we don’t keep up with the advances in cognitive neurosciences
IV. Because we don’t keep up with the technological advances of the scanners
BECAUSES NEUROSCIENCES AND IMAGE/SIGNAL PROCESSING WORLDS ARE TOO DISCONNECTED
26/09/04CEA-SHFJ
MADIC
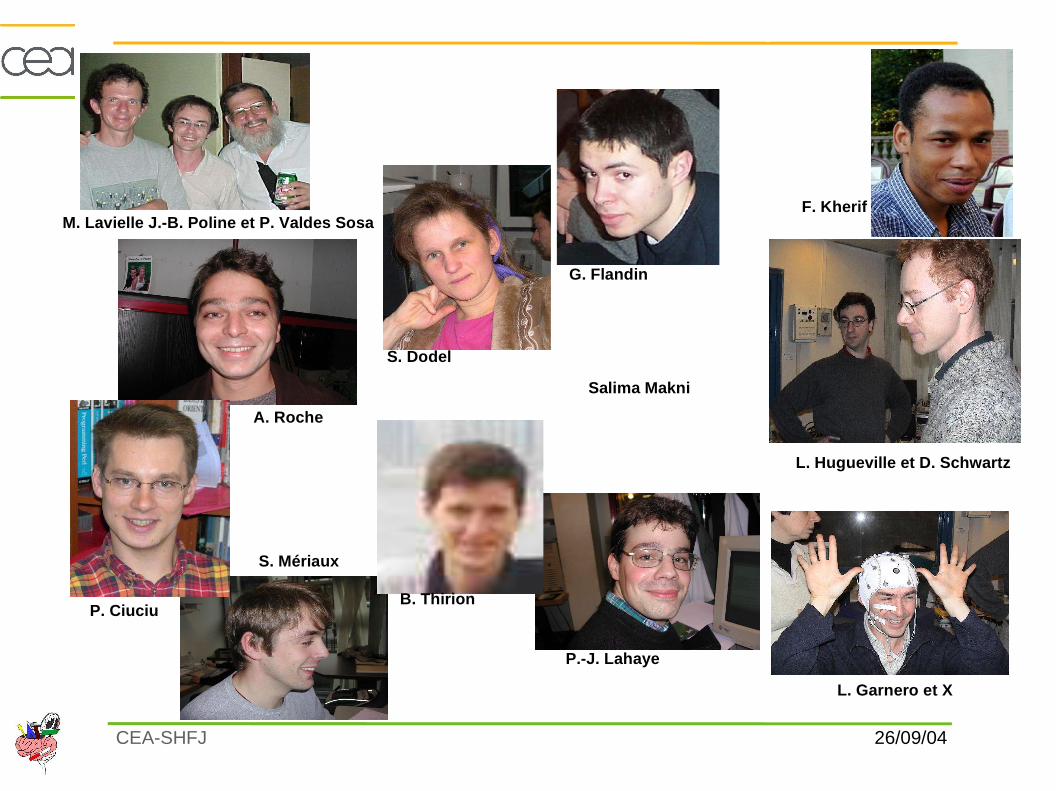
A. Roche
F. Kherif
S. Mériaux
P. Ciuciu
G. Flandin
S. Dodel
P.-J. Lahaye
M. Lavielle J.-B. Poline et P. Valdes Sosa
L. Hugueville et D. Schwartz
L. Garnero et X
B. Thirion
Salima Makni
THANKS TO …. www.madic.org


![MICCAI’09 fMRI data analysis workshop (Thursday 24th ......poral autocorrelations inherent to fMRI data [1{4] and anatomical information [5,6]. More recently, inspired by the success](https://img.pdfslide.us/doc/110x75/610650bed43f877e661ef085/miccaia09-fmri-data-analysis-workshop-thursday-24th-poral-autocorrelations.jpg)