Embed Size (px)
Citation preview
Tutorial for Moss-Lab Tools
1. ScanFold
The ScanFold webserver allows users to identify potentially functional RNA structures given an
input RNA/DNA sequence. The ScanFold pipeline (which can be separated into “scanning” and
“folding” steps) is described in detail in the manuscript where it was introduced.
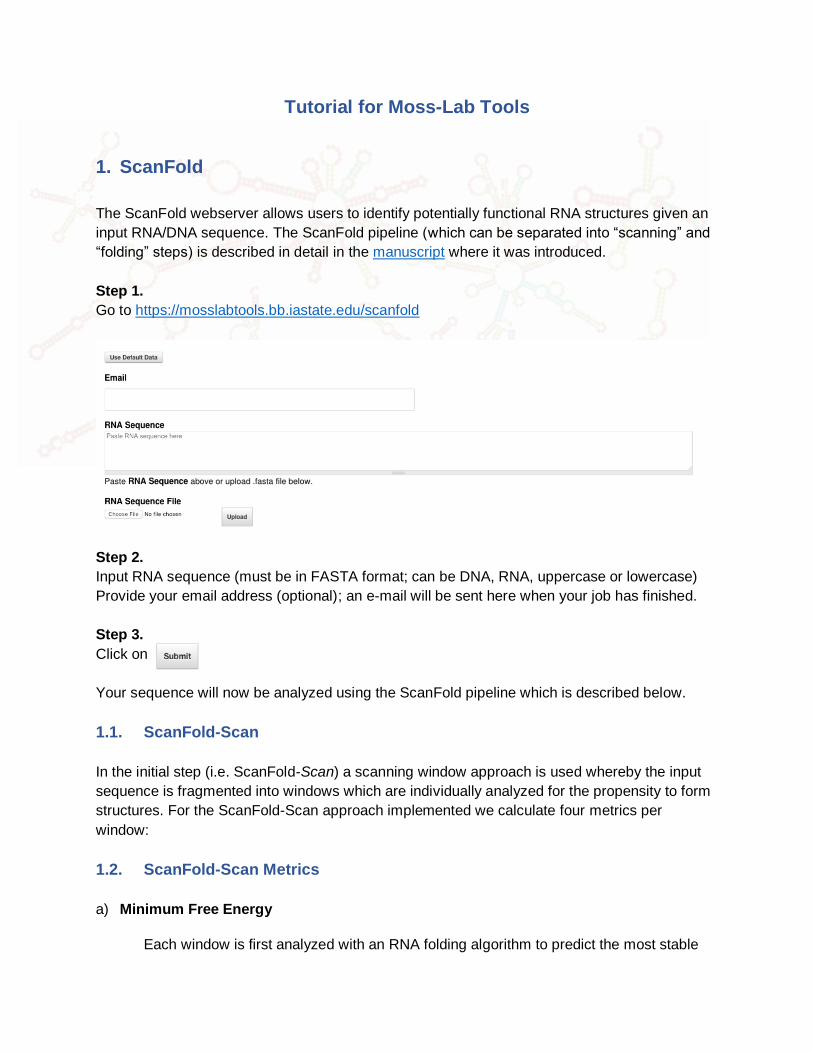
Step 1.
Go to https://mosslabtools.bb.iastate.edu/scanfold
Step 2.
Input RNA sequence (must be in FASTA format; can be DNA, RNA, uppercase or lowercase)
Provide your email address (optional); an e-mail will be sent here when your job has finished.
Step 3.
Click on
Your sequence will now be analyzed using the ScanFold pipeline which is described below.
1.1. ScanFold-Scan
In the initial step (i.e. ScanFold-Scan) a scanning window approach is used whereby the input
sequence is fragmented into windows which are individually analyzed for the propensity to form
structures. For the ScanFold-Scan approach implemented we calculate four metrics per
window:
1.2. ScanFold-Scan Metrics
a) Minimum Free Energy
Each window is first analyzed with an RNA folding algorithm to predict the most stable
structure it could theoretically adopt. A good description of how this works by Sean R.
Eddy here.
The Minimum Free Energy (MFE) is the free energy value of this most stable structure
in kcal/mol. The more negative the value, the more stable the structure.
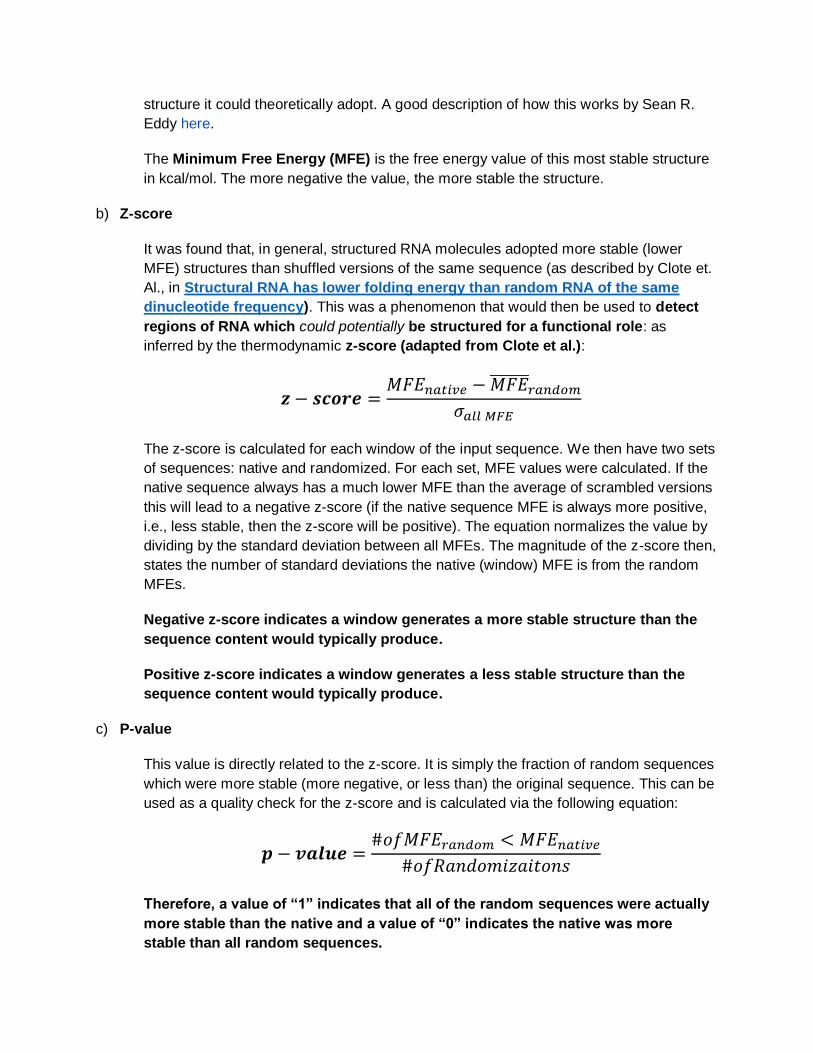
b) Z-score
It was found that, in general, structured RNA molecules adopted more stable (lower
MFE) structures than shuffled versions of the same sequence (as described by Clote et.
Al., in Structural RNA has lower folding energy than random RNA of the same
dinucleotide frequency). This was a phenomenon that would then be used to detect
regions of RNA which could potentially be structured for a functional role: as
inferred by the thermodynamic z-score (adapted from Clote et al.):
𝒛 − 𝒔𝒄𝒐𝒓𝒆 =𝑀𝐹𝐸𝑛𝑎𝑡𝑖𝑣𝑒 − 𝑀𝐹𝐸̅̅ ̅̅ ̅̅
𝑟𝑎𝑛𝑑𝑜𝑚
𝜎𝑎𝑙𝑙 𝑀𝐹𝐸
The z-score is calculated for each window of the input sequence. We then have two sets
of sequences: native and randomized. For each set, MFE values were calculated. If the
native sequence always has a much lower MFE than the average of scrambled versions
this will lead to a negative z-score (if the native sequence MFE is always more positive,
i.e., less stable, then the z-score will be positive). The equation normalizes the value by
dividing by the standard deviation between all MFEs. The magnitude of the z-score then,
states the number of standard deviations the native (window) MFE is from the random
MFEs.
Negative z-score indicates a window generates a more stable structure than the
sequence content would typically produce.
Positive z-score indicates a window generates a less stable structure than the
sequence content would typically produce.
c) P-value
This value is directly related to the z-score. It is simply the fraction of random sequences
which were more stable (more negative, or less than) the original sequence. This can be
used as a quality check for the z-score and is calculated via the following equation:
𝒑 − 𝒗𝒂𝒍𝒖𝒆 =#𝑜𝑓𝑀𝐹𝐸𝑟𝑎𝑛𝑑𝑜𝑚 < 𝑀𝐹𝐸𝑛𝑎𝑡𝑖𝑣𝑒
#𝑜𝑓𝑅𝑎𝑛𝑑𝑜𝑚𝑖𝑧𝑎𝑖𝑡𝑜𝑛𝑠
Therefore, a value of “1” indicates that all of the random sequences were actually
more stable than the native and a value of “0” indicates the native was more
stable than all random sequences.

d) Ensemble Diversity
When calculating an MFE structure/value for a particular sequence, we are always
finding a single result: the minimum free energy structure/value. However, theoretically,
there are many possible structures/values. The ensemble diversity is a metric which
attempts to describe the variety of possible structures. How is this determined? All
possible structures are first calculated. The probability of the RNA adopting one of these
structures is calculated using the partition function. This partition function can then be
used to measure the “diversity” of possible structures. If the structures are very similar
(different by only a few base pairs) the ensemble diversity will be low, however, if
there are a wide variety of structures possible, the ensemble diversity will be high.
1.3. ScanFold-Scan Input
a) Sequence (required)
Must be in Fasta format (input as text or uploaded). Can be in DNA or RNA
format. This is the minimal input and is required for ScanFold-Scan.
b) Name (No spaces or characters allowed; default “UserInput” | optional)
c) E-mail (optional)
The following input parameters are set to default values which will be optimal for most users, but
can be changed by user input.
d) Temperature (in Celsius; default 37C)
e) Window Size (length in nucleotides; default 120 nt)
f) Step Size (length in nucleotides; default 10 nt)
g) Randomizations (number of random sequences which will be generated
during the calculation of z-score; default 30x)
h) Randomization type (randomization method | mononucleotide OR
dinucleotide; default mononucleotide shuffle)
1.4. ScanFold-Scan Output
The results of ScanFold-Scan are shown in an IGV web browser and output to downloadable
text files.
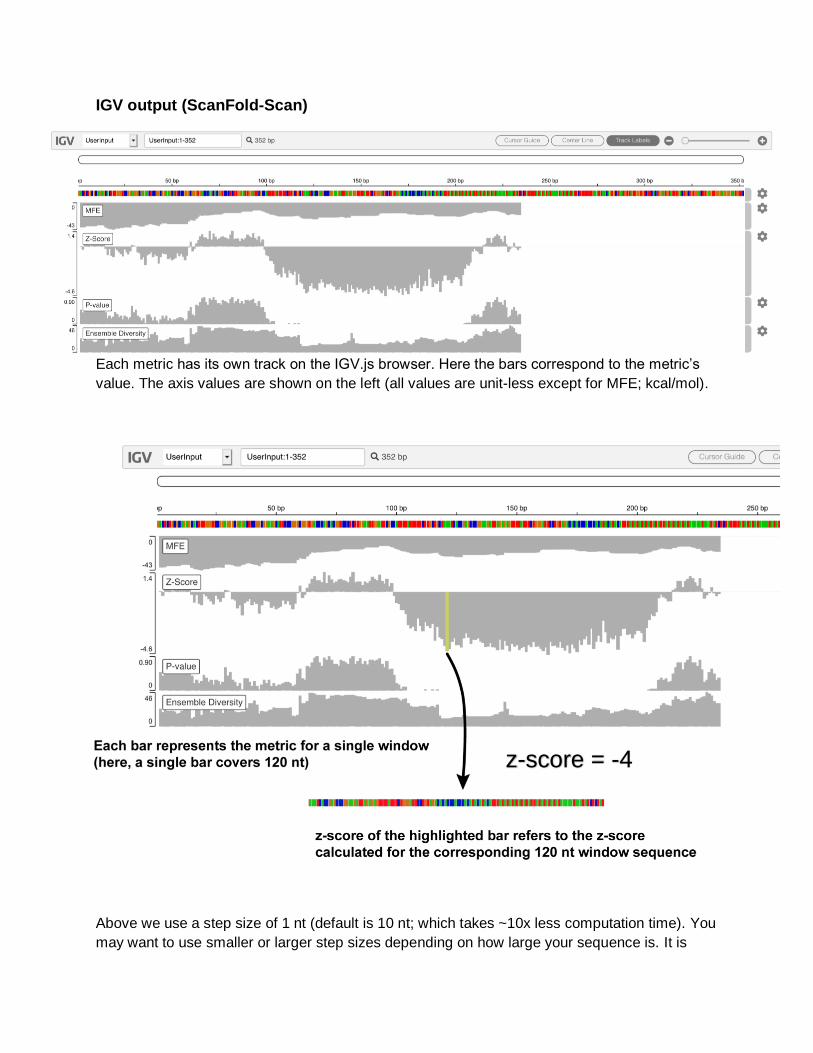
IGV output (ScanFold-Scan)
Each metric has its own track on the IGV.js browser. Here the bars correspond to the metric’s
value. The axis values are shown on the left (all values are unit-less except for MFE; kcal/mol).
Above we use a step size of 1 nt (default is 10 nt; which takes ~10x less computation time). You
may want to use smaller or larger step sizes depending on how large your sequence is. It is
z-score = -4
likely that potentially functional structures are not bound by the chosen window size. Therefore,
you may want to adjust the window size (max 600 nt).
In the example above, we see a large stretch of highly negative z-scores (indicating that a
region from nt 100 to ~320 contains some RNA secondary structure which is unusually stable
for its particular nucleotide composition). In this example case, we have used a region from the
human genome known to contain a riboswitch: the VEGFA 3'UTR.
Indeed, the region with low z-scores correspond with the known riboswitch sequence. Using this
method can allow for a quick search for low z-score regions in a given sequence. If your
sequence has highly negative regions you may want to find more details. In any case, we also
provide detailed text output of the scan results.
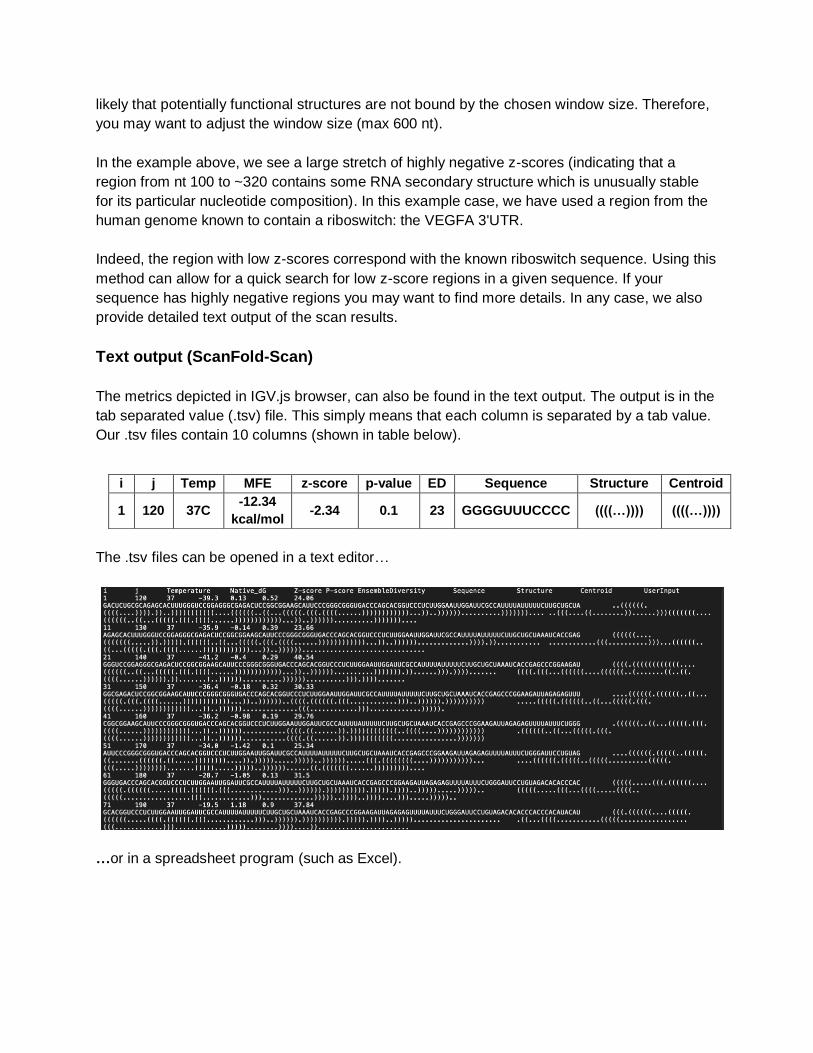
Text output (ScanFold-Scan)
The metrics depicted in IGV.js browser, can also be found in the text output. The output is in the
tab separated value (.tsv) file. This simply means that each column is separated by a tab value.
Our .tsv files contain 10 columns (shown in table below).
The .tsv files can be opened in a text editor…
…or in a spreadsheet program (such as Excel).
i j Temp MFE z-score p-value ED Sequence Structure Centroid
1 120 37C -12.34
kcal/mol -2.34 0.1 23 GGGGUUUCCCC ((((…)))) ((((…))))
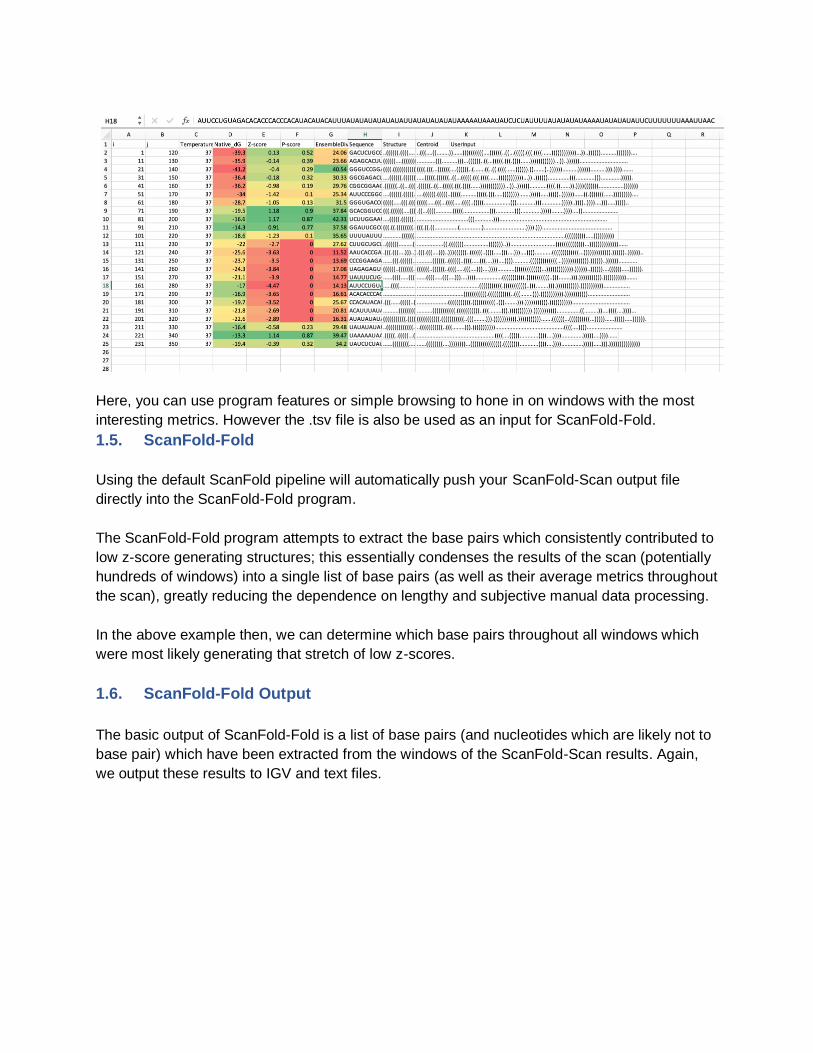
Here, you can use program features or simple browsing to hone in on windows with the most
interesting metrics. However the .tsv file is also be used as an input for ScanFold-Fold.
1.5. ScanFold-Fold
Using the default ScanFold pipeline will automatically push your ScanFold-Scan output file
directly into the ScanFold-Fold program.
The ScanFold-Fold program attempts to extract the base pairs which consistently contributed to
low z-score generating structures; this essentially condenses the results of the scan (potentially
hundreds of windows) into a single list of base pairs (as well as their average metrics throughout
the scan), greatly reducing the dependence on lengthy and subjective manual data processing.
In the above example then, we can determine which base pairs throughout all windows which
were most likely generating that stretch of low z-scores.
1.6. ScanFold-Fold Output
The basic output of ScanFold-Fold is a list of base pairs (and nucleotides which are likely not to
base pair) which have been extracted from the windows of the ScanFold-Scan results. Again,
we output these results to IGV and text files.
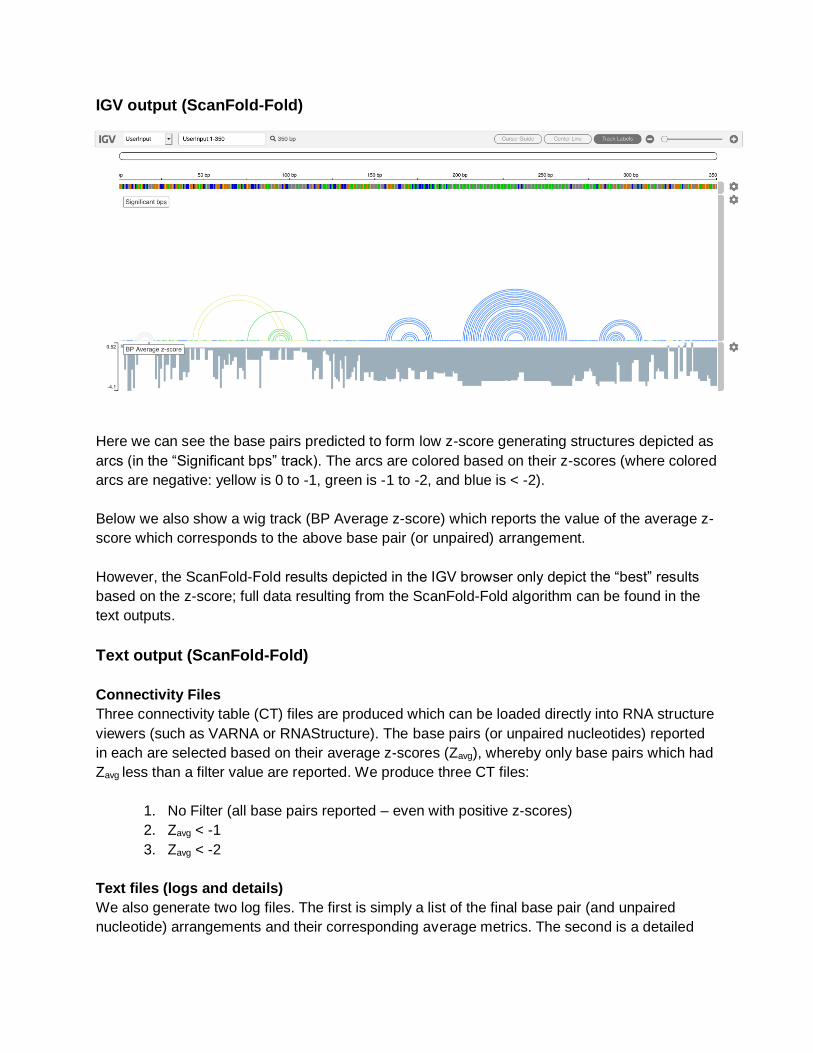
IGV output (ScanFold-Fold)
Here we can see the base pairs predicted to form low z-score generating structures depicted as
arcs (in the “Significant bps” track). The arcs are colored based on their z-scores (where colored
arcs are negative: yellow is 0 to -1, green is -1 to -2, and blue is < -2).
Below we also show a wig track (BP Average z-score) which reports the value of the average z-
score which corresponds to the above base pair (or unpaired) arrangement.
However, the ScanFold-Fold results depicted in the IGV browser only depict the “best” results
based on the z-score; full data resulting from the ScanFold-Fold algorithm can be found in the
text outputs.
Text output (ScanFold-Fold)
Connectivity Files
Three connectivity table (CT) files are produced which can be loaded directly into RNA structure
viewers (such as VARNA or RNAStructure). The base pairs (or unpaired nucleotides) reported
in each are selected based on their average z-scores (Zavg), whereby only base pairs which had
Zavg less than a filter value are reported. We produce three CT files:
1. No Filter (all base pairs reported – even with positive z-scores)
2. Zavg < -1
3. Zavg < -2
Text files (logs and details)
We also generate two log files. The first is simply a list of the final base pair (and unpaired
nucleotide) arrangements and their corresponding average metrics. The second is a detailed
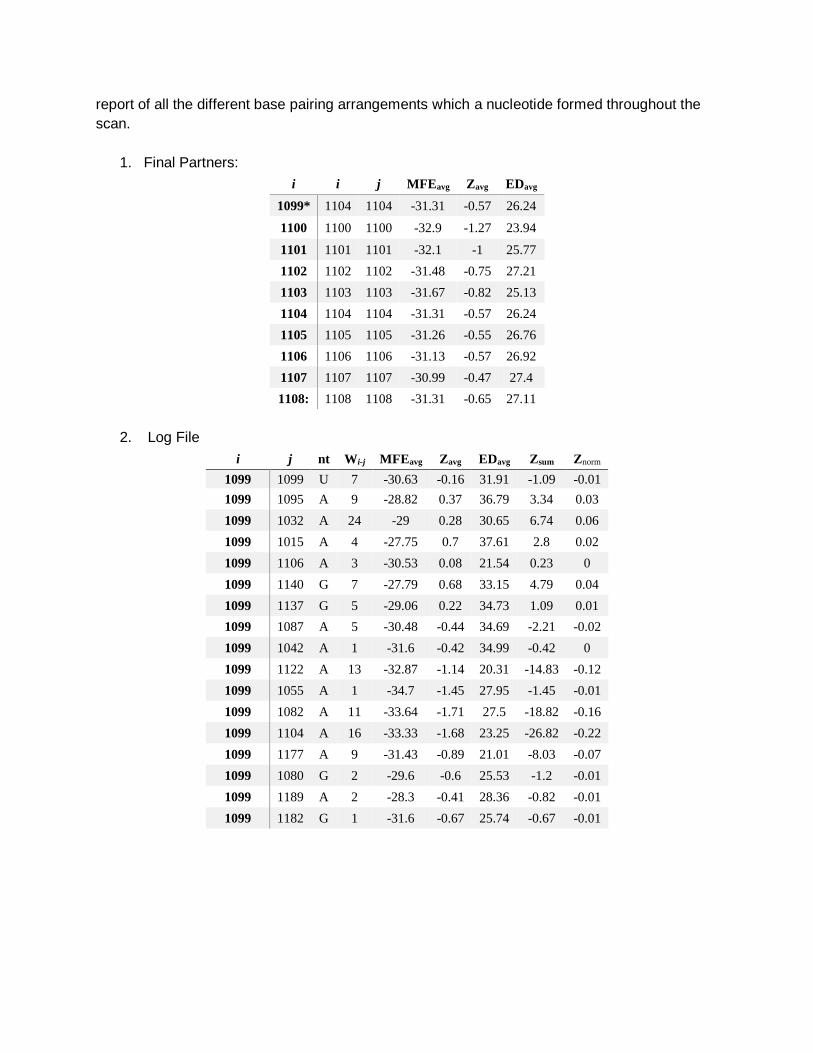
report of all the different base pairing arrangements which a nucleotide formed throughout the
scan.
1. Final Partners:
i i j MFEavg Zavg EDavg
1099* 1104 1104 -31.31 -0.57 26.24
1100 1100 1100 -32.9 -1.27 23.94
1101 1101 1101 -32.1 -1 25.77
1102 1102 1102 -31.48 -0.75 27.21
1103 1103 1103 -31.67 -0.82 25.13
1104 1104 1104 -31.31 -0.57 26.24
1105 1105 1105 -31.26 -0.55 26.76
1106 1106 1106 -31.13 -0.57 26.92
1107 1107 1107 -30.99 -0.47 27.4
1108: 1108 1108 -31.31 -0.65 27.11
2. Log File
i j nt Wi-j MFEavg Zavg EDavg Zsum Znorm
1099 1099 U 7 -30.63 -0.16 31.91 -1.09 -0.01
1099 1095 A 9 -28.82 0.37 36.79 3.34 0.03
1099 1032 A 24 -29 0.28 30.65 6.74 0.06
1099 1015 A 4 -27.75 0.7 37.61 2.8 0.02
1099 1106 A 3 -30.53 0.08 21.54 0.23 0
1099 1140 G 7 -27.79 0.68 33.15 4.79 0.04
1099 1137 G 5 -29.06 0.22 34.73 1.09 0.01
1099 1087 A 5 -30.48 -0.44 34.69 -2.21 -0.02
1099 1042 A 1 -31.6 -0.42 34.99 -0.42 0
1099 1122 A 13 -32.87 -1.14 20.31 -14.83 -0.12
1099 1055 A 1 -34.7 -1.45 27.95 -1.45 -0.01
1099 1082 A 11 -33.64 -1.71 27.5 -18.82 -0.16
1099 1104 A 16 -33.33 -1.68 23.25 -26.82 -0.22
1099 1177 A 9 -31.43 -0.89 21.01 -8.03 -0.07
1099 1080 G 2 -29.6 -0.6 25.53 -1.2 -0.01
1099 1189 A 2 -28.3 -0.41 28.36 -0.82 -0.01
1099 1182 G 1 -31.6 -0.67 25.74 -0.67 -0.01