Embed Size (px)
Citation preview
GEOG 245: Geographic Information Systems
Lab 01
1
Tutorial 1– Exploring ArcGIS Before beginning this tutorial, you should make sure your GIS network folder is mapped on the computer
you are using. Please refer to the “How to map your GIS server folder as a network drive” document for
instructions.
Objectives:
• Starting ArcMap and opening a map
• Managing the layers window
• Learning the difference between layout view and data view
• Navigating within ArcMap
• Exploring data on a map
• Exploring attribute data for a layer
• Adding data to a map
The ArcGIS Structure
ArcGIS consists of several separate, but functionally connected, subsystems. Each
subsystem is designed to perform specific GIS tasks. For example, the ArcMap system
serves as the primary map production and analysis site for ArcGIS. Most of our work in
Geog 245 will take place within ArcMAP. ArcCatalog is another subsystem that allows
you to manage (view, document, search, etc.) your spatial data. Other ArcGIS
subsystems that we will be using in this course include ArcToolbox and ArcScene.
Launching ArcMap
The ArcMap system is launched in the following way (at least on the majority of
computers): Start Menu � Programs � ArcGIS � ArcMap10
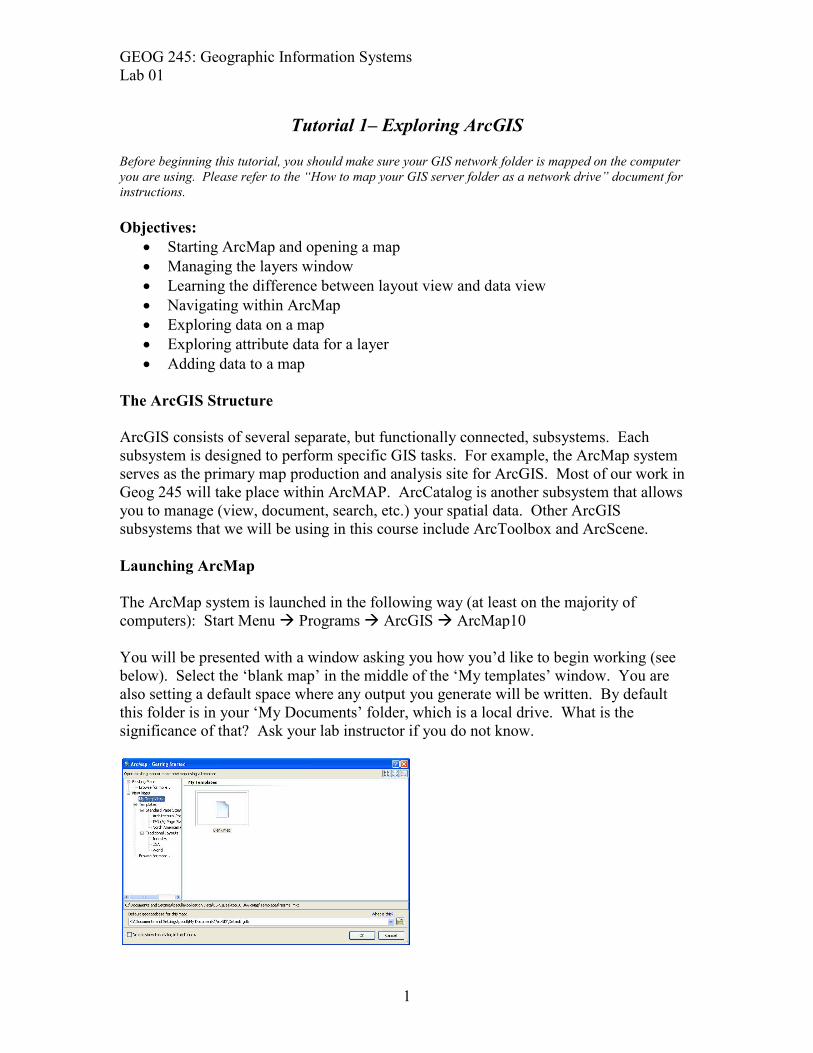
You will be presented with a window asking you how you’d like to begin working (see
below). Select the ‘blank map’ in the middle of the ‘My templates’ window. You are
also setting a default space where any output you generate will be written. By default
this folder is in your ‘My Documents’ folder, which is a local drive. What is the
significance of that? Ask your lab instructor if you do not know.
GEOG 245: Geographic Information Systems
Lab 01
2
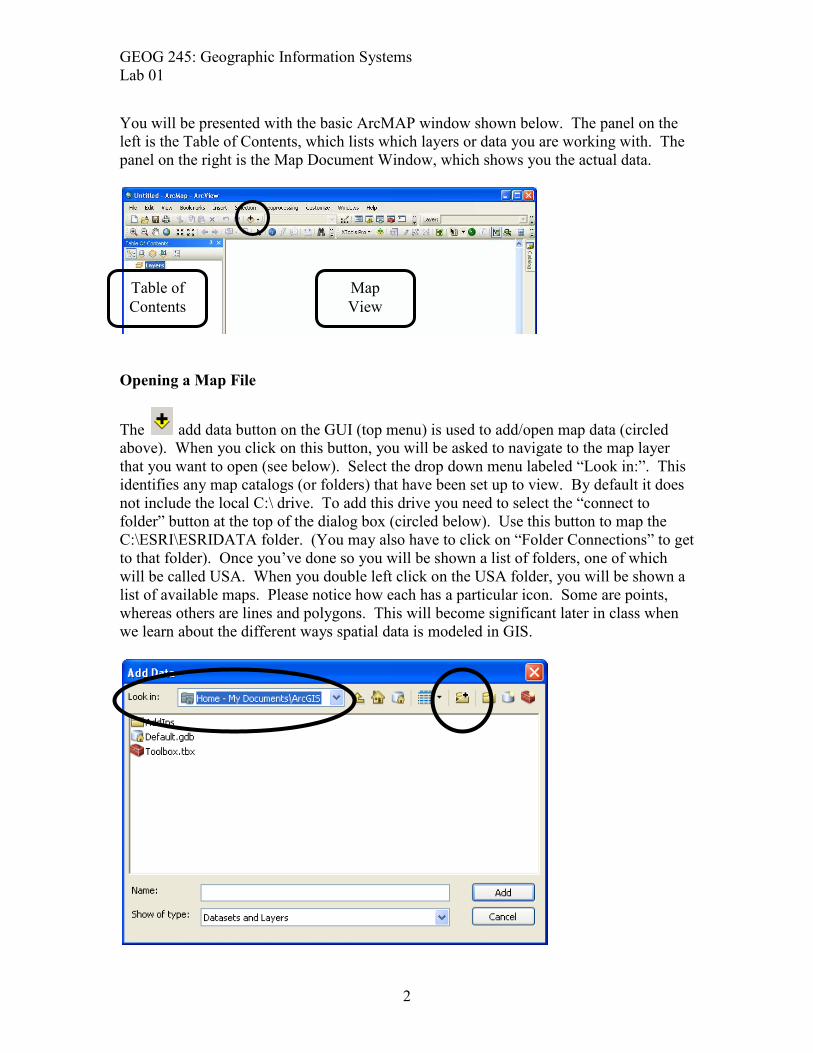
You will be presented with the basic ArcMAP window shown below. The panel on the
left is the Table of Contents, which lists which layers or data you are working with. The
panel on the right is the Map Document Window, which shows you the actual data.
Opening a Map File
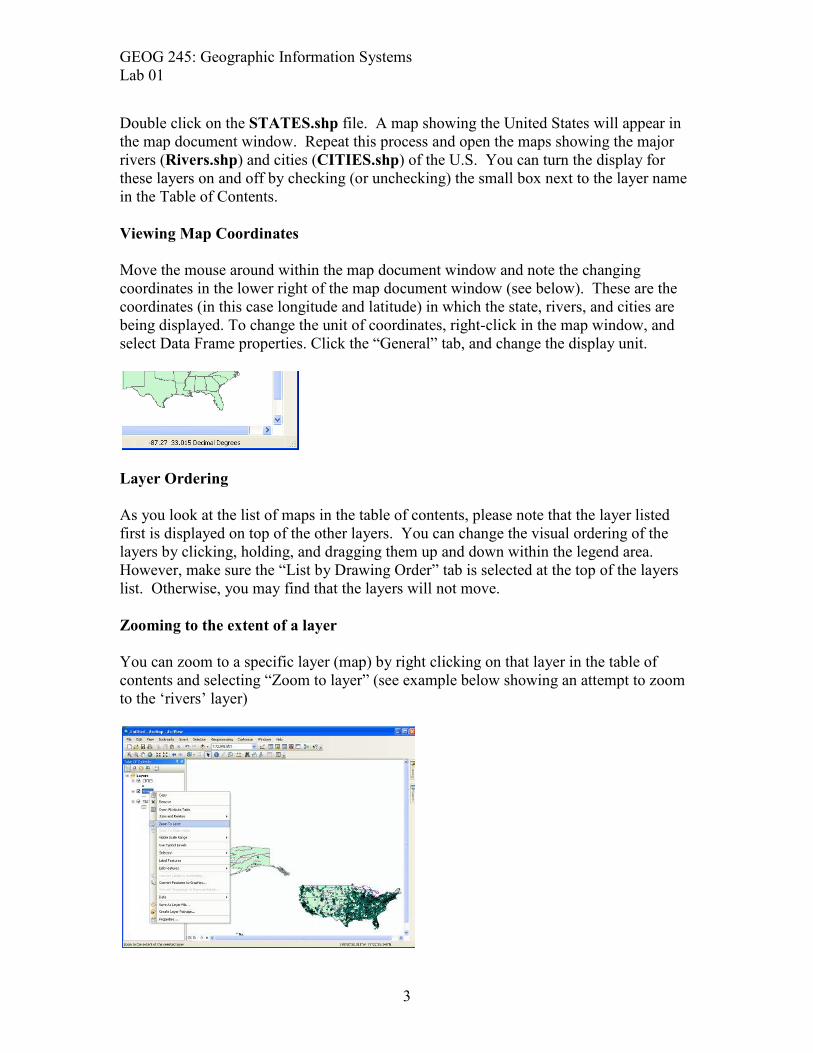
The add data button on the GUI (top menu) is used to add/open map data (circled
above). When you click on this button, you will be asked to navigate to the map layer
that you want to open (see below). Select the drop down menu labeled “Look in:”. This
identifies any map catalogs (or folders) that have been set up to view. By default it does
not include the local C:\ drive. To add this drive you need to select the “connect to
folder” button at the top of the dialog box (circled below). Use this button to map the
C:\ESRI\ESRIDATA folder. (You may also have to click on “Folder Connections” to get
to that folder). Once you’ve done so you will be shown a list of folders, one of which
will be called USA. When you double left click on the USA folder, you will be shown a
list of available maps. Please notice how each has a particular icon. Some are points,
whereas others are lines and polygons. This will become significant later in class when
we learn about the different ways spatial data is modeled in GIS.
Table of
Contents
Map
View
GEOG 245: Geographic Information Systems
Lab 01
3
Double click on the STATES.shp file. A map showing the United States will appear in
the map document window. Repeat this process and open the maps showing the major
rivers (Rivers.shp) and cities (CITIES.shp) of the U.S. You can turn the display for
these layers on and off by checking (or unchecking) the small box next to the layer name
in the Table of Contents.
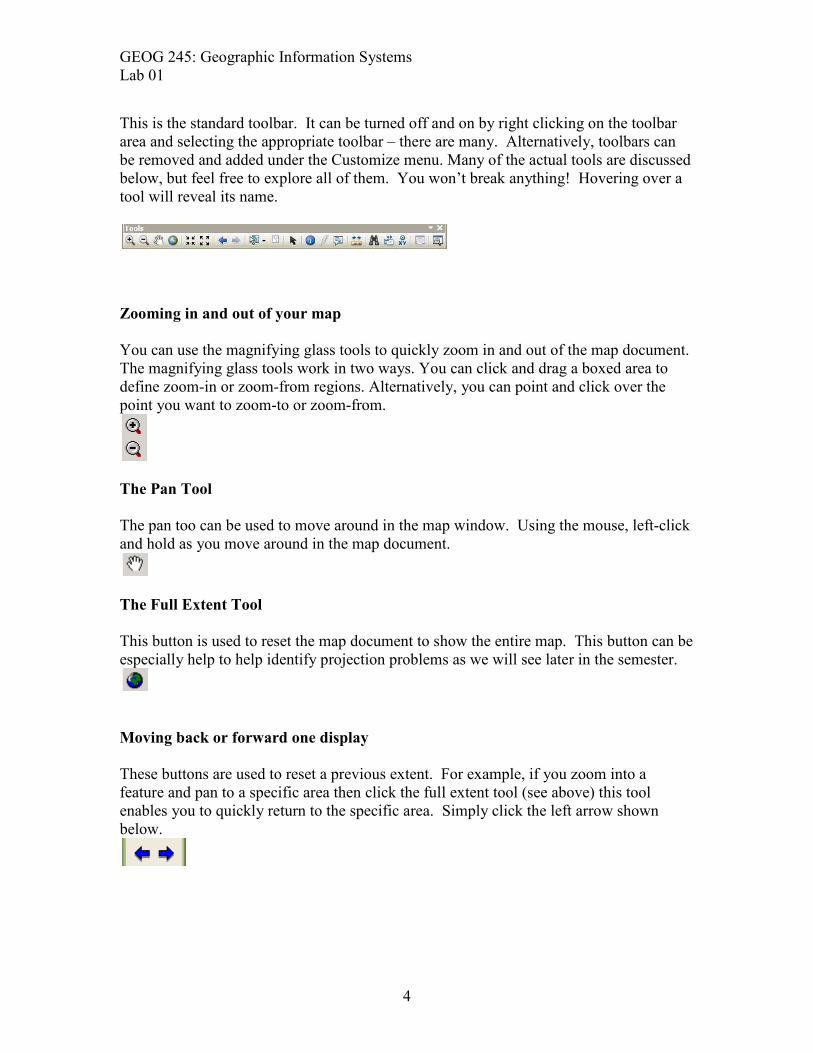
Viewing Map Coordinates
Move the mouse around within the map document window and note the changing
coordinates in the lower right of the map document window (see below). These are the
coordinates (in this case longitude and latitude) in which the state, rivers, and cities are
being displayed. To change the unit of coordinates, right-click in the map window, and
select Data Frame properties. Click the “General” tab, and change the display unit.
Layer Ordering
As you look at the list of maps in the table of contents, please note that the layer listed
first is displayed on top of the other layers. You can change the visual ordering of the
layers by clicking, holding, and dragging them up and down within the legend area.
However, make sure the “List by Drawing Order” tab is selected at the top of the layers
list. Otherwise, you may find that the layers will not move.
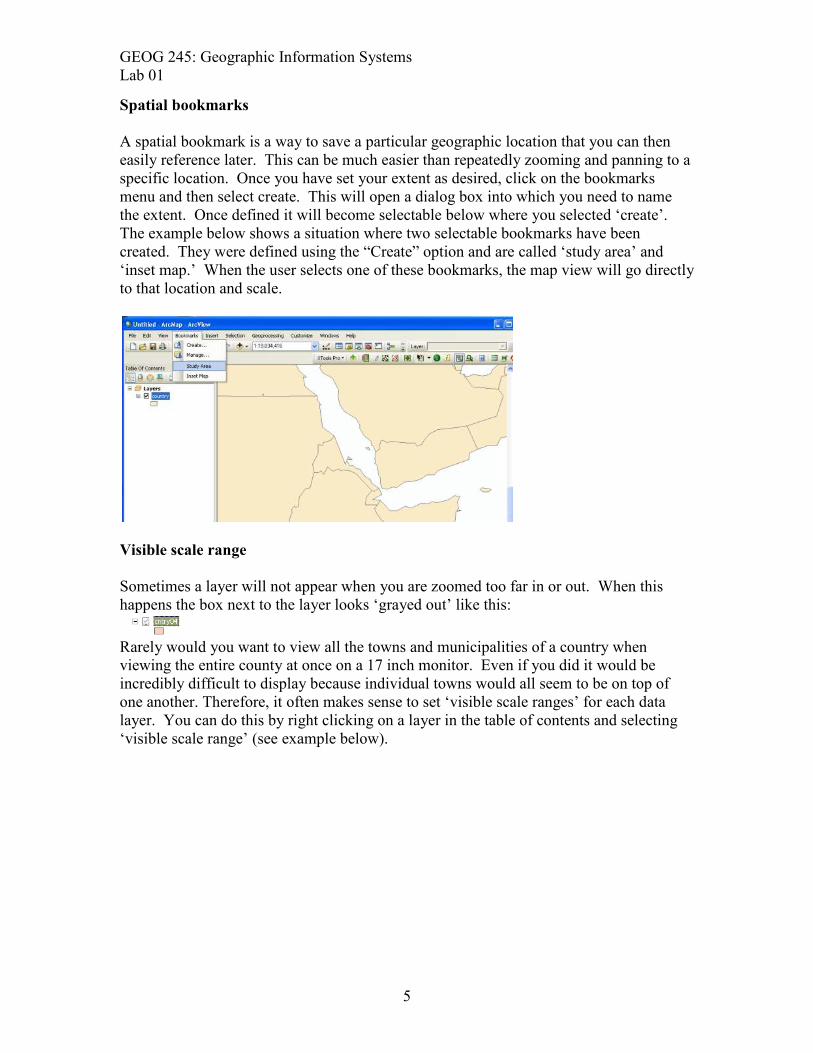
Zooming to the extent of a layer
You can zoom to a specific layer (map) by right clicking on that layer in the table of
contents and selecting “Zoom to layer” (see example below showing an attempt to zoom
to the ‘rivers’ layer)
GEOG 245: Geographic Information Systems
Lab 01
4
This is the standard toolbar. It can be turned off and on by right clicking on the toolbar
area and selecting the appropriate toolbar – there are many. Alternatively, toolbars can
be removed and added under the Customize menu. Many of the actual tools are discussed
below, but feel free to explore all of them. You won’t break anything! Hovering over a
tool will reveal its name.
Zooming in and out of your map
You can use the magnifying glass tools to quickly zoom in and out of the map document.
The magnifying glass tools work in two ways. You can click and drag a boxed area to
define zoom-in or zoom-from regions. Alternatively, you can point and click over the
point you want to zoom-to or zoom-from.
The Pan Tool
The pan too can be used to move around in the map window. Using the mouse, left-click
and hold as you move around in the map document.
The Full Extent Tool
This button is used to reset the map document to show the entire map. This button can be
especially help to help identify projection problems as we will see later in the semester.
Moving back or forward one display
These buttons are used to reset a previous extent. For example, if you zoom into a
feature and pan to a specific area then click the full extent tool (see above) this tool
enables you to quickly return to the specific area. Simply click the left arrow shown
below.
GEOG 245: Geographic Information Systems
Lab 01
5
Spatial bookmarks
A spatial bookmark is a way to save a particular geographic location that you can then
easily reference later. This can be much easier than repeatedly zooming and panning to a
specific location. Once you have set your extent as desired, click on the bookmarks
menu and then select create. This will open a dialog box into which you need to name
the extent. Once defined it will become selectable below where you selected ‘create’.
The example below shows a situation where two selectable bookmarks have been
created. They were defined using the “Create” option and are called ‘study area’ and
‘inset map.’ When the user selects one of these bookmarks, the map view will go directly
to that location and scale.
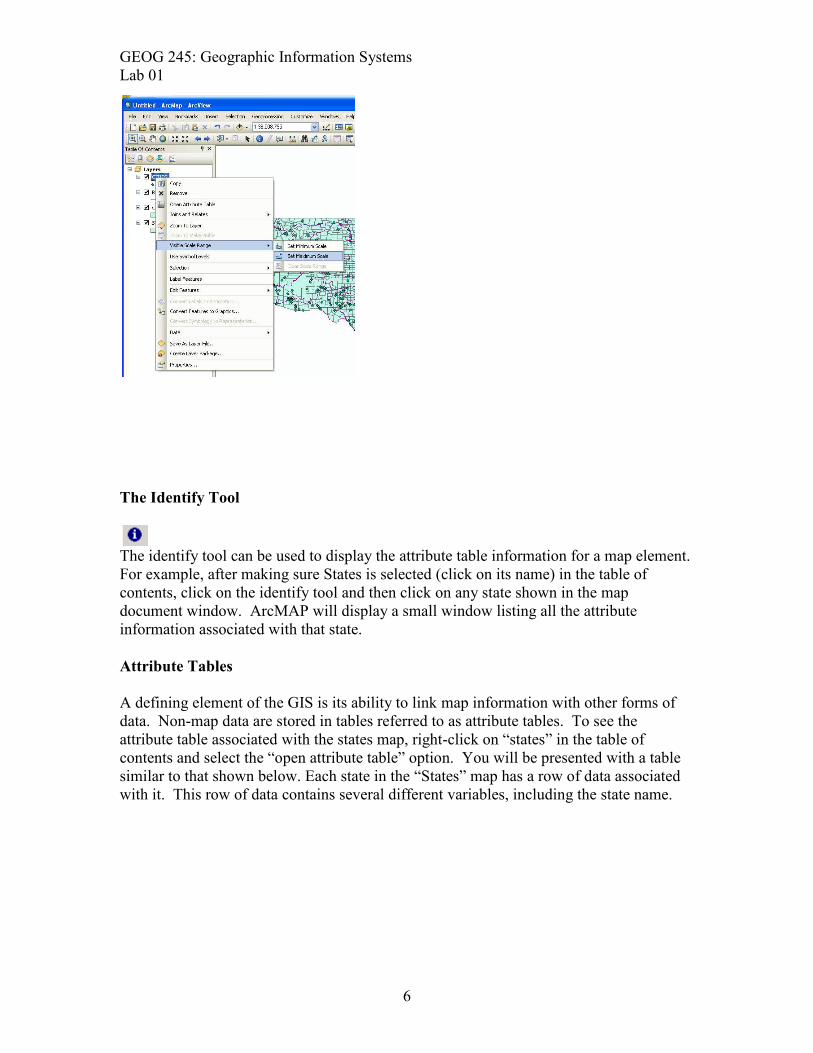
Visible scale range
Sometimes a layer will not appear when you are zoomed too far in or out. When this
happens the box next to the layer looks ‘grayed out’ like this:
Rarely would you want to view all the towns and municipalities of a country when
viewing the entire county at once on a 17 inch monitor. Even if you did it would be
incredibly difficult to display because individual towns would all seem to be on top of
one another. Therefore, it often makes sense to set ‘visible scale ranges’ for each data
layer. You can do this by right clicking on a layer in the table of contents and selecting
‘visible scale range’ (see example below).
GEOG 245: Geographic Information Systems
Lab 01
6
The Identify Tool
The identify tool can be used to display the attribute table information for a map element.
For example, after making sure States is selected (click on its name) in the table of
contents, click on the identify tool and then click on any state shown in the map
document window. ArcMAP will display a small window listing all the attribute
information associated with that state.
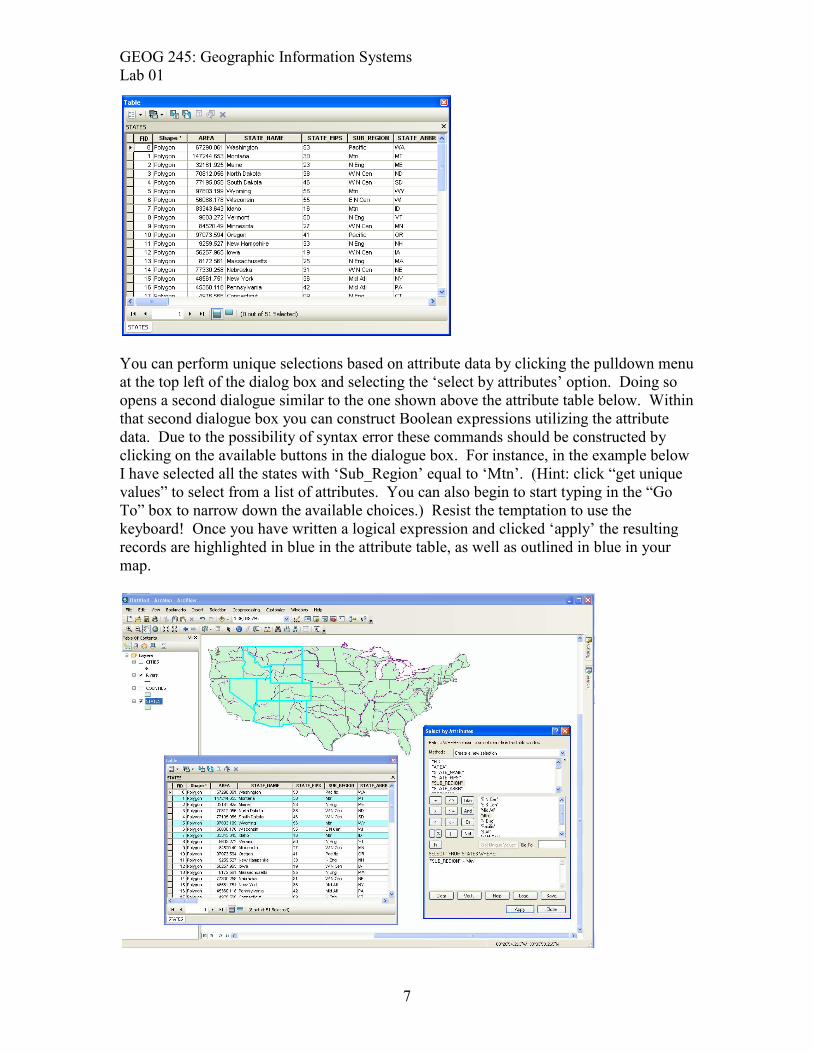
Attribute Tables
A defining element of the GIS is its ability to link map information with other forms of
data. Non-map data are stored in tables referred to as attribute tables. To see the
attribute table associated with the states map, right-click on “states” in the table of
contents and select the “open attribute table” option. You will be presented with a table
similar to that shown below. Each state in the “States” map has a row of data associated
with it. This row of data contains several different variables, including the state name.
GEOG 245: Geographic Information Systems
Lab 01
7
You can perform unique selections based on attribute data by clicking the pulldown menu
at the top left of the dialog box and selecting the ‘select by attributes’ option. Doing so
opens a second dialogue similar to the one shown above the attribute table below. Within
that second dialogue box you can construct Boolean expressions utilizing the attribute
data. Due to the possibility of syntax error these commands should be constructed by
clicking on the available buttons in the dialogue box. For instance, in the example below
I have selected all the states with ‘Sub_Region’ equal to ‘Mtn’. (Hint: click “get unique
values” to select from a list of attributes. You can also begin to start typing in the “Go
To” box to narrow down the available choices.) Resist the temptation to use the
keyboard! Once you have written a logical expression and clicked ‘apply’ the resulting
records are highlighted in blue in the attribute table, as well as outlined in blue in your
map.
GEOG 245: Geographic Information Systems
Lab 01
8
You can deselect these “Mtn” states by either selecting “Clear Selection” in the options
dropdown of the attribute table or by selecting “Clear selected features” from the
selection menu in the main ArcMap window.
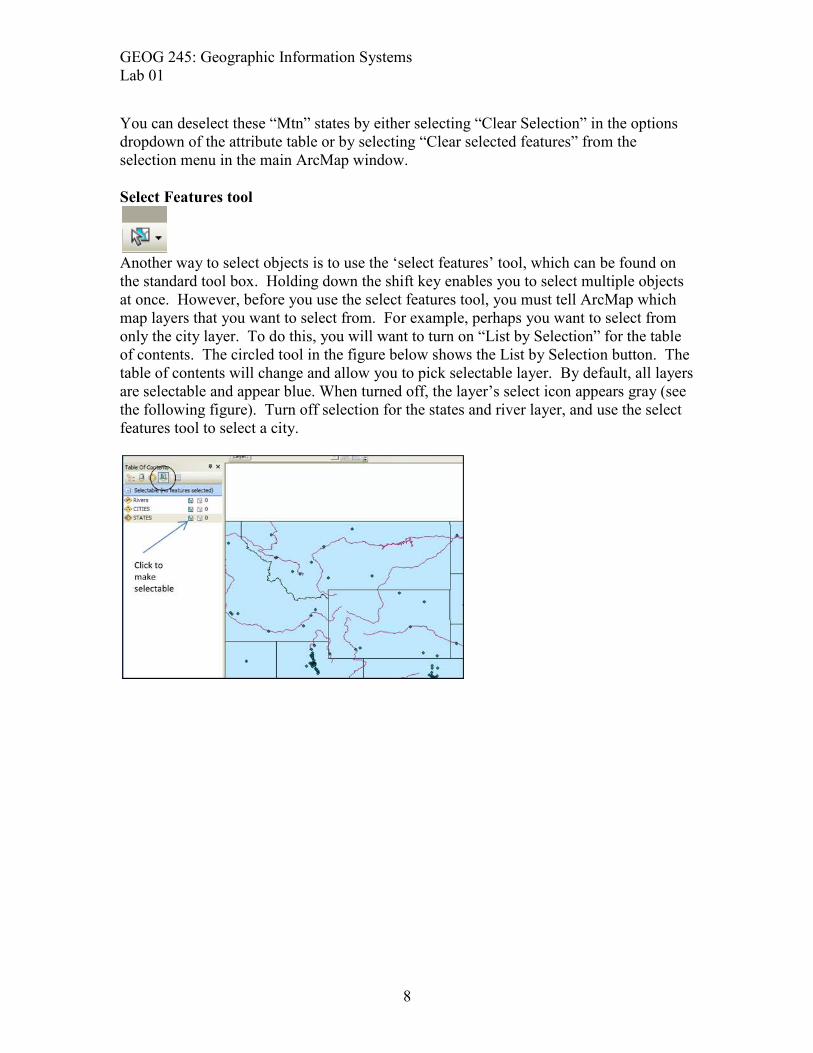
Select Features tool
Another way to select objects is to use the ‘select features’ tool, which can be found on
the standard tool box. Holding down the shift key enables you to select multiple objects
at once. However, before you use the select features tool, you must tell ArcMap which
map layers that you want to select from. For example, perhaps you want to select from
only the city layer. To do this, you will want to turn on “List by Selection” for the table
of contents. The circled tool in the figure below shows the List by Selection button. The
table of contents will change and allow you to pick selectable layer. By default, all layers
are selectable and appear blue. When turned off, the layer’s select icon appears gray (see
the following figure). Turn off selection for the states and river layer, and use the select
features tool to select a city.
GEOG 245: Geographic Information Systems
Lab 01
9
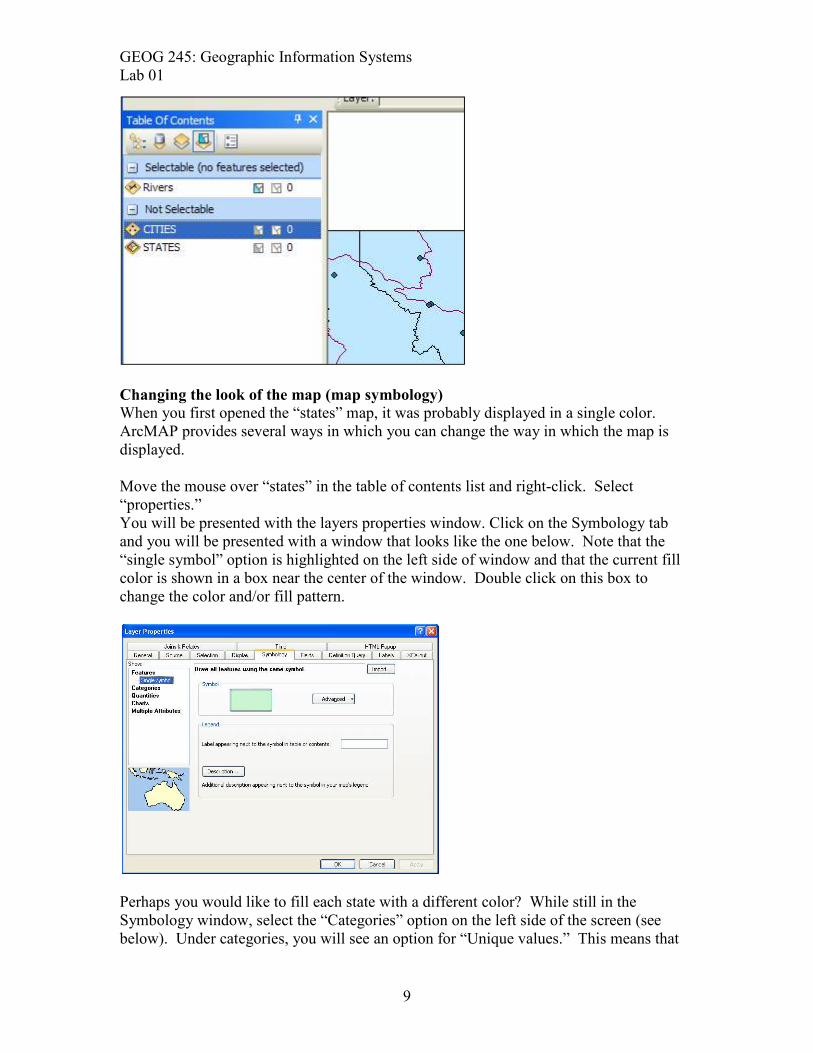
Changing the look of the map (map symbology)
When you first opened the “states” map, it was probably displayed in a single color.
ArcMAP provides several ways in which you can change the way in which the map is
displayed.
Move the mouse over “states” in the table of contents list and right-click. Select
“properties.”
You will be presented with the layers properties window. Click on the Symbology tab
and you will be presented with a window that looks like the one below. Note that the
“single symbol” option is highlighted on the left side of window and that the current fill
color is shown in a box near the center of the window. Double click on this box to
change the color and/or fill pattern.
Perhaps you would like to fill each state with a different color? While still in the
Symbology window, select the “Categories” option on the left side of the screen (see
below). Under categories, you will see an option for “Unique values.” This means that
GEOG 245: Geographic Information Systems
Lab 01
10
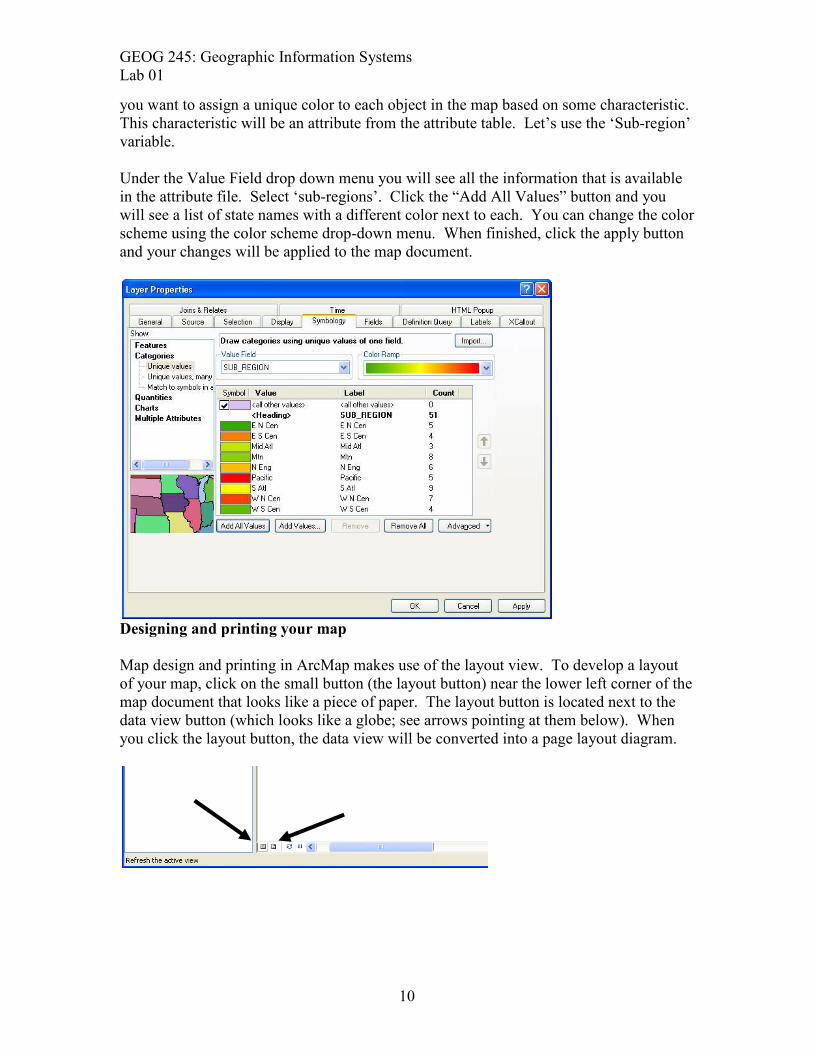
you want to assign a unique color to each object in the map based on some characteristic.
This characteristic will be an attribute from the attribute table. Let’s use the ‘Sub-region’
variable.
Under the Value Field drop down menu you will see all the information that is available
in the attribute file. Select ‘sub-regions’. Click the “Add All Values” button and you
will see a list of state names with a different color next to each. You can change the color
scheme using the color scheme drop-down menu. When finished, click the apply button
and your changes will be applied to the map document.
Designing and printing your map
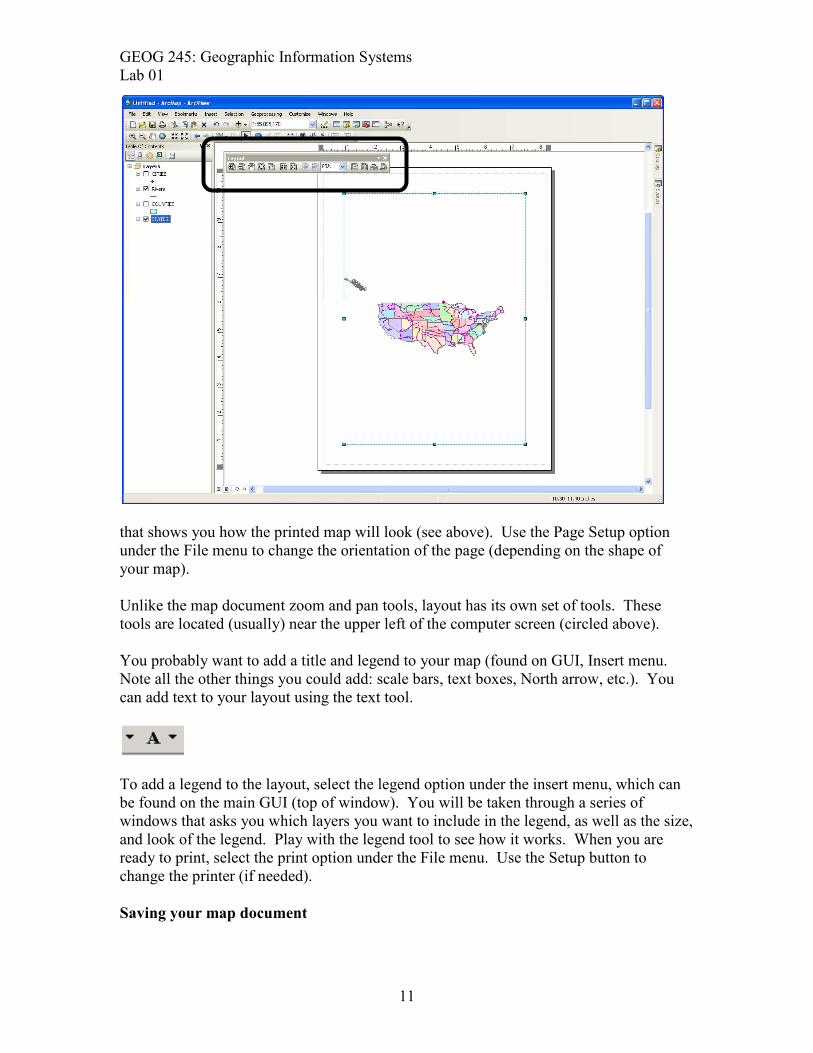
Map design and printing in ArcMap makes use of the layout view. To develop a layout
of your map, click on the small button (the layout button) near the lower left corner of the
map document that looks like a piece of paper. The layout button is located next to the
data view button (which looks like a globe; see arrows pointing at them below). When
you click the layout button, the data view will be converted into a page layout diagram.
GEOG 245: Geographic Information Systems
Lab 01
11
that shows you how the printed map will look (see above). Use the Page Setup option
under the File menu to change the orientation of the page (depending on the shape of
your map).
Unlike the map document zoom and pan tools, layout has its own set of tools. These
tools are located (usually) near the upper left of the computer screen (circled above).
You probably want to add a title and legend to your map (found on GUI, Insert menu.
Note all the other things you could add: scale bars, text boxes, North arrow, etc.). You
can add text to your layout using the text tool.
To add a legend to the layout, select the legend option under the insert menu, which can
be found on the main GUI (top of window). You will be taken through a series of
windows that asks you which layers you want to include in the legend, as well as the size,
and look of the legend. Play with the legend tool to see how it works. When you are
ready to print, select the print option under the File menu. Use the Setup button to
change the printer (if needed).
Saving your map document
GEOG 245: Geographic Information Systems
Lab 01
12
You can save your work by using the save or save as options under the file menu.
ArcMAP will create a map document file (*.mxd) which, when opened, will instruct
ArcMAP how to recreate your map. Please remember that the map document file
does not actually save any maps to your disc, but rather provides instructions for
map recreation. As such, if you move to a computer that doesn’t have the maps you
need to recreate your document, ArcMAP will not be able open the *.mxd file. Please
ask your lab instructor to explain the dangers of not keeping track of where your maps are
located! Later, we will show you a strategy involving relative path names as a way to
avoid trouble.
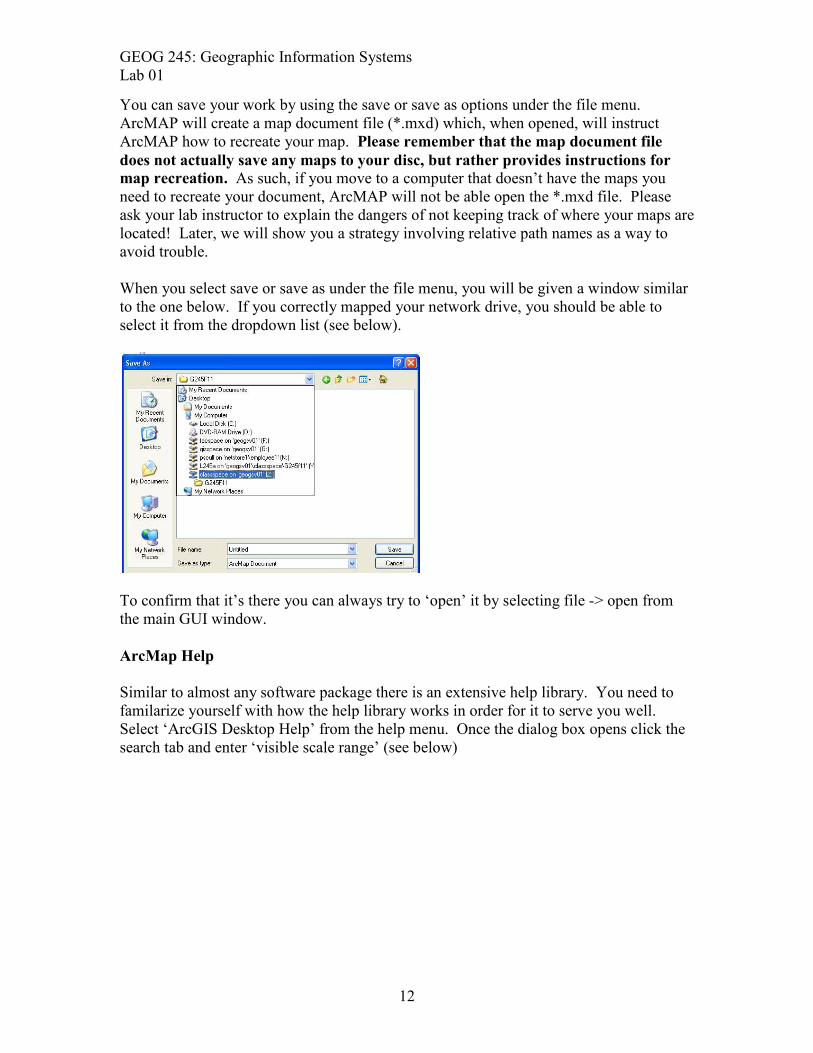
When you select save or save as under the file menu, you will be given a window similar
to the one below. If you correctly mapped your network drive, you should be able to
select it from the dropdown list (see below).
To confirm that it’s there you can always try to ‘open’ it by selecting file -> open from
the main GUI window.
ArcMap Help
Similar to almost any software package there is an extensive help library. You need to
familarize yourself with how the help library works in order for it to serve you well.
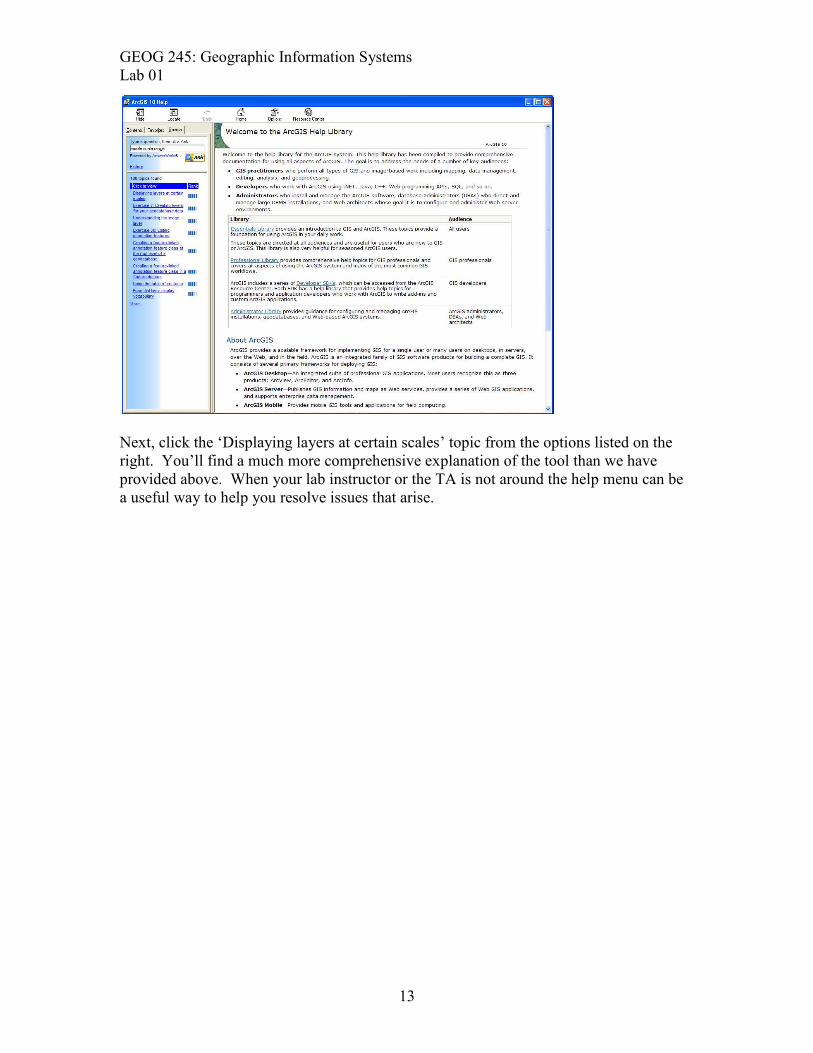
Select ‘ArcGIS Desktop Help’ from the help menu. Once the dialog box opens click the
search tab and enter ‘visible scale range’ (see below)
GEOG 245: Geographic Information Systems
Lab 01
13
Next, click the ‘Displaying layers at certain scales’ topic from the options listed on the
right. You’ll find a much more comprehensive explanation of the tool than we have
provided above. When your lab instructor or the TA is not around the help menu can be
a useful way to help you resolve issues that arise.