Embed Size (px)
Citation preview
22 June 2018
SBS-SS-SPSS -2016 (1/22)
Structural Business Statistics Services Sector Statistics on Products in the Services Sector
Year 2016. Final Results1
1 The results published today change the preliminary results published on 27 March 2018. This results have been obtained with a larger sample that allows to provide data on a more disaggregated level. 2The population under study is the set of companies whose main activity is described in the sections H, I, J, L, M, N, R and divisions 95 and 96 of the section S of the CNAE-2009 (see details in the methodological note included at the end of this document). 3 For more details, you can refer to the specific document “Measure of the impact of the methodological changes in the Structural Business Statistics 2016” :
http://www.ine.es/metodologia/t37/metodologia_eee_cambios2016.pdf 4 All the economic variables are valued at current prices.
Turnover of the Services sector stood at 471,050 million euros in 2016
More than one fifth of the sector's turnover corresponded to Transport and storage
Out of every 10 euros invoiced by transport companies, more than seven came from land transport
Turnover of companies in the non-financial market Services sector2 reached 471,050 million euros in 2016. The value added generated by these companies stood at 212,549 million euros,
For the reference year 2016 various methodological improvements have been implemented on the Structural Business Statistics, framed within the "Integration Project of the Structural Business Statistics". As a consequence of these changes, the results presented today are not strictly comparable to those of other years since the evolution of the variables is due not only to possible real changes produced in this period, but also to the effects of the methodological improvements on the estimation of said variables3.
Main magnitudes4. Year 2016
Variables económicas Millonesde euros
Cifra de negocios 471.050
Total de compras de bienes y servicios 277.983
Valor añadido a coste de los factores 212.549
Gastos de personal 130.621
Sueldos y salarios 102.730
Excedente bruto de explotación 81.927
Inversión en activos materiales 31.998
SBS-SS-SPSS -2016 (2/22)
Results by activity sections5
5 The companies studied were classified according to their main activity. Likewise, all of the study variables referring to the company are assigned to said activity.
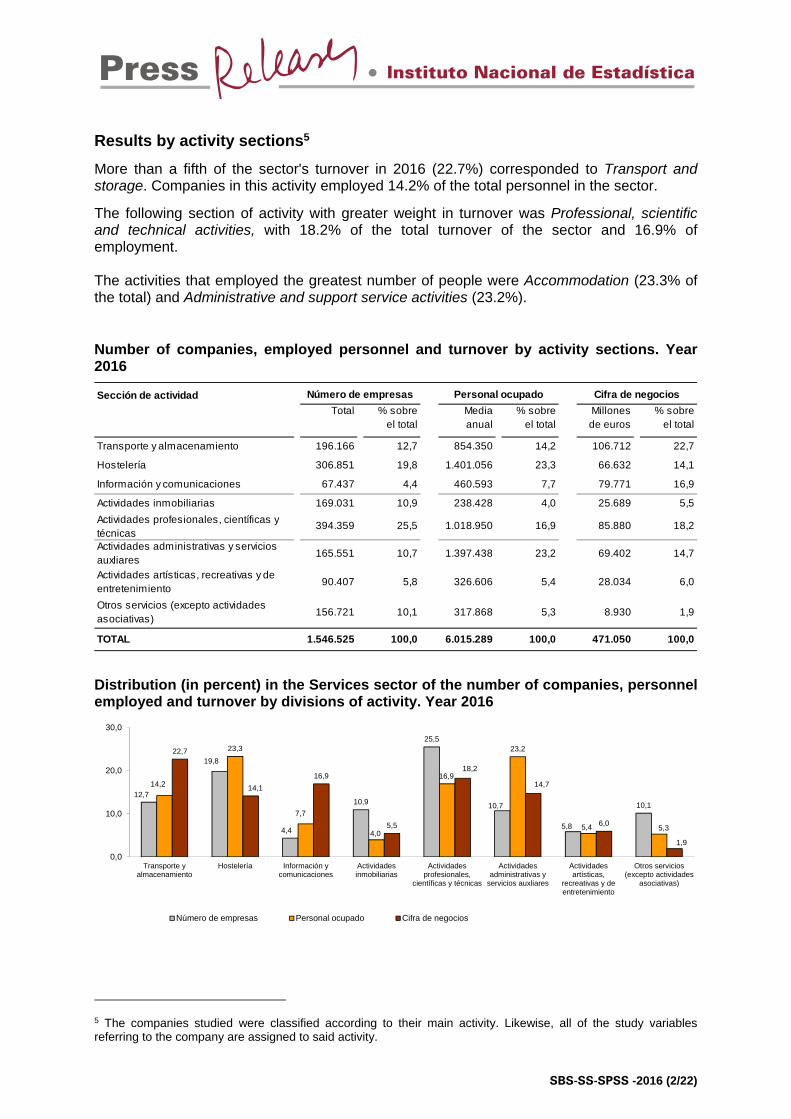
More than a fifth of the sector's turnover in 2016 (22.7%) corresponded to Transport and storage. Companies in this activity employed 14.2% of the total personnel in the sector.
The following section of activity with greater weight in turnover was Professional, scientific and technical activities, with 18.2% of the total turnover of the sector and 16.9% of employment. The activities that employed the greatest number of people were Accommodation (23.3% of the total) and Administrative and support service activities (23.2%). Number of companies, employed personnel and turnover by activity sections. Year 2016
Sección de actividad
Total % sobreel total
Media anual
% sobreel total
Millonesde euros
% sobreel total
Transporte y almacenamiento 196.166 12,7 854.350 14,2 106.712 22,7
Hostelería 306.851 19,8 1.401.056 23,3 66.632 14,1
Información y comunicaciones 67.437 4,4 460.593 7,7 79.771 16,9
Actividades inmobiliarias 169.031 10,9 238.428 4,0 25.689 5,5
Actividades profesionales, científicas y técnicas
394.359 25,5 1.018.950 16,9 85.880 18,2
Actividades administrativas y servicios auxliares
165.551 10,7 1.397.438 23,2 69.402 14,7
Actividades artísticas, recreativas y de entretenimiento
90.407 5,8 326.606 5,4 28.034 6,0
Otros servicios (excepto actividades asociativas)
156.721 10,1 317.868 5,3 8.930 1,9
TOTAL 1.546.525 100,0 6.015.289 100,0 471.050 100,0
Cifra de negociosPersonal ocupadoNúmero de empresas
Distribution (in percent) in the Services sector of the number of companies, personnel employed and turnover by divisions of activity. Year 2016
12,7
19,8
4,4
10,9
25,5
10,7
5,8
10,1
14,2
23,3
7,7
4,0
16,9
23,2
5,4 5,3
22,7
14,1
16,9
5,5
18,2
14,7
6,0
1,9
0,0
10,0
20,0
30,0
Transporte yalmacenamiento
Hostelería Información ycomunicaciones
Actividadesinmobiliarias
Actividadesprofesionales,
científicas y técnicas
Actividadesadministrativas y
servicios auxliares
Actividadesartísticas,
recreativas y deentretenimiento
Otros servicios(excepto actividades
asociativas)
Número de empresas Personal ocupado Cifra de negocios
SBS-SS-SPSS -2016 (3/22)
Results by divisions of activity
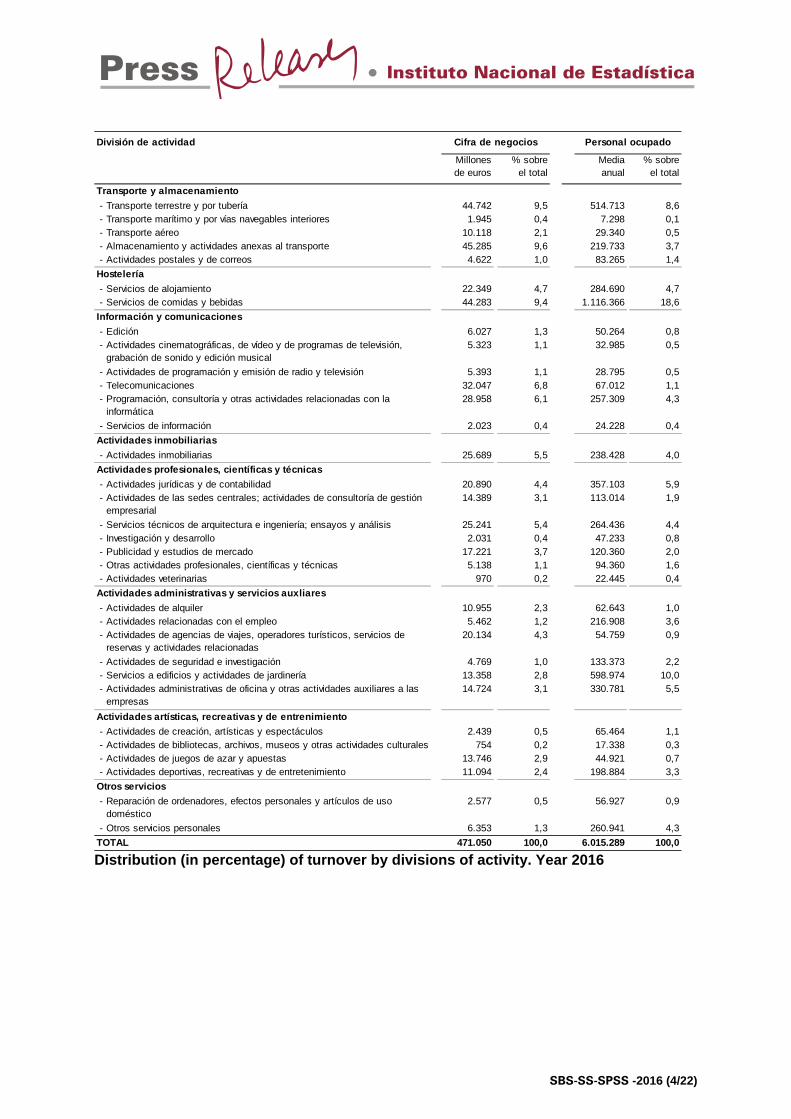
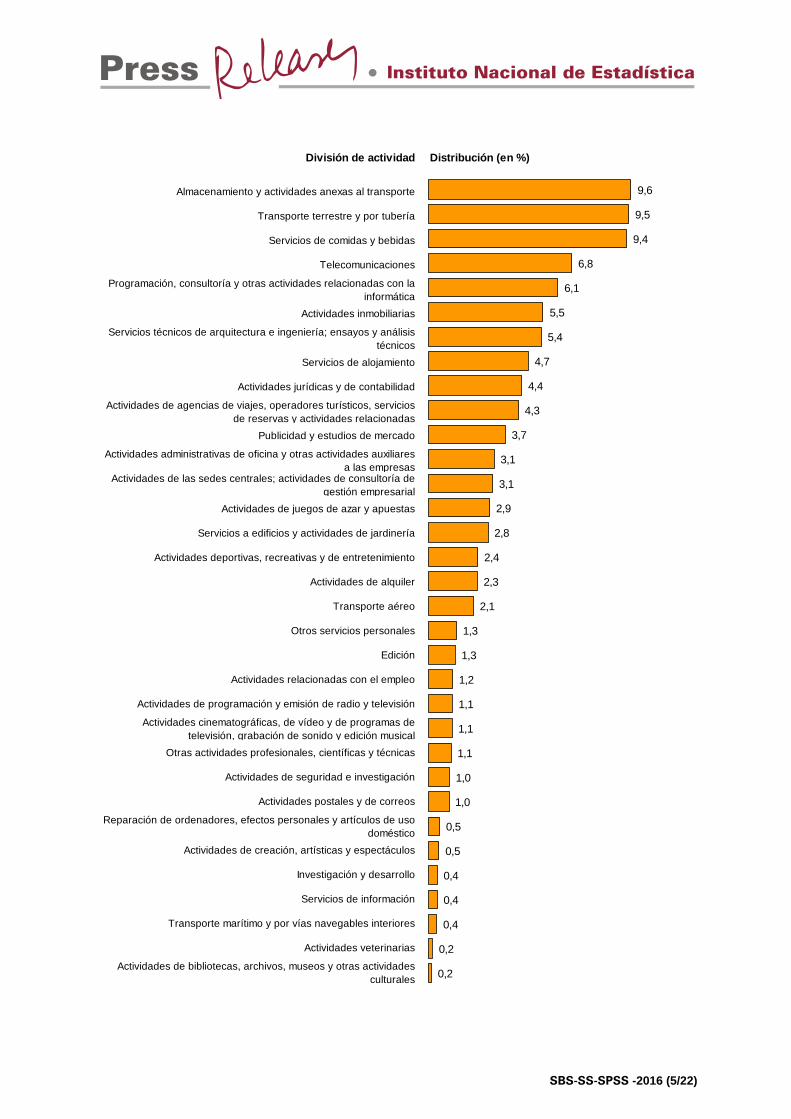
At a more disaggregated level, the divisions with greater contribution to the sector's turnover in 2016 were Warehousing and support activities for transportation (9.6% of the total), Land transport and transport via pipelines (9.5%) and Food and beverage service activities (9.4%).
On the other hand, the divisions of activity that employed the largest number of people were Food and beverage service activities (18.6% of the total), Services to buildings and landscape activities (10.0%) and Land transport and transport via pipelines (8.6%).
Turnover and employed personnel by divisions of activity. Year 2016
SBS-SS-SPSS -2016 (4/22)
División de actividad
Millonesde euros
% sobreel total
Media anual
% sobreel total
- Transporte terrestre y por tubería 44.742 9,5 514.713 8,6- Transporte marítimo y por vías navegables interiores 1.945 0,4 7.298 0,1- Transporte aéreo 10.118 2,1 29.340 0,5- Almacenamiento y actividades anexas al transporte 45.285 9,6 219.733 3,7- Actividades postales y de correos 4.622 1,0 83.265 1,4
- Servicios de alojamiento 22.349 4,7 284.690 4,7- Servicios de comidas y bebidas 44.283 9,4 1.116.366 18,6
- Edición 6.027 1,3 50.264 0,8- Actividades cinematográficas, de vídeo y de programas de televisión,
grabación de sonido y edición musical5.323 1,1 32.985 0,5
- Actividades de programación y emisión de radio y televisión 5.393 1,1 28.795 0,5- Telecomunicaciones 32.047 6,8 67.012 1,1- Programación, consultoría y otras actividades relacionadas con la
informática28.958 6,1 257.309 4,3
- Servicios de información 2.023 0,4 24.228 0,4
- Actividades inmobiliarias 25.689 5,5 238.428 4,0
- Actividades jurídicas y de contabilidad 20.890 4,4 357.103 5,9- Actividades de las sedes centrales; actividades de consultoría de gestión
empresarial14.389 3,1 113.014 1,9
- Servicios técnicos de arquitectura e ingeniería; ensayos y análisis 25.241 5,4 264.436 4,4- Investigación y desarrollo 2.031 0,4 47.233 0,8- Publicidad y estudios de mercado 17.221 3,7 120.360 2,0- Otras actividades profesionales, científicas y técnicas 5.138 1,1 94.360 1,6- Actividades veterinarias 970 0,2 22.445 0,4
- Actividades de alquiler 10.955 2,3 62.643 1,0- Actividades relacionadas con el empleo 5.462 1,2 216.908 3,6- Actividades de agencias de viajes, operadores turísticos, servicios de
reservas y actividades relacionadas20.134 4,3 54.759 0,9
- Actividades de seguridad e investigación 4.769 1,0 133.373 2,2- Servicios a edificios y actividades de jardinería 13.358 2,8 598.974 10,0- Actividades administrativas de oficina y otras actividades auxiliares a las
empresas14.724 3,1 330.781 5,5
- Actividades de creación, artísticas y espectáculos 2.439 0,5 65.464 1,1- Actividades de bibliotecas, archivos, museos y otras actividades culturales 754 0,2 17.338 0,3- Actividades de juegos de azar y apuestas 13.746 2,9 44.921 0,7- Actividades deportivas, recreativas y de entretenimiento 11.094 2,4 198.884 3,3
- Reparación de ordenadores, efectos personales y artículos de uso doméstico
2.577 0,5 56.927 0,9
- Otros servicios personales 6.353 1,3 260.941 4,3
TOTAL 471.050 100,0 6.015.289 100,0
Información y comunicaciones
Actividades inmobiliarias
Actividades profesionales, científicas y técnicas
Otros servicios
Cifra de negocios Personal ocupado
Transporte y almacenamiento
Hostelería
Actividades administrativas y servicios auxliares
Actividades artísticas, recreativas y de entrenimiento
Distribution (in percentage) of turnover by divisions of activity. Year 2016
SBS-SS-SPSS -2016 (5/22)
División de actividad Distribución (en %)Variac
Almacenamiento y actividades anexas al transporte
Transporte terrestre y por tubería
Servicios de comidas y bebidas
Telecomunicaciones
Programación, consultoría y otras actividades relacionadas con la informática
Actividades inmobiliarias
Servicios técnicos de arquitectura e ingeniería; ensayos y análisis técnicos
Servicios de alojamiento
Actividades jurídicas y de contabilidad
Actividades de agencias de viajes, operadores turísticos, servicios de reservas y actividades relacionadas
Publicidad y estudios de mercado
Actividades administrativas de oficina y otras actividades auxiliares a las empresas
Actividades de las sedes centrales; actividades de consultoría de gestión empresarial
Actividades de juegos de azar y apuestas
Servicios a edificios y actividades de jardinería
Actividades deportivas, recreativas y de entretenimiento
Actividades de alquiler
Transporte aéreo
Otros servicios personales
Edición
Actividades relacionadas con el empleo
Actividades de programación y emisión de radio y televisión
Actividades cinematográficas, de vídeo y de programas de televisión, grabación de sonido y edición musical
Otras actividades profesionales, científicas y técnicas
Actividades de seguridad e investigación
Actividades postales y de correos
Reparación de ordenadores, efectos personales y artículos de uso doméstico
Actividades de creación, artísticas y espectáculos
Investigación y desarrollo
Servicios de información
Transporte marítimo y por vías navegables interiores
Actividades veterinarias
Actividades de bibliotecas, archivos, museos y otras actividades culturales
9,6
9,5
9,4
6,8
6,1
5,5
5,4
4,7
4,4
4,3
3,7
3,1
3,1
2,9
2,8
2,4
2,3
2,1
1,3
1,3
1,2
1,1
1,1
1,1
1,0
1,0
0,5
0,5
0,4
0,4
0,4
0,2
0,2
SBS-SS-SPSS -2016 (6/22)
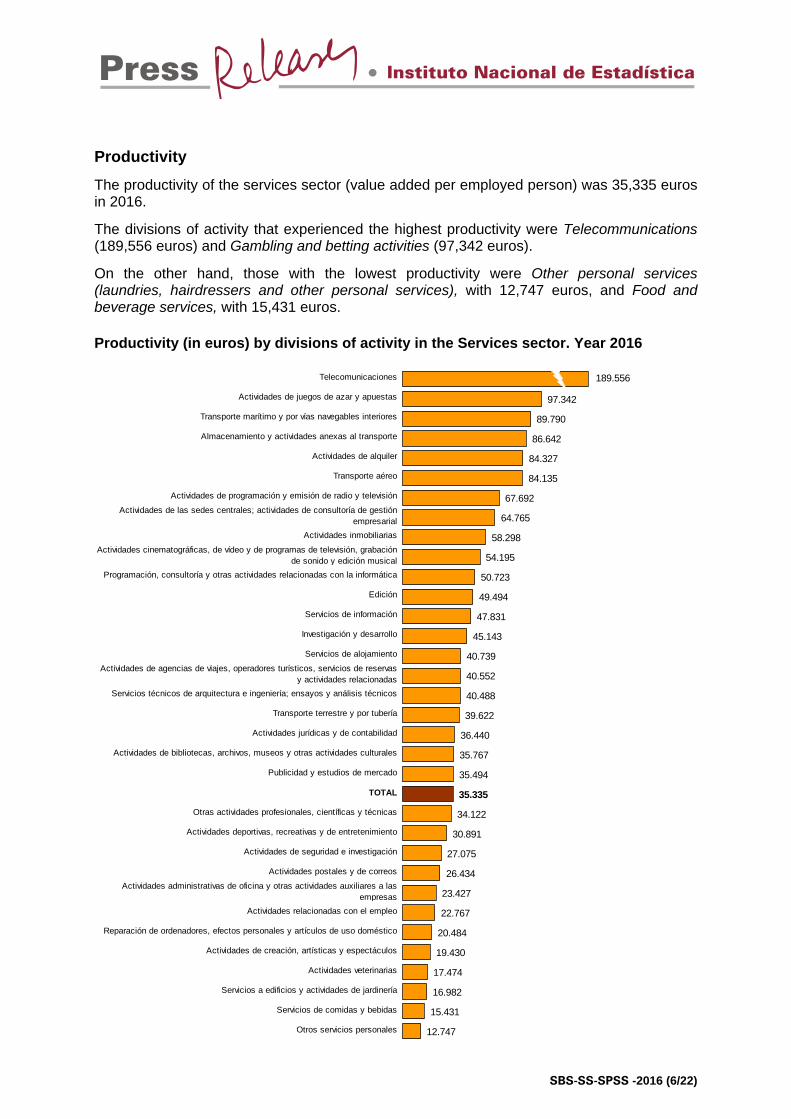
Productivity
The productivity of the services sector (value added per employed person) was 35,335 euros in 2016.
The divisions of activity that experienced the highest productivity were Telecommunications (189,556 euros) and Gambling and betting activities (97,342 euros).
On the other hand, those with the lowest productivity were Other personal services (laundries, hairdressers and other personal services), with 12,747 euros, and Food and beverage services, with 15,431 euros.
Productivity (in euros) by divisions of activity in the Services sector. Year 2016
Telecomunicaciones
Actividades de juegos de azar y apuestas
Transporte marítimo y por vías navegables interiores
Almacenamiento y actividades anexas al transporte
Actividades de alquiler
Transporte aéreo
Actividades de programación y emisión de radio y televisión
Actividades de las sedes centrales; actividades de consultoría de gestión empresarial
Actividades inmobiliarias
Actividades cinematográficas, de vídeo y de programas de televisión, grabación de sonido y edición musical
Programación, consultoría y otras actividades relacionadas con la informática
Edición
Servicios de información
Investigación y desarrollo
Servicios de alojamiento
Actividades de agencias de viajes, operadores turísticos, servicios de reservas y actividades relacionadas
Servicios técnicos de arquitectura e ingeniería; ensayos y análisis técnicos
Transporte terrestre y por tubería
Actividades jurídicas y de contabilidad
Actividades de bibliotecas, archivos, museos y otras actividades culturales
Publicidad y estudios de mercado
TOTAL
Otras actividades profesionales, científicas y técnicas
Actividades deportivas, recreativas y de entretenimiento
Actividades de seguridad e investigación
Actividades postales y de correos
Actividades administrativas de oficina y otras actividades auxiliares a las empresas
Actividades relacionadas con el empleo
Reparación de ordenadores, efectos personales y artículos de uso doméstico
Actividades de creación, artísticas y espectáculos
Actividades veterinarias
Servicios a edificios y actividades de jardinería
Servicios de comidas y bebidas
Otros servicios personales
189.556
97.342
89.790
86.642
84.327
84.135
67.692
64.765
58.298
54.195
50.723
49.494
47.831
45.143
40.739
40.552
40.488
39.622
36.440
35.767
35.494
35.335
34.122
30.891
27.075
26.434
23.427
22.767
20.484
19.430
17.474
16.982
15.431
12.747
SBS-SS-SPSS -2016 (7/22)
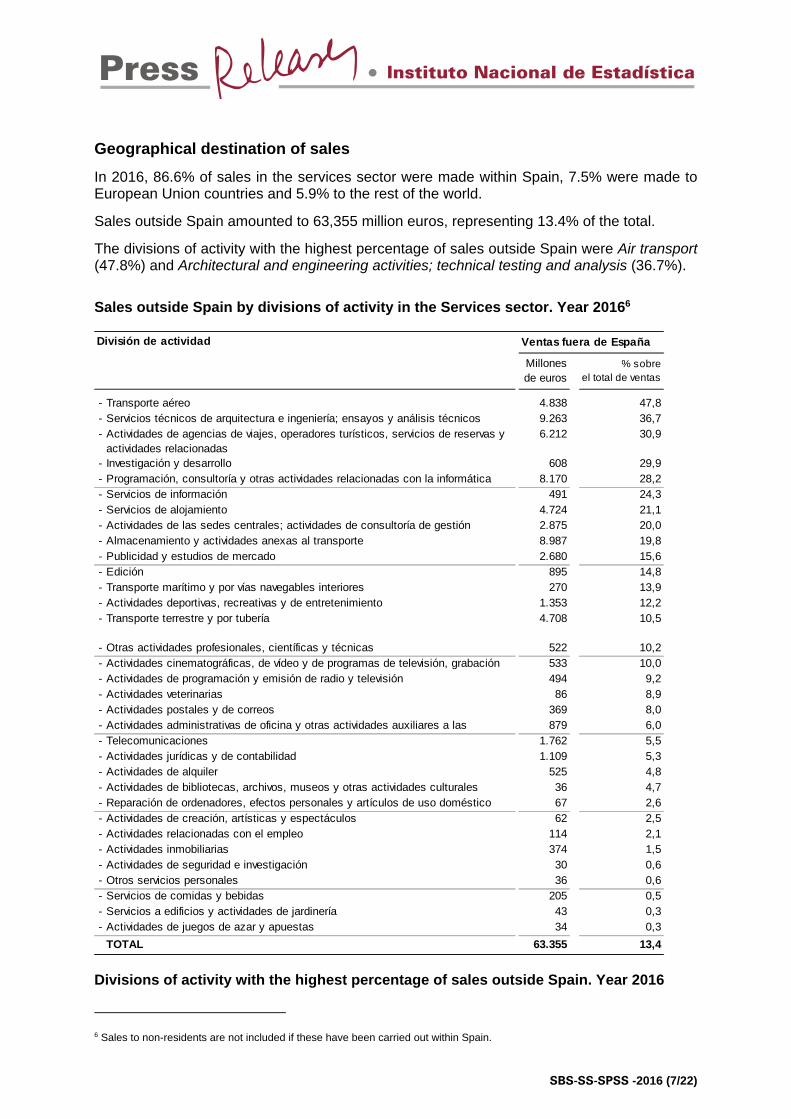
Geographical destination of sales
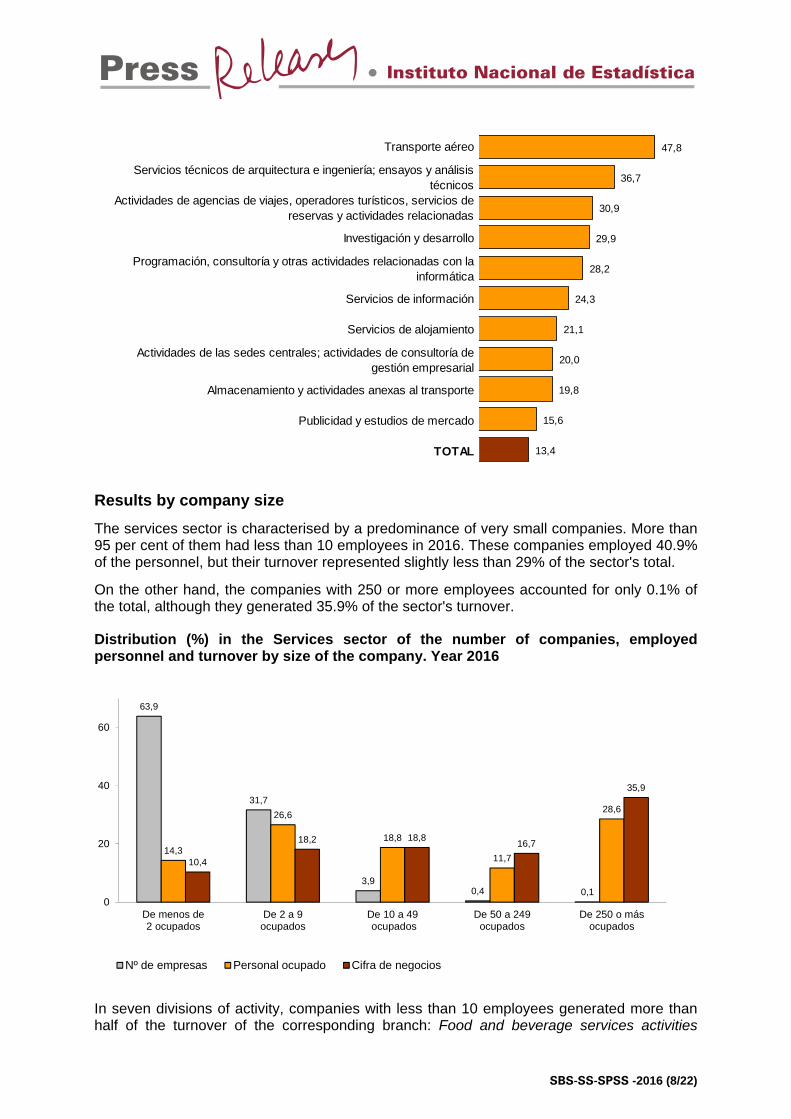
In 2016, 86.6% of sales in the services sector were made within Spain, 7.5% were made to European Union countries and 5.9% to the rest of the world.
Sales outside Spain amounted to 63,355 million euros, representing 13.4% of the total.
The divisions of activity with the highest percentage of sales outside Spain were Air transport (47.8%) and Architectural and engineering activities; technical testing and analysis (36.7%).
Sales outside Spain by divisions of activity in the Services sector. Year 20166
Ventas fuera de España
Millones de euros
% sobre el total de ventas
- Transporte aéreo 4.838 47,8- Servicios técnicos de arquitectura e ingeniería; ensayos y análisis técnicos 9.263 36,7- Actividades de agencias de viajes, operadores turísticos, servicios de reservas y
actividades relacionadas 6.212 30,9
- Investigación y desarrollo 608 29,9- Programación, consultoría y otras actividades relacionadas con la informática 8.170 28,2- Servicios de información 491 24,3- Servicios de alojamiento 4.724 21,1- Actividades de las sedes centrales; actividades de consultoría de gestión 2.875 20,0- Almacenamiento y actividades anexas al transporte 8.987 19,8- Publicidad y estudios de mercado 2.680 15,6- Edición 895 14,8- Transporte marítimo y por vías navegables interiores 270 13,9- Actividades deportivas, recreativas y de entretenimiento 1.353 12,2- Transporte terrestre y por tubería 4.708 10,5
- Otras actividades profesionales, científicas y técnicas 522 10,2- Actividades cinematográficas, de vídeo y de programas de televisión, grabación 533 10,0- Actividades de programación y emisión de radio y televisión 494 9,2- Actividades veterinarias 86 8,9- Actividades postales y de correos 369 8,0- Actividades administrativas de oficina y otras actividades auxiliares a las 879 6,0- Telecomunicaciones 1.762 5,5- Actividades jurídicas y de contabilidad 1.109 5,3- Actividades de alquiler 525 4,8- Actividades de bibliotecas, archivos, museos y otras actividades culturales 36 4,7- Reparación de ordenadores, efectos personales y artículos de uso doméstico 67 2,6- Actividades de creación, artísticas y espectáculos 62 2,5- Actividades relacionadas con el empleo 114 2,1- Actividades inmobiliarias 374 1,5- Actividades de seguridad e investigación 30 0,6- Otros servicios personales 36 0,6- Servicios de comidas y bebidas 205 0,5- Servicios a edificios y actividades de jardinería 43 0,3- Actividades de juegos de azar y apuestas 34 0,3
TOTAL 63.355 13,4
División de actividad
6 Sales to non-residents are not included if these have been carried out within Spain.
Divisions of activity with the highest percentage of sales outside Spain. Year 2016
SBS-SS-SPSS -2016 (8/22)
Transporte aéreo
Servicios técnicos de arquitectura e ingeniería; ensayos y análisis técnicos
Actividades de agencias de viajes, operadores turísticos, servicios de reservas y actividades relacionadas
Investigación y desarrollo
Programación, consultoría y otras actividades relacionadas con la informática
Servicios de información
Servicios de alojamiento
Actividades de las sedes centrales; actividades de consultoría de gestión empresarial
Almacenamiento y actividades anexas al transporte
Publicidad y estudios de mercado
TOTAL
47,8
36,7
30,9
29,9
28,2
24,3
21,1
20,0
19,8
15,6
13,4
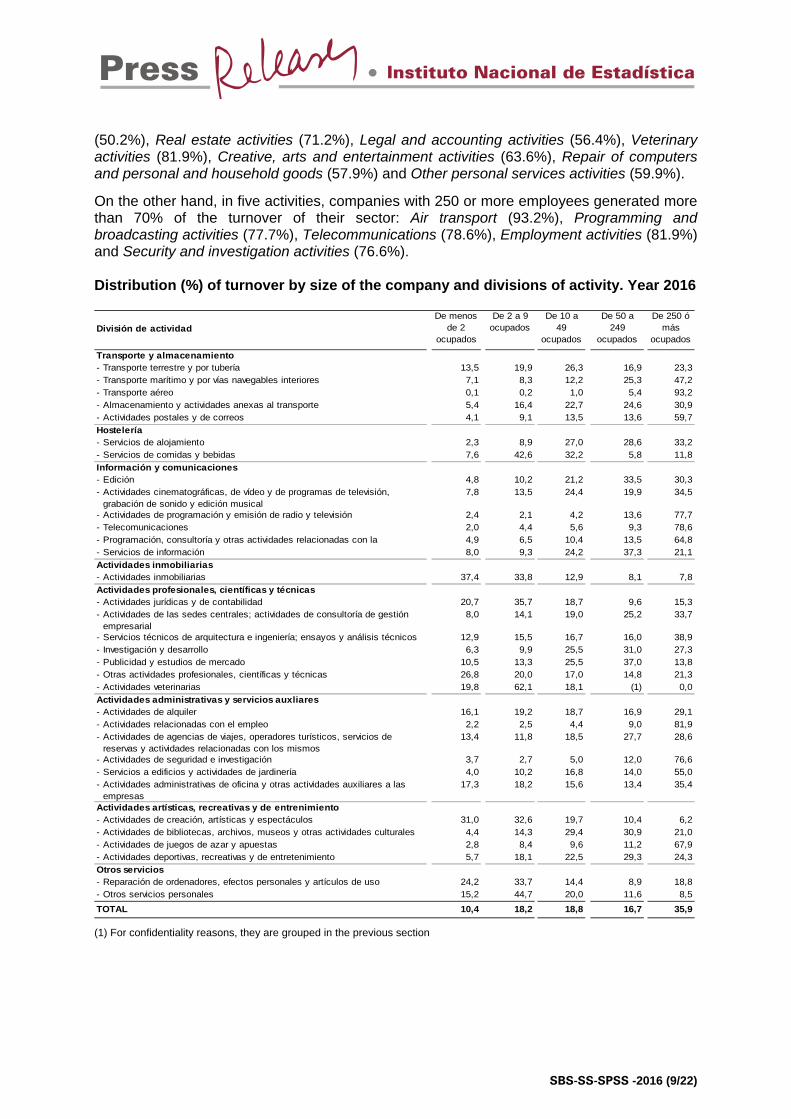
Results by company size
The services sector is characterised by a predominance of very small companies. More than 95 per cent of them had less than 10 employees in 2016. These companies employed 40.9% of the personnel, but their turnover represented slightly less than 29% of the sector's total.
On the other hand, the companies with 250 or more employees accounted for only 0.1% of the total, although they generated 35.9% of the sector's turnover.
Distribution (%) in the Services sector of the number of companies, employed personnel and turnover by size of the company. Year 2016
63,9
31,7
3,90,4 0,1
14,3
26,6
18,8
11,7
28,6
10,4
18,2 18,816,7
35,9
0
20
40
60
De menos de2 ocupados
De 2 a 9ocupados
De 10 a 49 ocupados
De 50 a 249ocupados
De 250 o másocupados
Nº de empresas Personal ocupado Cifra de negocios
In seven divisions of activity, companies with less than 10 employees generated more than half of the turnover of the corresponding branch: Food and beverage services activities
SBS-SS-SPSS -2016 (9/22)
(50.2%), Real estate activities (71.2%), Legal and accounting activities (56.4%), Veterinary activities (81.9%), Creative, arts and entertainment activities (63.6%), Repair of computers and personal and household goods (57.9%) and Other personal services activities (59.9%).
On the other hand, in five activities, companies with 250 or more employees generated more than 70% of the turnover of their sector: Air transport (93.2%), Programming and broadcasting activities (77.7%), Telecommunications (78.6%), Employment activities (81.9%) and Security and investigation activities (76.6%). Distribution (%) of turnover by size of the company and divisions of activity. Year 2016
División de actividad
De menos de 2
ocupados
De 2 a 9 ocupados
De 10 a 49
ocupados
De 50 a 249
ocupados
De 250 ó más
ocupados
- Transporte terrestre y por tubería 13,5 19,9 26,3 16,9 23,3- Transporte marítimo y por vías navegables interiores 7,1 8,3 12,2 25,3 47,2- Transporte aéreo 0,1 0,2 1,0 5,4 93,2- Almacenamiento y actividades anexas al transporte 5,4 16,4 22,7 24,6 30,9- Actividades postales y de correos 4,1 9,1 13,5 13,6 59,7
- Servicios de alojamiento 2,3 8,9 27,0 28,6 33,2- Servicios de comidas y bebidas 7,6 42,6 32,2 5,8 11,8
- Edición 4,8 10,2 21,2 33,5 30,3- Actividades cinematográficas, de vídeo y de programas de televisión,
grabación de sonido y edición musical7,8 13,5 24,4 19,9 34,5
- Actividades de programación y emisión de radio y televisión 2,4 2,1 4,2 13,6 77,7- Telecomunicaciones 2,0 4,4 5,6 9,3 78,6- Programación, consultoría y otras actividades relacionadas con la 4,9 6,5 10,4 13,5 64,8- Servicios de información 8,0 9,3 24,2 37,3 21,1
- Actividades inmobiliarias 37,4 33,8 12,9 8,1 7,8
- Actividades jurídicas y de contabilidad 20,7 35,7 18,7 9,6 15,3- Actividades de las sedes centrales; actividades de consultoría de gestión
empresarial8,0 14,1 19,0 25,2 33,7
- Servicios técnicos de arquitectura e ingeniería; ensayos y análisis técnicos 12,9 15,5 16,7 16,0 38,9- Investigación y desarrollo 6,3 9,9 25,5 31,0 27,3- Publicidad y estudios de mercado 10,5 13,3 25,5 37,0 13,8- Otras actividades profesionales, científicas y técnicas 26,8 20,0 17,0 14,8 21,3- Actividades veterinarias 19,8 62,1 18,1 (1) 0,0
- Actividades de alquiler 16,1 19,2 18,7 16,9 29,1- Actividades relacionadas con el empleo 2,2 2,5 4,4 9,0 81,9- Actividades de agencias de viajes, operadores turísticos, servicios de
reservas y actividades relacionadas con los mismos13,4 11,8 18,5 27,7 28,6
- Actividades de seguridad e investigación 3,7 2,7 5,0 12,0 76,6- Servicios a edificios y actividades de jardinería 4,0 10,2 16,8 14,0 55,0- Actividades administrativas de oficina y otras actividades auxiliares a las
empresas17,3 18,2 15,6 13,4 35,4
- Actividades de creación, artísticas y espectáculos 31,0 32,6 19,7 10,4 6,2- Actividades de bibliotecas, archivos, museos y otras actividades culturales 4,4 14,3 29,4 30,9 21,0- Actividades de juegos de azar y apuestas 2,8 8,4 9,6 11,2 67,9- Actividades deportivas, recreativas y de entretenimiento 5,7 18,1 22,5 29,3 24,3
- Reparación de ordenadores, efectos personales y artículos de uso 24,2 33,7 14,4 8,9 18,8- Otros servicios personales 15,2 44,7 20,0 11,6 8,5
TOTAL 10,4 18,2 18,8 16,7 35,9
Actividades artísticas, recreativas y de entrenimiento
Otros servicios
Hostelería
Información y comunicaciones
Actividades inmobiliarias
Actividades profesionales, científicas y técnicas
Actividades administrativas y servicios auxliares
Transporte y almacenamiento
(1) For confidentiality reasons, they are grouped in the previous section
SBS-SS-SPSS -2016 (10/22)
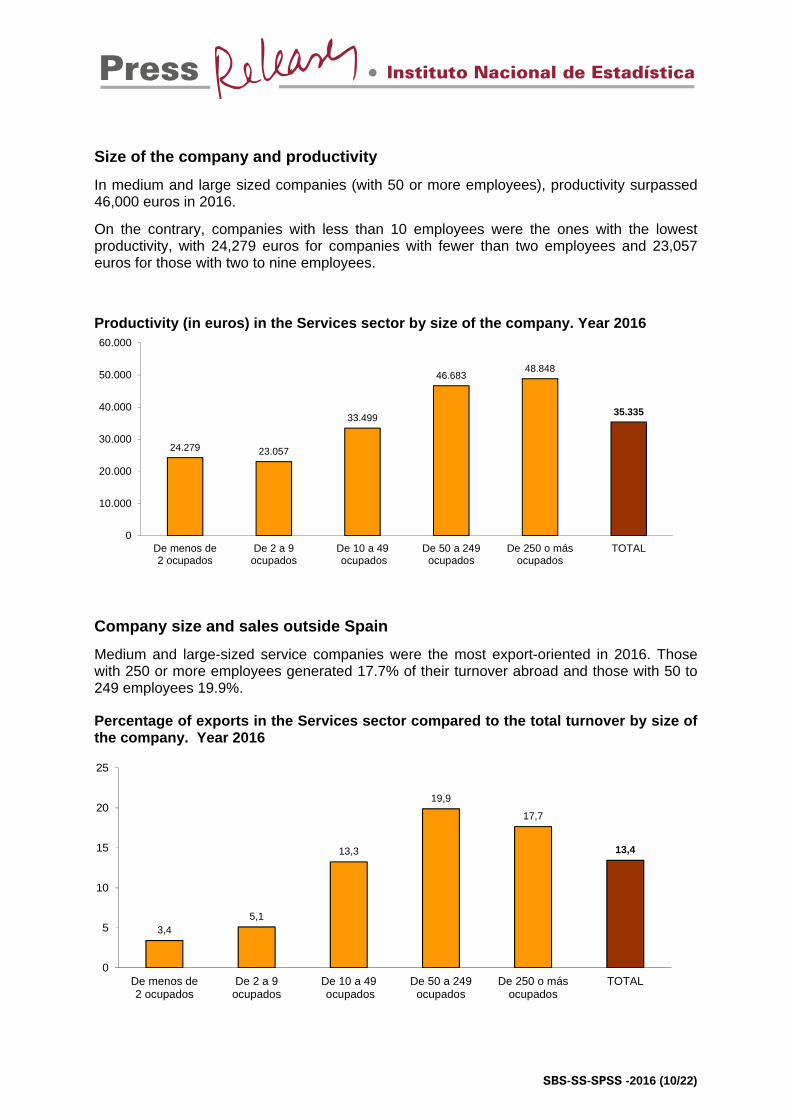
Size of the company and productivity
In medium and large sized companies (with 50 or more employees), productivity surpassed 46,000 euros in 2016.
On the contrary, companies with less than 10 employees were the ones with the lowest productivity, with 24,279 euros for companies with fewer than two employees and 23,057 euros for those with two to nine employees.
Productivity (in euros) in the Services sector by size of the company. Year 2016
24.279 23.057
33.499
46.68348.848
35.335
0
10.000
20.000
30.000
40.000
50.000
60.000
De menos de2 ocupados
De 2 a 9ocupados
De 10 a 49 ocupados
De 50 a 249ocupados
De 250 o másocupados
TOTAL
Company size and sales outside Spain
Medium and large-sized service companies were the most export-oriented in 2016. Those with 250 or more employees generated 17.7% of their turnover abroad and those with 50 to 249 employees 19.9%.
Percentage of exports in the Services sector compared to the total turnover by size of the company. Year 2016
3,45,1
13,3
19,9
17,7
13,4
0
5
10
15
20
25
De menos de2 ocupados
De 2 a 9ocupados
De 10 a 49 ocupados
De 50 a 249ocupados
De 250 o másocupados
TOTAL
SBS-SS-SPSS -2016 (11/22)
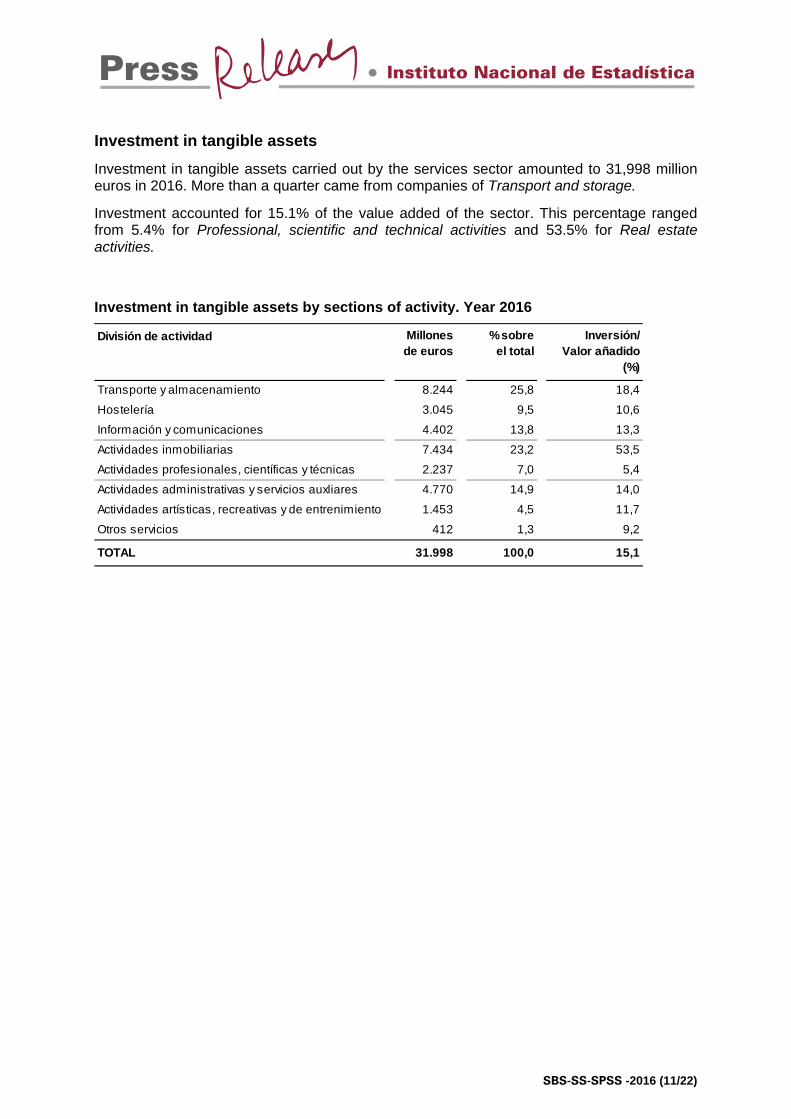
Investment in tangible assets
Investment in tangible assets carried out by the services sector amounted to 31,998 million euros in 2016. More than a quarter came from companies of Transport and storage.
Investment accounted for 15.1% of the value added of the sector. This percentage ranged from 5.4% for Professional, scientific and technical activities and 53.5% for Real estate activities.
Investment in tangible assets by sections of activity. Year 2016
División de actividad
Transporte y almacenamiento 8.244 25,8 18,4
Hostelería 3.045 9,5 10,6
Información y comunicaciones 4.402 13,8 13,3
Actividades inmobiliarias 7.434 23,2 53,5
Actividades profesionales, científicas y técnicas 2.237 7,0 5,4
Actividades administrativas y servicios auxliares 4.770 14,9 14,0
Actividades artísticas, recreativas y de entrenimiento 1.453 4,5 11,7
Otros servicios 412 1,3 9,2
TOTAL 31.998 100,0 15,1
Inversión/Valor añadido
(%)
Millonesde euros
% sobreel total
SBS-SS-SPSS -2016 (12/22)
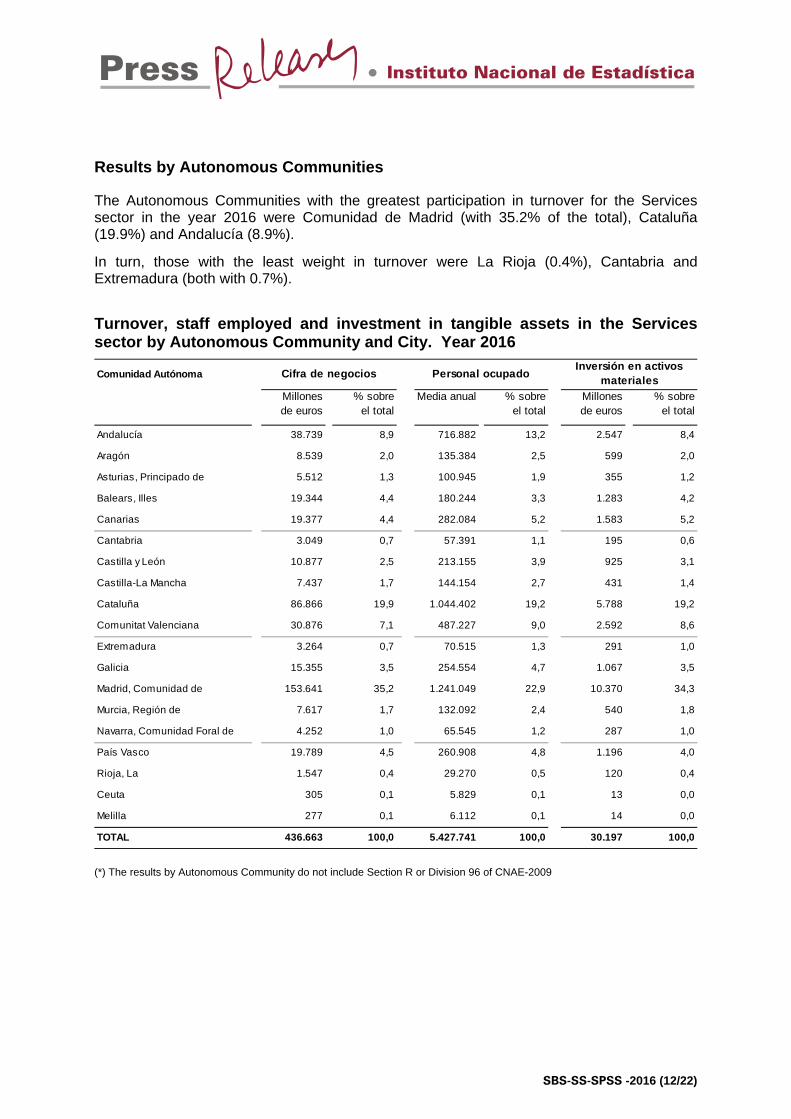
Results by Autonomous Communities
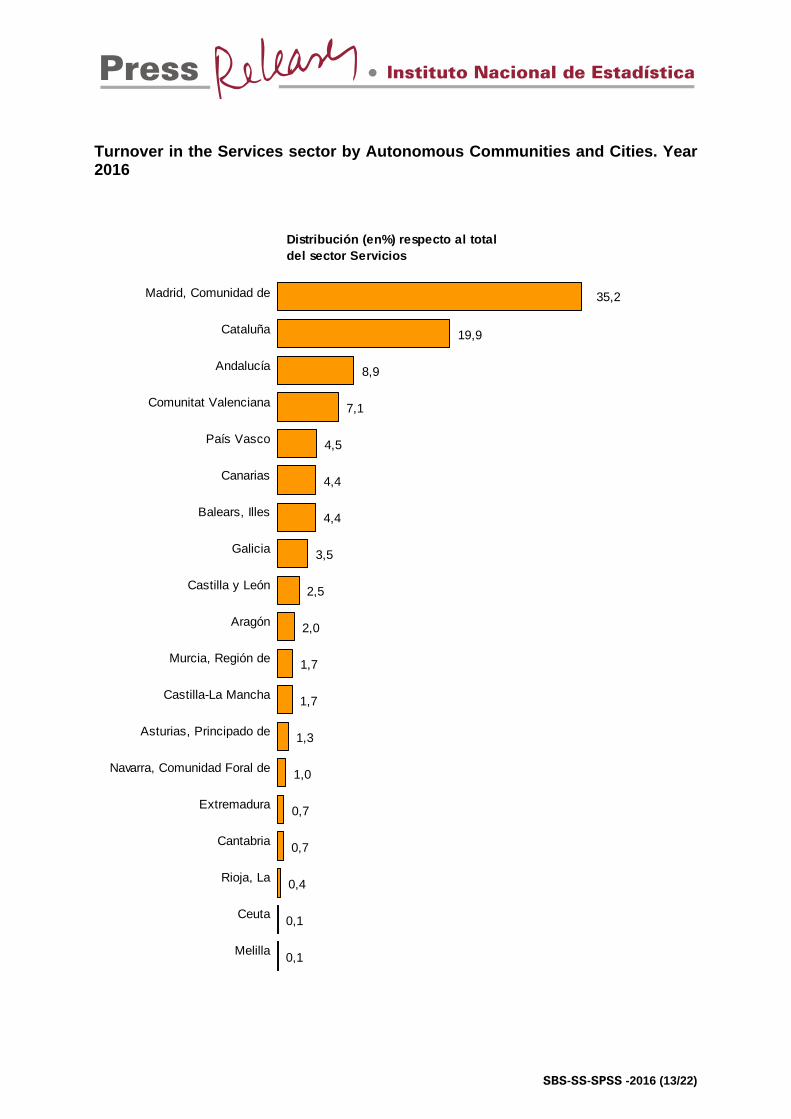
The Autonomous Communities with the greatest participation in turnover for the Services sector in the year 2016 were Comunidad de Madrid (with 35.2% of the total), Cataluña (19.9%) and Andalucía (8.9%).
In turn, those with the least weight in turnover were La Rioja (0.4%), Cantabria and Extremadura (both with 0.7%).
Turnover, staff employed and investment in tangible assets in the Services sector by Autonomous Community and City. Year 2016
Comunidad Autónoma
Millonesde euros
% sobreel total
Var
Media anual % sobreel total
Millonesde euros
% sobreel total
Andalucía 38.739 8,9 716.882 13,2 2.547 8,4
Aragón 8.539 2,0 135.384 2,5 599 2,0
Asturias, Principado de 5.512 1,3 100.945 1,9 355 1,2
Balears, Illes 19.344 4,4 180.244 3,3 1.283 4,2
Canarias 19.377 4,4 282.084 5,2 1.583 5,2
Cantabria 3.049 0,7 57.391 1,1 195 0,6
Castilla y León 10.877 2,5 213.155 3,9 925 3,1
Castilla-La Mancha 7.437 1,7 144.154 2,7 431 1,4
Cataluña 86.866 19,9 1.044.402 19,2 5.788 19,2
Comunitat Valenciana 30.876 7,1 487.227 9,0 2.592 8,6
Extremadura 3.264 0,7 70.515 1,3 291 1,0
Galicia 15.355 3,5 254.554 4,7 1.067 3,5
Madrid, Comunidad de 153.641 35,2 1.241.049 22,9 10.370 34,3
Murcia, Región de 7.617 1,7 132.092 2,4 540 1,8
Navarra, Comunidad Foral de 4.252 1,0 65.545 1,2 287 1,0
País Vasco 19.789 4,5 260.908 4,8 1.196 4,0
Rioja, La 1.547 0,4 29.270 0,5 120 0,4
Ceuta 305 0,1 5.829 0,1 13 0,0
Melilla 277 0,1 6.112 0,1 14 0,0
TOTAL 436.663 100,0 5.427.741 100,0 30.197 100,0
Cifra de negocios Personal ocupadoInversión en activos
materiales
(*) The results by Autonomous Community do not include Section R or Division 96 of CNAE-2009
SBS-SS-SPSS -2016 (13/22)
Turnover in the Services sector by Autonomous Communities and Cities. Year 2016
Madrid, Comunidad de
5,2
Cataluña
3,9
Andalucía
2,8
Comunitat Valenciana
7,2
País Vasco
4,1
Canarias
-1,2
Balears, Illes
23,8
Galicia
1,0
Castilla y León
-0,3
Aragón
4,1
Murcia, Región de
4,8
Castilla-La Mancha
-2,7
Asturias, Principado de
1,1
Navarra, Comunidad Foral de
5,2
Extremadura
8,7
Cantabria
4,8
Rioja, La
8,4
Ceuta
6,5
Melilla
18,4
Distribución (en%) respecto al total del sector Servicios
Variaciónanual (%)
35,2
19,9
8,9
7,1
4,5
4,4
4,4
3,5
2,5
2,0
1,7
1,7
1,3
1,0
0,7
0,7
0,4
0,1
0,1
SBS-SS-SPSS -2016 (14/22)
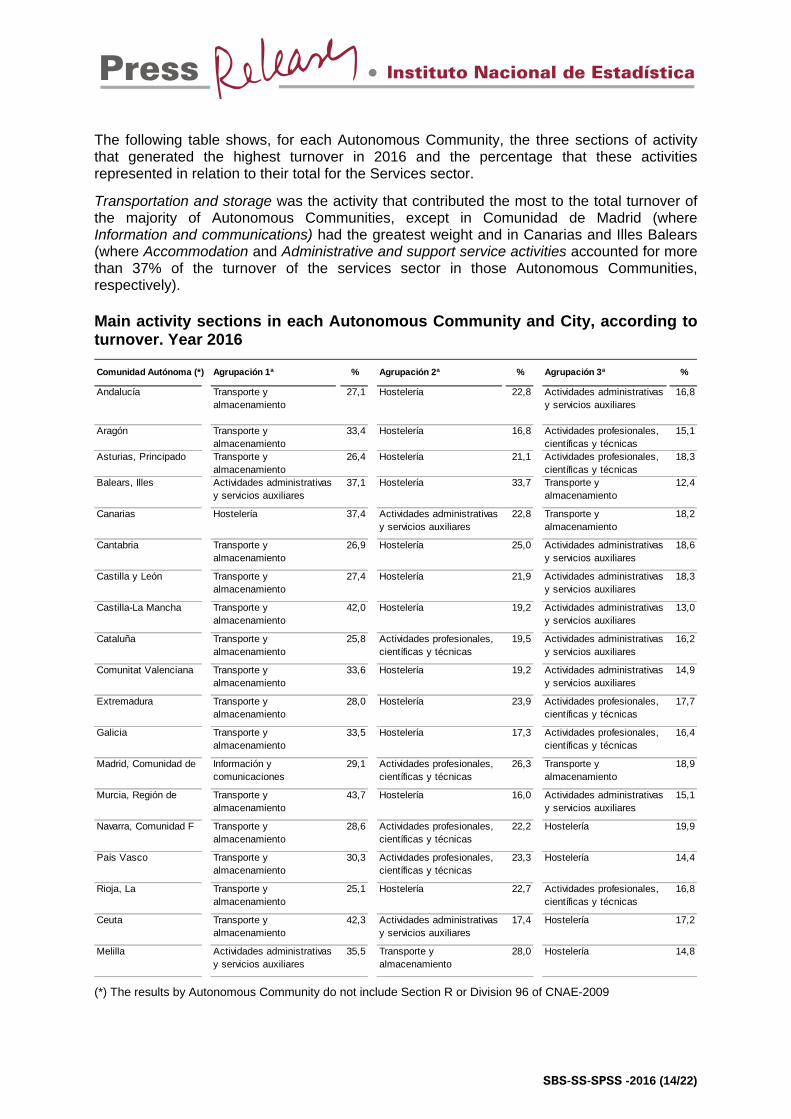
The following table shows, for each Autonomous Community, the three sections of activity that generated the highest turnover in 2016 and the percentage that these activities represented in relation to their total for the Services sector.
Transportation and storage was the activity that contributed the most to the total turnover of the majority of Autonomous Communities, except in Comunidad de Madrid (where Information and communications) had the greatest weight and in Canarias and Illes Balears (where Accommodation and Administrative and support service activities accounted for more than 37% of the turnover of the services sector in those Autonomous Communities, respectively). Main activity sections in each Autonomous Community and City, according to turnover. Year 2016
Comunidad Autónoma (*) Agrupación 1ª % Agrupación 2ª % Agrupación 3ª %
Andalucía Transporte y almacenamiento
27,1 Hostelería 22,8 Actividades administrativas y servicios auxiliares
16,8
Aragón Transporte y almacenamiento
33,4 Hostelería 16,8 Actividades profesionales, científicas y técnicas
15,1
Asturias, Principado Transporte y almacenamiento
26,4 Hostelería 21,1 Actividades profesionales, científicas y técnicas
18,3
Balears, Illes Actividades administrativas y servicios auxiliares
37,1 Hostelería 33,7 Transporte y almacenamiento
12,4
Canarias Hostelería 37,4 Actividades administrativas y servicios auxiliares
22,8 Transporte y almacenamiento
18,2
Cantabria Transporte y almacenamiento
26,9 Hostelería 25,0 Actividades administrativas y servicios auxiliares
18,6
Castilla y León Transporte y almacenamiento
27,4 Hostelería 21,9 Actividades administrativas y servicios auxiliares
18,3
Castilla-La Mancha Transporte y almacenamiento
42,0 Hostelería 19,2 Actividades administrativas y servicios auxiliares
13,0
Cataluña Transporte y almacenamiento
25,8 Actividades profesionales, científicas y técnicas
19,5 Actividades administrativas y servicios auxiliares
16,2
Comunitat Valenciana Transporte y almacenamiento
33,6 Hostelería 19,2 Actividades administrativas y servicios auxiliares
14,9
Extremadura Transporte y almacenamiento
28,0 Hostelería 23,9 Actividades profesionales, científicas y técnicas
17,7
Galicia Transporte y almacenamiento
33,5 Hostelería 17,3 Actividades profesionales, científicas y técnicas
16,4
Madrid, Comunidad de Información y comunicaciones
29,1 Actividades profesionales, científicas y técnicas
26,3 Transporte y almacenamiento
18,9
Murcia, Región de Transporte y almacenamiento
43,7 Hostelería 16,0 Actividades administrativas y servicios auxiliares
15,1
Navarra, Comunidad F Transporte y almacenamiento
28,6 Actividades profesionales, científicas y técnicas
22,2 Hostelería 19,9
País Vasco Transporte y almacenamiento
30,3 Actividades profesionales, científicas y técnicas
23,3 Hostelería 14,4
Rioja, La Transporte y almacenamiento
25,1 Hostelería 22,7 Actividades profesionales, científicas y técnicas
16,8
Ceuta Transporte y almacenamiento
42,3 Actividades administrativas y servicios auxiliares
17,4 Hostelería 17,2
Melilla Actividades administrativas y servicios auxiliares
35,5 Transporte y almacenamiento
28,0 Hostelería 14,8
(*) The results by Autonomous Community do not include Section R or Division 96 of CNAE-2009
SBS-SS-SPSS -2016 (15/22)
Statistics on Products in the Services Sector
These statistics provide information on the breakdown of turnover by the services provided and the sectors of activity of the customers to whom these services are provided.
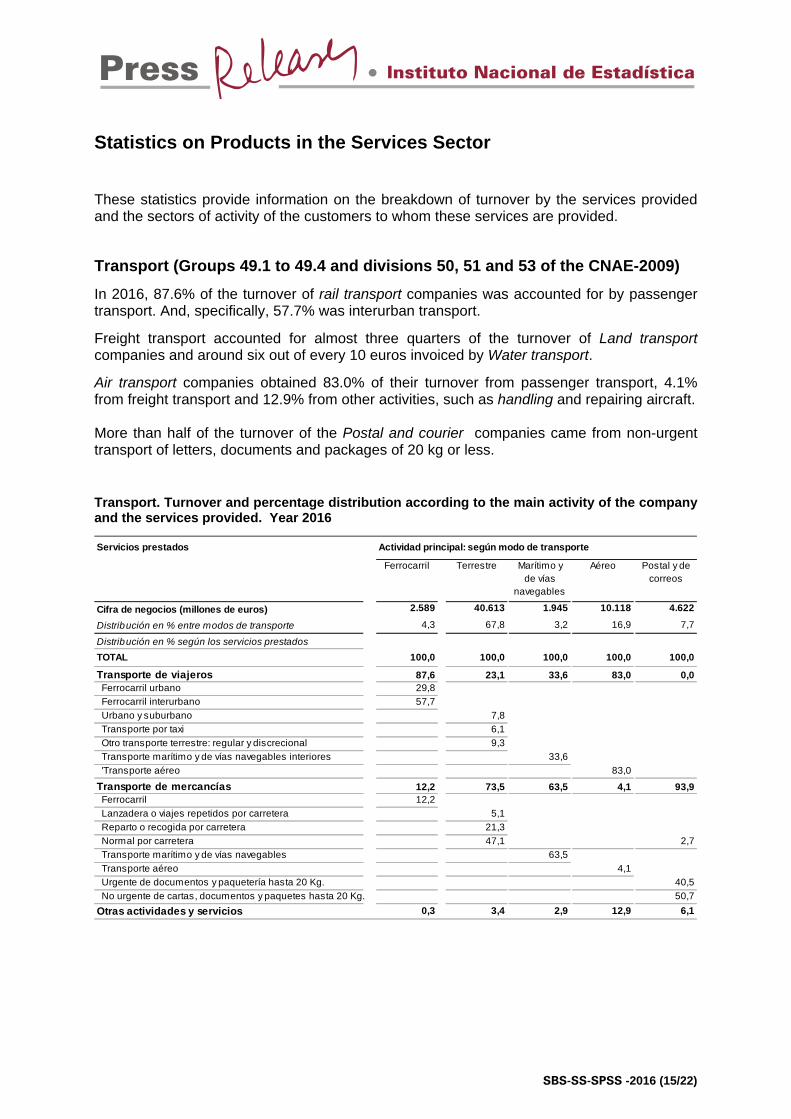
Transport (Groups 49.1 to 49.4 and divisions 50, 51 and 53 of the CNAE-2009)
In 2016, 87.6% of the turnover of rail transport companies was accounted for by passenger transport. And, specifically, 57.7% was interurban transport.
Freight transport accounted for almost three quarters of the turnover of Land transport companies and around six out of every 10 euros invoiced by Water transport.
Air transport companies obtained 83.0% of their turnover from passenger transport, 4.1% from freight transport and 12.9% from other activities, such as handling and repairing aircraft. More than half of the turnover of the Postal and courier companies came from non-urgent transport of letters, documents and packages of 20 kg or less.
Transport. Turnover and percentage distribution according to the main activity of the company and the services provided. Year 2016
Servicios prestados
Ferrocarril Terrestre Aéreo
Cifra de negocios (millones de euros) 2.589 40.613 1.945 10.118 4.622
Distribución en % entre modos de transporte 4,3 67,8 3,2 16,9 7,7
Distribución en % según los servicios prestados
TOTAL 100,0 100,0 100,0 100,0 100,0
Transporte de viajeros 87,6 23,1 33,6 83,0 0,0 Ferrocarril urbano 29,8
Ferrocarril interurbano 57,7
Urbano y suburbano 7,8
Transporte por taxi 6,1
Otro transporte terrestre: regular y discrecional 9,3
Transporte marítimo y de vías navegables interiores 33,6
'Transporte aéreo 83,0
Transporte de mercancías 12,2 73,5 63,5 4,1 93,9 Ferrocarril 12,2
Lanzadera o viajes repetidos por carretera 5,1
Reparto o recogida por carretera 21,3
Normal por carretera 47,1 2,7
Transporte marítimo y de vías navegables 63,5
Transporte aéreo 4,1
Urgente de documentos y paquetería hasta 20 Kg. 40,5
No urgente de cartas, documentos y paquetes hasta 20 Kg. 50,7
Otras actividades y servicios 0,3 3,4 2,9 12,9 6,1
Actividad principal: según modo de transporte
Postal y de correos
Marítimo y de vías
navegables
SBS-SS-SPSS -2016 (16/22)
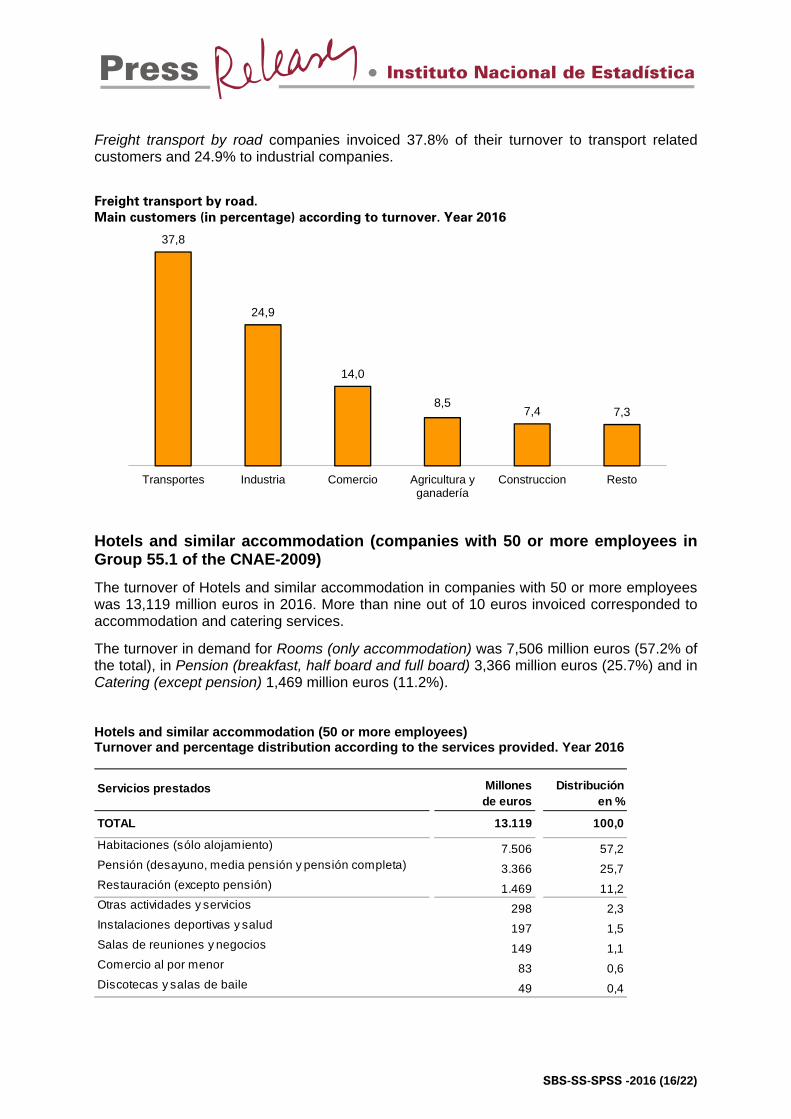
Freight transport by road companies invoiced 37.8% of their turnover to transport related customers and 24.9% to industrial companies.
Freight transport by road.
Main customers (in percentage) according to turnover. Year 2016
37,8
24,9
14,0
8,57,4 7,3
Transportes Industria Comercio Agricultura yganadería
Construccion Resto
Hotels and similar accommodation (companies with 50 or more employees in Group 55.1 of the CNAE-2009)
The turnover of Hotels and similar accommodation in companies with 50 or more employees was 13,119 million euros in 2016. More than nine out of 10 euros invoiced corresponded to accommodation and catering services.
The turnover in demand for Rooms (only accommodation) was 7,506 million euros (57.2% of the total), in Pension (breakfast, half board and full board) 3,366 million euros (25.7%) and in Catering (except pension) 1,469 million euros (11.2%). Hotels and similar accommodation (50 or more employees) Turnover and percentage distribution according to the services provided. Year 2016
TOTAL 13.119 100,0
Habitaciones (sólo alojamiento) 7.506 57,2Pensión (desayuno, media pensión y pensión completa) 3.366 25,7Restauración (excepto pensión) 1.469 11,2Otras actividades y servicios 298 2,3Instalaciones deportivas y salud 197 1,5Salas de reuniones y negocios 149 1,1Comercio al por menor 83 0,6Discotecas y salas de baile 49 0,4
Distribuciónen %
Servicios prestados Millones de euros
SBS-SS-SPSS -2016 (17/22)
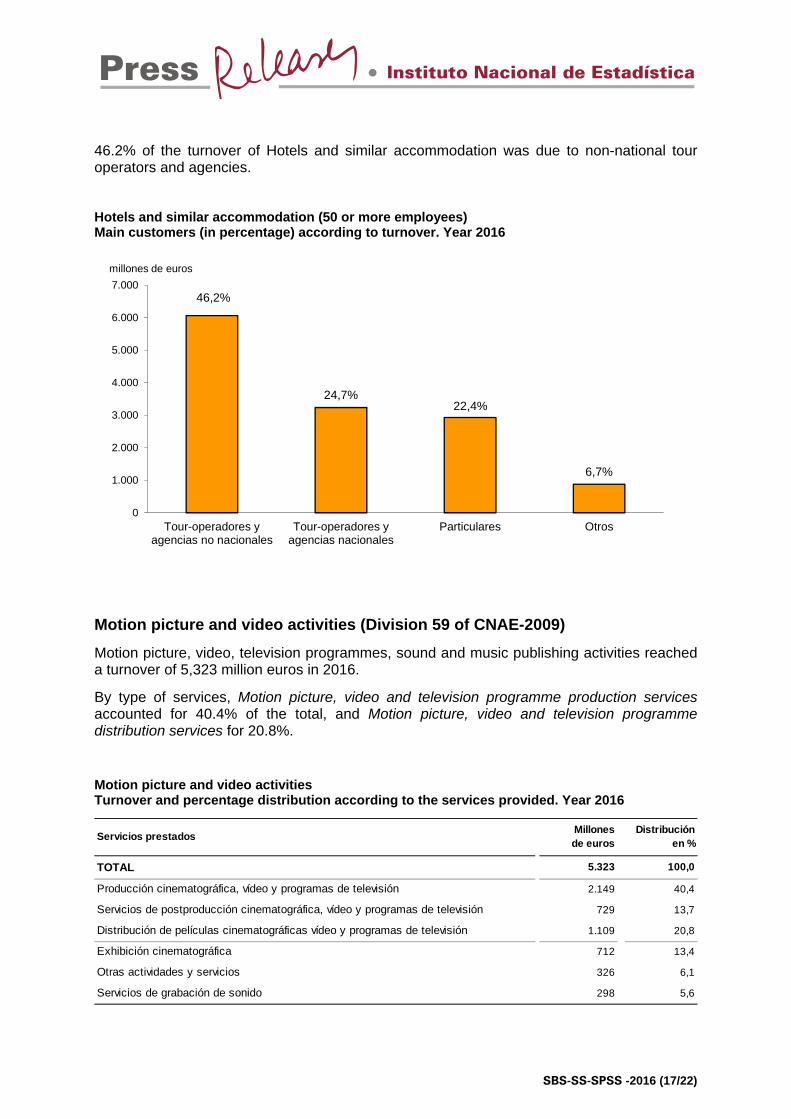
46.2% of the turnover of Hotels and similar accommodation was due to non-national tour operators and agencies. Hotels and similar accommodation (50 or more employees) Main customers (in percentage) according to turnover. Year 2016
46,2%
24,7%22,4%
6,7%
0
1.000
2.000
3.000
4.000
5.000
6.000
7.000
Tour-operadores yagencias no nacionales
Tour-operadores yagencias nacionales
Particulares Otros
millones de euros
Motion picture and video activities (Division 59 of CNAE-2009)
Motion picture, video, television programmes, sound and music publishing activities reached a turnover of 5,323 million euros in 2016.
By type of services, Motion picture, video and television programme production services accounted for 40.4% of the total, and Motion picture, video and television programme distribution services for 20.8%.
Motion picture and video activities Turnover and percentage distribution according to the services provided. Year 2016
TOTAL 5.323 100,0
Producción cinematográfica, vídeo y programas de televisión 2.149 40,4
Servicios de postproducción cinematográfica, vídeo y programas de televisión 729 13,7
Distribución de películas cinematográficas vídeo y programas de televisión 1.109 20,8
Exhibición cinematográfica 712 13,4
Otras actividades y servicios 326 6,1
Servicios de grabación de sonido 298 5,6
Distribución en %
Servicios prestadosMillonesde euros
SBS-SS-SPSS -2016 (18/22)
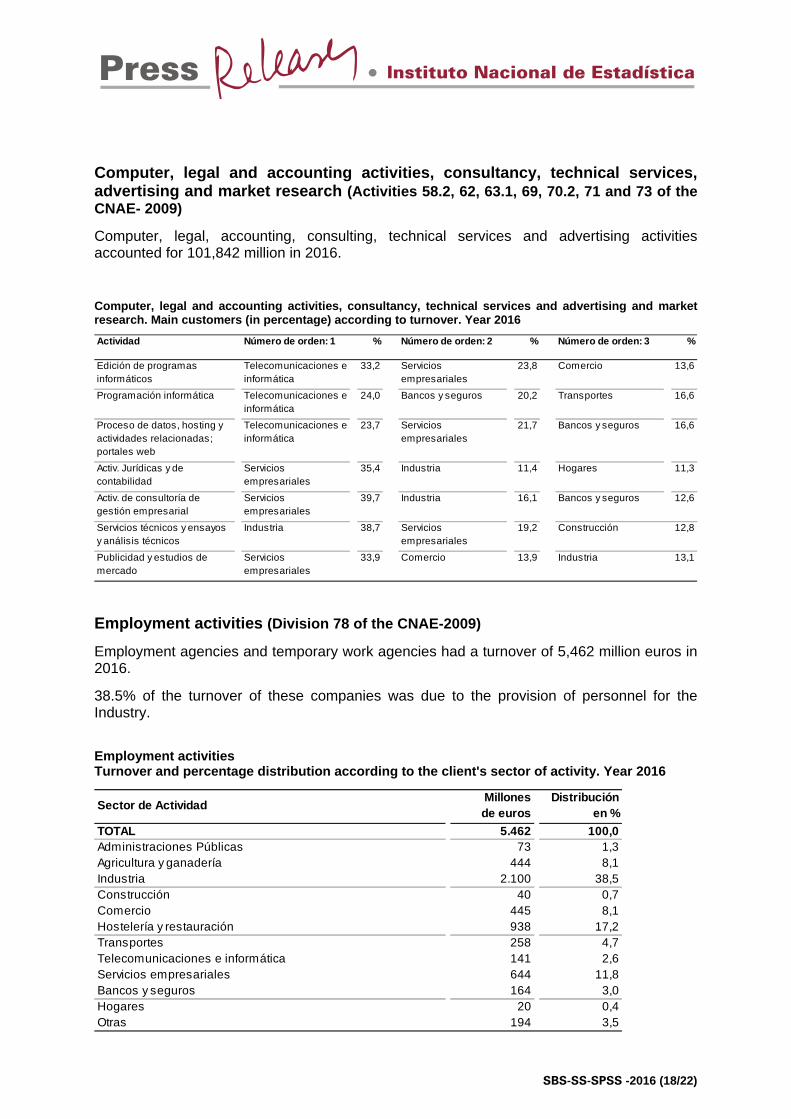
Computer, legal and accounting activities, consultancy, technical services, advertising and market research (Activities 58.2, 62, 63.1, 69, 70.2, 71 and 73 of the CNAE- 2009)
Computer, legal, accounting, consulting, technical services and advertising activities accounted for 101,842 million in 2016.
Computer, legal and accounting activities, consultancy, technical services and advertising and market research. Main customers (in percentage) according to turnover. Year 2016
Actividad Número de orden: 1 % Número de orden: 2 % Número de orden: 3 %
Edición de programas informáticos
Telecomunicaciones e informática
33,2 Servicios empresariales
23,8 Comercio 13,6
Programación informática Telecomunicaciones e informática
24,0 Bancos y seguros 20,2 Transportes 16,6
Proceso de datos, hosting y actividades relacionadas; portales web
Telecomunicaciones e informática
23,7 Servicios empresariales
21,7 Bancos y seguros 16,6
Activ. Jurídicas y de contabilidad
Servicios empresariales
35,4 Industria 11,4 Hogares 11,3
Activ. de consultoría de gestión empresarial
Servicios empresariales
39,7 Industria 16,1 Bancos y seguros 12,6
Servicios técnicos y ensayos y análisis técnicos
Industria 38,7 Servicios empresariales
19,2 Construcción 12,8
Publicidad y estudios de mercado
Servicios empresariales
33,9 Comercio 13,9 Industria 13,1
Employment activities (Division 78 of the CNAE-2009)
Employment agencies and temporary work agencies had a turnover of 5,462 million euros in 2016.
38.5% of the turnover of these companies was due to the provision of personnel for the Industry.
Employment activities Turnover and percentage distribution according to the client's sector of activity. Year 2016
TOTAL 5.462 100,0Administraciones Públicas 73 1,3Agricultura y ganadería 444 8,1Industria 2.100 38,5Construcción 40 0,7Comercio 445 8,1Hostelería y restauración 938 17,2Transportes 258 4,7Telecomunicaciones e informática 141 2,6Servicios empresariales 644 11,8Bancos y seguros 164 3,0Hogares 20 0,4Otras 194 3,5
Sector de ActividadMillonesde euros
Distribución en %
SBS-SS-SPSS -2016 (19/22)
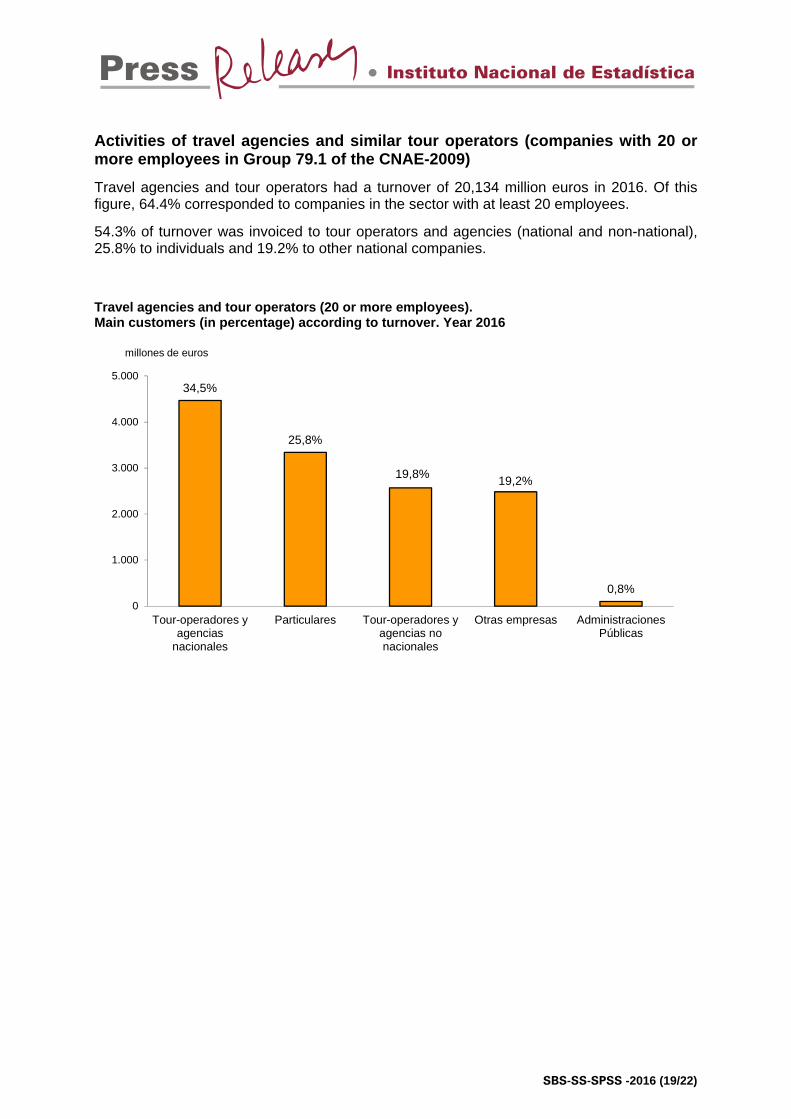
Activities of travel agencies and similar tour operators (companies with 20 or more employees in Group 79.1 of the CNAE-2009)
Travel agencies and tour operators had a turnover of 20,134 million euros in 2016. Of this figure, 64.4% corresponded to companies in the sector with at least 20 employees.
54.3% of turnover was invoiced to tour operators and agencies (national and non-national), 25.8% to individuals and 19.2% to other national companies.
Travel agencies and tour operators (20 or more employees). Main customers (in percentage) according to turnover. Year 2016
34,5%
25,8%
19,8%19,2%
0,8%0
1.000
2.000
3.000
4.000
5.000
Tour-operadores yagencias
nacionales
Particulares Tour-operadores yagencias nonacionales
Otras empresas AdministracionesPúblicas
millones de euros
SBS-SS-SPSS -2016 (20/22)
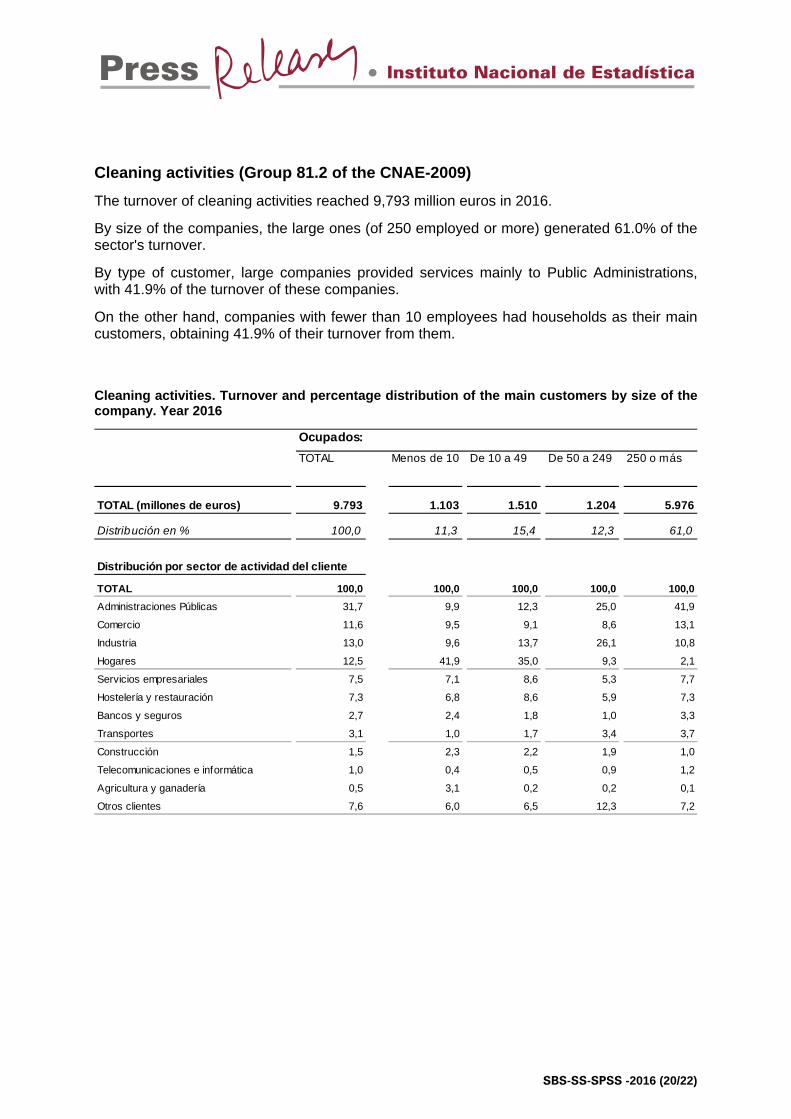
Cleaning activities (Group 81.2 of the CNAE-2009)
The turnover of cleaning activities reached 9,793 million euros in 2016.
By size of the companies, the large ones (of 250 employed or more) generated 61.0% of the sector's turnover.
By type of customer, large companies provided services mainly to Public Administrations, with 41.9% of the turnover of these companies.
On the other hand, companies with fewer than 10 employees had households as their main customers, obtaining 41.9% of their turnover from them.
Cleaning activities. Turnover and percentage distribution of the main customers by size of the company. Year 2016
TOTAL Menos de 10 De 10 a 49 De 50 a 249 250 o más
TOTAL (millones de euros) 9.793 1.103 1.510 1.204 5.976
Distribución en % 100,0 11,3 15,4 12,3 61,0
TOTAL 100,0 100,0 100,0 100,0 100,0
Administraciones Públicas 31,7 9,9 12,3 25,0 41,9
Comercio 11,6 9,5 9,1 8,6 13,1
Industria 13,0 9,6 13,7 26,1 10,8
Hogares 12,5 41,9 35,0 9,3 2,1
Servicios empresariales 7,5 7,1 8,6 5,3 7,7
Hostelería y restauración 7,3 6,8 8,6 5,9 7,3
Bancos y seguros 2,7 2,4 1,8 1,0 3,3
Transportes 3,1 1,0 1,7 3,4 3,7
Construcción 1,5 2,3 2,2 1,9 1,0
Telecomunicaciones e informática 1,0 0,4 0,5 0,9 1,2
Agricultura y ganadería 0,5 3,1 0,2 0,2 0,1
Otros clientes 7,6 6,0 6,5 12,3 7,2
Ocupados:
Distribución por sector de actividad del cliente
SBS-SS-SPSS -2016 (21/22)
Methodological note
Second year of implementation of the integration project of the structural business statistics
The National Statistics Institute (INE) annually prepares, for the Industry, Trade and Services sectors, the structural business statistics. These statistics are governed by Regulation 295/2008 of the Council and the European Parliament whose objective is to provide information on the main economic characteristics of companies, such as people employed, turnover and other incomes, purchases and consumption, personnel expenditure, tax and investment.
Until the reference year 2014 included, the INE Structural Business Statistics were carried out, according to the different sectors under study, through separate processes and with different collection and publication schedules.
From the reference year 2015, the implementation of the Integration Project of Structural Business Statistics1 started with the aim to standardise and improve the production process of these operations, the statistical results and the dissemination of information. This project has been developed over two years (2015 and 2016) and has meant a major reform of these operations.
Denomination until the reference year 2014
New denomination since the reference year 2015
Industrial Companies Survey Structural Business Statistics: Industrial Sector
Annual Trade Survey Structural Business Statistics: Trade Sector
Annual Services Survey Structural Business Statistics: Services sector
The reform has introduced, among other aspects, the following improvements:
As of the reference year 2015:
Use of practically uniform questionnaires for the three sectors under study, and adapted, in the case of legal person companies, to the standardised models of the Annual Accounts. In addition, the collection of information is already carried out in an integrated and simultaneous manner for the three sectors under study.
New dissemination plan, homogeneous for the three operations, which facilitates the comparison of the statistical results of the different sectors.
As of the reference year 2016:
More efficient sample designs in order to reduce the burden on the respondents and improve the use of administrative registers.
Methodological improvements relating to the treatment of companies that enter or leave the target population during the reference year, as well as the imputation of lack
1 The Integration Project of the Structural Business Statistics was presented to the High Council on Statistics and was approved at the Permanent Commission meeting held on 18 February 2016.
SBS-SS-SPSS -2016 (22/22)
of response. Additionally, the estimation of employment variables has been improved using administrative sources.
The new sampling designs and the simultaneous organisation of the collection of the three sectors under study allow to establish two different moments for the dissemination of the results:
- Preliminary results, using information from the ‘main sample’ collected up to the end of September of the year t+1. This sample allows to provide national results for a first level of breakdown by activities (at least up to three digits of the CNAE-2009 for the industry and trade sectors, and up to two digits for the services sector).
- Final results, based on the ‘complete sample’ (main and complementary, the latter collected until December of the year t+1). National results reach the highest level of detail by activities (up to four digits of the CNAE-2009), as required by the Community Regulation, and the results are presented by activity at the Autonomous Community level. These detailed results allow us to meet the requirements of other more specialized users.
All these measures, which have contributed to the uniformity, improvement and optimisation of the production process of these operations, also make it possible to meet the demand of users interested in making comparisons between the different sectors.
Turnover and employed personnel by sections of activity. Year 2016 Industrial Sector, Trade Sector and Services Sector
Sección de actividad
Millonesde euros
% sobreel total
Miles de personas
% sobreel total
Sector Industrial 571.944 32,4 2.082,8 18,6
B Industrias extractivas 3.421 0,2 20,4 0,2C Industria manufacturera 466.088 26,4 1.854,9 16,6D Suministro de energía eléctrica, gas, vapor y aire
acondicionado83.242 4,7 41,0 0,4
E Suministro de agua, actividades de saneamiento, gestión de residuos y descontaminación
19.193 1,1 166,5 1,5
Sector Comercio
G Comercio al por mayor y al por menor; reparación de vehículos de motor y motocicletas
724.594 41,0 3.107,5 27,7
Sector Servicios 471.050 26,6 6.015,3 53,7
H Transporte y almacenamiento 106.712 6,0 854,3 7,6I Hostelería 66.632 3,8 1.401,1 12,5J Información y comunicaciones 79.771 4,5 460,6 4,1L Actividades inmobiliarias 25.689 1,5 238,4 2,1M Actividades profesionales, científicas y técnicas 85.880 4,9 1.018,9 9,1N Actividades administrativas y servicios auxliares 69.402 3,9 1.397,4 12,5R Actividades artísticas, recreativas y de entrenimiento 28.034 1,6 326,6 2,9S Otros servicios (excepto actividades asociativas) 8.930 0,5 317,9 2,8
1.767.588 100,0 11.205,6 100,0TOTAL
Cifra de negociosPersonal ocupado
(media anual)
SBS-SS-SPSS -2016 (23/22)
Brief description of the statistical operation
Structural Business Statistics: Services Sector (formerly Annual Services Survey), is an annual structural survey, aimed at companies, both legal and natural persons, whose main activity is described in the sections H, I, J, L, M, N, R and divisions 95 and 96 of section S of CNAE-2009. Therefore, this includes the activities of transport and storage, accommodation, information and communications, real estate activities, professional, scientific and technical activities, administrative and support service activities, arts, entertainment and recreation and repair of computers and personal and household goods and other personal services (with the exception of the activities of membership organisations, Division 94).
This operation provides information on the main structural features and economic variables of companies in the sector through a wide range of variables relating to the personnel employed, turnover and other incomes, purchases and consumption, personnel expenses, taxes and investments. The statistics includes economic aggregates such as the value of production and gross value added, as well as main indicators.
The Statistics on Products in the Services Sector is an annual structural operation, integrated into the previous one, whose main objective is to provide a detailed breakdown of the turnover according to the services provided and the sector of activity of the customer. This additional breakdown applies to transport activities, hotels, computer and audiovisual services, legal and accounting services, technical services, advertising and market research, activities of employment agencies, travel agencies and tour operators, and cleaning activities.
Other variables studied include the breakdown of the consumption of raw materials and other consumables for transport and hotel activities, the fleet of vehicles used in transport, consumption by products and services purchased by travel agencies and tour operators, the hours invoiced at recruitment and placement companies, etc.
For more details on the characteristics and methodology of these operations, the following documentation can be consulted on the INE website:
Structural Business Statistics: Services Sector:
http://www.ine.es/dyngs/INEbase/en/operacion.htm?c=Estadistica_C&cid=1254736176865&menu=ultiDatos&idp=1254735576778
Statistics on Products in the Services Sector:
http://www.ine.es/dyngs/INEbase/en/operacion.htm?c=Estadistica_C&cid=1254736176898&menu=resultados&idp=1254735576778
For further information see INEbase: www.ine.es/en/ Twitter: @es_ine All press releases at: www.ine.es/en/prensa/prensa_en.htm Press office: Telephone numbers: (+34) 91 583 93 63 /94 08 – [email protected] Information Area: Telephone number: (+34) 91 583 91 00 – www.ine.es/infoine/?L=1