Embed Size (px)
Citation preview

TURKISH JOURNAL OF ELECTRICAL ENGINEERING AND
COMPUTER SCIENCES –ISSN NO. 13000632 (SCOPUS INDEX)
Machine learning algorithm-based Fusion of Hyperspectral and 3D Laser
Scanning Images
Shanthi T 1, Anand R2 , Vivek Karthick3 and Veni S4,
2 Research Scholar, Department of Electronics and Communication Engineering, Amrita School of Engineering,
Coimbatore, Amrita Vishwa Vidyapeetham, India and Assistant Professor, Research Member in Sona SIPRO,
Department of ECE, Sona College of Technology, Salem. Email: [email protected]
1 Assistant Professor, Research Member in Sona SIPRO, Department of ECE, Sona College of Technology,
Salem [email protected].
3 Assistant Professor, Research Member in Sona SIPRO, Department of ECE, Sona College of Technology,
Salem
4Department of Electronics and Communication Engineering, Amrita School of Engineering, Coimbatore,
Amrita Vishwa Vidyapeetham, India.
Abstract—Data fusion on remote sensing refers to the process of
combining data from multiple Sensors to produce a dataset. The
resulted data set contains more detailed information then each of
the individual sources also data from multiple sensors can
significantly improve the accuracy and interpretation of features.
Pixel-level, Feature-level and Decision-level are three common
levels of data fusion. Here, we summarized the proposal work, to
increasing the testing samples and reduce the computational
complexity of processing input image. Generally, spectral
resolution will give more about information of the spectrum of the
image and LiDAR gives the light intensity if the image. The
Novelty of this work to reduce the training samples and achieve
better classification accuracy in urban places. This work,
concentrates on the subsequent intentions: (i) To enhance the
classification precision in HSI and LiDAR images (ii) To lessen the
assorted pixels in suburban constructions that are encircled by
tiny trees (iii) To reduce the comparable pixels of streets and
parking areas. Here, 15 separate classes were categorized which
are significant for the expansion in urban areas.
I. INTRODUCTION
In 2019, the first time in history, more than half the
world’s population lives in cities. Key objectives of this
proposed contribution is grouping of LiDAR (Spectral
resolution) and HSI (Spatial resolution) for urban area land-use
arrangement. The Importance of Hyperspectral Image (HSI)
has accurate discrimination of different materials in spectral
resolution and analysis a small spatial structures in spatial
resolutions. Both Spatial and Spectral resolution are powerful
tool for accurate analysis of the earth. LiDAR data provides
useful information related to size, structure and elevation. So,
the fusion of hyperspectral and LiDAR has good impact to
classifiy different urban areas. Fusion of HSI and LiDAR
provides a complementary information because hyperspectral
image has spectral information but elevation of the image is not
available, but LiDAR has elevation of the image but no spectral
information. The classifier should be accurate, automatic and
simple fast for fusion data [1], [2]. Big data procedures are
deadly procedure in case of HSI image, let 𝑥 be an input
attributes, and let 𝑓 (𝑥) be a projecting or mapping function,
which is shown in below,
𝑦 = 𝑓(𝑥) (1)
Data investigation must usually adapt only similar design, i.e.,
𝑥 = 𝑥1, 𝑥2, , 𝑥3, . , . , 𝑥𝑁, which is, in between a enormous set
of attributes 𝑥 to N lesser attributes of sample[3].
II. LITERATURE SURVEY
HSI expertise has been more expressively used in past
few years. Spectral- spatial classification is conventional
spectral classifiers, consider hyperspectral images as a list of
spectral dimensions with no spatial informations. The
increases of labelling uncertainty, it may overcome by using
combination of spectral and spatial information[4]. Attributes
filters operate only on the connected Some of the research
works performed on LiDAR data alone includes involuntary
Structure of Edifice paths, Separation of 3D LIDAR[5].
In Ancient years, the scholars are used to share the
information by using palm leaf images. Narahari Sastry
Panyam [4], describes the 3D-feature (depth of indentation)
which is directly proportional to the pressure applied to scriber
at the point for character Road Accident Detection using
Convolutional Neural Network recognition. Narahar i Sastr y
and et.al have used Two Dimensional - Discrete wavelet
transform (2D-DW T), Fast Fourier transform (2D-FFT) for
extracting features from printed manuscripts. A total of 1540
images with 1232 in training and 308 in testing have been
outlined in the work. The authors have utilized a two-level
transforms and this transfor m helps to improve accuracy up to
96.4%. H. Swethalakshmi [ 6], has made use of the sequence of
strokes in Telugu and Devanagiri characters and the ectracted
features are used to classify these characters by using Support
Vector Machine (SVM). The palm-leaf manuscript character
images that are fed into the proposed approach were
normalization, smoothen and interpolated. Saeeda Naz [7], has
approached an implied segmentation based optical recognition
system for Urdu Character in Nastlaliq Scripts. A prediction
rate of 96.40% was achieved by the proposed method. Apurva
A. Desai [ 3] have used a neural network type of classification
and compared it with other machine learning approaches. This
literature shows that neural network based approach gives a
better result when compared to other approaches. Apurva A.
Desai has done this comparison with Gujarathi Characters
Hidden Markov Model and fuzzy logic algorithm was used on
Urdu scripts by Muhammad Imran Razzak [8] for character
recognition. The approach was evaluated on Nastaliq and
Nasakh script-based languages. With around twenty-six time-
invariant features and statistical features, the approach provided
87.4% and 74.1% of accuracy
for Nastaliq and Nasakh scripts respectively. An effective
optical character recognition system to recognize and identify
the Persian character using Support vector machine (SVM) was
proposed]. In this work, we addressed to overcome those
problem by using fusion of spectral and spatial components for
detecting urban objects. The upcoming sections: Section (3)
deals with summary of hyperspectral image and LiDAR.
Section (4) describes the proposed methodology by continuing
the Section (5) elaborates the proposed method for multi-class
Non-Linear SVM polynomial kernel classification techniques
are reviewed in section and end up with the Conclusions and
future scope this work.
III. OVERVIEW OF HYPERSPECTRAL AND LIDAR
HSI Sensor is extremely helpful than any other sensor
because it provides a constant band in the range, which can be
helpful for identifying precise objects covering in a scene [13],
[14],[15]. LiDAR processing: In most topographical data,
advancement information is deadly component.
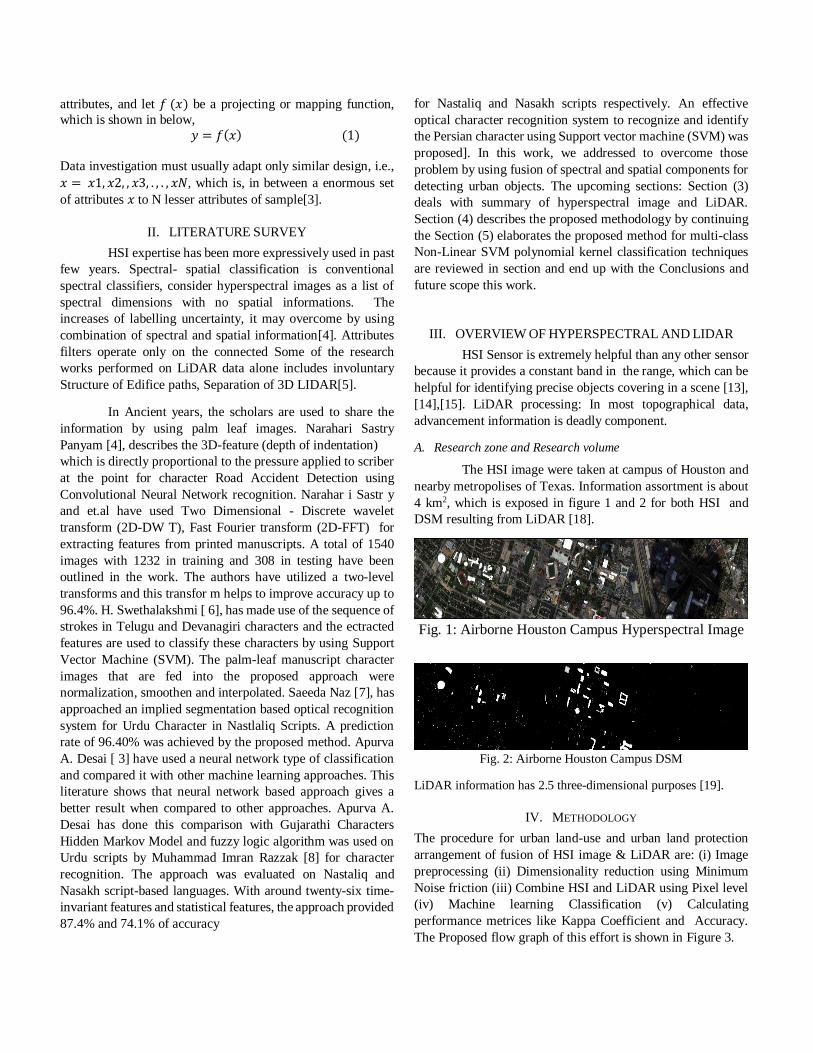
A. Research zone and Research volume
The HSI image were taken at campus of Houston and
nearby metropolises of Texas. Information assortment is about
4 km2, which is exposed in figure 1 and 2 for both HSI and
DSM resulting from LiDAR [18].
Fig. 1: Airborne Houston Campus Hyperspectral Image
Fig. 2: Airborne Houston Campus DSM
LiDAR information has 2.5 three-dimensional purposes [19].
IV. METHODOLOGY
The procedure for urban land-use and urban land protection
arrangement of fusion of HSI image & LiDAR are: (i) Image
preprocessing (ii) Dimensionality reduction using Minimum
Noise friction (iii) Combine HSI and LiDAR using Pixel level
(iv) Machine learning Classification (v) Calculating
performance metrices like Kappa Coefficient and Accuracy.
The Proposed flow graph of this effort is shown in Figure 3.

A. Pre-Processing
In Airborne HSI and LiDAR image is needed, atmospheric
adjustment is not required very much since the picture was
taken by CASI and the elevation of sensor is only 1676.4 meter
above the base level [20]. ,[21]. Fusion of HSI and LiDAR
information provides the data size of 349*1905*145
(9,64,02,525 pixels).
Fig. 3: Flow chart of Proposed Method
Throughout imagining viewpoint, the 3-D information can be
altered to 2-D information. Conclusively, the data size fused
information becomes (145*6,64,845 pixels [22], [23] which is
shown in Table 1.
Table 1: Quantity of the HIS, LiDAR and Combination of HSI
and LiDAR
Size of the HSI 349x1905x144
Size of LiDAR 349x1905x1
Fusion of both HSI and
LiDAR 349x1905x145
B. PCA or MNF
The benefits of Principal Component analysis (PCA) is to drop
the unwanted dimensionality of any data and it has the property
of orthogonality to each other which is shown in equation 2.
𝑍𝑗 = 𝑎𝑖𝑇𝑥
where 𝑖 = 1, 2, 𝑝, every Principle Component (PC) denotes P,
it’s a direct mixture of 𝑥. Initial PC is 𝑎1𝑇 exposed to 𝑎1
𝑇𝑎1 = 1
i.e., maximum variability of 𝑎1𝑇𝑥. Second PC is 𝑎2
𝑇𝑥 is
maximum variability of 𝑎2𝑇𝑥, 𝑎1
𝑇𝑥 and it is subjected to𝑎2𝑇𝑎2 =
1 and 𝑐𝑜𝑣(𝑎2𝑇𝑥, 𝑎1
𝑇𝑥) and if we have maximum variables with
constraint as 𝑎𝑗𝑇𝑎𝑗 = 1 to be computed [24], [25] & [26] used
in this work.
C. Pixel Level Fusion for HSI and LiDAR
Steps for combine of HSI and LiDAR data is explained as
follows: (i) Gathering of HSI and LiDAR data. (ii) Elimination
of illegal wavelength of HSI data (iii) Fusion of HIS and
LiDAR data by using Pixel level algorithm[27]. (v) Using
Supervised Based algorithm to classify the fused data. The
subsequent unit defines our projected prototypical using SVM
[28].
V. PROPOSED METHOD
Classification problems are an essential category of
difficulties in analytics in which the outcome changing or
response variable takes separate classes. Primary objective of a
classification model is to predict the probability of an
observation belonging to a class, known as class probability
[29]. Machine learning is a set of algorithms that have the
capability to learn to perform tasks such as predication and
classification effectively using data [33].
Nonlinear SVM is used for HSI data alone and for the
combined data of HSI and LiDAR we use supervised learning
. That let us to discover that Nonlinear SVM out goes well in
terms of precision and Kappa measurement. In linear classifier,
it may simply minimize the number of misclassification whilst
maximizing the margin with respect to the correctly classified.
In these the SVM training algorithm allows a training error. The
hyperplane in feature space corresponding to a highly non-
linear separating surface in the original input vector, hence this
classifier is called a nonlinear classifier.
Fig. 4: Training ROIs
A. Multi class Support Vector Machine
Supervised machine learning classification algorithm needs a
training samples with labels [30], The original HSI and LiDAR

data are shown in Figure 4 and 5. The training information are
categorized to 15 dissimilar labels [33].
Fig. 5: Spectral separability of the different Training ROIs
If big data can be characterized in hyperplane overlay which is
shown in below equation 3,
𝑦𝑖(𝑤𝑇𝑥𝑖 + 𝑏) ≥ 1 (3)
Where, 𝑤 is the load vector, 𝑥 is input and b is the bias [31]. If
𝑥𝑖 ∈ 𝐶𝑖 where 𝑖 is the amount of labels. User can also assign
labels belongingness, which is shown in equation 3. In case of
non -separable case, the classes become overlap to each other’s.
). For non -separable case, the classes become overlap to each
other’s so we utilize the Lagrangian constraints 𝑦𝑖(𝑤𝑇𝑥𝑖 +
𝑏) ≥ 1 where i=1, 2...M, cannot be satisfied for all data points.
To overcome this constraint will attempt to increase the
Lagrangian to arbitrarily large values. These ideas are
incorporated into the optimal margin algorithm described for
the linearly separable case by introducing slack variable 𝜖𝑖 ,
where i = 1, 2, ..M , 𝜖 ≥ 0, into the constraints as shown in
equation 4
𝑦. 𝑥 + 𝑏 ≥ +1 − 𝜖𝑖 , 𝑑𝑖 = +1 (4)
𝑦. 𝑥 + 𝑏 ≥ −1 + 𝜖𝑖 , 𝑑𝑖 = −1
Where, 𝜙(𝑥) is the mapping function could be done using an
immeasurable amount of feature variables. The feature
variables 𝜙(𝑥) in place of 𝑥 which is describes below equation
5,
y(x) = sign(∑ 𝜆𝑖𝑑𝑖(𝜙(𝑥). 𝜙(𝑥𝑖)) + 𝑊 (5)
15
𝑖=1
Conclusively working summary of the SVM procedure is
clarified below:
Step 1: A training information τ = 398907 i.e, 60%
of 664845 original images which is previously described and
40% of 664845 data points are used as testing samples data
points 𝑋𝑘 = 15 and anticipated output vector 𝑑𝑘 = [+1, −1]. Step 2: Select Polynomial Kernels and calculate dot
product of 𝜑(𝑥𝑗)𝑇
𝜑(𝑥𝑗)
Step 3: Find LaGrange Multipliers.
Step 4: Classify the test data points to get the output of y(x).
B. Accuracy Assessment
Accuracy evaluation is founded on the confusion matrix which
is several mixed data points are in same labels and the Accuracy
Index (AI) and Kappa measurement [34]. Both kappa
measurement and AI are shown in equations 11 and 12,
𝐴𝐼 = [𝑛 − (𝑜𝑚𝑖𝑠𝑠𝑖𝑜𝑛 + 𝑐𝑜𝑚𝑚𝑖𝑠𝑖𝑜𝑛)
𝑛] ∗ 100 (10)
K =𝑁 ∑ 𝑥𝑖𝑖
𝑟𝑖 − ∑ 𝑥𝑖(𝑥𝑖+1)
𝑁2 − ∑ 𝑥𝑖(𝑥𝑖+1) (11)
Where, ’n’ is the number of confusion matrix, ’K’ is the kappa
measurement, ’r’ is the amount of rows and N is the total of
datapoint or Region of interest.
VI. RESULTS AND DISCUSSION
Figure 6, 7 shows, all observations of class 1 to 15 are
displayed in different colors. The hyperplane is the decision
boundary how new observations are classified. The kernel
calculates internal product among the different labels from 1 to
15. In table 2 shows, the accuracy has been improved from
67.12% to 79.55%) using SVM.
The individual classes are shown in figure 8. Table 2
shows the performance comparison of Nonlinear SVM on HSI
and combined data (HSI + LiDAR) in terms of accuracy
indexes.
Fig. 6: HSI Image classification using SVM classifier

Fig. 7: HSI and LiDAR image classification using SVM
classifier
Fig. 8: Different color description for 15 different labels
The tasks which can be attained in remote sensing
while fusion of HSI and LiDAR comprises rebuilding of items,
ornamental feature origin and classification of classes
[32][36],[37]. The land-use organization assistances to
overcome the difficulties related to overflows and water in the
urban areas [35],[38].
TABLE 2: The Overall Accuracy using Multi class SVM
Method Overall Accuracy
Kappa coefficient
Computational Time
Nonlinear SVM for HSI alone 67.33 0.6432 16.47s
Nonlinear SVM for HSI and LiDAR 79.55 0.7789 14.32s
V. CONCLUSION
In this paper, we used Polynomial kernel based SVM
collaborative systems can attain good kappa coefficient and
accuracy for fusion of HSI and LiDAR. . This types the SVM-
based fusion of HSI and LiDAR data classification method
more relevant applications for Urban land use classification,
that needs as low computational complexity in deployment
level. For SVM classification, we used gradient descent
procedure for training one-vs-all 15-class SVM classifiers. The
gradient descent procedure is to accomplish of commerce with
terabytes of training image and unites very quick-typically 100
iterations are enough. As a outcome, we achieve state-of-the-
art performance on the SVM 15 class classification, i.e.,
79.55% in classification accuracy and 0.6432 as Kappa
coefficient.
REFERENCES
[1] Ammu, N.,& Irfanuddin, M. (2013). Big Data Challenges.
International Journal of Advanced Trends in Computer Science
and Engineering, 2(1),613-615.
[2] Laney, D. (2001). 3D data management: Controlling data
volume, velocity and variety. META Group Research Note, 6,
70.
[3] Shafri, Helmi ZM, et al. Hyperspectral remote sensing of
urban areas: an overview of techniques and applications.
Research Journal of Applied Sciences, Engineering and
Technology 4.11 (2012): 1557-1565.
[4] Ramdani, F. (2013). Urban vegetation mapping from fused
hyperspectral image and LiDAR data with application to
monitor urban tree heights.
[5] Zhang, K., Yan, J., & Chen, S. C. (2006). Automatic
construction of building footprints from airborne LIDAR data.
IEEE Transactions on Geoscience and Remote Sensing, 44(9),
2523-2533.
[6] Chen, Z., Xu, B., & Gao, B. (2016). An Image-
Segmentation-Based Urban DTM Generation Method Using
Airborne Lidar Data. IEEE Journal of Selected Topics in
Applied Earth Observations and Remote Sensing,
9(1), 496-506.
[7] Nielsen, A. A. (2011). Kernel maximum autocorrelation
factor and minimum noise fraction transformations. IEEE
Transactions on Image Processing, 20(3), 612-624.
[8] Debes, Christian, et al. Hyperspectral and LiDAR data
fusion: Outcome of the 2013 GRSS data fusion contest. IEEE
Journal of Selected Topics in Applied Earth Observations and
Remote Sensing 7.6 (2014): 2405-2418.
[9] Jung, A., Kardevn, P., & Tkei, L. (2005). Detection of urban
effect on vegetation in a less built-up Hungarian city by
hyperspectral remote sensing. Physics and Chemistry of the
Earth, Parts A/B/C, 30(1), 255-259.
[10] Lulla, V. (2009). Hyperspectral applications in urban
geography. In Planning and Socioeconomic Applications (pp.
79-86). Springer Netherlands.
[11] Man, Q., Dong, P., & Guo, H. (2015). Pixel-and feature-
level fusion of hyperspectral and lidar data for urban land-use
classification. International Journal of Remote Sensing, 36(6),
1618-1644.
[12] Schlkopf, B., Smola, A., & Mller, K. R. (1997, October).

Kernel principal component analysis. In International
Conference on Artificial Neural Networks (pp. 583-588).
Springer Berlin Heidelberg.
[13] Lillesand, T., Kiefer, R. W., & Chipman, J. (2014).
Remote sensing and image interpretation. John Wiley & Sons.
[14] DellAcqua, F., et al. Exploiting spectral and spatial
information in hyperspectral urban data with high resolution.
IEEE Geoscience and Remote Sensing Letters 1.4 (2004): 322-
326.
[15] Eismann, M. T. (2012, April). Hyperspectral remote
sensing. Bellingham: SPIE.
[16] Targ, R., Steakley, B. C., Hawley, J. G., Ames, L. L.,
Forney, P., Swanson, D., ... & Calloway, R. S. (1996). Coherent
lidar airborne wind sensor II: flight-test results at 2 and 10 m.
Applied optics, 35(36), 7117- 7127.
[17] Huang, Z. W., He, S., & Qiu, L. (2012). The urban objects
classification based on LiDAR 3D. In Applied Mechanics and
Materials (Vol. 226, pp. 1840-1843). Trans Tech Publications.
[18] Du, Qian, and Saurabh PraSaD. Report on the 2013 IEEE
GRSS data fusion contest: Fusion of hyperspectral and LiDAR
data. (2013).
[19] htt p : //hyperspectral.ee.uh.edu/?pageid = 459
[20] Berger, C., Voltersen, M., Eckardt, R., Eberle, J., Heyer,
T., Salepci, N., ... & Bamler, R. (2013). Multi-modal and multi-
temporal data fusion: Outcome of the 2012 GRSS data fusion
contest. IEEE Journal of Selected Topics in Applied Earth
Observations and Remote Sensing, 6(3), 1324- 1340.
[21] Douillard, B., Underwood, J., Kuntz, N., Vlaskine, V.,
Quadros, A., Morton, P., & Frenkel, A. (2011, May). On the
segmentation of 3D LIDAR point clouds. In Robotics and
Automation (ICRA), 2011 IEEE International Conference on
(pp. 2798-2805). IEEE.
[22]. Rodarmel, C., & Shan, J. (2002). Principal component
analysis for hyperspectral image classification. Surveying and
Land Information Science, 62(2), 115.
[23] Nielsen, A. A. (2011). Kernel maximum autocorrelation
factor and minimum noise fraction transformations. IEEE
Transactions on Image Processing, 20(3), 612-624.
[24] Wang, J., & Chang, C. I. (2006). Independent component
analysis based dimensionality reduction with applications in
hyperspectral image analysis. IEEE transactions on geoscience
and remote sensing, 44(6), 1586-1600.
[25] Nascimento, J. M., & Dias, J. M. (2005). Vertex
component analysis: A fast algorithm to unmix hyperspectral
data. IEEE transactions on Geoscience and Remote Sensing,
43(4), 898-910.
[26] Nielsen, A. A. (2011). Kernel maximum autocorrelation
factor and minimum noise fraction transformations. IEEE
Transactions on Image Processing, 20(3), 612-624.
[27] Man, Q., Dong, P., & Guo, H. (2015). Pixel-and feature-
level fusion of hyperspectral and lidar data for urban land-use
classification. International Journal of Remote Sensing, 36(6),
1618-1644.
[28] Dietterich, T. G. (1998). Approximate statistical tests for
comparing supervised classification learning algorithms.
Neural computation, 10(7), 1895-1923.
[29] Suykens, J. A., & Vandewalle, J. (1999). Least squares
support vector machine classifiers. Neural processing letters,
9(3), 293-300.
[30] Smola, A. J., & Schlkopf, B. (2004). A tutorial on support
vector regression. Statistics and computing, 14(3), 199-222.
[31] Shawe-Taylor, J., & Cristianini, N. (2004). Kernel
methods for pattern analysis. Cambridge university press.
[32] Kumar, S. (2004). Neural networks: a classroom approach.
Tata McGraw-Hill Education.
[33] Soman, K. P., Loganathan, R., & Ajay, V. (2009). Machine
learning with SVM and other kernel methods. PHI Learning
Pvt. Ltd..
[34] Foody, G. M. (2002). Status of land cover classification
accuracy assessment. Remote sensing of environment, 80(1),
185-201.
[35]. R. Anand, S. Veni, J. Aravinth, "An application of image
processing techniques for detection of diseases on brinjal leaves
using k-means clustering method", Recent Trends in
Information Technology (ICRTIT) 2016 International
Conference on. IEEE, 2016.
[36]. Anand, R., Veni, S., & Aravinth, J. (2017, September).
Big data challenges in airborne hyperspectral image for urban
landuse classification. In 2017 International Conference on
Advances in Computing, Communications and Informatics
(ICACCI) (pp. 1808-1814). IEEE.
[37]. Anand, R., Veni, S., & Aravinth, J. (2017, September).
Big data challenges in airborne hyperspectral image for urban
landuse classification. In 2017 International Conference on
Advances in Computing, Communications and Informatics
(ICACCI) (pp. 1808-1814). IEEE.
[38]. Shanthi, T., Sabeenian, R. S., & Anand, R. (2020).
Automatic diagnosis of skin diseases using convolution
neural network. Microprocessors and Microsystems, 76,
103074.