Embed Size (px)
DESCRIPTION
For the third year, Treatment Action Group (TAG) analyzes and reports on the annual funding of tuberculosis (TB) research and development (R&D). The top 40 TB research funding institutions were surveyed for actual disbursements made for R&D in fiscal years 2005, 2006, and now 2007. three-year data reveal trends in funding and demonstrates an alarming shortfall in the growth of R&during the initial years covered by The Global Plan to Stop TB: 2006–2015.
Citation preview
1
second printing
MAY 2009
bY NEHA AGARWAL
EditEd bY JAVid SYEd & MARk HARRiNGtoN
tubERcuLoSiS RESEARcH & dEVELopMENt:
A critical Analysis ofFunding trends, 2005–2007:An update
2
tubERcuLoSiS RESEARcH & dEVELopMENt:
A critical Analysis ofFunding trends, 2005–2007:An update
second printing
MAY 2009
bY NEHA AGARWAL
EditEd bY JAVid SYEd & MARk HARRiNGtoN
table of contents1 Executive Summary 4
2 introduction 6
2.1 the importance of tb R&d 6
2.2 background 6
2.3 objectives 7
2.4 Methodology 7
2.5 Limitations of the data 8
3 Results 9
3.1 Research investment categories 12
3.2 donor categories 13
4 top ten tb R&d donors 15
4.1 National institute of Allergy & infectious diseases (NiAid),
u.S/ National institute of Health (NiH) 15
4.2 the bill & Melinda Gates Foundation 16
4.3 the European commission’s Sixth and Seventh Frameworks 16
4.4 otsuka pharmaceutical company 17
4.5 u.S. centers for disease control & prevention (cdc) 17
4.6 other u.S. NiH institutes & centers (ics) 18
4.7 the Wellcome trust 18
4.8 uk Medical Research council (MRc) 18
4.9 Netherlands Ministry of Foreign Affairs (dGiS) 19
4.10 Novartis institute of tropical diseases (Nitd), Singapore 19
5 trends in tb Research by category 20
5.1 basic Science 20
5.2 diagnostics 21
5.3 tb drugs 22
5.4 tb Vaccines 24
5.5 operational Research 25
6 conclusions & Recommendations 26
6.1 conclusions 26
6.2 Recommendations 27
7 Appendix A: top Reporting tb R&d Funders in 2007 28
8 Appendix b: tb R&d Funders in 2007, 2006, 2005 30
Executive Summary
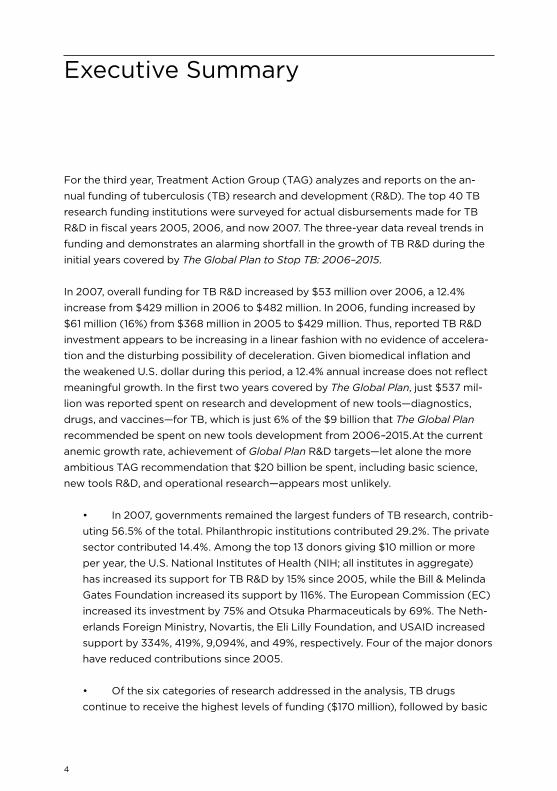
For the third year, treatment Action Group (tAG) analyzes and reports on the an-
nual funding of tuberculosis (tb) research and development (R&d). the top 40 tb
research funding institutions were surveyed for actual disbursements made for tb
R&d in fiscal years 2005, 2006, and now 2007. the three-year data reveal trends in
funding and demonstrates an alarming shortfall in the growth of tb R&d during the
initial years covered by The Global Plan to Stop TB: 2006–2015.
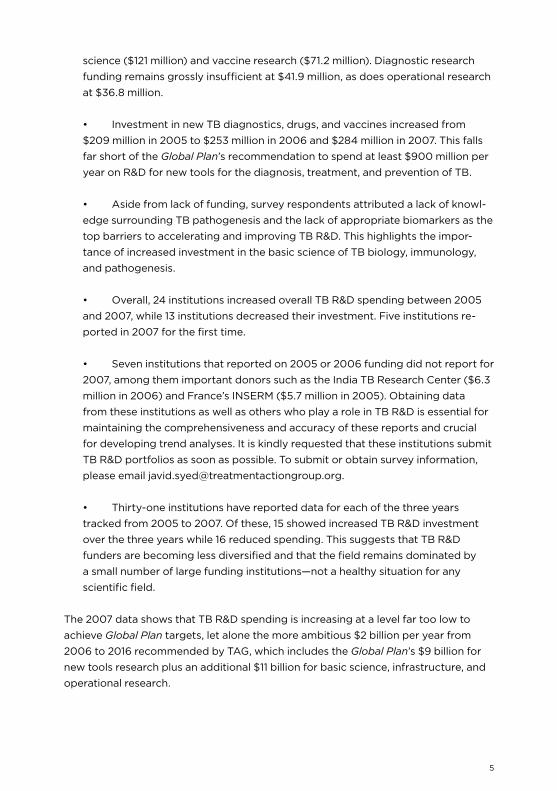
in 2007, overall funding for tb R&d increased by $53 million over 2006, a 12.4%
increase from $429 million in 2006 to $482 million. in 2006, funding increased by
$61 million (16%) from $368 million in 2005 to $429 million. thus, reported tb R&d
investment appears to be increasing in a linear fashion with no evidence of accelera-
tion and the disturbing possibility of deceleration. Given biomedical inflation and
the weakened u.S. dollar during this period, a 12.4% annual increase does not reflect
meaningful growth. in the first two years covered by The Global Plan, just $537 mil-
lion was reported spent on research and development of new tools—diagnostics,
drugs, and vaccines—for tb, which is just 6% of the $9 billion that The Global Plan
recommended be spent on new tools development from 2006–2015.At the current
anemic growth rate, achievement of Global Plan R&d targets—let alone the more
ambitious tAG recommendation that $20 billion be spent, including basic science,
new tools R&d, and operational research—appears most unlikely.
• in 2007, governments remained the largest funders of tb research, contrib-
uting 56.5% of the total. philanthropic institutions contributed 29.2%. the private
sector contributed 14.4%. Among the top 13 donors giving $10 million or more
per year, the u.S. National institutes of Health (NiH; all institutes in aggregate)
has increased its support for tb R&d by 15% since 2005, while the bill & Melinda
Gates Foundation increased its support by 116%. the European commission (Ec)
increased its investment by 75% and otsuka pharmaceuticals by 69%. the Neth-
erlands Foreign Ministry, Novartis, the Eli Lilly Foundation, and uSAid increased
support by 334%, 419%, 9,094%, and 49%, respectively. Four of the major donors
have reduced contributions since 2005.
• of the six categories of research addressed in the analysis, tb drugs
continue to receive the highest levels of funding ($170 million), followed by basic
4
5
science ($121 million) and vaccine research ($71.2 million). diagnostic research
funding remains grossly insufficient at $41.9 million, as does operational research
at $36.8 million.
• investment in new tb diagnostics, drugs, and vaccines increased from
$209 million in 2005 to $253 million in 2006 and $284 million in 2007. this falls
far short of the Global Plan’s recommendation to spend at least $900 million per
year on R&d for new tools for the diagnosis, treatment, and prevention of tb.
• Aside from lack of funding, survey respondents attributed a lack of knowl-
edge surrounding tb pathogenesis and the lack of appropriate biomarkers as the
top barriers to accelerating and improving tb R&d. this highlights the impor-
tance of increased investment in the basic science of tb biology, immunology,
and pathogenesis.
• overall, 24 institutions increased overall tb R&d spending between 2005
and 2007, while 13 institutions decreased their investment. Five institutions re-
ported in 2007 for the first time.
• Seven institutions that reported on 2005 or 2006 funding did not report for
2007, among them important donors such as the india tb Research center ($6.3
million in 2006) and France’s iNSERM ($5.7 million in 2005). obtaining data
from these institutions as well as others who play a role in tb R&d is essential for
maintaining the comprehensiveness and accuracy of these reports and crucial
for developing trend analyses. it is kindly requested that these institutions submit
tb R&d portfolios as soon as possible. to submit or obtain survey information,
please email [email protected].
• thirty-one institutions have reported data for each of the three years
tracked from 2005 to 2007. of these, 15 showed increased tb R&d investment
over the three years while 16 reduced spending. this suggests that tb R&d
funders are becoming less diversified and that the field remains dominated by
a small number of large funding institutions—not a healthy situation for any
scientific field.
the 2007 data shows that tb R&d spending is increasing at a level far too low to
achieve Global Plan targets, let alone the more ambitious $2 billion per year from
2006 to 2016 recommended by tAG, which includes the Global Plan’s $9 billion for
new tools research plus an additional $11 billion for basic science, infrastructure, and
operational research.
6
2.1 The Importance of TB R&D
the most frequently used tb diagnostic, the sputum smear test, routinely fails to
diagnose at least 50% of cases. tb treatment needs to be taken for 6–8 months
for drug-susceptible tb and for nearly twice that duration for multidrug-resistant
tb. Furthermore, tb treatments are difficult to take with some HiV medication.
the bcG vaccine for tb loses its protection over time and doesn’t prevent any
form of tb disease in adults. it is clear that new tools to diagnose, treat, and
prevent tb are needed to meet the Stop tb partnership and World Health
organization (WHo) goals to reduce tb incidence and death by 50% in 2015
relative to 1990 levels, and to eliminate tb as a public health threat by 2050.
Massive scale-up is needed in basic, applied, and operational research and in
development of better tools to prevent, diagnose, and cure tb.
2.2 Background
in the spring of 2006, tAG began a resource-mapping exercise to establish a
baseline for tb R&d funding disbursed in 2005 against which future funding
trends could be analyzed. the findings were published in Tuberculosis R&D
Investments: A Preliminary Assessment in August 2006. the final edition of the
report, Tuberculosis Research & Development: A Critical Analysis, published in
october 2006, presented a more comprehensive set of 2005 tb R&d data. in the
following report, published in November 2007, tAG provided data on reported
tb R&d funding in 2006, and compared 2006 with 2005 spending levels. the
updated edition of this report, Tuberculosis R&D: A Critical Analysis of Funding
Trends, 2005–2006: An Update, published in July 2008, included revised and
corrected baseline and trend data for 2005 and 2006.
the 2006 tAG report Tuberculosis Research & Development: A Critical Analysis
identified $393 million invested by forty donors in tb R&d in 2005. though we
now know that this number was inflated due to a discrepancy in reporting and
should have been $363 million,1 the report had a significant impact on raising
2. introduction
1. As noted in the July 2008 report, “in 2005 the MRc [uk] was incorrectly ranked number three with a total donation
of $31 million. the correct amount invested by the MRc was $6.2 million, which knocks its ranking down to number 14.
. . . the inaccurate account of MRc’s contribution of $31 million in 2005 was due to the bundling of a five-year award
that should have been annualized to represent spending in 2005. . . . the MRc error is a good illustration of the perils
and pitfalls of R&d tracking. it is also an apt example of the need for explicit and standardized annual accounting on
the part of R&d donors of all neglected diseases” (Feuer 2008, p. 12).
7
awareness about the dismal state of investment in tb research. the report’s
findings were used widely by researchers and policy makers, and the results
were presented as a late-breaker at the 37th iuAtLd World conference on Lung
Health in paris in November 2006. Stefan kaufmann and Shreemanta parida
cited the report in the special tb issue of Nature Medicine in March 2007. Neil
Schluger of columbia university cited it as the most important tb paper of 2006
at the March 2007 keystone tb pathogenesis meeting in Vancouver.
tAG presented its results at the Stop tb partnership coordinating board
meeting in Jakarta, indonesia, and at the NiH National institute of Allergy and
infectious diseases (NiAid) Advisory council special meeting on MdR- and XdR-
tb in May 2007. the Foundation for innovative New diagnostics (FiNd), Médecins
sans Frontières, the WHo, and other organizations have cited tAG’s data.
2.3 Objectives
by tracking spending trends and highlighting underfunded areas of research,
this publication aims to drive advocacy for research on new tb diagnostics,
treatment, and prevention tools; for expanded basic science research, which
provides the basis for new tools discovery; and for increased operational
research, which demonstrates how new and existing tools can be optimized for
effectiveness in real-world programmatic conditions.
Forty-nine donors reported for at least one year. of these, ten did not report
in 2005, ten in 2006, and seven in 2007. there was, however, variation in
nonreporting. thus, the data in this report are not complete; some public funders
(notably from china, France, and india) did not provide complete data for 2007,
nor did most industry funders. Nevertheless, most major sponsors of tb R&d are
likely included here.
2.4 Methodology
A list of 128 potential tb research funders was generated using information
from the Stop tb partnership website; reports by Aeras, FiNd, and the Global
Alliance for tb drug development; from internet research; and from contacts
garnered from the last three years’ tb R&d survey respondents. key informants
in the tb research community were consulted to assist in confirming a core list of
significant donors.
8
tAG used an e-mail survey to solicit information from funders and recipients
about actual annual disbursements (not commitments or awards) for tb research
for 2007. the survey also collected information about future commitments;
the amount of funding an institution disbursed or received; grant portfolios
describing the research; and qualitative responses about priorities and obstacles
in tb research.
All efforts were made to follow institutions tracked in 2005 and in 2006 to allow
for three-year trend data. unfortunately, seven previously reporting institutions
did not provide data for 2007.
Several new institutions have been identified during the process, expanding the
list to 49 surveyed institutions from 2005 to 2007. New to the list in 2007 are the
Statens Serum institute, the New Zealand Health Research council, the Mexico
National institute of public Health, dafra pharmaceutical Ltd., and the korean
institute of tuberculosis.
2.5 Limitations of the Data
the lack of accuracy in resource tracking continues to be a challenge. Several
features contribute to this:
1. certain funders decline to provide data, preventing us from thoroughly
tracking existing funding levels and multiyear trends.
2. Funders often do not clearly categorize investments and lack a rigorous
understanding about where their money is going, in some cases due to
provision of block funds and in others due to a lack of clarity about how their
investments will be used.
3. certain funders have difficulty in separating commitments from
disbursements or in apportioning multiyear grants into single years. in some
cases funders operate on a two-year fiscal cycle. Some funders ask that their
multiyear grants simply be divided by the number of years they cover, though
this does not always correlate with actual disbursements.
4. Most companies surveyed declined to reveal the amounts of their
investments, though tAG encouraged them to do so by allowing them to
remain unnamed in the report. We salute the ten companies that provided data
for 2007, eight by name and two who chose to remain anonymous.
tAG urges funders to be more rigorous in tracking their tb R&d investments each
year by award and research category so they can measure what they are doing
and how it changes over time.
9
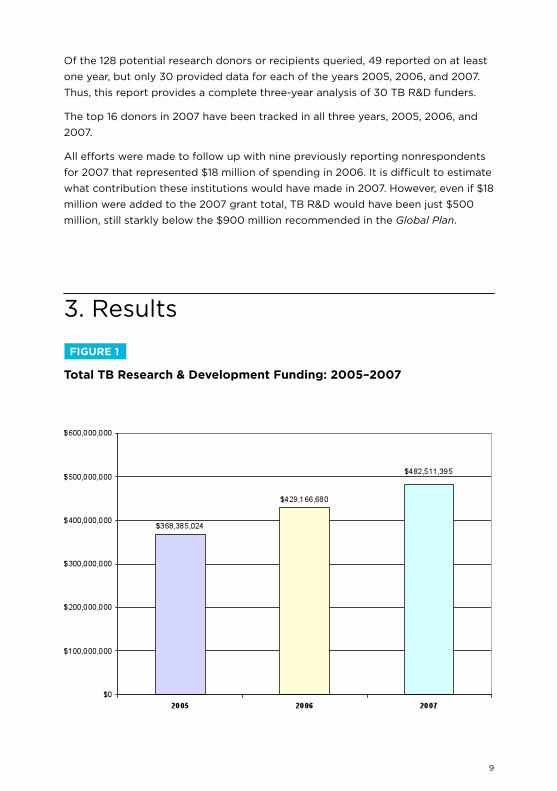
of the 128 potential research donors or recipients queried, 49 reported on at least
one year, but only 30 provided data for each of the years 2005, 2006, and 2007.
thus, this report provides a complete three-year analysis of 30 tb R&d funders.
the top 16 donors in 2007 have been tracked in all three years, 2005, 2006, and
2007.
All efforts were made to follow up with nine previously reporting nonrespondents
for 2007 that represented $18 million of spending in 2006. it is difficult to estimate
what contribution these institutions would have made in 2007. However, even if $18
million were added to the 2007 grant total, tb R&d would have been just $500
million, still starkly below the $900 million recommended in the Global Plan.
3. Results
fIguRe 1
Total TB Research & Development funding: 2005–2007
10
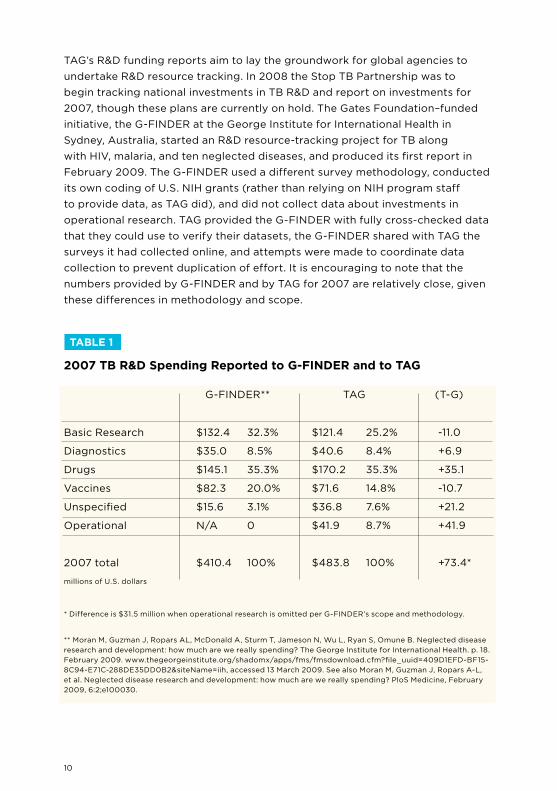
tAG’s R&d funding reports aim to lay the groundwork for global agencies to
undertake R&d resource tracking. in 2008 the Stop tb partnership was to
begin tracking national investments in tb R&d and report on investments for
2007, though these plans are currently on hold. the Gates Foundation–funded
initiative, the G-FiNdER at the George institute for international Health in
Sydney, Australia, started an R&d resource-tracking project for tb along
with HiV, malaria, and ten neglected diseases, and produced its first report in
February 2009. the G-FiNdER used a different survey methodology, conducted
its own coding of u.S. NiH grants (rather than relying on NiH program staff
to provide data, as tAG did), and did not collect data about investments in
operational research. tAG provided the G-FiNdER with fully cross-checked data
that they could use to verify their datasets, the G-FiNdER shared with tAG the
surveys it had collected online, and attempts were made to coordinate data
collection to prevent duplication of effort. it is encouraging to note that the
numbers provided by G-FiNdER and by tAG for 2007 are relatively close, given
these differences in methodology and scope.
* difference is $31.5 million when operational research is omitted per G-FiNdER’s scope and methodology.
** Moran M, Guzman J, Ropars AL, Mcdonald A, Sturm t, Jameson N, Wu L, Ryan S, omune b. Neglected disease
research and development: how much are we really spending? the George institute for international Health. p. 18.
February 2009. www.thegeorgeinstitute.org/shadomx/apps/fms/fmsdownload.cfm?file_uuid=409d1EFd-bF15-
8c94-E71c-288dE35dd0b2&siteName=iih, accessed 13 March 2009. See also Moran M, Guzman J, Ropars A-L,
et al. Neglected disease research and development: how much are we really spending? ploS Medicine, February
2009, 6:2;e100030.
TABLe 1
2007 TB R&D Spending Reported to g-fINDeR and to TAg
G-FiNdER** tAG (t-G)
basic Research
diagnostics
drugs
Vaccines
unspecified
operational
2007 total
$132.4
$35.0
$145.1
$82.3
$15.6
N/A
$410.4
32.3%
8.5%
35.3%
20.0%
3.1%
0
100%
$121.4
$40.6
$170.2
$71.6
$36.8
$41.9
$483.8
25.2%
8.4%
35.3%
14.8%
7.6%
8.7%
100%
-11.0
+6.9
+35.1
-10.7
+21.2
+41.9
+73.4*
millions of u.S. dollars
11
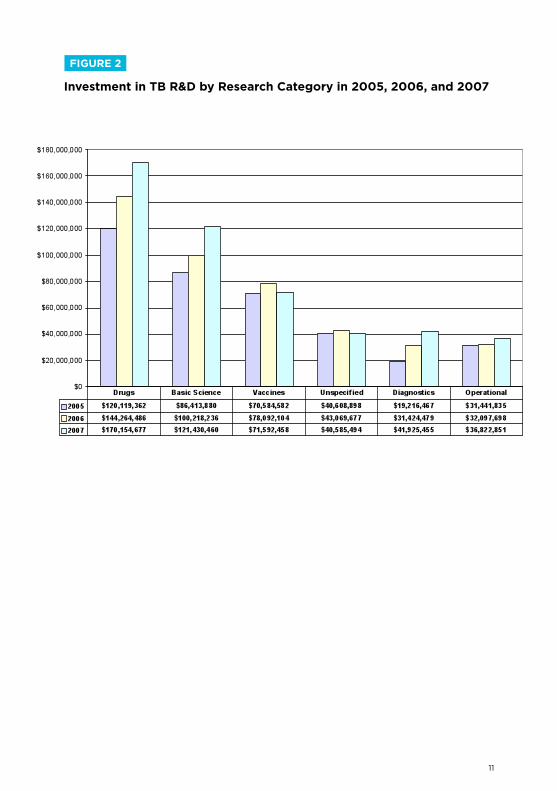
fIguRe 2
Investment in TB R&D by Research Category in 2005, 2006, and 2007
12
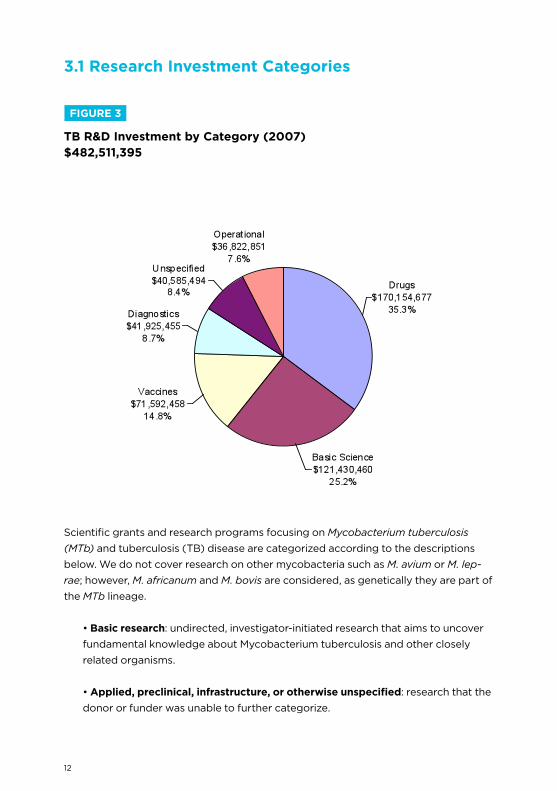
Scientific grants and research programs focusing on Mycobacterium tuberculosis
(MTb) and tuberculosis (tb) disease are categorized according to the descriptions
below. We do not cover research on other mycobacteria such as M. avium or M. lep-
rae; however, M. africanum and M. bovis are considered, as genetically they are part of
the MTb lineage.
• Basic research: undirected, investigator-initiated research that aims to uncover
fundamental knowledge about Mycobacterium tuberculosis and other closely
related organisms.
• Applied, preclinical, infrastructure, or otherwise unspecified: research that the
donor or funder was unable to further categorize.
3.1 Research Investment Categories
fIguRe 3
TB R&D Investment by Category (2007)$482,511,395
13
• Diagnostics: preclinical or clinical trials of diagnostic technologies and algorithms.
• Drugs: preclinical or clinical research on treatments and treatment strategies
for tuberculosis disease (including prophylaxis and latent and active tb).
• Vaccines: preclinical or clinical research on tb vaccines.
• Operational research: includes randomized controlled studies of existing inter-
ventions within routine program settings, or targeted evaluation of new or existing
interventions to improve tb program performance and reduce tb rates.
treatment Action Group’s three-year collection of data provides an unprecedented
picture of reported tb R&d spending from 2005 to 2007, with extensive data on indi-
vidual donors and trends by research category and by donor category, and provides
a unique overview of the world’s progress—or more accurately, lack of progress—
toward meeting the ambitious R&d targets of the Global Plan and the even more
ambitious targets set by tAG in 2006.
3.2 Donor Categories
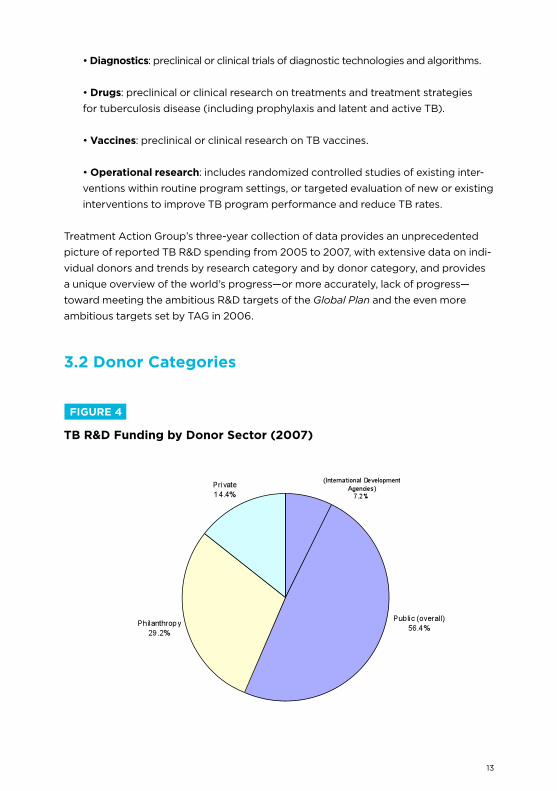
fIguRe 4
TB R&D funding by Donor Sector (2007)
14
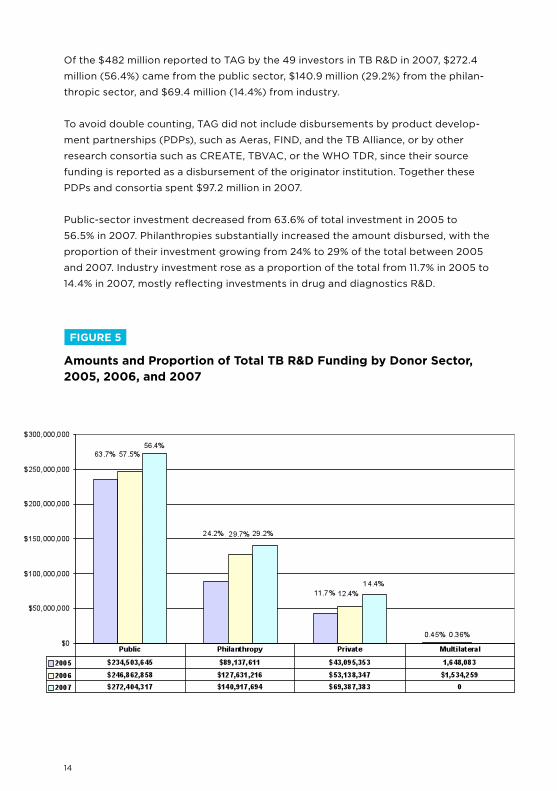
of the $482 million reported to tAG by the 49 investors in tb R&d in 2007, $272.4
million (56.4%) came from the public sector, $140.9 million (29.2%) from the philan-
thropic sector, and $69.4 million (14.4%) from industry.
to avoid double counting, tAG did not include disbursements by product develop-
ment partnerships (pdps), such as Aeras, FiNd, and the tb Alliance, or by other
research consortia such as cREAtE, tbVAc, or the WHo tdR, since their source
funding is reported as a disbursement of the originator institution. together these
pdps and consortia spent $97.2 million in 2007.
public-sector investment decreased from 63.6% of total investment in 2005 to
56.5% in 2007. philanthropies substantially increased the amount disbursed, with the
proportion of their investment growing from 24% to 29% of the total between 2005
and 2007. industry investment rose as a proportion of the total from 11.7% in 2005 to
14.4% in 2007, mostly reflecting investments in drug and diagnostics R&d.
fIguRe 5
Amounts and Proportion of Total TB R&D funding by Donor Sector, 2005, 2006, and 2007
15
4.1 National Institute of Allergies and Infectious Diseases (NIAID), National Institutes of Health (NIH)
the u.S. National institutes of Health (NiH), the world leader in health research
spending, continues to be the largest funder of tb research for the third con-
secutive year. in 2007, the NiH, which comprises the National institute of Allergy
and infectious diseases (NiAid, rank 1), the National Heart, Lung, and blood
institute (NHLbi, rank 11), and all other NiH institutes and centers (ics, rank 6),
disbursed a total of $160 million in grants and contracts targeted for tb R&d.
in 2007, the NiH was virtually paralyzed by an inability to mount ambitious new
initiatives due to frozen funding levels. due to the poor budget situation and
to the NiH’s inherent slowness in adapting to emerging needs, 2007 saw only a
slight uptick in support for tb R&d, though it was the year immediately following
the much-publicized outbreak of extensively drug-resistant tuberculosis (XdR-
tb) in South Africa.
Although NiAid’s 2007 tb R&d funds increased by $12 million (10%) from 2005,
tb spending at the NHLbi declined from $17 million in 2005 to just $11.6 million
in 2007. the overall NiH budget has been essentially flat since 2004, actually
declining in constant dollars when biomedical inflation is considered. the NiAid
supported 82% of the NiH’s tb R&d and 27% of all tb R&d reported to tAG for
2007. of NiAid’s $131 million, $61 million went to basic research, a 20% increase
from 2006. tb diagnostics and drugs increased at more modest rates of 11% and
13%, respectively. NiAid’s investment in tb vaccine research decreased by 25%.
the immediate prospect for the NiH budget has recently brightened with the
passage of the American Recovery and Reinvestment Act of 2009, but most of
the $10.8 billion appropriated under this act—intended to be distributed among
all of NiH’s institutes and centers—must be spent within two years. it is unclear
whether these stimulus funds will end up benefiting tb R&d. the fiscal year
2009 NiH budget is expected to be $30.3 billion plus the one-time stimulus
investment of $10 billion.
4. top 10 Funders of tb R&d
16
4.2 The Bill and Melinda gates foundation
the bill & Melinda Gates Foundation is the world’s largest private philanthropic
organization, with a total endowment of $29.0 billion at the start of 2009 (pre-
viously it was higher, but it has lost value in the recent economic crisis). the
Gates Foundation disbursed $124 million for tb R&d in 2007, up 29% from the
$96 million disbursed in 2006 and up 116% from the $57 million disbursed in
2005. the majority of the 2007 increase can be attributed to increases in drug
development costs. in 2007, $51 million was spent on drug development, nearly
a threefold increase from the previous year. diagnostics research increased from
$15 million in 2006 to $21 million in 2007. operational research also increased
from $9.5 million to $18 million since 2006. However, in 2007, basic science and
vaccines funding decreased to 2005 levels.
For the first time in 2007, Gates Foundation support for tb R&d outpaced that
of NiAid for all categories other than basic research.
the foundation’s largest 2007 tb disbursement ($29.7 million) was made to
the AERAS Global tb Vaccine Foundation. the Global Alliance for tb drug
development received $29.3 million, followed by cREAtE and FiNd, which
received $17.8 million and $16.1 million, respectively.
Recent economic setbacks have reduced the Gates Foundation’s endowment
to $29 billion at the start of 2009, but the Foundation has pledged to meet all
of its commitments to existing projects. Nonetheless, as early-stage product
development increasingly gives way to later-stage phase ii and iii trials of new
tb drugs and vaccines, costs will mount, and it is unclear whether the public
sector will step in to support this research as it should. Another concern is that
generous Gates funding for tb R&d may deter other donors from remaining
active. circumstantially, this may explain the withdrawal of the Ellison and
Rockefeller Foundations from tb funding. despite the impact of the Gates
Foundation on tb R&d, its activity must not excuse the public and private
sectors from continued and increased investment.
4.3 The european Commission’s Sixth and Seventh frameworks
the European commission’s Sixth Framework programme (Fp6) is aimed at
integrating European efforts toward small-scale, phase i clinical trials for new
tb vaccines and to establish production technologies for lead compounds for

17
new anti-tb drugs. the Sixth Framework contributed $13 million to tb R&d in
2006. of this, $7 million went to preclinical vaccine studies, $2.7 million to basic
science, and $2.7 million to preclinical drug studies. the Sixth Framework ended
in 2006 and was replaced by the Seventh Framework programme, which runs
from 2007 to 2013.
in 2007, the European commission contributed $23 million to tb R&d, an 81%
increase from 2006. this increase was partially unintentional as disbursements
from the Sixth Framework were still being made in 2007 alongside new dis-
bursements granted through the Seventh Framework. Future Ec funding is
expected to flatten out to near 2006 levels.
4.4 Otsuka Pharmaceutical Company
the otsuka pharmaceutical company in Japan is developing the novel nitro-
imidazo-oxazole compound opc-67683, one in a new class of drugs with potent
anti-tb activity. the compound is currently in a global, multicenter, randomized,
phase ii study for treatment of multidrug-resistant (MdR) tb. in 2006 otsuka
rose to become the third largest funder of tb R&d simply by putting opc-67683
into early bactericidal activity (EbA) studies, an intermediate phase between
phases i and ii in drug development. in 2007 otsuka occupies the fourth rank,
and is the largest industry donor to tb R&d. We salute the otsuka company for
undertaking its development efforts with this promising new drug, and hope
that it will pursue the drug through phase iii and to licensure. companies such
as otsuka and tibotec are paving the way for a new generation of tb drug trials
focused on dire unmet medical needs, such as for people with MdR tb. We hope
that other companies will follow their lead and enter the drug development
space as well. Nevertheless, the lack of evident public-sector support for large,
pivotal phase iii efficacy trials for opc-67683 and other promising new tb drugs
remains a concern.
4.5 u.S. Centers for Disease Control & Prevention (CDC)
cdc funding for tb fell from $20 million in 2005 to $17 million in 2006 and only
increased by 5% in 2007. From 2006 to 2007, tb drugs received a 14% boost
from $8.2 to $9.3 million and infrastructure/unspecified research increased by
15% from $2.8 to $3.2 million. though individual categories of research have
fluctuated, overall cdc tb R&d funding remains unchanged at around $18
million. in 2007, 87% of tb funding from the cdc went to the tuberculosis trials
consortium (tbtc) and the tb Epidemiologic Studies consortium (tbESc).
18
4.6 Other NIH Institutes & Centers
in addition to larger and more focused NiH efforts at NiAid and the NHLbi,
which are listed separately, an additional 14 of the NiH’s 27 institutes and centers
contributed $17.2 million in 2007. this amount declined from $20 million in 2005.
4.7 The Wellcome Trust
the Wellcome trust is a uk-based private philanthropy that runs a diverse
range of grant programs supporting biomedical research, as well as activities in
medical humanities, technology transfer, and public engagement with science.
the Wellcome trust is the second largest philanthropic investor and the seventh
largest overall funder of tb R&d in 2007. Wellcome’s overall spending decreased
from $18.4 million in 2006 to $15.4 million in 2007. Vaccine research took the
hardest hit, with a total disbursement of $319,000, a mere 9% of the 2006
amount. the other two areas of research funded by the Wellcome trust, basic
science and operational research, remained level.
the Wellcome trust is primarily a response-mode funder. As such, the trust has
not earmarked future funds for research into tb or other specific disease areas.
However, the trust provides vital support for a range of tb researchers and
for strengthening scientific infrastructure in developing countries, particularly
Africa. the trust is also showing new interest in some platform technologies for
potential new diagnostics (broader than tb alone). We encourage the Wellcome
trust to expand its contributions in all areas.
4.8 uK Medical Research Council (MRC)
Short-course curative tb chemotherapy was largely developed by the uk MRc
in a series of groundbreaking trials carried out over the four decades from 1948
to 1986. With tb curable, tb research virtually shut down in the uk, at the u.S.
NiH, and around the world. When tb research began to ramp up again after
the outbreak of HiV-associated MdR-tb in New York city in the early 1990s, a
whole generation of researchers had grown up without significant interest in tb
R&d. thus, the MRc’s return to tb research more recently is welcome, and we
hope that the MRc will once again step up to meet unfilled needs in tb research,
including support not only for basic science but also for much needed clinical
trials of new drugs and vaccines.
19
4.9 Netherlands Ministry of foreign Affairs (DgIS)
the Netherlands Ministry of Foreign Affairs (dGiS) is a newcomer in the top 10
tb R&d funders. With an overall tb R&d spending of $13.7 million in 2007, dGiS
jumped from the 17th largest donor in 2006 to the 9th largest donor in 2007.
dGiS supports diagnostics, drugs, and vaccine research. the expansion in dGiS’s
portfolio is mainly reflected in the increased disbursement for vaccine research;
$9.5 million was spent on vaccine development in 2007, representing 14% of total
vaccine funding.
the Netherlands dGiS has shown an accelerated rate of tb R&d funding since
2005. this is due to political will by the government of the Netherlands, which
in 2006 and 2007 made significant new contributions to tb R&d through the
product development partnerships Aeras, FiNd, and the tb Alliance.
other European countries should take notice of the increasing dutch contribu-
tions to tb R&d and should make similarly large, new, multiyear contributions to
the field.
4.10 Novartis Institute for Tropical Diseases (NITD), Singapore
Rounding off the top ten tb research donors is the Novartis institute for tropical
diseases (Nitd), which is focused on preclinical drug discovery. Novartis
increased its investment from $8.7 million in 2006 to $11.7 million in 2007.
Nitd represents a new model for industry R&d related to diseases of the
developing world, in which a large pharmaceutical company sets up an institute
to bring together researchers to discover new products to prevent and treat
diseases of global concern.
Given the paucity of new tb drugs in the clinic—just five new compounds as
well as two older fluoroquinolones—we would encourage more companies to
join Novartis, Eli Lilly, AstraZeneca, and GlaxoSmithkline in contributing to the
preclinical discovery work carried out at institutions such as Nitd.
20
5. trends in tb Research by category
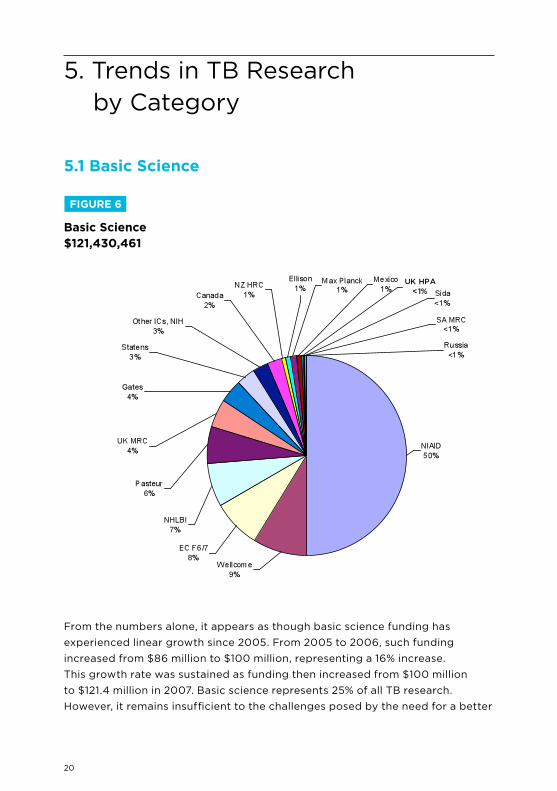
From the numbers alone, it appears as though basic science funding has
experienced linear growth since 2005. From 2005 to 2006, such funding
increased from $86 million to $100 million, representing a 16% increase.
this growth rate was sustained as funding then increased from $100 million
to $121.4 million in 2007. basic science represents 25% of all tb research.
However, it remains insufficient to the challenges posed by the need for a better
fIguRe 6
Basic Science$121,430,461
5.1 Basic Science
21
understanding of the MTb life cycle, host interactions, defense mechanisms,
evolution, latency, and persistence. MTb is slow to grow, hard to identify in vivo
until full-blown disease occurs, has imperfect animal models that do not fully
recapitulate disease pathogenesis in humans, and is expensive and dangerous
to handle, requiring biosafety level-3 laboratories in most developed countries.
As a result, many researchers prefer to work with the attenuated M. bovis bcG
organism which may be of limited relevance due to its extensive attenuation.
Much more resources are required if a new generation of scientists is to be
attracted to spend its career in tb R&d. New molecular tools, systems biology,
genomics and proteomics, and a variety of other new techniques desperately
need to be applied to the study of tb pathogenesis and the quest for new and
better interventions.
5.2 TB Diagnostics
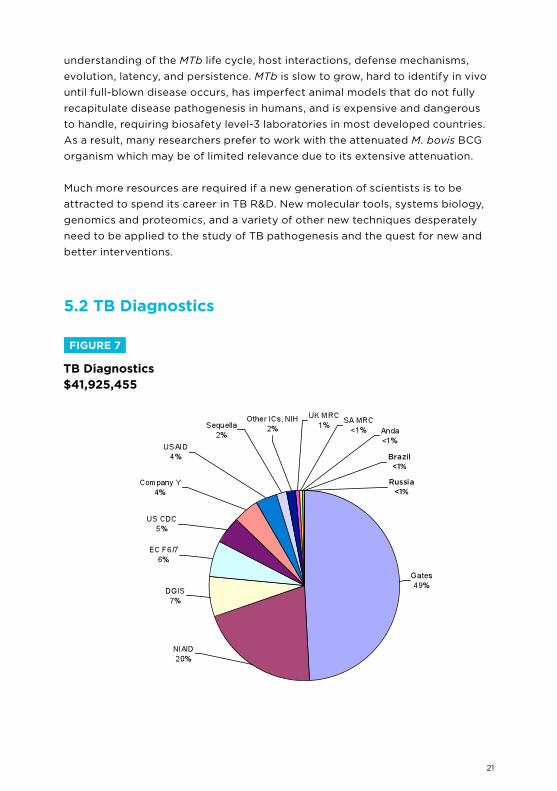
fIguRe 7
TB Diagnostics$41,925,455
22
the most commonly used tb diagnostic, the sputum smear test, routinely fails to
detect 50% of tb cases. the failure of current tb diagnostic tools is a challenge
for tb control efforts, and funding levels need to reflect the urgency of this
area of research. in order to fulfill the Global Plan’s 2006 projected R&d needs,
diagnostics research spending should double to at least $59 million.
in 2006, diagnostics research represented the research category with the least
amount of funding; in 2007, diagnostics ranks as the third lowest. the increase in
diagnostics research funding is largely due to a boost in support from the Gates
Foundation. At $42 million in 2007, diagnostics research comprises 8.9% of all
tb R&d—an increase of 1.6% over 2006, but still grossly insufficient.
Gates Foundation support provided $20.6 million for diagnostics research,
representing 49% of all diagnostic research funding in 2007, followed by
NiAid at $8.5 million, dGiS at $2.9 million, and the Ec at $2.6 million. though
the increase in diagnostics research funding is commended, three-year trend
data suggests funding levels are tapering off. between 2005 and 2006, funds
increased by 64%. From 2006 to 2007, they decreased by 34%.
5.3 TB Drugs
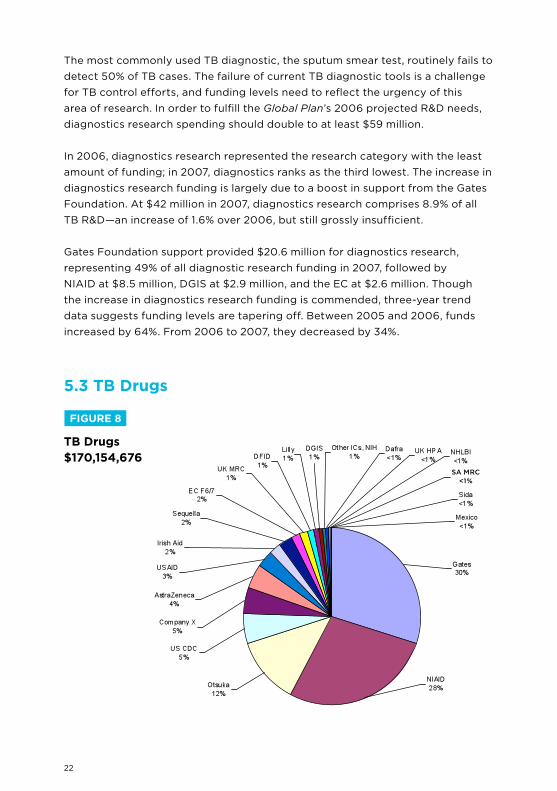
fIguRe 8
TB Drugs$170,154,676
23
drug discovery and development is the big fish in the small pond of tb R&d.
For the third year, drug development remains the largest funded category of
tb R&d. totaling $169 million, drug research makes up 35.8% of all tb R&d.
Not only is drug research the largest funded, it also has the largest number of
contributors. twenty-seven of the forty-eight responding institutions provide
drug research funding.
the Gates Foundation increased its drug research funding by $31 million, from
$20 million in 2006 to $51 million in 2007; most of the increase was given to
the tb Alliance and to the Accelerator program of smaller preclinical drug
discovery grants. the Gates increase for drug development funding places
NiAid in second rank, with a total of $47 million in 2007, up $5.5 million from
the previous year. in third place is otsuka pharmaceuticals, the largest private
contributor to tb R&d with $21 million directed to drug research in 2007.
With just four drugs in early phase trials—Sudoterb (phase i), SQ-109 (phase
i), opc-67683 (phase ii), and tMc-207 (phase ii)—and two drugs (gati- and
moxifloxacin) in phase iii trials, the clinical pipeline is alarmingly small. Failures
are common during early phase drug development and may be anticipated
among these candidates. the strength of the preclinical pipeline remains to
be seen. infrastructure for the large phase iii trials required to gain regulatory
approval is nonexistent. infrastructure for phase iV postmarketing studies is also
scant. the field is now challenged, not by a lack of drugs to test but by the lack
of institutional commitment by any funder—including the u.S. NiH—to subsidize
trials that the industry may be reluctant to undertake.
24
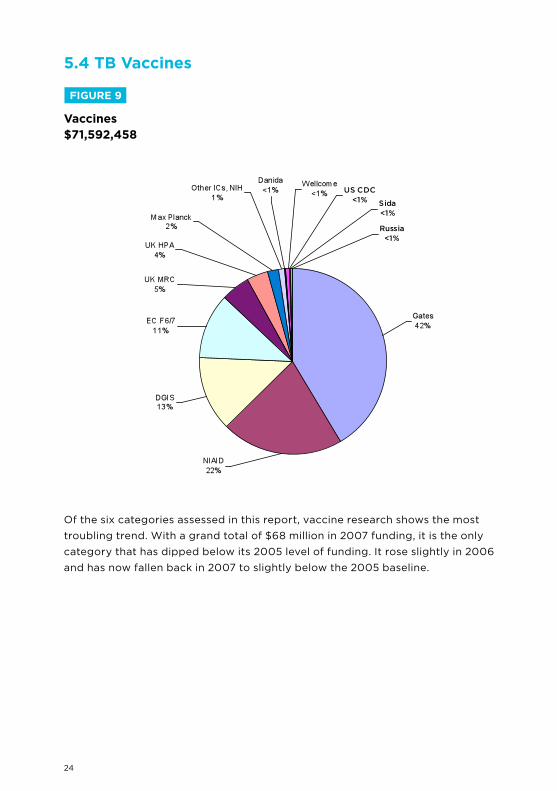
5.4 TB Vaccines
of the six categories assessed in this report, vaccine research shows the most
troubling trend. With a grand total of $68 million in 2007 funding, it is the only
category that has dipped below its 2005 level of funding. it rose slightly in 2006
and has now fallen back in 2007 to slightly below the 2005 baseline.
fIguRe 9
Vaccines$71,592,458
25
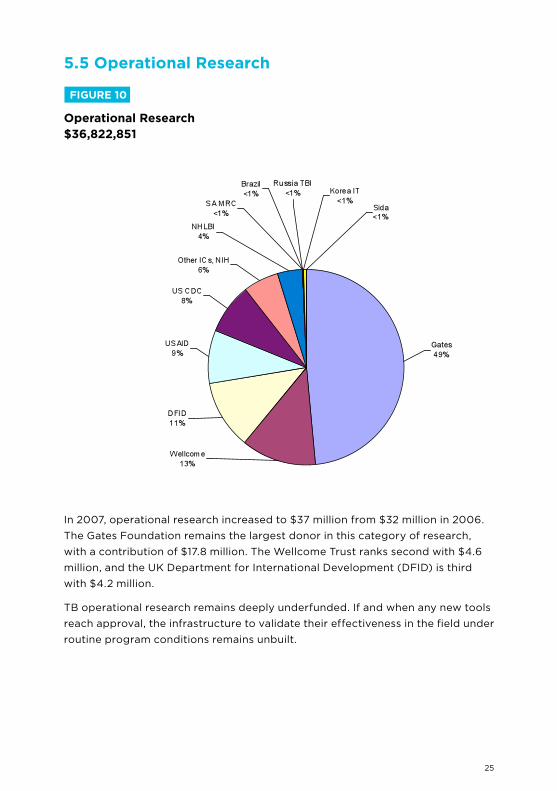
5.5 Operational Research
in 2007, operational research increased to $37 million from $32 million in 2006.
the Gates Foundation remains the largest donor in this category of research,
with a contribution of $17.8 million. the Wellcome trust ranks second with $4.6
million, and the uk department for international development (dFid) is third
with $4.2 million.
tb operational research remains deeply underfunded. if and when any new tools
reach approval, the infrastructure to validate their effectiveness in the field under
routine program conditions remains unbuilt.
fIguRe 10
Operational Research$36,822,851
26
6.1 Conclusions
Although tb is the most common curable infectious cause of death worldwide,
tb R&d remains an underresourced backwater, with only sluggish growth
registering in the years from 2005 to 2007. despite the release of The Global
Plan to Stop TB 2006–2015 and the outbreak of XdR-tb in kwaZulu-Natal in
2006, the world’s leading public research funding agencies have been slow to
increase their investments in tb R&d. it is to be expected that public agencies
would be slow to increase spending (and there is a danger that the current
economic climate will further blunt growth), yet the world’s leading public
research funding agencies have also not risen to the challenge of massively
increasing support for tb R&d.
though public R&d funding has not increased substantially, some public
international development agencies, such as the Ec Frameworks 6 and 7, the
Netherlands dGiS, uSAid, and irish Aid, have made substantial new investments
in tb R&d. the overall performance by the rich organization for Economic
co-operation and development countries, however, remains disappointingly
inadequate.
We have found some developing countries increasing their support for tb R&d,
but reporting is patchy and inconsistent. We hope that this area will be one of
major growth in the coming years, particularly as china, india, Russia, brazil,
thailand, and South Africa report new tb R&d activity.
the Gates Foundation and the Wellcome trust remain the only significant
philanthropic supporters of tb R&d, with growth in the Gates Foundation’s
support largely responsible for the overall increase in tb R&d spending since
2005. However, as noted above, there may be a disturbing trend in play if
the presence of a single large funder tends to displace or discourage other
foundation support. it would ultimately be unhealthy for tb research if too few
players take responsibility while too many turn away.
Some industry entities are now making a significant effort in tb, particularly
in drug discovery. the much greater involvement of otsuka, Novartis, Eli Lilly,
AstraZeneca, Sequella, Statens Serum institute, company X, and company
Y provides a ray of hope that more companies will enter this space of unmet
medical need with the potential to save millions of lives.
6. conclusions & Recommendations
27
6.2 Recommendations
tAG remains committed to our original goal of encouraging research funders
to increase their investments in tb R&d fourfold, to $2 billion per year, as the
minimum necessary to underwrite the science that will lead to tb no longer
being a significant public health threat by the year 2050. At current rates this
goal is not one of science but of science fiction. the continuing failure to fund
tb R&d at adequate levels, along with the continuing inadequacy of tb control
programs worldwide, condemns tens of millions of people to unnecessary
suffering and death over the next four decades. it is time to change that.
* * *
28
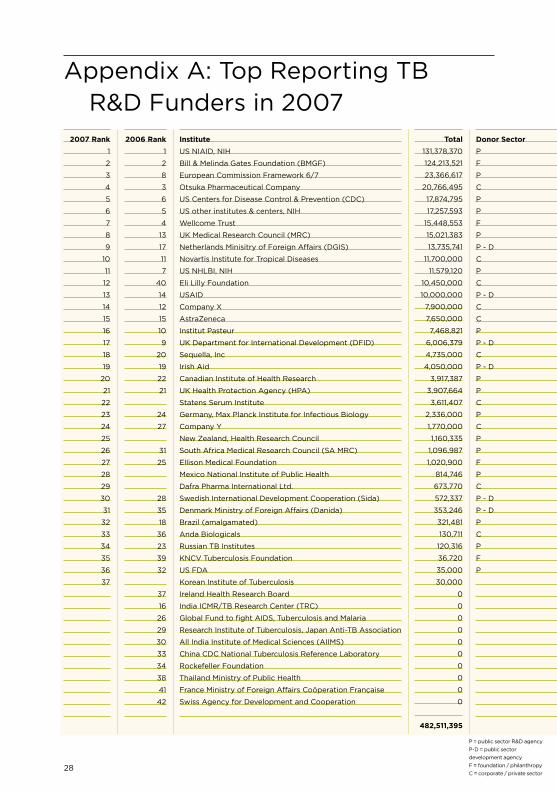
Institute
uS NiAid, NiH
bill & Melinda Gates Foundation (bMGF)
European commission Framework 6/7
otsuka pharmaceutical company
uS centers for disease control & prevention (cdc)
uS other institutes & centers, NiH
Wellcome trust
uk Medical Research council (MRc)
Netherlands Minisitry of Foreign Affairs (dGiS)
Novartis institute for tropical diseases
uS NHLbi, NiH
Eli Lilly Foundation
uSAid
company X
AstraZeneca
institut pasteur
uk department for international development (dFid)
Sequella, inc
irish Aid
canadian institute of Health Research
uk Health protection Agency (HpA)
Statens Serum institute
Germany, Max planck institute for infectious biology
company Y
New Zealand, Health Research council
South Africa Medical Research council (SA MRc)
Ellison Medical Foundation
Mexico National institute of public Health
dafra pharma international Ltd.
Swedish international development cooperation (Sida)
denmark Ministry of Foreign Affairs (danida)
brazil (amalgamated)
Anda biologicals
Russian tb institutes
kNcV tuberculosis Foundation
uS FdA
korean institute of tuberculosis
ireland Health Research board
india icMR/tb Research center (tRc)
Global Fund to fight AidS, tuberculosis and Malaria
Research institute of tuberculosis, Japan Anti-tb Association
All india institute of Medical Sciences (AiiMS)
china cdc National tuberculosis Reference Laboratory
Rockefeller Foundation
thailand Ministry of public Health
France Ministry of Foreign Affairs coöperation Française
Swiss Agency for development and cooperation
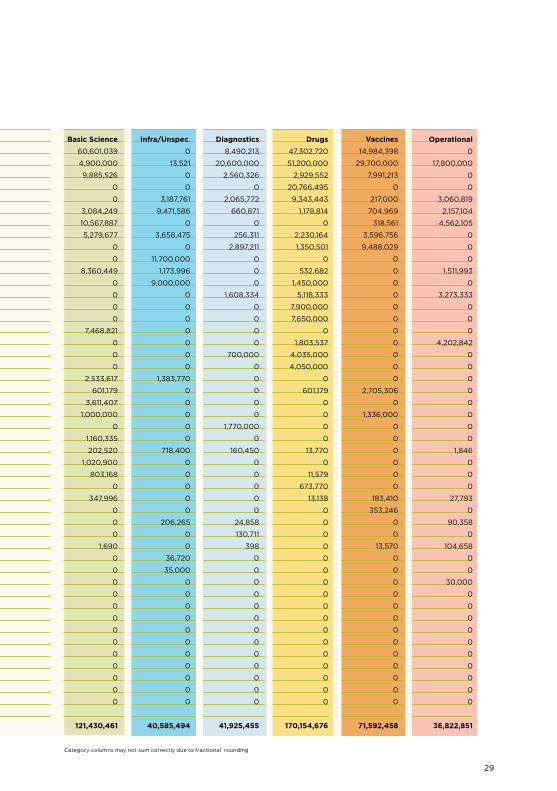
Appendix A: top Reporting tbR&d Funders in 2007
2007 Rank
1
2
3
4
5
6
7
8
9
10
11
12
13
14
15
16
17
18
19
20
21
22
23
24
25
26
27
28
29
30
31
32
33
34
35
36
37
2006 Rank
1
2
8
3
6
5
4
13
17
11
7
40
14
12
15
10
9
20
19
22
21
24
27
31
25
28
35
18
36
23
39
32
37
16
26
29
30
33
34
38
41
42
Total
131,378,370
124,213,521
23,366,617
20,766,495
17,874,795
17,257,593
15,448,553
15,021,383
13,735,741
11,700,000
11,579,120
10,450,000
10,000,000
7,900,000
7,650,000
7,468,821
6,006,379
4,735,000
4,050,000
3,917,387
3,907,664
3,611,407
2,336,000
1,770,000
1,160,335
1,096,987
1,020,900
814,746
673,770
572,337
353,246
321,481
130,711
120,316
36,720
35,000
30,000
0
0
0
0
0
0
0
0
0
0
482,511,395
Donor Sector
p
F
p
c
p
p
F
p
p - d
c
p
c
p - d
c
c
p
p - d
c
p - d
p
p
c
p
c
p
p
F
p
c
p - d
p - d
p
c
p
F
p
p = public sector R&d agency
p-d = public sector
development agency
F = foundation / philanthropy
c = corporate / private sector
29
Appendix A: top Reporting tbR&d Funders in 2007
Donor Sector
p
F
p
c
p
p
F
p
p - d
c
p
c
p - d
c
c
p
p - d
c
p - d
p
p
c
p
c
p
p
F
p
c
p - d
p - d
p
c
p
F
p
Basic Science
60,601,039
4,900,000
9,885,526
0
0
3,084,249
10,567,887
5,279,677
0
0
8,360,449
0
0
0
0
7,468,821
0
0
0
2,533,617
601,179
3,611,407
1,000,000
0
1,160,335
202,520
1,020,900
803,168
0
347,996
0
0
0
1,690
0
0
0
0
0
0
0
0
0
0
0
0
0
121,430,461
Infra/unspec.
0
13,521
0
0
3,187,761
9,471,586
0
3,658,475
0
11,700,000
1,173,996
9,000,000
0
0
0
0
0
0
0
1,383,770
0
0
0
0
0
718,400
0
0
0
0
0
206,265
0
0
36,720
35,000
0
0
0
0
0
0
0
0
0
0
0
40,585,494
Diagnostics
8,490,213
20,600,000
2,560,326
0
2,065,772
660,871
0
256,311
2,897,211
0
0
0
1,608,334
0
0
0
0
700,000
0
0
0
0
0
1,770,000
0
160,450
0
0
0
0
0
24,858
130,711
398
0
0
0
0
0
0
0
0
0
0
0
0
0
41,925,455
Drugs
47,302,720
51,200,000
2,929,552
20,766,495
9,343,443
1,178,814
0
2,230,164
1,350,501
0
532,682
1,450,000
5,118,333
7,900,000
7,650,000
0
1,803,537
4,035,000
4,050,000
0
601,179
0
0
0
0
13,770
0
11,579
673,770
13,138
0
0
0
0
0
0
0
0
0
0
0
0
0
0
0
0
0
170,154,676
Vaccines
14,984,398
29,700,000
7,991,213
0
217,000
704,969
318,561
3,596,756
9,488,029
0
0
0
0
0
0
0
0
0
0
0
2,705,306
0
1,336,000
0
0
0
0
0
0
183,410
353,246
0
0
13,570
0
0
0
0
0
0
0
0
0
0
0
0
0
71,592,458
Operational
0
17,800,000
0
0
3,060,819
2,157,104
4,562,105
0
0
0
1,511,993
0
3,273,333
0
0
0
4,202,842
0
0
0
0
0
0
0
0
1,846
0
0
0
27,793
0
90,358
0
104,658
0
0
30,000
0
0
0
0
0
0
0
0
0
0
36,822,851
category columns may not sum correctly due to fractional rounding
30
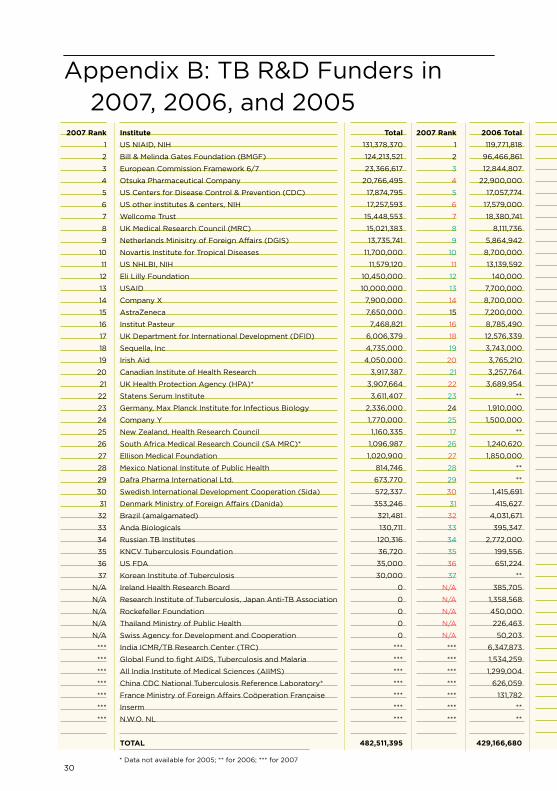
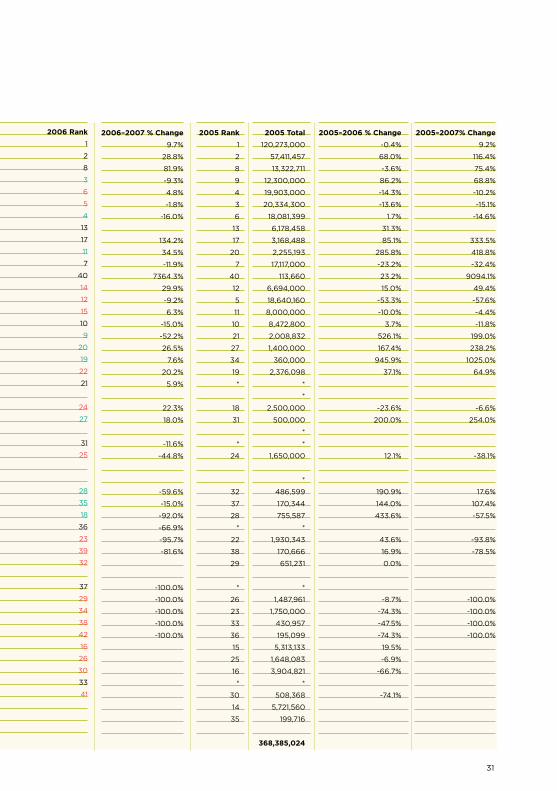
Appendix b: tb R&d Funders in2007, 2006, and 2005
Institute
uS NiAid, NiH
bill & Melinda Gates Foundation (bMGF)
European commission Framework 6/7
otsuka pharmaceutical company
uS centers for disease control & prevention (cdc)
uS other institutes & centers, NiH
Wellcome trust
uk Medical Research council (MRc)
Netherlands Minisitry of Foreign Affairs (dGiS)
Novartis institute for tropical diseases
uS NHLbi, NiH
Eli Lilly Foundation
uSAid
company X
AstraZeneca
institut pasteur
uk department for international development (dFid)
Sequella, inc
irish Aid
canadian institute of Health Research
uk Health protection Agency (HpA)*
Statens Serum institute
Germany, Max planck institute for infectious biology
company Y
New Zealand, Health Research council
South Africa Medical Research council (SA MRc)*
Ellison Medical Foundation
Mexico National institute of public Health
dafra pharma international Ltd.
Swedish international development cooperation (Sida)
denmark Ministry of Foreign Affairs (danida)
brazil (amalgamated)
Anda biologicals
Russian tb institutes
kNcV tuberculosis Foundation
uS FdA
korean institute of tuberculosis
ireland Health Research board
Research institute of tuberculosis, Japan Anti-tb Association
Rockefeller Foundation
thailand Ministry of public Health
Swiss Agency for development and cooperation
india icMR/tb Research center (tRc)
Global Fund to fight AidS, tuberculosis and Malaria
All india institute of Medical Sciences (AiiMS)
china cdc National tuberculosis Reference Laboratory*
France Ministry of Foreign Affairs coöperation Française
inserm
N.W.o. NL
TOTAL
2007 Rank
1
2
3
4
5
6
7
8
9
10
11
12
13
14
15
16
17
18
19
20
21
22
23
24
25
26
27
28
29
30
31
32
33
34
35
36
37
N/A
N/A
N/A
N/A
N/A
***
***
***
***
***
***
***
Total
131,378,370
124,213,521
23,366,617
20,766,495
17,874,795
17,257,593
15,448,553
15,021,383
13,735,741
11,700,000
11,579,120
10,450,000
10,000,000
7,900,000
7,650,000
7,468,821
6,006,379
4,735,000
4,050,000
3,917,387
3,907,664
3,611,407
2,336,000
1,770,000
1,160,335
1,096,987
1,020,900
814,746
673,770
572,337
353,246
321,481
130,711
120,316
36,720
35,000
30,000
0
0
0
0
0
***
***
***
***
***
***
***
482,511,395
2007 Rank
1
2
3
4
5
6
7
8
9
10
11
12
13
14
15
16
18
19
20
21
22
23
24
25
17
26
27
28
29
30
31
32
33
34
35
36
37
N/A
N/A
N/A
N/A
N/A
***
***
***
***
***
***
***
2006 Total
119,771,818
96,466,861
12,844,807
22,900,000
17,057,774
17,579,000
18,380,741
8,111,736
5,864,942
8,700,000
13,139,592
140,000
7,700,000
8,700,000
7,200,000
8,785,490
12,576,339
3,743,000
3,765,210
3,257,764
3,689,954
**
1,910,000
1,500,000
**
1,240,620
1,850,000
**
**
1,415,691
415,627
4,031,671
395,347
2,772,000
199,556
651,224
**
385,705
1,358,568
450,000
226,463
50,203
6,347,873
1,534,259
1,299,004
626,059
131,782
**
**
429,166,680
2006 Rank
1
2
8
3
6
5
4
13
17
11
7
40
14
12
15
10
9
20
19
22
21
24
27
31
25
28
35
18
36
23
39
32
37
29
34
38
42
16
26
30
33
41
* data not available for 2005; ** for 2006; *** for 2007
31
2006–2007 % Change
9.7%
28.8%
81.9%
-9.3%
4.8%
-1.8%
-16.0%
134.2%
34.5%
-11.9%
7364.3%
29.9%
-9.2%
6.3%
-15.0%
-52.2%
26.5%
7.6%
20.2%
5.9%
22.3%
18.0%
-11.6%
-44.8%
-59.6%
-15.0%
-92.0%
-66.9%
-95.7%
-81.6%
-100.0%
-100.0%
-100.0%
-100.0%
-100.0%
2005 Rank
1
2
8
9
4
3
6
13
17
20
7
40
12
5
11
10
21
27
34
19
*
18
31
*
24
32
37
28
*
22
38
29
*
26
23
33
36
15
25
16
*
30
14
35
2005 Total
120,273,000
57,411,457
13,322,711
12,300,000
19,903,000
20,334,300
18,081,399
6,178,458
3,168,488
2,255,193
17,117,000
113,660
6,694,000
18,640,160
8,000,000
8,472,800
2,008,832
1,400,000
360,000
2,376,098
*
*
2,500,000
500,000
*
*
1,650,000
*
486,599
170,344
755,587
*
1,930,343
170,666
651,231
*
1,487,961
1,750,000
430,957
195,099
5,313,133
1,648,083
3,904,821
*
508,368
5,721,560
199,716
368,385,024
2005–2006 % Change
-0.4%
68.0%
-3.6%
86.2%
-14.3%
-13.6%
1.7%
31.3%
85.1%
285.8%
-23.2%
23.2%
15.0%
-53.3%
-10.0%
3.7%
526.1%
167.4%
945.9%
37.1%
-23.6%
200.0%
12.1%
190.9%
144.0%
433.6%
43.6%
16.9%
0.0%
-8.7%
-74.3%
-47.5%
-74.3%
19.5%
-6.9%
-66.7%
-74.1%
2005–2007% Change
9.2%
116.4%
75.4%
68.8%
-10.2%
-15.1%
-14.6%
333.5%
418.8%
-32.4%
9094.1%
49.4%
-57.6%
-4.4%
-11.8%
199.0%
238.2%
1025.0%
64.9%
-6.6%
254.0%
-38.1%
17.6%
107.4%
-57.5%
-93.8%
-78.5%
-100.0%
-100.0%
-100.0%
-100.0%
2006 Rank
1
2
8
3
6
5
4
13
17
11
7
40
14
12
15
10
9
20
19
22
21
24
27
31
25
28
35
18
36
23
39
32
37
29
34
38
42
16
26
30
33
41

32
References
Feuer c. tuberculosis Research & development: A critical Analysis. Syed J,
Harrington M, Huff b, eds. New York, treatment Action Group, July 2008
33
AckNoWLEdGMENtS
thanks to all the tb R&d donors who provided information, to the bill & Melinda Gates Foundation for supporting treatment Action Group’s tb/HiV Advocacy project, including this report, and to tAG’s board of directors, staff, consultants, and supporters who motivate and enable our work.
About tAG
treatment Action Group is an independent AidS research and policy think tank fighting for better treatment, a vaccine, and a cure for AidS. tAG works to ensure that all people with HiV receive lifesaving treatment, care, and information. We are science-based treatment activists working to expand and accelerate vital research and effective community engagement with research and policy institutions. tAG catalyzes open collective action by all affected communities, scientists, and policy makers to end AidS.
tb/HiV pRoJEct
the treatment Action Group’s tb/HiV project works to strengthen global advocacy to improve research, programs, and policy for people with tb and HiV.
iSbN-13: 978-0-9791073-9-9iSbN-10: 0-9791073-9-3
coNtAct tAG
treatment Action Group611 broadway, Suite 308New York, NY 10012 uSA+ 1 212 253 7922 – t+ 1 212.253.7923 – [email protected]
© 2009 by treatment Action Group
May be copied with attribution for
noncommercial use.
34
Treatment Action group
611 broadway, Suite 308
New York, NY 10012
tel 212 253 7922
Fax 212 253 7923
www.treatmentactiongroup.org
iSbN-13: 978-0-9791073-9-9iSbN-10: 0-9791073-9-3