Embed Size (px)
Citation preview

1
����������� ����������
Project Duration: Aug 03 - Aug 04

2
3
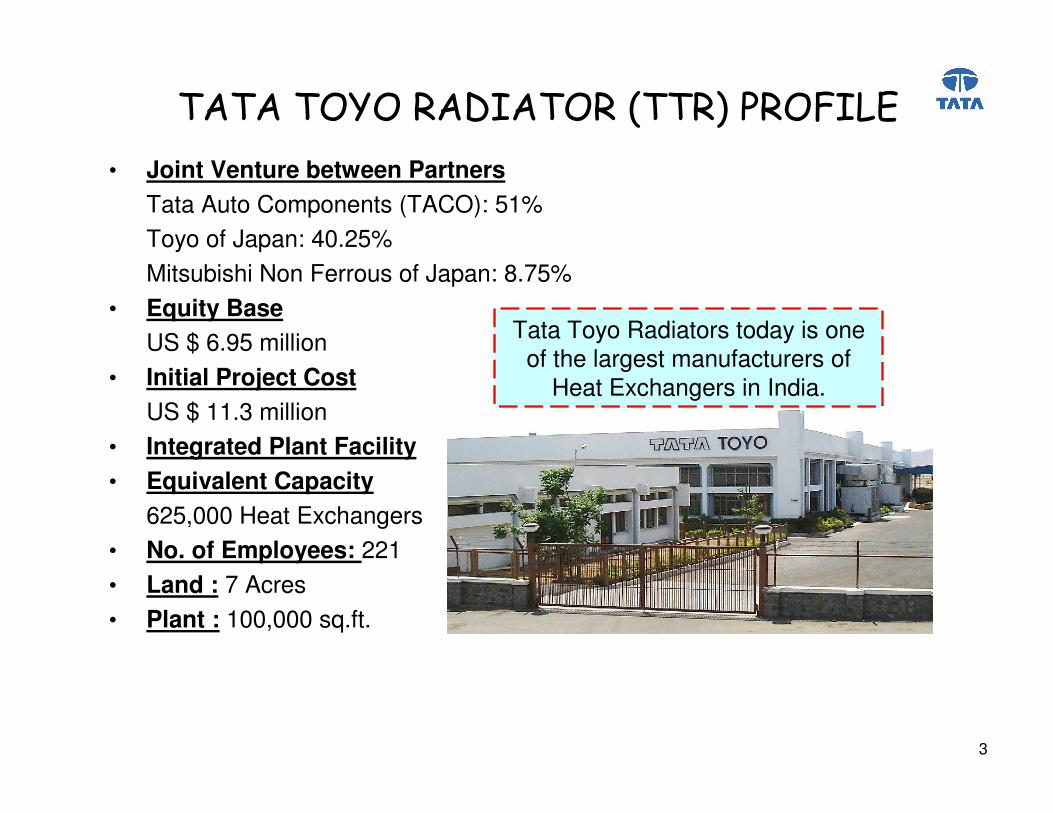
• Joint Venture between PartnersTata Auto Components (TACO): 51%Toyo of Japan: 40.25%Mitsubishi Non Ferrous of Japan: 8.75%
• Equity BaseUS $ 6.95 million
• Initial Project CostUS $ 11.3 million
• Integrated Plant Facility• Equivalent Capacity
625,000 Heat Exchangers• No. of Employees: 221• Land : 7 Acres• Plant : 100,000 sq.ft.
� � � � �� � �� ��� � �� � � ���� � ������ ����
Tata Toyo Radiators today is one of the largest manufacturers of
Heat Exchangers in India.

4
• Integrated Plant Facility
Press, Tube Mill, Fin Forming, Degreasing,
Core Assembly, Brazing Oven, Tank Clinching &
Leak Testing
• Products
Aluminum Brazed Radiator, Intercooler,
Heater Core, Condenser
��� � � �� �� ��� ����� ���

5
Acknowledgements������� ��
This report presents the work done by the team for reducing energy consumption and improving brazing oven productivity.
Energy conservation has been an integral effort for Tata Toyo Radiators (TTR) since its inception in 1998. This Six Sigma project, undertaken in 2003-04, assisted in channeling the efforts of team members through astructured and systematic data driven approach for enhancing productivity, planning, and energy planning.
We would like thank our management champion, Mr. R. Sundar, CEO, for providing us guidance and support for moving this project forward. We would also like to express our thanks to Mr. A. Alur & Mr. R. Shete. Our special thanks to the technical advisors of Toyo Radiators, Japan, and also to the management and the board members of Tata Auto Comp Systems (TACO), the parent company of TTR, for supporting the Six Sigma movement in TTR.
6
Summary of Project Achievements � ��� � !�������� ��
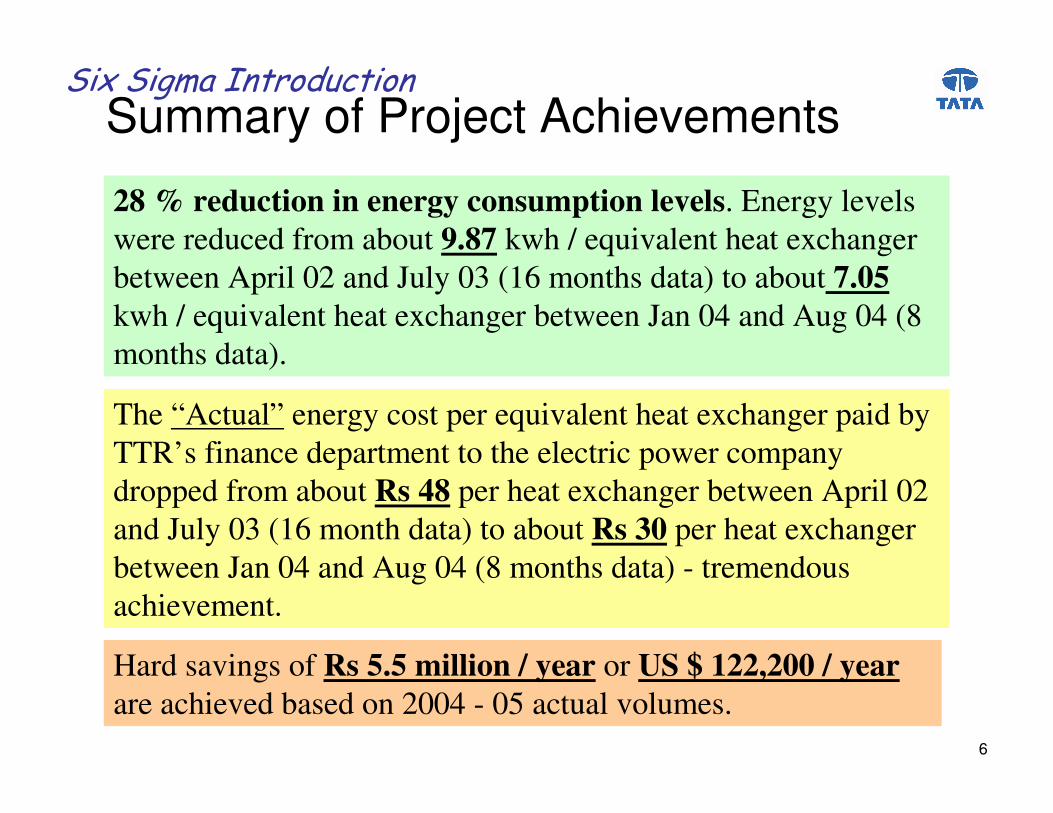
28 % reduction in energy consumption levels. Energy levels were reduced from about 9.87 kwh / equivalent heat exchanger between April 02 and July 03 (16 months data) to about 7.05kwh / equivalent heat exchanger between Jan 04 and Aug 04 (8 months data).
Hard savings of Rs 5.5 million / year or US $ 122,200 / yearare achieved based on 2004 - 05 actual volumes.
The “Actual” energy cost per equivalent heat exchanger paid by TTR’s finance department to the electric power company dropped from about Rs 48 per heat exchanger between April 02 and July 03 (16 month data) to about Rs 30 per heat exchanger between Jan 04 and Aug 04 (8 months data) - tremendous achievement.

7
Summary of Project Achievements
Productivity Improvement:
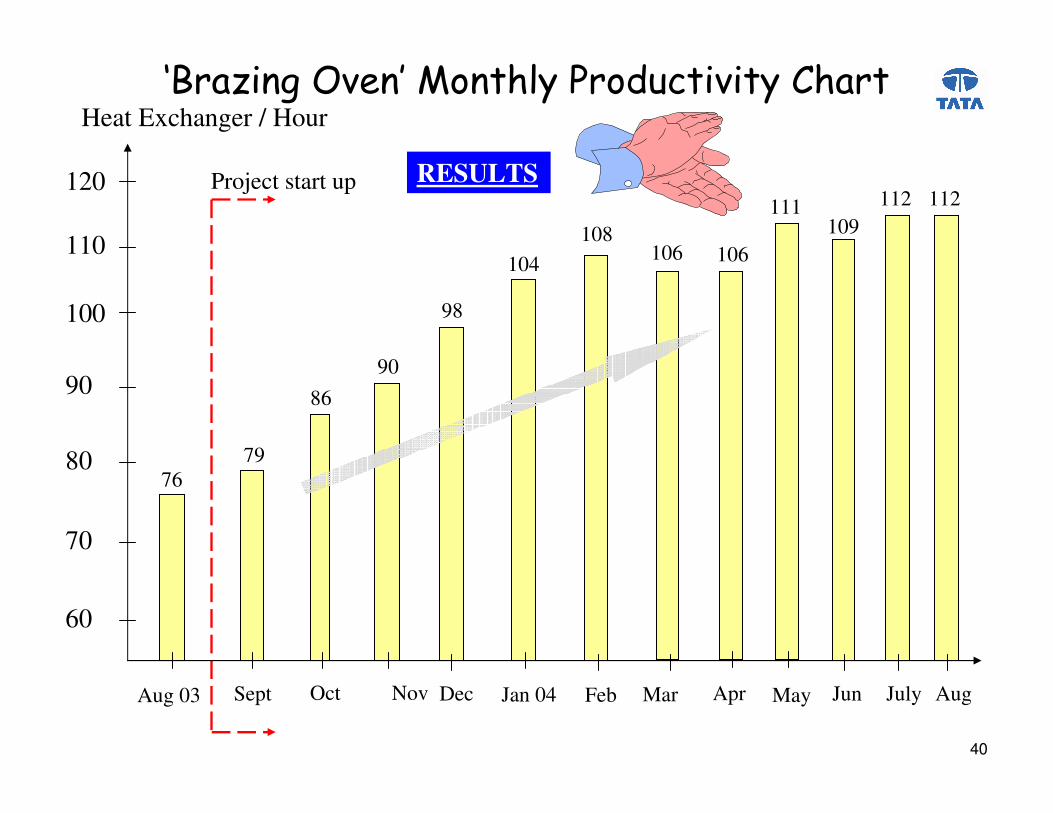
Brazing oven productivity increased 42 % from 76 equivalent heat exchangers in July / Aug 03 to 108equivalent heat exchangers in Jan to Aug 04.
� ��� � !�������� ��
8
��������� �" � � ��
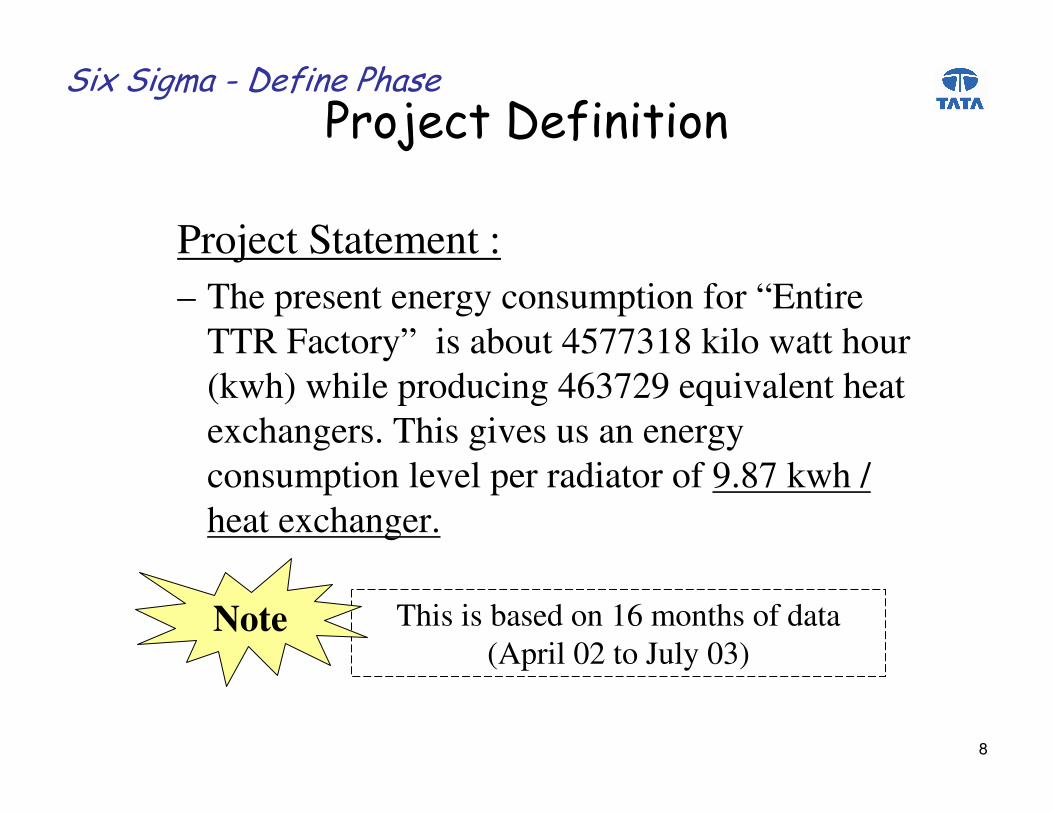
Project Statement :– The present energy consumption for “Entire
TTR Factory” is about 4577318 kilo watt hour (kwh) while producing 463729 equivalent heat exchangers. This gives us an energy consumption level per radiator of 9.87 kwh / heat exchanger.
This is based on 16 months of data (April 02 to July 03)
Note
� ��� � !�# � �" ����$!%�
9
��������� �" � � ��&&&
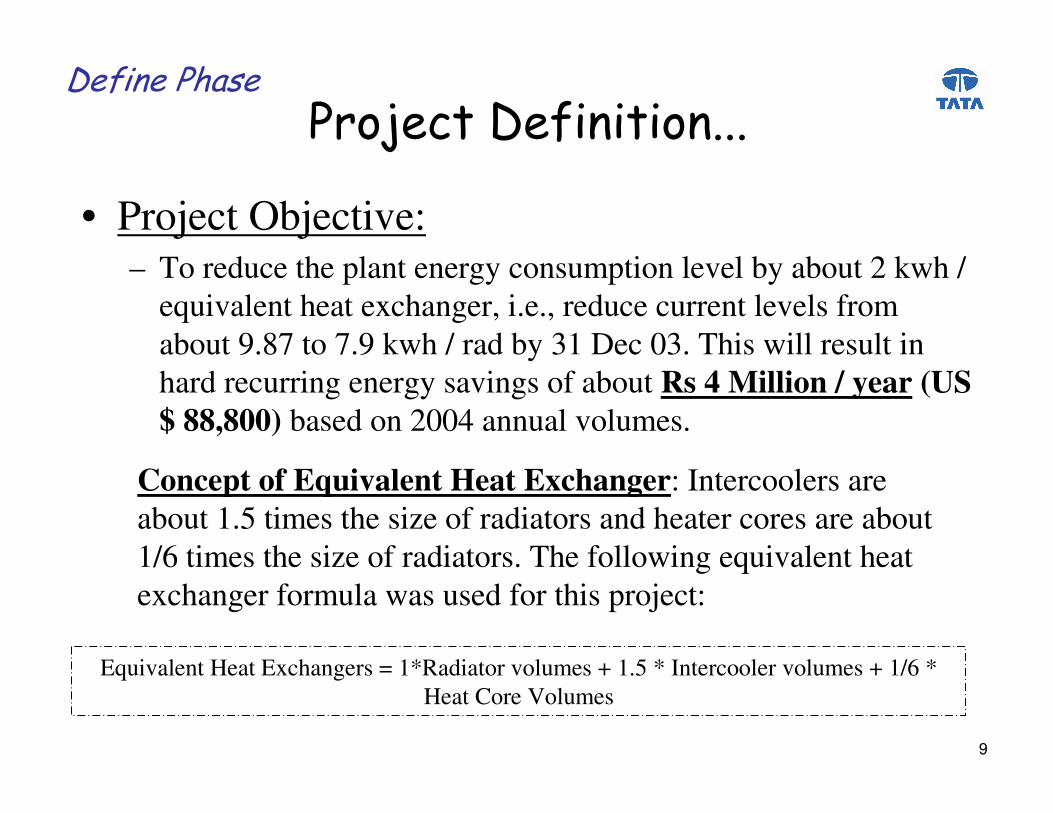
• Project Objective:– To reduce the plant energy consumption level by about 2 kwh /
equivalent heat exchanger, i.e., reduce current levels from about 9.87 to 7.9 kwh / rad by 31 Dec 03. This will result in hard recurring energy savings of about Rs 4 Million / year (US $ 88,800) based on 2004 annual volumes.
Equivalent Heat Exchangers = 1*Radiator volumes + 1.5 * Intercooler volumes + 1/6 * Heat Core Volumes
� �" ����$!%�
Concept of Equivalent Heat Exchanger: Intercoolers are about 1.5 times the size of radiators and heater cores are about1/6 times the size of radiators. The following equivalent heat exchanger formula was used for this project:

10
��������� �" � � ����' �!%����$!%��
02-03 Apr-Jul 03
9.829.9
Kwh /eq heat exchanger
9.0
9.5
10.0
8.5
8.0
7.5
Aug Sept Oct Nov Dec Jan 04 Feb Mar
Target: 7.9 Target: 7.9 KwhKwh / / radrad
Expected Savings of
RsRs. 4 . 4 Million / yrMillion / yr
Before Project DataEnergy Consumption between Apr 02 to Jul 03 is 9.87 Kwh / rad
11
��������� �" � � ��&&&
•• Expected Date to complete DMAI Phases: Expected Date to complete DMAI Phases: On / before 30 Nov 2003 On / before 30 Nov 2003
•• Expected Date to complete Control Phase: Expected Date to complete Control Phase: On / before 31 March 2004On / before 31 March 2004
A Team Commitment
� �" ����$!%�

12
Tube Mill Machine
Press 1 Press 2 Press 3
Fin Forming Machine
Plastic Tank & O Ring
( �!�����$!�����' !�"!��� ��������%%��)�* ��$!��
Testing
Tube weld Tube mill Cut to size
Degrease
Clinching
Fitment of drain plug, pressure
cap etc
Packaging and Dispatch
Leak Testing
Fin Forming Cut to size
Core Assembly
Brazing Area
Header Plate Core Support
� �" ����$!%�

13
�������� !�!���))��� ���+��� ��!%��� ,� )�# - )��./�
Brazing FDV
612000
123000
Kwh
600,000
Air Comp
Others
500,000
400,000
300,000
200,000
100,000
119700
Tube Mill
70320
Pump House
48180
Admin Bldg
27820
Fin Forming
26240
Press
20000
Pareto Analysis
� ��� � !�' �!%����$!%�
Main Focus Area:
Brazing Area
Secondary Focus Areas:
FDV (Ventilation System), Air Comp (Air Compressor), and Pump House
�!) +�!���������� ����%�* ���� �%�!))��!��0!� �%����% ,� ���,� ��%��%���+�)�* ��!�� �!%�� ���%�* �����!1���+��* ����� ,� )�!��- )��./

14
�����������%
Tata Toyo Radiators (TTR)
Brazing Area
Force Draft Ventilation
(FDV)
Air Compressor (Air Comp)
Tube Mill
Pump House
Admin Bldg Fin Forming Press
Tank Clinching and Leak Testing
IC
' ! ������������% ,� ���� ��!%�"���� � �
Based on Pareto Analysis, project will focus primarily on‘Brazing Area’ and secondarily on areas like FDV, Air Comp, Tube Mill and Pump House
15
' �!%����$!%�
� ,!������������ +���� 0�
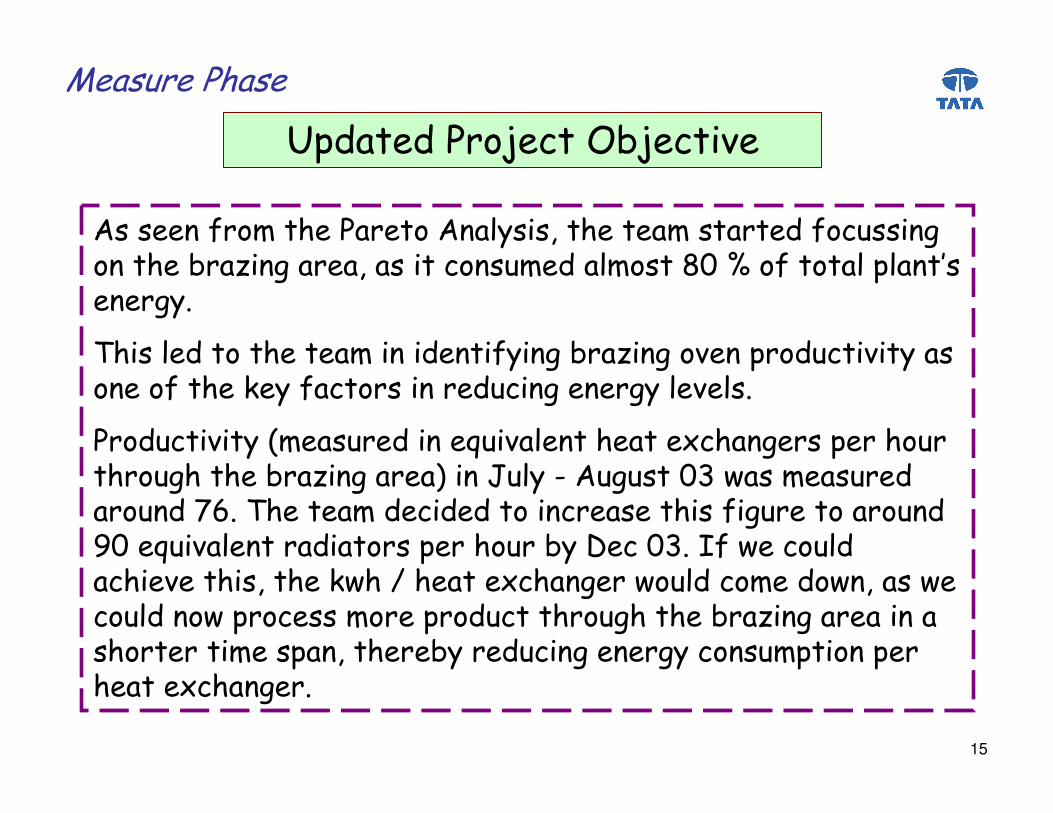
� %�%����"�� ��$���!������ �!)�% %2��$����! �%�!����"��%% �������$��+�!3 ���!��!2�!%� �����% ��!) �%��4.�5 ��"����!)�,)!��6%������&
� $ %�)������$����! � �� ��� "� ���+�!3 ����0���,���� 0 ���!%�����"��$��1���"!����%� ����� ����������)�0�)%&
����� 0 ���� �!%��� ���7 0!)����$�!�����$!����%�,���$����$���$��$��+�!3 ���!��!�� ��- )��# � �%��./�* !%� �!%���!����89&�� $����! ��� ����� ����!%���$ %�" �������!����:.��7 0!)�����! !���%�,���$���+��� ���./&��"�* ����)�!�$ �0���$ %2��$��1* $ ;�$�!�����$!�����* �)��� ���* �2�!%�* ����)���* �,����%%� ����,������$���$��$��+�!3 ���!��!� ��!�%$������� ��%,!�2��$���+����� �������������% ,� ���,���$�!�����$!����&�

16
' �!%����$!%�<=�"���>���������� !�!�
Plant Energy Levels
July – Aug 03
76
90
100
110
80
70
60
Target = 90
Brazing Area Productivity Levels
Productivity figures include change over times, however, exclude planned shut downs
02-03 Apr to July 03
9.82
Kwh / Equivalent Heat Exchangers
8.5
9.0
9.5
8.0
7.5
7.0
Target = 7.9
10.0 9.9
Kwh / Equivalent Heat Exchangers

17
=�!3 ���� ��!��)�* �� !��!
Burn Off Fluxing Dry Off 1 Dry Off 2
Brazing Oven Cooling Section
7.5 kw blower motor
12 heater, 10 kw each. Total = 120 kw load (t Deg C)
7.5 kw blower motor 7.5 kw blower motor
12 heater, 10 kw each. Total = 120 kw load
9 heater, 9 kw each. Total = 81 kw load
8 top and bottom zones. 8 Heaters = 360 kw.Varying from t1 to t2 Deg C
Product must reach T +/- T1 Deg C for minimum ‘x’ minutes
7.5 kw blower motor
7.5 kw exhaust system blower
� �!)�3���$!%�
The ‘Brazing Oven’ is the biggest source of energy consumption in the Brazing Area.

18
� ���� !)�? �* ��"��$��=�!3 ���� ��!� �!)�3���$!%�
Temp Zone 1
Temp Zone 2
Temp Zone 3
Brazing Oven Cooling Section
Burn Off, Fluxing and Dry Off
Start to Finish Length of the Brazing Area: 46 meters

19
� %� ����!%�%��@ %�• After many brainstorming sessions the team identified the
following causes for “High Energy Consumption” for the areas highlighted in the Pareto Analysis. Causes for “Lower Productivity in Brazing Area” were also brainstormed.
Wherever possible, the team attempted to quantify financial losses per individual causes. Simultaneously, counteractions for the causes were also brainstormed. Approximate costs for implementing counteractions were also discussed for management to take immediate decision.
� �!)�3���$!%�

20
� %���"�A����!%�%�!��������!�� ��%Area Causes & Losses in Rs
Million per yr Counteractions
Burnoff • Burnoff ‘ON’ during heater core brazing (Rs 0.314 M/yr)
• Inadequate utilization due to frequent temp / speed changes (Rs 0.214 M/yr)
• Shut off burnoff as last radiator exits before HC starts
• See “Brazing Oven” section
Fluxer • Fluxer ‘ON’ during heater core brazing (Rs 0.011 M/yr)
• Inadequate utilization due to frequent temp / speed changes (Rs 0.015 M/yr)
• Fluxer Breakdown (Rs 0.2 M/yr)
• Fluxer nozzle setting problem
(Rs 0.15 M/yr)
• Shut off burnoff as last radiator exits before HC starts
• See “Brazing Oven” section • Keep spare fluxer balls. Spare kit for
fluxer pump • Procure and install video camera in
the fluxer area to assist the loading operator
� ��� � !�# � �!)�3��;�� ,��0���$!%�
Detailed calculations for ‘financial losses’ are available
Note

21
Area Causes & Losses in Rs Million per yr
Counteractions
Dry Off • Inadequate utilization due to frequent temp / speed changes (Rs 0.4 M/yr)
• Air Blower not functioning properly (Rs 0.075 M/yr)
See “Brazing Oven” section • Procure bearing and other motor spares
Cooling Section
• Muffle between oven and cooling section has no insulation, causing heat loss
• Air blower remains
‘on’ during idle condition changes (Rs 0.03 M/yr)
• Insulate muffle • Modify current circuit
� �!)�3��;�� ,��0���$!%�
� %���"�A����!%�%�!��������!�� ��%
22
Area Causes & Losses in Rs Million per
yr
Counteractions
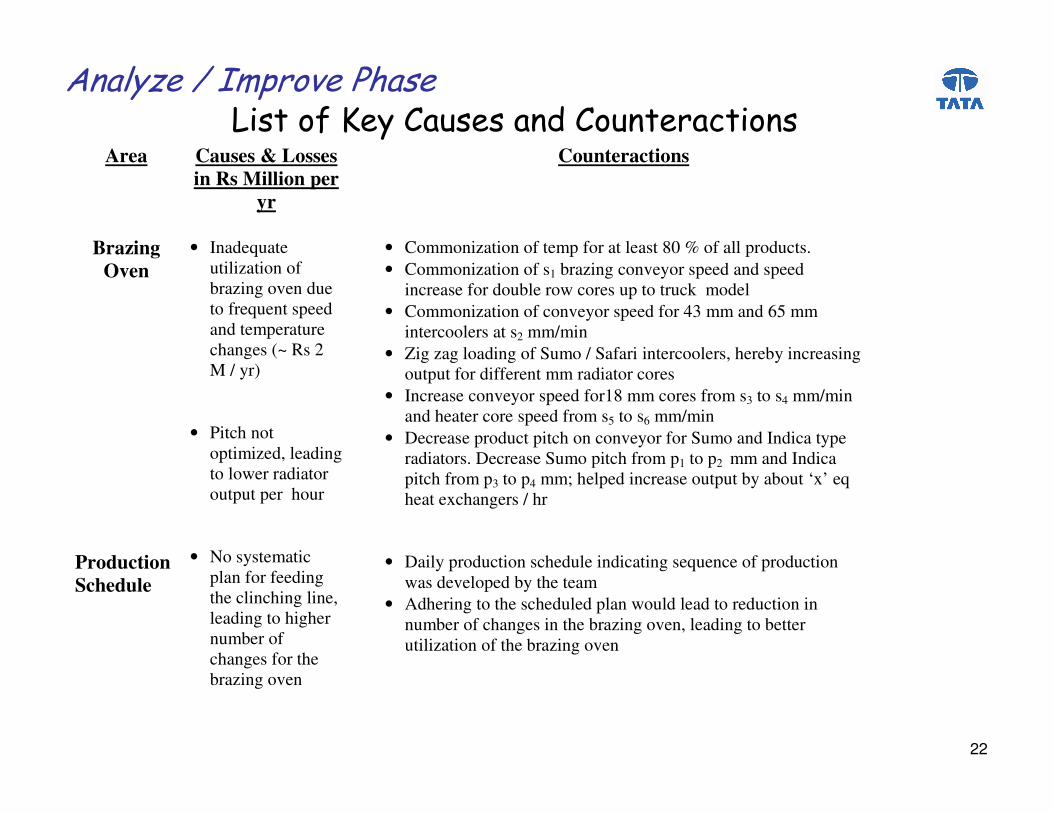
Brazing
Oven
Production Schedule
• Inadequate utilization of brazing oven due to frequent speed and temperature changes (~ Rs 2 M / yr)
• Pitch not
optimized, leading to lower radiator output per hour
• No systematic
plan for feeding the clinching line, leading to higher number of changes for the brazing oven
• Commonization of temp for at least 80 % of all products. • Commonization of s1 brazing conveyor speed and speed
increase for double row cores up to truck model • Commonization of conveyor speed for 43 mm and 65 mm
intercoolers at s2 mm/min • Zig zag loading of Sumo / Safari intercoolers, hereby increasing
output for different mm radiator cores • Increase conveyor speed for18 mm cores from s3 to s4 mm/min
and heater core speed from s5 to s6 mm/min • Decrease product pitch on conveyor for Sumo and Indica type
radiators. Decrease Sumo pitch from p1 to p2 mm and Indica pitch from p3 to p4 mm; helped increase output by about ‘x’ eq heat exchangers / hr
• Daily production schedule indicating sequence of production
was developed by the team • Adhering to the scheduled plan would lead to reduction in
number of changes in the brazing oven, leading to better utilization of the brazing oven
� �!)�3��;�� ,��0���$!%�� %���"�A����!%�%�!��������!�� ��%

23
Area Causes & Losses in Rs Million per yr
Counteractions
Brazing Area
• Brazing conveyor running at Sx mm/min during idle condition
• Core Band Shortages (Rs
0.49 M / yr)
• Reduced conveyor speed to Sy for idle condition reducing heat loss and switched off blower during non-brazing time (by introducing new electrical logic)
• Procured new core bands
Force Draft
Ventilation System (FDV)
• FDV does not have a cut off timer, thus many times FDV keeps running during the night also (when not actually needed) (Rs 0.16 M / yr)
• Exhaust fans do not start automatically after power failure
• Install 6 timers on FDV • Circuit modification
Employees • Employees’ involvement and awareness for energy conversation
• Generated operator awareness for energy / utility cost. Mr. Purandhare, an energy conservation expert, conducted “Energy Conservation Awareness” program for the factory on 15 Nov 03.
• Also the team initiated a poster campaign in TTR.
� �!)�3��;�� ,��0���$!%�� %���"�A����!%�%�!��������!�� ��%

24
Area Causes & Losses in Rs Million per yr
Counteractions
Air Comp • Press drop due to leakages in air comp line
• Due to inadequate brazing oven utilization, more use of comp air
• Fix leakages • Reduced brazing oven running hours. This
reduced load on air compressor, saving money
Core Assy & Clinching
Admin Building
• Hydraulic power packs remain “ON” during lunch and changeovers (Rs 0.17 M / yr)
• Electrical heating elements are
used to heat food in cafeteria
• Completed work instructions and conduct operator awareness session for shutting power packs during lunch, tea breaks, and dinner
• Install solar heating system
(payback period is about 8 months)
Pump House • Pumps operate continuously during no-production time as the pump switches are located far away from production area (for example tube mill area)
• Provided remote switches for tube mill pumps (near machine control board)
� �!)�3��;�� ,��0���$!%�
� %���"�A����!%�%�!��������!�� ��%
25
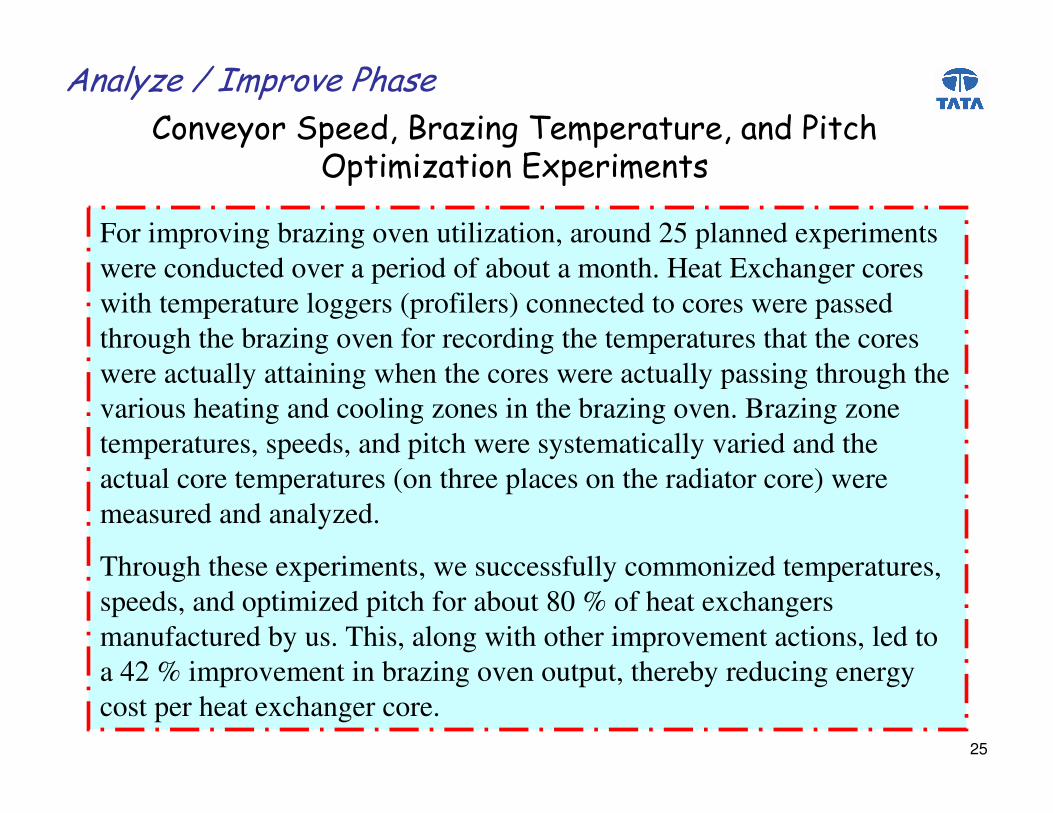
For improving brazing oven utilization, around 25 planned experiments were conducted over a period of about a month. Heat Exchanger cores with temperature loggers (profilers) connected to cores were passed through the brazing oven for recording the temperatures that the cores were actually attaining when the cores were actually passing through the various heating and cooling zones in the brazing oven. Brazing zone temperatures, speeds, and pitch were systematically varied and the actual core temperatures (on three places on the radiator core) were measured and analyzed.
Through these experiments, we successfully commonized temperatures, speeds, and optimized pitch for about 80 % of heat exchangers manufactured by us. This, along with other improvement actions, led to a 42 % improvement in brazing oven output, thereby reducing energy cost per heat exchanger core.
� �!)�3��;�� ,��0���$!%�
���0������ ,��2�=�!3 ���� � ,��!���2�!��� ��$��� ,� 3!� �����,�� ���%

26
=�!3 ���� � ,2����0������ ,��2�!��� ��$�� ,� 3!� �����,�� ���%
Radiator cores moving on the brazing oven conveyor just before entering the brazing oven
Speed of ConveyorRadiator Core
� ,��0���$!%�
Pitch

27
=�!3 ���� � ,2����0������ ,��2�!��� ��$�� ,� 3!� �����,�� ���%
Experimental Radiator core (with data logger) moving on the brazing oven conveyor just before entering the brazing oven
Speed of ConveyorRadiator Core
� ,��0���$!%�
PitchData Logger Insulation Box
Thermocouples attached to radiator core for recording brazing temp profile
Data Logger
Radiator Core Temperature Profile Analysis

28
� ,��0���$!%�
Radiator Temperature Profile (through Brazing Oven)
Temp Ramp Up
Temp Ramp Down
Temp Stabilization
�
���
���
���
���
���
���
���
00:0
0
00:4
1
01:2
2
02:0
3
02:4
4
03:2
5
04:0
6
04:4
7
05:2
8
06:0
9
06:5
0
07:3
1
08:1
2
08:5
3
09:3
4
10:1
5
10:5
6
11:3
7
12:1
8
12:5
9
13:4
0
14:2
1
15:0
2
15:4
3
16:2
4
17:0
5
17:4
6
18:2
7
19:0
8
19:4
9
20:3
0
21:1
1
21:5
2
22:3
3
TIME (MM:SS)
TEM
PE
RA
TUR
E
Channel 1Channel 2Channel 3
����,��,� ��!�����!%��%��$��!��!)�!�!�$!%�����+����%$�* �
Specifications:
T +/- t temp to be maintained for ‘x’ minutes in the brazing oven
29
The progress of the project action items was tracked through a detailed action item worksheet.
This action item work sheet was reviewed in the “Six Sigma CEO Review Meeting” held every 15 days during the course of the project. This meeting was very instrumental in giving direction to the project and helped the project move forward.
A Sample of the Action Item Work Sheet is shown on the next page...
� ,��0���$!%�
������!�� ��%�# � �� ������ �B ��1%$���

30
ENERGY PROJECT Main task/sub task Responsibility Support Start date End date
I.) Minimize Converyor Speed and Temp Changes Kiran SSK/MMK/SH 1-Oct 31-Octa.) Study different combinations of speed and temp settings for 1512 & Indica D. 1-Oct 31-Octb.) Validate study for other models also at the optimised settings 15-Novc.) Quantify benefits of the optimization study Kiran SSK/MMK/SH 15-Oct 31-Octd.) Standardize set up. Modify process sheets and work instructions 15-Oct 31-Oct
2.) Burnoff / Fluxer Shut Offa.) Shut Burn Off & Fluxer as last radiator exits before HC starts Sanjay AG 1-Oct 15-Octb.) Visual Control and Work Instructions Sanjay AG 1-Oct 31-Oct
3.) Order Spare Fluxer Balls a.) PO to be released Alur KPK / RS 15-Oct 1-Nov
4.) Spare Kit for Fluxer Pump a.) PO to be released Alur KPK / RS 15-Oct 1-Nov
5.) Install TV / Camera for Fluxer Monitoring Sanjay RNS 15-Oct 31-Oct
6.) Spares for 'Dry Off' Air Blowera.) Bearing, Air Blower, Motor Alur KPK / RS 15-Oct 5-Nov
7.) Procure Core Bandsa.) Finalize quantity required Alur KPK / RS 15-Oct 30-Novb.) PO release
� �� ������ �B ��1�� $������ �� ! ,)��
� ��� � !�# � ,��0���$!%�

31
New Circuit Breaker installed for switching off air blower during non-production hours of brazing oven.
� ��� � !�# � ,��0���$!%�
� ���� !)����%���!� ����"�� �$���� ,��0� ����� �� ��%
Cooling Section
Remote switch installed for the cooling water pumps (at tube mill control panel). Now the tube mill operator can shut the pumps during non-production hours due to this remote arrangement, saving energy.
Pump House

32
Solar water heating system installed for cafeteria (replacing the existing electrical heating system ) leading to energy savings (pay back period was only 8 months).
� ��� � !�# � ,��0���$!%�� ���� !)����%���!� ����"�� �$���� ,��0� ����� �� ��%
Fluxer Solar Heating System
TV monitor and video camera in fluxing area installed for assisting the brazing oven operator in real-time monitoring of the fluxing area. This helped reduce breakdown time thereby reducing energy during brazing oven ‘ON’ time.
33
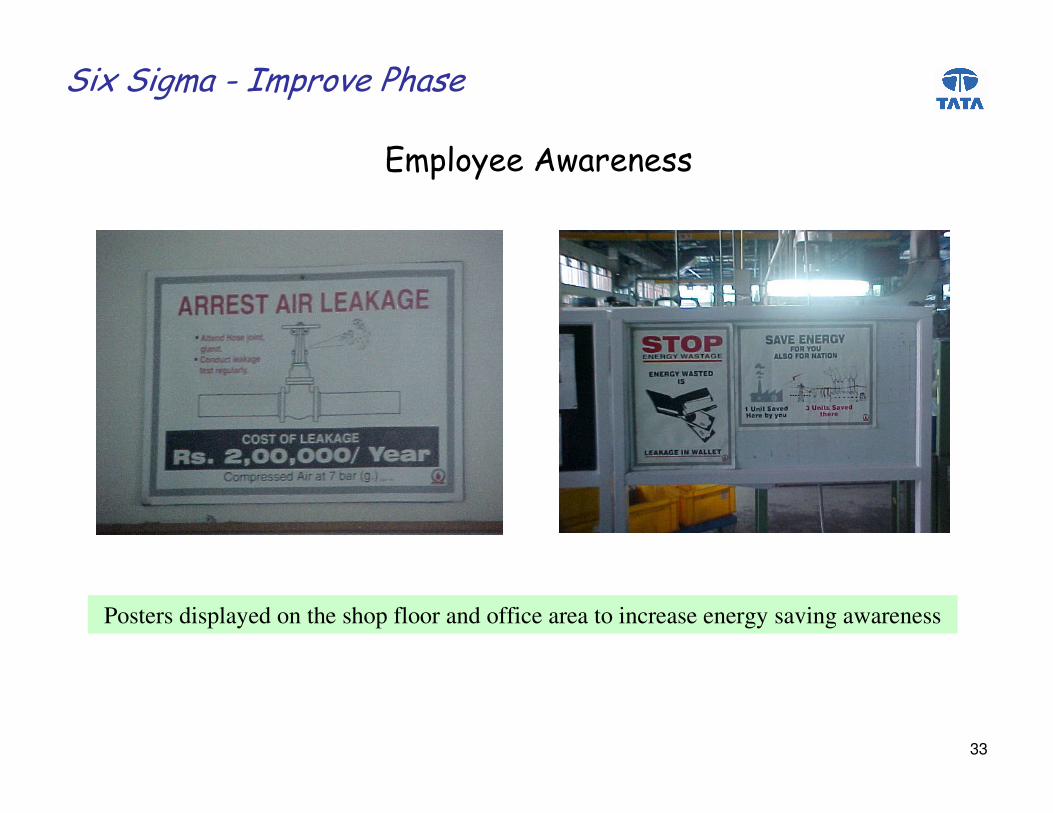
Posters displayed on the shop floor and office area to increase energy saving awareness
� ��� � !�# � ,��0���$!%�
� ,)������ * !����%%

34
C� ��!)6��������' ���$)��� !%$+�!�
02-03 Apr-Jul 03
9.829.9
Kwh / heat exchanger
9.0
9.5
8.5
8.0
7.5
Aug Sept Oct Nov Dec Jan 04
8.79
Project Start
Feb Mar
8.32 8.34
7.507.72
7.07.14
10.0
6.56.42
6.92
Apr
7.54
May
7.43
Jun
7.26
Jul
7.20
Aug 04
6.7
Target = 7.9 kwh / Eq Heat Exchanger
Control Phase
Before: 9.87 kwh / eq heat exchanger (Apr 02 through July 03 - 16 month data)
After: 7.05 kwh / eq heat exchanger (Jan 04 through Aug 04 - 8 month data)
28 % Reduction in Energy Levels
RESULTS
35
02-03 Apr-Jul 03
48.5647.17
Rs / heat exchanger
42
45
39
36
33
Aug Sept Oct Nov Dec Jan 04
40.48
Project Start
Feb Mar
37.02
47.19
33.9
28.0530
27.07
48
27
29.44 28.9
Apr
34.67
May
31.5
Jun
31.2
Jul
27.63
Aug 04
27.62
Control Phase
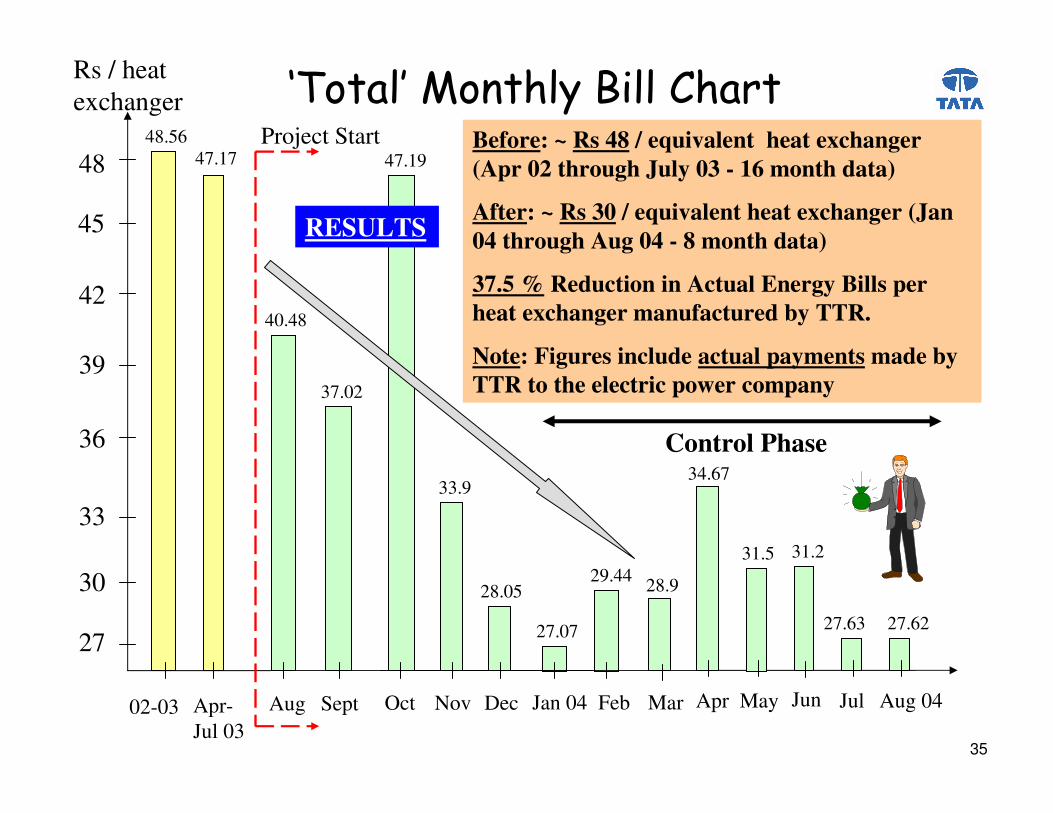
Before: ~ Rs 48 / equivalent heat exchanger (Apr 02 through July 03 - 16 month data)
After: ~ Rs 30 / equivalent heat exchanger (Jan 04 through Aug 04 - 8 month data)
37.5 % Reduction in Actual Energy Bills per heat exchanger manufactured by TTR.
Note: Figures include actual payments made by TTR to the electric power company
C� ��!)6�' ���$)��= ))��$!��
RESULTS

36
C= �!3 ���� ��!6��������' ���$)���$!��
02-03 Apr-Jul 03
4.45
4.64
Kwh / heat exchanger
4.3
4.5
4.1
3.9
3.7
Aug Sept Oct Nov Dec Jan 04
4.37
Project Start
Feb Mar
4.28
4.16
3.98
3.5
3.81
4.7
3.3 3.243.32
Apr
3.45
May
3.58
Jun
3.56
Jul
3.51
Aug 04
3.37
Before: 4.52 kwh / eq heat exchanger (Apr 02 through July 03 - 16 month data)
After: 3.47 kwh / eq heat exchanger (Jan 04 through Aug 04 - 8 month data)
23 % Reduction in Energy Levels
RESULTS
4.10

37
02 - 03 Apr - Jul 03
0.82
0.92
0.7
0.9
1.1
0.5
0.3
0.1
Project start up
C� ���� ,��%%��6���������$!��Kwh / heat exchanger
Jan – Apr 04
0.41
May – Aug 04
0.39
Before: 0.85 kwh / eq heat exchanger (Apr 02 through July 03 - 16 month data)
After: 0.40 kwh / eq heat exchanger (Jan 04 through Aug 04 - 8 month data)
53 % Reduction in Energy Levels
RESULTS
38
02 - 03 Apr - Jul 03
0.54
0.94
0.7
0.9
1.1
0.5
0.3
0.1
Project start up
C? ��� )!� ���� �%�� 6���������$!��Kwh / heat exchanger
Jan – Apr 04
0.39
May – Aug 04
0.49
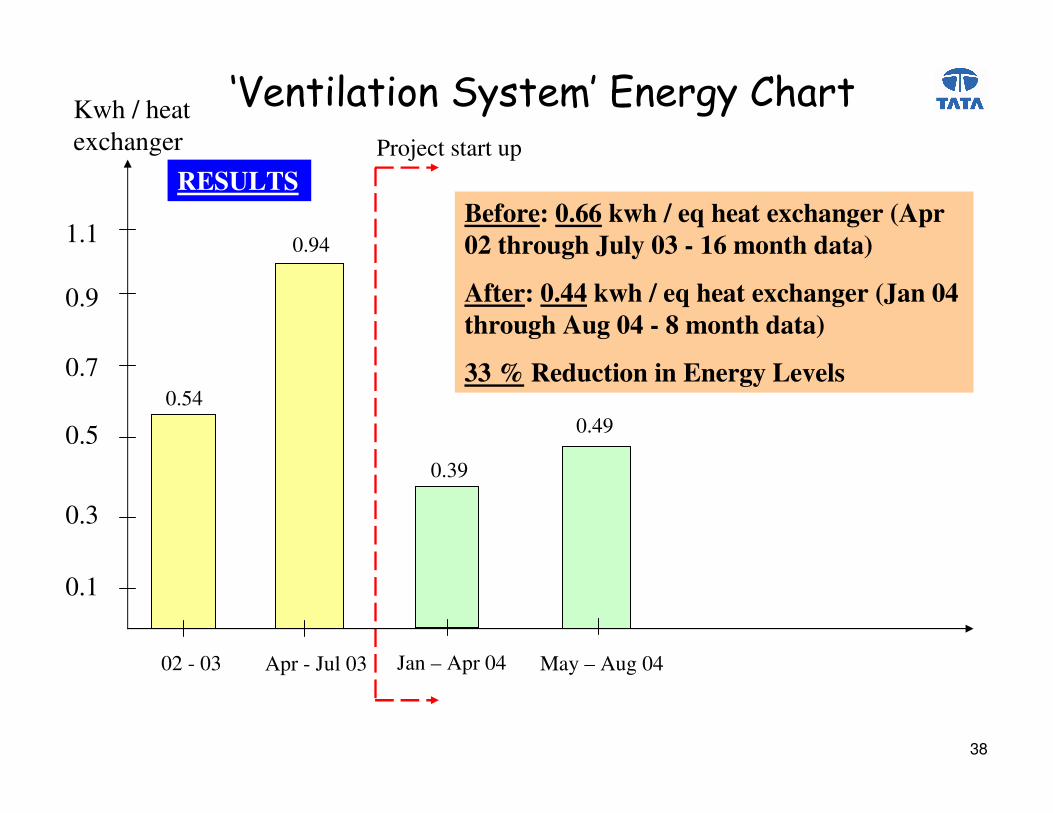
Before: 0.66 kwh / eq heat exchanger (Apr 02 through July 03 - 16 month data)
After: 0.44 kwh / eq heat exchanger (Jan 04 through Aug 04 - 8 month data)
33 % Reduction in Energy Levels
RESULTS

39
02 - 03 Apr - Jul 03
0.34
0.37
0.3
0.35
0.4
0.25
0.2
0.15
Project start up
C� ,�( �%�6���������$!��Kwh / heat exchanger
Jan – Apr 04
0.19
May – Aug 04
0.20
Before: 0.35 kwh / eq heat exchanger (Apr 02 through July 03 - 16 month data)
After: 0.20 kwh / eq heat exchanger (Jan 04 through Aug 04 - 8 month data)
43 % Reduction in Energy Levels
RESULTS
40
C= �!3 ���� 0��6�' ���$)������� 0 ����$!��
Aug 03
76
90
Heat Exchanger / Hour
90
100
110
80
70
60
Project start up
79
Sept Oct Nov Jan 04 Feb
86
98
Dec
104
Mar
106
120
108106
Apr
111
May
109
Jun
112
July
112
Aug
RESULTS
41
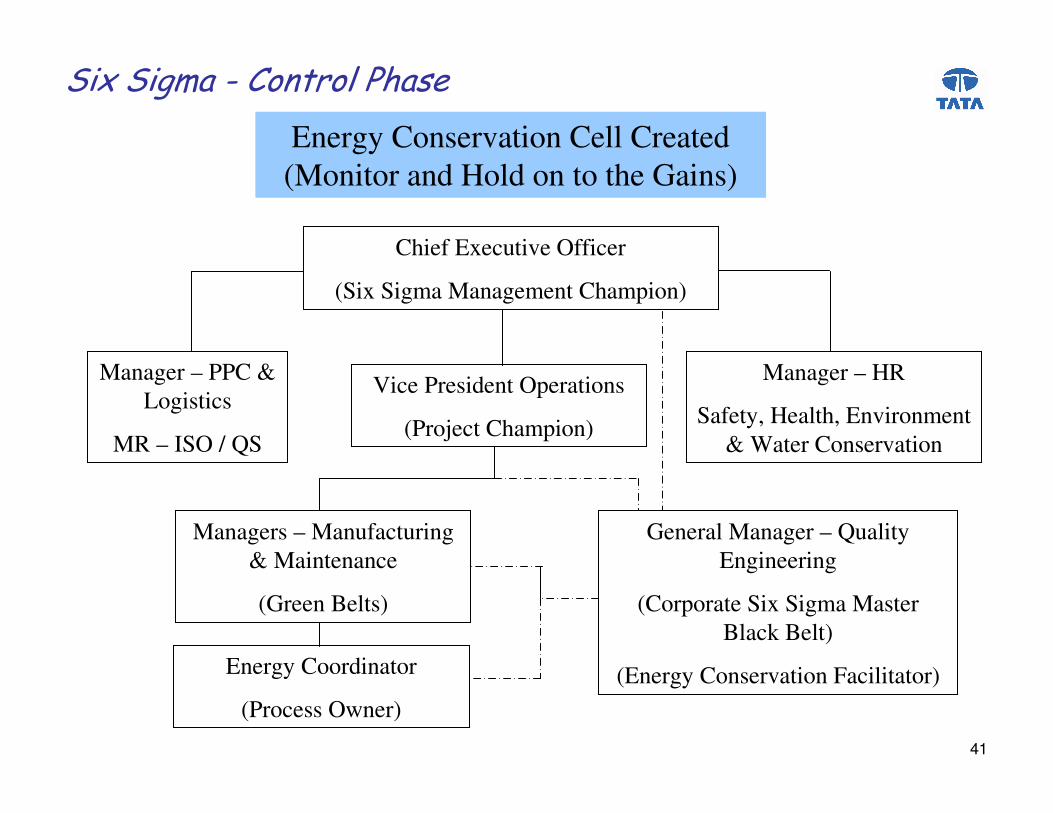
� ��� � !�# ������)��$!%�
Energy Conservation Cell Created (Monitor and Hold on to the Gains)
Chief Executive Officer
(Six Sigma Management Champion)
Manager – PPC & Logistics
MR – ISO / QS
Vice President Operations
(Project Champion)
Manager – HR
Safety, Health, Environment & Water Conservation
Managers – Manufacturing & Maintenance
(Green Belts)
Energy Coordinator
(Process Owner)
General Manager – Quality Engineering
(Corporate Six Sigma Master Black Belt)
(Energy Conservation Facilitator)
42
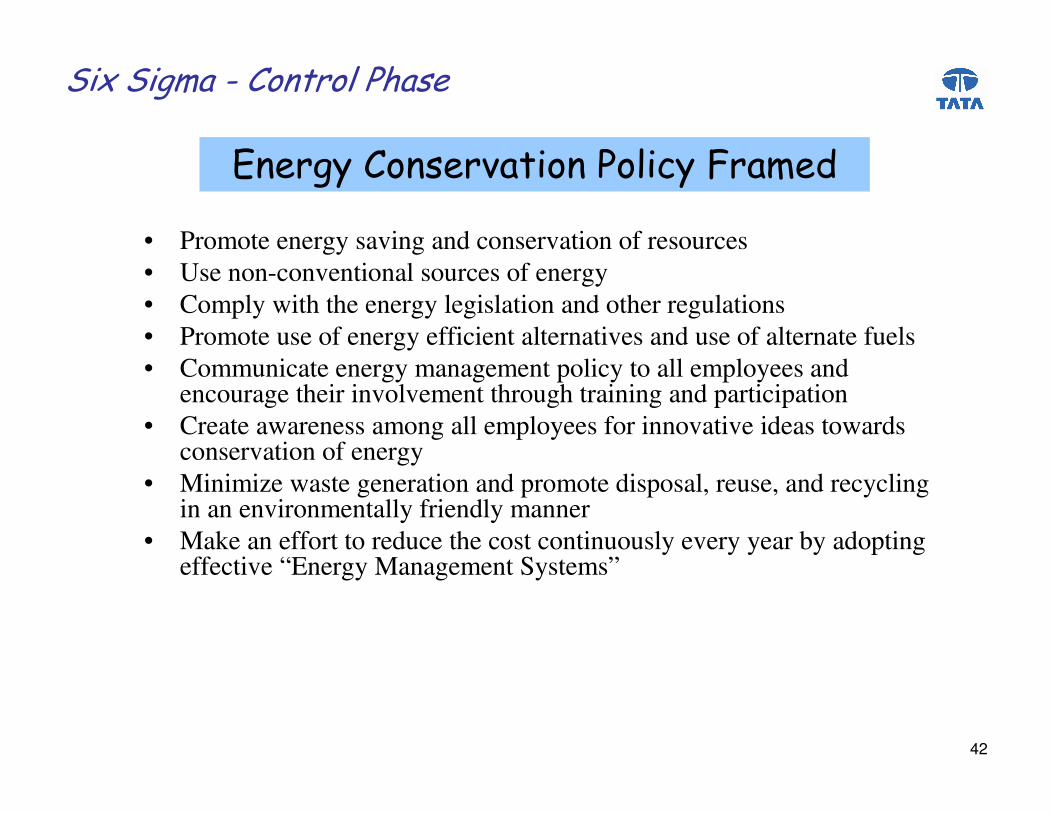
� ��� � !�# ������)��$!%�
����������%��0!� �����) �����! �
• Promote energy saving and conservation of resources• Use non-conventional sources of energy• Comply with the energy legislation and other regulations• Promote use of energy efficient alternatives and use of alternate fuels• Communicate energy management policy to all employees and
encourage their involvement through training and participation• Create awareness among all employees for innovative ideas towards
conservation of energy• Minimize waste generation and promote disposal, reuse, and recycling
in an environmentally friendly manner• Make an effort to reduce the cost continuously every year by adopting
effective “Energy Management Systems”
43
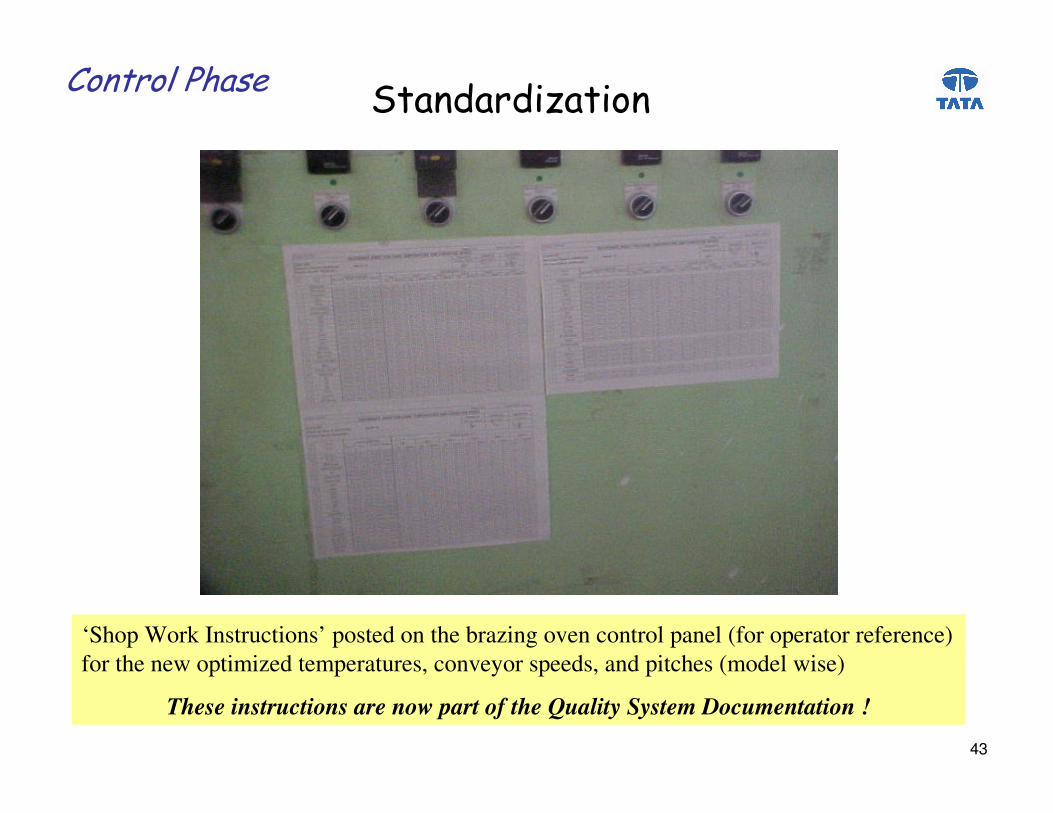
‘Shop Work Instructions’ posted on the brazing oven control panel (for operator reference) for the new optimized temperatures, conveyor speeds, and pitches (model wise)
These instructions are now part of the Quality System Documentation !
� �!�!� 3!� ��������)��$!%�
44
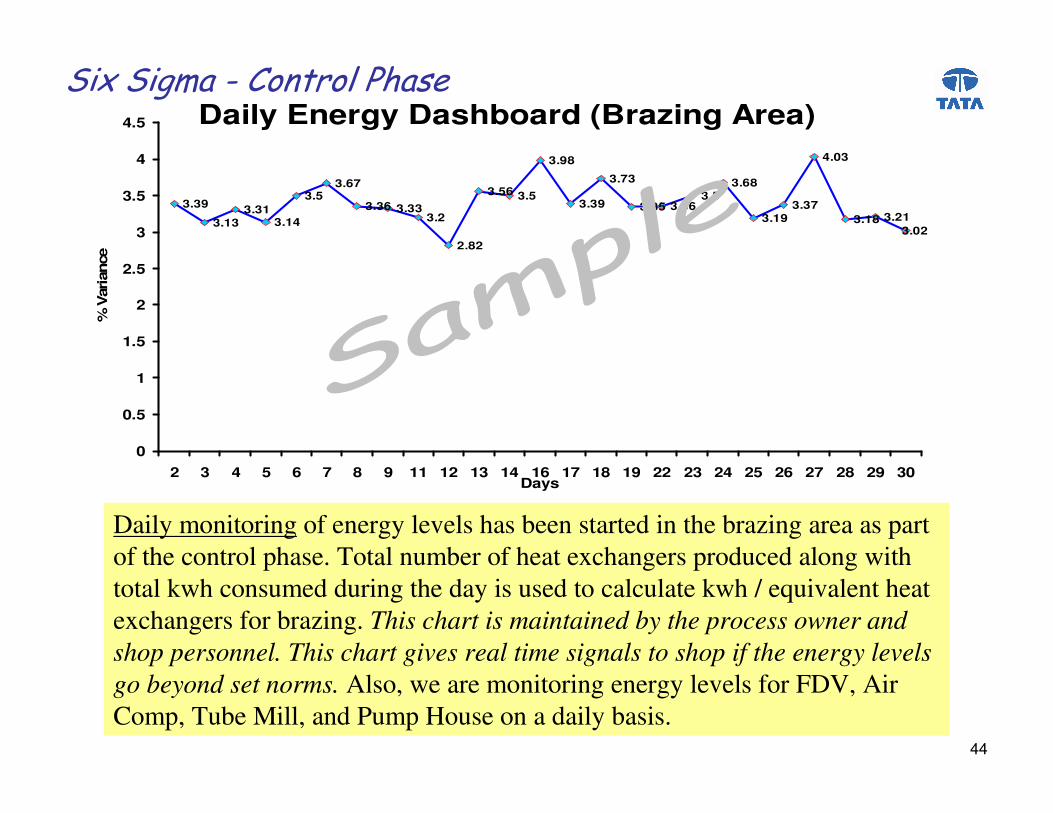
� ��� � !�# ������)��$!%�Daily Energy Dashboard (Brazing Area)
3.39
3.133.31
3.14
3.53.67
3.36 3.333.2
2.82
3.56 3.5
3.98
3.39
3.73
3.35 3.363.5
3.68
3.193.37
4.03
3.18 3.213.02
0
0.5
1
1.5
2
2.5
3
3.5
4
4.5
2 3 4 5 6 7 8 9 11 12 13 14 16 17 18 19 22 23 24 25 26 27 28 29 30Days
% V
aria
nce
Daily monitoring of energy levels has been started in the brazing area as part of the control phase. Total number of heat exchangers produced along with total kwh consumed during the day is used to calculate kwh / equivalent heat exchangers for brazing. This chart is maintained by the process owner and shop personnel. This chart gives real time signals to shop if the energy levels go beyond set norms. Also, we are monitoring energy levels for FDV, Air Comp, Tube Mill, and Pump House on a daily basis.

45
������)��$!%�
Productivity levels are now being measured shift wise to make sure that the gains obtained from this project are sustained over time.
This chart is also maintained by the process owner and shop personnel.
� $ "��B %������� 0 ����$!����=�!3 ���� ��!�
80.898.1122.2105.949.3101.471.9118.6106.60.00.0106.9105.197.8108.0Qty/hr
420510165420190510290510510420510450420510510Actual time
0034503200130000060000Breakdown time/Planned stoppage
420510510420510510420510510420510510420510510Std available Time
IIIIIIIIIIIIIIIIIIIIIIIIIIIIIIShift
18-Jan17-Jan16-Jan14-Jan13-JanDate

46
��������� �$ �0� ���� ��� � !�# ����)% ��%
D ���������������% ,� ���)�0�)%�+��E4�5 &D � �$ �0��!��!)�%!0 ��%��"�� � �F �GEE2E..�,�����!�&�
D � ,��0��,���� 0 ���+��HE�5 &D � �����+������� ) 3!� ����"�+�!3 ����0��2��0��$�!%�) 1��� ����������% ,� ���$!0��!)%��+��������&
D � $ %� ,��0� ����$!%�+����%%�! ���"����$��)!%��� �$�� ���$%&�� � �6% ���!0���* ))�+�����$�)��������$ %���� ���%�!�$ �0� ���� ��"���&

47
� �$�����������=���" �%
D �� �"���� ���� ��<� ��� � !�=�) �">I �)!���!%�!�* $�)�� %��$!����,�����!1�������* �� ��� � !�
,��0� ����,������%
D � $���������%!0 ��%�,���������! �$!%�!)��!�� ��� " ��%�0���! � ��!)� � #,������%�"����� ,)�� ��� ��E..H#.J�I � $�%��! � ��!)�,������%�* ))�"��$���������������
���% ,� ���!��* ))���%)�� ��"��$���%!0 ��%��"��%/&J�' )) ���,�����!������� � �F �8828..�,�����!���"���� � �
� ��� � !�# ����)% ��%

48
� ����,�� ����K�� ��� � !� %�4.�5 ����,)��!��� �)��E.�5 �� ��)%�L
� ��� � !�I ����) ���� $��$�