Embed Size (px)
Citation preview
A Perfect Match23 Nov 200923 Nov 2009
Thoresen Thai Agencies PLCUnique Mining Services PLC
Important Notice
This presentation is being furnished to you solely for your information and for your use and may not be copied, reproduced orredistributed to any other person in any manner. You agree to keep the contents of this presentation and these materials confidential.Th i f ti t i d i thi t ti d t tit t f t f ff i it ti t h itiThe information contained in this presentation does not constitute or form any part of any offer or invitation to purchase any securitiesand neither the issue of the information nor anything contained herein shall form the basis of, or be relied upon in connection with, anycontract or commitment on the part of any person to proceed with any transaction.
This document is for review only by persons who are existing shareholders of Thoresen Thai Agencies Public Company Limited(“TTA”) h l (I) N US d fi d i R l ti S d th U S S iti A t f 1933 d d (th(“TTA”) who are also (I) Non‐US persons, as defined in Regulation S under the U.S. Securities Act of 1933, as amended (theʺSecurities Actʺ), who are outside the United States, or (II) Persons who are Qualified Institutional Buyers as defined in Rule 144Aunder the Securities Act. By your acceptance of this document, you acknowledge that you fall within either category (I) or (II) of theprior sentence. Neither this document, in whole or in part, nor any copy thereof may be taken or transmitted to any other person. Thedistribution of this document to other persons or in other jurisdictions may be restricted by law, and persons into whose possession thisp j y y p pdocument comes should inform themselves about, and observe, any such restrictions. Any failure to comply with these restrictions mayconstitute a violation of the federal securities laws of the United States and the laws of other jurisdictions.
This presentation has been prepared on the basis of publicly available information and information confidential to TTA. Except asrequired by law, none of TTA or its advisers or their and their affiliatesʹ respective officers, employees, agents and consultants make anyrepresentation or warranty as to the accuracy or completeness of the contents of this presentation, and take no responsibility for any lossor damage suffered as a result of any omission, inadequacy, or inaccuracy therein.
This document contains forward‐looking statements. These statements are subject to certain risks and uncertainties that could cause theperformance or achievements of TTA to differ materially from the information set forth herein, although such information reflectsforecasts and projections prepared in good faith based upon methods and data that are believed to be reasonable and accurate as at thedates thereof and although all reasonable care has been taken to ensure that the facts stated herein are accurate and that the forward‐looking statements, opinions and expectations contained herein are based on fair and reasonable assumptions. TTA undertakes noobligation to revise these forward‐looking statements to reflect subsequent events or circumstances. Individuals should not place unduereliance on forward‐looking statements and are advised to make their own independent analysis and determination with respect to thereliance on forward looking statements and are advised to make their own independent analysis and determination with respect to theforecasted periods, which reflect TTA views only as of the date hereof.
2

Agenda
TTA’s Business GroupsTTAs Business Groups
UMS’s Company Profile & Operations
UMS’s Industry Outlook & Business Plans
TTA & UMS, a Perfect Match for Synergised Growth
TTA’s & UMS’s Financial Highlights
Q & A
Appendix
3
Appendix

TTA’ B i GTTA’s Business Groups
HK000NDC
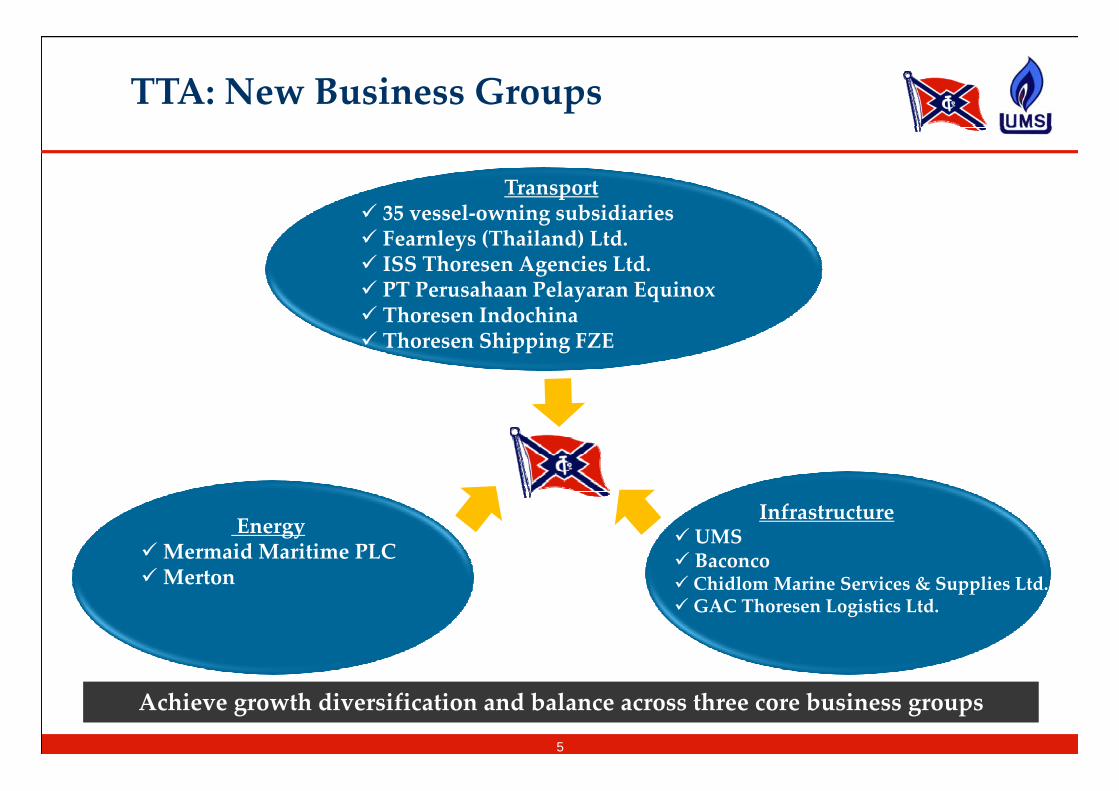
TTA: New Business Groups
Transport35 vessel‐owning subsidiaries35 vessel owning subsidiariesFearnleys (Thailand) Ltd.ISS Thoresen Agencies Ltd.PT Perusahaan Pelayaran EquinoxThoresen Indochina Thoresen Shipping FZE
InfrastructureUMSBaconco
EnergyMermaid Maritime PLCMerton ChidlomMarine Services & Supplies Ltd.
GAC Thoresen Logistics Ltd.Merton
Achieve growth diversification and balance across three core business groups
5
TTA: New Business Groups
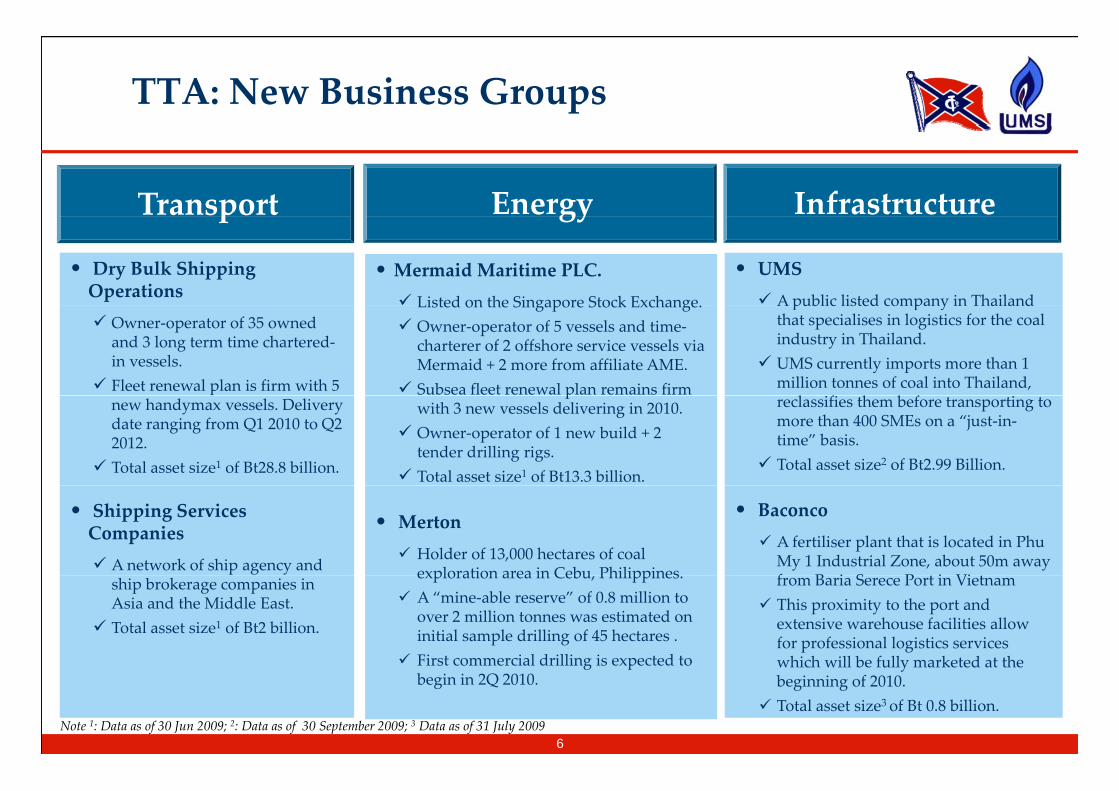
Transport Energy Infrastructurep gy
• Dry Bulk Shipping Operations
• Mermaid Maritime PLC.Listed on the Singapore Stock Exchange.
• UMSA public listed company in Thailand
Owner‐operator of 35 owned and 3 long term time chartered‐in vessels.Fleet renewal plan is firm with 5
Listed on the Singapore Stock Exchange.Owner‐operator of 5 vessels and time‐charterer of 2 offshore service vessels via Mermaid + 2 more from affiliate AME. Subsea fleet renewal plan remains firm
A public listed company in Thailand that specialises in logistics for the coal industry in Thailand.UMS currently imports more than 1 million tonnes of coal into Thailand,
l f h b fnew handymax vessels. Delivery date ranging from Q1 2010 to Q2 2012.Total asset size1 of Bt28.8 billion.
pwith 3 new vessels delivering in 2010.Owner‐operator of 1 new build + 2 tender drilling rigs.Total asset size1 of Bt13.3 billion.
reclassifies them before transporting to more than 400 SMEs on a “just‐in‐time” basis. Total asset size2 of Bt2.99 Billion.
• Shipping Services Companies
A network of ship agency and
• MertonHolder of 13,000 hectares of coal exploration area in Cebu Philippines
• BaconcoA fertiliser plant that is located in PhuMy 1 Industrial Zone, about 50m away f B i S P i Viship brokerage companies in
Asia and the Middle East.Total asset size1 of Bt2 billion.
exploration area in Cebu, Philippines.A “mine‐able reserve” of 0.8 million to over 2 million tonnes was estimated on initial sample drilling of 45 hectares . First commercial drilling is expected to
from Baria Serece Port in Vietnam This proximity to the port and extensive warehouse facilities allow for professional logistics services which will be fully marketed at the
6Note 1: Data as of 30 Jun 2009; 2: Data as of 30 September 2009; 3 Data as of 31 July 2009
First commercial drilling is expected to begin in 2Q 2010.
which will be fully marketed at the beginning of 2010.Total asset size3 of Bt 0.8 billion.
UMS’s Company Profile &UMS s Company Profile & Operations
HK000NDC
UMS’s Company Profile
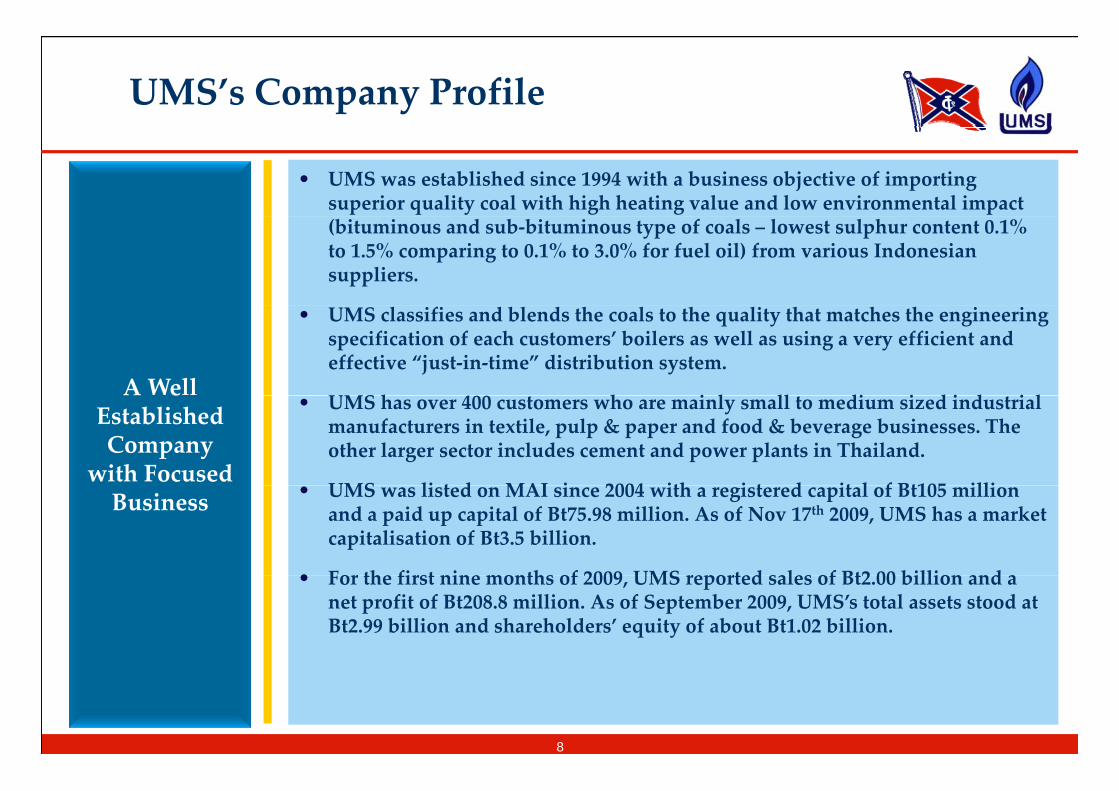
• UMS was established since 1994 with a business objective of importing superior quality coal with high heating value and low environmental impact (bituminous and sub‐bituminous type of coals – lowest sulphur content 0.1% to 1.5% comparing to 0.1% to 3.0% for fuel oil) from various Indonesian suppliers.
A Well
• UMS classifies and blends the coals to the quality that matches the engineering specification of each customers’ boilers as well as using a very efficient and effective “just‐in‐time” distribution system.
UMS h 4 h i l ll di i d i d i lA e
Established Company
with Focused
• UMS has over 400 customers who are mainly small to medium sized industrial manufacturers in textile, pulp & paper and food & beverage businesses. The other larger sector includes cement and power plants in Thailand.
UMS li t d MAI i 2004 ith i t d it l f Bt105 illiBusiness • UMS was listed on MAI since 2004 with a registered capital of Bt105 million and a paid up capital of Bt75.98 million. As of Nov 17th 2009, UMS has a market capitalisation of Bt3.5 billion.
• For the first nine months of 2009 UMS reported sales of Bt2 00 billion and a• For the first nine months of 2009, UMS reported sales of Bt2.00 billion and a net profit of Bt208.8 million. As of September 2009, UMS’s total assets stood at Bt2.99 billion and shareholders’ equity of about Bt1.02 billion.
8
Strong and Diversified Portfolio of Customers and Suppliers
Customers Suppliers
pp
Customers Suppliers
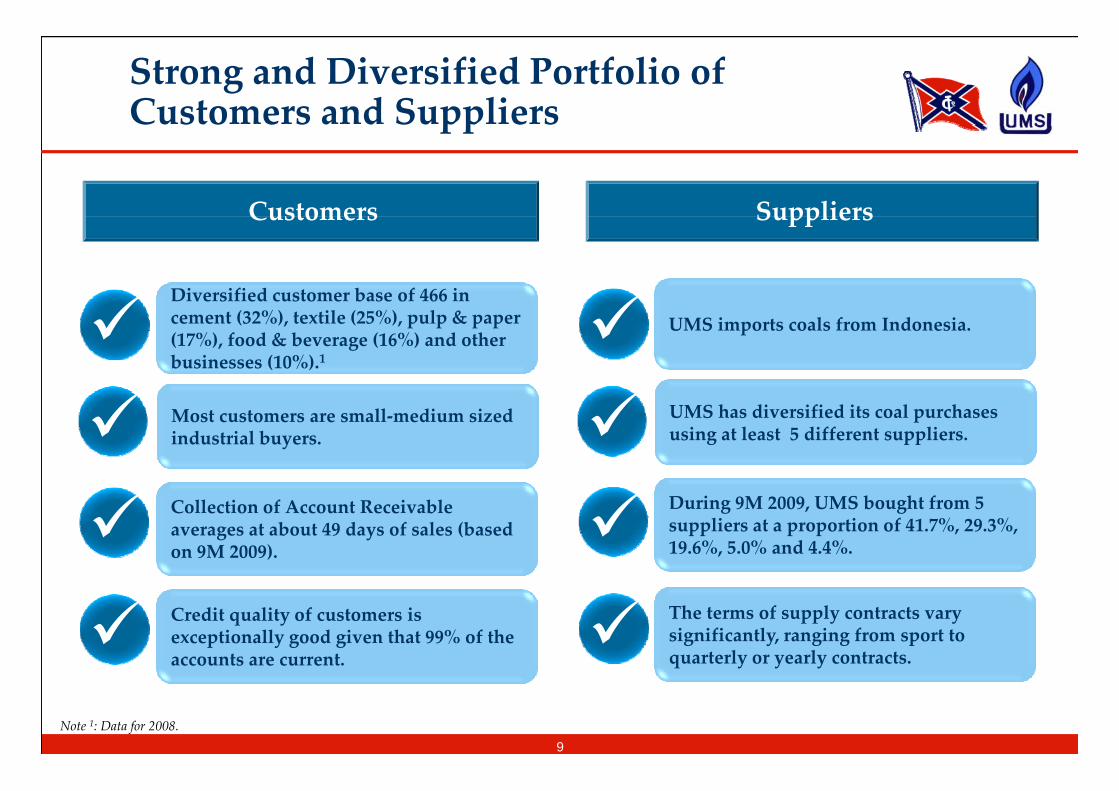
Diversified customer base of 466 in cement (32%), textile (25%), pulp & paper (17%), food & beverage (16%) and other businesses (10%).1
UMS imports coals from Indonesia.
Most customers are small‐medium sized industrial buyers.
UMS has diversified its coal purchases using at least 5 different suppliers.
Collection of Account Receivable averages at about 49 days of sales (based on 9M 2009).
During 9M 2009, UMS bought from 5 suppliers at a proportion of 41.7%, 29.3%, 19.6%, 5.0% and 4.4%.
Credit quality of customers is exceptionally good given that 99% of the accounts are current.
The terms of supply contracts vary significantly, ranging from sport to quarterly or yearly contracts.accounts are current.
9
q y y y
Note 1: Data for 2008.
UMS’s Company Operations
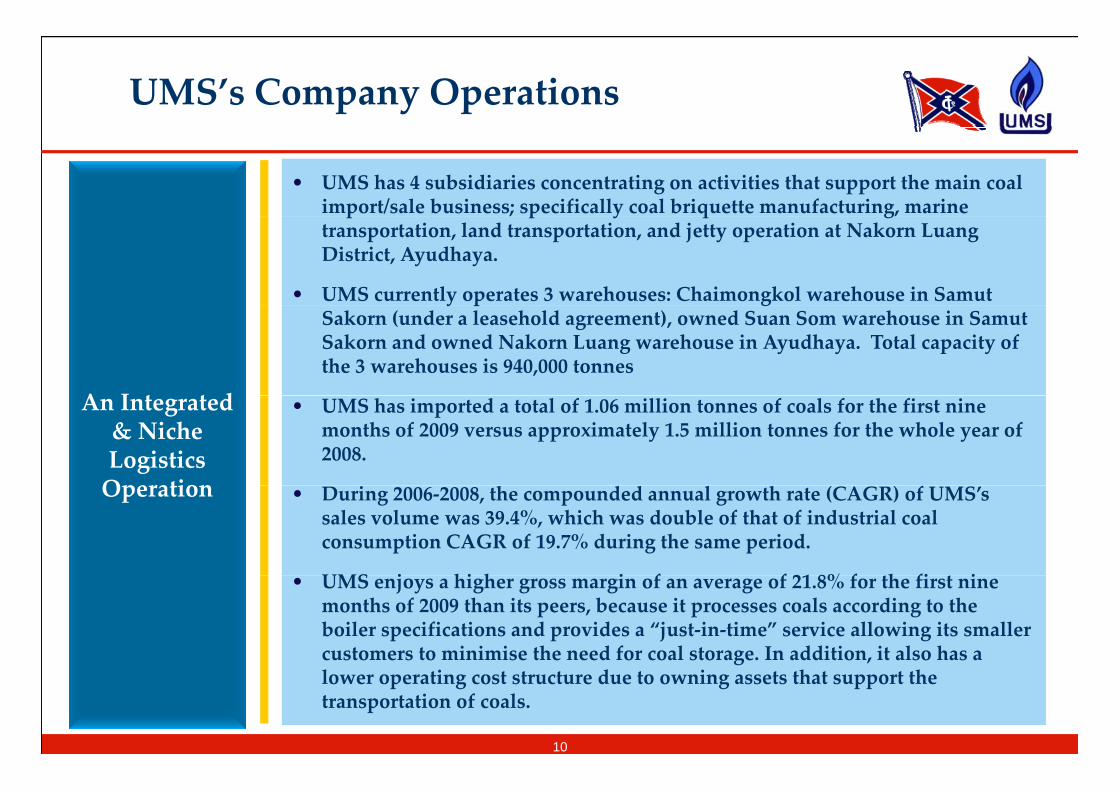
• UMS has 4 subsidiaries concentrating on activities that support the main coal import/sale business; specifically coal briquette manufacturing, marine p ; p y q g,transportation, land transportation, and jetty operation at Nakorn Luang District, Ayudhaya.
• UMS currently operates 3 warehouses: Chaimongkol warehouse in Samut
A I t t d
y p gSakorn (under a leasehold agreement), owned Suan Som warehouse in Samut Sakorn and owned Nakorn Luang warehouse in Ayudhaya. Total capacity of the 3 warehouses is 940,000 tonnes
An Integrated & Niche Logistics Operation
• UMS has imported a total of 1.06 million tonnes of coals for the first nine months of 2009 versus approximately 1.5 million tonnes for the whole year of 2008.
Operation • During 2006‐2008, the compounded annual growth rate (CAGR) of UMS’s sales volume was 39.4%, which was double of that of industrial coal consumption CAGR of 19.7% during the same period.
UMS j hi h i f f 21 8% f h fi i• UMS enjoys a higher gross margin of an average of 21.8% for the first nine months of 2009 than its peers, because it processes coals according to the boiler specifications and provides a “just‐in‐time” service allowing its smaller customers to minimise the need for coal storage. In addition, it also has a glower operating cost structure due to owning assets that support the transportation of coals.
10
UMS’s Four Wholly Owned Subsidiaries
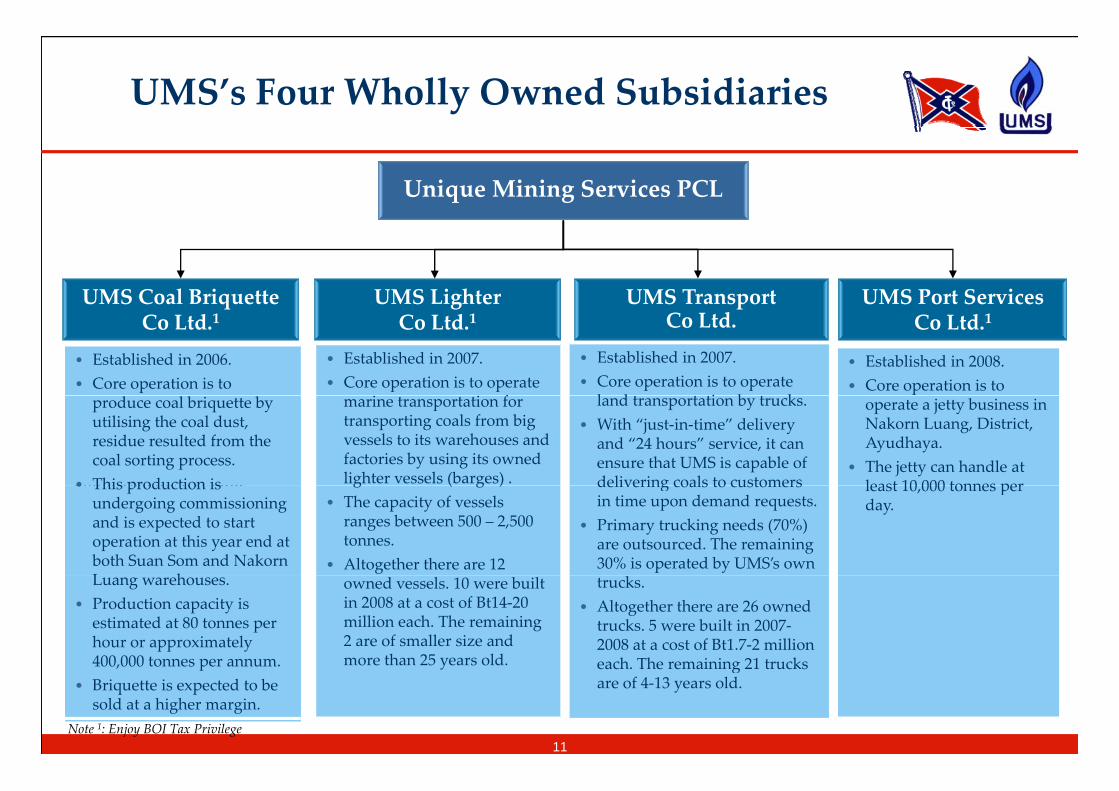
Unique Mining Services PCL
UMS Transport UMS Lighter UMS Coal Briquette UMS Port Services pCo Ltd.
gCo Ltd.1
qCo Ltd.1 Co Ltd.1
• Established in 2006.• Core operation is to
• Established in 2008.• Core operation is to
• Established in 2007.• Core operation is to operate
l d i b k
• Established in 2007.• Core operation is to operate
f•Established in 2006.•Core operation is to produce coal briquette by utilising the ample coal dust, residue
produce coal briquette by utilising the coal dust, residue resulted from the coal sorting process.
• This production is
operate a jetty business in Nakorn Luang, District, Ayudhaya.
• The jetty can handle at least 10 000 tonnes per
land transportation by trucks. • With “just‐in‐time” delivery
and “24 hours” service, it can ensure that UMS is capable of delivering coals to customers
marine transportation for transporting coals from big vessels to its warehouses and factories by using its owned lighter vessels (barges) .ample coal dust, residue
resulted from the coal sorting process.•This production is undergoing commissioning
• This production is undergoing commissioning and is expected to start operation at this year end at both Suan Som and Nakorn L h
least 10,000 tonnes per day.
delivering coals to customers in time upon demand requests.
• Primary trucking needs (70%) are outsourced. The remaining 30% is operated by UMS’s own
g ( g )• The capacity of vessels
ranges between 500 – 2,500 tonnes.
• Altogether there are 12 and is expected to start operation at this year end at both Suam Som and Nakorn Luang warehouses.•Production capacity is
Luang warehouses.• Production capacity is
estimated at 80 tonnes per hour or approximately 400,000 tonnes per annum.
trucks.• Altogether there are 26 owned
trucks. 5 were built in 2007‐2008 at a cost of Bt1.7‐2 million each The remaining 21 trucks
owned vessels. 10 were built in 2008 at a cost of Bt14‐20 million each. The remaining 2 are of smaller size and more than 25 years old.•Production capacity is
estimated at 100 tonnes per hour.
11
400,000 tonnes per annum.• Briquette is expected to be
sold at a higher margin.
each. The remaining 21 trucks are of 4‐13 years old.
more than 25 years old.
Note 1: Enjoy BOI Tax Privilege
UMS’s Operation Procedures and Delivery Services
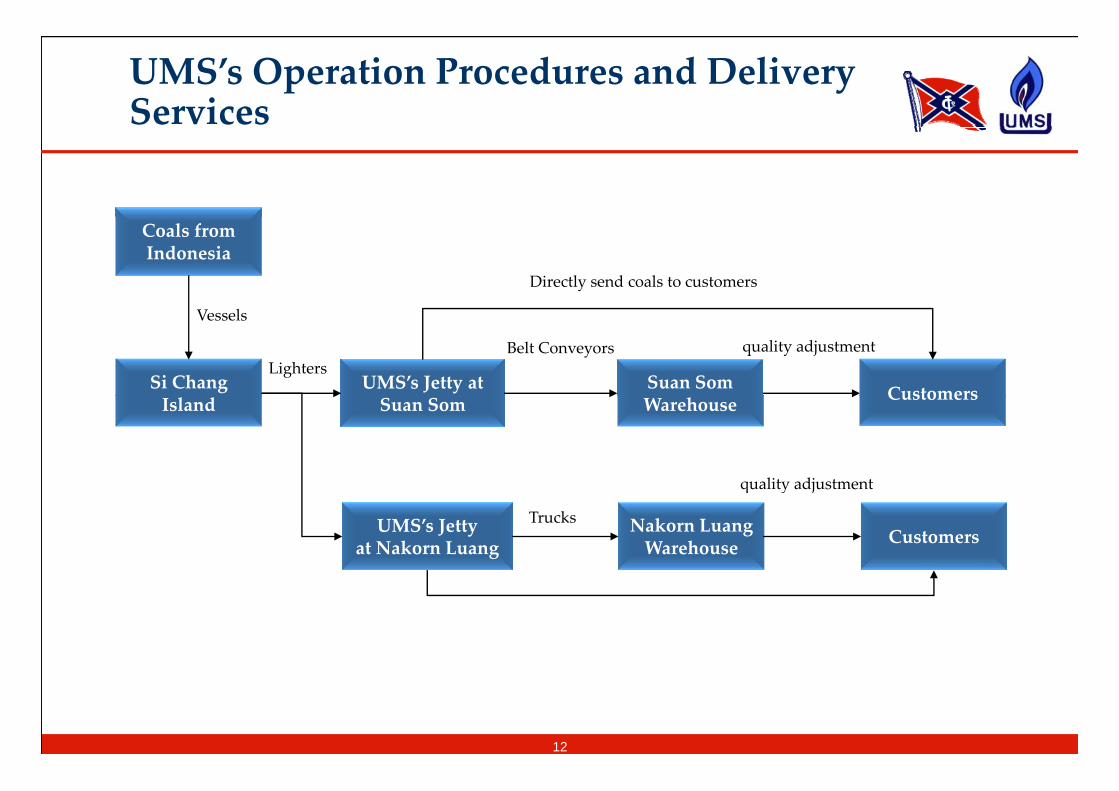
Coals from Indonesia
Directly send coals to customers
Si Chang UMS’s Jetty at CustomersSuan Som
Vessels
LightersBelt Conveyors quality adjustment
Island Suan Som CustomersWarehouse
quality adjustment
UMS’s Jetty at Nakorn Luang CustomersNakorn Luang
Warehouse
quality adjustment
Trucks
Directly send coals to customers
12

UMS’s Industry Outlook &UMS s Industry Outlook & Business Plans
HK000NDC
UMS’s Industry Outlook
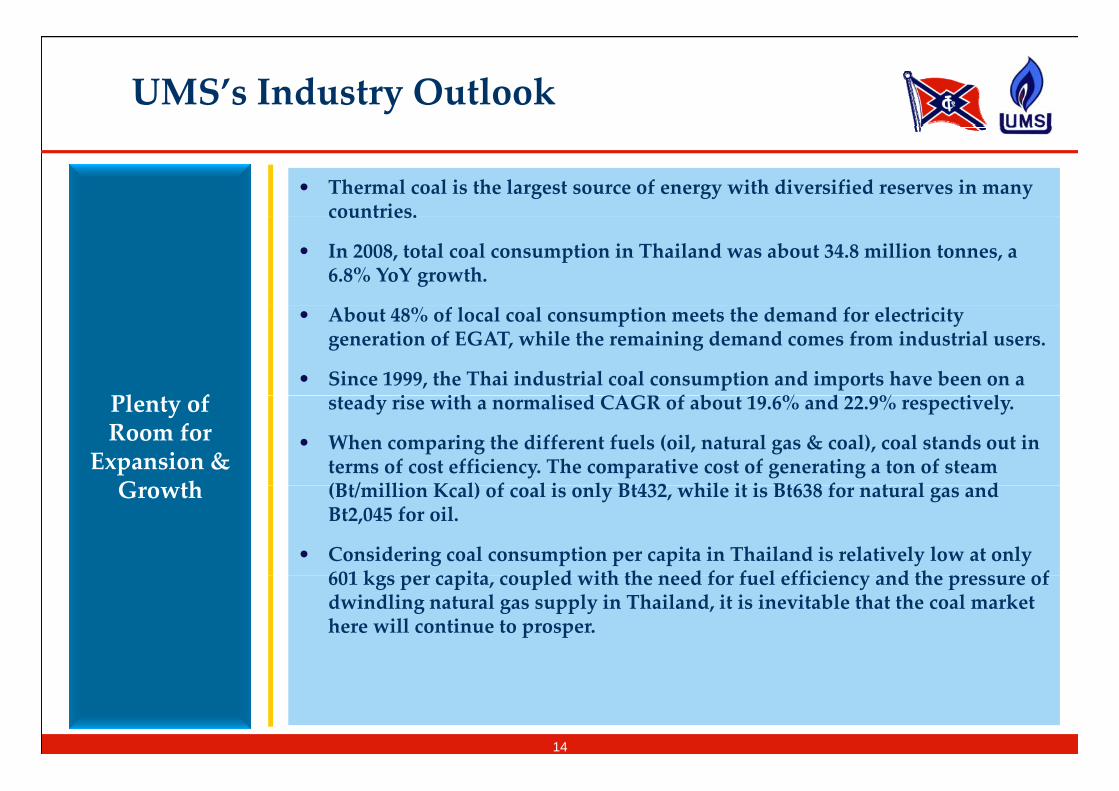
• Thermal coal is the largest source of energy with diversified reserves in many countries.countries.
• In 2008, total coal consumption in Thailand was about 34.8 million tonnes, a 6.8% YoY growth.
Pl f
• About 48% of local coal consumption meets the demand for electricity generation of EGAT, while the remaining demand comes from industrial users.
• Since 1999, the Thai industrial coal consumption and imports have been on a d i i h li d CAGR f b % d % i lPlenty of
Room for Expansion & G th
steady rise with a normalised CAGR of about 19.6% and 22.9% respectively.
• When comparing the different fuels (oil, natural gas & coal), coal stands out in terms of cost efficiency. The comparative cost of generating a ton of steam (Bt/ illi K l) f l i l Bt432 hil it i Bt638 f t l dGrowth (Bt/million Kcal) of coal is only Bt432, while it is Bt638 for natural gas and Bt2,045 for oil.
• Considering coal consumption per capita in Thailand is relatively low at only 601 k e a ita ou led ith the eed fo fuel effi ie y a d the e u e of601 kgs per capita, coupled with the need for fuel efficiency and the pressure of dwindling natural gas supply in Thailand, it is inevitable that the coal market here will continue to prosper.
14
Rising Demand for Imported Coal
Quantity (ʹ000 tons) Value (million Baht)
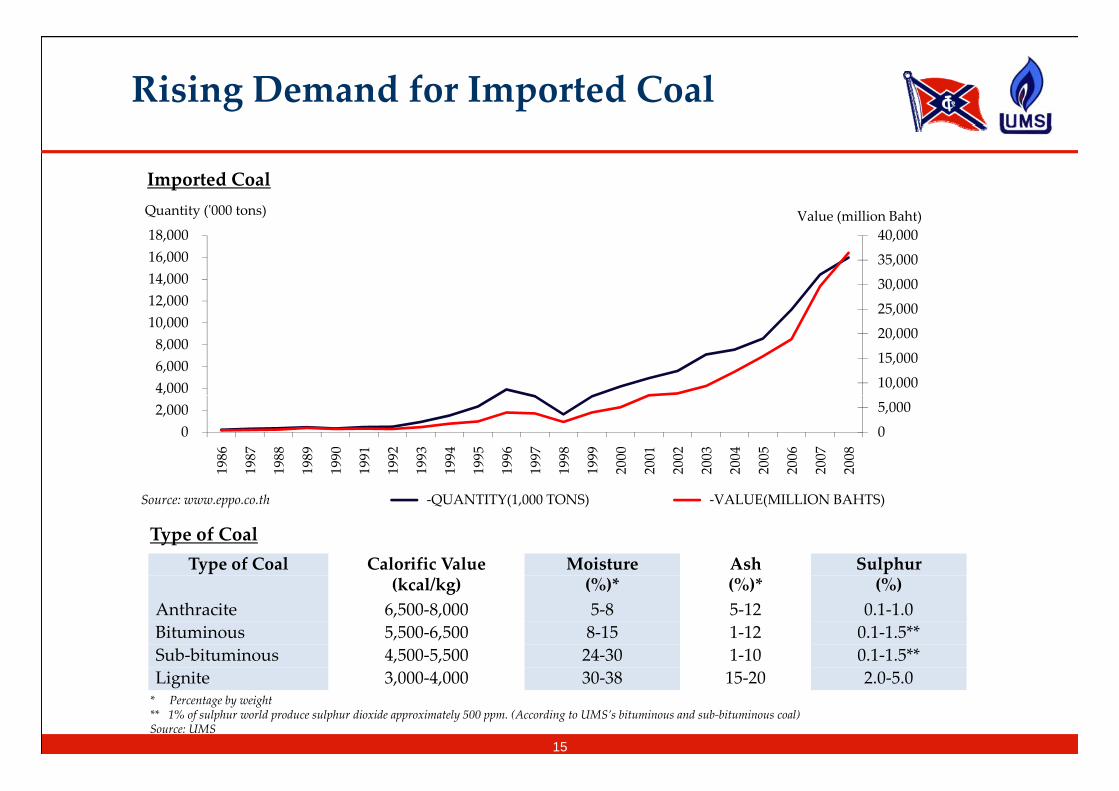
Imported Coal
25 000
30,000
35,000
40,000
12,000 14,000 16,000 18,000
Q y ( ) Value (million Baht)
10,000
15,000
20,000
25,000
4,000 6,000 8,000 10,000 ,
0
5,000
0 2,000
1986
1987
1988
1989
1990
1991
1992
1993
1994
1995
1996
1997
1998
1999
2000
2001
2002
2003
2004
2005
2006
2007
2008
‐QUANTITY(1,000 TONS) ‐VALUE(MILLION BAHTS) Source: www.eppo.co.th
Type of Coal Calorific Value Moisture Ash Sulphur
Type of Coal
(kcal/kg) (%)* (%)* (%)Anthracite 6,500‐8,000 5‐8 5‐12 0.1‐1.0Bituminous 5,500‐6,500 8‐15 1‐12 0.1‐1.5**Sub‐bituminous 4,500‐5,500 24‐30 1‐10 0.1‐1.5**
15
Lignite 3,000‐4,000 30‐38 15‐20 2.0‐5.0* Percentage by weight** 1% of sulphur world produce sulphur dioxide approximately 500 ppm. (According to UMS’s bituminous and sub‐bituminous coal) Source: UMS
Higher Growth in Coal Consumption of the Thai Industrial Sector
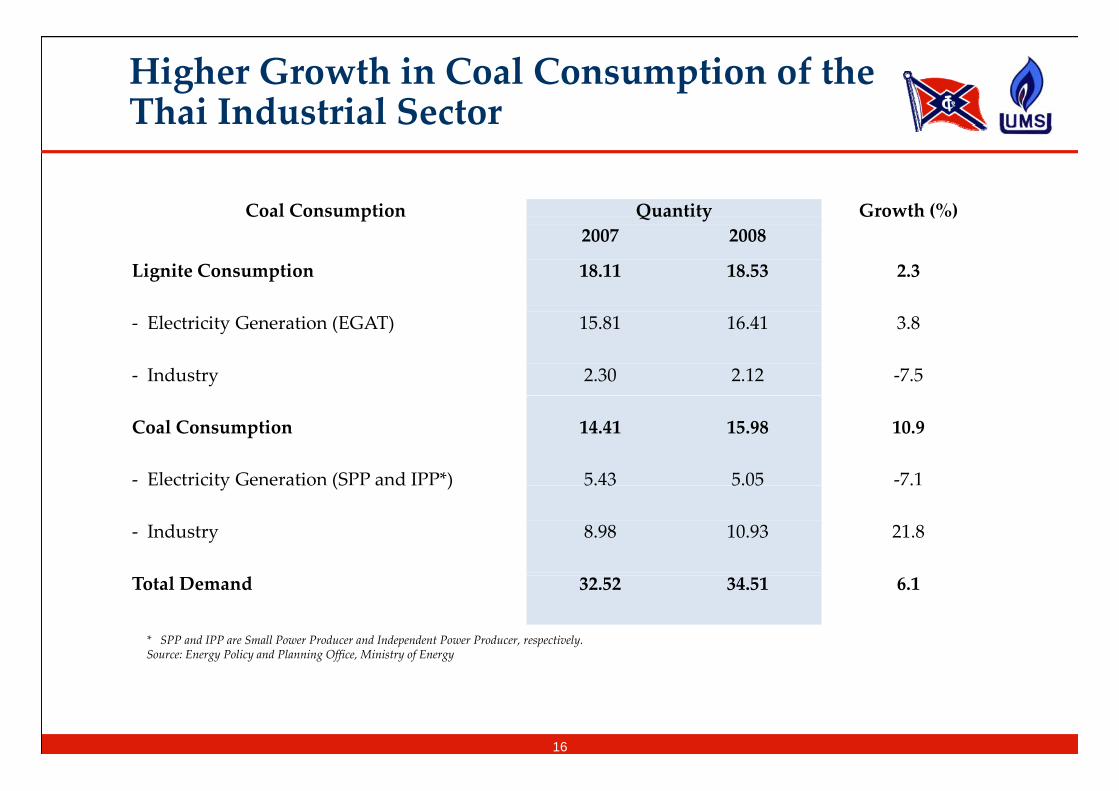
Coal Consumption Quantity Growth (%)Coal Consumption Quantity Growth (%)2007 2008
Lignite Consumption 18.11 18.53 2.3
‐ Electricity Generation (EGAT) 15.81 16.41 3.8
‐ Industry 2.30 2.12 ‐7.5
Coal Consumption 14.41 15.98 10.9
‐ Electricity Generation (SPP and IPP*) 5.43 5.05 ‐7.1E ect icity Ge e atio (S a d I ) 5. 3 5.05 .
‐ Industry 8.98 10.93 21.8
Total Demand 32.52 34.51 6.1
* SPP and IPP are Small Power Producer and Independent Power Producer, respectively. Source: Energy Policy and Planning Office, Ministry of Energy
16
Low Consumption per Capita Allowing for Potential Growth
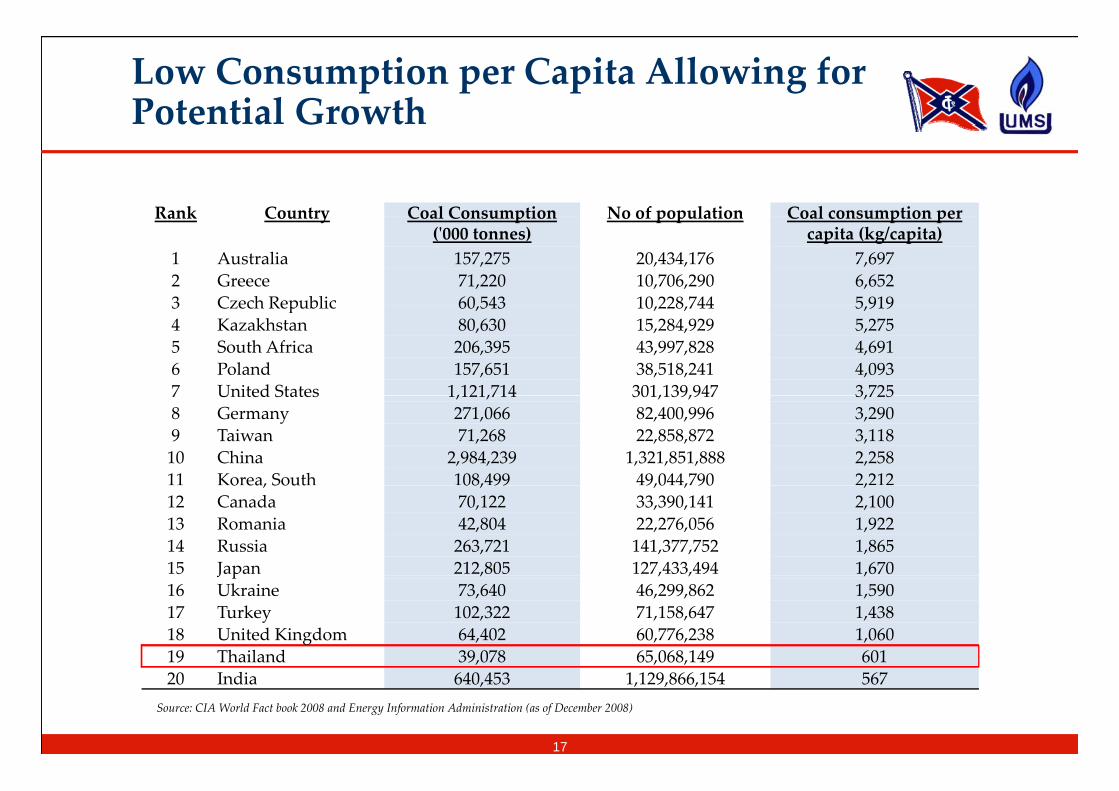
Rank Country Coal Consumption No of population Coal consumption perRank Country Coal Consumption (ʹ000 tonnes)
No of population Coal consumption per capita (kg/capita)
1 Australia 157,275 20,434,176 7,6972 Greece 71,220 10,706,290 6,6523 Czech Republic 60 543 10 228 744 5 9193 Czech Republic 60,543 10,228,744 5,9194 Kazakhstan 80,630 15,284,929 5,2755 South Africa 206,395 43,997,828 4,6916 Poland 157,651 38,518,241 4,0937 United States 1,121,714 301,139,947 3,7257 United States 1,121,714 301,139,947 3,7258 Germany 271,066 82,400,996 3,2909 Taiwan 71,268 22,858,872 3,11810 China 2,984,239 1,321,851,888 2,25811 Korea, South 108,499 49,044,790 2,212o ea, Sout 08, 99 9,0 , 90 ,12 Canada 70,122 33,390,141 2,10013 Romania 42,804 22,276,056 1,92214 Russia 263,721 141,377,752 1,86515 Japan 212,805 127,433,494 1,670J p , , , ,16 Ukraine 73,640 46,299,862 1,59017 Turkey 102,322 71,158,647 1,43818 United Kingdom 64,402 60,776,238 1,06019 Thailand 39,078 65,068,149 601
17
20 India 640,453 1,129,866,154 567Source: CIA World Fact book 2008 and Energy Information Administration (as of December 2008)
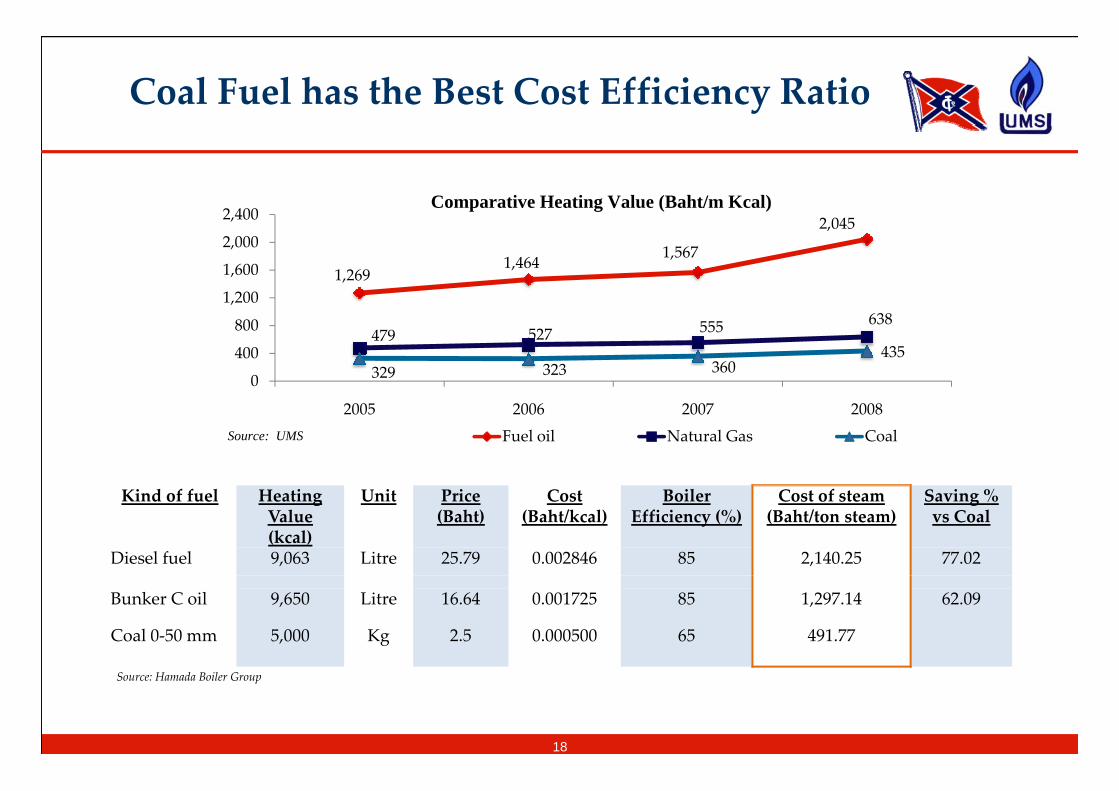
Coal Fuel has the Best Cost Efficiency Ratio
2 400Comparative Heating Value (Baht/m Kcal)
1,2691,464 1,567
2,045
1,200
1,600
2,000
2,400
479 527 555 638
329 323 360435
0
400
800
2005 2006 2007 2008
Fuel oil Natural Gas CoalSource: UMS
Kind of fuel Heating Value (kcal)
Unit Price (Baht)
Cost (Baht/kcal)
Boiler Efficiency (%)
Cost of steam (Baht/ton steam)
Saving % vs Coal
Diesel fuel 9,063 Litre 25.79 0.002846 85 2,140.25 77.02
Bunker C oil 9,650 Litre 16.64 0.001725 85 1,297.14 62.09
Coal 0‐50 mm 5,000 Kg 2.5 0.000500 65 491.77
18
Source: Hamada Boiler Group
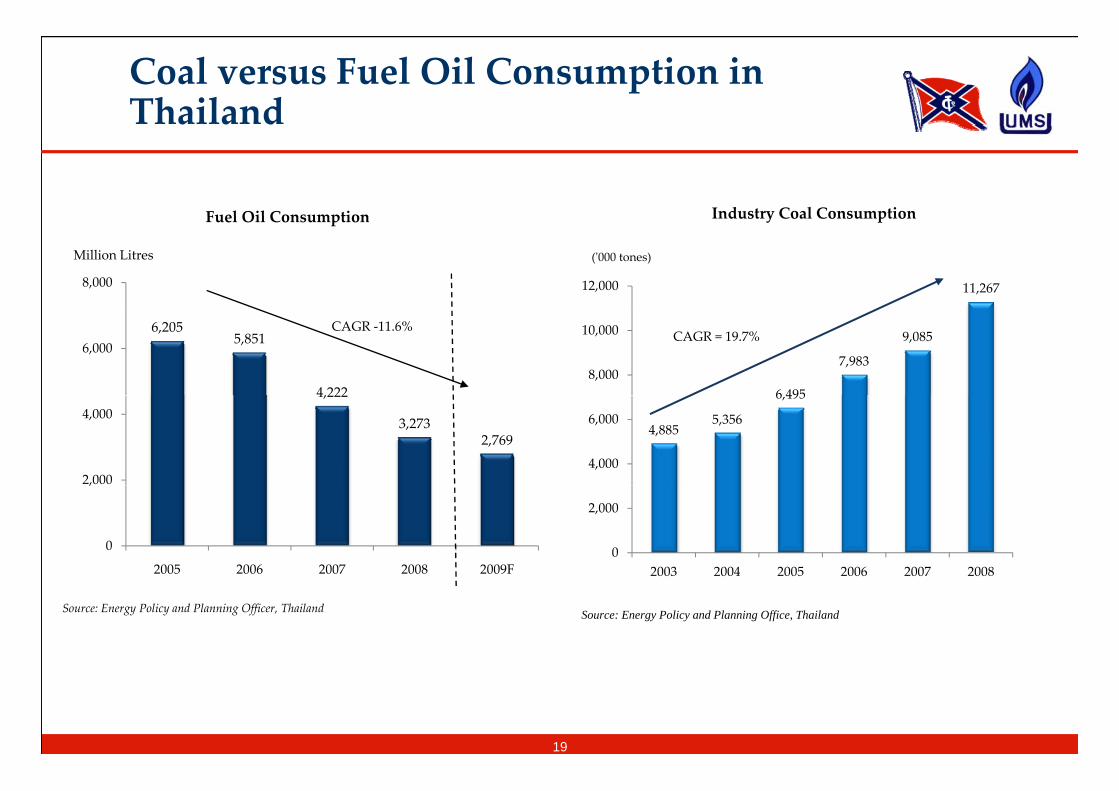
Coal versus Fuel Oil Consumption in Thailand
Industry Coal ConsumptionFuel Oil Consumption
8,000
Million Litres
11,26712,000
(ʹ000 tones)
Industry Coal ConsumptionFuel Oil Consumption
6,2055,851
4,222
6,000CAGR ‐11.6%
6 495
7,983
9,085
8,000
10,000 CAGR = 19.7%
4,222
3,2732,769
2,000
4,0004,885
5,356
6,495
4,000
6,000
0
,
2005 2006 2007 2008 2009F0
2,000
2003 2004 2005 2006 2007 2008
Source: Energy Policy and Planning Officer, Thailand
2003 2004 2005 2006 2007 2008
Source: Energy Policy and Planning Office, Thailand
19
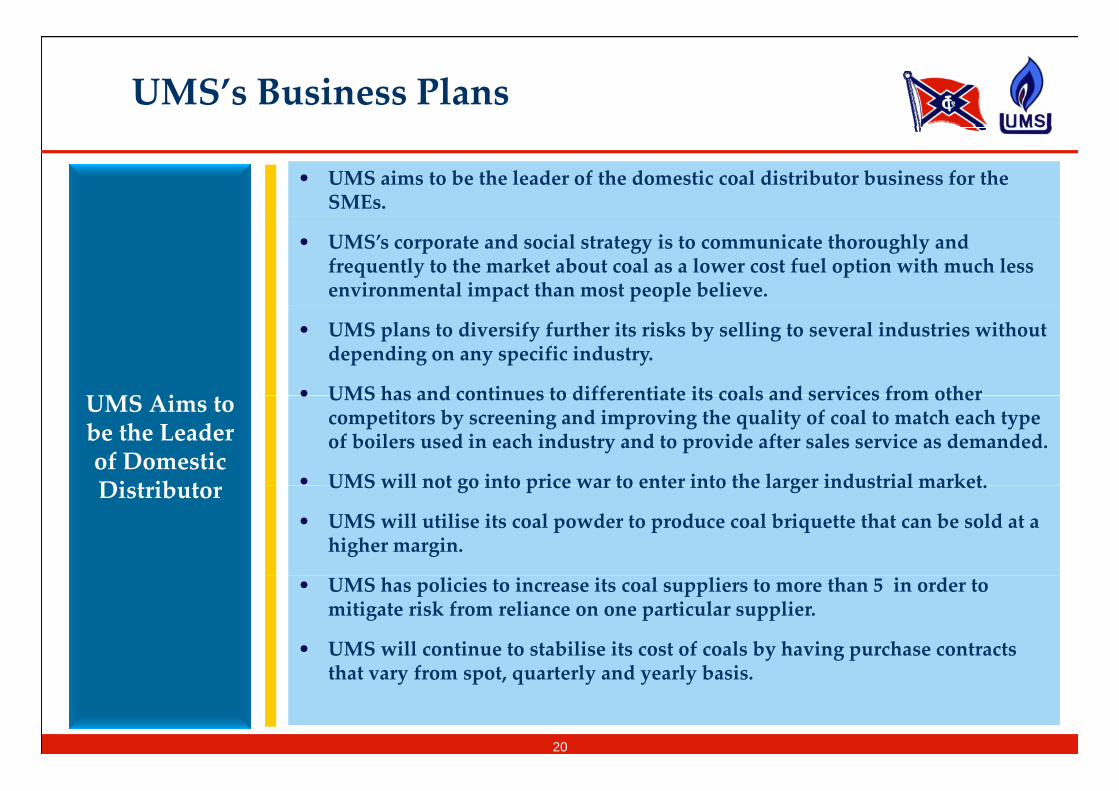
UMS’s Business Plans
• UMS aims to be the leader of the domestic coal distributor business for the SMEs.
• UMS’s corporate and social strategy is to communicate thoroughly and frequently to the market about coal as a lower cost fuel option with much less environmental impact than most people believe.
UMS Ai
• UMS plans to diversify further its risks by selling to several industries without depending on any specific industry.
• UMS has and continues to differentiate its coals and services from otherUMS Aims to be the Leader of Domestic Di t ib t
• UMS has and continues to differentiate its coals and services from other competitors by screening and improving the quality of coal to match each type of boilers used in each industry and to provide after sales service as demanded.
• UMS will not go into price war to enter into the larger industrial market.Distributor UMS will not go into price war to enter into the larger industrial market.
• UMS will utilise its coal powder to produce coal briquette that can be sold at a higher margin.
• UMS has policies to increase its coal suppliers to more than 5 in order to mitigate risk from reliance on one particular supplier.
• UMS will continue to stabilise its cost of coals by having purchase contracts h f l d l bthat vary from spot, quarterly and yearly basis.
20
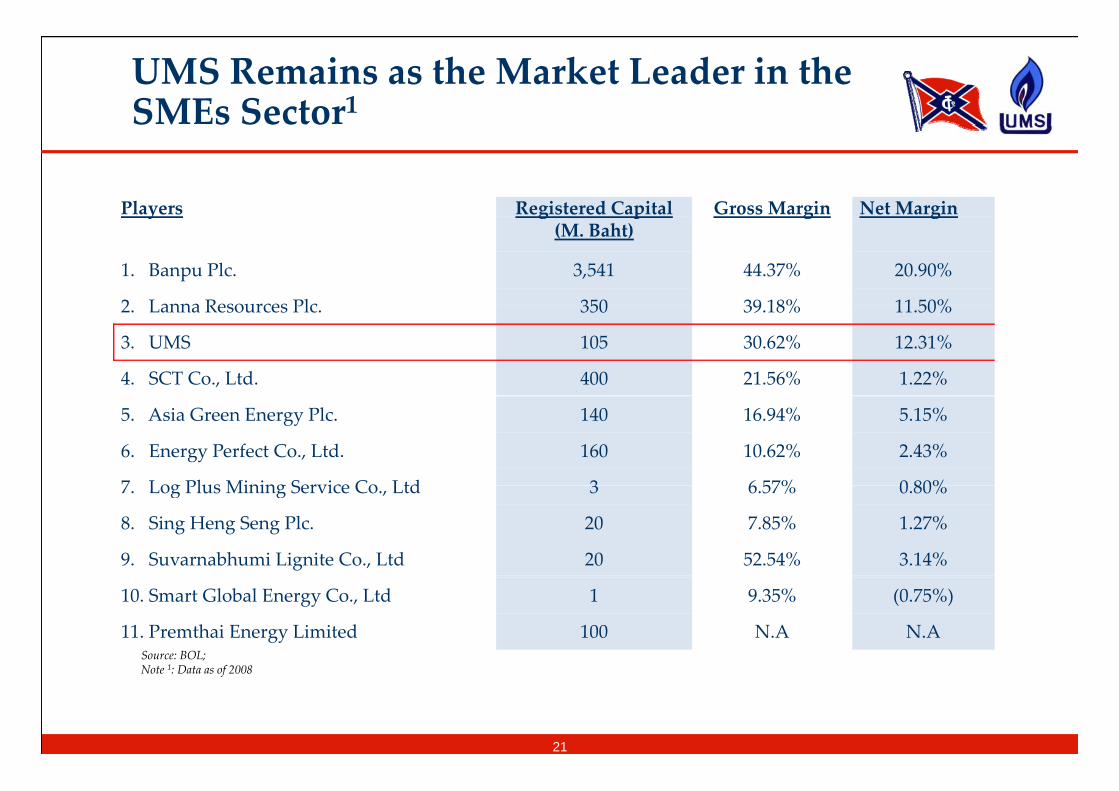
UMS Remains as the Market Leader in the SMEs Sector1
Players Registered Capital Gross Margin Net Margin y g p(M. Baht)
g g
1. Banpu Plc. 3,541 44.37% 20.90%
2 Lanna Resources Plc 350 39 18% 11 50%2. Lanna Resources Plc. 350 39.18% 11.50%
3. UMS 105 30.62% 12.31%
4. SCT Co., Ltd. 400 21.56% 1.22%
5. Asia Green Energy Plc. 140 16.94% 5.15%
6. Energy Perfect Co., Ltd. 160 10.62% 2.43%
7 Log Plus Mining Service Co Ltd 3 6 57% 0 80%7. Log Plus Mining Service Co., Ltd 3 6.57% 0.80%
8. Sing Heng Seng Plc. 20 7.85% 1.27%
9. Suvarnabhumi Lignite Co., Ltd 20 52.54% 3.14%
10. Smart Global Energy Co., Ltd 1 9.35% (0.75%)
11. Premthai Energy Limited 100 N.A N.ASource: BOL;
1 f
21
Note 1: Data as of 2008
TTA & UMS – The Perfect MatchTTA & UMS The Perfect Match for Synergised Growth
HK000NDC
TTA & UMS – A Perfect Match
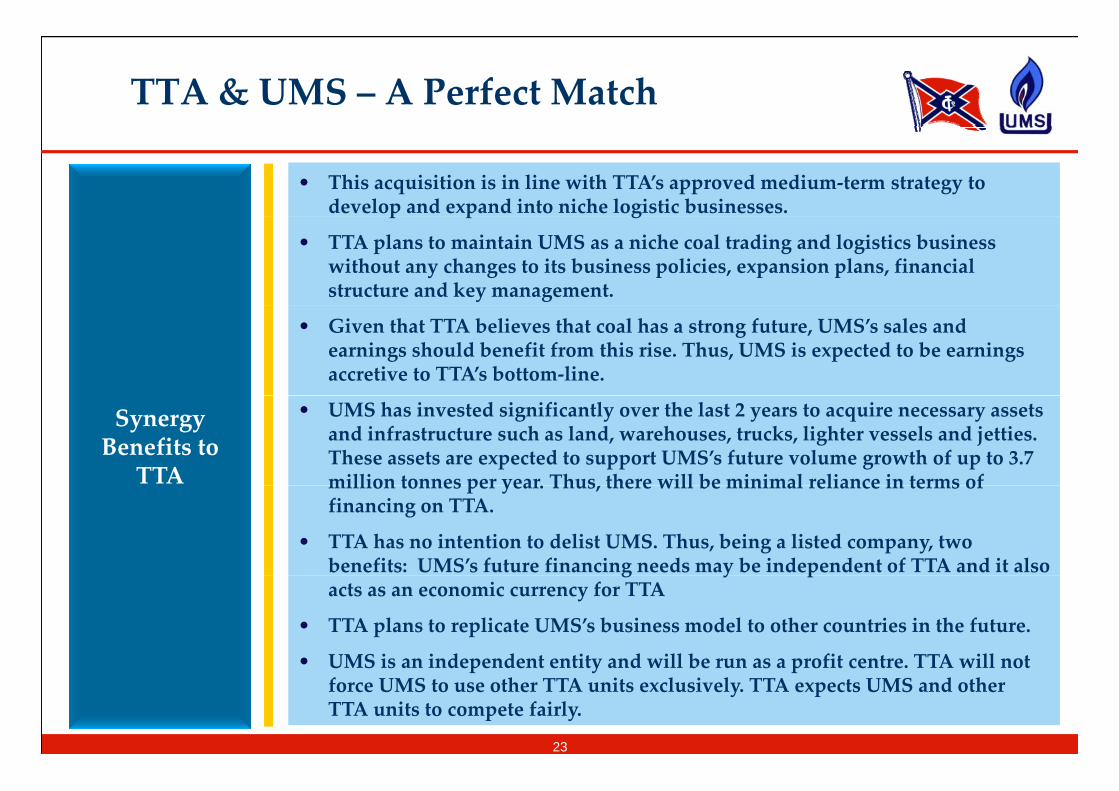
• This acquisition is in line with TTA’s approved medium‐term strategy to develop and expand into niche logistic businesses. p p g
• TTA plans to maintain UMS as a niche coal trading and logistics business without any changes to its business policies, expansion plans, financial structure and key management.
• Given that TTA believes that coal has a strong future, UMS’s sales and earnings should benefit from this rise. Thus, UMS is expected to be earnings accretive to TTA’s bottom‐line.
Synergy Benefits to TTA
• UMS has invested significantly over the last 2 years to acquire necessary assets and infrastructure such as land, warehouses, trucks, lighter vessels and jetties. These assets are expected to support UMS’s future volume growth of up to 3.7 million tonnes per year Thus there will be minimal reliance in terms ofmillion tonnes per year. Thus, there will be minimal reliance in terms of financing on TTA.
• TTA has no intention to delist UMS. Thus, being a listed company, two benefits: UMS’s future financing needs may be independent of TTA and it also g y pacts as an economic currency for TTA
• TTA plans to replicate UMS’s business model to other countries in the future.
• UMS is an independent entity and will be run as a profit centre TTA will notUMS is an independent entity and will be run as a profit centre. TTA will not force UMS to use other TTA units exclusively. TTA expects UMS and other TTA units to compete fairly.
23
TTA & UMS – A Perfect Match
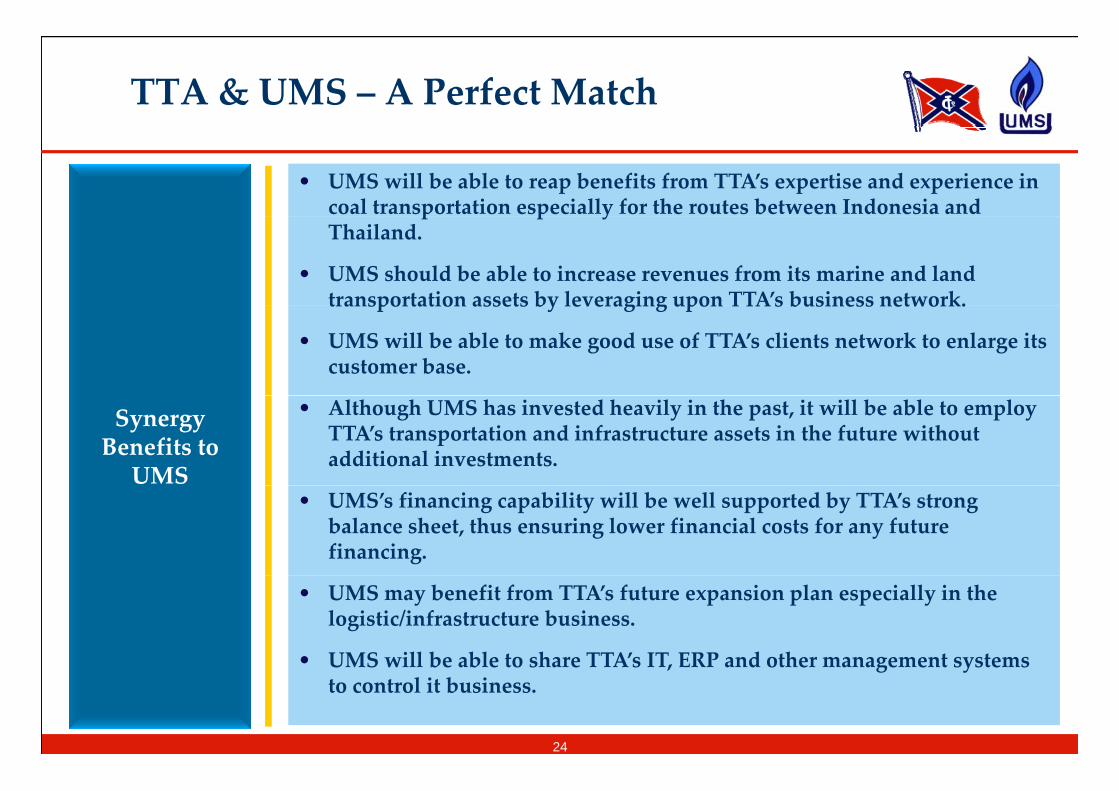
• UMS will be able to reap benefits from TTA’s expertise and experience in coal transportation especially for the routes between Indonesia and p p yThailand.
• UMS should be able to increase revenues from its marine and land transportation assets by leveraging upon TTA’s business network.transportation assets by leveraging upon TTAs business network.
• UMS will be able to make good use of TTA’s clients network to enlarge its customer base.
Synergy Benefits to UMS
• Although UMS has invested heavily in the past, it will be able to employ TTA’s transportation and infrastructure assets in the future without additional investments.
• UMS’s financing capability will be well supported by TTA’s strong balance sheet, thus ensuring lower financial costs for any future financing.
• UMS may benefit from TTA’s future expansion plan especially in the logistic/infrastructure business.
• UMS will be able to share TTA’s IT, ERP and other management systemsUMS will be able to share TTAs IT, ERP and other management systems to control it business.
24

Fi i l Hi hli htFinancial Highlights
HK000NDC
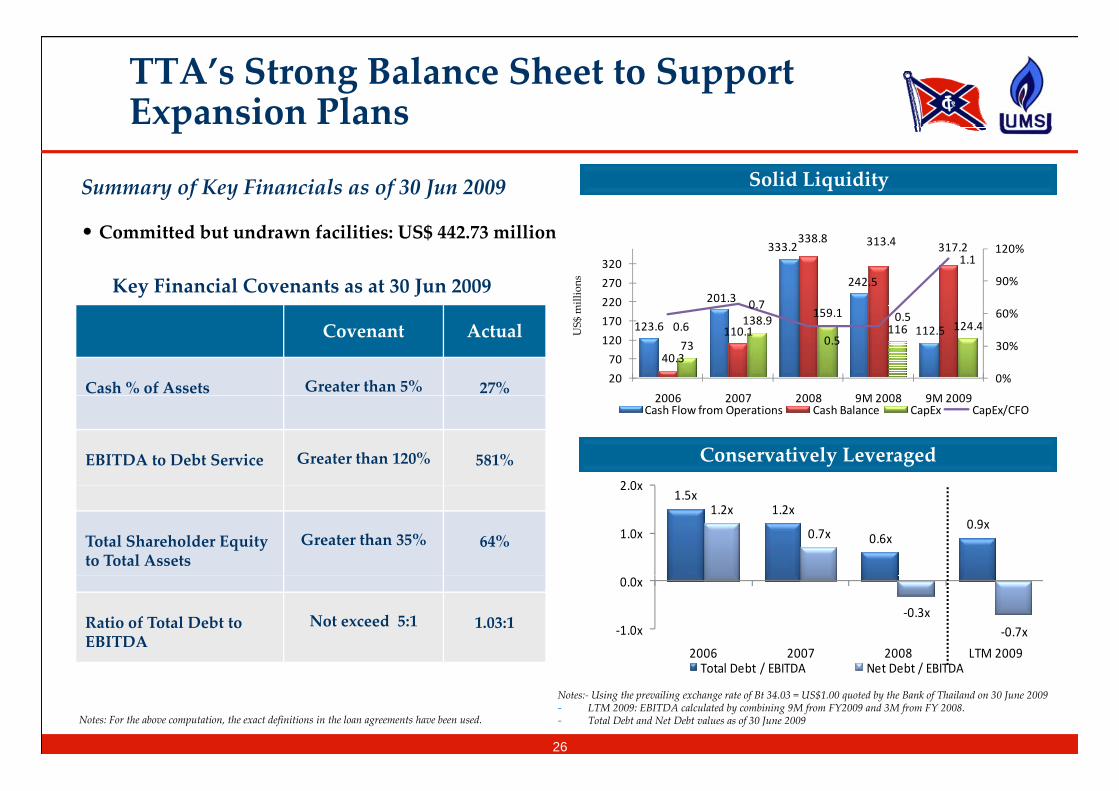
TTA’s Strong Balance Sheet to Support Expansion Plansp
Summary of Key Financials as of 30 Jun 2009 Solid Liquidity
Key Financial Covenants as at 30 Jun 2009
millions
201.3
333.2
242.5
338.8 313.4 317.2
0 7
1.1
90%
120%
220
270
320
• Committed but undrawn facilities: US$ 442.73 million
US$ m
123.6 112.5
40.3
110.173
138.9159.1
116 124.40.6
0.7
0.5
0.5
0%
30%
60%
20
70
120
170
220
2006 2007 2008 9M 2008 9M 2009
Covenant Actual
Cash % of Assets Greater than 5% 27%
2 0x
2006 2007 2008 9M 2008 9M 2009Cash Flow from Operations Cash Balance CapEx CapEx/CFO
EBITDA to Debt Service Greater than 120% 581% Conservatively Leveraged
1.5x1.2x
0.6x0.9x
1.2x
0.7x1.0x
2.0x
Total Shareholder Equity to Total Assets
Greater than 35% 64%
‐0.3x‐0.7x‐1.0x
0.0x
2006 2007 2008 LTM 2009T t l D bt / EBITDA N t D bt / EBITDA
Ratio of Total Debt to EBITDA
Not exceed 5:1 1.03:1
Notes:‐ Using the prevailing exchange rate of Bt 34.03 = US$1.00 quoted by the Bank of Thailand on 30 June 2009‐ LTM 2009: EBITDA calculated by combining 9M from FY2009 and 3M from FY 2008. ‐ Total Debt and Net Debt values as of 30 June 2009
Total Debt / EBITDA Net Debt / EBITDA
Notes: For the above computation, the exact definitions in the loan agreements have been used.
26
UMS’s Impressive ROE and ROA
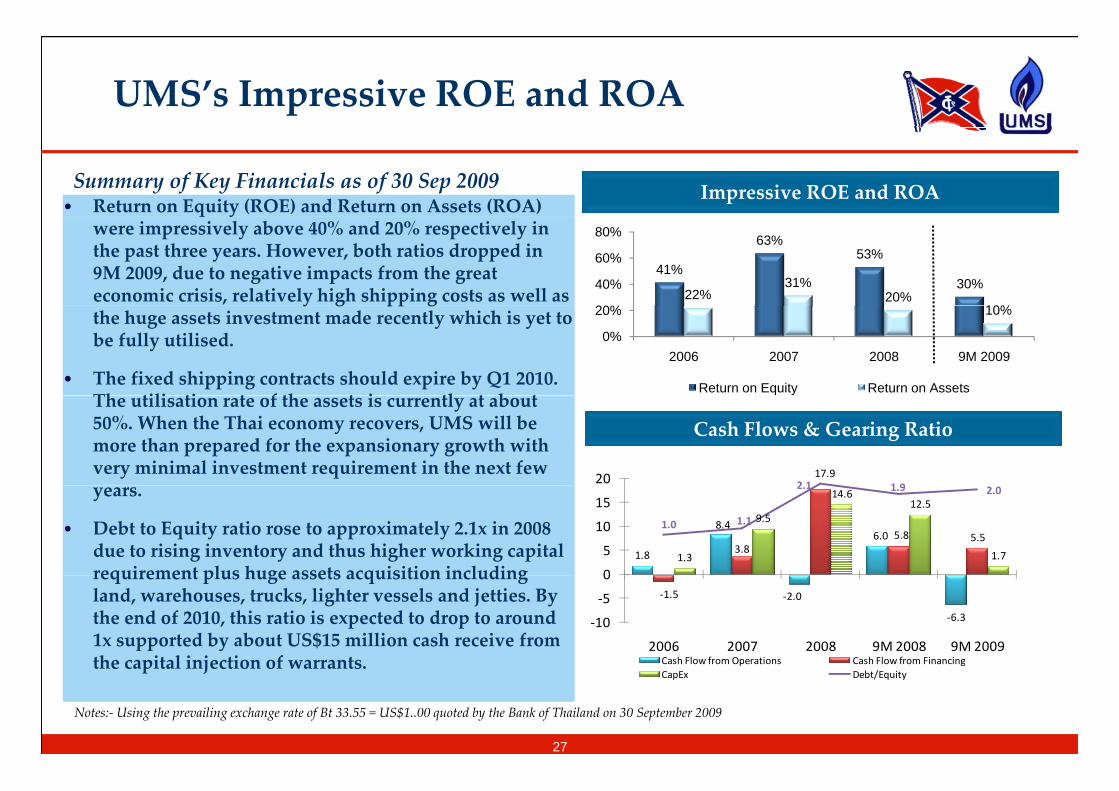
• Return on Equity (ROE) and Return on Assets (ROA) Impressive ROE and ROASummary of Key Financials as of 30 Sep 2009
41%
63%53%
30%22%
31%20%
10%20%
40%
60%
80%
q ywere impressively above 40% and 20% respectively in the past three years. However, both ratios dropped in 9M 2009, due to negative impacts from the great economic crisis, relatively high shipping costs as well as
10%
0%
20%
2006 2007 2008 9M 2009
Return on Equity Return on Assets
y g pp gthe huge assets investment made recently which is yet to be fully utilised.
• The fixed shipping contracts should expire by Q1 2010. Th tili ti t f th t i tl t b t
17.92 1 1 9
20
The utilisation rate of the assets is currently at about 50%. When the Thai economy recovers, UMS will be more than prepared for the expansionary growth with very minimal investment requirement in the next few
Cash Flows & Gearing Ratio
1.8
8.46.0
3.85.8 5.5
1.3
9.5
14.612.5
1.7
1.0 1.1
2.1 1.9 2.0
0
5
10
15years.
• Debt to Equity ratio rose to approximately 2.1x in 2008 due to rising inventory and thus higher working capital requirement plus huge assets acquisition including
‐2.0
‐6.3
‐1.5
‐10
‐5
0
2006 2007 2008 9M 2008 9M 2009Cash Flow from Operations Cash Flow from Financing
requirement plus huge assets acquisition including land, warehouses, trucks, lighter vessels and jetties. By the end of 2010, this ratio is expected to drop to around 1x supported by about US$15 million cash receive from the capital injection of warrants p g
CapEx Debt/Equitythe capital injection of warrants.
Notes:‐ Using the prevailing exchange rate of Bt 33.55 = US$1..00 quoted by the Bank of Thailand on 30 September 2009
27

TTA’s Strong Financial Performance
(US$ millions) 20082004 2005 2006 2007
Summary of Key Financials
9M 20099M 2008(US$ millions) 20082004 2005 2006 2007INCOME STATEMENTOperating Revenue 1,010.7307.3 437.5 470.1 598.2
EBITDA 368.8161.0 233.0 196.8 242.2
9M 20099M 2008
719.3
279.4
459.8
117.2
BALANCE SHEET
Interest Expense 15.76.3 13.1 20.6 19.6
Net Income 257.9127.1 174.8 102.9 146.0
EPS (US cents) 40.120.3 27.2 16.0 22.7
11.7
197.7
27.9
8.5
39.6
5.6
BALANCE SHEETCash and Cash at Banks 338.878.0 49.9 40.3 110.1
Total Assets 1,238.4463.3 572.1 680.0 827.0
Total Debt 237.1227.3 255.1 263.4 266.7
313.4
1,134.3
231.1
317.2
1,189.3
188.9
Net Debt (115.3)142.1 188.7 215.8 147.8
Total Liabilities 379.9266.6 303.4 326.7 355.3
Total Shareholder’s Equity 735.3196.0 267.4 328.7 445.3
(110.1)
341.7
673.8
(154.5)
285.1
763.8
CFO 333.2152.7 206.4 123.6 201.3
CapEx 159.1225.4 158.4 73.0 138.9
Cash Dividends 45.428.1 104.0 40.7 27.1
CASH FLOW STATEMENT242.5
116.0
45.4
112.5
124.4
14.2
Note: Using the exchange rate of Bt 34.03 = US$1.00 quoted by the Bank of Thailand as of 30 June 2009
28
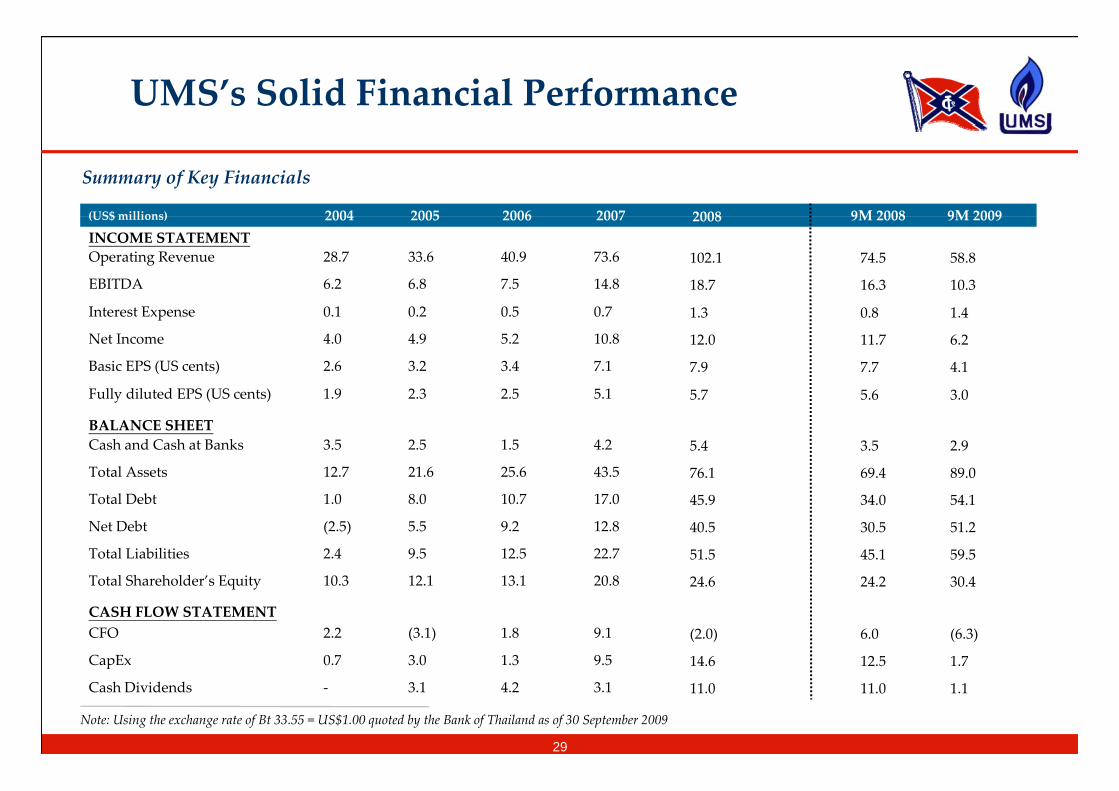
UMS’s Solid Financial Performance
(US$ millions) 20082004 2005 2006 2007
Summary of Key Financials
9M 20099M 2008(US$ millions) 20082004 2005 2006 2007INCOME STATEMENTOperating Revenue 102.128.7 33.6 40.9 73.6
EBITDA 18.76.2 6.8 7.5 14.8
9M 20099M 2008
74.5
16.3
58.8
10.3
Interest Expense 1.30.1 0.2 0.5 0.7
Net Income 12.04.0 4.9 5.2 10.8
Basic EPS (US cents) 7.92.6 3.2 3.4 7.1
0.8
11.7
7.7
1.4
6.2
4.1
Fully diluted EPS (US cents) 5 71 9 2 3 2 5 5 1 5 6 3 0
BALANCE SHEETCash and Cash at Banks 5.43.5 2.5 1.5 4.2
Total Assets 76.112.7 21.6 25.6 43.5
3.5
69.4
2.9
89.0
Fully diluted EPS (US cents) 5.71.9 2.3 2.5 5.1 5.6 3.0
Total Debt 45.91.0 8.0 10.7 17.0
Net Debt 40.5(2.5) 5.5 9.2 12.8
Total Liabilities 51.52.4 9.5 12.5 22.7
l h h ld E
34.0
30.5
45.1
54.1
51.2
59.5
Total Shareholder’s Equity 24.610.3 12.1 13.1 20.8
CFO (2.0)2.2 (3.1) 1.8 9.1
CapEx 14.60.7 3.0 1.3 9.5
CASH FLOW STATEMENT
24.2
6.0
12.5
30.4
(6.3)
1.7CapEx 14.60.7 3.0 1.3 9.5
Cash Dividends 11.0‐ 3.1 4.2 3.1
Note: Using the exchange rate of Bt 33.55 = US$1.00 quoted by the Bank of Thailand as of 30 September 2009
12.5
11.0
1.7
1.1
29

Q&AQ &A
HK000NDC
AppendiAppendix
HK000NDC
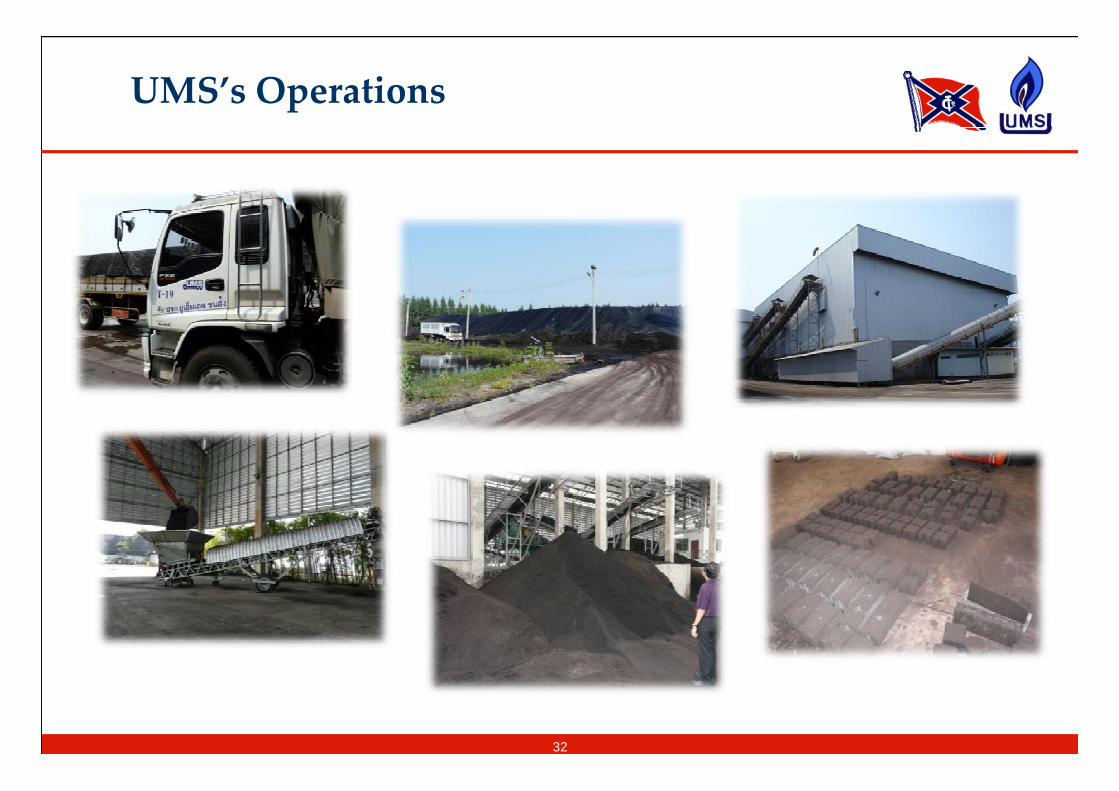
UMS’s Operations
32