Embed Size (px)
Citation preview

Tsunami WarningCAN CHINA’S CENTRAL AUTHORITIES STOP A
MASSIVE SURGE IN NEW COAL PLANTS CAUSED BY PROVINCIAL OVERPERMITTING?
Christine Shearer, Aiqun Yu, and Ted Nace
TSUNAMI WARNING
TSUNAMI WARNING | SEPTEMBER 2018 | 2COALSWARM
AUTHORSThis report was prepared by Christine Shearer, Aiqun Yu, and Ted Nace. Christine Shearer is a Researcher and Analyst for CoalSwarm. Aiqun Yu is China Researcher for CoalSwarm. Ted Nace is Executive Director for CoalSwarm.
ABOUT COALSWARMCoalSwarm is a global network of research-ers developing collaborative informational resources on fossil fuels and alternatives. Current projects include the Global Coal Plant
Tracker, the Global Fossil Projects Tracker (coal, oil, and gas infrastructure), the CoalWire newsletter, and the CoalSwarm and FrackSwarm wiki portals.
ABOUT THE GLOBAL COAL PLANT TRACKERThe Global Coal Plant Tracker is an online database that identifies, maps, describes, and categorizes every known coal-fired generating unit and every new unit proposed since January 1, 2010 (30 MW and larger). Developed by CoalSwarm, the tracker uses footnoted wiki pages to doc-ument each plant and is updated biannually. For further details, see Tracker Methodology at EndCoal.org.
PRODUCTIONDesign by Charlene Will. Additional design and page layout by David Van Ness.
PERMISSIONS/COPYRIGHTThis publication may be reproduced in whole or in part and in any form for educational or nonprofit purposes without special permission from the copyright holders, provided that acknowledgement of the source is made. No use of this publication may be made for resale or other commercial purpose without the written permission of the copyright holders.
Copyright © September 2018 by CoalSwarm and licensed for reuse under this Creative Commons License: http://bit.ly/2CQKoGw.
FURTHER RESOURCESFor additional data on proposed and existing coal plants, see Summary Statistics at EndCoal.org, which provides over 20 tables providing results from the Global Coal Plant Tracker (GPCT), broken down by province, nation, and region. For links to reports based on GPCT data, see Reports at EndCoal.org. To obtain primary data from the GCPT, contact Ted Nace ([email protected]).
TSUNAMI WARNING
TSUNAMI WARNING | SEPTEMBER 2018 | 3COALSWARM
EXECUTIVE SUMMARYLike an approaching tsunami triggered by a distant earthquake, a massive cohort of hundreds of new coal-fired power plants is on course to be added to the already overbuilt Chinese coal plant fleet. This wave of new capacity—comparable in size to the entire U.S. coal fleet—is the consequence of a little reported surge in permit approvals at the provincial level from late 2014 to early 2016.
While China’s central authorities have sought to mitigate the surge through a series of special regulatory measures, new satellite imagery and plant-by-plant research show the measures to have been only partially effective. Rather than cancelling unneeded coal plants, China’s offi-cials in many cases have merely rescheduled them.
There is still time to stop the wave, but China’s authorities must move quickly to cancel the unneeded projects. Otherwise the tsunami of coal power capacity will overwhelm China’s own coal cap and seriously undermine global climate goals.
This report, based on a plant-by-plant survey by CoalSwarm’s Global Coal Plant Tracker (GCPT) completed in July 2018, includes the following findings:
■■ 259 Gigawatts (GW) of new capacity are under development in China, compa-rable to the entire U.S. coal fleet (266 GW). If built, the new plants will increase China’s current coal fleet of 993 GW by 25%.
■■ The new capacity is the result of a permitting surge from late 2014 to early 2016, after a regulatory devolution from central to provincial authorities.
■■ In 2016 and 2017, central authorities sought to rein in the surge through a series of suspension orders.
■■ Contrary to previous reporting and analysis, many of the restrictions only delayed new projects rather than stopping them.
■■ Adding 259 GW of new coal power in China is wildly out of line with the Paris climate agreement. According to the IEA, a 50% chance of limiting future tem-perature increases to 1.75°C requires that China phase out its traditional coal plants by 2045.
■■ The surge in new projects will overwhelm China’s own 1100 GW coal cap in the country’s current Five-Year Plan.
■■ Cancelling the 259 GW of new coal plants would free up US$210 billion in capital expenditures, enough to build nearly 300 GW of solar PV or 175 GW of wind power.
TSUNAMI WARNING | SEPTEMBER 2018 | 4COALSWARM
Since 2016, the central government of China has made repeated efforts to rein in the overbuilding of new coal-fired power plants through a series of suspension policies. But new evidence based on satellite photog-raphy and official documents shows hundreds of coal projects still in development, on course to overwhelm the country’s own announced coal power cap and seriously undermine global climate goals.
According to a project-by-project survey completed in July 2018 by CoalSwarm’s Global Coal Plant Tracker, 259 gigawatts (GW)1 of coal-fired capacity are under development in China, comparable to the total installed coal power capacity of the United States (266 GW). Most of the capacity is the result of a mas-sive surge in new project approvals by provincial authorities from late 2014 to early 2016. Mitigating that surge has been the principal goal of subsequent central government measures, but CoalSwarm’s new survey shows those efforts have been significantly less effective than indicated by earlier media and analytical reports.
Coming on top of the 993 GW of coal power capacity already operating in China, the additional 259 GW put China on a trajectory to increase the size of its coal fleet by 25 percent and overshoot its own announced 1100 GW cap on coal-fired capacity during the current
1. A typical coal-fired unit in China has a gross electrical capacity between 350 megawatts (MW) and 1,000 MW, with most power stations having two or more units.
2. According to the Global CCS database, China has no coal plants operating or under construction with CCS technology.
Five-Year Plan (2016–2020). Recently, the central gov-ernment has begun restricting which newly completed plants can connect to the grid each year, perhaps to avoid exceeding the 1100 GW capacity cap. While such a tactic may technically preserve the official cap, behind the scenes there will be a growing reservoir of coal plants ready to operate as soon as authorized.
For climate prospects, adding 259 GW of new coal power capacity to the Chinese coal fleet is wildly out of line with the goals of the international Paris agree-ment, no matter what their start date. According to the International Energy Agency (IEA 2017), a 50% chance of limiting average future temperature increases to 1.75°C requires that China, with half of the world’s coal power capacity, close all coal plants without carbon capture and storage (CCS) by 2045.2 Such a phase-out requires aggressive retirement of existing coal plants, not the building of huge numbers of new ones.
China already has enough coal-fired power plants to meet its needs, with the average plant running less than half the time. Cancelling the current pipeline of 259 GW would free up US$210 billion in capital expenditures—funds that could be used to build nearly 300 GW of solar PV or 175 GW of onshore wind power in China and move the country toward decarbonization.
Tsunami Warning CAN CHINA’S CENTRAL AUTHORITIES STOP A MASSIVE SURGE
IN NEW COAL PLANTS CAUSED BY PROVINCIAL OVERPERMITTING?
Christine Shearer, Aiqun Yu, and Ted Nace
TSUNAMI WARNING
TSUNAMI WARNING | SEPTEMBER 2018 | 5COALSWARM
BACKGROUND: CONSTRUCTION ON STEROIDSAs with many economic dilemmas, China’s current crisis of excess coal plants is rooted in the country’s own success. Beginning in the late 1990s, the country developed unprecedented capabilities for building coal plants at a scale that had never been seen any-where in the world. Indeed, no country has ever developed more power capacity more quickly and cheaply.
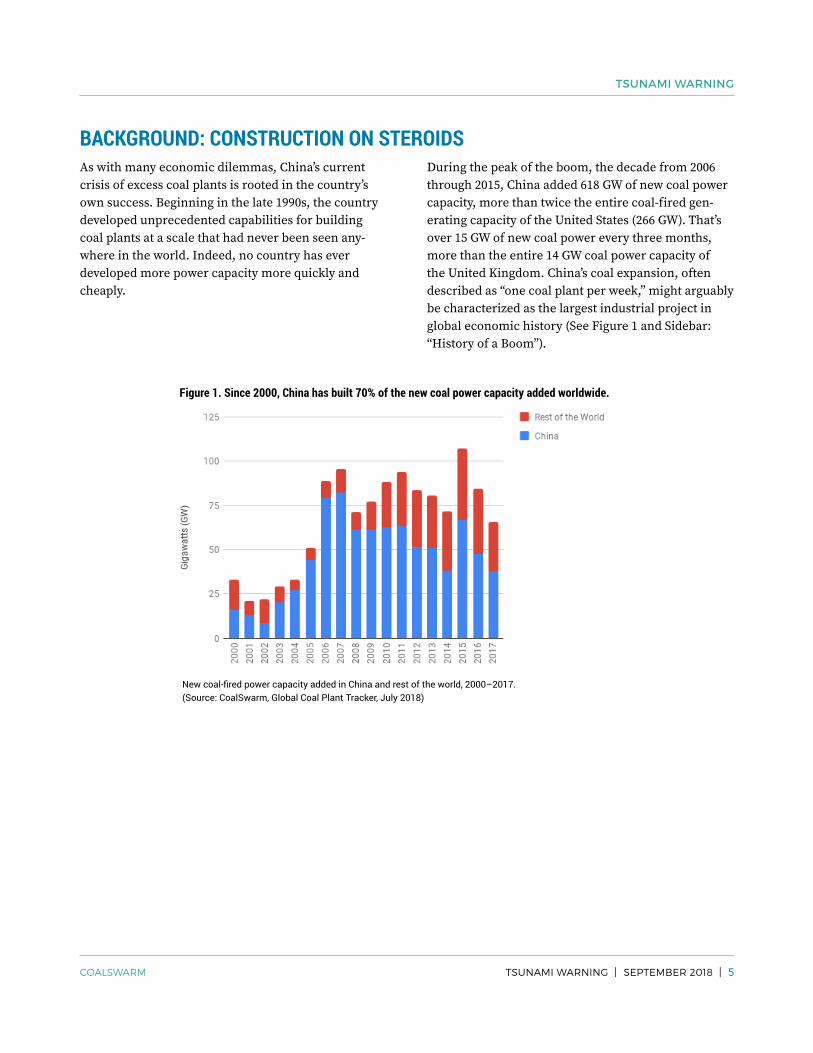
During the peak of the boom, the decade from 2006 through 2015, China added 618 GW of new coal power capacity, more than twice the entire coal-fired gen-erating capacity of the United States (266 GW). That’s over 15 GW of new coal power every three months, more than the entire 14 GW coal power capacity of the United Kingdom. China’s coal expansion, often described as “one coal plant per week,” might arguably be characterized as the largest industrial project in global economic history (See Figure 1 and Sidebar: “History of a Boom”).
Figure 1. Since 2000, China has built 70% of the new coal power capacity added worldwide.
New coal-fired power capacity added in China and rest of the world, 2000–2017. (Source: CoalSwarm, Global Coal Plant Tracker, July 2018)
TSUNAMI WARNING
TSUNAMI WARNING | SEPTEMBER 2018 | 6COALSWARM
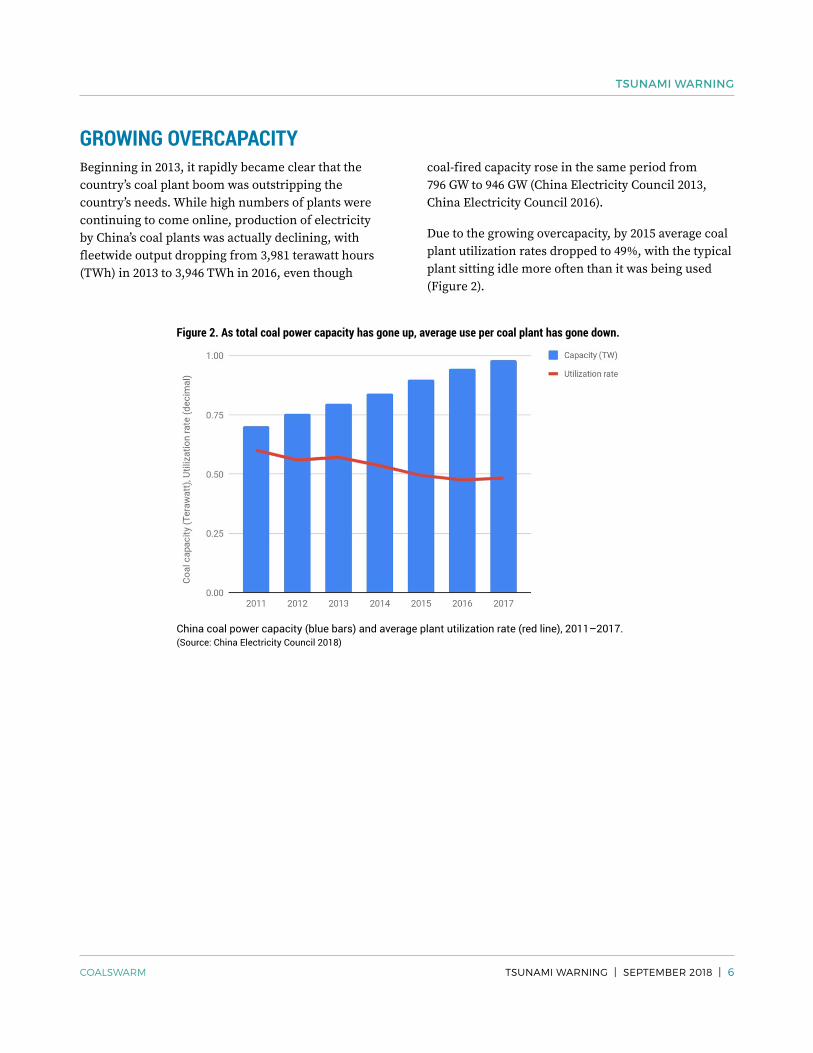
GROWING OVERCAPACITYBeginning in 2013, it rapidly became clear that the country’s coal plant boom was outstripping the country’s needs. While high numbers of plants were continuing to come online, production of electricity by China’s coal plants was actually declining, with fleetwide output dropping from 3,981 terawatt hours (TWh) in 2013 to 3,946 TWh in 2016, even though
coal-fired capacity rose in the same period from 796 GW to 946 GW (China Electricity Council 2013, China Electricity Council 2016).
Due to the growing overcapacity, by 2015 average coal plant utilization rates dropped to 49%, with the typical plant sitting idle more often than it was being used (Figure 2).
Figure 2. As total coal power capacity has gone up, average use per coal plant has gone down.
China coal power capacity (blue bars) and average plant utilization rate (red line), 2011–2017. (Source: China Electricity Council 2018)
TSUNAMI WARNING
TSUNAMI WARNING | SEPTEMBER 2018 | 7COALSWARM
PERMITTING EXPLODESFinding itself in the midst of a worsening overcapac-ity problem, the Chinese government implemented measures that proved to be highly counterproductive: a decentralization program that moved coal plant permitting authority from Beijing to individual prov-inces. In September 2014, authority over coal plant construction approvals was moved from the National Development and Reform Commission (NDRC) to the provincial DRCs. In March 2015, environmental impact assessment (EIA) approvals by the Ministry of Environmental Protection (MEP) were moved to the provincial Environmental Protection Bureaus (EPBs).
The measures were reportedly intended to help prov-inces make investment decisions that better aligned their local power demand with supply, with the central government limiting its role to creating total capacity limits and policy guidelines. In practice the devolution of authority resulted in an unprecedented surge in permits, as local authorities raced to approve projects they believed would stimulate local econo-mies and benefit economic interests with influence at the provincial level.
Provincial regulators soon showed themselves to be far more lenient than the central authorities, moving quickly to grant permits that had sat for several years on federal waiting lists, and even retroactively approv-ing 15 GW of coal power plants that had been illegally operating for years without permits. Prior to hand-ing authority to the provincial EPB, the federal MEP had vetoed two projects from Shanxi Province due to emission concerns in an already over-polluted area. Shanxi’s EPB reapproved these two projects immedi-ately after it received the authority, then approved 21 similar projects in seven months.
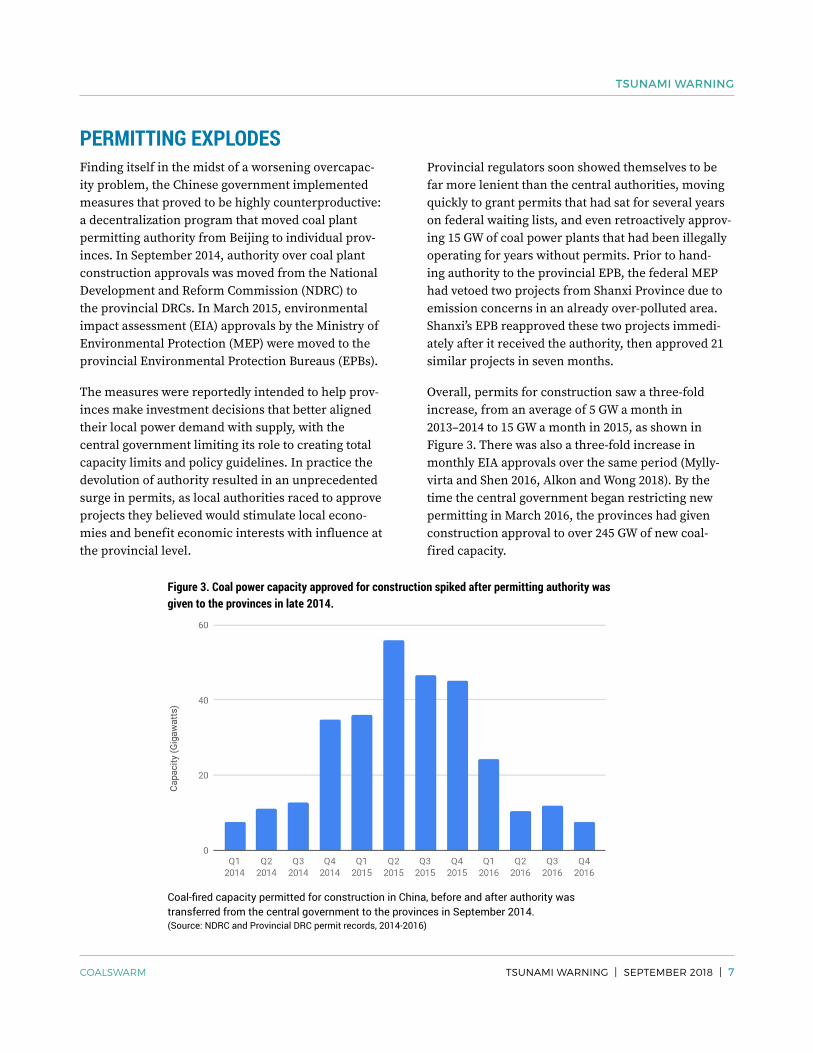
Overall, permits for construction saw a three-fold increase, from an average of 5 GW a month in 2013–2014 to 15 GW a month in 2015, as shown in Figure 3. There was also a three-fold increase in monthly EIA approvals over the same period (Mylly-virta and Shen 2016, Alkon and Wong 2018). By the time the central government began restricting new permitting in March 2016, the provinces had given construction approval to over 245 GW of new coal-fired capacity.
Figure 3. Coal power capacity approved for construction spiked after permitting authority was given to the provinces in late 2014.
Coal-fired capacity permitted for construction in China, before and after authority was transferred from the central government to the provinces in September 2014. (Source: NDRC and Provincial DRC permit records, 2014-2016)
TSUNAMI WARNING
TSUNAMI WARNING | SEPTEMBER 2018 | 8COALSWARM
CHINA’S AUTHORITIES ATTEMPT TO ADDRESS THE OVERCAPACITY PROBLEMBeginning in March 2016, central authorities took action to address the overcapacity problem, by means of a series of special edicts issued by the National Development and Reform Commission (NDRC) and its energy branch, the National Energy Administration (NEA). Initially, these announcements laid out a vari-ety of measures aimed at reducing the amount of coal power capacity permitted or entering construction; later announcements also targeted projects that had already begun construction.
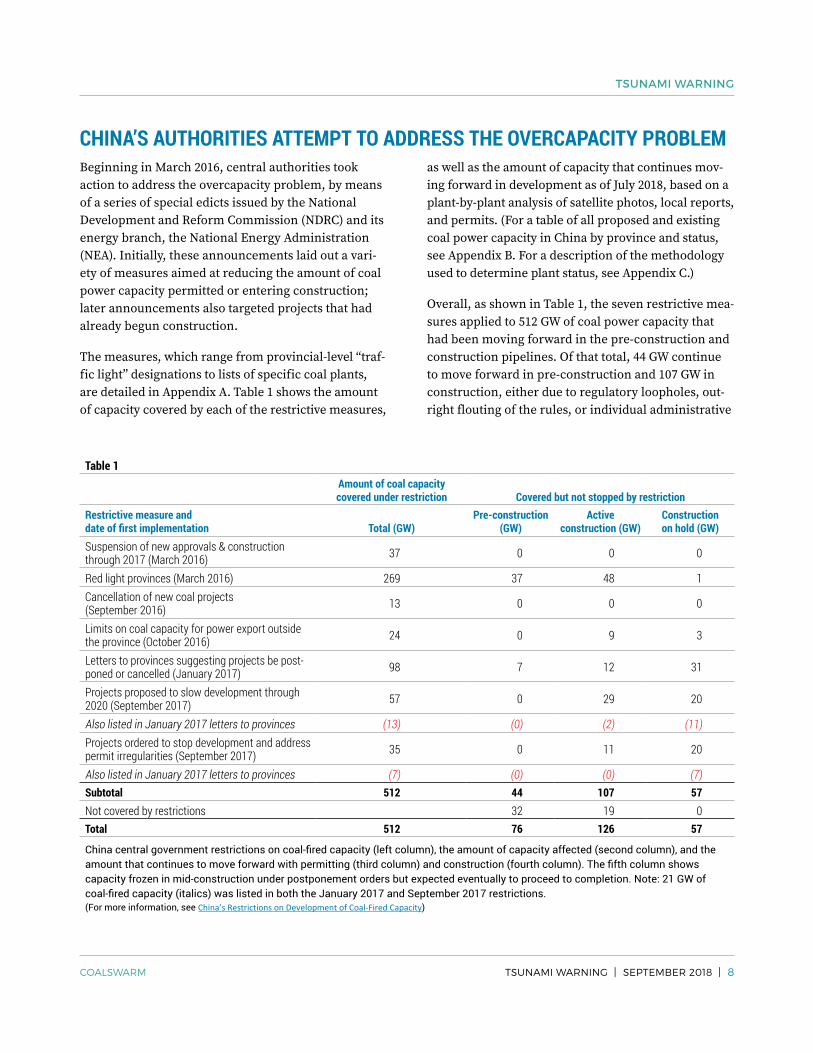
The measures, which range from provincial-level “traf-fic light” designations to lists of specific coal plants, are detailed in Appendix A. Table 1 shows the amount of capacity covered by each of the restrictive measures,
as well as the amount of capacity that continues mov-ing forward in development as of July 2018, based on a plant-by-plant analysis of satellite photos, local reports, and permits. (For a table of all proposed and existing coal power capacity in China by province and status, see Appendix B. For a description of the methodology used to determine plant status, see Appendix C.)
Overall, as shown in Table 1, the seven restrictive mea-sures applied to 512 GW of coal power capacity that had been moving forward in the pre-construction and construction pipelines. Of that total, 44 GW continue to move forward in pre-construction and 107 GW in construction, either due to regulatory loopholes, out-right flouting of the rules, or individual administrative
Table 1Amount of coal capacity covered under restriction Covered but not stopped by restriction
Restrictive measure and date of first implementation Total (GW)
Pre-construction (GW)
Active construction (GW)
Construction on hold (GW)
Suspension of new approvals & construction through 2017 (March 2016) 37 0 0 0
Red light provinces (March 2016) 269 37 48 1Cancellation of new coal projects (September 2016) 13 0 0 0
Limits on coal capacity for power export outside the province (October 2016) 24 0 9 3
Letters to provinces suggesting projects be post-poned or cancelled (January 2017) 98 7 12 31
Projects proposed to slow development through 2020 (September 2017) 57 0 29 20
Also listed in January 2017 letters to provinces (13) (0) (2) (11)Projects ordered to stop development and address permit irregularities (September 2017) 35 0 11 20
Also listed in January 2017 letters to provinces (7) (0) (0) (7)Subtotal 512 44 107 57Not covered by restrictions 32 19 0Total 512 76 126 57
China central government restrictions on coal-fired capacity (left column), the amount of capacity affected (second column), and the amount that continues to move forward with permitting (third column) and construction (fourth column). The fifth column shows capacity frozen in mid-construction under postponement orders but expected eventually to proceed to completion. Note: 21 GW of coal-fired capacity (italics) was listed in both the January 2017 and September 2017 restrictions. (For more information, see China’s Restrictions on Development of Coal-Fired Capacity)
TSUNAMI WARNING
TSUNAMI WARNING | SEPTEMBER 2018 | 9COALSWARM
exemptions under the increasingly opaque regulatory regime. An additional 57 GW are currently frozen in mid-construction under postponement orders but are expected eventually to proceed to completion.
The most significant 2016 policy was the “traffic light” system, which assigned each province a color to signify the the severity of restrictions that were being placed on its coal pipeline. The policy initially put all but four provinces under red light status, meaning the policy’s prohibition on new coal plant permits and new construction initially applied throughout much of the country. However, the number of provinces with a green or orange light allowing for new coal development increased to six in 2017 and ten in 2018. The policy also includes a number of loopholes that have allowed 85 GW of coal power capacity in red light provinces to advance. The loopholes include exemp-tions for plants in districts designated as economically underdeveloped, plants exporting electricity from northwestern “power bases” to eastern cities, and—most commonly—plants that provide steam heat to residential areas.
In 2017 the central government began naming spe-cific projects in its restrictions, mainly projects in advanced stages of permitting or construction. While the 2017 restrictions do not have multiple exemptions like the red light policy, they have proven to be loosely designed and enforced, allowing many plants to advance in development.
The January 2017 action consisted of letters to provin-cial authorities that proposed the postponement of 95 GW of coal capacity for development after 2020, and cancelled another 3 GW of pre-construction capacity. Many news reports at the time mistakenly character-ized this entire cohort of projects as being cancelled (e.g. Forsythe 2017). However, 50 GW appear likely to be built, including 7 GW that have received permits since January 2017, 12 GW shown to have further
construction activity since January 2017, and 31 GW that are currently frozen in mid-construction but expected to eventually resume construction and be completed.
In September 2017, the NEA ordered 57 GW of coal-fired capacity by name to slow down construction progress from 2017 to 2020, and prohibited the plants from connecting to the grid in 2017. Yet satellite data suggests about half of that capacity (29 GW) does not appear to have slowed construction much, if at all. The main effect of the policy appears to have been to limit the number of plants allowed to come online in 2017, with newly commissioned coal plants falling from the 2006–2016 annual average of 61 GW to 38 GW in 2017. However, this drop is misleading, since analysis of sat-ellite data suggests additional coal power capacity was actually completed in 2017, but barred from connect-ing to the grid.
The September 2017 policy also ordered the owners of 35 GW of coal power capacity to stop development or operation altogether until problems with permitting or regulation were resolved. As of July 2018, satellite imagery shows that 11 GW of the 35 GW have already resumed construction, either flouting the policy or securing permission quietly and without public notice. It appears likely that the additional 24 GW will also eventually be commissioned, once the permitting or regulatory issues have been resolved. Some of the projects that appear to violate this policy include:
■■ Linyou Waste Coal power station - Planet Labs satellite photos from July 2017 to May 2018 show construction continued without stop at a rapid pace, with the coal plant near completion.
■■ Shangluo power station - Planet Labs satellite photos from July and November 2017 show that construction continued immediately after the suspension.
TSUNAMI WARNING
TSUNAMI WARNING | SEPTEMBER 2018 | 10COALSWARM
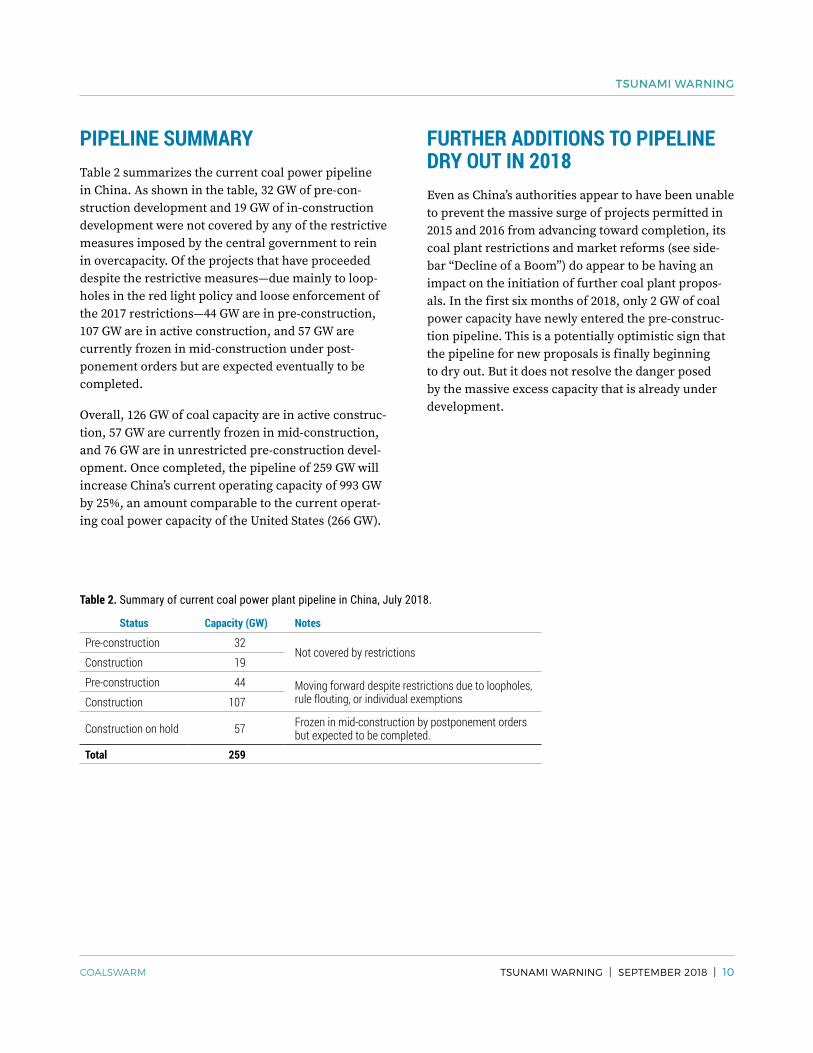
PIPELINE SUMMARYTable 2 summarizes the current coal power pipeline in China. As shown in the table, 32 GW of pre-con-struction development and 19 GW of in-construction development were not covered by any of the restrictive measures imposed by the central government to rein in overcapacity. Of the projects that have proceeded despite the restrictive measures—due mainly to loop-holes in the red light policy and loose enforcement of the 2017 restrictions—44 GW are in pre-construction, 107 GW are in active construction, and 57 GW are currently frozen in mid-construction under post-ponement orders but are expected eventually to be completed.
Overall, 126 GW of coal capacity are in active construc-tion, 57 GW are currently frozen in mid-construction, and 76 GW are in unrestricted pre-construction devel-opment. Once completed, the pipeline of 259 GW will increase China’s current operating capacity of 993 GW by 25%, an amount comparable to the current operat-ing coal power capacity of the United States (266 GW).
FURTHER ADDITIONS TO PIPELINE DRY OUT IN 2018Even as China’s authorities appear to have been unable to prevent the massive surge of projects permitted in 2015 and 2016 from advancing toward completion, its coal plant restrictions and market reforms (see side-bar “Decline of a Boom”) do appear to be having an impact on the initiation of further coal plant propos-als. In the first six months of 2018, only 2 GW of coal power capacity have newly entered the pre-construc-tion pipeline. This is a potentially optimistic sign that the pipeline for new proposals is finally beginning to dry out. But it does not resolve the danger posed by the massive excess capacity that is already under development.
Table 2. Summary of current coal power plant pipeline in China, July 2018.
Status Capacity (GW) Notes
Pre-construction 32Not covered by restrictions
Construction 19
Pre-construction 44 Moving forward despite restrictions due to loopholes, rule flouting, or individual exemptionsConstruction 107
Construction on hold 57 Frozen in mid-construction by postponement orders but expected to be completed.
Total 259
TSUNAMI WARNING
TSUNAMI WARNING | SEPTEMBER 2018 | 11COALSWARM
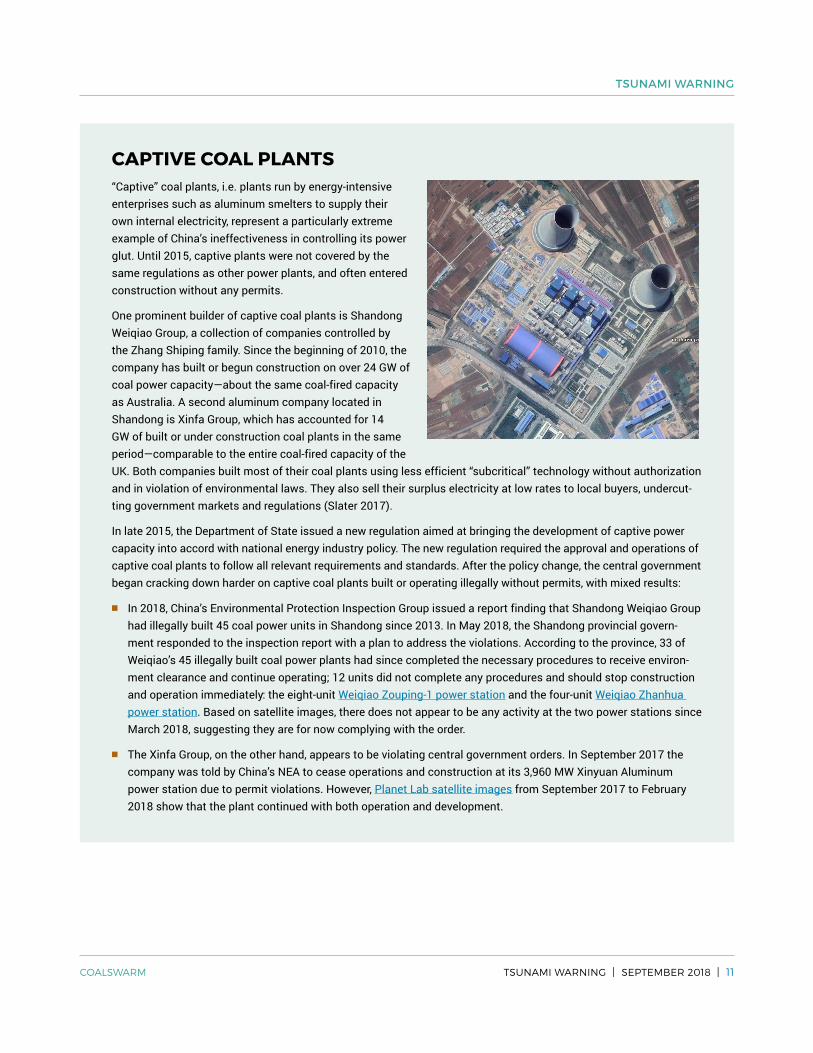
CAPTIVE COAL PLANTS“Captive” coal plants, i.e. plants run by energy- intensive enterprises such as aluminum smelters to supply their own internal electricity, represent a particularly extreme example of China’s ineffectiveness in controlling its power glut. Until 2015, captive plants were not covered by the same regulations as other power plants, and often entered construction without any permits.
One prominent builder of captive coal plants is Shandong Weiqiao Group, a collection of companies controlled by the Zhang Shiping family. Since the beginning of 2010, the company has built or begun construction on over 24 GW of coal power capacity—about the same coal-fired capacity as Australia. A second aluminum company located in Shandong is Xinfa Group, which has accounted for 14 GW of built or under construction coal plants in the same period—comparable to the entire coal-fired capacity of the UK. Both companies built most of their coal plants using less efficient “subcritical” technology without authorization and in violation of environmental laws. They also sell their surplus electricity at low rates to local buyers, undercut-ting government markets and regulations (Slater 2017).
In late 2015, the Department of State issued a new regulation aimed at bringing the development of captive power capacity into accord with national energy industry policy. The new regulation required the approval and operations of captive coal plants to follow all relevant requirements and standards. After the policy change, the central government began cracking down harder on captive coal plants built or operating illegally without permits, with mixed results:
■■ In 2018, China’s Environmental Protection Inspection Group issued a report finding that Shandong Weiqiao Group had illegally built 45 coal power units in Shandong since 2013. In May 2018, the Shandong provincial govern-ment responded to the inspection report with a plan to address the violations. According to the province, 33 of Weiqiao’s 45 illegally built coal power plants had since completed the necessary procedures to receive environ-ment clearance and continue operating; 12 units did not complete any procedures and should stop construction and operation immediately: the eight-unit Weiqiao Zouping-1 power station and the four-unit Weiqiao Zhanhua power station. Based on satellite images, there does not appear to be any activity at the two power stations since March 2018, suggesting they are for now complying with the order.
■■ The Xinfa Group, on the other hand, appears to be violating central government orders. In September 2017 the company was told by China’s NEA to cease operations and construction at its 3,960 MW Xinyuan Aluminum power station due to permit violations. However, Planet Lab satellite images from September 2017 to February 2018 show that the plant continued with both operation and development.
TSUNAMI WARNING
TSUNAMI WARNING | SEPTEMBER 2018 | 12COALSWARM
CHINA’S COAL POWER CAP AND INTERNATIONAL CLIMATE GOALS AT RISK
3. CoalSwarm’s Global Coal Plant Tracker estimated the figure to be 936 GW in 2017, not including units under 30 MW.
4. Coal power retirements in China have averaged under 6 GW a year since 2010.
An important metric for China’s Power Sector Thir-teenth Five-Year Plan (2016–2020) is the 1100 GW cap on the overall size of the country’s coal plant fleet. Many analysts argue that the cap far exceeds the country’s needs, as China already has redundant coal power capacity and falling utilization rates (Feng et al. 2018, Li 2017, Gray 2016). Even so, that cap now appears to be at risk of being surpassed.
At the end of 2017, China’s coal fleet stood at 981 GW, according to the China Electricity Council (2018).3 CoalSwarm estimates 12 GW were commissioned in the first six months of 2018, putting total coal power capacity at 993 GW. This allows only 107 GW of further capacity to be added through 2020, minus retirements, without violating the 1100 GW cap.4
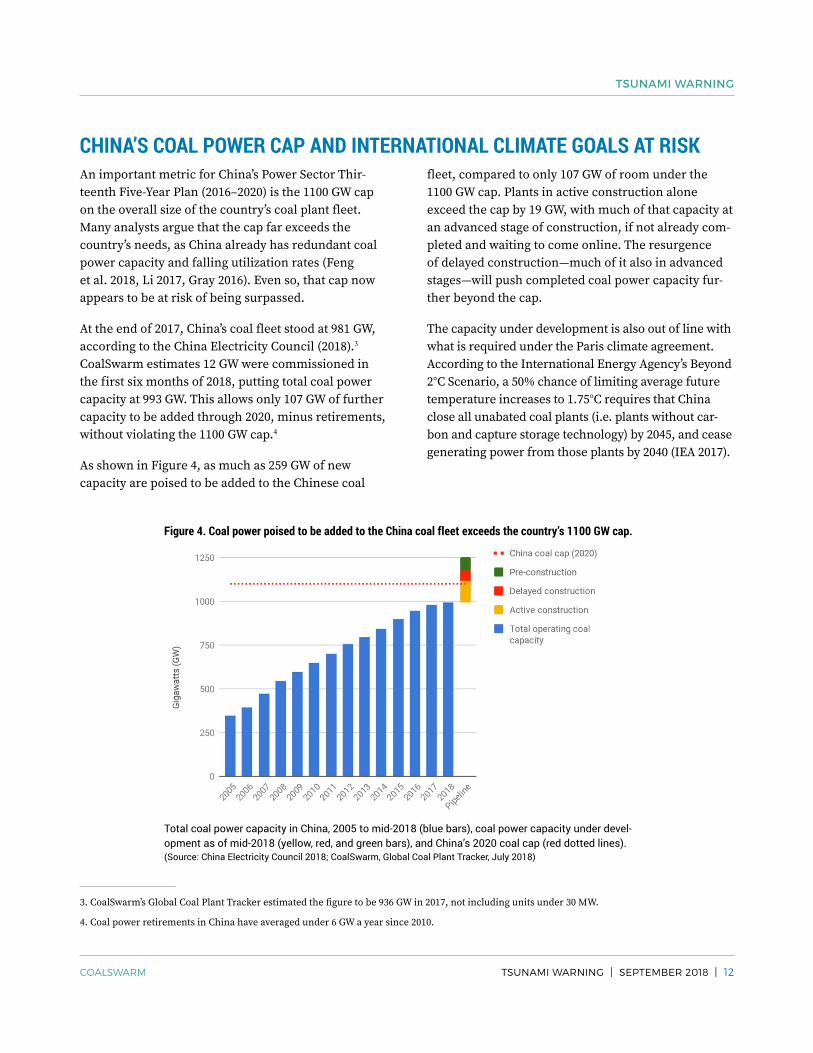
As shown in Figure 4, as much as 259 GW of new capacity are poised to be added to the Chinese coal
fleet, compared to only 107 GW of room under the 1100 GW cap. Plants in active construction alone exceed the cap by 19 GW, with much of that capacity at an advanced stage of construction, if not already com-pleted and waiting to come online. The resurgence of delayed construction—much of it also in advanced stages—will push completed coal power capacity fur-ther beyond the cap.
The capacity under development is also out of line with what is required under the Paris climate agreement. According to the International Energy Agency’s Beyond 2°C Scenario, a 50% chance of limiting average future temperature increases to 1.75°C requires that China close all unabated coal plants (i.e. plants without car-bon and capture storage technology) by 2045, and cease generating power from those plants by 2040 (IEA 2017).
Figure 4. Coal power poised to be added to the China coal fleet exceeds the country’s 1100 GW cap.
Total coal power capacity in China, 2005 to mid-2018 (blue bars), coal power capacity under devel-opment as of mid-2018 (yellow, red, and green bars), and China’s 2020 coal cap (red dotted lines). (Source: China Electricity Council 2018; CoalSwarm, Global Coal Plant Tracker, July 2018)
TSUNAMI WARNING
TSUNAMI WARNING | SEPTEMBER 2018 | 13COALSWARM
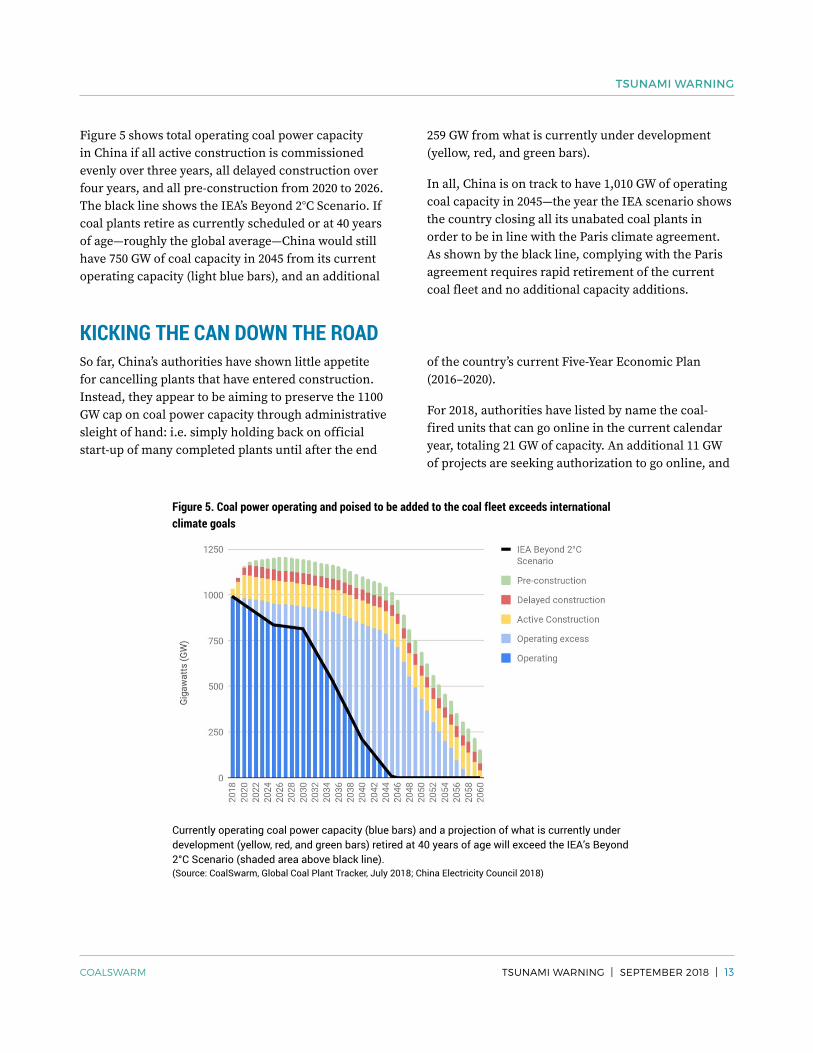
Figure 5 shows total operating coal power capacity in China if all active construction is commissioned evenly over three years, all delayed construction over four years, and all pre-construction from 2020 to 2026. The black line shows the IEA’s Beyond 2°C Scenario. If coal plants retire as currently scheduled or at 40 years of age—roughly the global average—China would still have 750 GW of coal capacity in 2045 from its current operating capacity (light blue bars), and an additional
259 GW from what is currently under development (yellow, red, and green bars).
In all, China is on track to have 1,010 GW of operating coal capacity in 2045—the year the IEA scenario shows the country closing all its unabated coal plants in order to be in line with the Paris climate agreement. As shown by the black line, complying with the Paris agreement requires rapid retirement of the current coal fleet and no additional capacity additions.
KICKING THE CAN DOWN THE ROADSo far, China’s authorities have shown little appetite for cancelling plants that have entered construction. Instead, they appear to be aiming to preserve the 1100 GW cap on coal power capacity through administrative sleight of hand: i.e. simply holding back on official start-up of many completed plants until after the end
of the country’s current Five-Year Economic Plan (2016–2020).
For 2018, authorities have listed by name the coal-fired units that can go online in the current calendar year, totaling 21 GW of capacity. An additional 11 GW of projects are seeking authorization to go online, and
Figure 5. Coal power operating and poised to be added to the coal fleet exceeds international climate goals
Currently operating coal power capacity (blue bars) and a projection of what is currently under development (yellow, red, and green bars) retired at 40 years of age will exceed the IEA’s Beyond 2°C Scenario (shaded area above black line). (Source: CoalSwarm, Global Coal Plant Tracker, July 2018; China Electricity Council 2018)
TSUNAMI WARNING
TSUNAMI WARNING | SEPTEMBER 2018 | 14COALSWARM
it is not yet clear how much completed capacity will be authorized for operation in 2018, and how much will be postponed to a later date.
Presumably limits on total operating capacity could also be imposed in 2019 and 2020, and be designed to keep the operating coal fleet technically under the 1100 GW cap. But such limits do not actually address
5. Based on IEA “overnight costs” (pre-construction, construction, and contingency costs, not including interest) for generating technologies in China: US$813/kW for ultra-supercritical coal plants (the most commonly installed in China), US$728/kW for commercial solar PV, and US$1200 for onshore wind.
the overcapacity problem, which can only be solved by cancelling capacity outright, not by rescheduling it. Any solution based on shifting start dates would be illusory, since it would simply create a growing reser-voir of fully completed plants that are ready to begin operating after the end of 2020, as soon as they receive authorization from the central government.
CONCLUSION: CHINA’S OVERBUILDING THREATENS ITS ECONOMY AND THE GLOBAL CLIMATEGuaranteed tariffs, easy access to cheap credit, and a recent permitting spree by provincial authorities have led to a rapid build-up of coal power capac-ity in China, far exceeding the country’s needs. In response, China’s central government began imple-menting a series of restrictive measures in 2016, but loopholes and loose enforcement have weakened their effectiveness. As a result, 259 GW of new coal power capacity are now poised to be added to an already crowded coal fleet. While China’s central government appears reluctant to cancel these plants, doing so would both benefit China’s economy and keep global climate goals within reach.
China already has more than enough power capacity to meet its needs, with the average coal plant run-ning only half the time. Construction of an additional 259 GW of coal plants represents approximately US$210 billion in wasted capital expenditures—funds that could be used to build 289 GW of solar PV or 175 GW of onshore wind power in China (IEA 2015).5 Excess coal power also puts coal plant owners in competition with alternatives, locking out the building of lower-carbon capacity and encouraging restrictive
policies such as curtailment of wind power—i.e. forced reductions in the amount of energy that may be trans-mitted into the grid.
Moreover, while subsidized loans and tariffs guaran-teed by the central government may make coal plants profitable now, that situation is likely to soon change as the country’s power sector transitions (for more details, see sidebar “Decline of a Boom”). As more coal plants face competitive markets and restricted operating hours, they will be unable to secure the tariffs needed to recoup development costs. Adding even more coal power capacity will only heighten the problem of reduced grid access and tariffs.
Finally, the sheer size of China’s coal fleet—48% of the global total—means China’s coal policies have an outsized effect on global climate prospects. Yet China’s current development puts it on a trajectory to have 1,010 GW of operating coal capacity in 2045, the year it should have phased out its unabated coal plants. To meet Paris climate goals, China’s central government needs to aggressively retire its existing coal plants, not build huge numbers of new ones.
TSUNAMI WARNING
TSUNAMI WARNING | SEPTEMBER 2018 | 15COALSWARM
HISTORY OF A BOOMFrom 1979 to 2017, China’s real gross domestic product grew at 9.5% a year, a pace described by the World Bank as “the fastest sustained expansion by a major economy in history” (Morrison 2018). The country’s growth strategy emphasized heavy industry fueled predominantly by coal, with most of the country’s power consumption going toward industry (China Electricity Council 2018).
The rapid expansion of coal power capacity, in turn, was driven by high levels of capital spending funded by easily accessible financing. China’s banking system is largely dominated by state-owned entities, which are used by the Chinese central government to issue loans at subsidized rates to boost credit and meet growth objectives. Bank lending for plants also has implicit gov-ernment backing, with minimal due diligence (Spencer et al. 2017). China’s investment spending makes up half of China’s GDP, compared to around 20% in developed economies (Myllyvirta and Shen 2016).
In addition to large amounts of subsidized credit, coal plant building has been enabled by coal-friendly policies: First, the country’s electricity tariffs cover operating costs while guaranteeing a return on investment for an average plant. Second, the country’s “equal share dispatch” scheme generally allocates equal operating hours to all plants in a region, allowing costlier, emis-sions-intensive plants to run just as much as more efficient ones. Third, some utility contracts provide a guaranteed allotment of hours during which coal plants can sell power to the grid.
An analysis by the Chinese National Institute of Finan-cial Research argues that such implicit government assurances are a key driver of overcapacity in China (Ning 2017). Both investors and banks have come to expect guaranteed returns, leading to excessive and risky investments.
Further encouraging continued capacity expansion is the uniquely low cost of building new coal plants in China. With the benefit of low labor costs and commod-ity prices, large average plant sizes, and economies of scale, Chinese coal plants cost a third to half as much per MW as the global average (Hervé-Mignucci and Wang 2015). Operating costs are also relatively low,
since China’s newest plants lead the world in efficiency. The Coal Power Energy Saving and Emission Reduc-tion Upgrade Action Plan, introduced in 2014, requires that all new plants be at least 600 MW in size and use ultra-supercritical combustion technology (Hervé- Mignucci and Wang 2015).
DECLINE OF A BOOMWhile government subsidies and tariffs may guaran-tee profits for coal plants now, that situation is likely to change soon. In 2015, China announced plans to move toward a more market-based organization of the electricity sector to replace regulated pricing and “equal share dispatch.” Coal power projects permitted by the provincial DRCs after March 15, 2015, will no longer have guaranteed hours and will have to compete in wholesale electricity markets. The shift towards competitive energy procurement and dispatch has already decreased tariffs received by coal plants in pilot provinces (Zhao et al. 2017).
In addition, the Chinese government began implement-ing a national carbon trading market in 2017. Coal plant owners will have to purchase carbon permits to offset their greenhouse gas emissions, raising the input costs of the plants and making them less competitive com-pared to lower-carbon alternatives (Zhao et al. 2017). Also, the central government has begun mandating that grid companies purchase a minimum number of hours for renewable power, which will cut into coal plant’s preferential access to the grid and further lower their utilization hours (Alkon and Wong 2018).
Finally, in 2017 the central government began regulating the number of new coal plants allowed to connect to the grid. The move means surplus coal power capacity will be unable to immediately come online and begin recouping development costs. The average coal plant is already operating for fewer and fewer hours while over-all power capacity continues to grow (China Electricity Council 2018). Recent estimates find China already has excess coal power capacity far beyond its needs, repre-senting “stranded assets” unable to earn an economic return on investment (Feng et al. 2018, Myllyvirta and Shen 2016, Gray 2016).
TSUNAMI WARNING
TSUNAMI WARNING | SEPTEMBER 2018 | 16COALSWARM
APPENDIX A
CHINA’S RESTRICTIVE MEASURES ON COAL PLANT DEVELOPMENT, 2016–2018
In response to growing overcapacity, the central gov-ernment began introducing a series of restrictions and proposals to slow development on nearly all new coal plants, with some exemptions. This was followed in 2017 by the naming of specific projects for postpone-ment. Policies and proposals included:
March 17, 2016. China’s NRDC ordered 13 provinces and regions with excess coal-fired power capacity to halt all new project approvals until 2017. With some overlap, 15 provinces were told to delay the construc-tion of approved projects until after 2017. Exemptions to the policy included coal plants for residential heating and power, projects in “coal power bases” exporting power to other provinces, and projects supporting poverty reduction in “revolutionary” areas (i.e. rural districts that supported the Chinese revo-lutionary struggle and typically remain economically underdeveloped) and poor areas.
March 17, 2016. China’s National Energy Adminis-tration (NEA), which oversees the country’s energy policies, released the Coal Bubble Alert System, dubbed the “traffic light” system. The System intro-duced a coal power planning risk management mechanism for provinces based on three factors: 1) the profitability of their coal-fired generation, 2) the adequacy of their existing coal capacity, and 3) their “resource constraints,” such as water availability and air quality. Based on these three factors, each province was assigned a color to signify the viability of its coal pipeline. Red means no new coal projects should be permitted. Orange indicates local governments should tread carefully. Green indicates space for new coal. The policy had the same exemptions as the March 17, 2016 NRDC order.
September 13, 2016. The NEA canceled 15 new coal projects (13 GW) in nine provinces.
October 10, 2016. The NEA suspended construction that began in 2016 or later in all provinces with a red light under the traffic light system, if the power from the plants is for use within the province (i.e. not exported). It also ordered projects in coal power bases that were designed to export power to other provinces to “scale down” to about half of the planned capacity within 2020. Exemptions included coal plants for resi-dential heating and power, as well as projects in poor areas and national demonstration projects.
November 7, 2016. China’s Power Sector 13th Five-Year Plan (2016–2020) placed a cap on total coal power capacity of 1,100 GW in 2020.
January 16, 2017. To help meet the coal capacity limit set out in China’s 13th Five-Year Plan, NEA sent letters to 13 provinces proposing the suspension of specific coal plants under planning or construction, totaling 95 GW of capacity. In the letters, it said the projects included should be postponed to the 14th Five-Year Plan (2021–2025). In addition, 3 GW of pre-construc-tion coal plant capacity were cancelled.
September 26, 2017. NEA ordered 58 GW of coal-fired capacity to slow down construction progress from 2017 to 2020, and prohibited them from connecting to the grid in 2017. In addition, 35 GW were halted indef-initely for permitting and regulation violations. The list partly overlapped with the projects listed in the January NEA letter to 13 provinces (21 GW total).
TSUNAMI WARNING
TSUNAMI WARNING | SEPTEMBER 2018 | 17COALSWARM
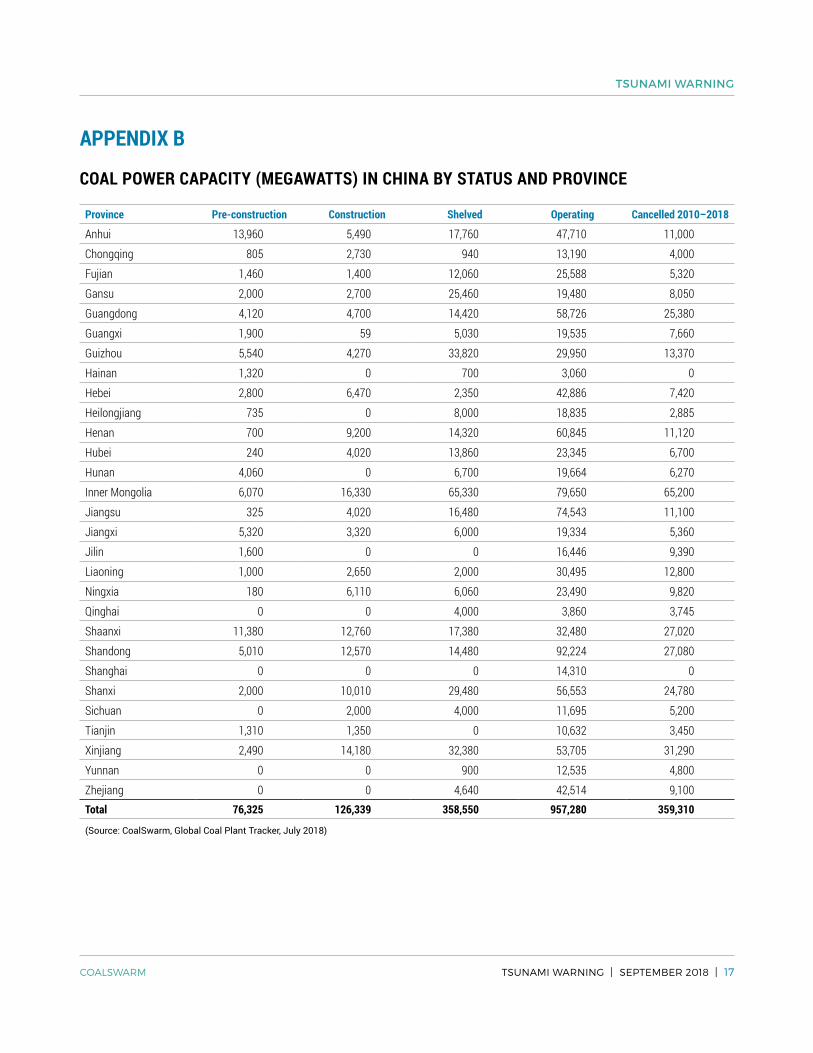
APPENDIX B
COAL POWER CAPACITY (MEGAWATTS) IN CHINA BY STATUS AND PROVINCE
Province Pre-construction Construction Shelved Operating Cancelled 2010–2018
Anhui 13,960 5,490 17,760 47,710 11,000
Chongqing 805 2,730 940 13,190 4,000
Fujian 1,460 1,400 12,060 25,588 5,320
Gansu 2,000 2,700 25,460 19,480 8,050
Guangdong 4,120 4,700 14,420 58,726 25,380
Guangxi 1,900 59 5,030 19,535 7,660
Guizhou 5,540 4,270 33,820 29,950 13,370
Hainan 1,320 0 700 3,060 0
Hebei 2,800 6,470 2,350 42,886 7,420
Heilongjiang 735 0 8,000 18,835 2,885
Henan 700 9,200 14,320 60,845 11,120
Hubei 240 4,020 13,860 23,345 6,700
Hunan 4,060 0 6,700 19,664 6,270
Inner Mongolia 6,070 16,330 65,330 79,650 65,200
Jiangsu 325 4,020 16,480 74,543 11,100
Jiangxi 5,320 3,320 6,000 19,334 5,360
Jilin 1,600 0 0 16,446 9,390
Liaoning 1,000 2,650 2,000 30,495 12,800
Ningxia 180 6,110 6,060 23,490 9,820
Qinghai 0 0 4,000 3,860 3,745
Shaanxi 11,380 12,760 17,380 32,480 27,020
Shandong 5,010 12,570 14,480 92,224 27,080
Shanghai 0 0 0 14,310 0
Shanxi 2,000 10,010 29,480 56,553 24,780
Sichuan 0 2,000 4,000 11,695 5,200
Tianjin 1,310 1,350 0 10,632 3,450
Xinjiang 2,490 14,180 32,380 53,705 31,290
Yunnan 0 0 900 12,535 4,800
Zhejiang 0 0 4,640 42,514 9,100Total 76,325 126,339 358,550 957,280 359,310
(Source: CoalSwarm, Global Coal Plant Tracker, July 2018)
TSUNAMI WARNING
TSUNAMI WARNING | SEPTEMBER 2018 | 18COALSWARM
APPENDIX C
METHODOLOGY
The data in this report is based on a project-by-project survey completed in July 2018 by CoalSwarm, as part of the Global Coal Plant Tracker (GCPT) database. The database tracks every coal-fired unit in the world 30 MW and larger, including all known operating units and all units proposed or retired since 2010. The GCPT also features a footnoted wiki page for each plant in the database, including location data. The GCPT tracks coal plants used for power generation and combined heat and power, as well as plants used for captive industrial use.
For China, the plants covered by each restrictive mea-sure were identified, including consideration of which plants fell under the various loopholes in the policies. Government permitting data, Chinese news reports, and satellite imagery were then used to identify the developmental status of each plant, and whether the
plant was progressing toward completion. Satellite imagery from Planet Labs allowed for date-specific comparisons of construction activity.
Each plant ordered to slow or postpone its construc-tion development was analyzed using Planet Labs satellite data. Units that showed further construction progress after the restriction measure were marked as active construction. Units that did not show further construction progress after the restriction measure were marked as shelved construction (i.e. on hold).
Pre-construction includes plants that have appeared in corporate or government plans, that have completed feasibility studies, or that have sought or received per-mits. Any coal plant proposal without activity for two years or more is marked shelved, and projects with no activity for four years or more are marked cancelled.
TSUNAMI WARNING
TSUNAMI WARNING | SEPTEMBER 2018 | 19COALSWARM
REFERENCESAlkon, M. and Wong, A. 2018. Authoritarian Environ-mental Federalism. SSRN. http://bit.ly/2CAaMpr
China Electricity Council. 2018. China Energy Portal. http://bit.ly/2owLVNq
China Electricity Council. 2016. China Energy Portal. http://bit.ly/2owyFZ3
China Electricity Council. 2013. China Energy Portal. http://bit.ly/2owufkE
Feng, Y., Wang, S., Sha, Y., Ding, Q., Yuan, J. and Guo, X. 2018. Coal power overcapacity in China: Province-Level estimates and policy implications. Resources, Conservation and Recycling, 137: 89-100. http://bit.ly/2oxpO9y
Forsythe, M. 2017. China cancels 103 coal plants, mindful of smog and wasted capacity. The New York Times, 18. https://nyti.ms/2jwnGOv
Gray, M. 2016. Chasing the Dragon? China’s coal over-capacity crisis and what it means for investors. Carbon Tracker Initiative. https://bit.ly/2wCiQ6R
Hervé-Mignucci, M. and Wang, X. 2015. Slowing the Growth of Coal Power Outside China: The Role of Chinese Finance. Climate Policy Initiative. https://bit.ly/2NFFDGb
IEA. 2017. Energy Technology Perspectives. Paris, France. https://bit.ly/2NAw1wa (The Beyond 2°C Scenario).
IEA. 2015. Projected costs of generating electricity. Paris, France. https://bit.ly/2nBeQS4
Li, D. 2017. Overcapacity, Overwithdrawal: How tack-ling coal power overcapacity can ease water stress. Greenpeace East Asia. http://bit.ly/2ovNuuI
Morrison, W. M. 2013. China’s economic rise: History, trends, challenges, and implications for the United States. Washington DC Library of Congress, Congres-sional Research Service. https://bit.ly/2id0f8h
Myllyvirta, L. and Shen, X. 2016. Burning Money: How China Could Squander over One Trillion Yuan on Unneeded Coal-Fired Capacity. Beijing: Greenpeace. https://bit.ly/2MJoUFp
Ning, Z. 2017. Tackling Moral Hazard in China’s Finan-cial System. Chicago, IL: Paulson Policy Memorandum. https://bit.ly/2NCoXzi
Qi, Y., Dong, W., Dong, C., and Huang, C. 2018. Fixing Wind Curtailment with Electric Power Sector Reform in China. Brookings-Tsinghua Center for Public Policy: China’s Energy in Transition Series. https://brook.gs/2ovrQXy
Slater, H. Coal power and privilege: China’s problem with industry-owned generators. China Dialogue. https://bit.ly/2wDbrnF
Spencer, T., Berghmans, N. and Sartor, O. 2017. Coal transitions in China’s power sector: A plant-level assessment of stranded assets and retirement path-ways. Paris, France: IDDRI. https://bit.ly/2NFyJ3D
Zhao, C., Zhang, W., Wang, Y., Liu, Q., Guo, J., Xiong, M., & Yuan, J. 2017. The economics of coal power gen-eration in China. Energy Policy, 105: 1–9. http://bit.ly/2LOazCm
Zhao, X., Li, S., Zhang, S., Yang, R. and Liu, S., 2016. The effectiveness of China’s wind power policy: An empirical analysis. Energy Policy, 95: 269-279. http://bit.ly/2LOviFP