Embed Size (px)
Citation preview

Tsunami Warning System
MIDN 1/C Carlin SongES402 Systems Engineering Design19 February 2008

Tsunami Phenomenon
large-scale, short-duration vertical displacement of water column.
generated by subduction earthquakes
principal source regions are earthquake zones in the Pacific Ocean
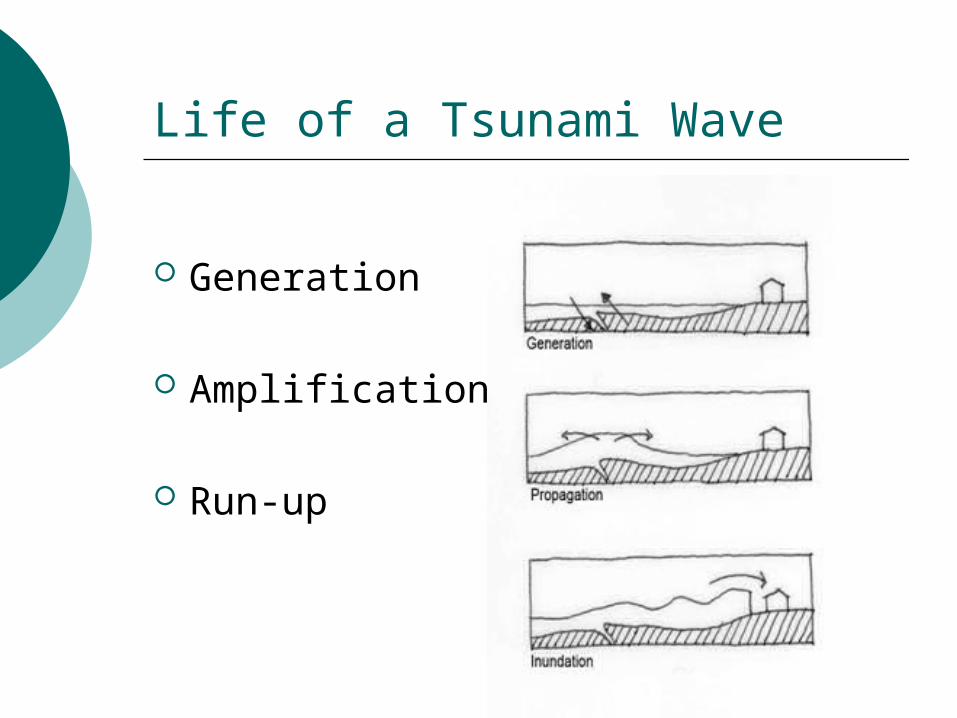
Life of a Tsunami Wave
Generation
Amplification
Run-up

Wave Motion & Dynamic Pressure
wave motion creates dynamic pressure which is measurable up to the wave base (L/2)
Shallow water wave characteristics of tsunami wave allows detection of dynamic pressure in deep ocean

Sensor Selection and Calibration
200 300 400 500 600 700 800 900 1000 1100 1200-10
0
10
20
30
40
50
60
70
80
90
Dep
th (
cm)
Sensor Voltage (mV)
Sensor application curve
Pressure range: Experiment (0 – 1.3 psi)
Sensor (0 – 13 psi)
Sensor MCP 601 Rabbit
countVV /0049.012
2012
Vout=-10+0.0049N

Experimental Set-up
Buffer Op-Amp
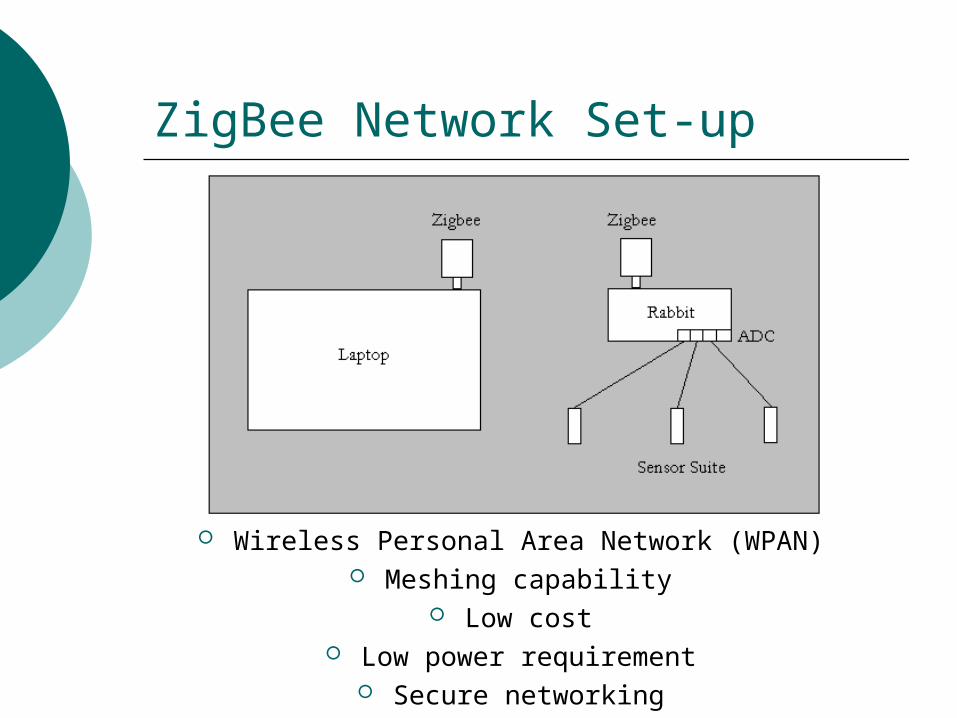
ZigBee Network Set-up
Wireless Personal Area Network (WPAN) Meshing capability
Low cost Low power requirement
Secure networking

Concept of Data Analysis (T = 5s)
0 5000 10000 15000
1.18
1.2
1.22
1.24
1.26
1.28collected data
Time (ms)
Pre
ssur
e (p
si)
0 500 1000 1500 2000 2500 3000 3500 4000 4500 5000
1.18
1.2
1.22
1.24
1.26
1.28Averaged single waveform
Time (ms)
Pre
ssur
e (p
si)

Concept of Data Analysis (T = 5s)
Pressure = Pstatic + Pdynamic
0 500 1000 1500 2000 2500 3000 3500 4000 4500 50001.16
1.18
1.2
1.22
1.24
1.26
1.28Averaged single waveform
Time (ms)
Pre
ssur
e (p
si)
74 76 78 80 82 84 861.16
1.18
1.2
1.22
1.24
1.26
1.28Pressure readings (4th Order Curve Fit)
Depth (cm)
Pre
ssur
e (p
si)

Concept of Data Analysis (T = 5s)
Subtract static pressure from readings using application curve data
Significant range of dynamic pressure
74 76 78 80 82 84 86
0.15
0.16
0.17
0.18
0.19
0.2
0.21
0.22
0.23
0.24Dynamic Pressure Readings(4th Order Curve Fit)
Depth (cm)
Dyn
amic
Pre
ssur
e (p
si)

Decision Parameter
Existence of dynamic pressure Amplitude range for dynamic
pressure Existence of low freq, high
amplitude signal Abnormal spike in voltage readings

Communications Infrastructure
3 in 4 tsunami alarms are false Evacuation for false cases causes
complacency Reliable and timely communications
system Current efforts

Online Data Transmission
Dynamic C program Digitize buffered output voltage from
sensor suite using Rabbit ADC Records time corresponding to voltage
data collection Arranges voltage and time data as an
ASCII string Output ASCII string to Serial Port B Zigbee attached to Serial Port B for
wireless transmission

Data Collection and Analysis
Data collection criteria Maximize time resolution in order to best detail
wave MATLAB code
Open ASCII string received at remote laptop via wireless transmission
Change digital voltage data to analog values Perform data analysis to find dynamic pressure of
passing wave Determine if recorded dynamic pressure is above
threshold pressure

Tsunami Warning System