Embed Size (px)
Citation preview

TST: RAMP METERS and DATA STATIONS
STUDENT HANDBOOK
ATMS CODE: CUF
Instructors: Kristina Irelan
Ken Lakey
January 2011
Washington StateDepartment of Transportation

WASHINGTON STATE DEPARTMENT OF TRANSPORTATION COURSE DESCRIPTION
TST Training Program
Course Title: TST: Ramp Meters and Data Stations Course Code: CUF Class Size: 10 Hours: 8 Course Description: To provide TST personnel with the basic knowledge of ramp meters and data stations.
Course Objectives: By the end of this course, you’ll be able to:
1. Describe 5 types of vehicle detection; loops, piezos, infrared, radar, camera. 2. Explain the function and layout of the 3 types of installations; ramp meters, weigh-in-
motion, and permanent traffic recorder. 3. Explain the 5 methods of data transfer; twisted pair, fiber optics, cellular IP, analog
and digital cell. Attendees: TST A, B, C, and D personnel. Comments:

1
Vehicle Detection
WSDOT utilized 5 types of vehicle detection for Ramp Meters and Data Stations.
1. Induction Loops 2. Piezo Sensors 3. RADAR 4. Video 5. Infrared (IR)

2
Inductive Loop Detectors
A road loop consists of two or more turns of insulated wire wound in a shallow,
rectangular or circular slot, sawed in the roadway. A type 2 induction loop has 4 turns of wire
and measures 6ft by 6ft square. Some newer installations use a 6ft circle (round loop), type 3.
Either can be used depending on installation preference. At curbside the two ends of the wire are
carefully spliced to a factory-twisted lead-in cable. This cable is routed to a cabinet housing the
detector unit. This unit drives energy through the loop at radio frequencies typically in the range
of 20 to 200 KHz.
The detector unit, lead-in wire and loop wire comprise a tuned circuit of which the loop is
the inductive element. A vehicle or any metal object entering the loop will absorb some of the
radio frequency energy because of eddy currents created in the metal periphery (the Chassis and
the body).
The inductance is reduced when disturbed by a vehicle, causing the resonant frequency to
increase. At this point, various designs of inductive loop detectors electronics process phase,
frequency, amplitude or impedance changes to register a count, perform an output or other action
based on the type of detectors purpose. In traffic classification and counting equipment the most
common method of detection utilizes the “phase shift” method which the oscillator is
automatically adjusted to a null condition in feedback circuits. Any drop in inductance
temporarily “de-tunes” the loop, causing a phase shift or amplitude change in the current flowing
through the loop. Long-term inductance changes, such as a vehicle parked on part of the loop,
are compensated for by the feedback circuit automatically tuning to a new null.
Advanced Detection Details
It is important to note the changes in inductance are very small when sensing presence of
a vehicle. The sensitivity in most detectors are measured by how much change is needed to
“sense” detection. This is usually calculated in the “percent change” in inductance measured on
the loop. The following is the defacto standard example:
3
Motorcycle: 0.13 percent (ΔL/L) or 0.12 μH (ΔL) inductance change (small motorcycle).
Large Motorcycle: 0.32 percent (ΔL/L) or 0.3 μH (ΔL) inductance change (large motorcycle).
Auto: 3.2 percent (ΔL/L) or 3.0 μH (ΔL) inductance change (automobile).
Depending on the detector used, sensitivity can be adjusted along with scan rates (resolution),
loop frequency and many other settings the can affect loop accuracy and performance. Although
most detectors do not provide a detailed signal analysis, the actual vehicle impact on a loop field
can be seen in the following graphs depicting the change in frequency on the loop over time.
The following graphs were recorded with a Diamond Traffic Products Phoenix II unit on 6ft
round loops with a scan rate of 1000 samples per second to produce the following signature
depiction of 4 vehicle classes and how they “look” to a loop.
Motorcycle - (notice the length and low signal strength):
1: 14:35:40.76 58.8mph, 2 Axles, Length= 5.2', A#1 = 4.9'

4
Passenger Car - (notice how high the signal strength is): 1: 14:35:37.56 59.2mph, 2 Axles, Length= 14.7', A#2= 9.2'
Passenger Bus - (notice the middle being the largest signal): 1: 15:39:24.28 56.0mph, 3 Axles, Length= 49.8', A#4 = 26.6' 3.9'

5
Truck (class 9) - (notice how weak the signal strength is): 1: 15:00:59.47 58.2mph, 5 Axles, Length= 63.9', A#9 = 15.5' 4.3' 31.7' 4.0'
The graphs represent the different vehicle characteristics such as the vehicle length,
vehicle “profile” and the strength of each vehicles signature. The question that is most posed by
this is “why does the passenger car have a much higher signal than the truck or even the bus?”
The answer to that question is the differences in vehicle heights. The inductive loop field created
is most sensitive closest to the sensor and its ability to detect change is not only limited to range
(height – typically 2/3 distance of the shortest side of a loop (6ft ~= 4ft detection height)) but the
further away from the loop the less sensitive it is as well. Because the passenger car is lower to
the roadway it produces a greater change in the field than a high bed truck or other vehicle.

6
Inductive loop Questions and Answers
1. Inductive loops are used in almost all traffic detection equipment.
2. Very accurate when installed correctly and used with good data collection equipment.
3. Inductive loops can be tested by measuring the inductance of the loop, continuity, the Q of the
loop, also resistance or leakage to ground.
4. A single loop can do vehicle counts and lane occupancy. Two loops per lane can do vehicle
counts, vehicle lengths, vehicle speeds, and occupancy.
Loop Pros
1. Accuracy (considered the most accurate sensor overall)
2. Long Lifespan (between 10-15 years on average)
3. Low cost (maintenance and calibration are nil after install)
Loop Cons
1. Intrusive technology (up front installation cost and safety)
2. Motorcycles can be missed
3. Static position (cannot adjust for lane shifting)
4. Cross talk on older detectors

7
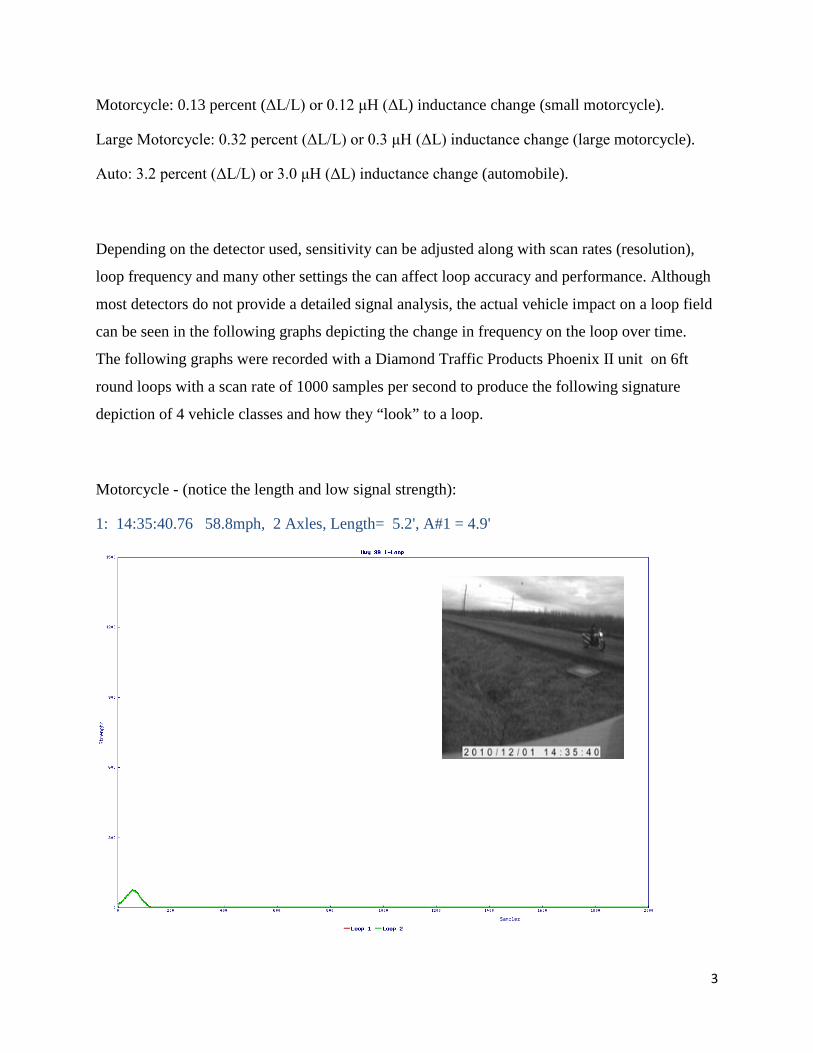
PIEZO VEHICLE DETECTION:
The Piezo axle and weight sensors employed by WSDOT data stations use the
piezoelectric effect to detect vehicle axles for vehicle classification and the weight of
each of those axles. These sensors are relatively inexpensive, fairly accurate +/- 7% for
weights, and somewhat durable (3-5 years). They are used in 95% of Washington States
historical data collection stations. The Piezo sensors are installed between the inductive
loops in most TDO data station installations. They are also used in State Patrol’s CVSIN
sites in the “sorter” lanes.
The “Piezo” works by producing a positive voltage spike that is relative to the
weight of the axle deflecting the sensor. The sensor itself is inserted into a 1 inch deep
slot across half of the lane for an axle sensor for vehicle classification only, and the entire
lane for a weight and classification sensor. As the tires cross the Piezo, it is deflected
downward; the polarized piezoelectric film in the sensor is bent, causing it to produce a
voltage spike.
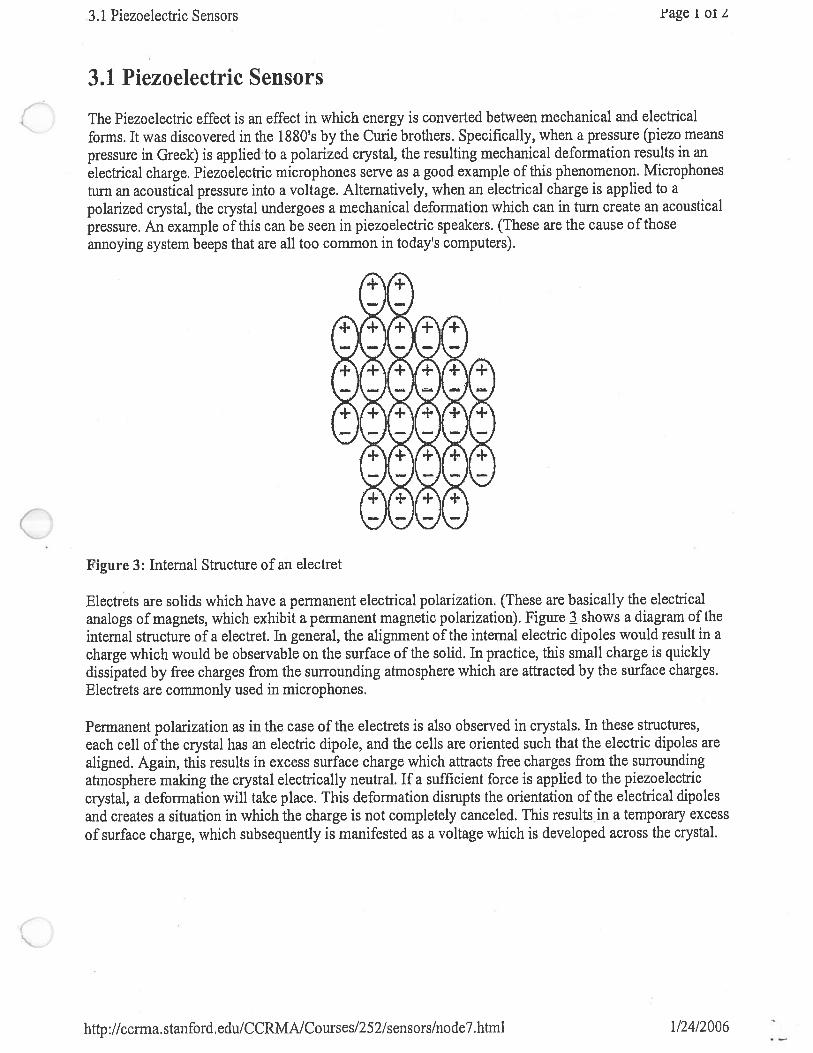
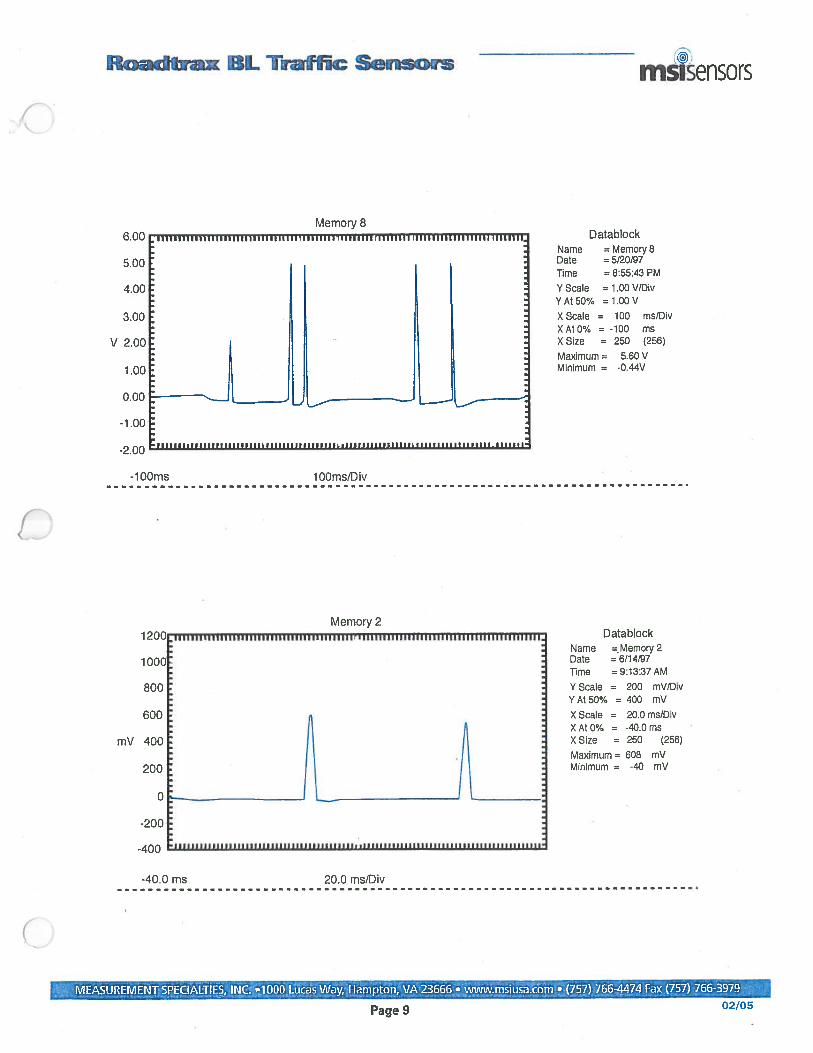
A typical class 9, five axle tractor trailer, will produce an approximate momentary
2 volt spike for the steering axle, and 5 volt for most remaining axles. The typical
passenger vehicle will produce around 600 mv spike on each axle.


8
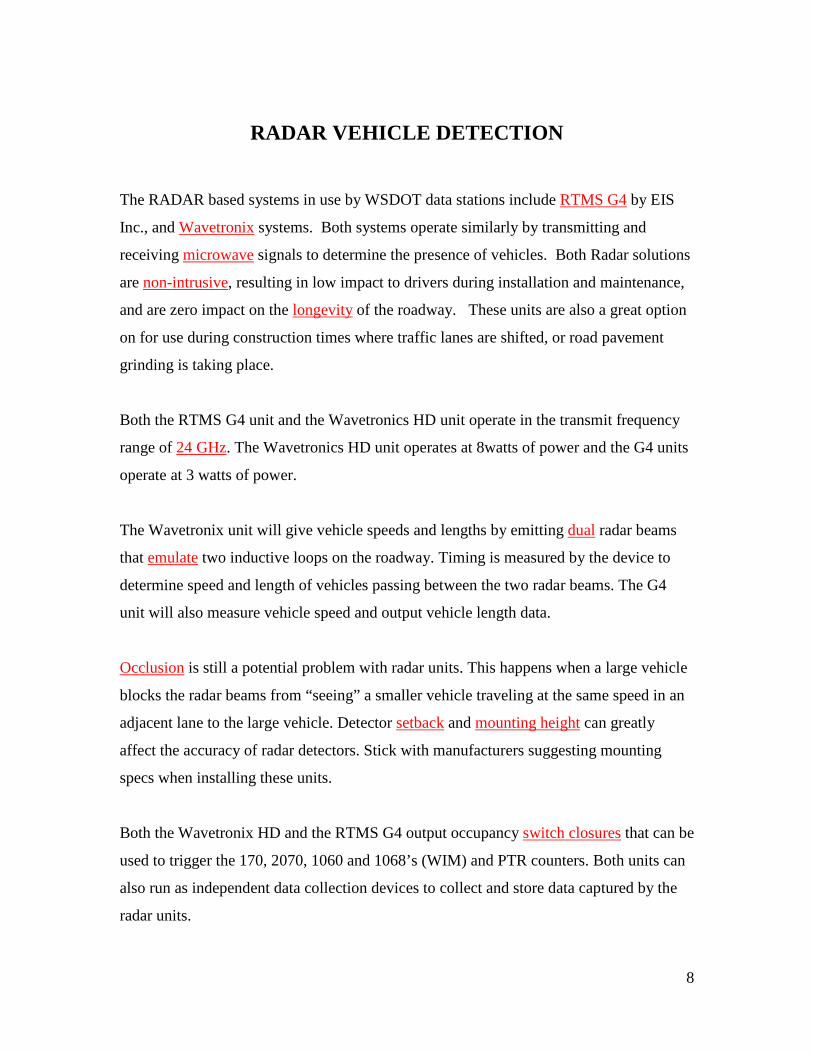
RADAR VEHICLE DETECTION
The RADAR based systems in use by WSDOT data stations include RTMS G4 by EIS
Inc., and Wavetronix systems. Both systems operate similarly by transmitting and
receiving microwave signals to determine the presence of vehicles. Both Radar solutions
are non-intrusive, resulting in low impact to drivers during installation and maintenance,
and are zero impact on the longevity of the roadway. These units are also a great option
on for use during construction times where traffic lanes are shifted, or road pavement
grinding is taking place.
Both the RTMS G4 unit and the Wavetronics HD unit operate in the transmit frequency
range of 24 GHz. The Wavetronics HD unit operates at 8watts of power and the G4 units
operate at 3 watts of power.
The Wavetronix unit will give vehicle speeds and lengths by emitting dual radar beams
that emulate two inductive loops on the roadway. Timing is measured by the device to
determine speed and length of vehicles passing between the two radar beams. The G4
unit will also measure vehicle speed and output vehicle length data.
Occlusion is still a potential problem with radar units. This happens when a large vehicle
blocks the radar beams from “seeing” a smaller vehicle traveling at the same speed in an
adjacent lane to the large vehicle. Detector setback and mounting height can greatly
affect the accuracy of radar detectors. Stick with manufacturers suggesting mounting
specs when installing these units.
Both the Wavetronix HD and the RTMS G4 output occupancy switch closures that can be
used to trigger the 170, 2070, 1060 and 1068’s (WIM) and PTR counters. Both units can
also run as independent data collection devices to collect and store data captured by the
radar units.

9
VIDEO VEHICLE DETECTION
The only video based vehicle detection system tested by the Transportation Data Office
today is the Iteris Vantage One system. This system uses video cameras positioned
directly above the roadway to detect the passage of vehicles. The advantage of a video
detection system is its non-intrusive characteristics over an inductive loop and axle sensor
installation. Camera software is also easily reprogrammable in the event that the lanes are
moved to provide for roadwork. It will also not be affected by any asphalt grinding,
which would eliminate surface mounted sensors. However, installation of any unit above
open lanes still requires the closing of lanes under which the camera is to be mounted.
The Iteris system requires considerably less maintenance than an inductive loop site.
However, the disadvantages of a video based vehicle detection systems include the
limitation of vehicle counts only, no accurate speed or length data. Weather and lightning
are also factors limiting video detection. It should be noted that the overall operation of
the Iteris video detection system has an accuracy of +/- 11%, which may work for certain
ITS and data collection needs, but is outside of the acceptable limits for accurate
historical trend calculations.

10
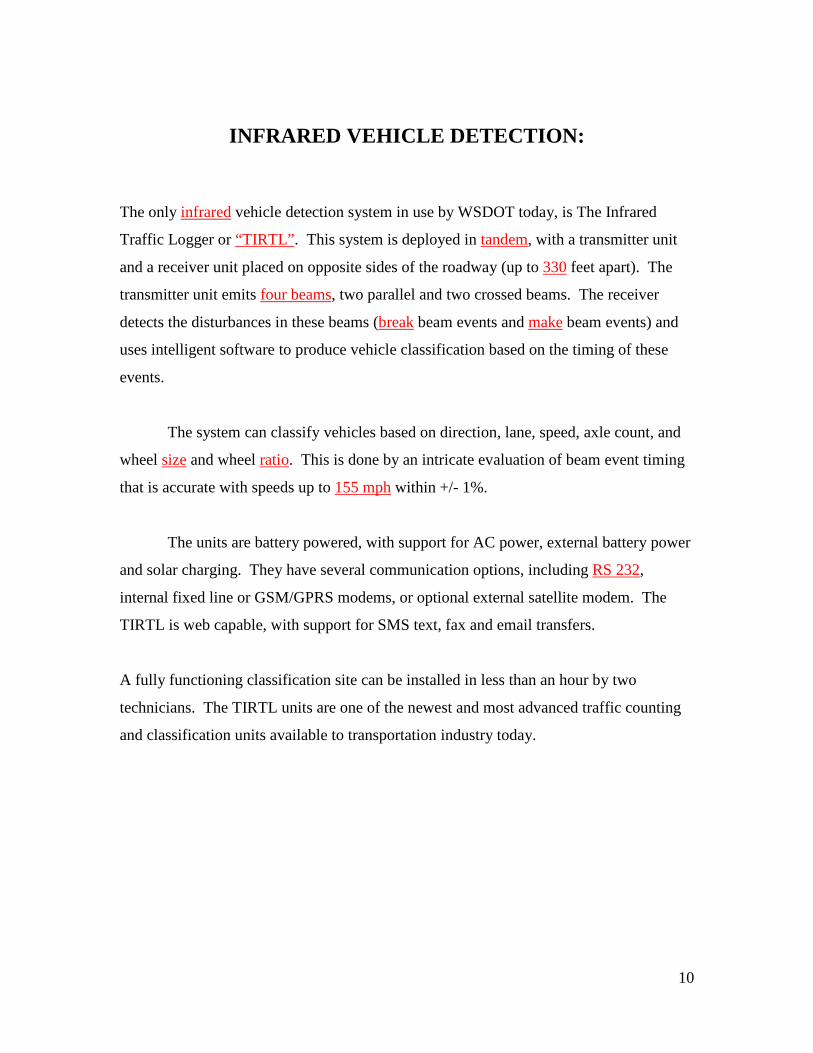
INFRARED VEHICLE DETECTION:
The only infrared vehicle detection system in use by WSDOT today, is The Infrared
Traffic Logger or “TIRTL”. This system is deployed in tandem, with a transmitter unit
and a receiver unit placed on opposite sides of the roadway (up to 330 feet apart). The
transmitter unit emits four beams, two parallel and two crossed beams. The receiver
detects the disturbances in these beams (break beam events and make beam events) and
uses intelligent software to produce vehicle classification based on the timing of these
events.
The system can classify vehicles based on direction, lane, speed, axle count, and
wheel size and wheel ratio. This is done by an intricate evaluation of beam event timing
that is accurate with speeds up to 155 mph within +/- 1%.
The units are battery powered, with support for AC power, external battery power
and solar charging. They have several communication options, including RS 232,
internal fixed line or GSM/GPRS modems, or optional external satellite modem. The
TIRTL is web capable, with support for SMS text, fax and email transfers.
A fully functioning classification site can be installed in less than an hour by two
technicians. The TIRTL units are one of the newest and most advanced traffic counting
and classification units available to transportation industry today.


1
Index 2. Purpose of Ramp Meters
Pictures
3. Type 1 and Type 2 Ramp Meter Pole 4. 334 Cabinet 5. 170 Controller 6. Loop Amps 7. Load Packs 8. Advance Warning Sign 9. Display Panel Ramps 10. Definitions 11. Ramp Design Example 14. How Loops are Name, Loop Naming Scheme 15. Loop Naming Example: Figure 16 16. Reversible Loop Names Loop Placement in Cabinet 18. Loop Placement in the Roadway
Guided Notes 19. Definitions 20. How a Ramp Meter Works 21. Ramp Meter Pre-emption, Local and Fuzzy Logic Metering 22. Basic Troubleshooting 24. 170 Controller Reset Outcome 3: Five Methods of Data Transfer 25. Two Types of Communication: Twisted Pair and Fiber Optics 28. Twisted Pair Troubleshooting 29. C-20 Wrap-around Pin-out and Citations 30. ITS Design Drawings Supplemental Schematic J-Drawing 7a Sheet 1 of 2 J-Drawing 7a Sheet 2 of 2

2
Training Purpose: To provide TST personnel with the basic knowledge of ramp meters and data stations. Learning Outcome The student will be able to explain the layout and function of a ramp meter site.
Purpose of Ramp Meters Regulates the flow of traffic on the mainline Decreases the mainline congestion Maximizes freeway capacity by prolonging free flow movement on the ramp Prevents stop and go merging at the gore point Ramp Meters Have:
8 and 12 inch signal heads Type 1 or 2 RM Pole
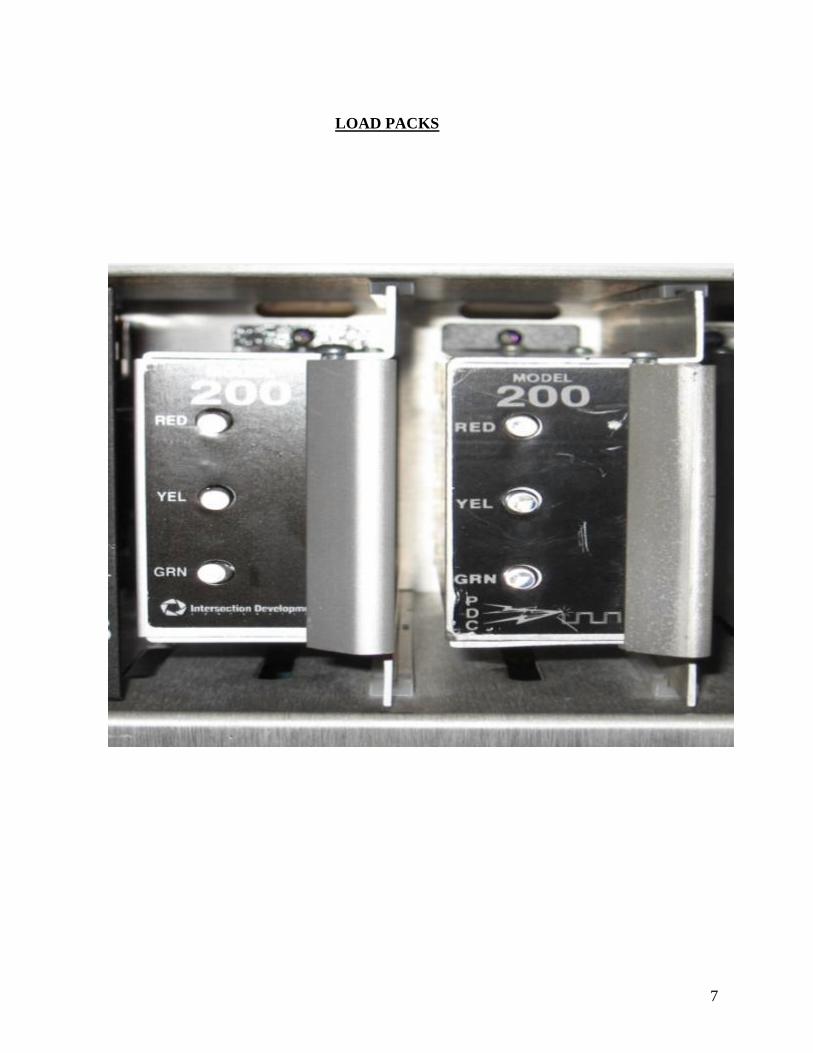
334 cabinet 170 controller Loop amps Load packs Advanced Warning Sign Display Panel
Modem
Monitor Unit/WDT

3
TYPE 1 RM POLE TYPE 2 RM POLE

4
334 CABINET

5
170 CONTROLLER
DISPLAY ON 170 CONTROLLER

6
LOOP AMPS
7
LOAD PACKS

8
ADVANCED WARNING SIGN

9
DISPLAY PANEL

10
DEFINITIONS
Advanced Loop: Located at the beginning of the ramp; used with Fuzzy Logic. (A common use for the queue loop is to measure the backup on the ramp and to adjust the meter rate when the line of cars becomes too long. This same job is given to the intermediate queue loop (present on long ramps) as well as advance queue loops.) Queue Loop: The loop that lets the controller know that a vehicle is moving
towards the ramp meter.
Demand Loop: Tells the controller that a vehicle is sitting at the ramp meter stop bar.
Pass Loop: Tells the controller that the vehicle has left the ramp stop bar.
High-Occupancy Vehicle Bypass Loop: A loop in the H.O.V. lane of the ramp that is used to add time to the Red signal indication of the METERED LANE for the car currently waiting at the stop bar. This allows the vehicle using the H.O.V. lane opportunity to bypass the car at the meter and safely merge with traffic. The HOV demand loop is normally located 300 feet before the stop bar in the HOV lane (accompanied by a speed loop).

11
Ramp Design

12

13

14
How loops are named Can contain up to 7 characters: the 1st is the roadway, 2nd is the direction, 3rd is the lane type, and 4th is lane number.

15
FIGURE 16 LOOP NAMING EXAMPLE

16
Reversible Loop Names A loop can only have one name, so the direction of increasing milepost is used for all reversible loops. There are a few exceptions to this rule: one is when there is a ramp that is only open in the decreasing milepost direction (such as a westbound on-ramp to the express lanes that does not operate as an eastbound off-ramp - a loop on this ramp would be called "-RW-O-1" - if the ramp was also used as an eastbound exit, it would be called "-RE-X-1"). Because the express lanes have different uses depending on the direction of the roadway, some loops seem to be “mirrored” in the cabinet. For example, on the I-5 express lanes, there could be "-Reversible NB" loops as well as "-Reversible SB" loops. When the lanes are open southbound, only two of the three lanes are open to traffic (the westernmost lane is closed to allow for Lake City Way to add). When the lanes are open northbound, the westernmost lane is an HOV lane. At all other locations, all of the reversible mainline loops are named "-Reversible NB". Loop placement in the cabinet is as follows: Data Stations: North comes before South East comes before West
Ordering: Mainline loops Speed loops On-ramps Off-ramps
EXAMPLE: TB2-1,2 : _ME___1 TB2-3,4 : _ME___2 TB2-5,6 : _ME__S1 TB2-7,8 : _ME__S2 TB2-9,10 : _ME_O_1 TB2-11,12 : _MW___1 TB3-1,2 : _MW___2 TB3-3,4 : _MW__S1 TB3-5,6 : _MW__S2 TB3-7,8 : _MW_O_1
TB3-9,10 : _MW_X_1
TB3-11,12 : _MW_X_2
17
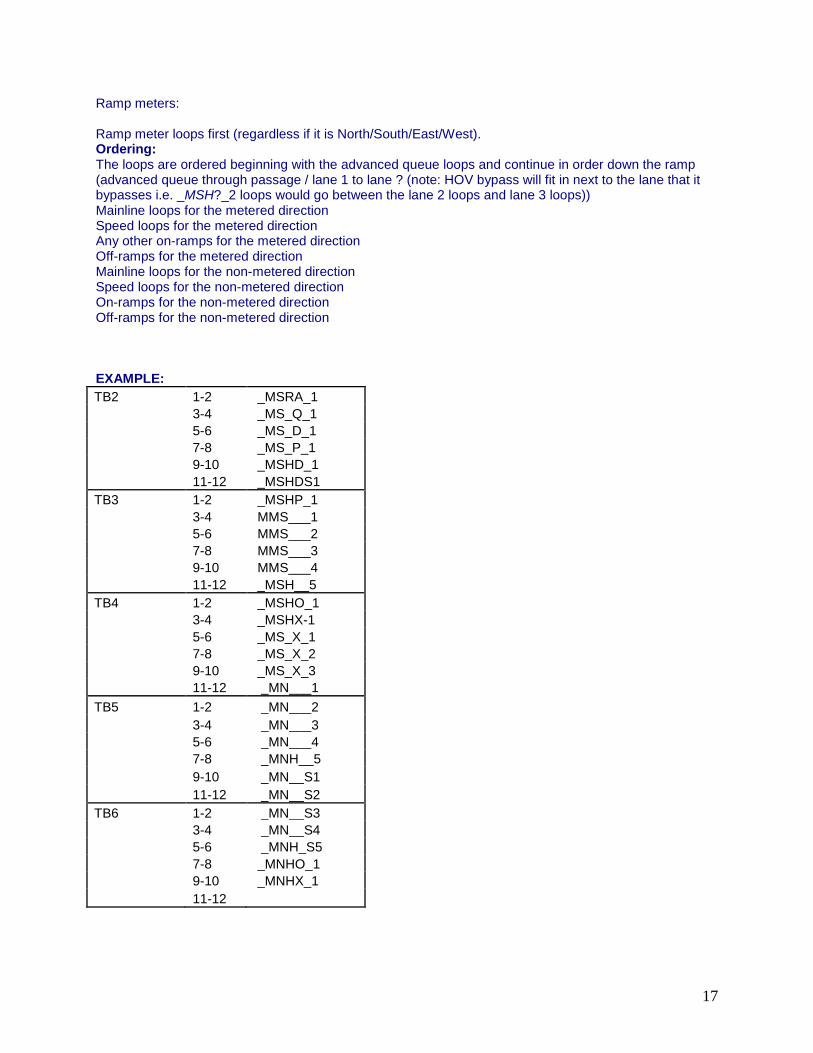
Ramp meters: Ramp meter loops first (regardless if it is North/South/East/West). Ordering: The loops are ordered beginning with the advanced queue loops and continue in order down the ramp (advanced queue through passage / lane 1 to lane ? (note: HOV bypass will fit in next to the lane that it bypasses i.e. _MSH?_2 loops would go between the lane 2 loops and lane 3 loops)) Mainline loops for the metered direction Speed loops for the metered direction Any other on-ramps for the metered direction Off-ramps for the metered direction Mainline loops for the non-metered direction Speed loops for the non-metered direction On-ramps for the non-metered direction Off-ramps for the non-metered direction EXAMPLE: TB2 1-2 _MSRA_1 3-4 _MS_Q_1 5-6 _MS_D_1 7-8 _MS_P_1 9-10 _MSHD_1 11-12 _MSHDS1 TB3 1-2 _MSHP_1 3-4 MMS___1 5-6 MMS___2 7-8 MMS___3 9-10 MMS___4 11-12 _MSH__5 TB4 1-2 _MSHO_1 3-4 _MSHX-1 5-6 _MS_X_1 7-8 _MS_X_2 9-10 _MS_X_3 11-12 _MN___1 TB5 1-2 _MN___2 3-4 _MN___3 5-6 _MN___4 7-8 _MNH__5 9-10 _MN__S1 11-12 _MN__S2 TB6 1-2 _MN__S3 3-4 _MN__S4 5-6 _MNH_S5 7-8 _MNHO_1 9-10 _MNHX_1 11-12

18
Loop Placement in the Roadway We use a type R2 loop for the demand loop. It is effectively two round loops connected together to act as a single loop. These two loops are spaced 9 feet apart, center to center. The distance between the trailing edge of the demand loop and the leading edge of the passage loop depends on the application. It is 7 feet for a type 1 (shoulder-mount), and 13 feet for a type 2 (mast arm) layout. Speed loops are placed 17’ apart leading edge to edge in each lane.

19
Definitions Local station: mainline station near the merge point Down Stream station: immediate location that is prone to congestion "Downstream Station" can refer to one or more stations that the drivers entering the on-ramp will encounter. These stations are between .5 and 5 miles away. Upstream station: next mainline station upstream of the local station
Red Signal Violations: A red signal violation occurs each time the passage loop is actuated while there is a red signal indication. When a violation occurs, the red cycle length is increased.
High-Occupancy Vehicle Bypass Meter Rate Adjustment: For each actuation of the HOV demand speed loop (or demand loop) while the metered lane signal is red, the red cycle length is extended to give the HOV the opportunity to bypass the meter and safely merge with metered traffic.
Queue Adjusted Metering Rate: If in 20-seconds the queue loop exceeds its maximum occupancy, the cycle length is decreased to allow more cars to get through the signal quicker. For Example: If the ramp is at minimum storage capacity, a 12 second cycle length with a 1 second red signal indication will be used. Then only 5 vehicles will go through the meter per minute. But, if the ramp is at maximum storage capacity, a 3 second cycle length with a 1 second red signal indication will be used. Then 12 vehicles will go through the meter per minute.
Volume Adjustment: The ramp volume equation adjusts the queue-adjusted meter rate to compensate for red signal violations and HOV bypass traffic on the ramp.
Advanced Queue Override: Each metered ramp may have more than one advanced queue loop. The loops are designated as right or left. If both of the advanced queue loops indicate that the ramp is at maximum occupancy, the advanced queue override value will adjust the queue meter rate. This adjustment will remain in effect until the advance queue loops indicate that the ramp is below the maximum occupancy limit.
20
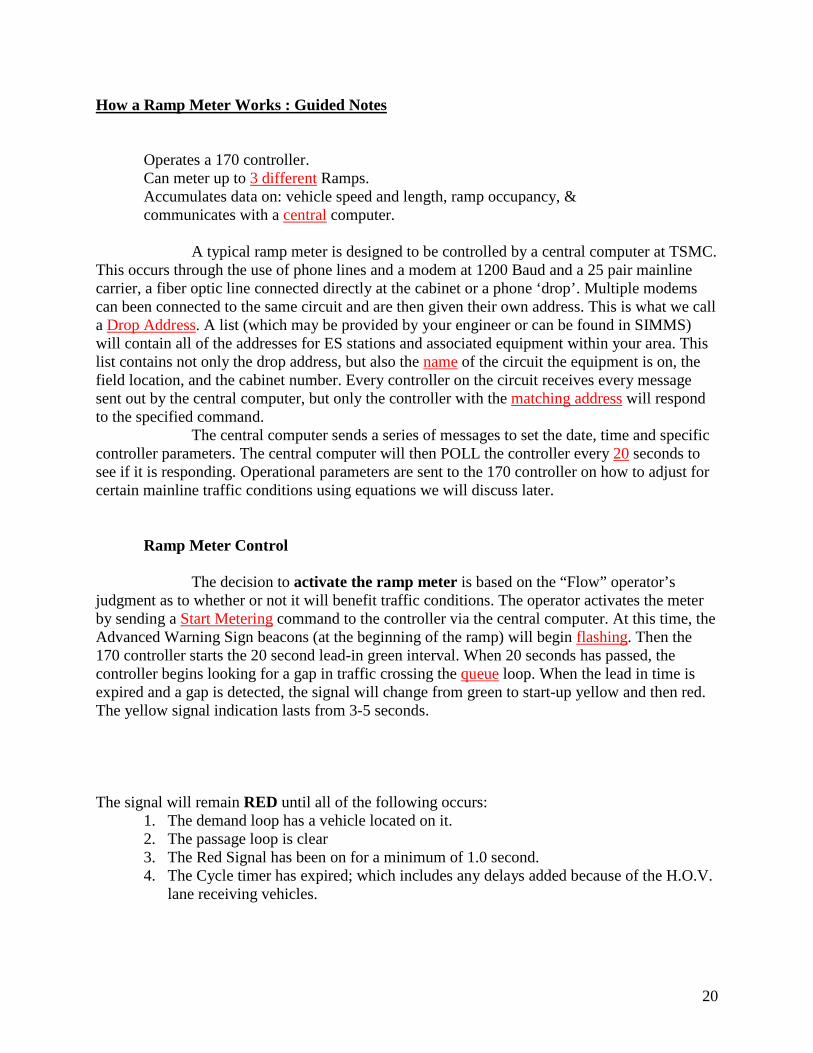
How a Ramp Meter Works : Guided Notes Operates a 170 controller. Can meter up to 3 different Ramps. Accumulates data on: vehicle speed and length, ramp occupancy, &
communicates with a central computer. A typical ramp meter is designed to be controlled by a central computer at TSMC. This occurs through the use of phone lines and a modem at 1200 Baud and a 25 pair mainline carrier, a fiber optic line connected directly at the cabinet or a phone ‘drop’. Multiple modems can been connected to the same circuit and are then given their own address. This is what we call a Drop Address. A list (which may be provided by your engineer or can be found in SIMMS) will contain all of the addresses for ES stations and associated equipment within your area. This list contains not only the drop address, but also the name of the circuit the equipment is on, the field location, and the cabinet number. Every controller on the circuit receives every message sent out by the central computer, but only the controller with the matching address will respond to the specified command. The central computer sends a series of messages to set the date, time and specific controller parameters. The central computer will then POLL the controller every 20 seconds to see if it is responding. Operational parameters are sent to the 170 controller on how to adjust for certain mainline traffic conditions using equations we will discuss later.
Ramp Meter Control
The decision to activate the ramp meter is based on the “Flow” operator’s judgment as to whether or not it will benefit traffic conditions. The operator activates the meter by sending a Start Metering command to the controller via the central computer. At this time, the Advanced Warning Sign beacons (at the beginning of the ramp) will begin flashing. Then the 170 controller starts the 20 second lead-in green interval. When 20 seconds has passed, the controller begins looking for a gap in traffic crossing the queue loop. When the lead in time is expired and a gap is detected, the signal will change from green to start-up yellow and then red. The yellow signal indication lasts from 3-5 seconds. The signal will remain RED until all of the following occurs:
1. The demand loop has a vehicle located on it. 2. The passage loop is clear 3. The Red Signal has been on for a minimum of 1.0 second. 4. The Cycle timer has expired; which includes any delays added because of the H.O.V.
lane receiving vehicles.

21
When it is no longer useful to have the ramp metered, the operator sends the Stop Metering command. The controller will continue to meter until a specific gap length is detected across the demand loop. The gap length is reduced by 1/10th of a second every 6 seconds. A 10 second gap will be reduced to zero in 10 minutes if the traffic on the ramp is heavy and does not allow a sufficient break between vehicles to meet the gap reduction rate. Then the 60-second green signal end of meter phase begins. The gap reduction rate is used so that a large number of vehicles are not dumped onto the freeway when the meter is shut off. If a gap is found, the controller knows that the large number of cars behind the meter is gone. NOTE: The 20-second green interval at startup is fixed and cannot be changed. The controller looks for a gap on the queue detector - typically 3.0 seconds. The operators at TSMC can change the size of the queue loop gap for startup if 3.0 seconds is too large. During startup, the green timer will be reset to 2.9 seconds each time the queue detector is actuated. There is no time limit on the gap search in startup. The controller will continue to search for a gap until one is found, or the TOD window closes or the Central computer commands the end of metering.
Ramp Meter Pre-emption There are 2 types of ramp metering pre-emption: locally by using the cabinet police switch and remotely via the pre-empt parameter. The police panel switch and the pre-empt parameter work separately from each other. But both will cause pre-emption. The meter will not return to normal operation until each one it turned off. The status of the police switch is checked every 1/10 second. If the police switch is turned on at the cabinet, an alarm is sent to the Central Computer. If the pre-empt parameter or the police panel switch is turned on, the controller places a steady green indication on all ramp signals. When the switch or the pre-empt parameter is turned off, the controller will resume normal operation. If the controller is supposed to be metering, the start meter phase will begin. If the controller should not be metering, the controller goes through the end of meter phase. Local and Fuzzy Logic Equation Metering: Guided Notes
There are two sources for ramp meter control: local equations using local data and the central computer equation (fuzzy logic). The Fuzzy Logic equation is what we generally use. The local equation can be used at a “free standing” site or when a communication failure between the 170 controller and the central computer occurs.
The Local Equation is based on a time of day plan and is used for special circumstances or when there is a communication failure. The time of day plan is activated at a specific hour, minute, and day of the week. In essence, the individual station uses the local equation to determine a metering rate. It does so by looking at the time-of-day plan, congestion on the ramp

22
(queue loop and advance queue loop), and congestion on the freeway (mainline loops at the merge point). Then, the local meter will increase or decrease its metering rate based on the information gathered from these inputs.
The Fuzzy Logic Equation is similar to human thought and reasoning. It utilizes volume, speed and occupancy data that is typical of the metered area; and it can consider imprecise data. When the equation is written, specific detectors or loops and stations are used to determine the meter rate. Ramp meters can process information from as many as 34 loops. The stations (other ramp meters or data stations) specified in the equation (either upstream/downstream) of the desired ramp to be metered are typically ones that have a lot of re-occurring congestion and represent mainline traffic conditions.
The 170 controller takes numerical data from each of the specified equation stations and the queue detector data from each of the ramps at the site you are looking at to formulate a metering rate. This information is then sent to the central computer. Specific ramp conditions (red signal violations, HOV bypass traffic, queue occupancy, and advanced queue detector occupancy) also help determine and optimize an adjusted meter rate. The adjusted meter rate (AMR) is the basic meter rate used to run the ramp meter.
Optimizing example: using the ramp to hold a certain number of cars slows down the number of cars merging. This could effect how traffic is handled on the mainline due to an accident.
Summary
The local equation uses ramp and mainline loops that directly affect the traffic metering rate. This information is the basis for how the ramp meter will operate. The fuzzy logic equation uses loop inputs (from both the mainline and the ramps) to gather data. The gathered data is then applied to specific parameters set forth by the Central Computer. The fuzzy logic parameters can then be adjusted as needed to optimize a meter rate for less-than-ideal freeway conditions.

23
Basic Troubleshooting for Ramp Meter Failures: Guided Notes
Circuit Failures: occur, because a controller on the circuit is locked up.
All controllers on the same circuit are daisy chained together and if one is locked up, the data carrier tone will be directed through to the transmit pair of wires. Most likely the cabinet that is farthest away from the HUB is the problem.
Watch Dog Timer Trip: occurs, because the Monitor Unit asks the 170 controller for a response
10 times a second. If the 170 takes a full second or more to respond, the signal heads will go to a green indication. This is the safe indication for traffic on the ramp to enter the freeway. *To reset the watch dog timer press the button on the WDT card.
WHEN A 170 IS IN A FAILED STATUS, LOOK FOR A: Locked Controller: its display will be all zeros, eights, blank, or you won’t be able to input data through the key pad on the front of the 170 controller. NOTE: Sometimes the
controller will show no sign of being locked up. If the unit is communicating via a T-1 line, check the communications wires on the punch down block at the back of the cabinet. Remove the C-2 connector on the back of the controller while listening to the transmit pair of wires. If the carrier tone is “gone,” this is your problem. Re-set the controller. If the unit is communicating on fiber optics, then verify that the bi-directional receiver has not locked up, or lost power.
Broken Communication Lines: The left side of the punch down block (back of cabinet) is the source tx/rx signal. The right side is the tx/rx signal going to the C-2 connector. The bridge clips connect the two together. Check that the bridge clips are secure and making good contact. Check the left side for good tones, and then the right. If the left source side is not giving the correct tones, then the problem is outside of the cabinet. Look for the nearest terminal cabinet. This will be a good starting point to look for broken communication wires. If the terminal cabinet has good tones, then the problem is between it and the cabinet that you already visited. Check all cabinets for good comm.’s and all JB’s that fall between the terminal cabinet and the ramp meter cabinet you
checked. If you have good tones on the source side of the punch down block, follow the wires from the right side down to Terminal Block Nine on the left side of the cabinet. NOTE: This is just a “pigtail” from the punch down block to the terminal block. Check the tones again. The C-2 connector is wired to this TB and goes to the back of the controller. You can also check the audio in and audio out on the back of the 170 controller or take the C-2 connector off and check pins A to B and C to E for tone. If the lines are “good” then you have a bad controller.

24
HUB/NETWORK Failure: this is usually a power problem, because the cameras, data stations, and ramp meters are all on the same circuit and will be without power or in a “failed” status. A LOOP Failure or a COMMUNICATION Failure:
Both have the ability to cause a similar symptom: a white segment being painted on the Webflow or Internet map. White segments are a product of some logic in a computer program that looks for bad data. A failed cabinet creates nothing but bad data - so if all of the segments being painted by a single cabinet (ES-XXX) are white, there is a good chance that the communication is failed (for whatever reason). However, if even a single segment for a cabinet is being painted green, yellow, red, or black, then it is a loop problem. "Bad data" is in reference to the quality of the data. Each 170 is running a basic quality check on the data it collects. Certain anomalies in the data generate flags that are sent back to the central computer for further analysis. Typically, in each cabinet, a loop from each lane (in each direction) are averaged together to create a single volume/occupancy value for all the lanes. If enough loops in a single direction have these flags on the data they create, the segment's data is considered bad and is painted white. This is often the case when loops break, are out of tune, or are beginning to fail.

25
170 Controller Reset 1. Turn the ‘Stop Timing Switch’ to ON. 2. Turn the 170 Controller OFF. For data stations, skip to step 4. 3. Ramp Meters: turn ‘MU’ switch to OFF. 4. Wait 30 seconds to make sure that the controller misses one communications interval
(ensuring that the controller status at TSMC will show failed). NOTE: Resetting the controller while it is still ‘active’ can cause problems that may not be evident at the cabinet.
5. Depress and hold key 5. Turn the 170 to ON and then release the key.
6. Turn the ‘Stop Timing Switch’ to OFF.
7. For Ramp Meter: turn the MU switch to ON and reset the Watch Dog Timer Card. 8. Enter the drop address using the circuit list provided by your engineer. Do this by pressing C-0-0 then the one or two digit number and E (which is enter). Press B key to get to the base page display. Then press 8-0. 9. The timing/data window will display all zeros and the phase interval window will count the time in hexadecimal. When communication between the controller and the central computer is re-established, the current time will be indicated in the timing/data window. Note: 8-0 = Time in hours, minutes, seconds & day of week.


72" 144"72"
MEDIAN: SOIL
L363"164"61"
L4
L1
71'
43'
P3P4
P1 P2
P4P3
45'
54"177"58"
NS
EW
INCREASING MILEPOST DIRECTION
DECREASING MILEPOST DIRECTION
LANE 3
LANE 4
LANE 1
LANE 2
4'
4'
10'
10'
12'
12'
12'
12'
EDGE OF PAVED
SHOULDER
EDGE OF PAVED
SHOULDER
EDGE OF PAVED
SHOULDER
EDGE OF PAVED
SHOULDER
EDGE OF LANE
EDGE OF LANE
EDGE OF LANE
EDGE OF LANE
INDUCTION LOOP/ PIEZO AXLE SENSOR
NUMBER IDENTIFICATION
INCREASING DIRECTION
Lane 1 – (drive lane) = Loop L1, Piezo P1, Piezo P2, Loop L2
Lane 2 – (pass lane) = Loop L3, Piezo P3, Piezo P4, Loop L4
_________________________________________________
DECREASING DIRECTION
Lane 3 – (drive lane) = Loop L1, Piezo P1, Piezo P2, Loop L2
Lane 4 – (drive lane) = Loop L3, Piezo P3, Piezo P4, Loop L4
CABINET WITH PHONE
INTERFACE ON POST,
pedestal is on west side of
Co. Rd 90' from site PWR Breaker on cabinet
post, pwr comes from
luminary at intersection
225' north of site
80'
L1L2
P1P2
60"165"63"
L4L3
L2
32'
2" Sch. 80
conduit push
One 1-½”
Sch. 40 PVC
60'
Site number:
Site Location: mp:
Site name:
Site Region:
Counter type:
Counter Serial #:
Modem type:
Modem serial #:
Pavement type:
Power:
Original install date:
Last complete reinstall date:
Layout drawn by:
Checked by:
Date drawing completed:
Last drawing update:
Richard C. Rackleff
Richard C. Rackleff
2/24/2009
2/24/2009
ASPHALT
FULLTIME
6/16/1992
10/31/2001
IRD 1068
0506-1419
ZDX
648023
CHATTAROY
EASTERN
SR 2 301.40
P28


Communications
1
Outcome 3: The Five Methods of Data Transfer
1. Twisted Pair 2. Fiber Optics 3. Digital Cellular 4. Cellular IP 5. Radio IP
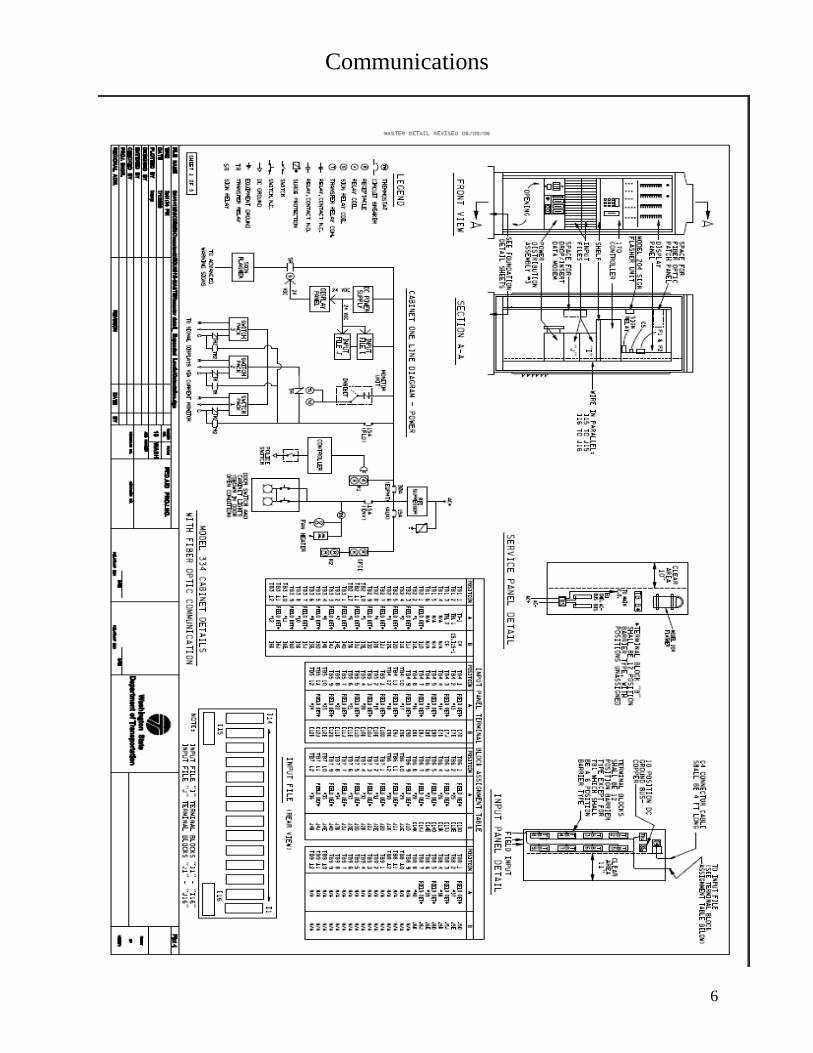
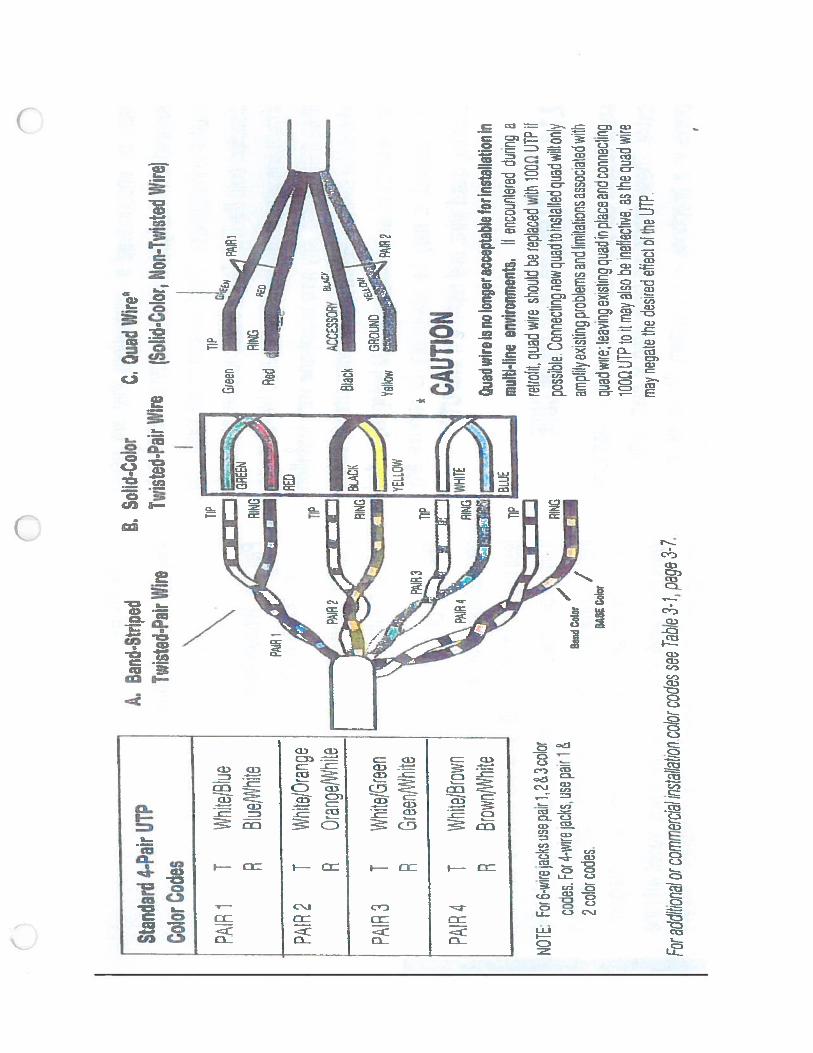
Two Types of Communication: Twisted Pairs and Fiber Optics Both use a modem: meaning to modulate/demodulate. A modem can be used to send digital data over a phone or fiber optic line. The sending modem modulates the data into a signal that is compatible with the phone or f/o line and the receiving modem demodulates the signal back into digital data. 170 controllers send their information in packets. A packet consists of a message that contains between 1 and 1500 eight-bit bytes. Ex: 170 Controller----Modem----P.O.T.S. or F/O Line-------Central Computer Twisted Pairs It is normally made of 22 or 24 AWG wire and is always described in pairs. The two wires in each pair must be twisted together to preserve signal quality. *The twisting of the wire prevents “crosstalk” from other pairs in the same wire bundle. Each pair consists of a tip (+) wire and a ring (-) wire. Two Types of Color Coding: Solid-Color and Band Striped Solid Color Coding means using only one color of wire for identification. Ex: Pair one is: Green/Red (tip/ring), Pair two is: Black/Yellow (tip/ring) Band Striped Coding means using the base color of the insulation along with a smaller band of color repeated along the length of that base insulation. Ex: Pair one is: White (base)with a Blue band (tip)/ Blue(base) with a White band (ring)
Communications
2
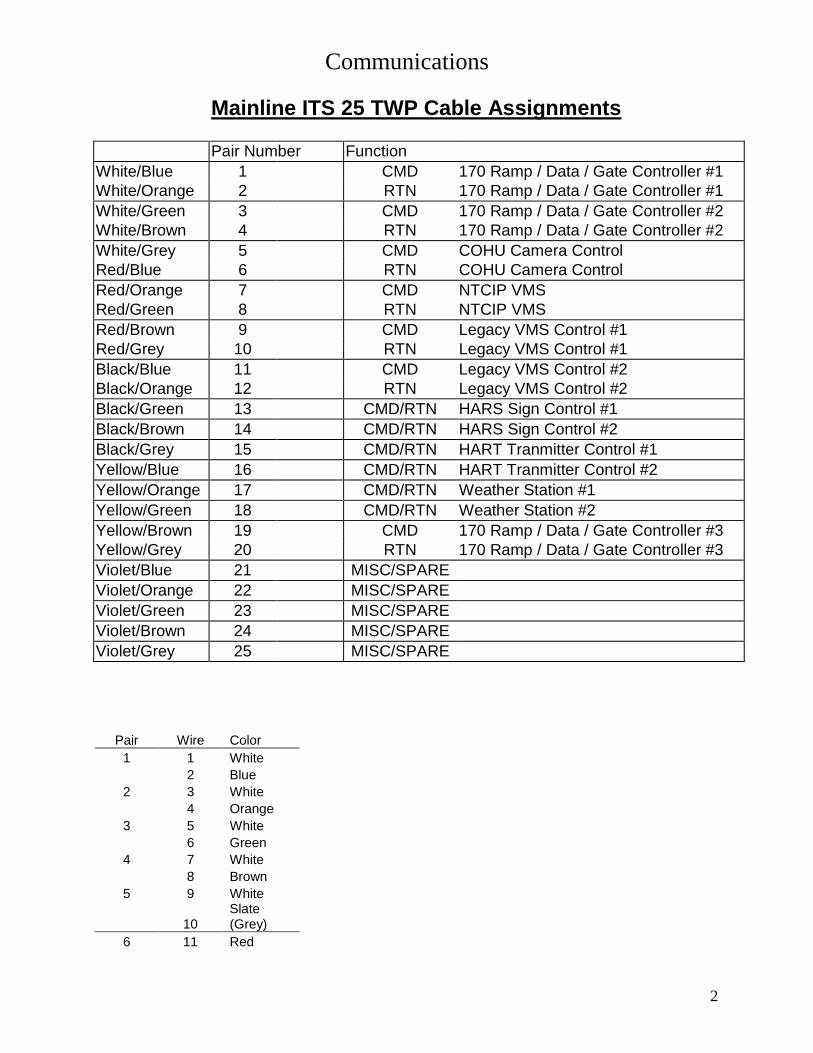
Mainline ITS 25 TWP Cable Assignments Pair Number Function
White/Blue 1 CMD 170 Ramp / Data / Gate Controller #1 White/Orange 2 RTN 170 Ramp / Data / Gate Controller #1 White/Green 3 CMD 170 Ramp / Data / Gate Controller #2 White/Brown 4 RTN 170 Ramp / Data / Gate Controller #2 White/Grey 5 CMD COHU Camera Control Red/Blue 6 RTN COHU Camera Control Red/Orange 7 CMD NTCIP VMS Red/Green 8 RTN NTCIP VMS Red/Brown 9 CMD Legacy VMS Control #1 Red/Grey 10 RTN Legacy VMS Control #1 Black/Blue 11 CMD Legacy VMS Control #2 Black/Orange 12 RTN Legacy VMS Control #2 Black/Green 13 CMD/RTN HARS Sign Control #1 Black/Brown 14 CMD/RTN HARS Sign Control #2 Black/Grey 15 CMD/RTN HART Tranmitter Control #1 Yellow/Blue 16 CMD/RTN HART Tranmitter Control #2 Yellow/Orange 17 CMD/RTN Weather Station #1 Yellow/Green 18 CMD/RTN Weather Station #2 Yellow/Brown 19 CMD 170 Ramp / Data / Gate Controller #3 Yellow/Grey 20 RTN 170 Ramp / Data / Gate Controller #3 Violet/Blue 21 MISC/SPARE Violet/Orange 22 MISC/SPARE Violet/Green 23 MISC/SPARE Violet/Brown 24 MISC/SPARE Violet/Grey 25 MISC/SPARE
Pair Wire Color
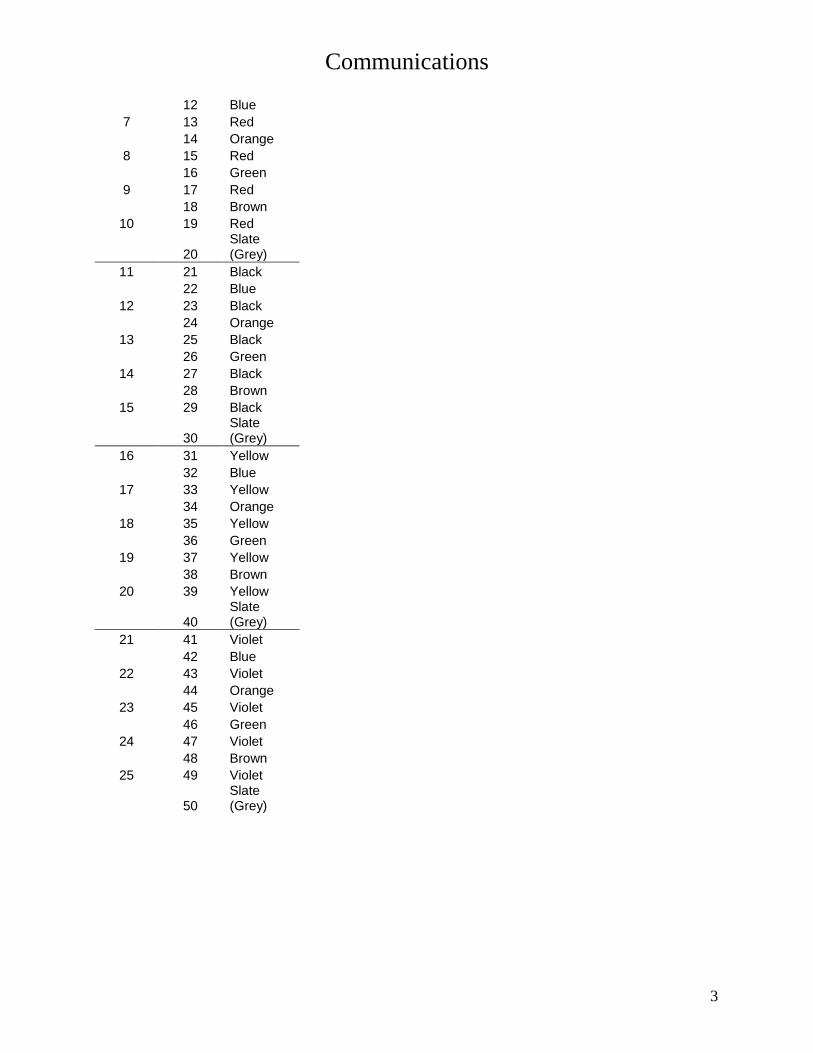
1 1 White 2 Blue 2 3 White 4 Orange 3 5 White 6 Green 4 7 White 8 Brown 5 9 White
10 Slate (Grey)
6 11 Red
Communications
3
12 Blue 7 13 Red 14 Orange 8 15 Red 16 Green 9 17 Red 18 Brown
10 19 Red
20 Slate (Grey)
11 21 Black 22 Blue
12 23 Black 24 Orange
13 25 Black 26 Green
14 27 Black 28 Brown
15 29 Black
30 Slate (Grey)
16 31 Yellow 32 Blue
17 33 Yellow 34 Orange
18 35 Yellow 36 Green
19 37 Yellow 38 Brown
20 39 Yellow
40 Slate (Grey)
21 41 Violet 42 Blue
22 43 Violet 44 Orange
23 45 Violet 46 Green
24 47 Violet 48 Brown
25 49 Violet
50 Slate (Grey)

Communications
4
Twisted Pair Troubleshooting Clip one alligator clip to ground and the other to one conductor (blue of the first pair). Listen with the butt
set "off hook" key in both positions. Then move the clip to the other conductor (white). Listen again. They
should both sound equal if the circuit is good. You are measuring capacitance and are simply looking for
a balanced pair of wires. Water or corrosion is the most common cause of noise on a circuit in the
northwest. WSDOT TWP is more susceptible to water induced noise because we don't use common
battery (-48 vdc) on the line all the time. Battery tends to dry out the pair over time and evaporate the
water. Noise on the line confuses the VAX into thinking it's carrier tone with data. The result is usually a
locked up modem or in your case, a "marginal" message. Ring out pairs using a telco style tone
generator, measure them as described before and then tag and date them as good pairs. Remember
that the rule of thumb is "tip top, ring right" In the telco world, the ring conductor has the battery and has
the color while the tip conductor has no battery and no color. In a color scheme of blue, orange, green,
brown, slate, they are all ring conductors matched up with white tip pairs. It's important that the proper tip
and ring go together because they are wound around each other much like the wires in a loop tail out. Be
on the lookout for "split pairs", ones where the ring conductors are landed correctly but the tip conductors
are switched. They will always sound imbalanced.
Each controller shall have an ACIA C20 wrap-around with the following pin connections:
C20 Function Pin C20 Function Pin
(J) RTS to (M) CTS (J) RTS to (H) DCD (K) DATA-IN to (L) DATA-OUT

Communications
5
Fiber Optics An optical fiber is a long thin strand of glass called a di-electric (about the diameter of a human hair). They are arranged in bundles called optical cables and transmit light signals over long distances. *A single fiber is made of: the Core, the Cladding and the Jacket. Modern F/O cables can carry a signal up to 60 miles. For longer distances we use HUBS. The HUB contains equipment that picks up and re-transmits the signal down the next F/O segment (at full strength) until it reaches its destination. Fiber Optic Video
Citations
HowStuffWorks, Inc., How Stuff Works it’s good to know, “How Fiber Optics Work”. Copyright 1998-2007 HowStuffWorks, Inc., How Stuff Works it’s good to know, “How Modems Work”. Copyright 1998-2007 Leviton Telcom, Residential And Light Commercial Applications, “Book 2”. Copyright 1998 Leviton Manufacturing Co. Inc Morse, M., W.S.D.O.T. Ramp Meter / Data Collection version 4.47, “User’s Manual” Created: 1996 Updated: 10 June 2009 NWR ITS Design Drawings: http://www.wsdot.wa.gov/NR/rdonlyres/E48B9C1A-9292-4DE6- A29F-EFAF77E51ACB/0/datastation.pdf
Communications
6

Communications
7

Communications
8

Digital cell communications
Digital cell converts binary code of 0s and 1s from electrical pulses. Because digital signals are made up only of binary streams, less information is needed to transmit a message. Digitized information can be transported through a noisy channel without degradation. Even if corruption occurs, as long as the one zero patterns are recognizable, the original information can be perfectly replicated at the receiving end. Some advantages of digital cell:
Faster download speeds-19200 bps. Cell and modem in one package available from manufactures. More reliable data transfer over analog. Lower cost for per month charges over normal twisted pair copper.
Some disadvantages of digital cell:
Limited locations Voice transmission take majority of bandwidth availability Small bandwidth

CELLULAR IP COMMUNICATION Cellular IP (Internet Protocol) is currently used by the TDO office to collect data from traffic
counters and weigh-in-motion devices that are within the cellular coverage network. This
method is preferred to landline data collection because of ease of installation, and a substantial
cost savings.
Cellular IP works by converting RS232 outputs of traffic counters to a packet and transmitting it
wirelessly to a cell tower. This packet is then switched to a custom APN (Access Point Name) A
custom APN gives TDO the ability to have individual or secure rights to a particular address.
This is accomplished by using a static IP address instead of a dynamic IP address on the host
computer. The data collected by the traffic counter in the field is then downloaded or viewed
over the internet by a computer that has access rights to the IP modem. Charges are based upon
per bytes of data sent. This system has a large bandwidth and can transmit real time video if
needed.
Some disadvantages of the cell IP system:
Voice takes precedence over data on cell tower use
Availability depends on cell coverage area
New system. Can be somewhat complicated to set up.
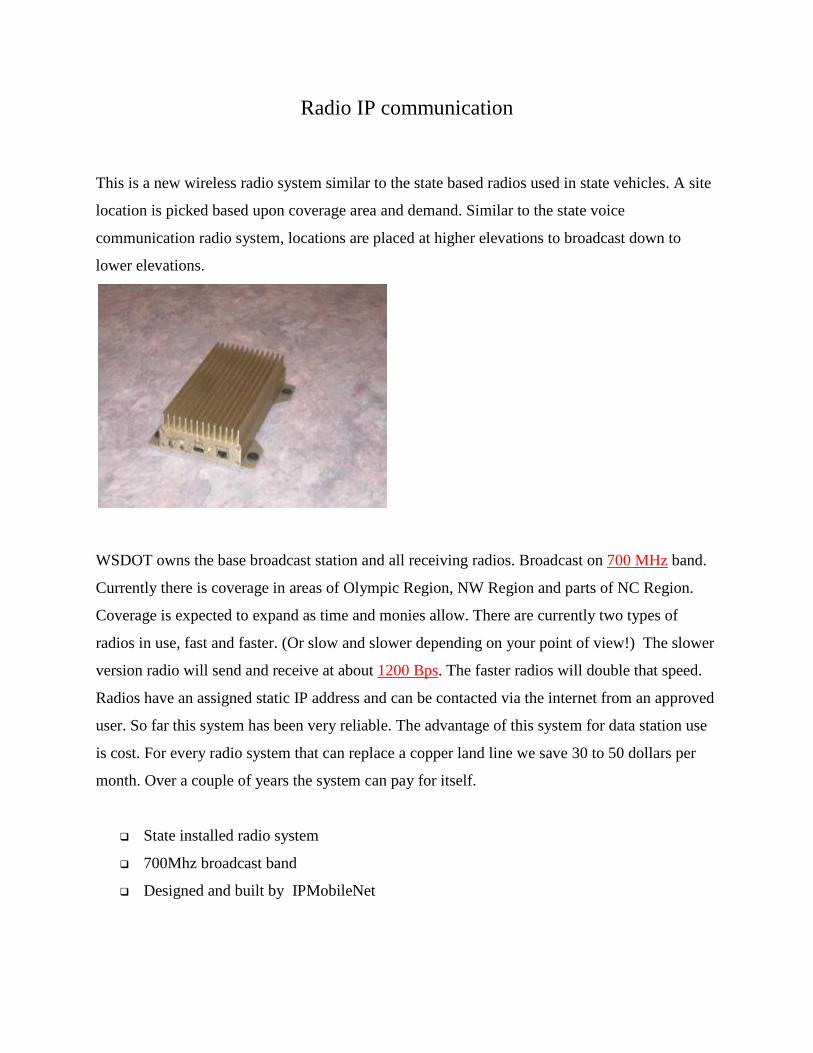
Radio IP communication
This is a new wireless radio system similar to the state based radios used in state vehicles. A site
location is picked based upon coverage area and demand. Similar to the state voice
communication radio system, locations are placed at higher elevations to broadcast down to
lower elevations.
WSDOT owns the base broadcast station and all receiving radios. Broadcast on 700 MHz band.
Currently there is coverage in areas of Olympic Region, NW Region and parts of NC Region.
Coverage is expected to expand as time and monies allow. There are currently two types of
radios in use, fast and faster. (Or slow and slower depending on your point of view!) The slower
version radio will send and receive at about 1200 Bps. The faster radios will double that speed.
Radios have an assigned static IP address and can be contacted via the internet from an approved
user. So far this system has been very reliable. The advantage of this system for data station use
is cost. For every radio system that can replace a copper land line we save 30 to 50 dollars per
month. Over a couple of years the system can pay for itself.
State installed radio system
700Mhz broadcast band
Designed and built by IPMobileNet