Embed Size (px)
Citation preview
Trust Revenue of Commercial Banks:The Influence of Bank Holding Companies
R. ALTON GILBERT
IN ADMINISTERING the Bank Holding CompanyAct, the Federal Reserve Board weighs the publicbenefits from proposed acquisitions by bank holdingcompanies (hereafter called BHCs) against possibleadverse competitive effects.~BHCs are asked to dis-cuss public benefits of proposed acquisitions in ap-plications to acquire banks and noubanking firms. Apublic benefit commonly mentioned in applicationsfor the acquisition of additional banks is increasedtrust services to be offered to customers in the areasof the proposed subsidiaries,2
Banks outside metropolitan areas and banks withrelatively few customers generally do not have enoughpotential trust customers to justify hiring a staff tospecialize in trust services. In some applications BHCsindicate plans for sharing the expertise of trust de-partment employees of their larger banks with theproposed subsidiaries. In other cases the BFICs planto offer trust services directly through the trust de-partments of their larger banks. It is contended thatunder both policies the potential customers of thebanks to be acquired would have opportunities of re-ceiving better trust services as a result of the affiliationof local banks \vith BFICs.
1Section
3(c)(Z) of the Bank Holding Company Act of 1956
as amended reads as follows The Board shall not approveany other proposed acquisition or merger or consolidation un-der this section whose effect in any section of the countrymay be substantially to lessen competition, or to tend to createa monopoly, or which in any other manner would be in re-straint of trade, unless it finds that the anticompetitive effectsof the proposed transactions are clearly outweighed in thepublic interest by the probable effect of the transaction inmeeting the convenience and needs of the community to beserved.
2See orders on bank holding company cases published in theFederal Reserve Bulletin.
The objective of this paper is to determine whetherthe amount of trust business in areas served by banksaffiliated with BHCs is significantly different fromthat in areas not served by affiliated banks, Severalvariables, in addition to the affiliation of banks withBHCs, are included in regression analyses to estimatethe influence of BHCs on the trust business of banksin areas served by their subsidiaries.
The paper is divided into three sections. The firstsection discusses the measure of trust business andthe variables used to explain the level of trust busi-ness. The second describes the sample of banks usedto estimate the influences of these variables on thetrust business of banks. The third section presentsempirical tests of hypotheses.
DETERMINANTS OF THE LEVEL OF
TRUST BUSINESS IN INDIVIDUAL
AREAS
The model specifies the factors which are presumedto influence the demand for trust services by individ-ual bank customers and the supply of trust services byindividual banks. The theoretical demand and supplyfunctions are aggregated across individuals, firms, andbanks, and a reduced form equation is specifiedwhich indicates how the demand and supply factorsinfluence the level of trust services. The measure oftrust business in an area is the revenue of bank trustdepartments per capita; trust revenue equals thequantity of trust services multiplied by the price of
trust services. Measurement of the influences on thedemand for and supply of trust services is discussedin the section where these influences are combined ina reduced form equation. Some influences on the trust
Page 8

FEDERAL RESERVE BANK OF ST. LOUIS JUNE 1974
business of banks are mentioned, but not measured,due to a lack of data.
Demand for Trust Services
Individuals demand trust services to secure man-agement of their wealth. Some trust arrangements areestablished by wills which give trust departments au-thority to sell the assets of estates and distribute theproceeds to the beneficiaries. Other trust accounts areestablished as living trusts under which individuals,while still alive, transfer legal title to part of theirwealth to trust departments to he invested and dis-posed of as the trust agreements specify. Under an-other type of arrangement, a trust department doesnot own the assets of an individual, but acts as amagent in managing his portfolio or giving investmentadvice?
The demand for trust services by am individual isassumed to be positively related to his wealth and,holding wealth constant, positively related to his age.Holding constant the influence of wealth, an individ-ual is more likely to establish a living trust as hegets older and considers the problems associatedwith transferring am estate to his family. Also, influ-ences like poor health may induce older people to usetrust departments as agents for investing their wealth.The demand for trust services by an individual atbanks in the area in which he lives is assumed to benegatively related to the price of trust services in thatarea; positively related to the prices of trust services innearby cities and to the prices of alternatives to trustservices; and positively related to the length of timethe individual has been in the area. If this individualhas moved into the area recently, he is more likelyto have established a trust account at a hank outsideof the area than someone who has lived in the areaall of his life. The prices of trust services in nearbycities and the prices of alternatives to trust servicesare not measured in this paper and therefore arenot mentioned again as determinants of trust services.
Business firms demand trust services mainly for themanagement of funds in employee benefit programs.This source of demand at banks in an area is assumedto be positively related to the percentage of employeesin the area that are accumulating pension benefits.Although trust departments provide other services for
3For more details on the operations of bank trust departmentssee Edna E. Ehrlich, “The Functions and Investment Policiesof Personal Trust Departments, I and H,’ Federal Resen’eBank of New York Monthly Review (Oct. 1972 and January1973).
business firms, no variables are included in the analy-sis to explain the demand for those services.
The total demand for trust services at banks in aparticular area is assumed to he a function of thefollowing variables:
(a) the total wealth of people in the area and stir-rounding areas (+);
(b) the percentage of individuals in the area andsurrounding areas that have enough wealth tomake management of their wealth by trust de-partme nts profitable for trust departments andan efficient means for individuals to invest theirwealth (+). Some of the costs to a bank ofestablishing a trust account do not dependupon the size of the estate to be managed.Such costs include those of talking to the cus-tomer about the purpose of the trust and dis-tributing the profits from the investments. Atthe prices trust departments would have tocharge to just cover the cost of managing smallestates, other ways of investing would be moreefficient for those individuals with relativelysmall amounts of wealth. Therefore, the ef-fective demand for trust services is assumedto depend upon the allocation of wealth. Thesetwo variables, (a) and (b), are independentif the degree of inequality in the distributionof wealth varies sufficiently among individualareas.
(c) the average age of people in the area (4-);
(d) the price of trust services in the area (—4;
(e) recent migration into the areainversely related to the lengthuals have lived in the area.
(f) the degree to which people in surroundingareas come into the area for reasons other thanjust shopping for trust services (±)-Some ofthe potential trust customers of banks in aparticular county live in surrounding counties.There are costs to these potential customers ofcoming to establish trust accounts in terms oftravel time and explicit travel costs. These costsare smaller for people from surrounding coun-ties who regularly come into the county forreasons other than shopping for trust services,such as commnting to work, entertainment, andgeneral shopping.
(g) the influence of BHCs (—). Some BHCs in-struct their smaller bank subsidiaries to refer
(—4, a measureof time individ-
Page 9

FEDERAL RESERVE BANK OF ST. LOUIS JUNE 1974
trust customers to the trust departments of thelarge bank subsidiaries of the BHCs.4 If thisis the general policy of BHCs, the amount oftmst services demanded by local customers atlocal banks would tend to be lower at eachprice charged by local banks for trust services.
(h) the percentage of employees in •the area thatare accumulating pension benefits (+).
Supply of Trust ServicesSome of the functions performed in managing trust
assets are the same as those involved in other opera-tions of a bank, such as buying and selling govern-ment securities and evaluating the future profit pros-pects of companies. If the other departments of abank have enough business to take advantage of someof the economies of scale in banking, the trust depart-ment of that bank would have a lower cost structurethan the trust department of a smaller bank.
Any influence that lowers the costs to a bank ofsupplying trust services shifts its supply schedule fortrust services so that more trust services are offeredat each price. The supply of trust services by anindividual bank is assumed to he a function of thefollowing variables: the price of trust services (+);the costs of inputs, such as labor (—); the volumeof transactions at the bank outside of the trust de-partment (+); and affiliation of the bank with a BHC(+). The sign of this last variable is positive if BHCshelp their subsidiary banks develop their own trustdepartments. Several studies indicate that thereare economies of scale in bank trust departmentsSuppose that a BHC helps its subsidiary banks lowertheir operating costs by pooling operations. This in-fluence on the cost structure of a subsidiary bankwould induce it to offer more trust services at eachprice than it would have without affiliating with theBHC. The costs of bank inputs are not measured andtherefore are excluded from additional analysis.
4cerald C. Fischer, Bank Holding Companies (New York:Columbia University Press, 1961), p. 130; Steven Weiss,‘Bank Holding Companies and Public Policy,” New EnglandEconomic Review (January/February 1969). p. 19.
5Frederick W. Bell and Neil B. Murphy, Costs in CommercialBanking, Federal Reserve Bank of Boston Report No. 41(April 1968), p. 164; Marvin S. Margolis, “Trust Depart-ments — A Suggested Approach for Determining Func-tional Profitability,” Federal Reserve Bank of Dalias BusinessReview (April 1974), pp. 1-5; Neil B. Murphy, “Cross-Sectional Analysis of the Cost of Operations of Trust Depart-ments,” Journal of Money, Credit and Banking (February1969), pp. 84-100; Keith V. Smith and Maurice B. Goudz-waard, “The Profitability of Commercial Bank Trust Man-agement,” Journal of Bank Research (Autumn 1972), pp.166-77.
The total supply of trust services by banks in agiven area is a function of the following variables:
(a) the price of trust services in the area
(b) the size of the largest bank in the area (+),
(c) the size distribution of banks in the area. Hold-ing constant the size of the largest bank, thequantity of trust services supplied by banks inan area at each price is assumed to be greaterthe more equal the size distribution of banks inthis area. The influence of the size of all banksin the area on the total supply of trust servicesis captured by items (b) and (c).
(d) the existence of banks in the area that areaffiliated with BuGs (+). As explained above,the direction of influence of this variable de-pends upon the policies of BI-ICs. The positivesign holds if BHCs help the trust departmentsof their individual subsidiary banks attractcustomers.
Reduced Form and Empirical Proxies
As indicated above, the trust business of banks inan area is measured by the revenue of their trust de-partments per person living in the area.6 Demandand supply functions for trust services can be esti-mated only with separate measures of price and quan-tity of services. These are not available. However, therevenue of bank trust departments can be specified asa function of variables listed above which influencethe supply of and demand for trust services.
Changes in variables that induce an outward shiftin the demand function cause trust revenue to rise.The influence of shifts in the supply curve dependsupon whether the supply curve intersects the demandcurve on its elastic or inelastic portion. If the supplycurves intersect the elastic portion of the demandcurves in all areas under analysis, changes in supplyvariables that cause the supply curves to shift to theright will increase trust revenue. There is no data toindicate whether this assumption is warranted. There-fore, the direction of influence of supply factors onthe trust revenue of banks must he determined em-pirically; neither positive nor negative signs arehypothesized.
The following list indicates the measurable varia-ables hypothesized to influence trust revenue per cap-
8Data on trust income is taken from the Report of Income byall commercial banks that are insured by the Federal DepositInsurance Corporation.
Page 10

FEDERAL RESERVE DANK OF ST. LOUIS JUNE 1974
ita and the directions of influence. A discussion ofempirical measurement follows the identification ofeach variable.
(a) Wealth per capita in the area (+). Data onwealth are not available by county, but meas-ures of income by county are available for pop-ulation census years.7 Trust revenue per capitais hypothesized to he positively •related to me-dian family income. A ranking of counties bymedian family income would approximate theranking by wealth per capita if no migrationtakes place, if the share of income saved doesnot vary among counties, and if the ranking ofcounties by median family income has re-mained the same over time.
The last assumption is relaxed by adding therate of change in median family income as anexplanatory variable. If two counties had thesame median income in 1969, the county withthe more rapid growth in median income from1959 to 1969 would have a lower level ofmedian income in 1959 than the area withslower growth. Accumulated nonhuman wealthwould generally be lower in the area with thefaster growth in median family income. There-fore, trust revenue per capita is hypothesizedto he negatively related to the rate of changein median family income, holding constant thecurrent level of median family income.
(b) The percentage of individuals in the area andsurrounding areas that have enough wealth tomake management of their wealth by trust de-partments profitable for trust departments andan efficient means for individuals to investtheir wealth (+). This variable is measuredas the percentage of families with incomes over$50,000 in 1969. This income level is used be-cause it is a measure of income distributionavailable from the census reports which is nothighly correlated with median family income.Two separate percentages are calculated, onefor the county under study and another for
the surrounding counties.
(c) The percentage of people in the area oldenough to consider trust accounts as a means ofmanaging their assets (+). This variable is
~The term wealth is used in this paper to refer to nonhumanwealth. For maoy people the largest portion of their totalwealth is their human wealth, that is, the present value of thefuture eamings they will receive from working. Individualshave a use for trust departments only when a large portion oftheir wealth is held in nonhuman fonn.
measured as the percentage of population 45years old or older in the area under study. Noalternative measures of age were used.
(d) Migration into the area (—). This variable ismeasured as the percentage of residents in acounty in 1970 who lived in another county in1965.
(e) The degree to which people in surroundingcounties come into the county under study forreasons other then shopping for trust services(±).This variable is measured as the popula-tion density of the county under study less thepopulation density of surrounding counties. Ifpeople shop in an area outside the county inwhich they live or commute into another areato work, they are likely to go to a countywith a higher population density than theirhome county.8
(f) The percentage of workers likely to he accumu-lating pension benefits (+)~A uniform indus-trial classification of employees is presented bycounty in the 1970 census. Domestic and farmworkers are considered least likely to have pen-sion plans. This variable is measured as thepercentage that domestic and farm workerscomprise of total employees and is assumed tobe negatively related to observed trust services.
(g) The size of the largest bank in the area ismeasured as total deposits on December 1971.
(h) The size distribution of banks in the area. Thisvariable is measured by the Herfindahl Index,computed by squaring the percentage of totaldeposits held by each bank in the county as ofDecember 1971 and then summing over allbanks in the county. The more equa]ly depositsare distributed among banks in a county, thelower this index.
(i) The existence of banks in the area affiliatedwith BHGS (-4-- or —). This variable is repre-sented by dummy variables, one with a valueof unity if one or more banks in a county wereaffiliated with a BHC on December 1971, zerootherwise, and the other dummy variable witha value of unity if one or more banks in thecounty were affiliated with BHCs on Decem-ber 1970, a value of zero othenvise. The second
8This hypothesis about shopping behavior is implied from theCentral Place Theory. See Hugh 0. Nourse, Regional Eco-nomics (New York: McGraw-Hill llook Co., 1968), pp.33-62.
Page 11
FEDERAL RESERVE DANK OF ST. LOUIS JUNE 1974
iated with BHCs would improvetheir trust departments under thethreat that the subsidiary bankswould start providing this serviceif they did not. Negative regres-sion coefficients would providesupport for the proposition thatBHCs have attracted the potentialtrust customers of their smallersubsidiary banks to their largerbanks. A regression coefficient notsignificantly different from zerocould indicate either that theBHCs have followed different pol-icies in dealing with trust custom-ers or that BHCs have had no
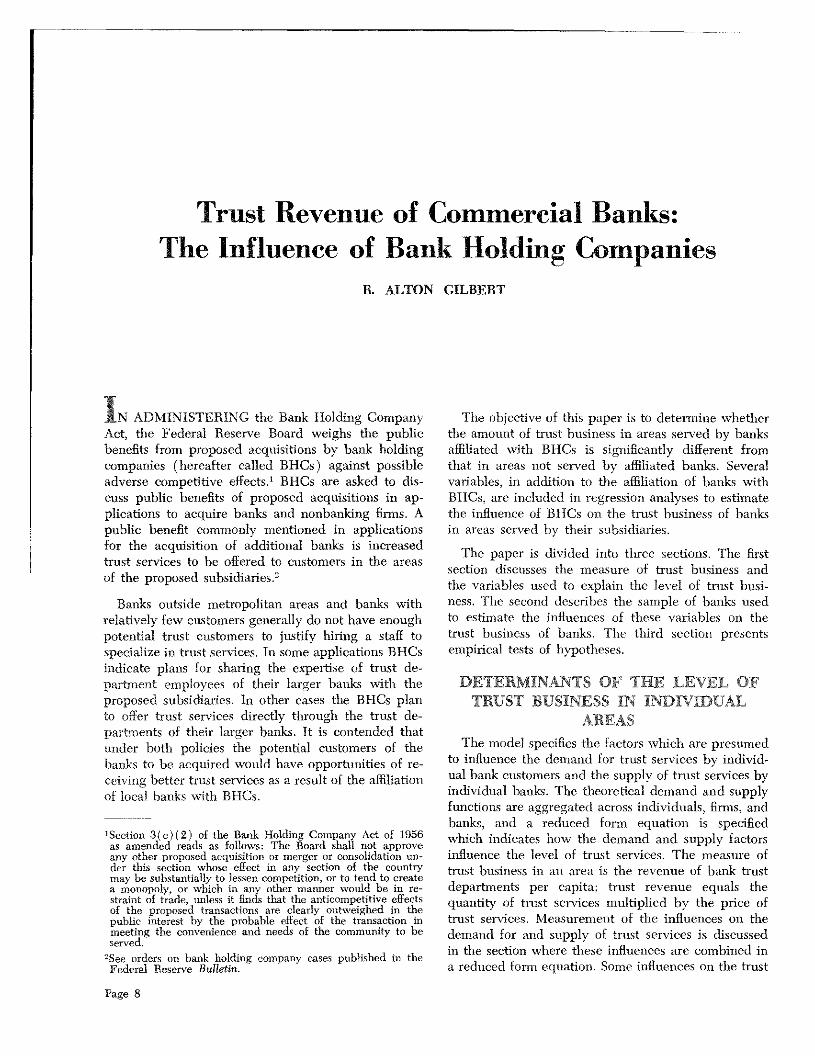
years, and these states appear to havesomewhat similar economic characteris-tics.°All nonmetropolitan counties in thethree states in which at least one bankreported trust revenue on the 1971 Re-port of Income are included in the sam-ple,1°As indicated in Table I, 26 of the125 counties had banks affiliated withBHCs as of December 1971. Two ormore banks were affiliated with BI-ICsin only three of these counties as of Dc-
e
$5
a6 a a
a a aa 7
a 3 37r III
c a 80
Sa
on
a 2 7~
aOct~ms a a
as
.-~ ,-of c:.r_ :4c.:,jr —
SIa~e can~t ‘~ _: . . ..r 5—.~ -
IOWa 7°
Mssouri . 7
Tutu!
dummy variable is added to allow for the pos- cember 1971. Banks were affiliated with BHCs in 22sibility that the influence of affiliation with counties as of December 1970.BHCs on trust services offered takes at least ayear to affect the trust revenue of subsidiary The sample is restricted to nonmetropolitan countiesbanks. These variables are included sepa- because BHCs commonly list increased trust servicesrately as independent variables in regression as public benefits when applying to acquire banks inequations. those areas. Furthermore, relatively few banks in
nonmetropolitan areas offer trust services, and it is in
No hypothesis is made about the direction these areas that BHCs can be expected to have theof influence of these dummy variables on trust greatest effect on the total supply of trust servicesrevenue per capita. Positive regression coeffi- offered if they have any effect at all.cients for these variables would indicate thatBHCs have helped their smaller subsidiary The names and sizes of the BHCs represented inbanks to increase their own trust business, An the study are given in Table II. In most counties inalternative hypothesis with the same implica- which BHCs were represented, only one bank was ation is that local banks other than those affil- subsidiary of a BHC. In one county in Tennessee
significant influence on the trust sen’ices offeredto potential customers of their subsidiary banks. °Some counties in Florida were originally included in the
empirical analysis but were later excluded because thosecounties increased the standard error of estimate substantially.This result is probably due to a large number of retired peo-ple in Florida who have a higher ratio of nonhuman wealth
THE SAMPLE OF BANKS to income than people in the other three states in the study.With data for Florida included in the sample and dummyvariables added for states, only the dummy variable for
The banks in this study are located in 125 counties Florida counties has a regression coefficient that was signifi-in the following states: Iowa (75); Missouri (26), and cantly different from zero.
Tennessee (24). These states are in the sample be- tONoumetropolitan counties are those outside Standard Metro-
cause BHCs have acquired banks there during recent politan Statistical Areas.
Page 12
EE RESEREEN FS Os JUNE 974
Tab 1ag a Rest
t -
7 HO GE P061 MG SflSG6 0 15 00074 015$ -‘0949
1~) 0 113 08 0194)2 003 0 6 008 0147 001
f 555~ 6 262 0 9 — 19) 1—023310514 it 1) 39 04 019 —00677
6) 1 277 0.23 f12S~ ( 16)O 1 .9 05 00 65 09224 3 8 90 02003 L16 2)
5 34 17 49 0 92792 7 05) 1 0~ f-4217
0- 69 1 60 58 2 001544 —9’024412 2 0188 11211 197
7 0. 46 8 00470 000344 0- 1 a~5) 469 274 3 —08
5 03 *077 00241t 84 9 903
9’ 131 2(4952) 78
a tandeMHa, P 88 80 aCT tar Inrcept
*09 0000 01 O~ 64$ 0683 4795038 43 036
2 43096 0.000 0 0 6 7 & t679 65874 2
6 O00O2 9’ a 065 611101 87
00304 00000 8-49 5 3 0677 2,4 684 543 (294 0963 17
5 000 .46 6 1 9678 L583O 8 6) 0
4 —00 00009 82 74 7 6 067 230414 0 874)
7 9 1 30 —070466
5 0,029 -D I 0 16047~1
9 0.w063 6 4 263 587
D193 C
P mad tt1t Sm. 96
eastnao tat age. ma a y~ fat91450 hepoata a
1r waS a sisl6 5,00 a
0 5 ectga pa4ye do 19
P 4 anca a ppv an q a Is a ndtsg osLo 90I pro aopaaat ot cats a pldan ada 90 a ~ed ad r ‘gun n1965
0 n rtsdag a • p tg p mao or - 9P thapercant ra maca ml me ca its r 97
5LS ha~ I alga banMe a org p gafO tailHERF Is a Ot4ab 6BK? admmyvtbiowh vu to a be eca ‘ii a ead hSltcaafOecmba
9’ era. a to
km S$C7~ p a a an 0
amilo Bancsha s rid nit Tnnss a - anksi th B C sofDcemberl lrangedfroms rs rveeac owed bank. r o i . $1 13mlho toS 4 Fon.o edthre ba sinoc nty n to -
anohrco tyin ow .Thethid ‘oum f agiesthenumb ofcoutie i I u ri - c Te~ifluen o ievri 5’ epedn variableseach Cisrp sented. ul eois fsìsir - s e ue en pit 1 stuna d / using
Page 13

FEDERAL RESERVE BANK OF ST. LOUIS JUNE 1974
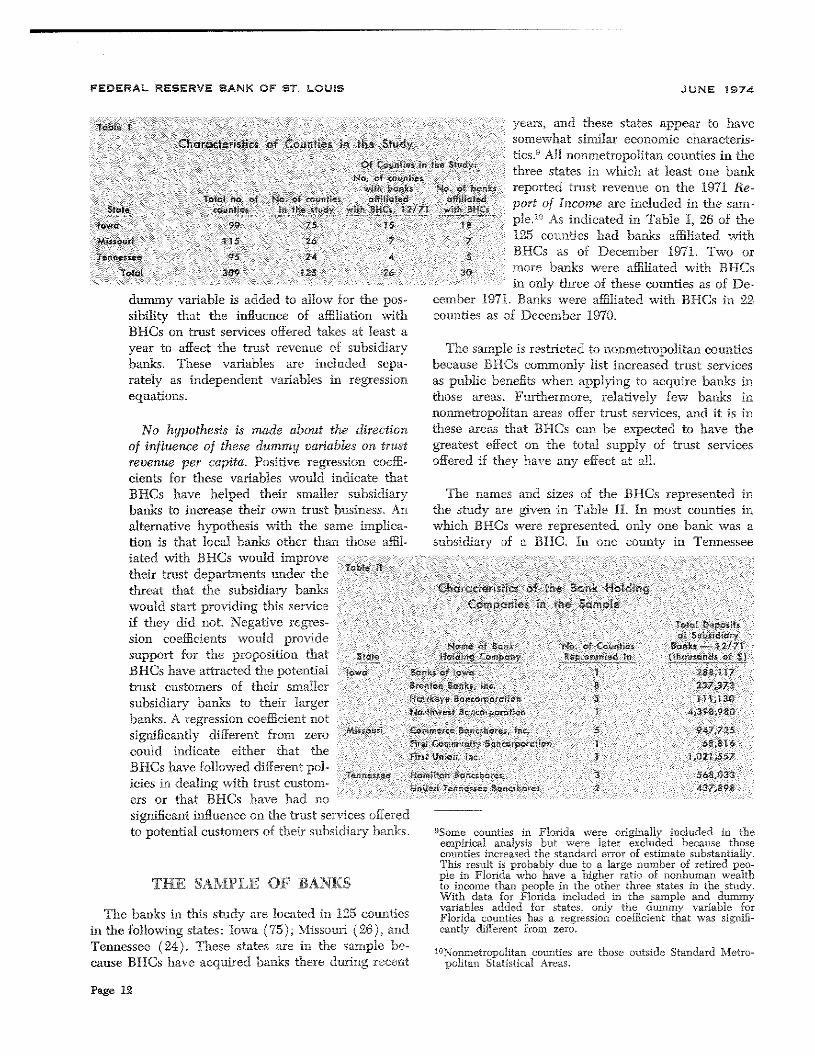
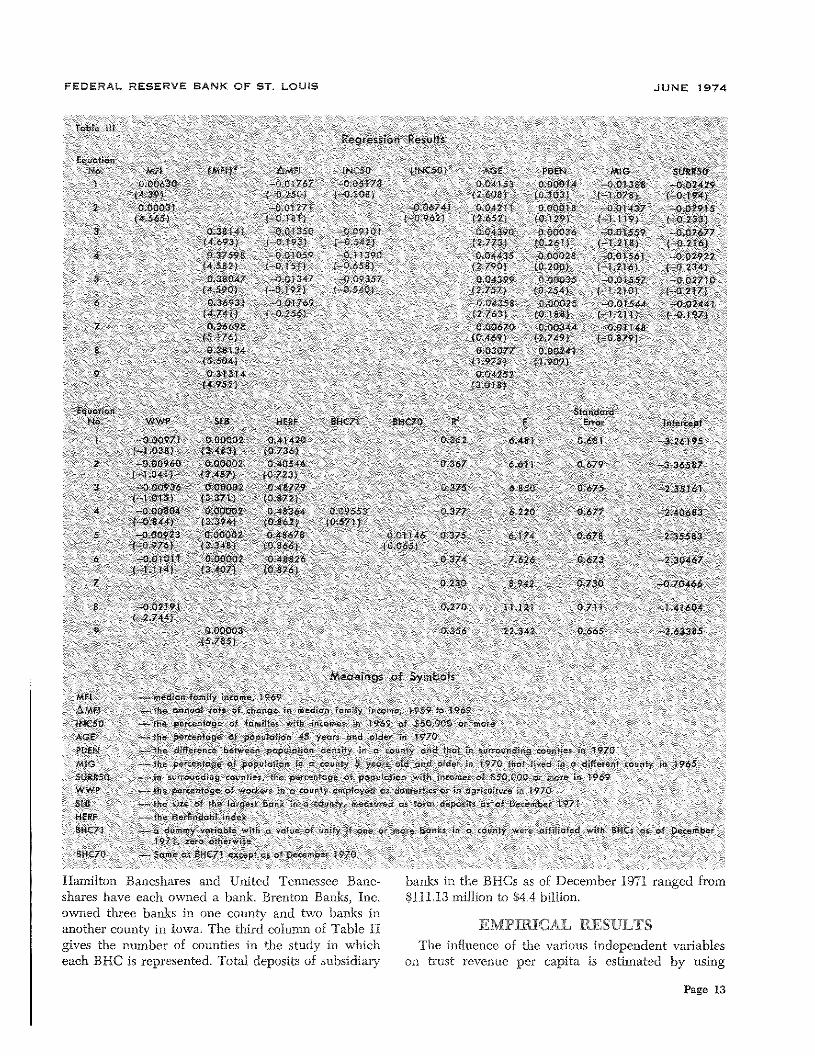
ordinary least squares regression analysis. The regres-sion results are presented in Table III (p. 13). Thet-statistics are presented in parentheses below the re-
— C ~<0. ~ U) U~ I mgression coefficients.
Approximately 37 percent of the variation in trust 0 . N —
revenue per capita is explained in equations that b ~• . . - 000000000000—include all of the independent vanables. There is col- I I
linearity among the independent variables, making it
difficult to determine the contribution of individual ~ ~- . . - LI — Neq—CN——Oeqeq 0 0 C’independent variables to explaining trust revenue (see a a a a 0 ci o ci ci ci ci
Table IV for an indication of the pairwise collinear- I I • I
ity ) - An equation which includes only the followingthree variables explains about 35 percent of the varia- ~ 2 ~ ~2 g ~
i~~O C~ ——000’- eq eq 000
tion in the dependent variable: median family income, = ci 9 d d ci ci ç ~ ~ ..
the percentage of population 45 years and older, andthe total deposits of the largest bank in the county. C, ~. — eq o , —
fl ~ N. C C’ C N ... N 0 C 0 C
Several variables were included in the equations in 6 ~ 2 2 ;
nonlinear form to see if the fit of the equations wouldbe improved. The fit of the equations is better with
e4 t ~ C, C, U) C.) C’ 0 eq C.) C’ eqmedian family income squared. Squaring the per-centage of families with incomes over $50,000 does not ~ o 9 9 ~ 0
improve the fit of the equation substantially.
.5 0 N eq C.) C, ~ C, 0 0. cn a- ~ NTwo vanables are highly correlated with the size of .~ ~ ; g gthe largest bank: (a) the population density in a 0 0 0 4 9 0 ~ C? ~
county less than population density in surroundingcounties and (b) the percentage of workers em-ployed as domestics and in agriculture, a proxy for ~§ ~workers without pension plans (see Table IV). The ~ ci ci d 4 ci -~ a a a ci ci
estimated regression coefficients of these variableshave the hypothesized signs and are statistically sig- N N C U) N 0 fl C, U) Co C U) Co
nificant in two equations that delete the size of the ~ 8 2 2 ~ ~ 2 2largest bank in the county as a variable (see Equa- 0 0 9 0 — ci ci ci 0 ci
tions 7 and 8), but are not statistically significantwhen that variable is added to the equation. The re- .. o e. N 0 N ‘t C.) ‘t 0 —— C-) C, 0 U) — C U) 0. — eq C-)
sults in equations 7-9 illustrate that with collinearity ‘1 q Q ° ‘~ 0 a ‘a 0 C-I N
- . . 0 9 0 0 — 0 0 0 0 0 0 0 0the t-statistics for regression coefficients vary greatly . I I I
depending upon which independent variables are in-cluded. Under those circumstances it is difficult to ~ ~
- ci 0 t 000000 eqsay that one variable explains trust revenue and an- z ci 0 ci — 0 ci ci ci ci ~ ci ci
other does not. I
Dummy variables that indicate the presence of ~ 2 ~- N C, 0 0—eqeqoeqeq—N—
banks that have been acquired by BHCs have regres- < a a ci a a a a a a a asion coefficients which are not significantly different . . . I I I
from zero (see Equations 4 and 5). These results are- . . . . C 0 N fl 0 N eq C-, ~ — C, ‘a C,
consistent with either of the following two inten~reta- ~ ~tions: (a) some BHCs have attracted the potential ci - ci ci eS ci ci d ci ci
trust customers of their smaller subsidiary banks to becustomers of their larger subsidiaries, while other ~ ~ N ..‘~ N eq C’ ~ C’
- — ~. 0 0 C C,-NC,k’ C Co C,BHCs have helped their smaller subsidianes attract ‘~ c- o — N 0 0 c-I ‘a 0 -:3 ~00000000 0000
customers for their own trust departments, and these I I
influences are of equal strength, or (b) BHCs have
Page 14
EEDERAL RESERVE BANK OF ST. LOUIS JUNE 1974
had no influence on the markets for trust services oftheir smaller bank subsidiaries tbrough either channel.The tests for the statistical significance of the regres-sion coefficients cannot discriminate between thesetwo hypotheses.
Collinearity among the independent variables maybe the influence which causes the t-statistics of theregression coefficients for the dummy variables repre-senting BHC affiliation to be so small as to indicatelack of statistical significance. Given that possibility, arelevant question is: what is the economic signifi-cance of those dummy variables for trust revenue ifthe question of statistical significance is ignored? Thedependent variable is measured as dollars of trustrevenue per capita. Therefore, the regression coeffi-cient of the dummy variable BHC 71 indicates thattrust revenue per capita was about $0.10 higher onaverage in areas in which one or more banks weresubsidiaries of BHCs, holding other factors constant.The difference was about $0.01 using the dummyBk-IC 70. These differences are so small as to indicatelittle economic significance, especially since for thesample of counties trust revenue per capita rangesfrom $0005 to $4823.
Equations 1-3 and 6-9 in Table III were reestimatedusing average trust revenue per capita in the years1969-71 as the dependent variable. This was done todetermine whether a significant amount of randomvariation could be removed by averaging over severalyears. The regression results with this dependent vari-able are not substantially different from those resultsin Table III. The predictive ability of the independentvariables is not substantially higher with the depend-ent variable, trust revenue, averaged over three years,indicating little variation in the trust revenue of banksover several years.
SUMMARY AND CONCLUSIONS
The purpose of this paper is to estimate the influ-ence of bank holding companies (BHCs) on the trustrevenue of banks in areas in which banks are affiliatedwith BHCs. Remarks in other studies indicate thatBHCs could be expected to either increase or decreasethe trust activities of their smaller subsidiary banks,depending upon the policies of the BHCs. Empiricalresults of this paper indicate that the trust revenue ofbanks in counties in which one or more banks areaffiliated with BHCs is neither higher nor lower thanin other counties, holding other factors constant. Thisindicates either that BHCs follow different policiesconcerning the trust business of their smaller banks orthat they have had no influence on the trust revenueof banks.
This paper presents equations for estimating thelevel of trust business of banks in county areas usingseveral variables which are assumed to influence thedemand for or supply of trust services. The trust busi-ness of banks is measured as the revenue of bank trustdepartments in each county per person living in thecounty. The following variables are the most usefulfor estimating the trust revenue per capita: medianfamily income, the percentage of population 45 yearsand over, and the size of the largest bank in the area.
The results of this paper have an implication for theregulation of BHCs. The empirical results do not indi-cate an influence of BHCs on the trust revenues ofbanks in areas with subsidiaries of BI-ICs. Therefore,it is appropriate, to give little weight to promises byBHCs that they will increase trust services offered tocustomers of their subsidiary banks until some evi-dence is presented to support this contention.
N
N
Page 15