Embed Size (px)
Citation preview

Trust is a dynamic, livingthing. It calls for truthfulnessand commitments honored.Trust frees us to think forourselves, to forge lastingrelationships, and opens theway to new possibilities.
2
2001 2000 % change
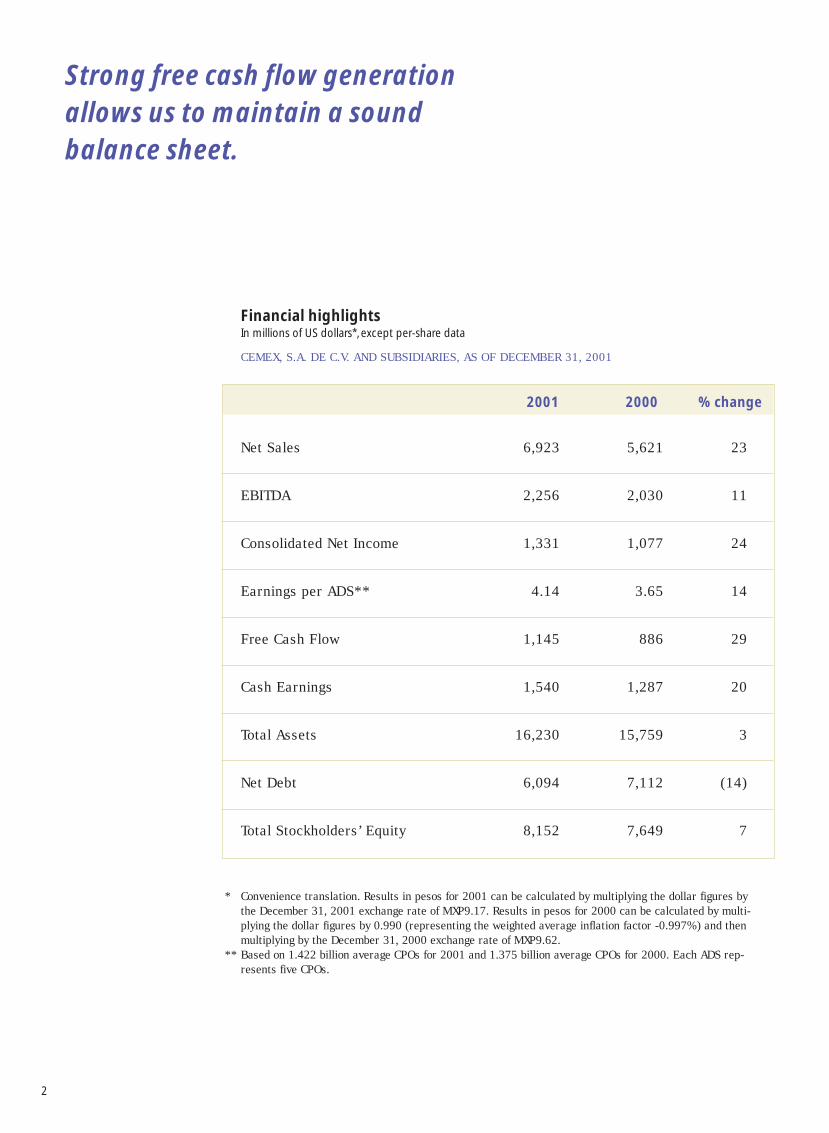
Net Sales 6,923 5,621 23
EBITDA 2,256 2,030 11
Consolidated Net Income 1,331 1,077 24
Earnings per ADS** 4.14 3.65 14
Free Cash Flow 1,145 886 29
Cash Earnings 1,540 1,287 20
Total Assets 16,230 15,759 3
Net Debt 6,094 7,112 (14)
Total Stockholders’ Equity 8,152 7,649 7
Financial highlightsIn millions of US dollars*, except per-share data
CEMEX, S.A. DE C.V. AND SUBSIDIARIES, AS OF DECEMBER 31, 2001
* Convenience translation. Results in pesos for 2001 can be calculated by multiplying the dollar figures bythe December 31, 2001 exchange rate of MXP9.17. Results in pesos for 2000 can be calculated by multi-plying the dollar figures by 0.990 (representing the weighted average inflation factor -0.997%) and thenmultiplying by the December 31, 2000 exchange rate of MXP9.62.
** Based on 1.422 billion average CPOs for 2001 and 1.375 billion average CPOs for 2000. Each ADS rep-resents five CPOs.
Strong free cash flow generationallows us to maintain a soundbalance sheet.
01009998979695949392
Consolidated net salesMILLIONS OF US DOLLARS
3,7
88
3,3
65
2,5
64
2,1
01
2,8
97
2,1
94
4,3
15 4
,82
8 5,6
21
6,9
23
01009998979695949392
Consolidated net incomeMILLIONS OF US DOLLARS
86
8
1,0
96
86
8
42
1
61
9
61
5
84
2
1,0
29
1,0
77
1,33
1
01009998979695949392
AssetsMILLIONS OF US DOLLARS
10
,23
1
9,9
42
8,3
70
7,8
94
8,0
18
7,4
57
10
,46
0 11
,86
4
15
,75
9
16
,23
0
3
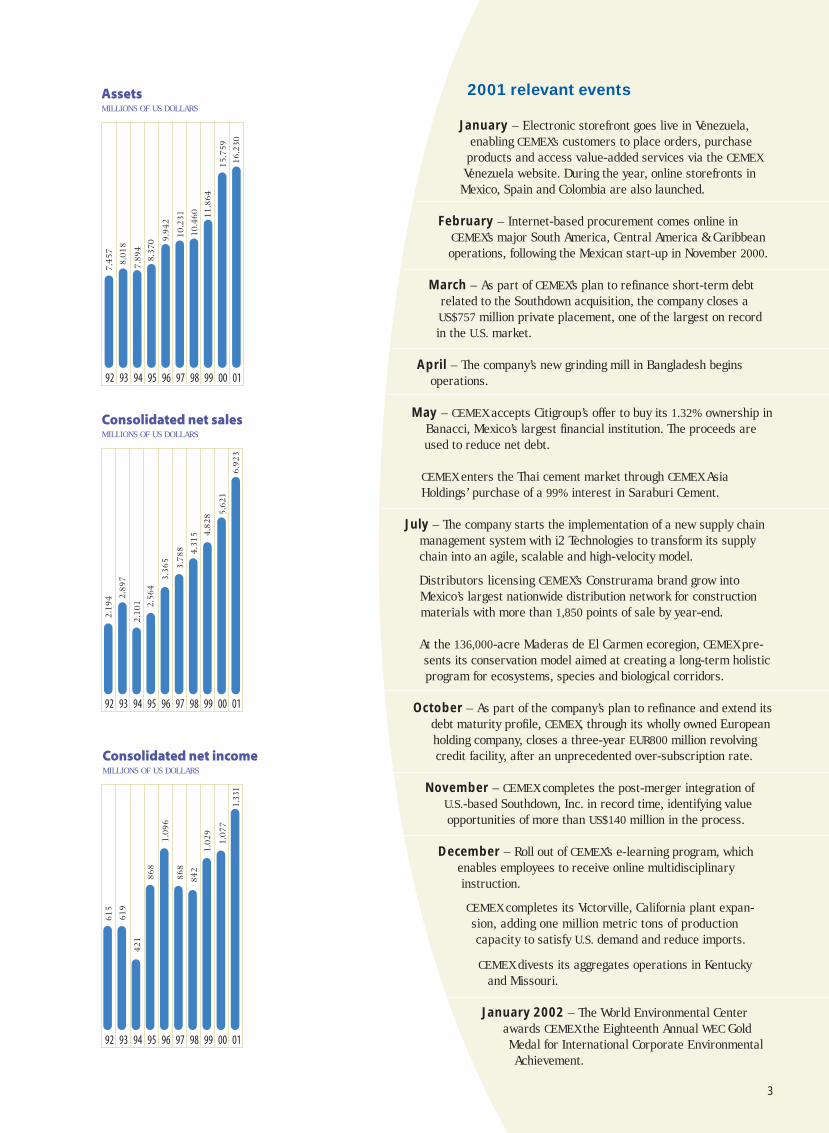
2001 relevant events
January – Electronic storefront goes live in Venezuela,enabling CEMEX’s customers to place orders, purchase
products and access value-added services via the CEMEXVenezuela website. During the year, online storefronts inMexico, Spain and Colombia are also launched.
February – Internet-based procurement comes online inCEMEX’s major South America, Central America & Caribbeanoperations, following the Mexican start-up in November 2000.
March – As part of CEMEX’s plan to refinance short-term debtrelated to the Southdown acquisition, the company closes aUS$757 million private placement, one of the largest on recordin the U.S. market.
April – The company’s new grinding mill in Bangladesh beginsoperations.
May – CEMEX accepts Citigroup’s offer to buy its 1.32% ownership inBanacci, Mexico’s largest financial institution. The proceeds areused to reduce net debt.
CEMEX enters the Thai cement market through CEMEX AsiaHoldings’ purchase of a 99% interest in Saraburi Cement.
July – The company starts the implementation of a new supply chainmanagement system with i2 Technologies to transform its supplychain into an agile, scalable and high-velocity model.
Distributors licensing CEMEX’s Construrama brand grow intoMexico’s largest nationwide distribution network for constructionmaterials with more than 1,850 points of sale by year-end.
At the 136,000-acre Maderas de El Carmen ecoregion, CEMEX pre-sents its conservation model aimed at creating a long-term holisticprogram for ecosystems, species and biological corridors.
October – As part of the company’s plan to refinance and extend itsdebt maturity profile, CEMEX, through its wholly owned Europeanholding company, closes a three-year EUR800 million revolvingcredit facility, after an unprecedented over-subscription rate.
November – CEMEX completes the post-merger integration ofU.S.-based Southdown, Inc. in record time, identifying valueopportunities of more than US$140 million in the process.
December – Roll out of CEMEX’s e-learning program, whichenables employees to receive online multidisciplinaryinstruction.
CEMEX completes its Victorville, California plant expan-sion, adding one million metric tons of productioncapacity to satisfy U.S. demand and reduce imports.
CEMEX divests its aggregates operations in Kentuckyand Missouri.
January 2002 – The World Environmental Centerawards CEMEX the Eighteenth Annual WEC GoldMedal for International Corporate EnvironmentalAchievement.
“We must remain flexible so that weare responsive to new opportunitiesand new challenges, and we mustfoster a culture that embracesconstant change.”
4
Lorenzo H. ZambranoChairman of the Board and CEO
Dear fellow stockholders:
I am proud of and grateful for the trust you place in us each year – in our ability to growand prosper in a dynamic business environment. I know that strong, long-lasting businessrelationships are based on trust that is earned, not given. That’s what this year’s report is allabout; the distinct way CEMEX works to build confidence among our customers, employeesand, ultimately, you.
We recognize that a compelling value proposition is founded upon results. Hence, we manageand position the company to create value in down and up markets, to produce consistentreturns, and to generate healthy cash flow throughout the economic cycle. This is an over-riding priority, and our executives – most of whom are also stockholders – are keenly awareof it. As a result, their interests are aligned with yours: to deliver results day in and dayout, year after year.
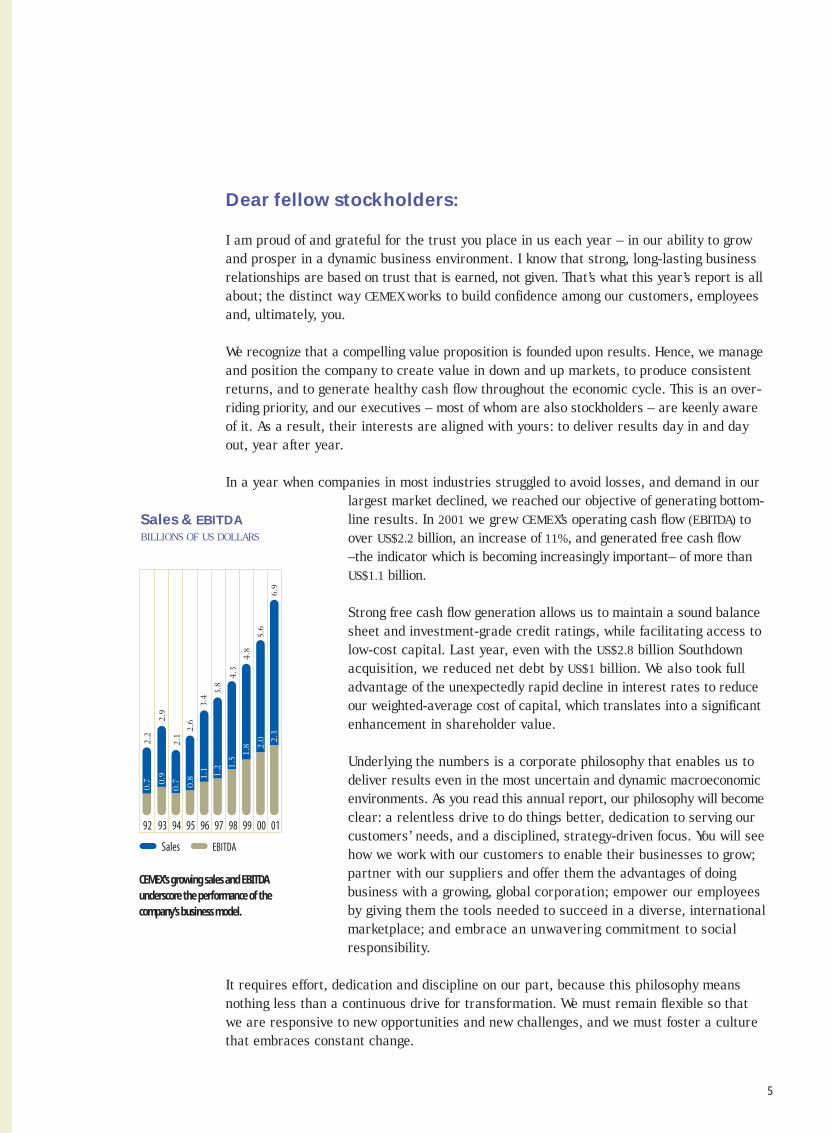
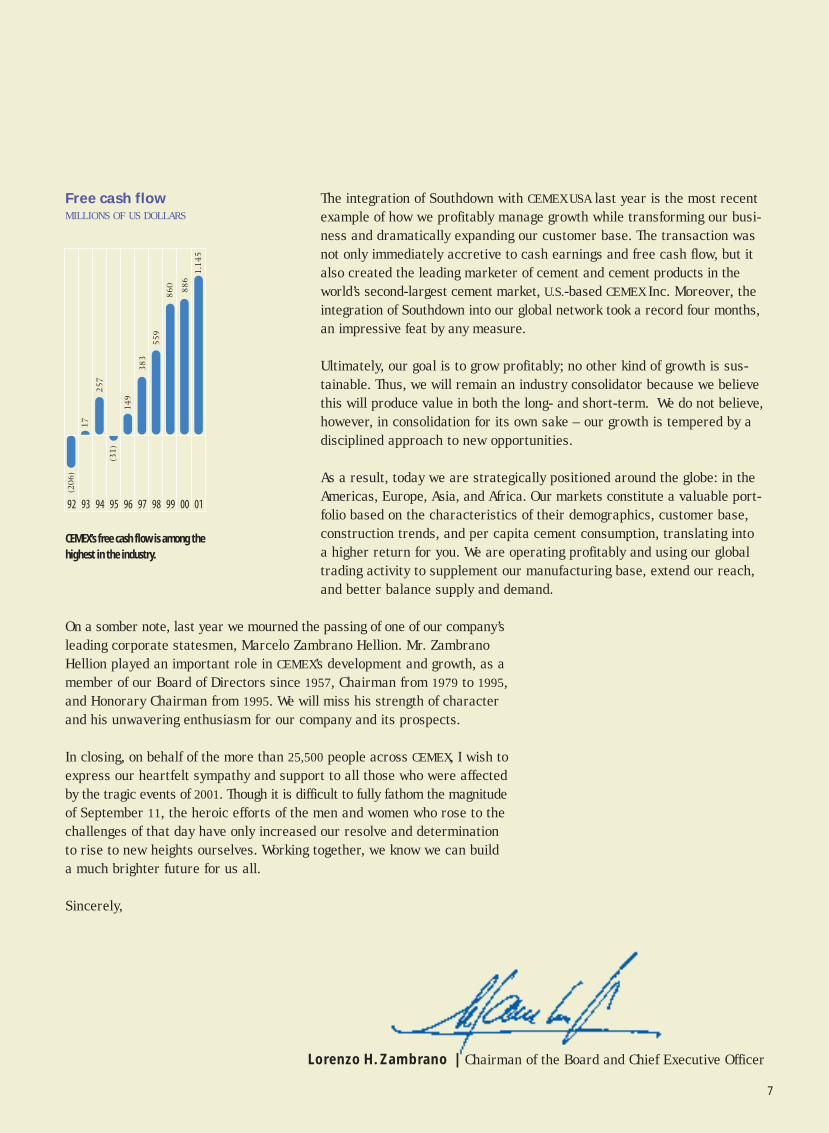
In a year when companies in most industries struggled to avoid losses, and demand in ourlargest market declined, we reached our objective of generating bottom-line results. In 2001 we grew CEMEX’s operating cash flow (EBITDA) toover US$2.2 billion, an increase of 11%, and generated free cash flow–the indicator which is becoming increasingly important– of more thanUS$1.1 billion.
Strong free cash flow generation allows us to maintain a sound balancesheet and investment-grade credit ratings, while facilitating access tolow-cost capital. Last year, even with the US$2.8 billion Southdownacquisition, we reduced net debt by US$1 billion. We also took fulladvantage of the unexpectedly rapid decline in interest rates to reduceour weighted-average cost of capital, which translates into a significantenhancement in shareholder value.
Underlying the numbers is a corporate philosophy that enables us todeliver results even in the most uncertain and dynamic macroeconomicenvironments. As you read this annual report, our philosophy will becomeclear: a relentless drive to do things better, dedication to serving ourcustomers’ needs, and a disciplined, strategy-driven focus. You will seehow we work with our customers to enable their businesses to grow;partner with our suppliers and offer them the advantages of doingbusiness with a growing, global corporation; empower our employeesby giving them the tools needed to succeed in a diverse, internationalmarketplace; and embrace an unwavering commitment to socialresponsibility.
It requires effort, dedication and discipline on our part, because this philosophy meansnothing less than a continuous drive for transformation. We must remain flexible so thatwe are responsive to new opportunities and new challenges, and we must foster a culturethat embraces constant change.
01009998979695949392
Sales EBITDA
3.8
3.4
2.6
2.1
2.9
2.2
4.3
4.8
5.6
6.9
2.3
2.0
1.8
1.5
1.2
1.1
0.8
0.70
.9
0.7
Sales & EBITDABILLIONS OF US DOLLARS
CEMEX’s growing sales and EBITDAunderscore the performance of thecompany’s business model.
5
6
Our distinctive approach – the CEMEX Way – is a culmination of nearly acentury of experience and underscores our dramatic evolution from aMexican-based company to one of the largest global enterprises in ourindustry. The fact that our business was well-grounded in the CEMEX Wayprior to our international expansion in the early 1990s gives us a key edgeover competitors who have since had to overcome institutional inertia andthe complexity of unifying far-flung operations and information systems.The CEMEX Way, rooted in expertise developed through the years, reflectsour core values of openness and flexibility.
At CEMEX, we have always worked to transform knowledge into profits. Werecognize that a successful global organization – especially in today’sincreasingly connected economy – needs to standardize as many processesas possible not just to manage costs, but also to realize the synergies ofworldwide operations. Hence, our network of multinational teams of processspecialists and experienced managers is systematically mapping, catalogingand disseminating our best corporate practices throughout the organization.
This means we wholeheartedly embrace information technology as a tool totransform CEMEX into an even stronger, more profitable company. We harnessthe power of technology and the Internet to improve and simplify our globaloperations, share best practices, streamline business processes, focus oncore business activities and, of course, to get closer to our customers. Whenused in this way, information technology is capable of making us smarter,more competitive, and more efficient – reaching more customers with betterservices and superior solutions for their building needs.
While technology is an important tool, it is in the hands of our highly talentedpeople that this tool comes to life. Our employees are passionate about theirwork. One of our key priorities is to create the space for innovation, allowingour people to focus their energy on the new instead of the usual. Our peoplemake us a single global company, but at the same time, one which is attunedto local needs; a company intensely focused on customer satisfaction andbetter able to deliver innovative, customer-specific services.
From tangible outcomes like better expense control and more efficient capitalallocation, to greater alignment with strategic objectives, our distinctiveapproach is enabling us to grow more profitably while furthering our commit-ment to service excellence. Furthermore, we are constantly transforming ourbusiness to incorporate local innovations and superior business practices.Through strategic initiatives like Construrama in Mexico and 24-hour self-service in Spain, we are strengthening our distribution platform and deliveringour wholesale customers what they need, where they need it, and whenthey need it most.
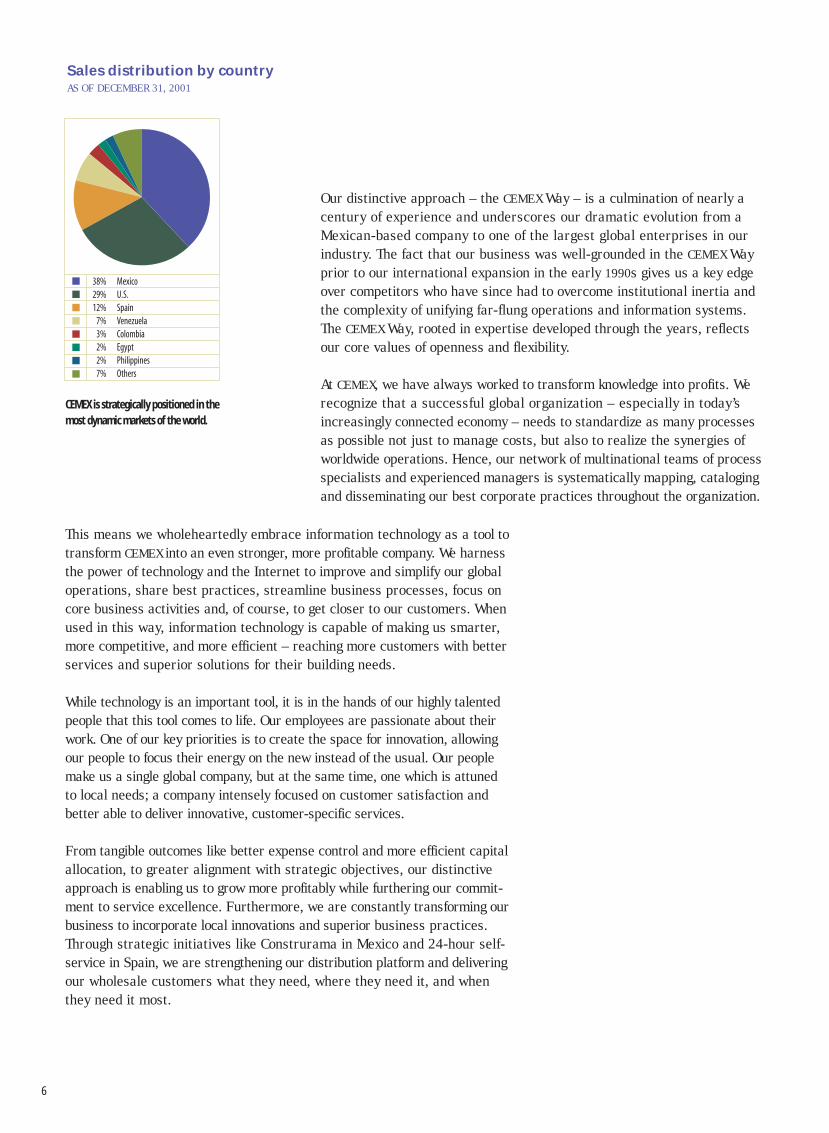
38%29%12%
7%3%2%2%7%
Mexico U.S. Spain VenezuelaColombia Egypt Philippines Others
Sales distribution by countryAS OF DECEMBER 31, 2001
CEMEX is strategically positioned in themost dynamic markets of the world.
7
The integration of Southdown with CEMEX USA last year is the most recentexample of how we profitably manage growth while transforming our busi-ness and dramatically expanding our customer base. The transaction wasnot only immediately accretive to cash earnings and free cash flow, but italso created the leading marketer of cement and cement products in theworld’s second-largest cement market, U.S.-based CEMEX Inc. Moreover, theintegration of Southdown into our global network took a record four months,an impressive feat by any measure.
Ultimately, our goal is to grow profitably; no other kind of growth is sus-tainable. Thus, we will remain an industry consolidator because we believethis will produce value in both the long- and short-term. We do not believe,however, in consolidation for its own sake – our growth is tempered by adisciplined approach to new opportunities.
As a result, today we are strategically positioned around the globe: in theAmericas, Europe, Asia, and Africa. Our markets constitute a valuable port-folio based on the characteristics of their demographics, customer base,construction trends, and per capita cement consumption, translating intoa higher return for you. We are operating profitably and using our globaltrading activity to supplement our manufacturing base, extend our reach,and better balance supply and demand.
01009998979695949392
38
3
14
9
(31
)
25
7
17
(20
6)
55
9
86
0
88
6
1,1
45
Free cash flowMILLIONS OF US DOLLARS
CEMEX’s free cash flow is among thehighest in the industry.
On a somber note, last year we mourned the passing of one of our company’sleading corporate statesmen, Marcelo Zambrano Hellion. Mr. ZambranoHellion played an important role in CEMEX’s development and growth, as amember of our Board of Directors since 1957, Chairman from 1979 to 1995,and Honorary Chairman from 1995. We will miss his strength of characterand his unwavering enthusiasm for our company and its prospects.
In closing, on behalf of the more than 25,500 people across CEMEX, I wish toexpress our heartfelt sympathy and support to all those who were affectedby the tragic events of 2001. Though it is difficult to fully fathom the magnitudeof September 11, the heroic efforts of the men and women who rose to thechallenges of that day have only increased our resolve and determinationto rise to new heights ourselves. Working together, we know we can builda much brighter future for us all.
Sincerely,
Lorenzo H. Zambrano | Chairman of the Board and Chief Executive Officer

8
“… we work with our customers …”
5:51 AM. Toledo, SpainSpain’s growing construction industry is creating demandfor reliable 24-hour self-service, which CEMEX is uniquelypositioned to meet. We initially offered this convenientand cost-effective service at two of our Spanish factories,but demand was so great that we expanded it to a thirdplant in 2001. Now, customers no longer have to spendvaluable time waiting in lines, and have the ability toaccess the products they need around the clock.
At CEMEX, we know that marketing cement has more to do withcredibility than with the art of selling. From top quality cement toa complete package of products and services, CEMEX is deliveringon its promise to fulfill existing customers’ needs, while at the sametime reaching new clientele through innovative channels.

9
A primary goal of the CEMEX Way is to offer our clients improved ser-vice, more efficient distribution, simplified business transactions, and24/7 access to real-time account information. Our electronic storefronts,live in Spain, Venezuela, Mexico and Colombia, enable clients to placeorders and purchase CEMEX products online, as well as to track theiraccount status and access an array of value-added services. We builtthis system to adapt to local needs and specific customer require-ments; thus, we can continue to develop our online presence – andengender brand loyalty – across key markets.
“From account balances to newproducts and services, CEMEX’selectronic storefront gives meaccess to the information I need,when I need it. It also offers metools to better manage my busi-ness, including online support.”
Fabio FigueroaCEMEX customer
Medellin, Colombia

10
“… to enable their businesses to grow…”
9:34 AM. Monterrey, MexicoIn most of the markets where we do business, we reach ourfinal consumers via distributors. To enable our Mexican dis-tributors to compete more effectively, we started a programin 2001 through which we share a common bond and brand:Construrama. We provide certified Construrama distributorsa full range of high-volume wholesale cementing and otherconstruction products, as well as the support – accounting,IT, inventory management, marketing and sales – theyrequire to thrive. In return, member distributors make acommitment to deliver an increasingly higher standard ofservice to their customers, providing an important compet-itive advantage for us all. Through initiatives like Constru-rama, we are responding to our distributors’ distinct businessneeds: offering them the tools they require to grow and, inthe process, bolstering our core commercial network.
11
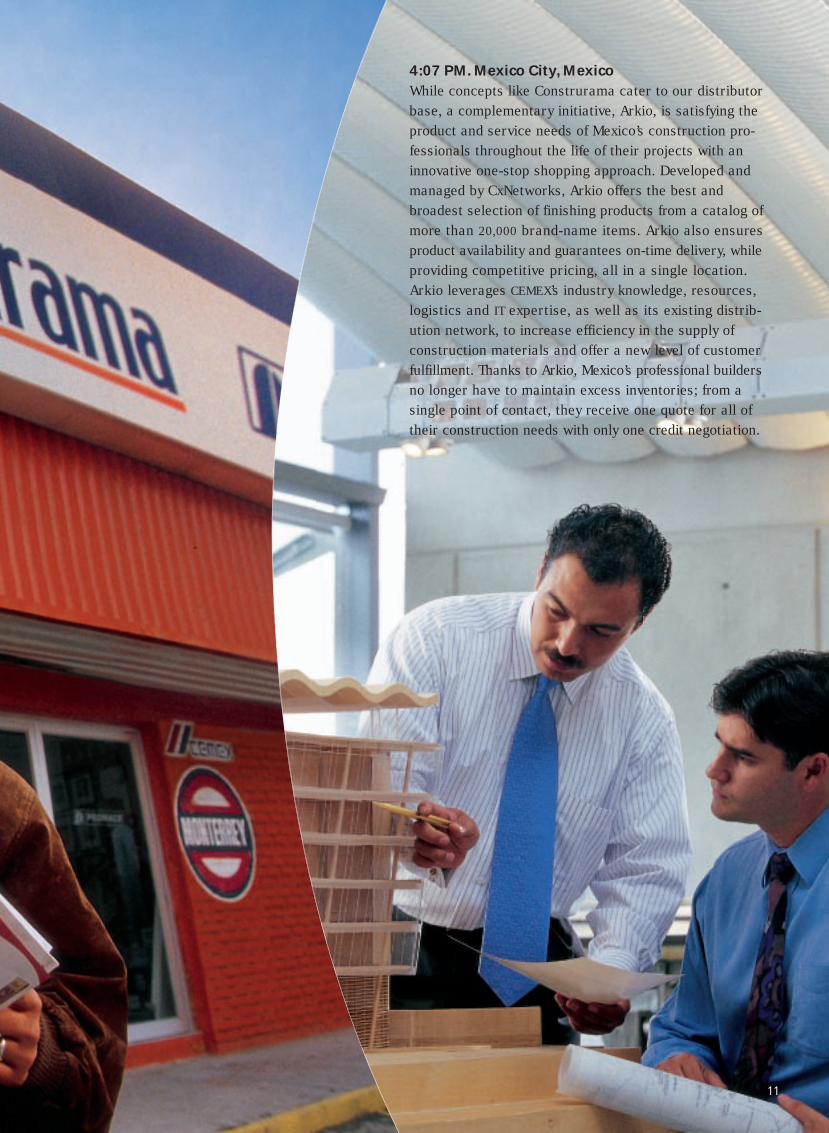
4:07 PM. Mexico City, MexicoWhile concepts like Construrama cater to our distributorbase, a complementary initiative, Arkio, is satisfying theproduct and service needs of Mexico’s construction pro-fessionals throughout the life of their projects with aninnovative one-stop shopping approach. Developed andmanaged by CxNetworks, Arkio offers the best andbroadest selection of finishing products from a catalog ofmore than 20,000 brand-name items. Arkio also ensuresproduct availability and guarantees on-time delivery, whileproviding competitive pricing, all in a single location.Arkio leverages CEMEX’s industry knowledge, resources,logistics and IT expertise, as well as its existing distrib-ution network, to increase efficiency in the supply ofconstruction materials and offer a new level of customerfulfillment. Thanks to Arkio, Mexico’s professional buildersno longer have to maintain excess inventories; from asingle point of contact, they receive one quote for all oftheir construction needs with only one credit negotiation.

12
One of our defined CEMEX Way initiatives - electronicprocurement – is now a reality in our major SouthAmerican, Caribbean and Mexican operations. Tosimplify and smooth the transition to a new onlineenvironment, we created an “e-culturization expo” to educate our worldwide suppliers and employeesabout the benefits of electronic procurement. For oursuppliers, working online offers improved coordina-tion and better response time. Our employees areable to purchase necessary supplies and materialsonline quickly and efficiently. Thus far, we haveconsolidated our global purchasing into four inter-national negotiation centers, saving US$9 millionthrough economies of scale.
13
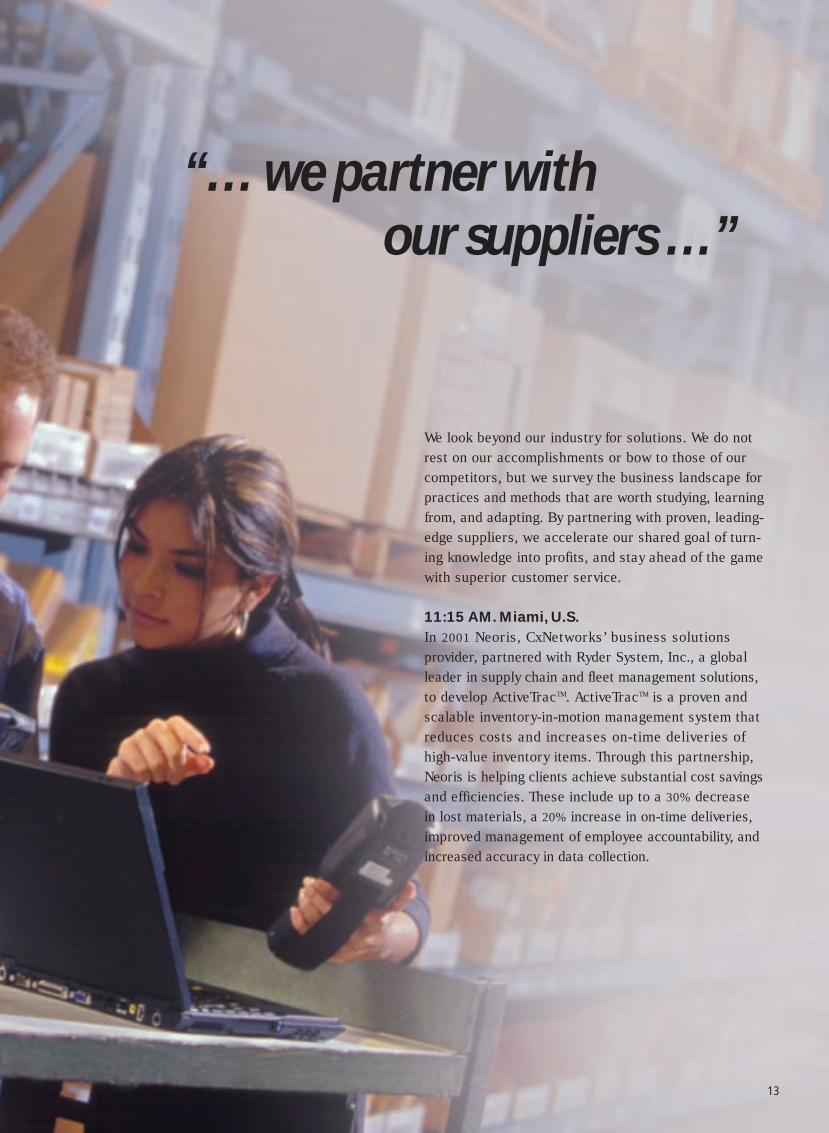
“… we partner withour suppliers …”
We look beyond our industry for solutions. We do notrest on our accomplishments or bow to those of ourcompetitors, but we survey the business landscape forpractices and methods that are worth studying, learningfrom, and adapting. By partnering with proven, leading-edge suppliers, we accelerate our shared goal of turn-ing knowledge into profits, and stay ahead of the gamewith superior customer service.
11:15 AM. Miami, U.S.In 2001 Neoris, CxNetworks’ business solutionsprovider, partnered with Ryder System, Inc., a globalleader in supply chain and fleet management solutions,to develop ActiveTracTM. ActiveTracTM is a proven andscalable inventory-in-motion management system thatreduces costs and increases on-time deliveries ofhigh-value inventory items. Through this partnership,Neoris is helping clients achieve substantial cost savingsand efficiencies. These include up to a 30% decreasein lost materials, a 20% increase in on-time deliveries,improved management of employee accountability, andincreased accuracy in data collection.
14
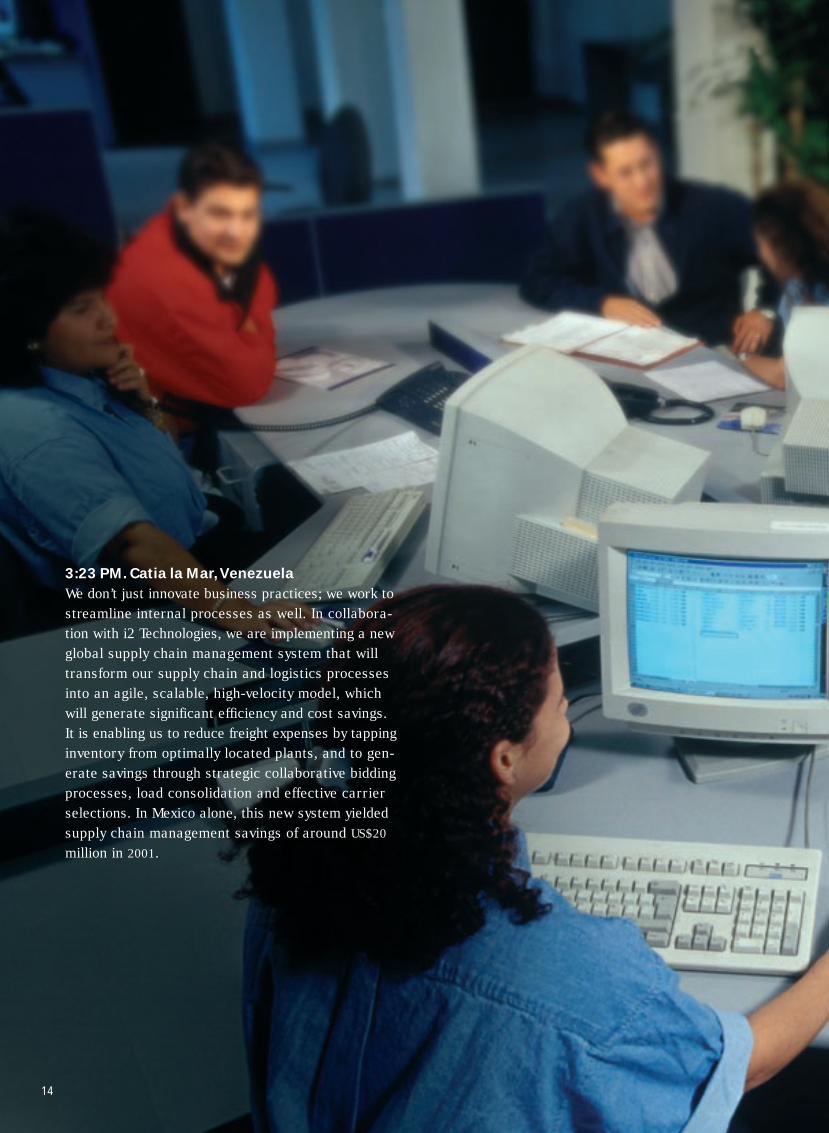
3:23 PM. Catia la Mar, VenezuelaWe don’t just innovate business practices; we work tostreamline internal processes as well. In collabora-tion with i2 Technologies, we are implementing a newglobal supply chain management system that willtransform our supply chain and logistics processesinto an agile, scalable, high-velocity model, whichwill generate significant efficiency and cost savings.It is enabling us to reduce freight expenses by tappinginventory from optimally located plants, and to gen-erate savings through strategic collaborative biddingprocesses, load consolidation and effective carrierselections. In Mexico alone, this new system yieldedsupply chain management savings of around US$20
million in 2001.
15
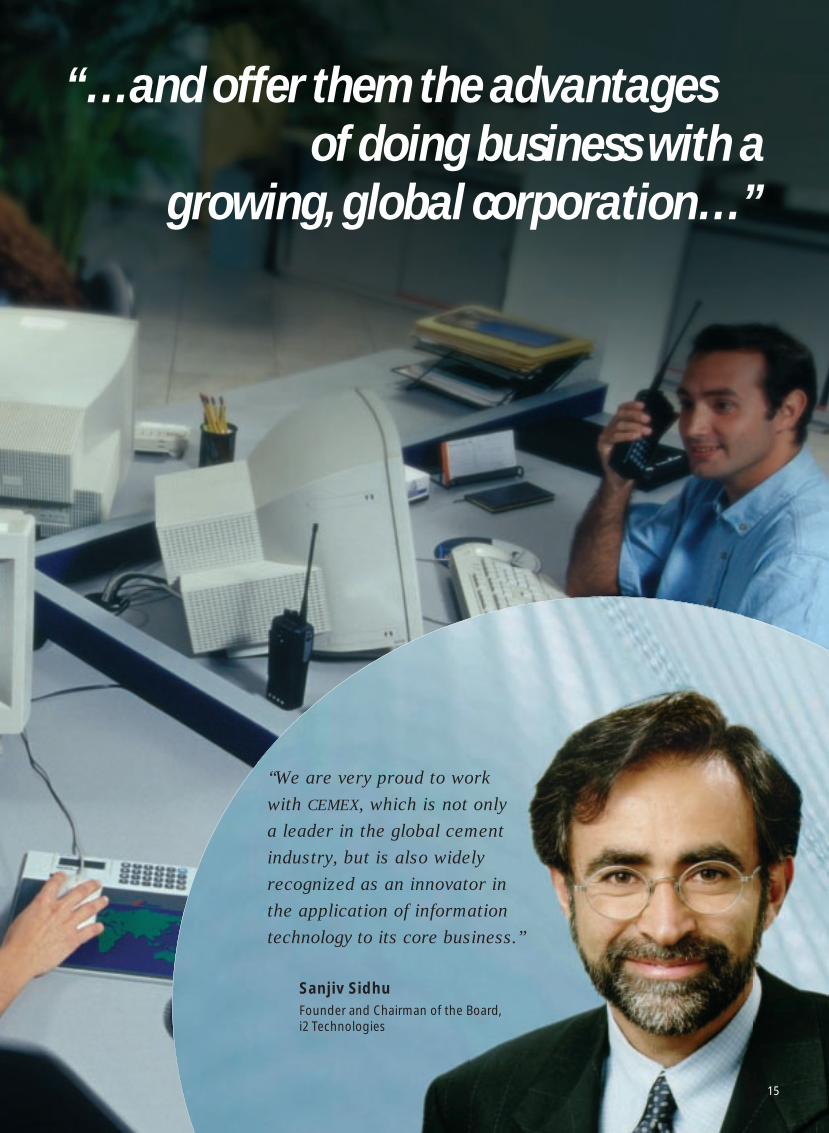
“…and offer them the advantages of doing business with a
growing, global corporation…”
“We are very proud to workwith CEMEX, which is not only a leader in the global cementindustry, but is also widelyrecognized as an innovator inthe application of informationtechnology to its core business.”
Sanjiv SidhuFounder and Chairman of the Board,i2 Technologies
16
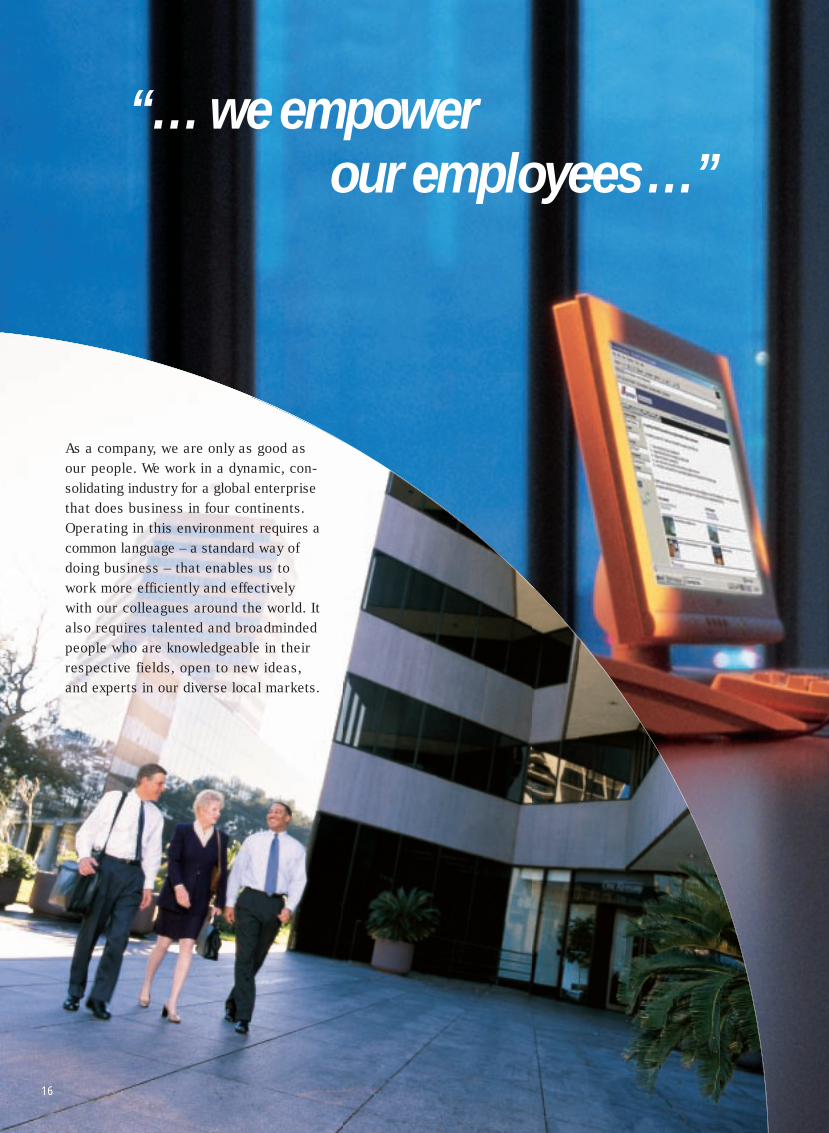
As a company, we are only as good asour people. We work in a dynamic, con-solidating industry for a global enterprisethat does business in four continents.Operating in this environment requires acommon language – a standard way ofdoing business – that enables us towork more efficiently and effectivelywith our colleagues around the world. Italso requires talented and broadmindedpeople who are knowledgeable in theirrespective fields, open to new ideas,and experts in our diverse local markets.
“… we empower our employees …”

17
6:37 PM. SingaporeOur people have always formed the foundation for the CEMEX Way.Through standardized models, practices and knowledge that we share,develop and disseminate, we continuously improve the way we do busi-ness, freeing our people to innovate and spend more time on their cus-tomers' and their own professional development. In 2001, for example,we initiated the deployment of our Internet-based e-learning initiativethat will enable employees to get the training they require whereverand whenever they need it, through the CEMEX employee portal. At akeystroke, they will have the ability to receive cross-functional instruc-tion in areas such as customer service, finance and project management.As employees utilize e-learning to improve their skills and competen-cies, they are able to increase their contribution to business resultsand take on greater responsibilities within CEMEX.
18
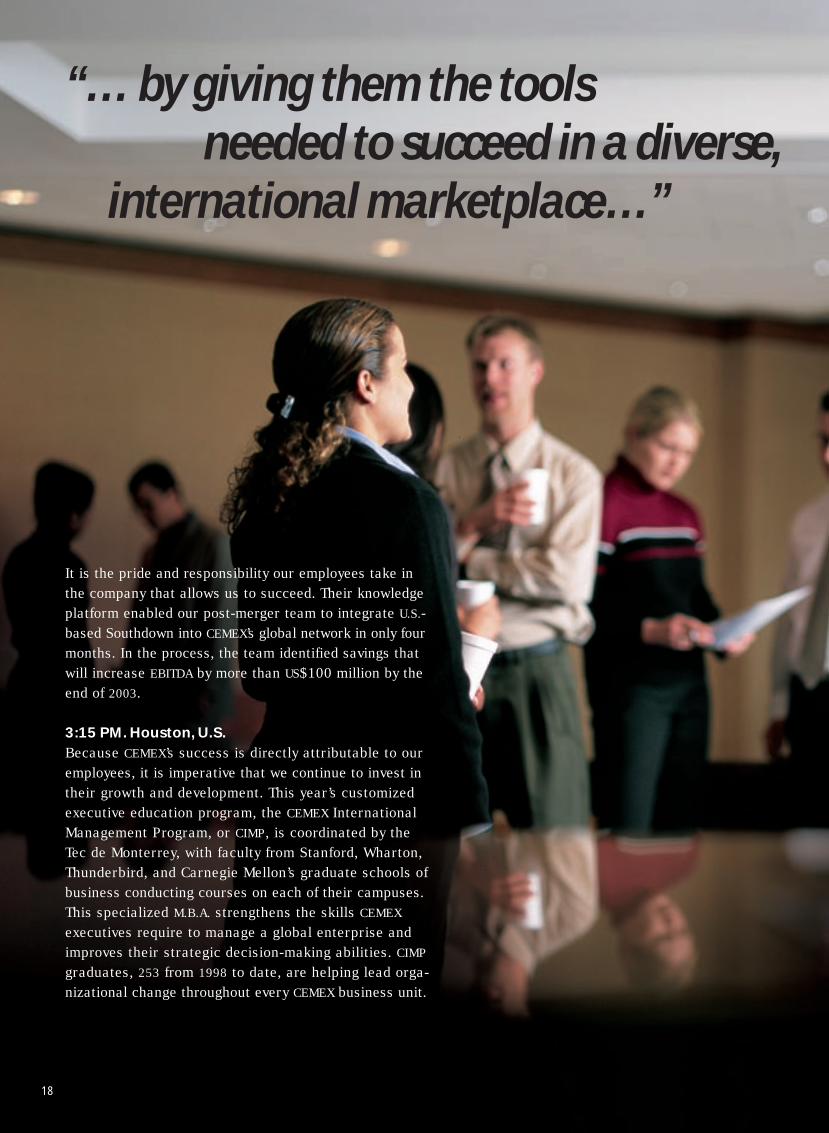
“… by giving them the toolsneeded to succeed in a diverse,
international marketplace…”
It is the pride and responsibility our employees take inthe company that allows us to succeed. Their knowledgeplatform enabled our post-merger team to integrate U.S.-based Southdown into CEMEX’s global network in only fourmonths. In the process, the team identified savings thatwill increase EBITDA by more than US$100 million by theend of 2003.
3:15 PM. Houston, U.S.Because CEMEX’s success is directly attributable to ouremployees, it is imperative that we continue to invest intheir growth and development. This year’s customizedexecutive education program, the CEMEX InternationalManagement Program, or CIMP, is coordinated by theTec de Monterrey, with faculty from Stanford, Wharton,Thunderbird, and Carnegie Mellon’s graduate schools ofbusiness conducting courses on each of their campuses.This specialized M.B.A. strengthens the skills CEMEX
executives require to manage a global enterprise andimproves their strategic decision-making abilities. CIMP
graduates, 253 from 1998 to date, are helping lead orga-nizational change throughout every CEMEX business unit.
19
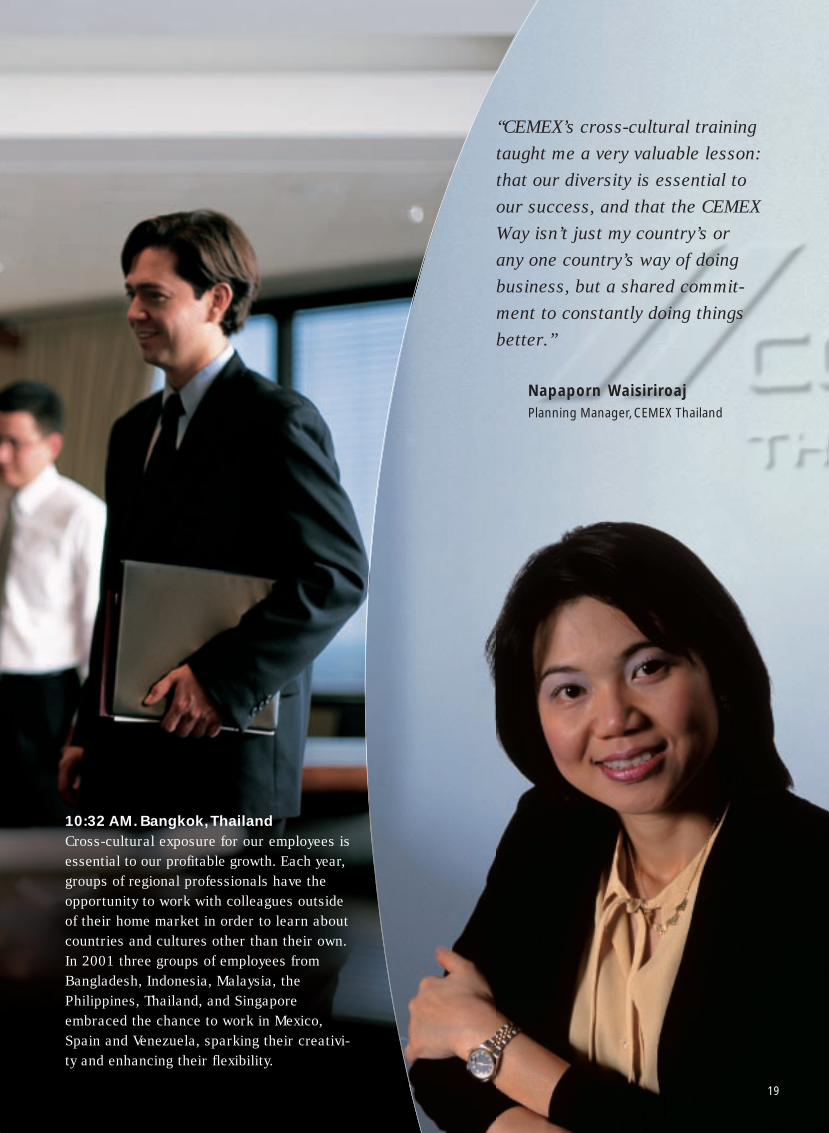
10:32 AM. Bangkok, ThailandCross-cultural exposure for our employees isessential to our profitable growth. Each year,groups of regional professionals have theopportunity to work with colleagues outsideof their home market in order to learn aboutcountries and cultures other than their own.In 2001 three groups of employees fromBangladesh, Indonesia, Malaysia, thePhilippines, Thailand, and Singaporeembraced the chance to work in Mexico,Spain and Venezuela, sparking their creativi-ty and enhancing their flexibility.
“CEMEX’s cross-cultural trainingtaught me a very valuable lesson:that our diversity is essential toour success, and that the CEMEXWay isn’t just my country’s or any one country’s way of doingbusiness, but a shared commit-ment to constantly doing thingsbetter.”
Napaporn WaisiriroajPlanning Manager, CEMEX Thailand

20
12:47 PM. Guadalajara, MexicoIn 2001 we helped to make the dream of homeownership a reality for 13,000 Mexican families.Our Patrimonio Hoy program organizes low-income families into self-financing cells that pro-mote housing construction. Participating familiesentrust us to take care of and manage their savingsuntil they are ready to start home building. Then,we not only provide them with the products theyneed, but we also offer them technical assistance– including an architect who helps design theirhouses with an eye to future growth – so they canoptimize space and reduce waste of buildingmaterials. As a result, we help families expeditethe typical home-building cycle from four years toonly one year.

21
“… we embrace an unwavering commitment …”
2:29 PM. Pertigalete,VenezuelaOur community outreach extendsthroughout CEMEX’s global organi-zation. For example, last year wedonated kindergarten furniture to1,000 handicapped and orphanedchildren in Egypt. And in Venezuela,CEMEX built, donated and continuesto support the Casa Hogar Sonrisa,a nonprofit center for children withcancer.
Our dedication to social and environmental responsibility is anintegral part of our business philosophy. From state-of-the-artenvironmental, health and safety practices at our global networkof plants, to medical and dental care for our neighboring com-munities in the Philippines, to scholarships for children in CostaRica, we look to contribute to the well-being of our people andour communities. By joining forces with others, we show thepositive impact that a holistic approach can play in the futureof our society.

22
6:32 PM. Ibague, ColombiaWe are committed to operating our facilities with the utmost respectfor the communities and the environment in which we all live andwork. This year, the World Environmental Center awarded CEMEX theEighteenth Annual WEC Gold Medal for International CorporateEnvironmental Achievement. Awarded by an independent jury of dis-tinguished international environmental experts, the WEC Gold Medalrecognizes a corporation that demonstrates preeminent industryleadership and contribution to worldwide environmental quality. Thejury based its award on our comprehensive environmental policy,implementation and leadership, which under the aegis “In Harmonywith Nature” has demonstrated an array of achievements. The WECGold Medal represents an incentive and a responsibility: to redoubleour efforts to achieve truly sustainable growth, the essential balancebetween profitability and social responsibility.
“All of CEMEX’s accomplishmentstaken together have set a stan-dard for the cement industry andfor industry in general, and willserve as a seminal example forresponsible growth and sustain-able development worldwide.”
The World Environmental Center

23
In partnership with IUCN-The World Conservation Union, the largest internationalconservation network, and Agrupacion Sierra Madre, a Mexican nature organization,we recently produced a compelling new tool to draw attention to the extinction ofthreatened species. The Red Book: The Extinction Crisis Face to Face combinesawe-inspiring imagery with a rigorous scientific approach in order to raise the public’sawareness of the spectacular and important species our Earth is rapidly losing. Moreimportantly, The Red Book – the latest in a series of ecological books that CEMEXhas helped to produce – is a call to action for industry, governments, educators, andthe general public to work together in order to preserve biological diversity.
“… to social responsibility.”
24
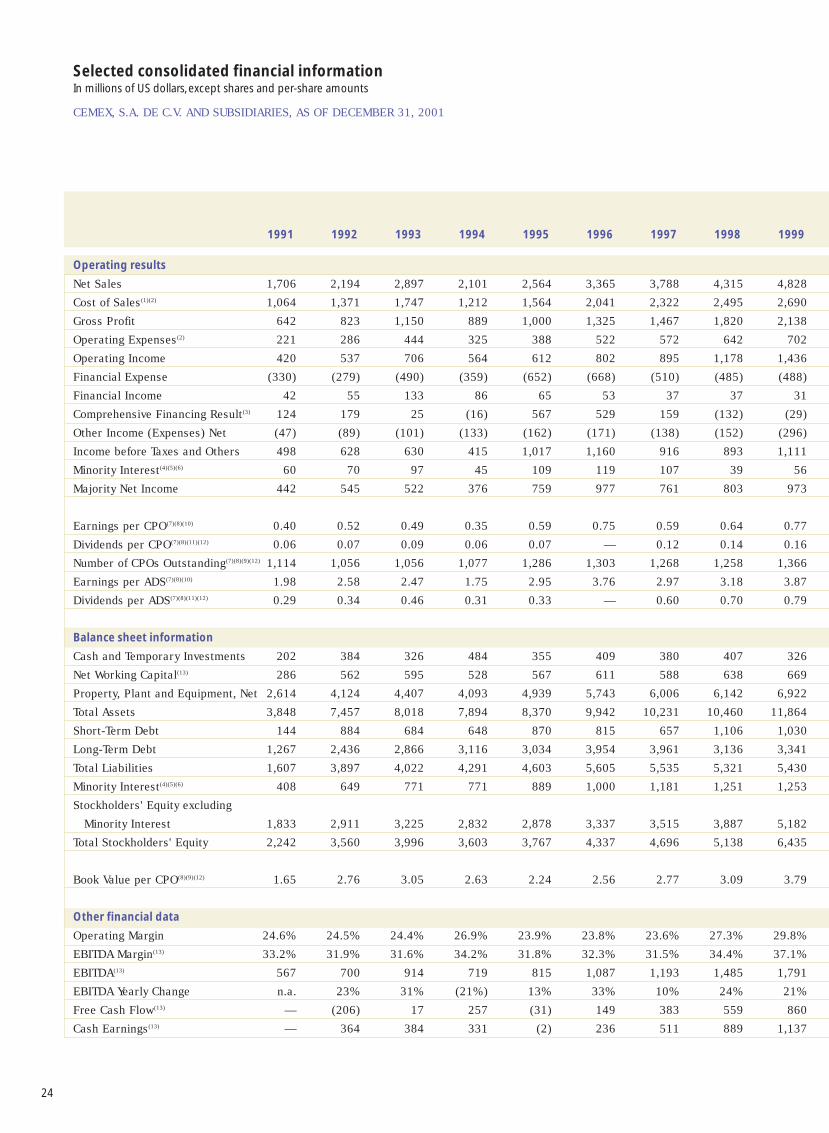
Selected consolidated financial informationIn millions of US dollars, except shares and per-share amounts
CEMEX, S.A. DE C.V. AND SUBSIDIARIES, AS OF DECEMBER 31, 2001
1991 1992 1993 1994 1995 1996 1997 1998 1999
Operating results
Net Sales 1,706 2,194 2,897 2,101 2,564 3,365 3,788 4,315 4,828
Cost of Sales(1)(2) 1,064 1,371 1,747 1,212 1,564 2,041 2,322 2,495 2,690
Gross Profit 642 823 1,150 889 1,000 1,325 1,467 1,820 2,138
Operating Expenses(2) 221 286 444 325 388 522 572 642 702
Operating Income 420 537 706 564 612 802 895 1,178 1,436
Financial Expense (330) (279) (490) (359) (652) (668) (510) (485) (488)
Financial Income 42 55 133 86 65 53 37 37 31
Comprehensive Financing Result(3) 124 179 25 (16) 567 529 159 (132) (29)
Other Income (Expenses) Net (47) (89) (101) (133) (162) (171) (138) (152) (296)
Income before Taxes and Others 498 628 630 415 1,017 1,160 916 893 1,111
Minority Interest(4)(5)(6) 60 70 97 45 109 119 107 39 56
Majority Net Income 442 545 522 376 759 977 761 803 973
Earnings per CPO(7)(8)(10) 0.40 0.52 0.49 0.35 0.59 0.75 0.59 0.64 0.77
Dividends per CPO(7)(8)(11)(12) 0.06 0.07 0.09 0.06 0.07 — 0.12 0.14 0.16
Number of CPOs Outstanding(7)(8)(9)(12) 1,114 1,056 1,056 1,077 1,286 1,303 1,268 1,258 1,366
Earnings per ADS(7)(8)(10) 1.98 2.58 2.47 1.75 2.95 3.76 2.97 3.18 3.87
Dividends per ADS(7)(8)(11)(12) 0.29 0.34 0.46 0.31 0.33 — 0.60 0.70 0.79
Balance sheet information
Cash and Temporary Investments 202 384 326 484 355 409 380 407 326
Net Working Capital(13) 286 562 595 528 567 611 588 638 669
Property, Plant and Equipment, Net 2,614 4,124 4,407 4,093 4,939 5,743 6,006 6,142 6,922
Total Assets 3,848 7,457 8,018 7,894 8,370 9,942 10,231 10,460 11,864
Short-Term Debt 144 884 684 648 870 815 657 1,106 1,030
Long-Term Debt 1,267 2,436 2,866 3,116 3,034 3,954 3,961 3,136 3,341
Total Liabilities 1,607 3,897 4,022 4,291 4,603 5,605 5,535 5,321 5,430
Minority Interest(4)(5)(6) 408 649 771 771 889 1,000 1,181 1,251 1,253
Stockholders' Equity excluding
Minority Interest 1,833 2,911 3,225 2,832 2,878 3,337 3,515 3,887 5,182
Total Stockholders' Equity 2,242 3,560 3,996 3,603 3,767 4,337 4,696 5,138 6,435
Book Value per CPO(8)(9)(12) 1.65 2.76 3.05 2.63 2.24 2.56 2.77 3.09 3.79
Other financial data
Operating Margin 24.6% 24.5% 24.4% 26.9% 23.9% 23.8% 23.6% 27.3% 29.8%
EBITDA Margin(13) 33.2% 31.9% 31.6% 34.2% 31.8% 32.3% 31.5% 34.4% 37.1%
EBITDA(13) 567 700 914 719 815 1,087 1,193 1,485 1,791
EBITDA Yearly Change n.a. 23% 31% (21%) 13% 33% 10% 24% 21%
Free Cash Flow(13) — (206) 17 257 (31) 149 383 559 860
Cash Earnings(13) — 364 384 331 (2) 236 511 889 1,137
25
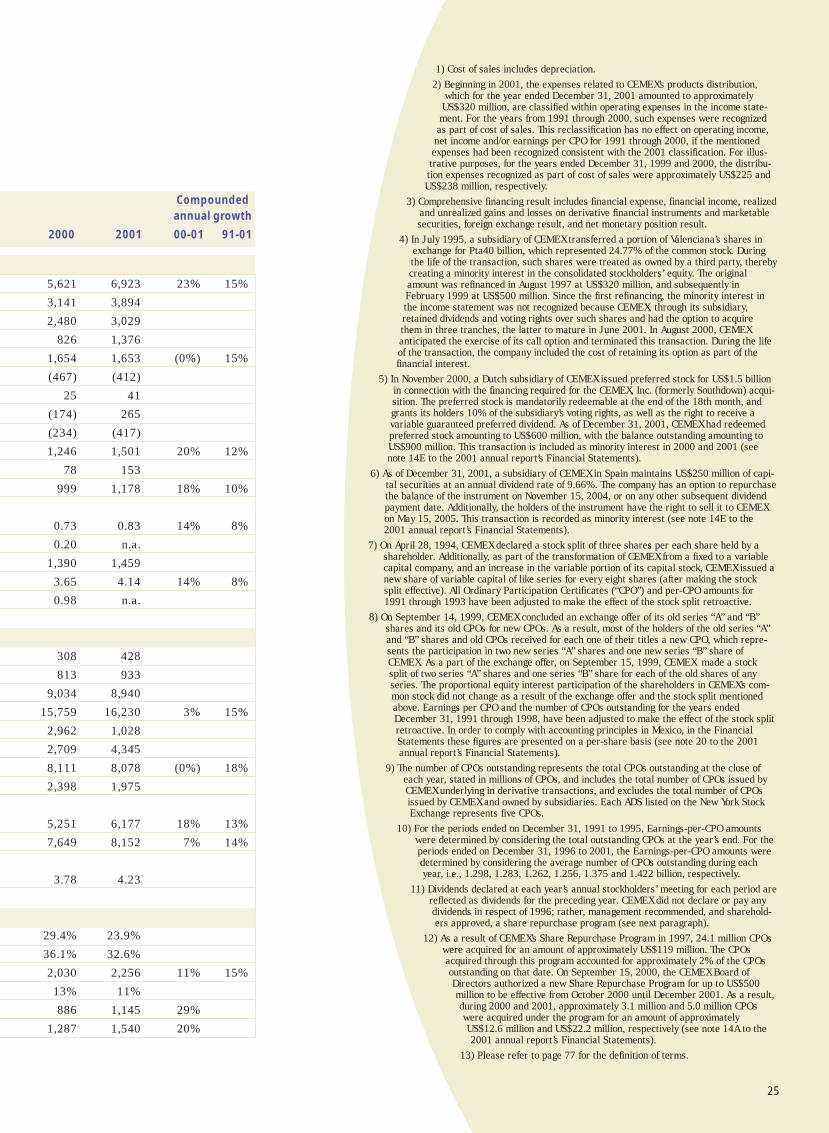
1) Cost of sales includes depreciation.
2) Beginning in 2001, the expenses related to CEMEX’s products distribution,which for the year ended December 31, 2001 amounted to approximatelyUS$320 million, are classified within operating expenses in the income state-ment. For the years from 1991 through 2000, such expenses were recognizedas part of cost of sales. This reclassification has no effect on operating income,net income and/or earnings per CPO for 1991 through 2000, if the mentionedexpenses had been recognized consistent with the 2001 classification. For illus-trative purposes, for the years ended December 31, 1999 and 2000, the distribu-tion expenses recognized as part of cost of sales were approximately US$225 andUS$238 million, respectively.
3) Comprehensive financing result includes financial expense, financial income, realizedand unrealized gains and losses on derivative financial instruments and marketablesecurities, foreign exchange result, and net monetary position result.
4) In July 1995, a subsidiary of CEMEX transferred a portion of Valenciana’s shares inexchange for Pta40 billion, which represented 24.77% of the common stock. Duringthe life of the transaction, such shares were treated as owned by a third party, therebycreating a minority interest in the consolidated stockholders’ equity. The originalamount was refinanced in August 1997 at US$320 million, and subsequently inFebruary 1999 at US$500 million. Since the first refinancing, the minority interest inthe income statement was not recognized because CEMEX, through its subsidiary,retained dividends and voting rights over such shares and had the option to acquirethem in three tranches, the latter to mature in June 2001. In August 2000, CEMEXanticipated the exercise of its call option and terminated this transaction. During the lifeof the transaction, the company included the cost of retaining its option as part of thefinancial interest.
5) In November 2000, a Dutch subsidiary of CEMEX issued preferred stock for US$1.5 billionin connection with the financing required for the CEMEX, Inc. (formerly Southdown) acqui-sition. The preferred stock is mandatorily redeemable at the end of the 18th month, andgrants its holders 10% of the subsidiary’s voting rights, as well as the right to receive avariable guaranteed preferred dividend. As of December 31, 2001, CEMEX had redeemedpreferred stock amounting to US$600 million, with the balance outstanding amounting toUS$900 million. This transaction is included as minority interest in 2000 and 2001 (seenote 14E to the 2001 annual report’s Financial Statements).
6) As of December 31, 2001, a subsidiary of CEMEX in Spain maintains US$250 million of capi-tal securities at an annual dividend rate of 9.66%. The company has an option to repurchasethe balance of the instrument on November 15, 2004, or on any other subsequent dividendpayment date. Additionally, the holders of the instrument have the right to sell it to CEMEXon May 15, 2005. This transaction is recorded as minority interest (see note 14E to the2001 annual report’s Financial Statements).
7) On April 28, 1994, CEMEX declared a stock split of three shares per each share held by ashareholder. Additionally, as part of the transformation of CEMEX from a fixed to a variablecapital company, and an increase in the variable portion of its capital stock, CEMEX issued anew share of variable capital of like series for every eight shares (after making the stocksplit effective). All Ordinary Participation Certificates (“CPO”) and per-CPO amounts for1991 through 1993 have been adjusted to make the effect of the stock split retroactive.
8) On September 14, 1999, CEMEX concluded an exchange offer of its old series “A” and “B”shares and its old CPOs for new CPOs. As a result, most of the holders of the old series “A”and “B” shares and old CPOs received for each one of their titles a new CPO, which repre-sents the participation in two new series “A” shares and one new series “B” share ofCEMEX. As a part of the exchange offer, on September 15, 1999, CEMEX made a stocksplit of two series “A” shares and one series “B” share for each of the old shares of anyseries. The proportional equity interest participation of the shareholders in CEMEX’s com-mon stock did not change as a result of the exchange offer and the stock split mentionedabove. Earnings per CPO and the number of CPOs outstanding for the years endedDecember 31, 1991 through 1998, have been adjusted to make the effect of the stock splitretroactive. In order to comply with accounting principles in Mexico, in the FinancialStatements these figures are presented on a per-share basis (see note 20 to the 2001annual report’s Financial Statements).
9) The number of CPOs outstanding represents the total CPOs outstanding at the close ofeach year, stated in millions of CPOs, and includes the total number of CPOs issued byCEMEX underlying in derivative transactions, and excludes the total number of CPOsissued by CEMEX and owned by subsidiaries. Each ADS listed on the New York StockExchange represents five CPOs.
10) For the periods ended on December 31, 1991 to 1995, Earnings-per-CPO amountswere determined by considering the total outstanding CPOs at the year’s end. For theperiods ended on December 31, 1996 to 2001, the Earnings-per-CPO amounts weredetermined by considering the average number of CPOs outstanding during eachyear, i.e., 1.298, 1.283, 1.262, 1.256, 1.375 and 1.422 billion, respectively.
11) Dividends declared at each year’s annual stockholders’ meeting for each period arereflected as dividends for the preceding year. CEMEX did not declare or pay anydividends in respect of 1996; rather, management recommended, and sharehold-ers approved, a share repurchase program (see next paragraph).
12) As a result of CEMEX’s Share Repurchase Program in 1997, 24.1 million CPOswere acquired for an amount of approximately US$119 million. The CPOsacquired through this program accounted for approximately 2% of the CPOsoutstanding on that date. On September 15, 2000, the CEMEX Board ofDirectors authorized a new Share Repurchase Program for up to US$500million to be effective from October 2000 until December 2001. As a result,during 2000 and 2001, approximately 3.1 million and 5.0 million CPOswere acquired under the program for an amount of approximatelyUS$12.6 million and US$22.2 million, respectively (see note 14A to the2001 annual report’s Financial Statements).
13) Please refer to page 77 for the definition of terms.
Compounded annual growth
2000 2001 00-01 91-01
5,621 6,923 23% 15%
3,141 3,894
2,480 3,029
826 1,376
1,654 1,653 (0%) 15%
(467) (412)
25 41
(174) 265
(234) (417)
1,246 1,501 20% 12%
78 153
999 1,178 18% 10%
0.73 0.83 14% 8%
0.20 n.a.
1,390 1,459
3.65 4.14 14% 8%
0.98 n.a.
308 428
813 933
9,034 8,940
15,759 16,230 3% 15%
2,962 1,028
2,709 4,345
8,111 8,078 (0%) 18%
2,398 1,975
5,251 6,177 18% 13%
7,649 8,152 7% 14%
3.78 4.23
29.4% 23.9%
36.1% 32.6%
2,030 2,256 11% 15%
13% 11%
886 1,145 29%
1,287 1,540 20%
26
“… a compelling value propositionis founded upon results …”
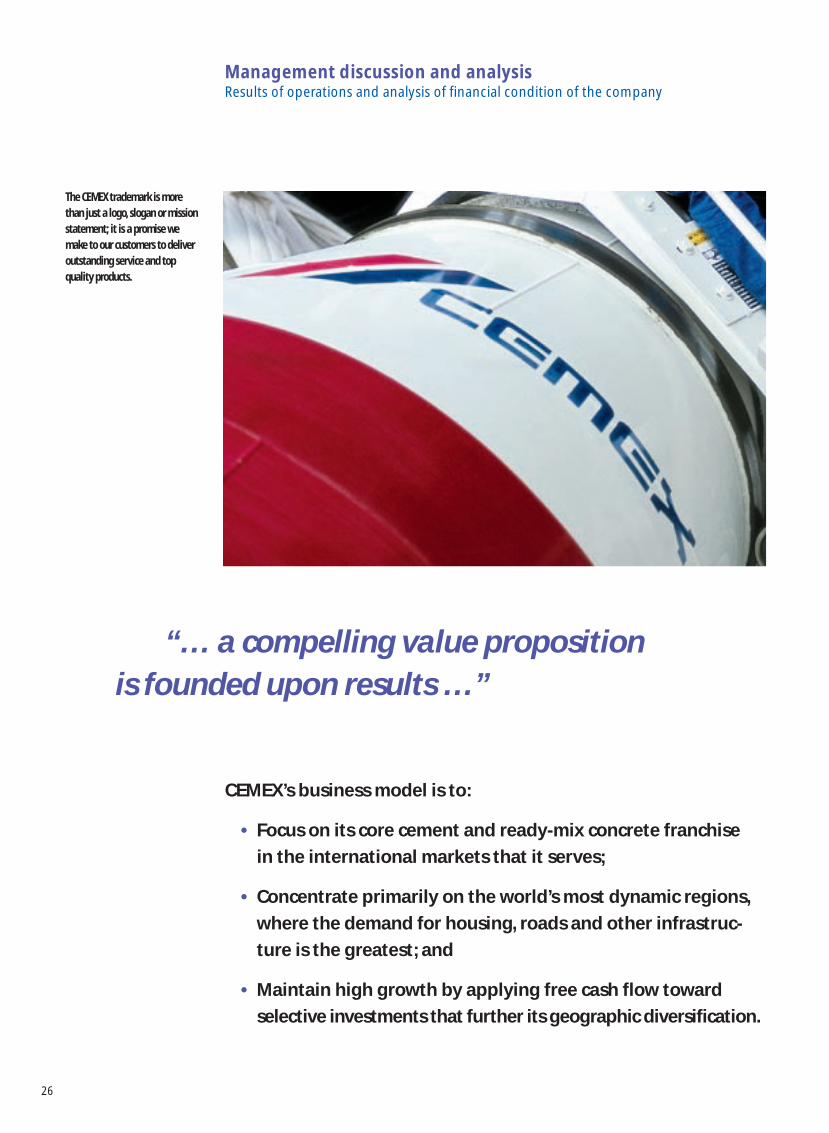
Management discussion and analysisResults of operations and analysis of financial condition of the company
The CEMEX trademark is morethan just a logo, slogan or missionstatement; it is a promise wemake to our customers to deliveroutstanding service and topquality products.
CEMEX’s business model is to:
• Focus on its core cement and ready-mix concrete franchise
in the international markets that it serves;
• Concentrate primarily on the world’s most dynamic regions,
where the demand for housing, roads and other infrastruc-
ture is the greatest; and
• Maintain high growth by applying free cash flow toward
selective investments that further its geographic diversification.
27
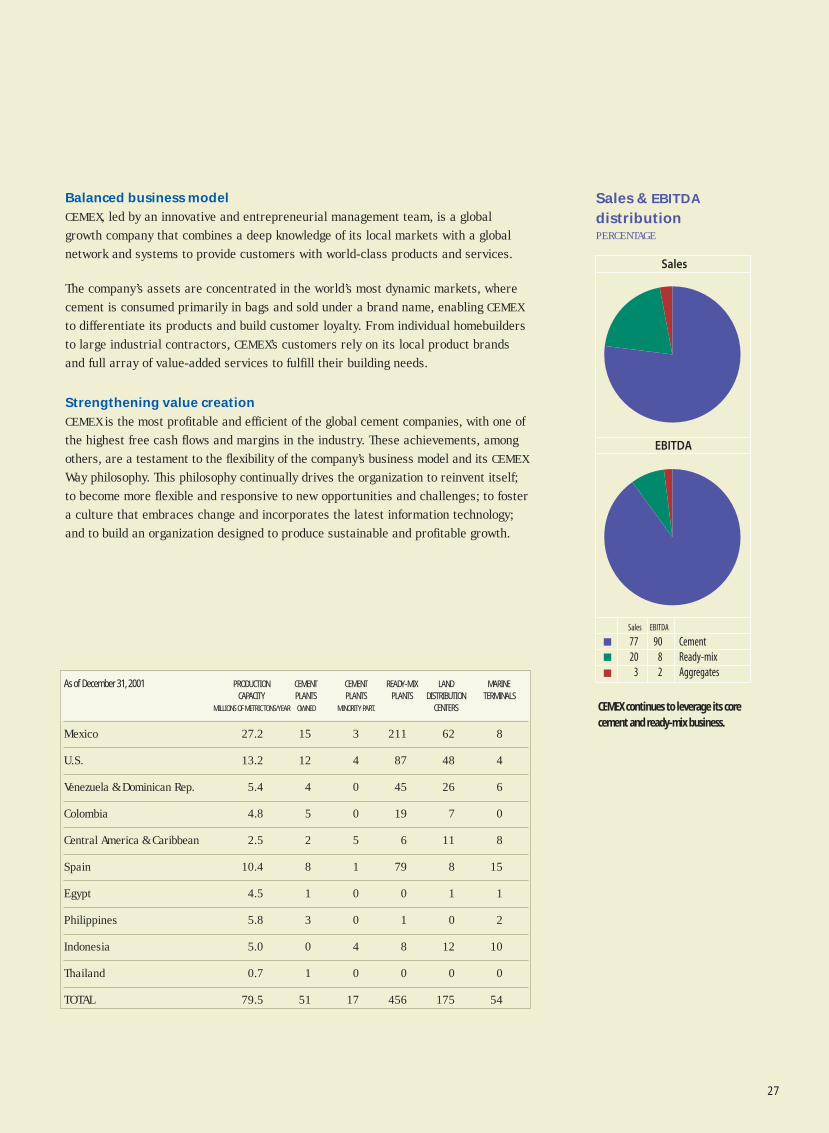
Balanced business model
CEMEX, led by an innovative and entrepreneurial management team, is a globalgrowth company that combines a deep knowledge of its local markets with a globalnetwork and systems to provide customers with world-class products and services.
The company’s assets are concentrated in the world’s most dynamic markets, wherecement is consumed primarily in bags and sold under a brand name, enabling CEMEX
to differentiate its products and build customer loyalty. From individual homebuildersto large industrial contractors, CEMEX’s customers rely on its local product brandsand full array of value-added services to fulfill their building needs.
Strengthening value creation
CEMEX is the most profitable and efficient of the global cement companies, with one ofthe highest free cash flows and margins in the industry. These achievements, amongothers, are a testament to the flexibility of the company’s business model and its CEMEX
Way philosophy. This philosophy continually drives the organization to reinvent itself;to become more flexible and responsive to new opportunities and challenges; to fostera culture that embraces change and incorporates the latest information technology;and to build an organization designed to produce sustainable and profitable growth.
As of December 31, 2001 PRODUCTION CEMENT CEMENT READY-MIX LAND MARINECAPACITY PLANTS PLANTS PLANTS DISTRIBUTION TERMINALS
MILLIONS OF METRIC TONS/YEAR OWNED MINORITY PART. CENTERS
Mexico 27.2 15 3 211 62 8
U.S. 13.2 12 4 87 48 4
Venezuela & Dominican Rep. 5.4 4 0 45 26 6
Colombia 4.8 5 0 19 7 0
Central America & Caribbean 2.5 2 5 6 11 8
Spain 10.4 8 1 79 8 15
Egypt 4.5 1 0 0 1 1
Philippines 5.8 3 0 1 0 2
Indonesia 5.0 0 4 8 12 10
Thailand 0.7 1 0 0 0 0
TOTAL 79.5 51 17 456 175 54
EBITDA
Sales
CementReady-mixAggregates
Sales EBITDA
9082
7720
3
Sales & EBITDA
distributionPERCENTAGE
CEMEX continues to leverage its corecement and ready-mix business.
28
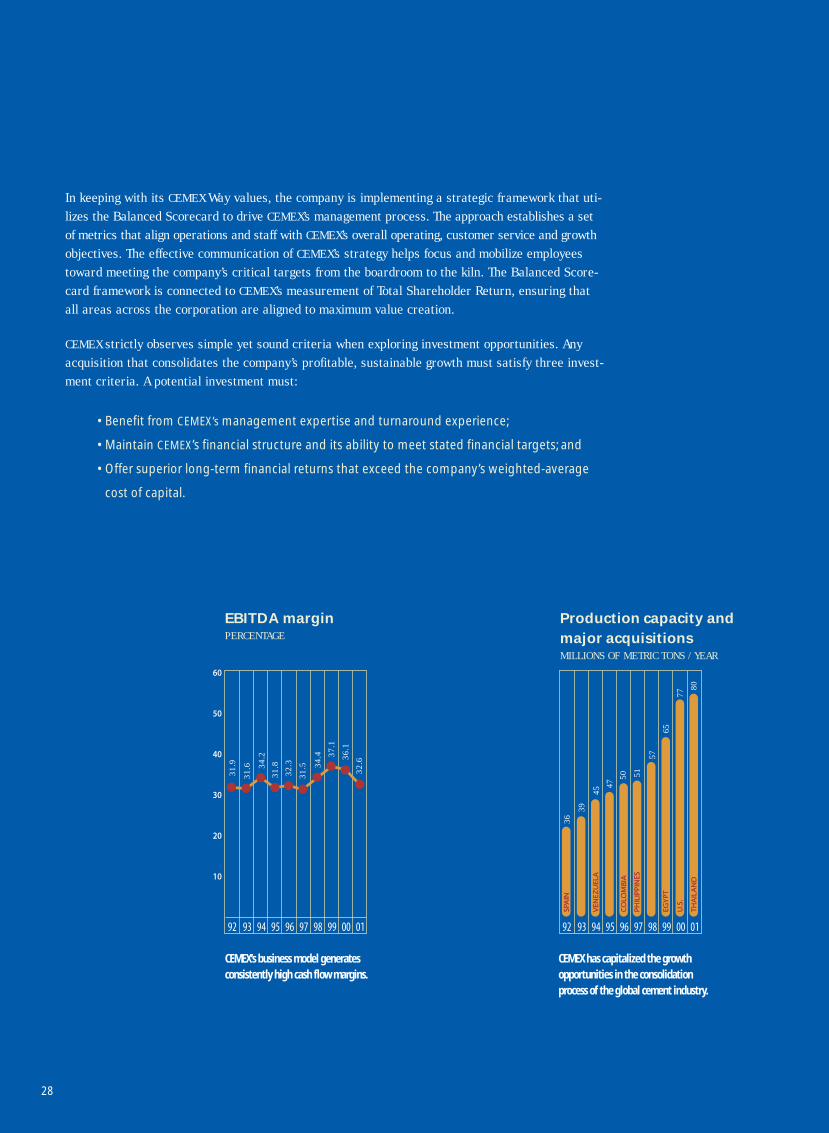
In keeping with its CEMEX Way values, the company is implementing a strategic framework that uti-lizes the Balanced Scorecard to drive CEMEX’s management process. The approach establishes a setof metrics that align operations and staff with CEMEX’s overall operating, customer service and growthobjectives. The effective communication of CEMEX’s strategy helps focus and mobilize employeestoward meeting the company’s critical targets from the boardroom to the kiln. The Balanced Score-card framework is connected to CEMEX’s measurement of Total Shareholder Return, ensuring thatall areas across the corporation are aligned to maximum value creation.
CEMEX strictly observes simple yet sound criteria when exploring investment opportunities. Anyacquisition that consolidates the company’s profitable, sustainable growth must satisfy three invest-ment criteria. A potential investment must:
• Benefit from CEMEX’s management expertise and turnaround experience;
• Maintain CEMEX’s financial structure and its ability to meet stated financial targets; and
• Offer superior long-term financial returns that exceed the company’s weighted-average
cost of capital.
01009998979695949392
10
20
30
40
50
60
31.5
32.3
31.834
.2
31.6
31.9 34
.4 37.1
36.1
32.6
EBITDA marginPERCENTAGE
CEMEX’s business model generatesconsistently high cash flow margins.
01009998979695949392
5150
47
45
39
36
57
65
77
80
SPA
INSP
AIN
VEN
EZU
ELA
VEN
EZU
ELA
CO
LOM
BIA
CO
LOM
BIA
PH
ILIP
PIN
ESP
HIL
IPP
INES
EGY
PT
EGY
PT
U.S
.U
.S.
TH
AIL
AN
DT
HA
ILA
ND
Production capacity andmajor acquisitionsMILLIONS OF METRIC TONS / YEAR
CEMEX has capitalized the growthopportunities in the consolidationprocess of the global cement industry.
29
Increasing financial flexibility
In 2001 CEMEX’s strong free cash flow generation capacity enabled the company toimprove its credit ratings, further strengthen its balance sheet, and facilitateaccess to low-cost capital. For the year, net debt reductions totaled more thanUS$1.0 billion, consistent with an investment-grade capital structure. Additionally,CEMEX extended its debt maturity profile by refinancing over US$2.5 billion ofshort-term obligations arising from the Southdown acquisition in late 2000.
Specifically, the company increased the percentage of long-term debt from 48% oftotal indebtedness at year-end 2000, to 81% at the close of 2001. CEMEX’s goal isto maintain its debt maturity profile commensurate with free cash flow generatingcapacity, diversifying its investor base and sources of capital.
The low interest rate environment and the company’s faster-than-expected debtreduction enabled CEMEX to reduce net interest expense and exceed its year-endinterest coverage target, reaching a level of 4.4 times for the 12 months endingDecember 2001. CEMEX also stayed within its stated net debt-to-EBITDA ratio of2.7 times, down from 3.0 times in year 2000.
Looking forward, CEMEX’s free cash flow and cash earnings are expected to growat a healthy rate for 2002. Lower net debt, financial expenses and capital expen-ditures, as compared to 2001, should help to achieve this growth. CEMEX expectsto use its free cash flow for accretive acquisitions that will add to the company’snatural growth or for reducing net debt.
01009998979695949392
4.0
2.4
4.6
1.7
5.3
1.3
5.1
2.0
3.9
1.9
4.3
2.6
3.1
3.0
2.7
3.6
3.0
4.1
2.7
4.4
Financial leverageInterest coverage
Interest coverage & financial leverageTIMES
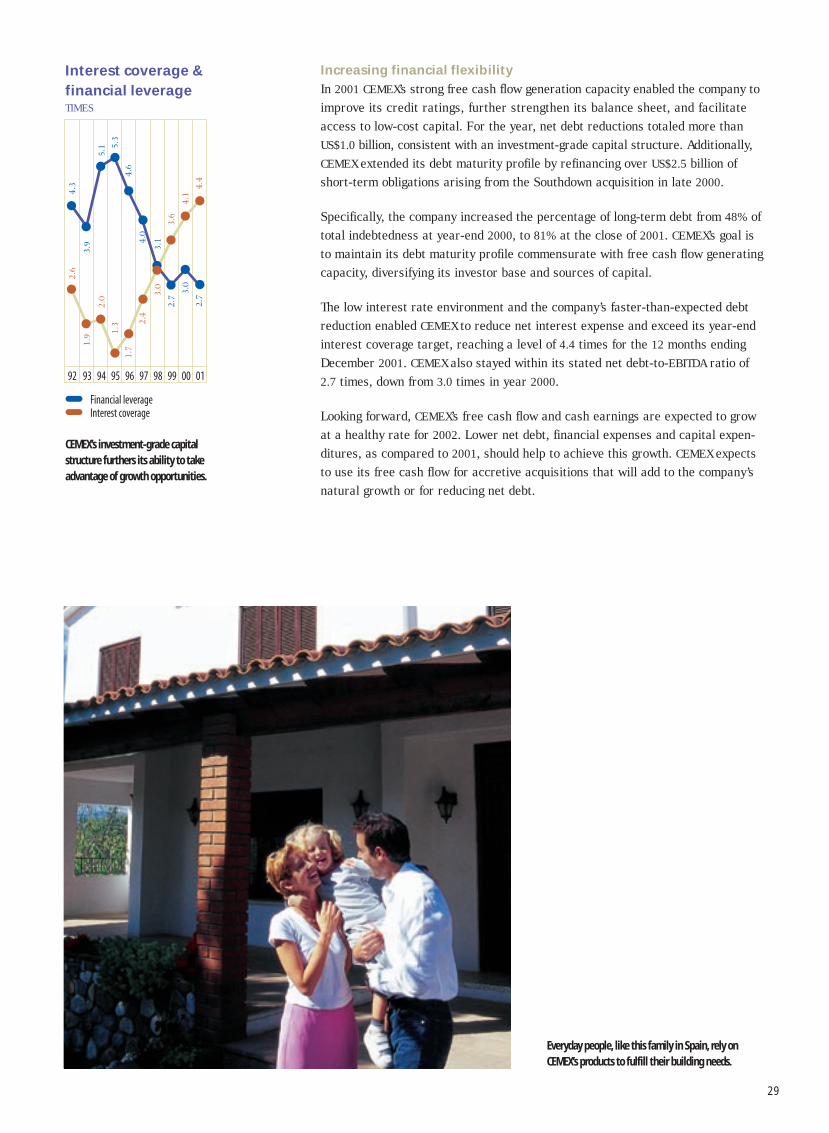
CEMEX’s investment-grade capital structure furthers its ability to takeadvantage of growth opportunities.
Everyday people, like this family in Spain, rely onCEMEX’s products to fulfill their building needs.
30
Across four continents, customers candepend on CEMEX’s expertise to help thembuild their projects.
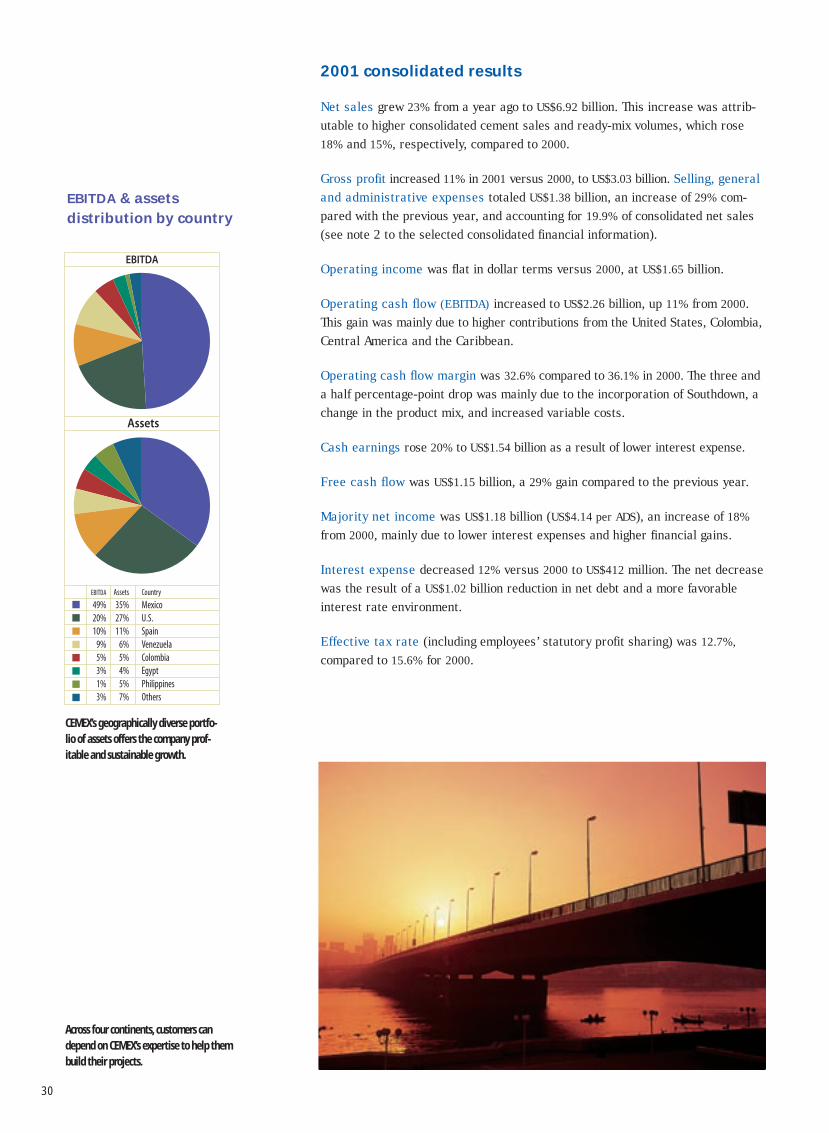
EBITDA
49%20%10%
9%5%3%1%3%
Assets
35%27%11%
6%5%4%5%7%
Country
Mexico U.S. Spain VenezuelaColombia Egypt Philippines Others
Assets
EBITDA
EBITDA & assetsdistribution by country
CEMEX’s geographically diverse portfo-lio of assets offers the company prof-itable and sustainable growth.
2001 consolidated results
Net sales grew 23% from a year ago to US$6.92 billion. This increase was attrib-utable to higher consolidated cement sales and ready-mix volumes, which rose18% and 15%, respectively, compared to 2000.
Gross profit increased 11% in 2001 versus 2000, to US$3.03 billion. Selling, generaland administrative expenses totaled US$1.38 billion, an increase of 29% com-pared with the previous year, and accounting for 19.9% of consolidated net sales(see note 2 to the selected consolidated financial information).
Operating income was flat in dollar terms versus 2000, at US$1.65 billion.
Operating cash flow (EBITDA) increased to US$2.26 billion, up 11% from 2000.This gain was mainly due to higher contributions from the United States, Colombia,Central America and the Caribbean.
Operating cash flow margin was 32.6% compared to 36.1% in 2000. The three anda half percentage-point drop was mainly due to the incorporation of Southdown, achange in the product mix, and increased variable costs.
Cash earnings rose 20% to US$1.54 billion as a result of lower interest expense.
Free cash flow was US$1.15 billion, a 29% gain compared to the previous year.
Majority net income was US$1.18 billion (US$4.14 per ADS), an increase of 18%
from 2000, mainly due to lower interest expenses and higher financial gains.
Interest expense decreased 12% versus 2000 to US$412 million. The net decreasewas the result of a US$1.02 billion reduction in net debt and a more favorableinterest rate environment.
Effective tax rate (including employees’ statutory profit sharing) was 12.7%,
compared to 15.6% for 2000.
31
“… we are strategically positioned around the globe: inthe Americas, Europe, Asia, and Africa. Our markets consti-tute a valuable portfolio based on the characteristics oftheir demographics, customer base, construction trends,and per capita cement consumption …”
Global review of operations
Sales EBITDA Assets2000 2001 % Change 2000 2001 % Change 2000 2001 % Change
Mexico 2,702 2,682 (1%) 1,285 1,234 (4%) 4,921 6,312 28%
U.S. 769 1,872 144% 166 500 201% 4,421 4,812 9%
Venezuela & Dominican Republic 664 624 (6%) 226 220 (2%) 1,361 1,444 6%
Colombia 206 216 5% 113 132 17% 790 846 7%
Central America & Caribbean 242 272 12% 53 70 31% 418 456 9%
Spain 850 848 (0%) 289 243 (16%) 2,047 1,949 (5%)
Egypt 162 133 (18%) 80 52 (35%) 637 836 31%
Philippines 137 151 10% 34 19 (42%) 768 795 4%
Others / eliminations (109) 125 n.a. (216) (214) n.a. 396 (1,220) n.a.
Consolidated 5,621 6,923 23% 2,030 2,256 11% 15,759 16,230 3%
Millions of US dollars.
Mexico
CEMEX’s domestic cement volume decreased 7% versus the year-earlier period.The formal and government sectors drove volumes lower with a double-digit con-traction; this was offset by a slight increase in self-construction sector activity,which was supported by higher real wages, but slowed by increasing unemployment.Private construction spending was weak due to the lack of credit. Restrained publicspending resulted from the government’s continued budgetary discipline, as well asthe delay and uncertainty surrounding the administration’s fiscal reform proposalto Congress.
In 2001 net sales were US$2.68 billion, a year-over-year decrease of 1% due toweaker demand. EBITDA declined to US$1.23 billion, a drop of 4% versus thepreceding year.
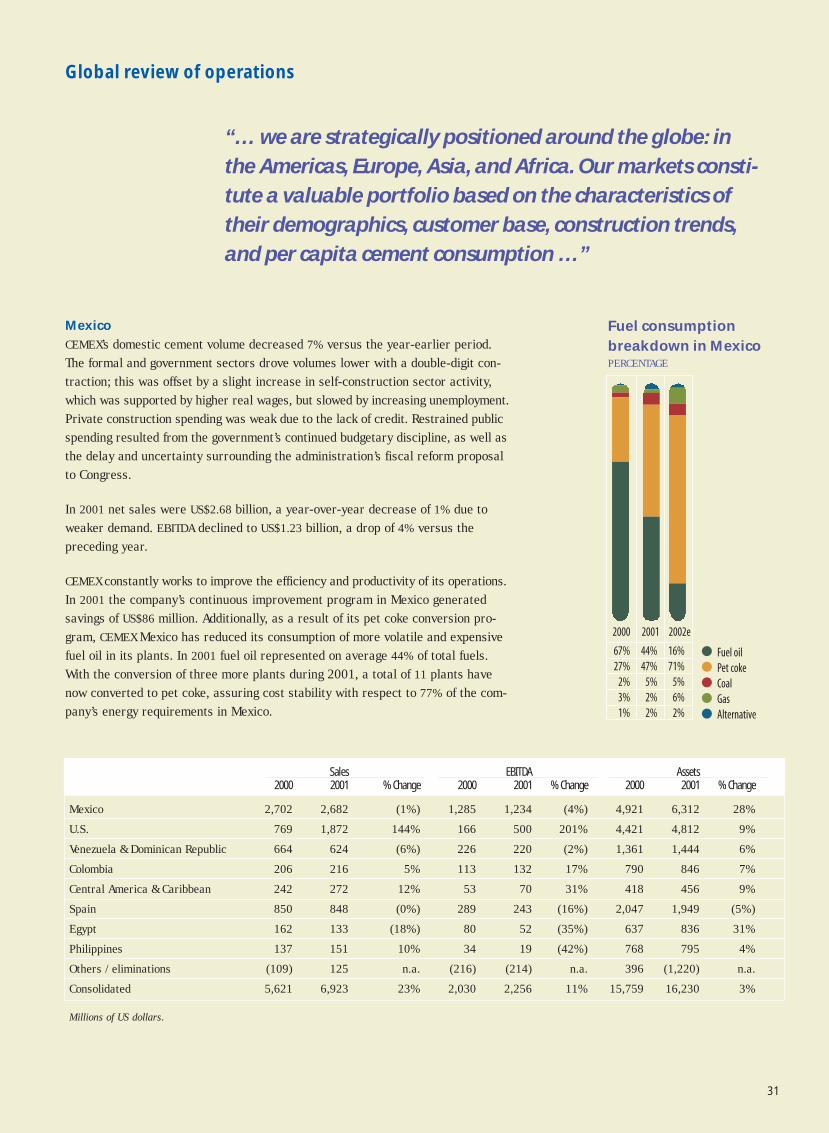
CEMEX constantly works to improve the efficiency and productivity of its operations.In 2001 the company’s continuous improvement program in Mexico generatedsavings of US$86 million. Additionally, as a result of its pet coke conversion pro-gram, CEMEX Mexico has reduced its consumption of more volatile and expensivefuel oil in its plants. In 2001 fuel oil represented on average 44% of total fuels.With the conversion of three more plants during 2001, a total of 11 plants havenow converted to pet coke, assuring cost stability with respect to 77% of the com-pany’s energy requirements in Mexico.
2002e20012000
Fuel oilPet cokeCoalGasAlternative
67%27%
2%3%1%
44%47%
5%2%2%
16%71%
5%6%2%
Fuel consumptionbreakdown in MexicoPERCENTAGE
32
During 2001, the company launched Construrama, a licensing system through whichCEMEX offers its main distributors the opportunity to participate in a nationwide,branded retailing network. Construrama has grown into the largest distributionchain of construction materials in Mexico, with more than 1,850 points of sale.CEMEX believes that this initiative has the potential to increase its distributors’sales significantly, help them share best practices, reduce their costs, and reapthe benefits of a strong national brand.
United States
CEMEX’s domestic U.S. cement sales volume increased 183% versus 2000, and 7%
on a like-to-like basis (had Southdown been consolidated for the full year of 2000).The public works sector, particularly highway construction, was the main driver ofdemand. The residential homebuilding sector remained relatively stable, whilecommercial construction declined. Ready-mix volumes increased 81% versus2000; however, on a like-to-like basis they declined 5%.
Net sales in 2001 were US$1.87 billion, an increase of 144% compared to 2000.EBITDA improved to US$500 million, a gain of 201% versus the preceding year. Ona like-to-like basis, net sales increased 8%, and EBITDA decreased 2% from theprevious year.
CEMEX completed the expansion of its Victorville cement plant, adding one millionmetric tons of production capacity in Southern California. This new capacity, whichwill reach full utilization during the first quarter of 2002, will translate into signif-icant cost savings. The expanded plant will satisfy customers’ demand in the U.S.and reduce the company’s imports into California and Arizona.
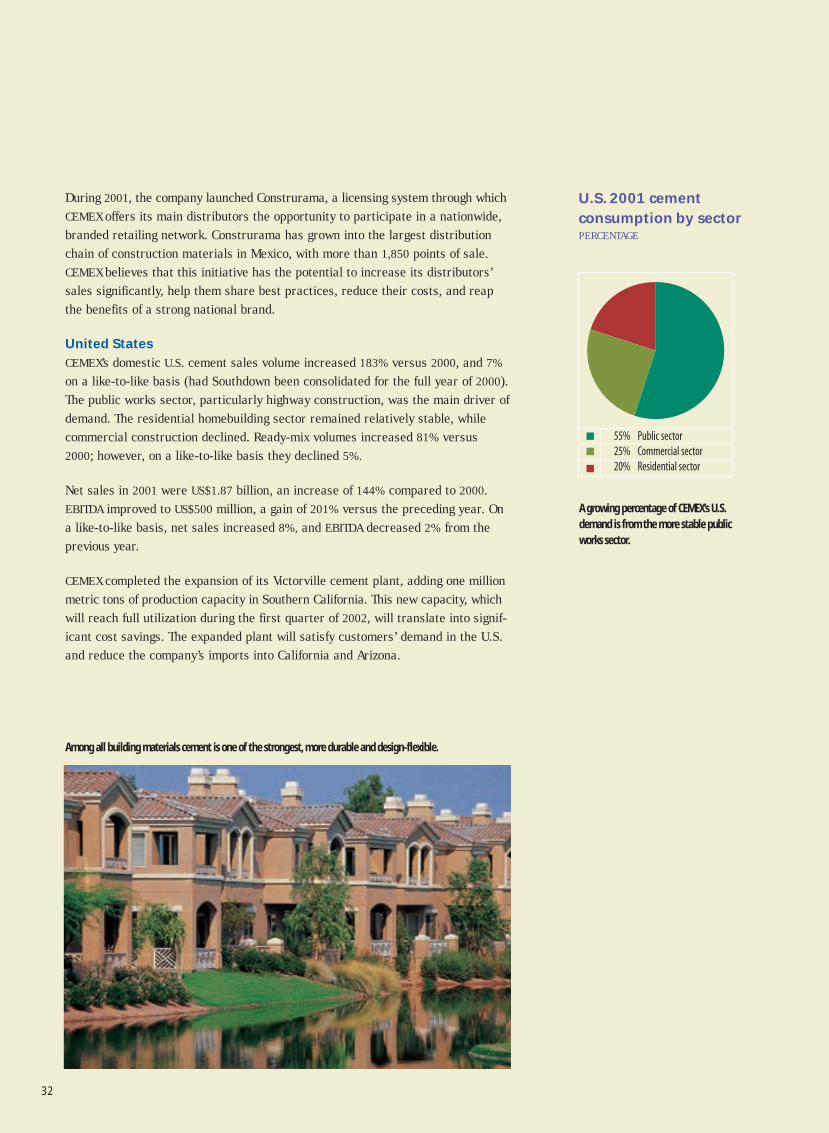
55% Public sector25% Commercial sector20% Residential sector
U.S. 2001 cementconsumption by sectorPERCENTAGE
A growing percentage of CEMEX’s U.S.demand is from the more stable publicworks sector.
Among all building materials cement is one of the strongest, more durable and design-flexible.
33
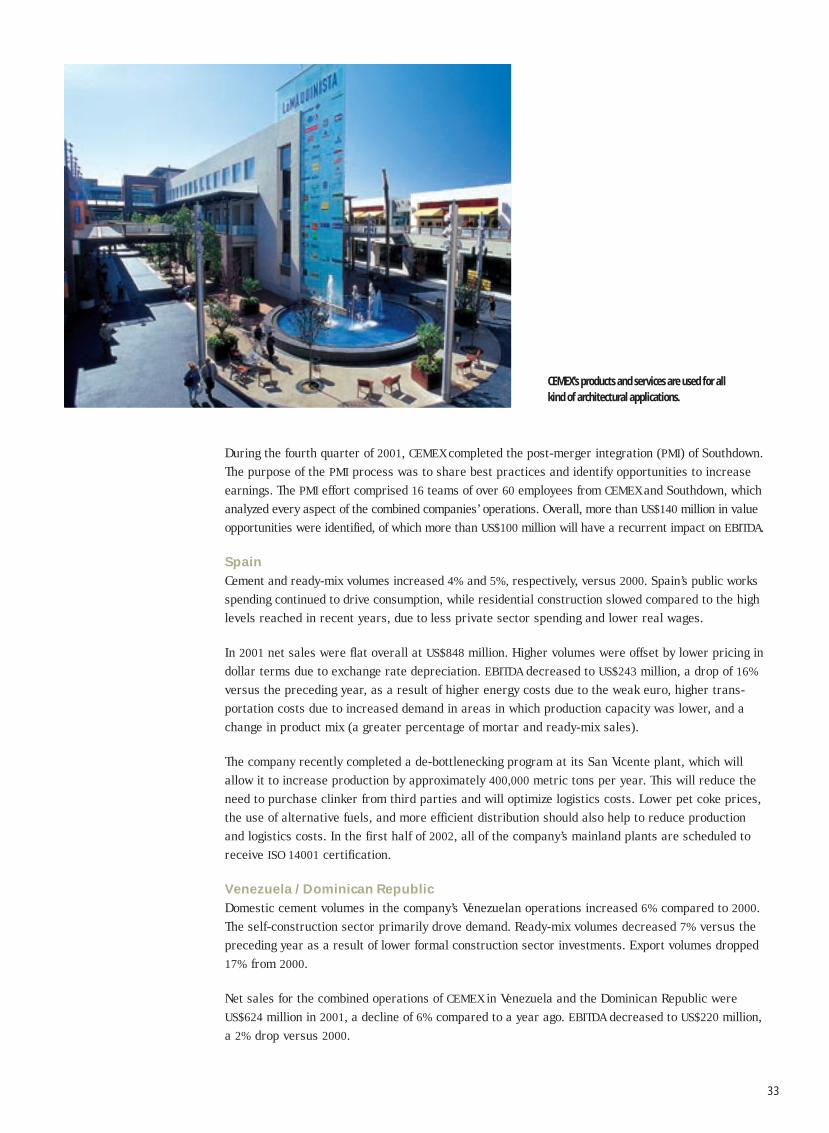
CEMEX’s products and services are used for allkind of architectural applications.
During the fourth quarter of 2001, CEMEX completed the post-merger integration (PMI) of Southdown.The purpose of the PMI process was to share best practices and identify opportunities to increaseearnings. The PMI effort comprised 16 teams of over 60 employees from CEMEX and Southdown, whichanalyzed every aspect of the combined companies’ operations. Overall, more than US$140 million in valueopportunities were identified, of which more than US$100 million will have a recurrent impact on EBITDA.
Spain
Cement and ready-mix volumes increased 4% and 5%, respectively, versus 2000. Spain’s public worksspending continued to drive consumption, while residential construction slowed compared to the highlevels reached in recent years, due to less private sector spending and lower real wages.
In 2001 net sales were flat overall at US$848 million. Higher volumes were offset by lower pricing indollar terms due to exchange rate depreciation. EBITDA decreased to US$243 million, a drop of 16%
versus the preceding year, as a result of higher energy costs due to the weak euro, higher trans-portation costs due to increased demand in areas in which production capacity was lower, and achange in product mix (a greater percentage of mortar and ready-mix sales).
The company recently completed a de-bottlenecking program at its San Vicente plant, which willallow it to increase production by approximately 400,000 metric tons per year. This will reduce theneed to purchase clinker from third parties and will optimize logistics costs. Lower pet coke prices,the use of alternative fuels, and more efficient distribution should also help to reduce productionand logistics costs. In the first half of 2002, all of the company’s mainland plants are scheduled toreceive ISO 14001 certification.
Venezuela / Dominican Republic
Domestic cement volumes in the company’s Venezuelan operations increased 6% compared to 2000.The self-construction sector primarily drove demand. Ready-mix volumes decreased 7% versus thepreceding year as a result of lower formal construction sector investments. Export volumes dropped17% from 2000.
Net sales for the combined operations of CEMEX in Venezuela and the Dominican Republic wereUS$624 million in 2001, a decline of 6% compared to a year ago. EBITDA decreased to US$220 million,a 2% drop versus 2000.
34
CEMEX consolidated seven data centers in South America into a single one in Venezuela. This hashelped to reduce the region’s back office costs and has dramatically increased the timeliness of thedata needed to manage the company.
Colombia
At CEMEX’s Colombian operations, domestic cement volume decreased 8% from 2000. Public worksdemand declined with the conclusion of major projects. Though private investment in non-residentialconstruction increased, higher unemployment and lower disposable income pushed down demandfrom the self-construction sector. Ready-mix volumes declined 3% versus the preceding year.
For the year, net sales rose to US$216 million, an increase of 5% compared to 2000. Higher averagegray cement prices in dollar terms more than offset higher energy costs. EBITDA grew to US$132
million, up 17% versus 2000. Cost-cutting initiatives and the concentration of production in theIbague plant helped to improve the company’s EBITDA margin.
Despite the downturn in Colombia’s cement market, the company’s operations have improved theirperformance well beyond historic benchmarks. Operating margin increased 2.9 percentage points year-over-year to 43.3%, and capacity utilization rose more than 10 percentage points to 89.8%.
Central America & Caribbean
During 2001, CEMEX’s net sales for its Central America & Caribbean operations (excluding theDominican Republic, consolidated under CEMEX Venezuela) grew 12% over the previous year,reaching US$272 million. EBITDA was also 31% higher, at US$70 million.
In Panama, CEMEX reduced energy costs by securing the supply of electricity while also negotiatinglower tariffs. In the Dominican Republic, the largest vertical cement mill in the world was inagu-rated, increasing CEMEX’s cement production capacity in the country by more than 100%. Duringthe year, CEMEX Costa Rica initiated the transition from fuel oil to pet coke, which is expected togenerate significant cost savings. In 2001, CEMEX formally entered Nicaragua by signing a 25-yearlease with the government to operate a local cement plant with annual production capacity of450,000 tons.
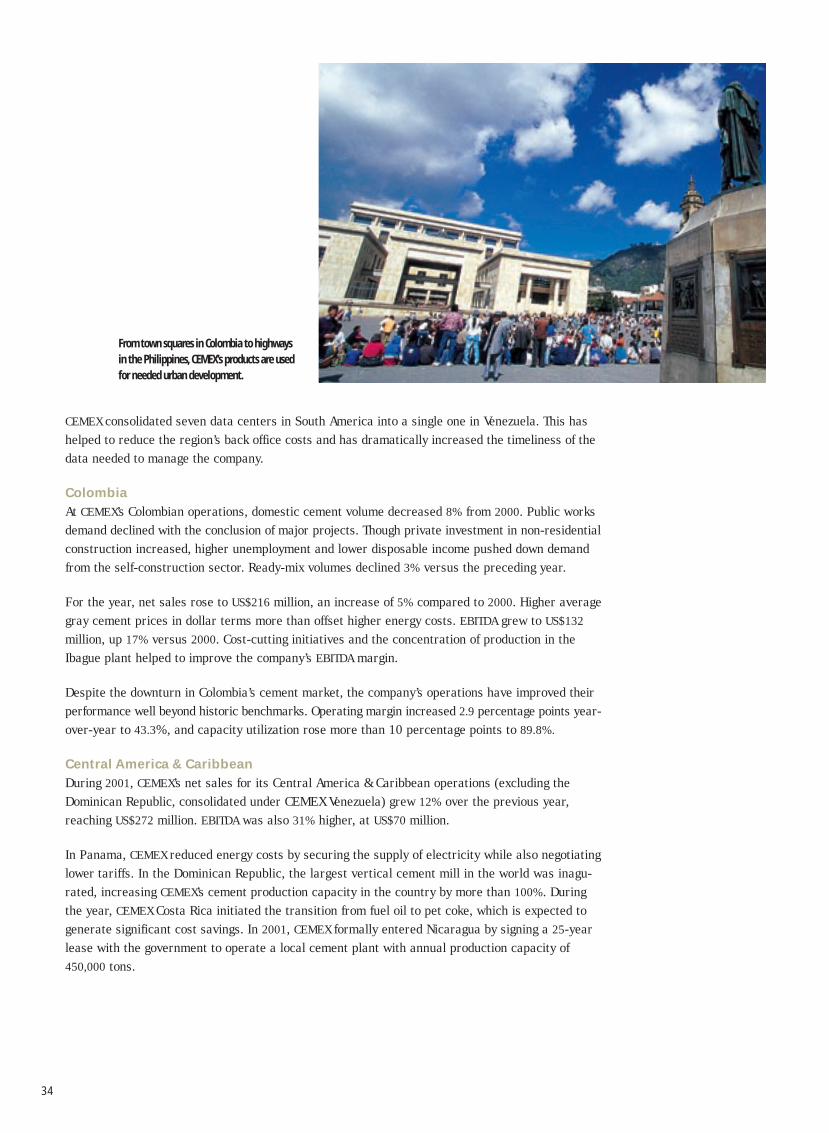
From town squares in Colombia to highwaysin the Philippines, CEMEX’s products are usedfor needed urban development.
35
Philippines
In the Philippines, domestic cement volumes decreased 11% versus 2000. The lackof government funding for infrastructure development continued to dampen con-struction sector activity. Cement imports into the Philippines grew considerably,and demand in the residential sector weakened due to an oversupply of housingcoupled with few projects under development.
In 2001 net sales increased to US$151 million, up 10% compared to 2000. However,EBITDA declined 42% to US$19 million due to a higher percentage of lower marginexport sales and losses sustained from the company’s trading operations.
Despite a challenging environment, the company achieved several operationalmilestones that underscore its commitment to efficiency, safety and the environ-ment. The Solid and APO cement plants were among the most efficient, lowest-costproducers in the CEMEX system, notwithstanding the country’s high energy prices.The operations’ accident rates remained extremely low, particularly at the APO
facility where no accidents have occurred for over a year. The Solid and APO plantsachieved ISO 9002 and ISO 14001 certification.
Egypt
In Egypt, domestic cement volumes increased 5% for the year. This growth resultedfrom successful marketing initiatives in the company’s most dynamic regions andits participation in lower Egypt.
Net sales were US$133 million, a decrease of 18% versus 2000. Sales declined dueto lower pricing in Egyptian pounds, as well as the 22% devaluation of the currency.EBITDA was US$52 million, a drop of 35% from a year ago.
During 2001, CEMEX Egypt bolstered its brand presence across all of its markets,and established a solid position in Cairo and the Nile Delta. As a result, the companynow enjoys a strong brand presence in all of the nation’s construction markets.
The company reinforced its commercial network of more than 500 retailers throughmultiple customer initiatives: improving logistics to ensure on-time delivery; openingadditional sales offices and creating an infrastructure of affiliated bank branches;increasing delivery to small retailers; consolidating sales of value-added SRC
cement; and introducing El Mohandes, a new premium cement product. In lessthan two years, the company has also reduced dust emissions from its plant tomeet CEMEX’s international standards, which are far more stringent than localenvironmental requirements.
Trading
CEMEX’s international cement trading network – one of the largest in the world –plays a fundamental role in realizing the company’s strategic goals. Its maritimefleet and more than 50 strategically located marine terminals serve customers inthe world’s most dynamic cement markets and constitute a critical competitiveadvantage for CEMEX.
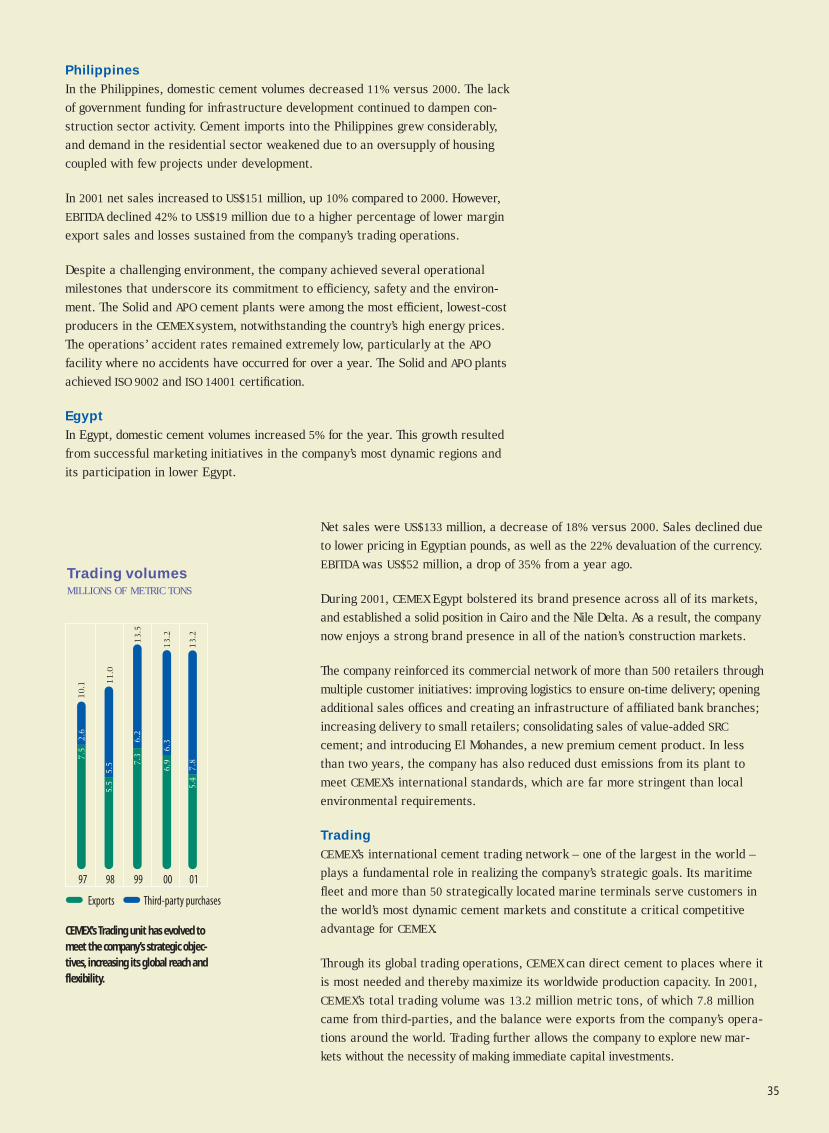
Through its global trading operations, CEMEX can direct cement to places where itis most needed and thereby maximize its worldwide production capacity. In 2001,CEMEX’s total trading volume was 13.2 million metric tons, of which 7.8 millioncame from third-parties, and the balance were exports from the company’s opera-tions around the world. Trading further allows the company to explore new mar-kets without the necessity of making immediate capital investments.
0100999897
Exports Third-party purchases
10
.1 11
.0
13
.5
13
.2
13
.2
7.5
2.6
5.5
5.5 7
.36
.2
6.9
6.3
5.4
7.8
Trading volumesMILLIONS OF METRIC TONS
CEMEX’s Trading unit has evolved tomeet the company’s strategic objec-tives, increasing its global reach andflexibility.
36
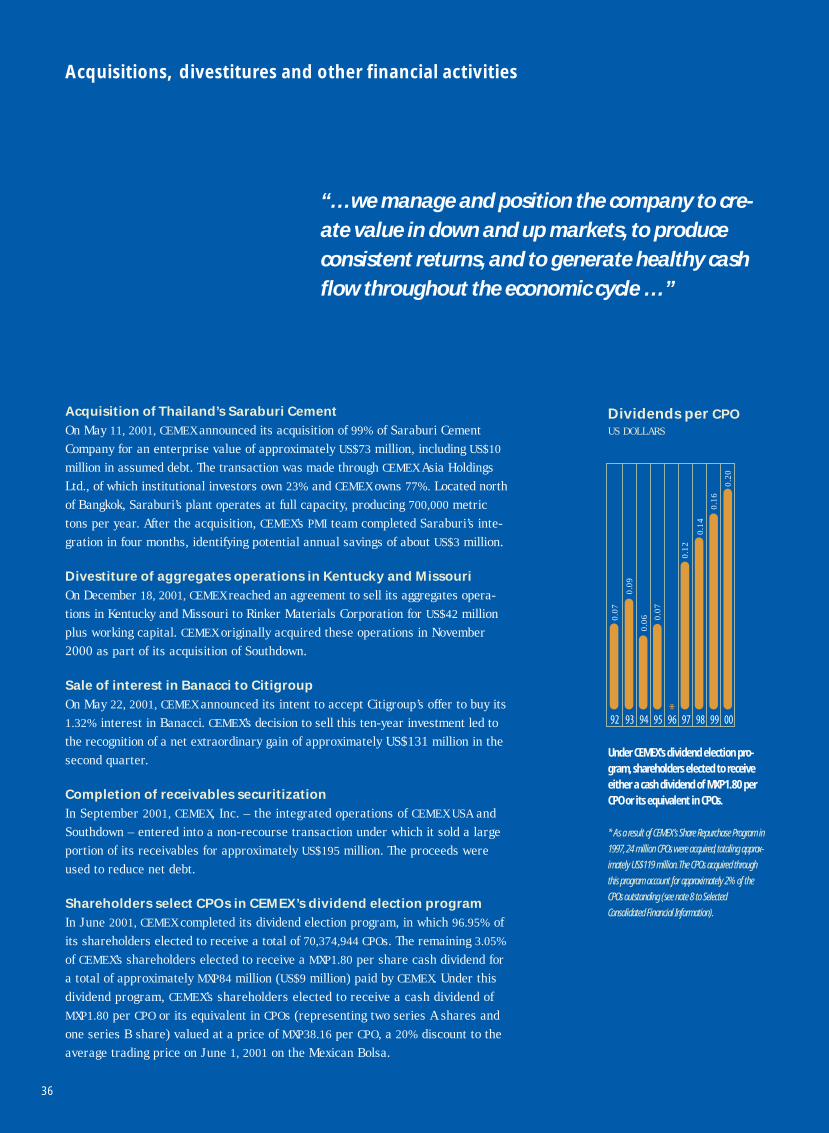
009998979695949392
0.12
*0.
07
0.06
0.09
0.07
0.14
0.16
0.20
Dividends per CPOUS DOLLARS
Under CEMEX’s dividend election pro-gram, shareholders elected to receiveeither a cash dividend of MXP1.80 perCPO or its equivalent in CPOs.
* As a result of CEMEX’s Share Repurchase Program in
1997, 24 million CPOs were acquired, totaling approx-
imately US$119 million.The CPOs acquired through
this program account for approximately 2% of the
CPOs outstanding (see note 8 to Selected
Consolidated Financial Information).
Acquisition of Thailand’s Saraburi Cement
On May 11, 2001, CEMEX announced its acquisition of 99% of Saraburi CementCompany for an enterprise value of approximately US$73 million, including US$10
million in assumed debt. The transaction was made through CEMEX Asia HoldingsLtd., of which institutional investors own 23% and CEMEX owns 77%. Located northof Bangkok, Saraburi’s plant operates at full capacity, producing 700,000 metrictons per year. After the acquisition, CEMEX’s PMI team completed Saraburi’s inte-gration in four months, identifying potential annual savings of about US$3 million.
Divestiture of aggregates operations in Kentucky and Missouri
On December 18, 2001, CEMEX reached an agreement to sell its aggregates opera-tions in Kentucky and Missouri to Rinker Materials Corporation for US$42 millionplus working capital. CEMEX originally acquired these operations in November2000 as part of its acquisition of Southdown.
Sale of interest in Banacci to Citigroup
On May 22, 2001, CEMEX announced its intent to accept Citigroup’s offer to buy its1.32% interest in Banacci. CEMEX’s decision to sell this ten-year investment led tothe recognition of a net extraordinary gain of approximately US$131 million in thesecond quarter.
Completion of receivables securitization
In September 2001, CEMEX, Inc. – the integrated operations of CEMEX USA andSouthdown – entered into a non-recourse transaction under which it sold a largeportion of its receivables for approximately US$195 million. The proceeds wereused to reduce net debt.
Shareholders select CPOs in CEMEX’s dividend election program
In June 2001, CEMEX completed its dividend election program, in which 96.95% ofits shareholders elected to receive a total of 70,374,944 CPOs. The remaining 3.05%
of CEMEX’s shareholders elected to receive a MXP1.80 per share cash dividend fora total of approximately MXP84 million (US$9 million) paid by CEMEX. Under thisdividend program, CEMEX’s shareholders elected to receive a cash dividend of MXP1.80 per CPO or its equivalent in CPOs (representing two series A shares andone series B share) valued at a price of MXP38.16 per CPO, a 20% discount to theaverage trading price on June 1, 2001 on the Mexican Bolsa.
Acquisitions, divestitures and other financial activities
“…we manage and position the company to cre-ate value in down and up markets, to produceconsistent returns, and to generate healthy cashflow throughout the economic cycle …”
37
Successful warrant exchange offer
On November 23, 2001, CEMEX announced a voluntary public exchange offer of its existing appreciationwarrants and American Depositary Warrants (ADWs) maturing December 13, 2002, for new warrantsmaturing December 21, 2004, under a one-for-one exchange offer. Of the 105,000,000 warrants origi-nally issued, 103,790,945 were tendered in exchange for the new warrants. On December 21, 2001,the new instruments began trading simultaneously on the New York Stock Exchange in the form ofADWs (NYSE: CX.WSB) and on the Bolsa Mexicana de Valores (BMV: CMX412E-DC062).
EUR800 million syndicated revolving credit facility
In October 2001, CEMEX, through its Spanish subsidiary, successfully closed a new three-yearrevolving credit facility in the amount of EUR800 million. With the participation of 38 financial insti-tutions, the transaction’s unprecedented over-subscription rate led to an increase of EUR350 millionover the facility’s original target amount.
US$757 million private placement
In March 2001, CEMEX, Inc. closed one of the U.S. market’s largest private placement financings onrecord – of US$757 million – with a group of insurance companies and pension funds. The proceedsof the private placement, in tranches of five and seven years, were mainly applied to refinanceshort-term debt incurred in conjunction with the Southdown acquisition and to extend the company’sdebt maturity profile.
MXP5,000 million medium-term promissory notes program
On November 19, 2001, CEMEX established a domestic medium-term promissory notes program forMXP5,000 million. On November 29, 2001, CEMEX issued two tranches under the program: the firstconsisted of MXP800 million with a three-year maturity, and the second consisted of MXP1,000 mil-lion with a five-year term. On January 25, 2002, CEMEX issued two additional tranches under thisprogram: MXP1,300 million with a seven-year term and MXP640 million with a five-year maturity.Both transactions were swapped through derivatives into dollar funding at rate of less than LIBOR
plus 1% for the first five years.
US$600 million syndicated bank loan
During the second quarter of 2001, CEMEX closed a US$600 million syndicated bank facility to extendthe company’s debt maturity profile. The facility has two tranches: a one-year US$200 million creditfacility, and a three-year US$400 million revolving credit facility.
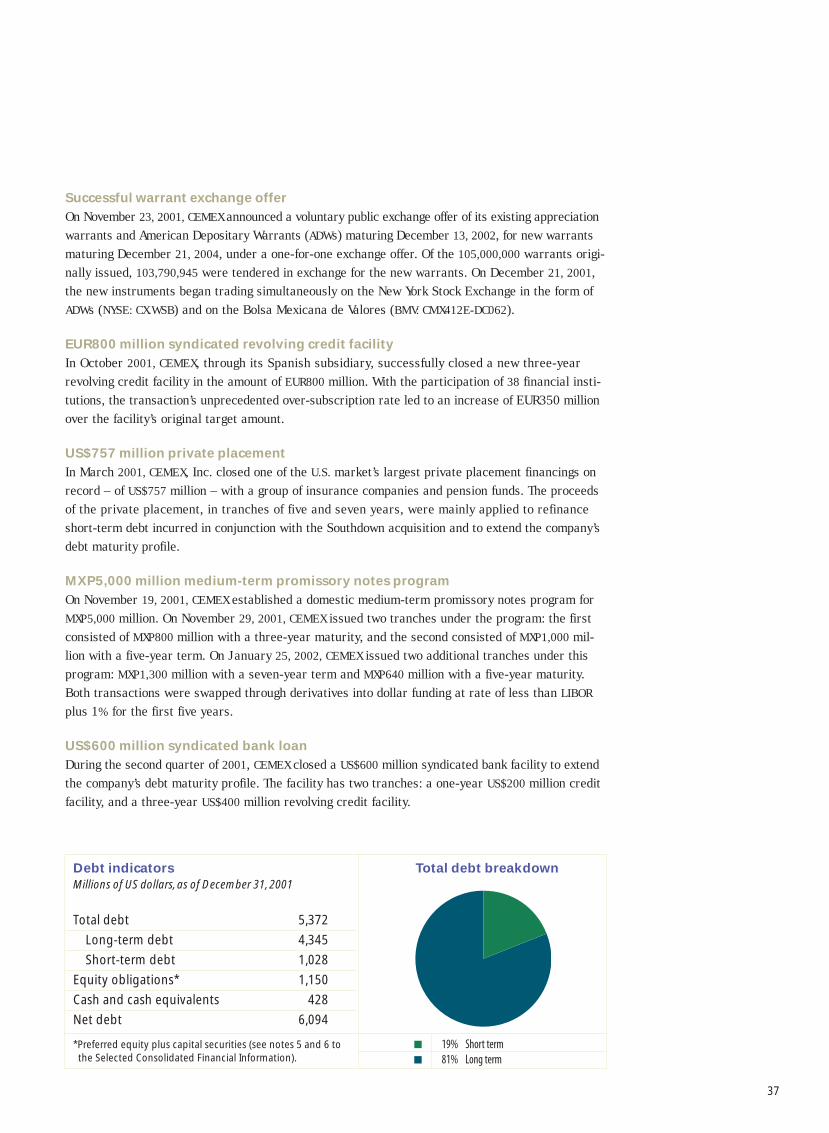
19% Short term81% Long term
Debt indicatorsMillions of US dollars, as of December 31, 2001
Total debt 5,372
Long-term debt 4,345
Short-term debt 1,028
Equity obligations* 1,150
Cash and cash equivalents 428
Net debt 6,094
*Preferred equity plus capital securities (see notes 5 and 6 to the Selected Consolidated Financial Information).
Total debt breakdown
38
Derivative instruments
In accordance with the controls and procedures established by the financial risk man-agement department, CEMEX periodically utilizes derivative financial instruments suchas interest rate and currency swaps, currency and equity forward contracts, optionsand futures in order to reduce risks associated with changes in interest rates and for-eign exchange rates of debt agreements, as a vehicle to reduce financing costs and ashedging instruments of CEMEX’s stock option plans, among other purposes. EffectiveJanuary 1, 2001, the Company adopted Bulletin C-2 Financial Instruments (”Bulletin C-
2), which became effective for all public companies reporting under Mexican GAAP.Bulletin C-2 requires the recognition of all derivative financial instruments in the bal-ance sheet as assets or liabilities, at their estimated fair value, with changes in suchvalues being recorded in the income statement, including instruments negotiated overforecasted transactions. The exceptions to the rule, as they refer to CEMEX, are pre-sented when transactions are entered for hedging purposes. In such cases, the relatedderivative financial instruments should be valued using the same valuation criteriaapplied to the hedged asset, liability or equity instrument. CEMEX recognized increasesin assets and liabilities, which resulted in a net gain of US$248.8 million, arising fromthe fair value recognition of such derivatives as of December 31, 2001. The notionalamounts of derivatives substantially match the amounts of underlying assets, liabili-ties or equity transactions on which the derivatives are being entered into.
Millions of US dollars December 31, 2001 1
Equity derivatives 1,396 Foreign-exchange derivatives 1,630 Interest-rate derivatives 5,281
1 Notional amounts
The estimated aggregate fair market value of the above derivative instruments wasUS$234 million for the period ending December 31, 2001.
Alignment of management and shareholder interests
In November 2001, CEMEX implemented a voluntary exchange program to its executivesunder the stock option plan (ESOP) intended to better align employee interests withthose of shareholders. The executives that participated in this program elected toresign their rights to subscribe and/or acquire newly issued CPOs of CEMEX commonstock at a weighted average price of MXP34.11 per CPO, in exchange for cash, repre-senting the intrinsic value of their options at the exchange date; and the issuance ofoptions from the new variable plan, equivalent in number to the time value of theirredeemed options at the exchange date, determined by the appropriate valuationmodel for each particular executive. The new variable program of CEMEX CPO shareshas an escalating dollar strike price set at US$4.93 per CPO as of December 31, 2001,growing by 7% per annum less dividends reflecting market funding costs for this fullyhedged program, while the prior fixed program has a strike price fixed in peso termson the CPOs. Approximately 90.1% of the outstanding fixed options were exchangedinto the variable program. As of December 31, 2001, directors, officers and other exec-utives had outstanding options on 97,633,194 CEMEX CPOs, considering both the oldand the new plans.
In addition, as of December 31, 2001, the Voluntary Executive Stock Option Plan(VESOP) was composed of five-year options on 20,215,960 CEMEX CPOs with anescalating strike price indexed quarterly in dollar terms, reflecting market fundingcosts for this fully hedged program.
The total amount of these fixed and variable stock options programs represents8.1% of total CPOs outstanding.
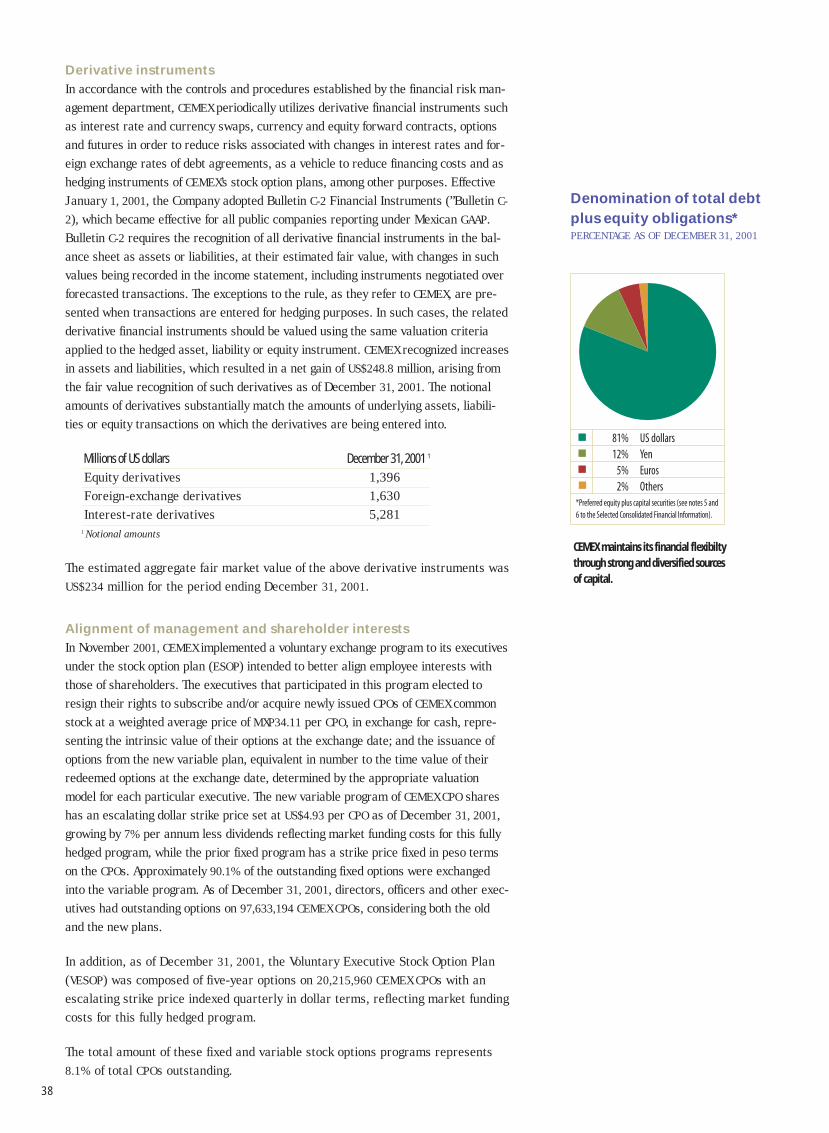
81%12% 5% 2%
US dollarsYenEurosOthers
*Preferred equity plus capital securities (see notes 5 and 6 to the Selected Consolidated Financial Information).
Denomination of total debtplus equity obligations*PERCENTAGE AS OF DECEMBER 31, 2001
CEMEX maintains its financial flexibiltythrough strong and diversified sourcesof capital.
39
financial statements
40 Auditors’ report
41 Management responsibility for internal control
42 Consolidated balance sheets
44 Consolidated statements of income
45 Consolidated statements of changes in
financial position
46 Balance sheets
(parent company only)
48 Statements of income
(parent company only)
49 Statements of changes in financial position
(parent company only)
50 Statements of changes in stockholders’ equity
52 Notes to consolidated and parent-company-only
financial statements
40
The Board of Directors and StockholdersCemex, S.A. de C.V.:(Millions of constant Mexican pesos as of December 31, 2001)
We have audited the consolidated and parent company-only balance sheets of Cemex, S.A. de C.V. andCemex, S.A. de C.V. and Subsidiaries as of December 31, 2001 and 2000, and the related consolidatedand parent company-only statements of income, changes in stockholders’ equity and changes in finan-cial position for each of the years in the three-year period ended December 31, 2001. These financialstatements are the responsibility of the Company’s management. Our responsibility is to express anopinion on these financial statements based on our audits. As of December 31, 2000 and 1999, we didnot audit the consolidated financial statements of certain consolidated subsidiaries which were auditedby other auditors. The financial statements of these subsidiaries reflect total assets of 2% in 2000 andtotal revenues constituting 0% and 9% in 2000 and 1999, respectively, of the related consolidatedtotals. The parent company’s investment in these subsidiaries was $484.3 as of December 31, 2000, andits share in their net income (loss) was $(48.0) and $510.8 for each of the years in the two-year peri-od ended December 31, 2000. Our opinion expressed herein, insofar as it relates to the amounts includ-ed for such subsidiaries, is based solely upon the reports of the other auditors.
We conducted our audits in accordance with generally accepted auditing standards in Mexico. Thosestandards require that we plan and perform the audits to obtain reasonable assurance about whetherthe financial statements are free of material misstatements and are prepared in accordance with gen-erally accepted accounting principles in Mexico. An audit consists of examining, on a test basis, evidencesupporting the amounts and disclosures in the financial statements. An audit also includes assessing theaccounting principles used and significant estimates made by management, as well as evaluating theoverall financial statement presentation. We believe that our audits and the reports of other auditorsprovide a reasonable basis for our opinion.
In our opinion, based upon our audits and the reports of other auditors, the consolidated and parentcompany-only financial statements referred to above present fairly, in all material respects, the finan-cial position of Cemex, S.A. de C.V. and Cemex, S.A. de C.V. and Subsidiaries at December 31, 2001 and2000, and the consolidated and parent company-only results of their operations, the changes in theirstockholders’ equity and the changes in their financial position for each of the years in the three-yearperiod ended December 31, 2001, in accordance with generally accepted accounting principles inMexico.
KPMG Cárdenas Dosal, S.C.
Rafael Gómez Eng
Monterrey, N.L., MexicoJanuary 15, 2002.
Independent Auditors’ Report
41
The Board of Directors and StockholdersCemex, S.A. de C.V.:
We have performed a study and evaluation of the system ofinternal accounting control of Cemex, S.A. de C.V. andSubsidiaries for the year ended December 31, 2001. Themanagement of Cemex, S.A. de C.V. is responsible for estab-lishing and maintaining a system of internal accounting control.Our responsibility is to express an opinion on this system ofinternal control based on our review. We conducted our study andevaluation in accordance with generally accepted auditing stan-dards.
Because of inherent limitations in any system of internalaccounting control, errors and irregularities may neverthelessoccur and not be detected. Also, projection of any evaluation ofthe system to future periods is subject to the risk that proce-dures may become inadequate because of changes in conditionsor that the degree of compliance with the procedures may dete-riorate.
In our opinion, the system of internal accounting control ofCemex, S.A. de C.V. and Subsidiaries for the year endedDecember 31, 2001, taken as a whole, was sufficient to meetmanagement’s objectives and to provide reasonable assurancethat material errors or irregularities will be prevented ordetected in the normal course of business.
KPMG Cárdenas Dosal, S.C.
Rafael Gómez Eng
Monterrey, N.L. MexicoJanuary 15, 2002.
The management of Cemex, S.A. de C.V. is responsible for thepreparation and integrity of the accompanying consolidatedfinancial statements and for maintaining a system of internalcontrol to provide reasonable assurance to shareholders, to thefinancial community and other interested parties, that transac-tions are executed in accordance with management authoriza-tion, accounting records are reliable as a basis for the prepara-tion of the consolidated financial statements and to provide rea-sonable assurance that assets are safeguarded against lossfrom unauthorized use or disposition.
In fulfilling its responsibilities for the integrity of financial infor-mation, management maintains and relies on the internal con-trol system of the Company. This system is based on an organi-zational structure providing division of responsibilities and theselection and training of qualified personnel. Also, it includespolicies, which are communicated to all personnel throughappropriate communication channels. The system of internalcontrol is supported by an internal audit function that operatesworldwide and reports its findings to management throughoutthe year. Management believes that, for the year endedDecember 31 2001, the internal control system of the Companyprovides reasonable assurance that material errors or irregu-larities will be prevented or detected within a timely period andis cost effective.
Cemex, S.A. de C.V. engaged KPMG Cárdenas Dosal, S.C., theprincipal independent auditors of the Company, to perform anaudit of the internal control system and express their opinionthereon for the year ended December 31 2001. Their auditapplied generally accepted auditing standards, which included areview and evaluation of control systems and performance ofsuch test of accounting information records as they considerednecessary in order to reach their opinion. Their report is pre-sented separately.
Lorenzo H. Zambrano
Chairman of the Boardand Chief Executive Officer
Management responsibilityfor internal control
42
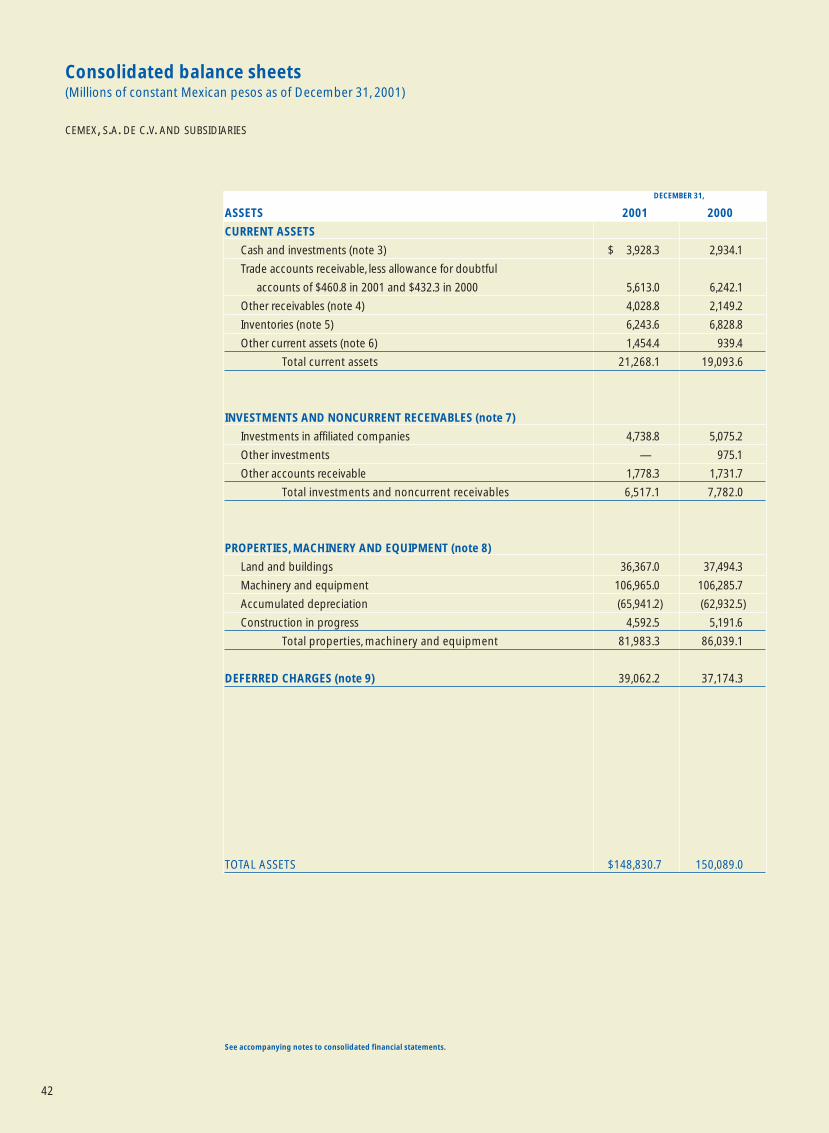
Consolidated balance sheets(Millions of constant Mexican pesos as of December 31, 2001)
CEMEX, S.A. DE C.V. AND SUBSIDIARIES
See accompanying notes to consolidated financial statements.
DECEMBER 31,
ASSETS 2001 2000
CURRENT ASSETS
Cash and investments (note 3) $ 3,928.3 2,934.1
Trade accounts receivable, less allowance for doubtful
accounts of $460.8 in 2001 and $432.3 in 2000 5,613.0 6,242.1
Other receivables (note 4) 4,028.8 2,149.2
Inventories (note 5) 6,243.6 6,828.8
Other current assets (note 6) 1,454.4 939.4
Total current assets 21,268.1 19,093.6
INVESTMENTS AND NONCURRENT RECEIVABLES (note 7)
Investments in affiliated companies 4,738.8 5,075.2
Other investments — 975.1
Other accounts receivable 1,778.3 1,731.7
Total investments and noncurrent receivables 6,517.1 7,782.0
PROPERTIES, MACHINERY AND EQUIPMENT (note 8)
Land and buildings 36,367.0 37,494.3
Machinery and equipment 106,965.0 106,285.7
Accumulated depreciation (65,941.2) (62,932.5)
Construction in progress 4,592.5 5,191.6
Total properties, machinery and equipment 81,983.3 86,039.1
DEFERRED CHARGES (note 9) 39,062.2 37,174.3
TOTAL ASSETS $148,830.7 150,089.0
43
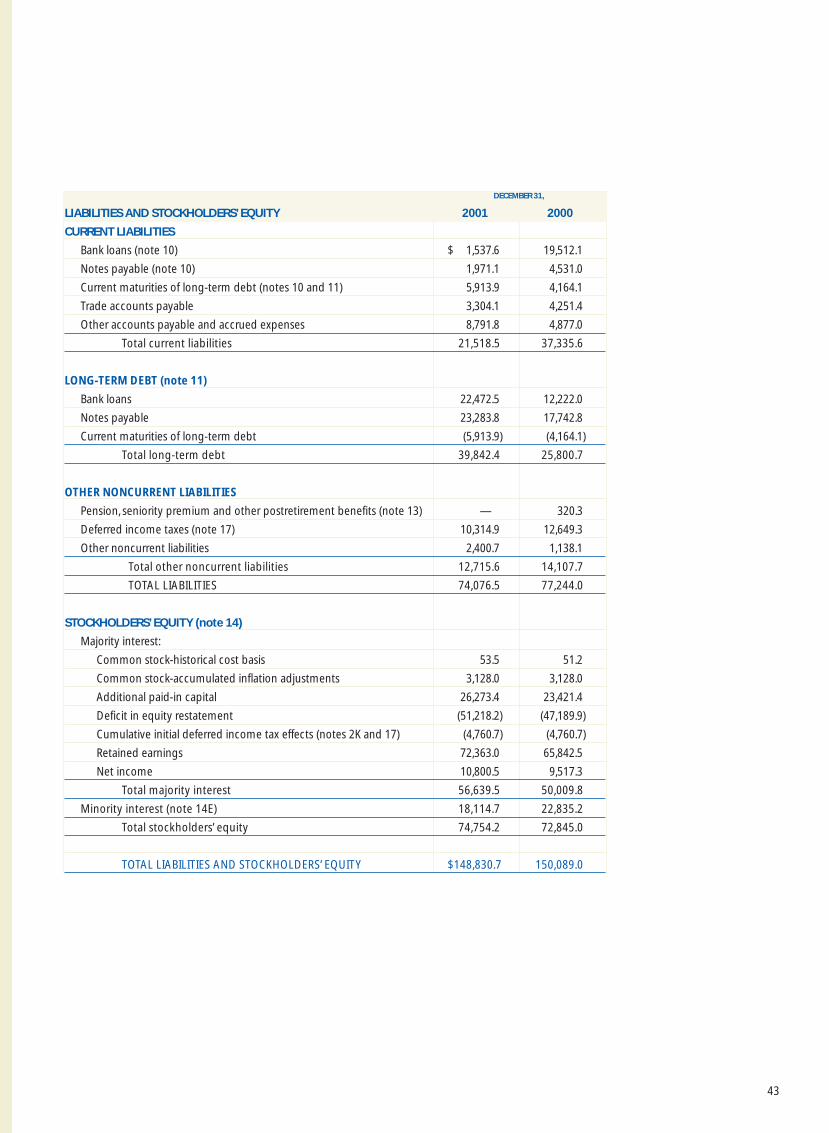
DECEMBER 31,
LIABILITIES AND STOCKHOLDERS’ EQUITY 2001 2000
CURRENT LIABILITIES
Bank loans (note 10) $ 1,537.6 19,512.1
Notes payable (note 10) 1,971.1 4,531.0
Current maturities of long-term debt (notes 10 and 11) 5,913.9 4,164.1
Trade accounts payable 3,304.1 4,251.4
Other accounts payable and accrued expenses 8,791.8 4,877.0
Total current liabilities 21,518.5 37,335.6
LONG-TERM DEBT (note 11)
Bank loans 22,472.5 12,222.0
Notes payable 23,283.8 17,742.8
Current maturities of long-term debt (5,913.9) (4,164.1)
Total long-term debt 39,842.4 25,800.7
OTHER NONCURRENT LIABILITIES
Pension, seniority premium and other postretirement benefits (note 13) — 320.3
Deferred income taxes (note 17) 10,314.9 12,649.3
Other noncurrent liabilities 2,400.7 1,138.1
Total other noncurrent liabilities 12,715.6 14,107.7
TOTAL LIABILITIES 74,076.5 77,244.0
STOCKHOLDERS’ EQUITY (note 14)
Majority interest:
Common stock-historical cost basis 53.5 51.2
Common stock-accumulated inflation adjustments 3,128.0 3,128.0
Additional paid-in capital 26,273.4 23,421.4
Deficit in equity restatement (51,218.2) (47,189.9)
Cumulative initial deferred income tax effects (notes 2K and 17) (4,760.7) (4,760.7)
Retained earnings 72,363.0 65,842.5
Net income 10,800.5 9,517.3
Total majority interest 56,639.5 50,009.8
Minority interest (note 14E) 18,114.7 22,835.2
Total stockholders’ equity 74,754.2 72,845.0
TOTAL LIABILITIES AND STOCKHOLDERS’ EQUITY $148,830.7 150,089.0
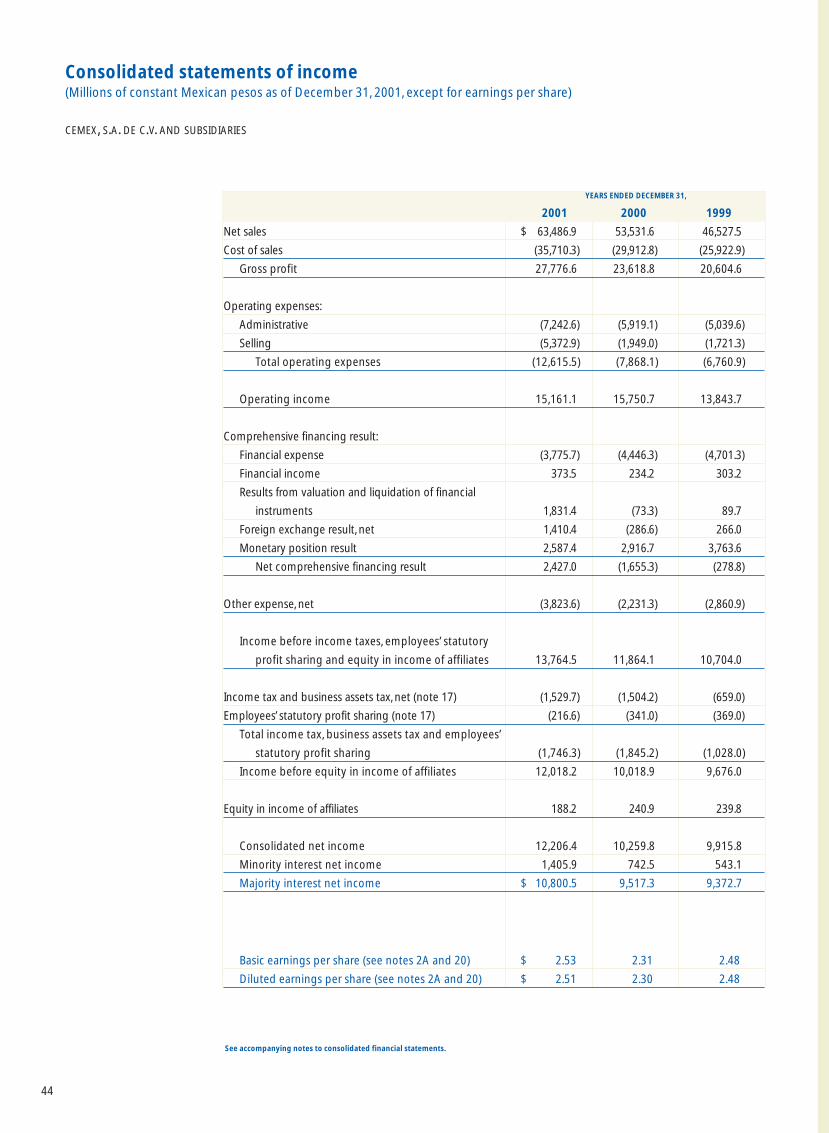
44
Consolidated statements of income(Millions of constant Mexican pesos as of December 31, 2001, except for earnings per share)
CEMEX, S.A. DE C.V. AND SUBSIDIARIES
See accompanying notes to consolidated financial statements.
YEARS ENDED DECEMBER 31,
2001 2000 1999
Net sales $ 63,486.9 53,531.6 46,527.5
Cost of sales (35,710.3) (29,912.8) (25,922.9)
Gross profit 27,776.6 23,618.8 20,604.6
Operating expenses:
Administrative (7,242.6) (5,919.1) (5,039.6)
Selling (5,372.9) (1,949.0) (1,721.3)
Total operating expenses (12,615.5) (7,868.1) (6,760.9)
Operating income 15,161.1 15,750.7 13,843.7
Comprehensive financing result:
Financial expense (3,775.7) (4,446.3) (4,701.3)
Financial income 373.5 234.2 303.2
Results from valuation and liquidation of financial
instruments 1,831.4 (73.3) 89.7
Foreign exchange result, net 1,410.4 (286.6) 266.0
Monetary position result 2,587.4 2,916.7 3,763.6
Net comprehensive financing result 2,427.0 (1,655.3) (278.8)
Other expense, net (3,823.6) (2,231.3) (2,860.9)
Income before income taxes, employees’ statutory
profit sharing and equity in income of affiliates 13,764.5 11,864.1 10,704.0
Income tax and business assets tax, net (note 17) (1,529.7) (1,504.2) (659.0)
Employees’ statutory profit sharing (note 17) (216.6) (341.0) (369.0)
Total income tax, business assets tax and employees’
statutory profit sharing (1,746.3) (1,845.2) (1,028.0)
Income before equity in income of affiliates 12,018.2 10,018.9 9,676.0
Equity in income of affiliates 188.2 240.9 239.8
Consolidated net income 12,206.4 10,259.8 9,915.8
Minority interest net income 1,405.9 742.5 543.1
Majority interest net income $ 10,800.5 9,517.3 9,372.7
Basic earnings per share (see notes 2A and 20) $ 2.53 2.31 2.48
Diluted earnings per share (see notes 2A and 20) $ 2.51 2.30 2.48
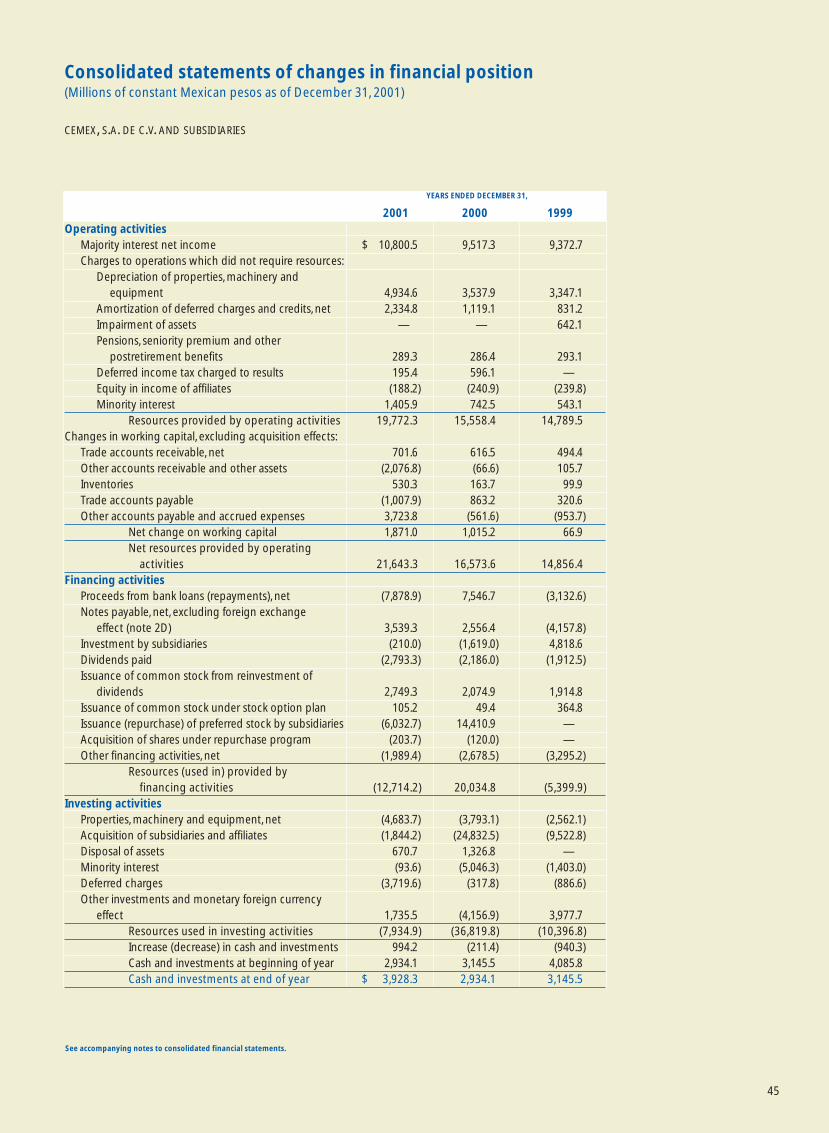
45
Consolidated statements of changes in financial position(Millions of constant Mexican pesos as of December 31, 2001)
CEMEX, S.A. DE C.V. AND SUBSIDIARIES
See accompanying notes to consolidated financial statements.
YEARS ENDED DECEMBER 31,
2001 2000 1999Operating activities
Majority interest net income $ 10,800.5 9,517.3 9,372.7Charges to operations which did not require resources:
Depreciation of properties, machinery and equipment 4,934.6 3,537.9 3,347.1
Amortization of deferred charges and credits, net 2,334.8 1,119.1 831.2Impairment of assets — — 642.1Pensions, seniority premium and other
postretirement benefits 289.3 286.4 293.1Deferred income tax charged to results 195.4 596.1 —Equity in income of affiliates (188.2) (240.9) (239.8)Minority interest 1,405.9 742.5 543.1
Resources provided by operating activities 19,772.3 15,558.4 14,789.5Changes in working capital, excluding acquisition effects:
Trade accounts receivable, net 701.6 616.5 494.4Other accounts receivable and other assets (2,076.8) (66.6) 105.7Inventories 530.3 163.7 99.9Trade accounts payable (1,007.9) 863.2 320.6Other accounts payable and accrued expenses 3,723.8 (561.6) (953.7)
Net change on working capital 1,871.0 1,015.2 66.9Net resources provided by operating
activities 21,643.3 16,573.6 14,856.4Financing activities
Proceeds from bank loans (repayments), net (7,878.9) 7,546.7 (3,132.6)Notes payable, net, excluding foreign exchange
effect (note 2D) 3,539.3 2,556.4 (4,157.8)Investment by subsidiaries (210.0) (1,619.0) 4,818.6Dividends paid (2,793.3) (2,186.0) (1,912.5)Issuance of common stock from reinvestment of
dividends 2,749.3 2,074.9 1,914.8Issuance of common stock under stock option plan 105.2 49.4 364.8Issuance (repurchase) of preferred stock by subsidiaries (6,032.7) 14,410.9 —Acquisition of shares under repurchase program (203.7) (120.0) —Other financing activities, net (1,989.4) (2,678.5) (3,295.2)
Resources (used in) provided by financing activities (12,714.2) 20,034.8 (5,399.9)
Investing activitiesProperties, machinery and equipment, net (4,683.7) (3,793.1) (2,562.1)Acquisition of subsidiaries and affiliates (1,844.2) (24,832.5) (9,522.8)Disposal of assets 670.7 1,326.8 —Minority interest (93.6) (5,046.3) (1,403.0)Deferred charges (3,719.6) (317.8) (886.6)Other investments and monetary foreign currency
effect 1,735.5 (4,156.9) 3,977.7Resources used in investing activities (7,934.9) (36,819.8) (10,396.8)Increase (decrease) in cash and investments 994.2 (211.4) (940.3)Cash and investments at beginning of year 2,934.1 3,145.5 4,085.8Cash and investments at end of year $ 3,928.3 2,934.1 3,145.5
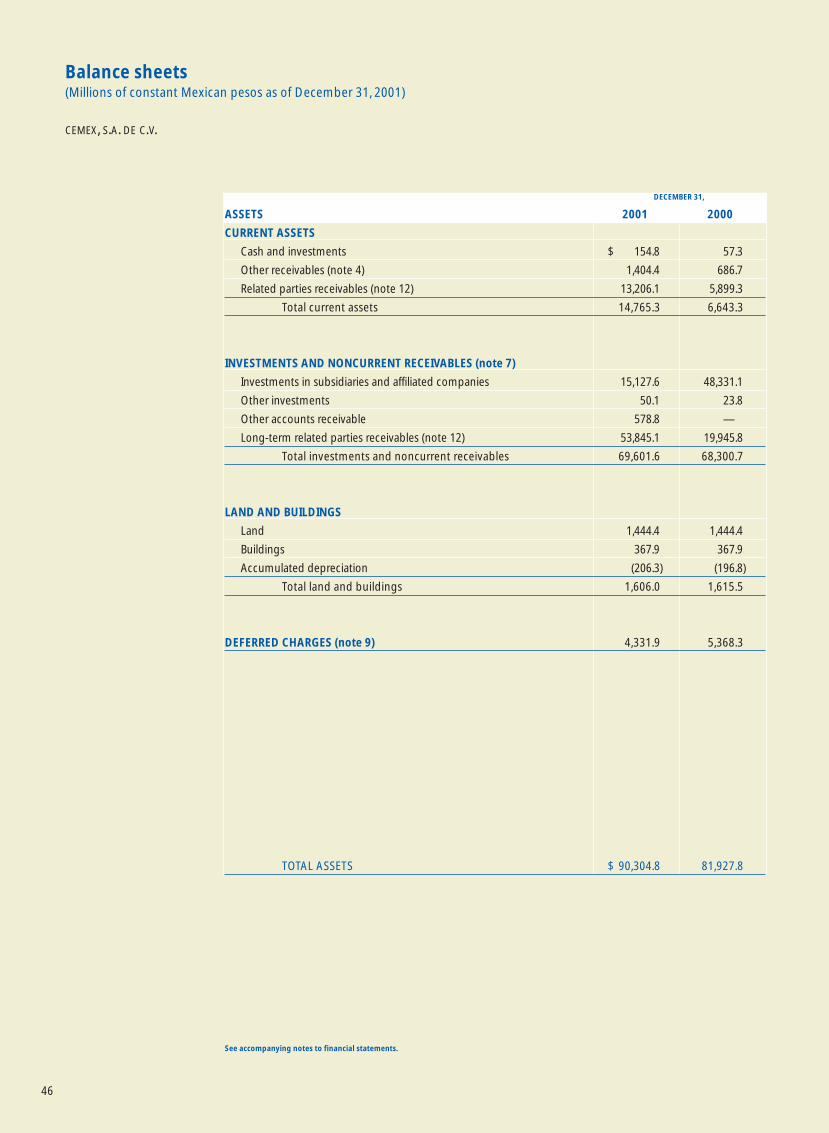
46
Balance sheets(Millions of constant Mexican pesos as of December 31, 2001)
CEMEX, S.A. DE C.V.
DECEMBER 31,
ASSETS 2001 2000
CURRENT ASSETS
Cash and investments $ 154.8 57.3
Other receivables (note 4) 1,404.4 686.7
Related parties receivables (note 12) 13,206.1 5,899.3
Total current assets 14,765.3 6,643.3
INVESTMENTS AND NONCURRENT RECEIVABLES (note 7)
Investments in subsidiaries and affiliated companies 15,127.6 48,331.1
Other investments 50.1 23.8
Other accounts receivable 578.8 —
Long-term related parties receivables (note 12) 53,845.1 19,945.8
Total investments and noncurrent receivables 69,601.6 68,300.7
LAND AND BUILDINGS
Land 1,444.4 1,444.4
Buildings 367.9 367.9
Accumulated depreciation (206.3) (196.8)
Total land and buildings 1,606.0 1,615.5
DEFERRED CHARGES (note 9) 4,331.9 5,368.3
TOTAL ASSETS $ 90,304.8 81,927.8
See accompanying notes to financial statements.
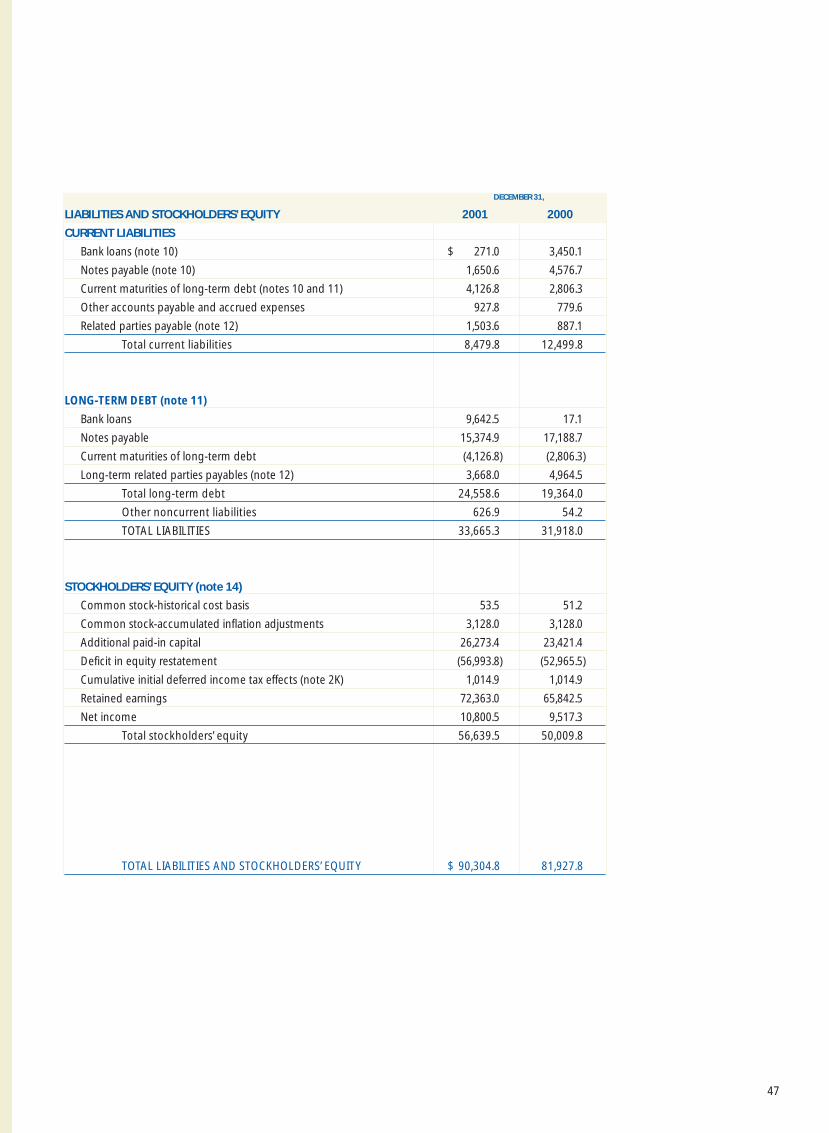
47
DECEMBER 31,
LIABILITIES AND STOCKHOLDERS’ EQUITY 2001 2000
CURRENT LIABILITIES
Bank loans (note 10) $ 271.0 3,450.1
Notes payable (note 10) 1,650.6 4,576.7
Current maturities of long-term debt (notes 10 and 11) 4,126.8 2,806.3
Other accounts payable and accrued expenses 927.8 779.6
Related parties payable (note 12) 1,503.6 887.1
Total current liabilities 8,479.8 12,499.8
LONG-TERM DEBT (note 11)
Bank loans 9,642.5 17.1
Notes payable 15,374.9 17,188.7
Current maturities of long-term debt (4,126.8) (2,806.3)
Long-term related parties payables (note 12) 3,668.0 4,964.5
Total long-term debt 24,558.6 19,364.0
Other noncurrent liabilities 626.9 54.2
TOTAL LIABILITIES 33,665.3 31,918.0
STOCKHOLDERS’ EQUITY (note 14)
Common stock-historical cost basis 53.5 51.2
Common stock-accumulated inflation adjustments 3,128.0 3,128.0
Additional paid-in capital 26,273.4 23,421.4
Deficit in equity restatement (56,993.8) (52,965.5)
Cumulative initial deferred income tax effects (note 2K) 1,014.9 1,014.9
Retained earnings 72,363.0 65,842.5
Net income 10,800.5 9,517.3
Total stockholders’ equity 56,639.5 50,009.8
TOTAL LIABILITIES AND STOCKHOLDERS’ EQUITY $ 90,304.8 81,927.8
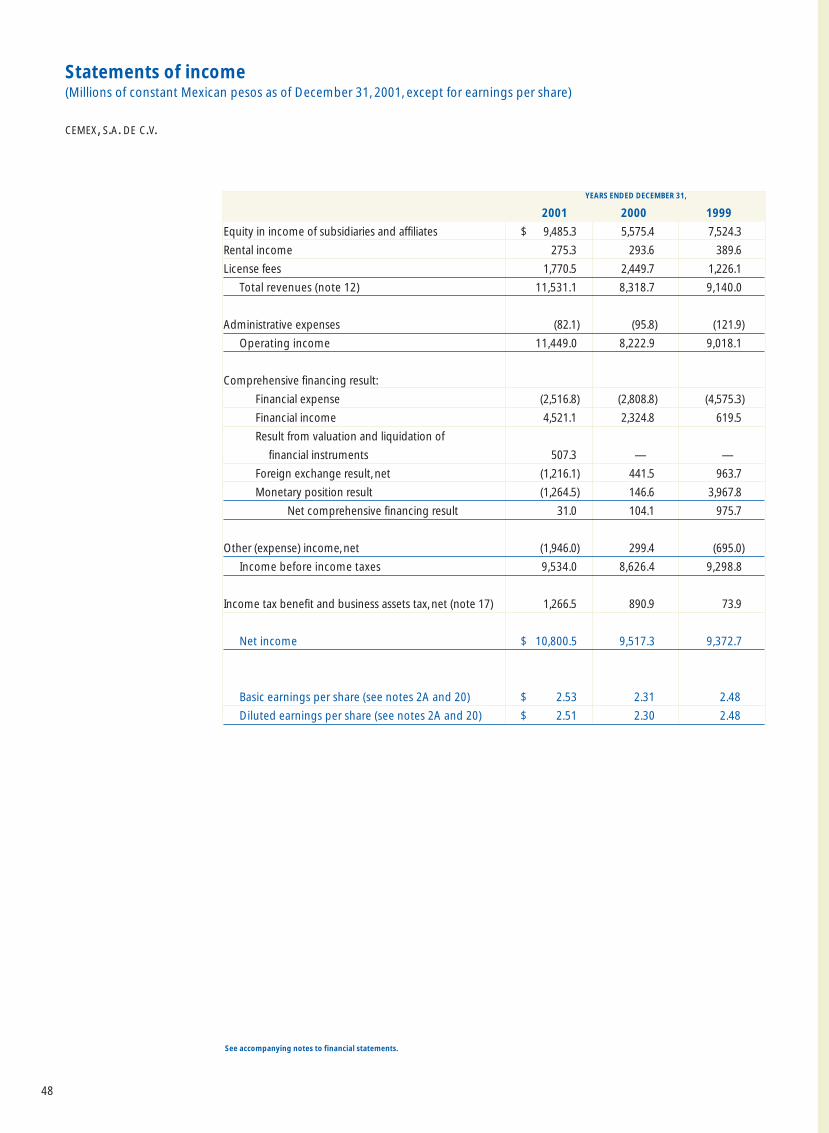
48
Statements of income(Millions of constant Mexican pesos as of December 31, 2001, except for earnings per share)
CEMEX, S.A. DE C.V.
See accompanying notes to financial statements.
YEARS ENDED DECEMBER 31,
2001 2000 1999
Equity in income of subsidiaries and affiliates $ 9,485.3 5,575.4 7,524.3
Rental income 275.3 293.6 389.6
License fees 1,770.5 2,449.7 1,226.1
Total revenues (note 12) 11,531.1 8,318.7 9,140.0
Administrative expenses (82.1) (95.8) (121.9)
Operating income 11,449.0 8,222.9 9,018.1
Comprehensive financing result:
Financial expense (2,516.8) (2,808.8) (4,575.3)
Financial income 4,521.1 2,324.8 619.5
Result from valuation and liquidation of
financial instruments 507.3 — —
Foreign exchange result, net (1,216.1) 441.5 963.7
Monetary position result (1,264.5) 146.6 3,967.8
Net comprehensive financing result 31.0 104.1 975.7
Other (expense) income, net (1,946.0) 299.4 (695.0)
Income before income taxes 9,534.0 8,626.4 9,298.8
Income tax benefit and business assets tax, net (note 17) 1,266.5 890.9 73.9
Net income $ 10,800.5 9,517.3 9,372.7
Basic earnings per share (see notes 2A and 20) $ 2.53 2.31 2.48
Diluted earnings per share (see notes 2A and 20) $ 2.51 2.30 2.48
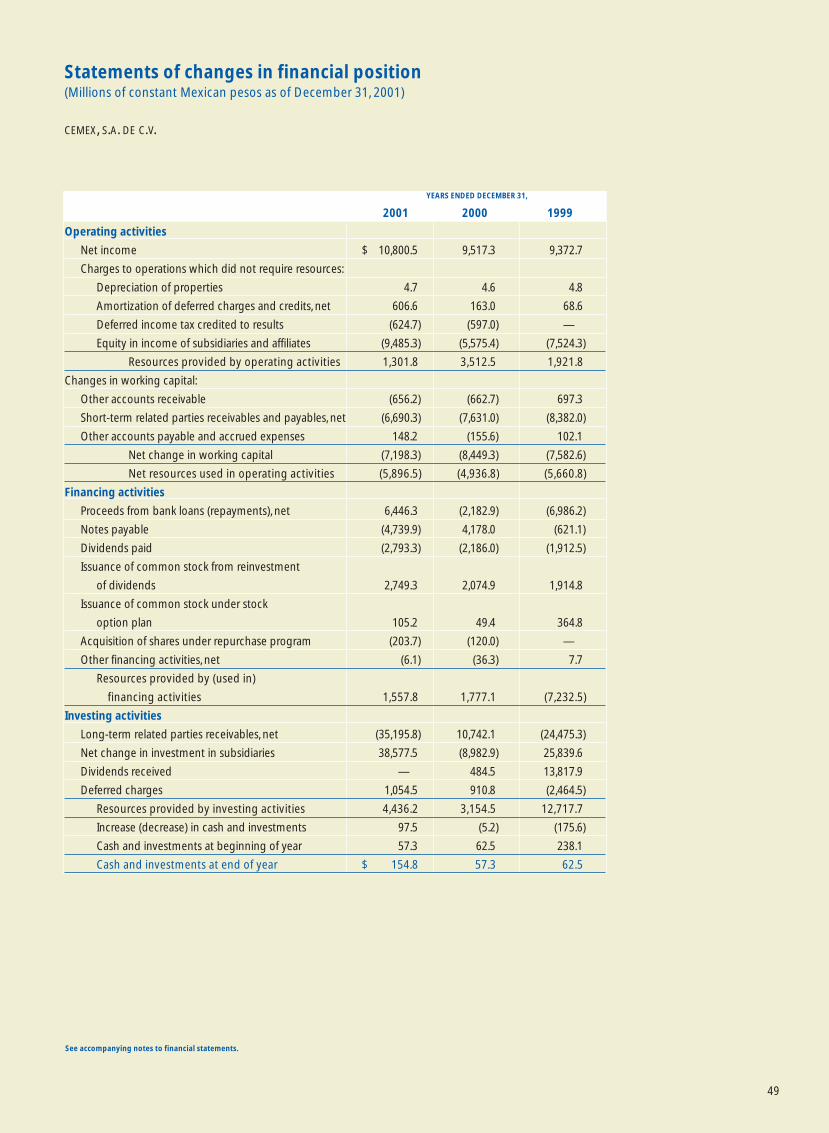
49
Statements of changes in financial position(Millions of constant Mexican pesos as of December 31, 2001)
CEMEX, S.A. DE C.V.
See accompanying notes to financial statements.
YEARS ENDED DECEMBER 31,
2001 2000 1999
Operating activities
Net income $ 10,800.5 9,517.3 9,372.7
Charges to operations which did not require resources:
Depreciation of properties 4.7 4.6 4.8
Amortization of deferred charges and credits, net 606.6 163.0 68.6
Deferred income tax credited to results (624.7) (597.0) —
Equity in income of subsidiaries and affiliates (9,485.3) (5,575.4) (7,524.3)
Resources provided by operating activities 1,301.8 3,512.5 1,921.8
Changes in working capital:
Other accounts receivable (656.2) (662.7) 697.3
Short-term related parties receivables and payables, net (6,690.3) (7,631.0) (8,382.0)
Other accounts payable and accrued expenses 148.2 (155.6) 102.1
Net change in working capital (7,198.3) (8,449.3) (7,582.6)
Net resources used in operating activities (5,896.5) (4,936.8) (5,660.8)
Financing activities
Proceeds from bank loans (repayments), net 6,446.3 (2,182.9) (6,986.2)
Notes payable (4,739.9) 4,178.0 (621.1)
Dividends paid (2,793.3) (2,186.0) (1,912.5)
Issuance of common stock from reinvestment
of dividends 2,749.3 2,074.9 1,914.8
Issuance of common stock under stock
option plan 105.2 49.4 364.8
Acquisition of shares under repurchase program (203.7) (120.0) —
Other financing activities, net (6.1) (36.3) 7.7
Resources provided by (used in)
financing activities 1,557.8 1,777.1 (7,232.5)
Investing activities
Long-term related parties receivables, net (35,195.8) 10,742.1 (24,475.3)
Net change in investment in subsidiaries 38,577.5 (8,982.9) 25,839.6
Dividends received — 484.5 13,817.9
Deferred charges 1,054.5 910.8 (2,464.5)
Resources provided by investing activities 4,436.2 3,154.5 12,717.7
Increase (decrease) in cash and investments 97.5 (5.2) (175.6)
Cash and investments at beginning of year 57.3 62.5 238.1
Cash and investments at end of year $ 154.8 57.3 62.5
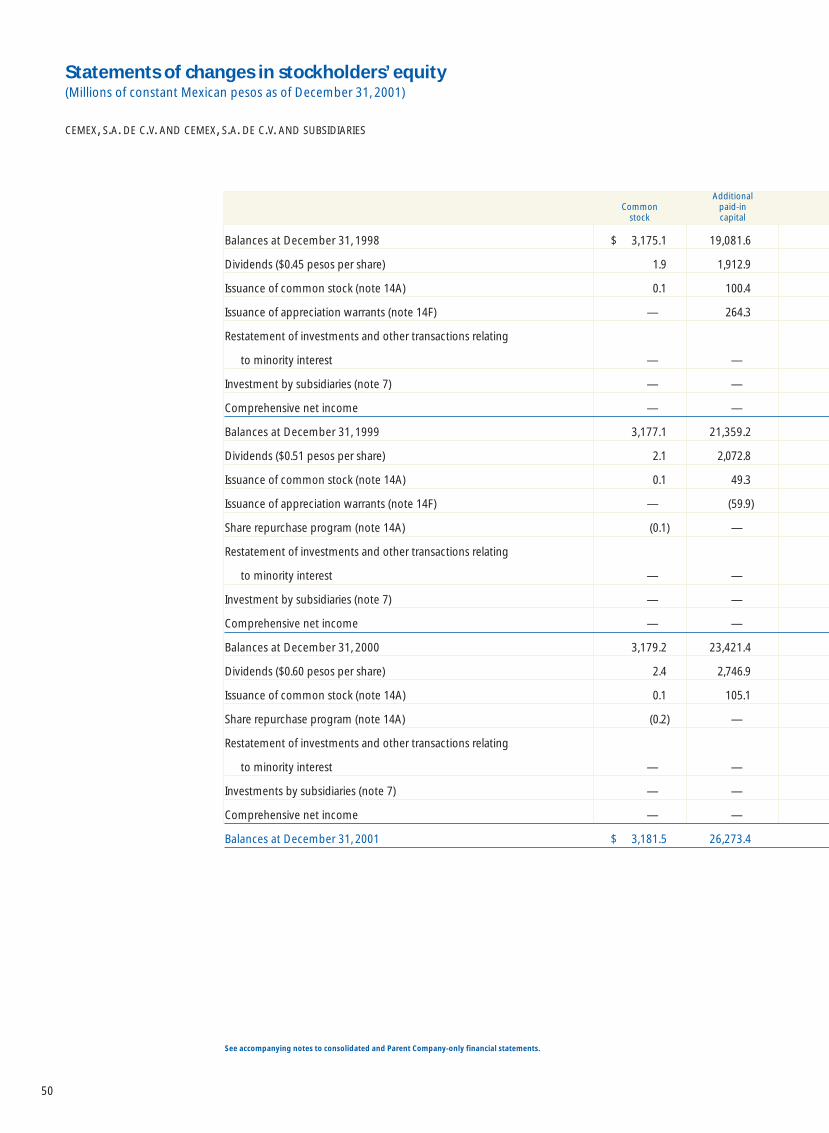
50
Statements of changes in stockholders’ equity(Millions of constant Mexican pesos as of December 31, 2001)
CEMEX, S.A. DE C.V. AND CEMEX, S.A. DE C.V. AND SUBSIDIARIES
See accompanying notes to consolidated and Parent Company-only financial statements.
AdditionalCommon paid-in
stock capital
Balances at December 31, 1998 $ 3,175.1 19,081.6
Dividends ($0.45 pesos per share) 1.9 1,912.9
Issuance of common stock (note 14A) 0.1 100.4
Issuance of appreciation warrants (note 14F) — 264.3
Restatement of investments and other transactions relating
to minority interest — —
Investment by subsidiaries (note 7) — —
Comprehensive net income — —
Balances at December 31, 1999 3,177.1 21,359.2
Dividends ($0.51 pesos per share) 2.1 2,072.8
Issuance of common stock (note 14A) 0.1 49.3
Issuance of appreciation warrants (note 14F) — (59.9)
Share repurchase program (note 14A) (0.1) —
Restatement of investments and other transactions relating
to minority interest — —
Investment by subsidiaries (note 7) — —
Comprehensive net income — —
Balances at December 31, 2000 3,179.2 23,421.4
Dividends ($0.60 pesos per share) 2.4 2,746.9
Issuance of common stock (note 14A) 0.1 105.1
Share repurchase program (note 14A) (0.2) —
Restatement of investments and other transactions relating
to minority interest — —
Investments by subsidiaries (note 7) — —
Comprehensive net income — —
Balances at December 31, 2001 $ 3,181.5 26,273.4
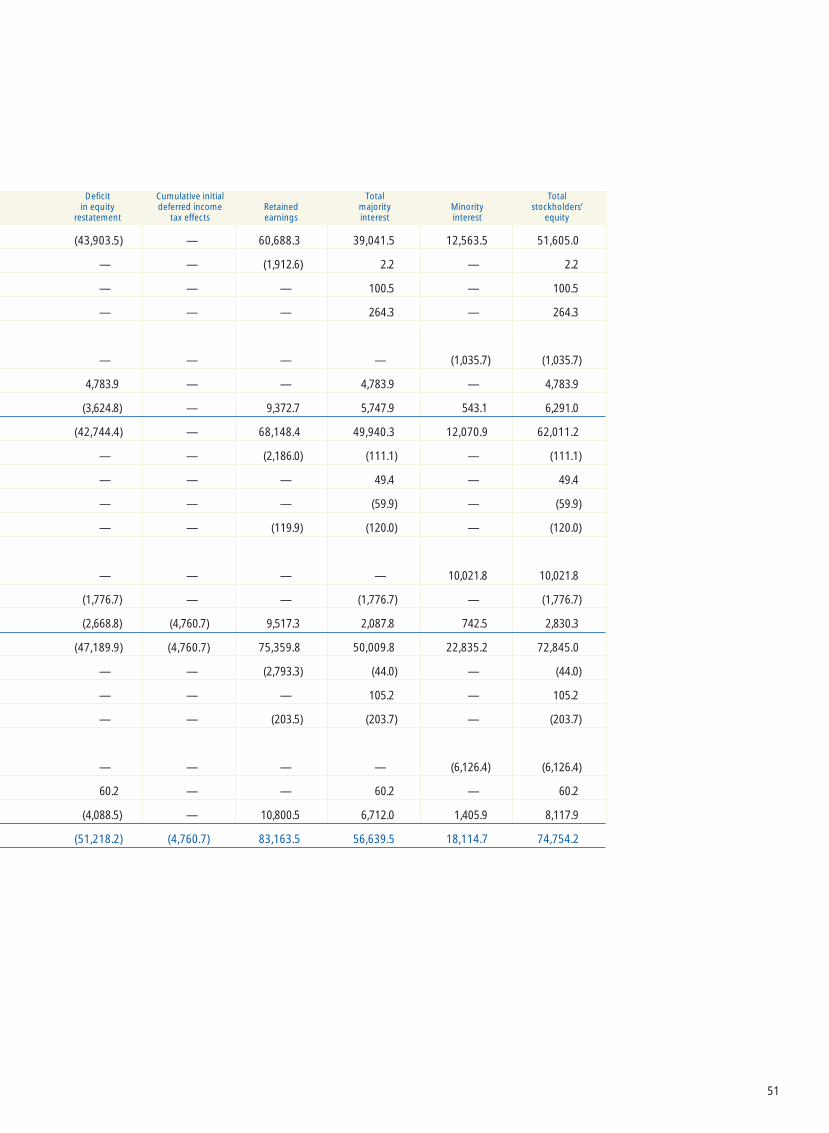
51
Deficit Cumulative initial Total Totalin equity deferred income Retained majority Minority stockholders’
restatement tax effects earnings interest interest equity
(43,903.5) — 60,688.3 39,041.5 12,563.5 51,605.0
— — (1,912.6) 2.2 — 2.2
— — — 100.5 — 100.5
— — — 264.3 — 264.3
— — — — (1,035.7) (1,035.7)
4,783.9 — — 4,783.9 — 4,783.9
(3,624.8) — 9,372.7 5,747.9 543.1 6,291.0
(42,744.4) — 68,148.4 49,940.3 12,070.9 62,011.2
— — (2,186.0) (111.1) — (111.1)
— — — 49.4 — 49.4
— — — (59.9) — (59.9)
— — (119.9) (120.0) — (120.0)
— — — — 10,021.8 10,021.8
(1,776.7) — — (1,776.7) — (1,776.7)
(2,668.8) (4,760.7) 9,517.3 2,087.8 742.5 2,830.3
(47,189.9) (4,760.7) 75,359.8 50,009.8 22,835.2 72,845.0
— — (2,793.3) (44.0) — (44.0)
— — — 105.2 — 105.2
— — (203.5) (203.7) — (203.7)
— — — — (6,126.4) (6,126.4)
60.2 — — 60.2 — 60.2
(4,088.5) — 10,800.5 6,712.0 1,405.9 8,117.9
(51,218.2) (4,760.7) 83,163.5 56,639.5 18,114.7 74,754.2
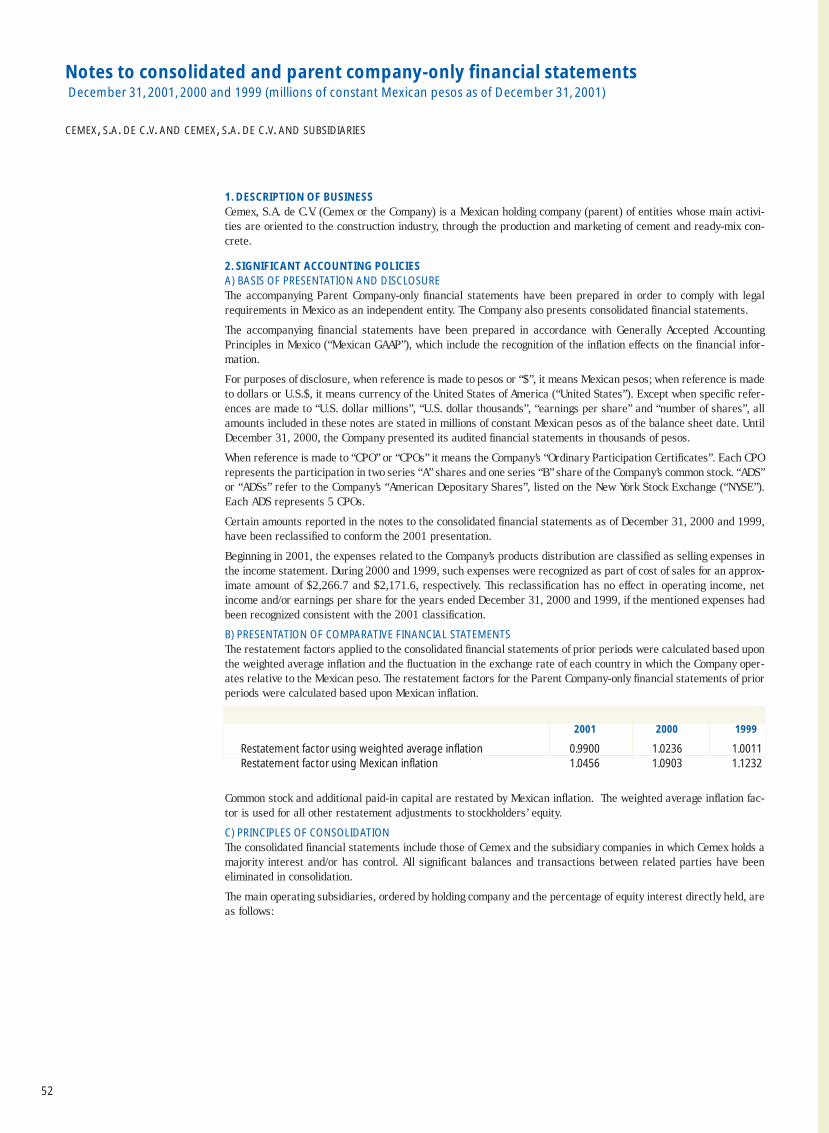
1. DESCRIPTION OF BUSINESSCemex, S.A. de C.V. (Cemex or the Company) is a Mexican holding company (parent) of entities whose main activi-ties are oriented to the construction industry, through the production and marketing of cement and ready-mix con-crete.
2. SIGNIFICANT ACCOUNTING POLICIESA) BASIS OF PRESENTATION AND DISCLOSUREThe accompanying Parent Company-only financial statements have been prepared in order to comply with legalrequirements in Mexico as an independent entity. The Company also presents consolidated financial statements.
The accompanying financial statements have been prepared in accordance with Generally Accepted AccountingPrinciples in Mexico (“Mexican GAAP”), which include the recognition of the inflation effects on the financial infor-mation.
For purposes of disclosure, when reference is made to pesos or “$”, it means Mexican pesos; when reference is madeto dollars or U.S.$, it means currency of the United States of America (“United States”). Except when specific refer-ences are made to “U.S. dollar millions”, “U.S. dollar thousands”, “earnings per share” and “number of shares”, allamounts included in these notes are stated in millions of constant Mexican pesos as of the balance sheet date. UntilDecember 31, 2000, the Company presented its audited financial statements in thousands of pesos.
When reference is made to “CPO” or “CPOs” it means the Company’s “Ordinary Participation Certificates”. Each CPOrepresents the participation in two series “A” shares and one series “B” share of the Company’s common stock. “ADS”or “ADSs” refer to the Company’s “American Depositary Shares”, listed on the New York Stock Exchange (“NYSE”).Each ADS represents 5 CPOs.
Certain amounts reported in the notes to the consolidated financial statements as of December 31, 2000 and 1999,have been reclassified to conform the 2001 presentation.
Beginning in 2001, the expenses related to the Company’s products distribution are classified as selling expenses inthe income statement. During 2000 and 1999, such expenses were recognized as part of cost of sales for an approx-imate amount of $2,266.7 and $2,171.6, respectively. This reclassification has no effect in operating income, netincome and/or earnings per share for the years ended December 31, 2000 and 1999, if the mentioned expenses hadbeen recognized consistent with the 2001 classification.
B) PRESENTATION OF COMPARATIVE FINANCIAL STATEMENTSThe restatement factors applied to the consolidated financial statements of prior periods were calculated based uponthe weighted average inflation and the fluctuation in the exchange rate of each country in which the Company oper-ates relative to the Mexican peso. The restatement factors for the Parent Company-only financial statements of priorperiods were calculated based upon Mexican inflation.
2001 2000 1999
Restatement factor using weighted average inflation 0.9900 1.0236 1.0011Restatement factor using Mexican inflation 1.0456 1.0903 1.1232
Common stock and additional paid-in capital are restated by Mexican inflation. The weighted average inflation fac-tor is used for all other restatement adjustments to stockholders’ equity.
C) PRINCIPLES OF CONSOLIDATIONThe consolidated financial statements include those of Cemex and the subsidiary companies in which Cemex holds amajority interest and/or has control. All significant balances and transactions between related parties have beeneliminated in consolidation.
The main operating subsidiaries, ordered by holding company and the percentage of equity interest directly held, areas follows:
52
Notes to consolidated and parent company-only financial statementsDecember 31, 2001, 2000 and 1999 (millions of constant Mexican pesos as of December 31, 2001)
CEMEX, S.A. DE C.V. AND CEMEX, S.A. DE C.V. AND SUBSIDIARIES
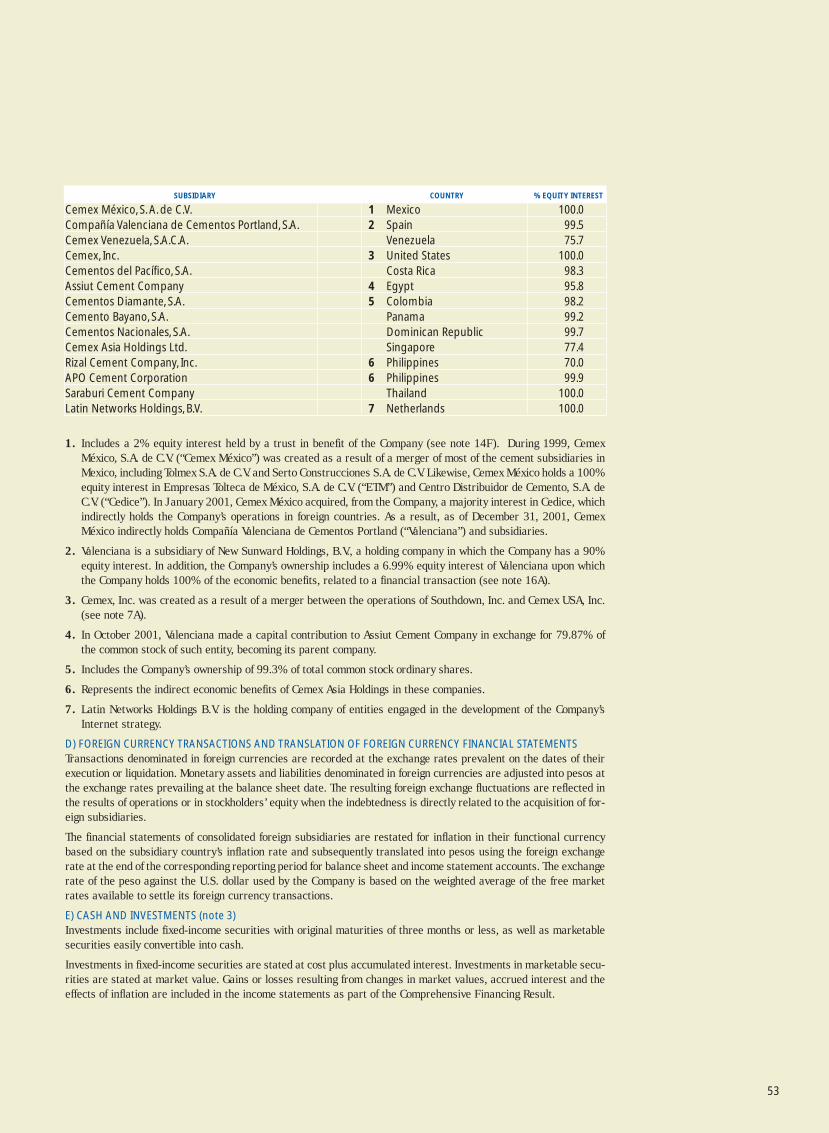
SUBSIDIARY COUNTRY % EQUITY INTEREST
Cemex México, S. A. de C.V. 1 Mexico 100.0Compañía Valenciana de Cementos Portland, S.A. 2 Spain 99.5Cemex Venezuela, S.A.C.A. Venezuela 75.7Cemex, Inc. 3 United States 100.0Cementos del Pacífico, S.A. Costa Rica 98.3Assiut Cement Company 4 Egypt 95.8Cementos Diamante, S.A. 5 Colombia 98.2Cemento Bayano, S.A. Panama 99.2Cementos Nacionales, S.A. Dominican Republic 99.7Cemex Asia Holdings Ltd. Singapore 77.4Rizal Cement Company, Inc. 6 Philippines 70.0APO Cement Corporation 6 Philippines 99.9Saraburi Cement Company Thailand 100.0Latin Networks Holdings, B.V. 7 Netherlands 100.0
1. Includes a 2% equity interest held by a trust in benefit of the Company (see note 14F). During 1999, CemexMéxico, S.A. de C.V. (“Cemex México”) was created as a result of a merger of most of the cement subsidiaries inMexico, including Tolmex S.A. de C.V. and Serto Construcciones S.A. de C.V. Likewise, Cemex México holds a 100%equity interest in Empresas Tolteca de México, S.A. de C.V. (“ETM”) and Centro Distribuidor de Cemento, S.A. deC.V. (“Cedice”). In January 2001, Cemex México acquired, from the Company, a majority interest in Cedice, whichindirectly holds the Company’s operations in foreign countries. As a result, as of December 31, 2001, CemexMéxico indirectly holds Compañía Valenciana de Cementos Portland (“Valenciana”) and subsidiaries.
2. Valenciana is a subsidiary of New Sunward Holdings, B.V., a holding company in which the Company has a 90%equity interest. In addition, the Company’s ownership includes a 6.99% equity interest of Valenciana upon whichthe Company holds 100% of the economic benefits, related to a financial transaction (see note 16A).
3. Cemex, Inc. was created as a result of a merger between the operations of Southdown, Inc. and Cemex USA, Inc.(see note 7A).
4. In October 2001, Valenciana made a capital contribution to Assiut Cement Company in exchange for 79.87% ofthe common stock of such entity, becoming its parent company.
5. Includes the Company’s ownership of 99.3% of total common stock ordinary shares.
6. Represents the indirect economic benefits of Cemex Asia Holdings in these companies.
7. Latin Networks Holdings B.V. is the holding company of entities engaged in the development of the Company’sInternet strategy.
D) FOREIGN CURRENCY TRANSACTIONS AND TRANSLATION OF FOREIGN CURRENCY FINANCIAL STATEMENTSTransactions denominated in foreign currencies are recorded at the exchange rates prevalent on the dates of theirexecution or liquidation. Monetary assets and liabilities denominated in foreign currencies are adjusted into pesos atthe exchange rates prevailing at the balance sheet date. The resulting foreign exchange fluctuations are reflected inthe results of operations or in stockholders’ equity when the indebtedness is directly related to the acquisition of for-eign subsidiaries.
The financial statements of consolidated foreign subsidiaries are restated for inflation in their functional currencybased on the subsidiary country’s inflation rate and subsequently translated into pesos using the foreign exchangerate at the end of the corresponding reporting period for balance sheet and income statement accounts. The exchangerate of the peso against the U.S. dollar used by the Company is based on the weighted average of the free marketrates available to settle its foreign currency transactions.
E) CASH AND INVESTMENTS (note 3)Investments include fixed-income securities with original maturities of three months or less, as well as marketablesecurities easily convertible into cash.
Investments in fixed-income securities are stated at cost plus accumulated interest. Investments in marketable secu-rities are stated at market value. Gains or losses resulting from changes in market values, accrued interest and theeffects of inflation are included in the income statements as part of the Comprehensive Financing Result.
53
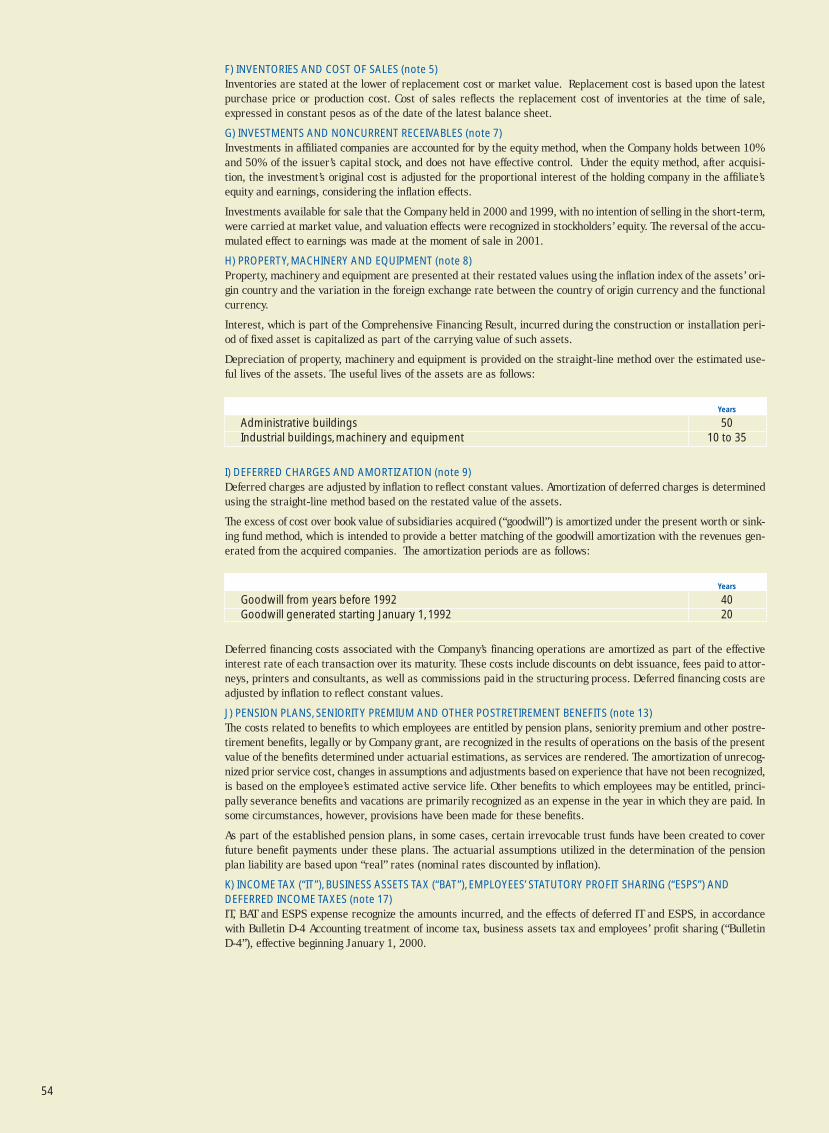
54
F) INVENTORIES AND COST OF SALES (note 5)Inventories are stated at the lower of replacement cost or market value. Replacement cost is based upon the latestpurchase price or production cost. Cost of sales reflects the replacement cost of inventories at the time of sale,expressed in constant pesos as of the date of the latest balance sheet.
G) INVESTMENTS AND NONCURRENT RECEIVABLES (note 7)Investments in affiliated companies are accounted for by the equity method, when the Company holds between 10%and 50% of the issuer’s capital stock, and does not have effective control. Under the equity method, after acquisi-tion, the investment’s original cost is adjusted for the proportional interest of the holding company in the affiliate’sequity and earnings, considering the inflation effects.
Investments available for sale that the Company held in 2000 and 1999, with no intention of selling in the short-term,were carried at market value, and valuation effects were recognized in stockholders’ equity. The reversal of the accu-mulated effect to earnings was made at the moment of sale in 2001.
H) PROPERTY, MACHINERY AND EQUIPMENT (note 8)Property, machinery and equipment are presented at their restated values using the inflation index of the assets’ ori-gin country and the variation in the foreign exchange rate between the country of origin currency and the functionalcurrency.
Interest, which is part of the Comprehensive Financing Result, incurred during the construction or installation peri-od of fixed asset is capitalized as part of the carrying value of such assets.
Depreciation of property, machinery and equipment is provided on the straight-line method over the estimated use-ful lives of the assets. The useful lives of the assets are as follows:
Years
Administrative buildings 50Industrial buildings, machinery and equipment 10 to 35
I) DEFERRED CHARGES AND AMORTIZATION (note 9)Deferred charges are adjusted by inflation to reflect constant values. Amortization of deferred charges is determinedusing the straight-line method based on the restated value of the assets.
The excess of cost over book value of subsidiaries acquired (“goodwill”) is amortized under the present worth or sink-ing fund method, which is intended to provide a better matching of the goodwill amortization with the revenues gen-erated from the acquired companies. The amortization periods are as follows:
Years
Goodwill from years before 1992 40Goodwill generated starting January 1, 1992 20
Deferred financing costs associated with the Company’s financing operations are amortized as part of the effectiveinterest rate of each transaction over its maturity. These costs include discounts on debt issuance, fees paid to attor-neys, printers and consultants, as well as commissions paid in the structuring process. Deferred financing costs areadjusted by inflation to reflect constant values.
J) PENSION PLANS, SENIORITY PREMIUM AND OTHER POSTRETIREMENT BENEFITS (note 13)The costs related to benefits to which employees are entitled by pension plans, seniority premium and other postre-tirement benefits, legally or by Company grant, are recognized in the results of operations on the basis of the presentvalue of the benefits determined under actuarial estimations, as services are rendered. The amortization of unrecog-nized prior service cost, changes in assumptions and adjustments based on experience that have not been recognized,is based on the employee’s estimated active service life. Other benefits to which employees may be entitled, princi-pally severance benefits and vacations are primarily recognized as an expense in the year in which they are paid. Insome circumstances, however, provisions have been made for these benefits.
As part of the established pension plans, in some cases, certain irrevocable trust funds have been created to coverfuture benefit payments under these plans. The actuarial assumptions utilized in the determination of the pensionplan liability are based upon “real” rates (nominal rates discounted by inflation).
K) INCOME TAX (“IT”), BUSINESS ASSETS TAX (“BAT”), EMPLOYEES’ STATUTORY PROFIT SHARING (“ESPS”) ANDDEFERRED INCOME TAXES (note 17) IT, BAT and ESPS expense recognize the amounts incurred, and the effects of deferred IT and ESPS, in accordancewith Bulletin D-4 Accounting treatment of income tax, business assets tax and employees’ profit sharing (“BulletinD-4”), effective beginning January 1, 2000.
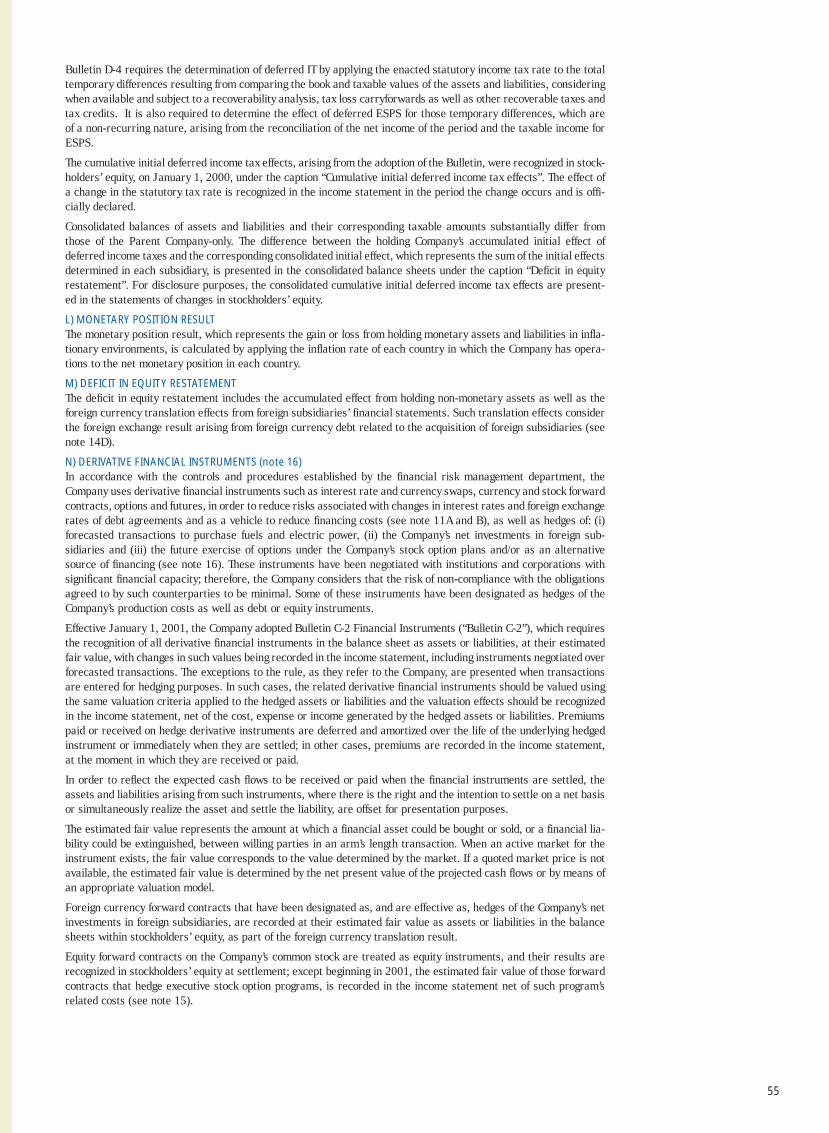
55
Bulletin D-4 requires the determination of deferred IT by applying the enacted statutory income tax rate to the totaltemporary differences resulting from comparing the book and taxable values of the assets and liabilities, consideringwhen available and subject to a recoverability analysis, tax loss carryforwards as well as other recoverable taxes andtax credits. It is also required to determine the effect of deferred ESPS for those temporary differences, which areof a non-recurring nature, arising from the reconciliation of the net income of the period and the taxable income forESPS.
The cumulative initial deferred income tax effects, arising from the adoption of the Bulletin, were recognized in stock-holders’ equity, on January 1, 2000, under the caption “Cumulative initial deferred income tax effects”. The effect ofa change in the statutory tax rate is recognized in the income statement in the period the change occurs and is offi-cially declared.
Consolidated balances of assets and liabilities and their corresponding taxable amounts substantially differ fromthose of the Parent Company-only. The difference between the holding Company’s accumulated initial effect ofdeferred income taxes and the corresponding consolidated initial effect, which represents the sum of the initial effectsdetermined in each subsidiary, is presented in the consolidated balance sheets under the caption “Deficit in equityrestatement”. For disclosure purposes, the consolidated cumulative initial deferred income tax effects are present-ed in the statements of changes in stockholders’ equity.
L) MONETARY POSITION RESULTThe monetary position result, which represents the gain or loss from holding monetary assets and liabilities in infla-tionary environments, is calculated by applying the inflation rate of each country in which the Company has opera-tions to the net monetary position in each country.
M) DEFICIT IN EQUITY RESTATEMENTThe deficit in equity restatement includes the accumulated effect from holding non-monetary assets as well as theforeign currency translation effects from foreign subsidiaries’ financial statements. Such translation effects considerthe foreign exchange result arising from foreign currency debt related to the acquisition of foreign subsidiaries (seenote 14D).
N) DERIVATIVE FINANCIAL INSTRUMENTS (note 16)In accordance with the controls and procedures established by the financial risk management department, theCompany uses derivative financial instruments such as interest rate and currency swaps, currency and stock forwardcontracts, options and futures, in order to reduce risks associated with changes in interest rates and foreign exchangerates of debt agreements and as a vehicle to reduce financing costs (see note 11A and B), as well as hedges of: (i)forecasted transactions to purchase fuels and electric power, (ii) the Company’s net investments in foreign sub-sidiaries and (iii) the future exercise of options under the Company’s stock option plans and/or as an alternativesource of financing (see note 16). These instruments have been negotiated with institutions and corporations withsignificant financial capacity; therefore, the Company considers that the risk of non-compliance with the obligationsagreed to by such counterparties to be minimal. Some of these instruments have been designated as hedges of theCompany’s production costs as well as debt or equity instruments.
Effective January 1, 2001, the Company adopted Bulletin C-2 Financial Instruments (“Bulletin C-2”), which requiresthe recognition of all derivative financial instruments in the balance sheet as assets or liabilities, at their estimatedfair value, with changes in such values being recorded in the income statement, including instruments negotiated overforecasted transactions. The exceptions to the rule, as they refer to the Company, are presented when transactionsare entered for hedging purposes. In such cases, the related derivative financial instruments should be valued usingthe same valuation criteria applied to the hedged assets or liabilities and the valuation effects should be recognizedin the income statement, net of the cost, expense or income generated by the hedged assets or liabilities. Premiumspaid or received on hedge derivative instruments are deferred and amortized over the life of the underlying hedgedinstrument or immediately when they are settled; in other cases, premiums are recorded in the income statement,at the moment in which they are received or paid.
In order to reflect the expected cash flows to be received or paid when the financial instruments are settled, theassets and liabilities arising from such instruments, where there is the right and the intention to settle on a net basisor simultaneously realize the asset and settle the liability, are offset for presentation purposes.
The estimated fair value represents the amount at which a financial asset could be bought or sold, or a financial lia-bility could be extinguished, between willing parties in an arm’s length transaction. When an active market for theinstrument exists, the fair value corresponds to the value determined by the market. If a quoted market price is notavailable, the estimated fair value is determined by the net present value of the projected cash flows or by means ofan appropriate valuation model.
Foreign currency forward contracts that have been designated as, and are effective as, hedges of the Company’s netinvestments in foreign subsidiaries, are recorded at their estimated fair value as assets or liabilities in the balancesheets within stockholders’ equity, as part of the foreign currency translation result.
Equity forward contracts on the Company’s common stock are treated as equity instruments, and their results arerecognized in stockholders’ equity at settlement; except beginning in 2001, the estimated fair value of those forwardcontracts that hedge executive stock option programs, is recorded in the income statement net of such program’srelated costs (see note 15).
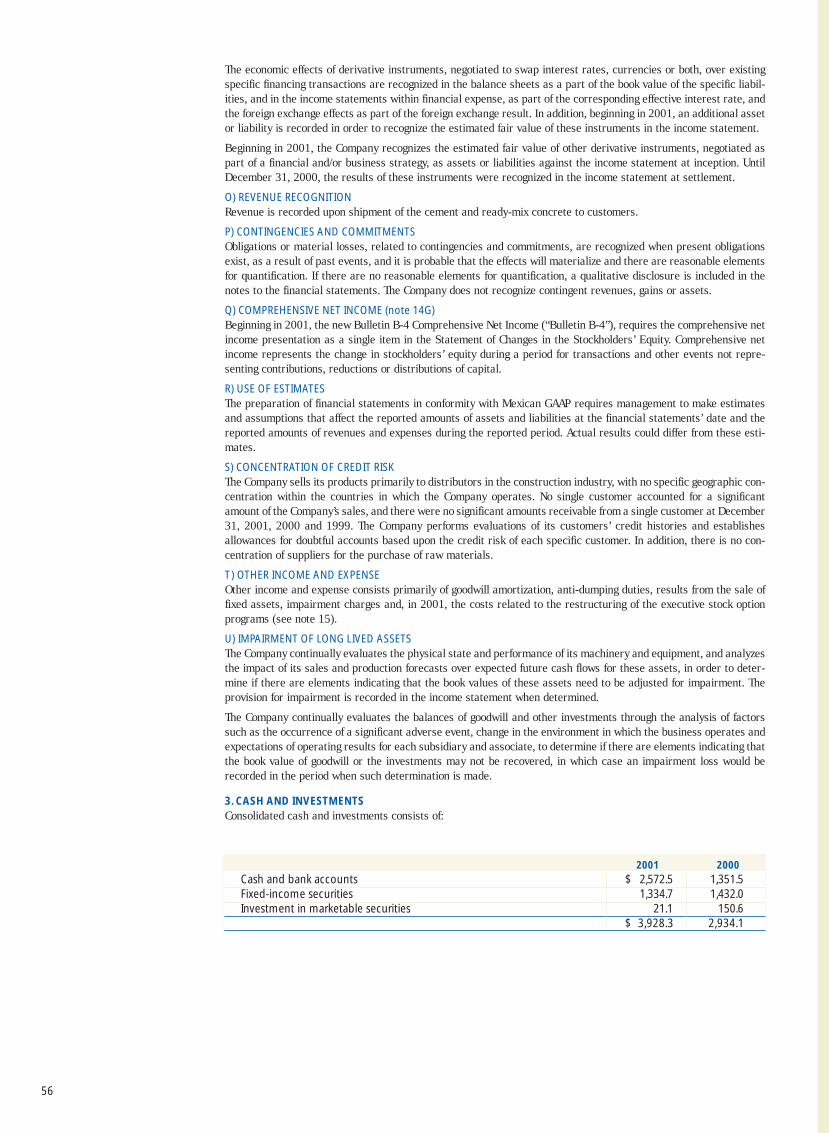
56
The economic effects of derivative instruments, negotiated to swap interest rates, currencies or both, over existingspecific financing transactions are recognized in the balance sheets as a part of the book value of the specific liabil-ities, and in the income statements within financial expense, as part of the corresponding effective interest rate, andthe foreign exchange effects as part of the foreign exchange result. In addition, beginning in 2001, an additional assetor liability is recorded in order to recognize the estimated fair value of these instruments in the income statement.
Beginning in 2001, the Company recognizes the estimated fair value of other derivative instruments, negotiated aspart of a financial and/or business strategy, as assets or liabilities against the income statement at inception. UntilDecember 31, 2000, the results of these instruments were recognized in the income statement at settlement.
O) REVENUE RECOGNITIONRevenue is recorded upon shipment of the cement and ready-mix concrete to customers.
P) CONTINGENCIES AND COMMITMENTSObligations or material losses, related to contingencies and commitments, are recognized when present obligationsexist, as a result of past events, and it is probable that the effects will materialize and there are reasonable elementsfor quantification. If there are no reasonable elements for quantification, a qualitative disclosure is included in thenotes to the financial statements. The Company does not recognize contingent revenues, gains or assets.
Q) COMPREHENSIVE NET INCOME (note 14G)Beginning in 2001, the new Bulletin B-4 Comprehensive Net Income (“Bulletin B-4”), requires the comprehensive netincome presentation as a single item in the Statement of Changes in the Stockholders’ Equity. Comprehensive netincome represents the change in stockholders’ equity during a period for transactions and other events not repre-senting contributions, reductions or distributions of capital.
R) USE OF ESTIMATES The preparation of financial statements in conformity with Mexican GAAP requires management to make estimatesand assumptions that affect the reported amounts of assets and liabilities at the financial statements’ date and thereported amounts of revenues and expenses during the reported period. Actual results could differ from these esti-mates.
S) CONCENTRATION OF CREDIT RISKThe Company sells its products primarily to distributors in the construction industry, with no specific geographic con-centration within the countries in which the Company operates. No single customer accounted for a significantamount of the Company’s sales, and there were no significant amounts receivable from a single customer at December31, 2001, 2000 and 1999. The Company performs evaluations of its customers’ credit histories and establishesallowances for doubtful accounts based upon the credit risk of each specific customer. In addition, there is no con-centration of suppliers for the purchase of raw materials.
T) OTHER INCOME AND EXPENSEOther income and expense consists primarily of goodwill amortization, anti-dumping duties, results from the sale offixed assets, impairment charges and, in 2001, the costs related to the restructuring of the executive stock optionprograms (see note 15).
U) IMPAIRMENT OF LONG LIVED ASSETSThe Company continually evaluates the physical state and performance of its machinery and equipment, and analyzesthe impact of its sales and production forecasts over expected future cash flows for these assets, in order to deter-mine if there are elements indicating that the book values of these assets need to be adjusted for impairment. Theprovision for impairment is recorded in the income statement when determined.
The Company continually evaluates the balances of goodwill and other investments through the analysis of factorssuch as the occurrence of a significant adverse event, change in the environment in which the business operates andexpectations of operating results for each subsidiary and associate, to determine if there are elements indicating thatthe book value of goodwill or the investments may not be recovered, in which case an impairment loss would berecorded in the period when such determination is made.
3. CASH AND INVESTMENTSConsolidated cash and investments consists of:
2001 2000
Cash and bank accounts $ 2,572.5 1,351.5Fixed-income securities 1,334.7 1,432.0Investment in marketable securities 21.1 150.6
$ 3,928.3 2,934.1

57
4. OTHER RECEIVABLESOther current receivables consist of:
2001 2000
CONSOLIDATED PARENT CONSOLIDATED PARENT
Non-trade receivables $ 2,976.0 125.2 1,838.5 93.9 Refundable income tax 909.6 1,193.3 236.3 592.8 Other refundable taxes 143.2 85.9 74.4 —
$ 4,028.8 1,404.4 2,149.2 686.7
As of December 31, 2001 and 2000, non-trade receivables primarily consist of interest receivable, notes receivable,advances to employees for travel expenses, loans made to employees and receivables from the sale of assets. In addi-tion, as of December 31, 2001, other receivables include advance payments toward the final price of forward con-tracts that will be settled at maturity, for an approximate amount of $1,392.0 (see note 16A).
5. INVENTORIESInventories are summarized as follows:
CONSOLIDATED
2001 2000
Finished goods $ 1,782.6 1,921.5 Work-in-process 729.3 859.4 Raw materials 621.5 721.0 Supplies and spare parts 2,648.7 2,882.5 Advances to suppliers 305.8 198.4 Inventory in transit 155.7 152.0 Real estate held for sale — 94.0
$ 6,243.6 6,828.8
As of December 31, 2000, real estate held for sale consisted of undeveloped land in different locations in Mexico,originally acquired by the Company for tourism projects. In June 2000, the Company sold real estate in PuertoVallarta, Mexico for $28.9, resulting a net loss of $25.3, which was included in other expenses, net. As of December31, 2001, real estate held for sale for an amount of $99.5 was reclassified to other current assets, as part of the non-cement related assets (see note 6).
6. OTHER CURRENT ASSETSOther current assets include $318.2 and $103.4, as of December 31, 2001 and 2000, respectively, of non-cementrelated assets which are intended to be sold in the short-term, and that are stated at their estimated realizable value.These assets include securities and assets not oriented to the Company’s main activity, mainly originated from (i) non-cement related assets acquired in the purchase of foreign subsidiaries, (ii) diverse assets received from customersas payment of trade receivables, and (iii) as of December 31, 2001, real estate held for sale.
During 1999, the Company recognized in other expenses, net, a loss of approximately $200.2, from the partial saleof an uncompleted real estate project in Spain and a subsequent impairment provision of this asset, which at the timeof sale had a book value of approximately $426.4. The remaining book value for this asset was merged during 2000into Valenciana and is presented under property, machinery and equipment.
7. INVESTMENTS AND NONCURRENT RECEIVABLES A) INVESTMENTS IN SUBSIDIARIES AND AFFILIATED COMPANIESAs of December 31, 2001 and 2000, investments in subsidiaries and affiliated companies accounted for by the equi-ty method, are summarized as follows:
2001 2000
CONSOLIDATED PARENT CONSOLIDATED PARENT
Contribution or book value atacquisition date $ 2,674.8 7,908.4 3,510.7 39,807.5
Equity in income and other changesin stockholders’ equity of subsidiaries and affiliated companies 2,064.0 7,219.2 1,564.5 8,523.6
$ 4,738.8 15,127.6 5,075.2 48,331.1
Investment held by subsidiaries in the Company’s shares, amounting to $6,764.0 (146,868,013 CPOs and1,791,695 appreciation warrants) and $5,091.6 (147,777,454 CPOs and 3,361,585 appreciation warrants) as ofDecember 31, 2001 and 2000, respectively, are offset against majority interest stockholders’ equity in the accom-panying financial statements.
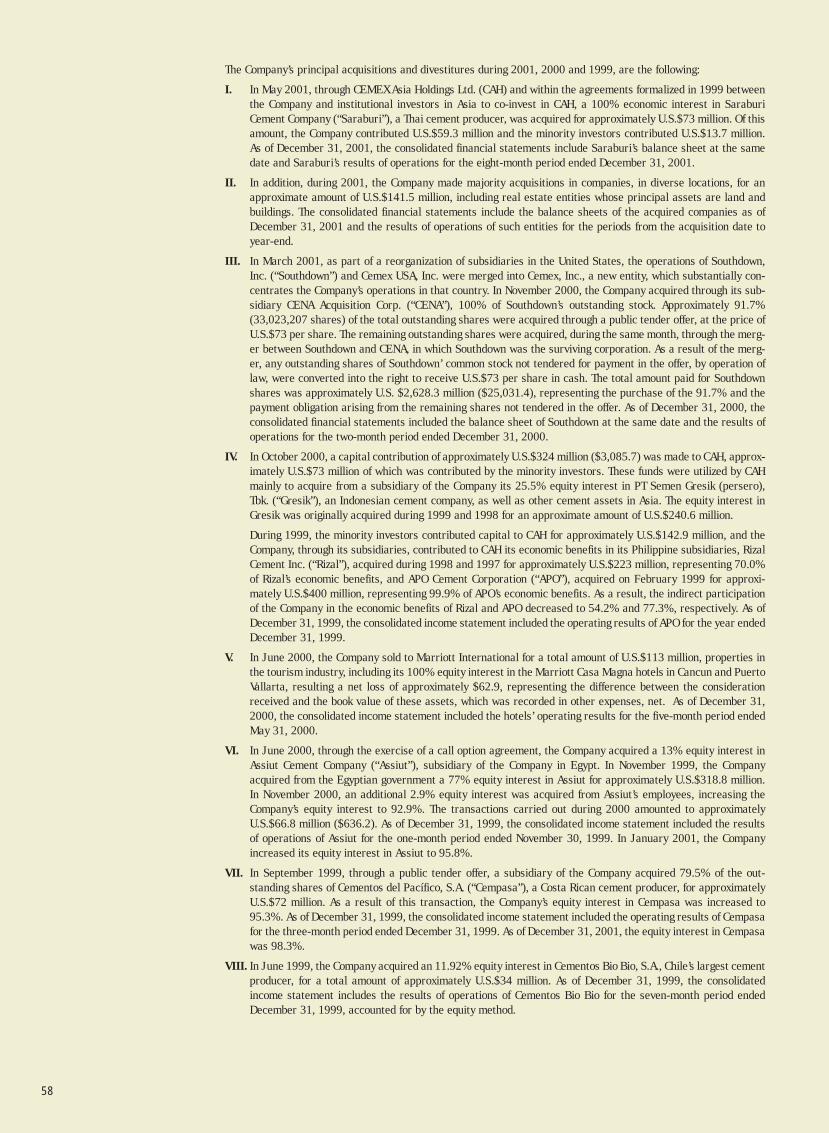
58
The Company’s principal acquisitions and divestitures during 2001, 2000 and 1999, are the following:
I. In May 2001, through CEMEX Asia Holdings Ltd. (CAH) and within the agreements formalized in 1999 betweenthe Company and institutional investors in Asia to co-invest in CAH, a 100% economic interest in SaraburiCement Company (“Saraburi”), a Thai cement producer, was acquired for approximately U.S.$73 million. Of thisamount, the Company contributed U.S.$59.3 million and the minority investors contributed U.S.$13.7 million.As of December 31, 2001, the consolidated financial statements include Saraburi’s balance sheet at the samedate and Saraburi’s results of operations for the eight-month period ended December 31, 2001.
II. In addition, during 2001, the Company made majority acquisitions in companies, in diverse locations, for anapproximate amount of U.S.$141.5 million, including real estate entities whose principal assets are land andbuildings. The consolidated financial statements include the balance sheets of the acquired companies as ofDecember 31, 2001 and the results of operations of such entities for the periods from the acquisition date toyear-end.
III. In March 2001, as part of a reorganization of subsidiaries in the United States, the operations of Southdown,Inc. (“Southdown”) and Cemex USA, Inc. were merged into Cemex, Inc., a new entity, which substantially con-centrates the Company’s operations in that country. In November 2000, the Company acquired through its sub-sidiary CENA Acquisition Corp. (“CENA”), 100% of Southdown’s outstanding stock. Approximately 91.7%(33,023,207 shares) of the total outstanding shares were acquired through a public tender offer, at the price ofU.S.$73 per share. The remaining outstanding shares were acquired, during the same month, through the merg-er between Southdown and CENA, in which Southdown was the surviving corporation. As a result of the merg-er, any outstanding shares of Southdown’ common stock not tendered for payment in the offer, by operation oflaw, were converted into the right to receive U.S.$73 per share in cash. The total amount paid for Southdownshares was approximately U.S. $2,628.3 million ($25,031.4), representing the purchase of the 91.7% and thepayment obligation arising from the remaining shares not tendered in the offer. As of December 31, 2000, theconsolidated financial statements included the balance sheet of Southdown at the same date and the results ofoperations for the two-month period ended December 31, 2000.
IV. In October 2000, a capital contribution of approximately U.S.$324 million ($3,085.7) was made to CAH, approx-imately U.S.$73 million of which was contributed by the minority investors. These funds were utilized by CAHmainly to acquire from a subsidiary of the Company its 25.5% equity interest in PT Semen Gresik (persero),Tbk. (“Gresik”), an Indonesian cement company, as well as other cement assets in Asia. The equity interest inGresik was originally acquired during 1999 and 1998 for an approximate amount of U.S.$240.6 million.
During 1999, the minority investors contributed capital to CAH for approximately U.S.$142.9 million, and theCompany, through its subsidiaries, contributed to CAH its economic benefits in its Philippine subsidiaries, RizalCement Inc. (“Rizal”), acquired during 1998 and 1997 for approximately U.S.$223 million, representing 70.0%of Rizal’s economic benefits, and APO Cement Corporation (“APO”), acquired on February 1999 for approxi-mately U.S.$400 million, representing 99.9% of APO’s economic benefits. As a result, the indirect participationof the Company in the economic benefits of Rizal and APO decreased to 54.2% and 77.3%, respectively. As ofDecember 31, 1999, the consolidated income statement included the operating results of APO for the year endedDecember 31, 1999.
V. In June 2000, the Company sold to Marriott International for a total amount of U.S.$113 million, properties inthe tourism industry, including its 100% equity interest in the Marriott Casa Magna hotels in Cancun and PuertoVallarta, resulting a net loss of approximately $62.9, representing the difference between the considerationreceived and the book value of these assets, which was recorded in other expenses, net. As of December 31,2000, the consolidated income statement included the hotels’ operating results for the five-month period endedMay 31, 2000.
VI. In June 2000, through the exercise of a call option agreement, the Company acquired a 13% equity interest inAssiut Cement Company (“Assiut”), subsidiary of the Company in Egypt. In November 1999, the Companyacquired from the Egyptian government a 77% equity interest in Assiut for approximately U.S.$318.8 million.In November 2000, an additional 2.9% equity interest was acquired from Assiut’s employees, increasing theCompany’s equity interest to 92.9%. The transactions carried out during 2000 amounted to approximatelyU.S.$66.8 million ($636.2). As of December 31, 1999, the consolidated income statement included the resultsof operations of Assiut for the one-month period ended November 30, 1999. In January 2001, the Companyincreased its equity interest in Assiut to 95.8%.
VII. In September 1999, through a public tender offer, a subsidiary of the Company acquired 79.5% of the out-standing shares of Cementos del Pacífico, S.A. (“Cempasa”), a Costa Rican cement producer, for approximatelyU.S.$72 million. As a result of this transaction, the Company’s equity interest in Cempasa was increased to95.3%. As of December 31, 1999, the consolidated income statement included the operating results of Cempasafor the three-month period ended December 31, 1999. As of December 31, 2001, the equity interest in Cempasawas 98.3%.
VIII. In June 1999, the Company acquired an 11.92% equity interest in Cementos Bio Bio, S.A., Chile’s largest cementproducer, for a total amount of approximately U.S.$34 million. As of December 31, 1999, the consolidatedincome statement includes the results of operations of Cementos Bio Bio for the seven-month period endedDecember 31, 1999, accounted for by the equity method.
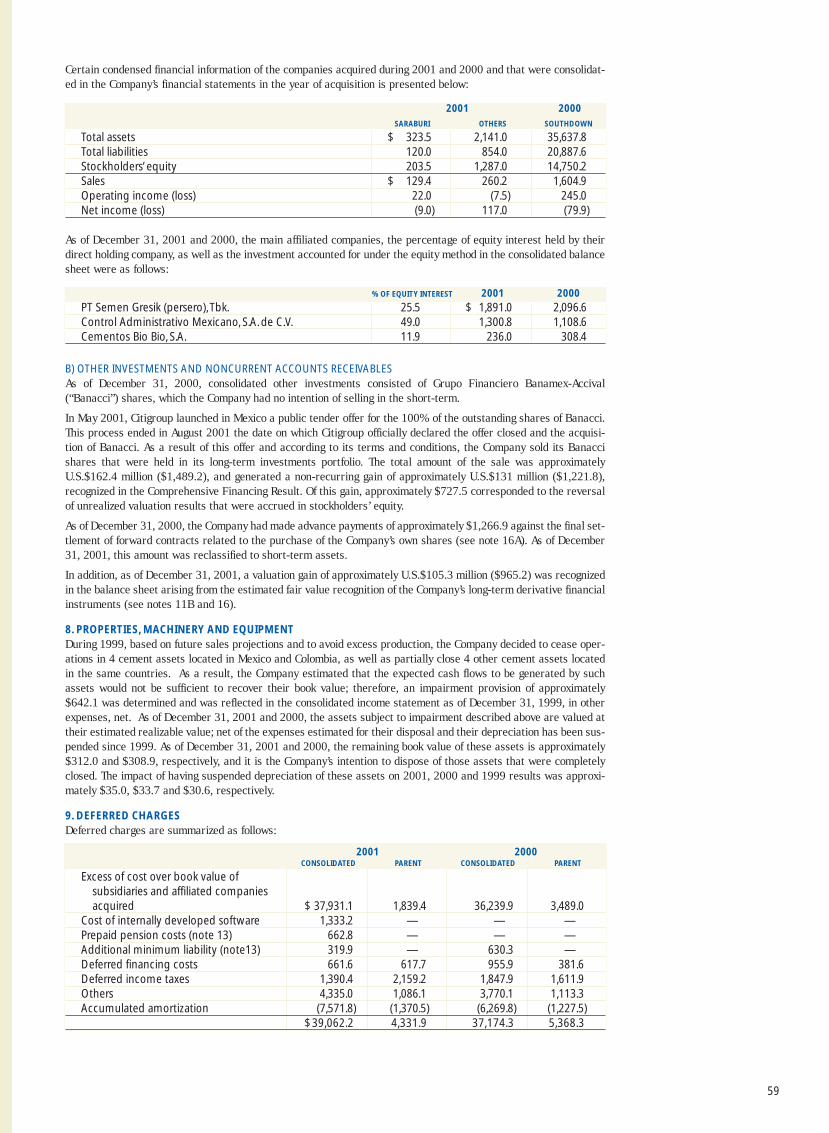
59
Certain condensed financial information of the companies acquired during 2001 and 2000 and that were consolidat-ed in the Company’s financial statements in the year of acquisition is presented below:
2001 2000
SARABURI OTHERS SOUTHDOWN
Total assets $ 323.5 2,141.0 35,637.8 Total liabilities 120.0 854.0 20,887.6 Stockholders’ equity 203.5 1,287.0 14,750.2 Sales $ 129.4 260.2 1,604.9 Operating income (loss) 22.0 (7.5) 245.0 Net income (loss) (9.0) 117.0 (79.9)
As of December 31, 2001 and 2000, the main affiliated companies, the percentage of equity interest held by theirdirect holding company, as well as the investment accounted for under the equity method in the consolidated balancesheet were as follows:
% OF EQUITY INTEREST 2001 2000
PT Semen Gresik (persero), Tbk. 25.5 $ 1,891.0 2,096.6 Control Administrativo Mexicano, S.A. de C.V. 49.0 1,300.8 1,108.6 Cementos Bio Bio, S.A. 11.9 236.0 308.4
B) OTHER INVESTMENTS AND NONCURRENT ACCOUNTS RECEIVABLESAs of December 31, 2000, consolidated other investments consisted of Grupo Financiero Banamex-Accival(“Banacci”) shares, which the Company had no intention of selling in the short-term.
In May 2001, Citigroup launched in Mexico a public tender offer for the 100% of the outstanding shares of Banacci.This process ended in August 2001 the date on which Citigroup officially declared the offer closed and the acquisi-tion of Banacci. As a result of this offer and according to its terms and conditions, the Company sold its Banaccishares that were held in its long-term investments portfolio. The total amount of the sale was approximatelyU.S.$162.4 million ($1,489.2), and generated a non-recurring gain of approximately U.S.$131 million ($1,221.8),recognized in the Comprehensive Financing Result. Of this gain, approximately $727.5 corresponded to the reversalof unrealized valuation results that were accrued in stockholders’ equity.
As of December 31, 2000, the Company had made advance payments of approximately $1,266.9 against the final set-tlement of forward contracts related to the purchase of the Company’s own shares (see note 16A). As of December31, 2001, this amount was reclassified to short-term assets.
In addition, as of December 31, 2001, a valuation gain of approximately U.S.$105.3 million ($965.2) was recognizedin the balance sheet arising from the estimated fair value recognition of the Company’s long-term derivative financialinstruments (see notes 11B and 16).
8. PROPERTIES, MACHINERY AND EQUIPMENTDuring 1999, based on future sales projections and to avoid excess production, the Company decided to cease oper-ations in 4 cement assets located in Mexico and Colombia, as well as partially close 4 other cement assets locatedin the same countries. As a result, the Company estimated that the expected cash flows to be generated by suchassets would not be sufficient to recover their book value; therefore, an impairment provision of approximately$642.1 was determined and was reflected in the consolidated income statement as of December 31, 1999, in otherexpenses, net. As of December 31, 2001 and 2000, the assets subject to impairment described above are valued attheir estimated realizable value; net of the expenses estimated for their disposal and their depreciation has been sus-pended since 1999. As of December 31, 2001 and 2000, the remaining book value of these assets is approximately$312.0 and $308.9, respectively, and it is the Company’s intention to dispose of those assets that were completelyclosed. The impact of having suspended depreciation of these assets on 2001, 2000 and 1999 results was approxi-mately $35.0, $33.7 and $30.6, respectively.
9. DEFERRED CHARGESDeferred charges are summarized as follows:
2001 2000CONSOLIDATED PARENT CONSOLIDATED PARENT
Excess of cost over book value ofsubsidiaries and affiliated companiesacquired $ 37,931.1 1,839.4 36,239.9 3,489.0
Cost of internally developed software 1,333.2 — — —Prepaid pension costs (note 13) 662.8 — — —Additional minimum liability (note13) 319.9 — 630.3 —Deferred financing costs 661.6 617.7 955.9 381.6 Deferred income taxes 1,390.4 2,159.2 1,847.9 1,611.9 Others 4,335.0 1,086.1 3,770.1 1,113.3 Accumulated amortization (7,571.8) (1,370.5) (6,269.8) (1,227.5)
$39,062.2 4,331.9 37,174.3 5,368.3
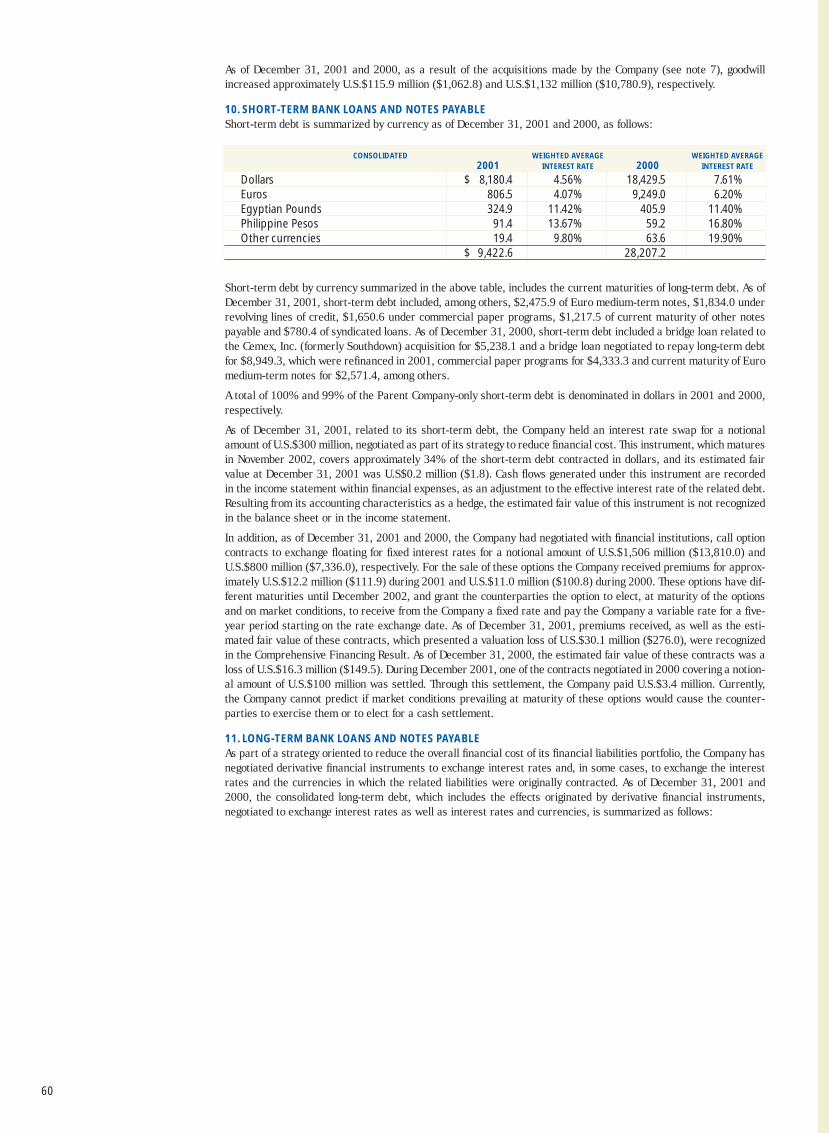
60
As of December 31, 2001 and 2000, as a result of the acquisitions made by the Company (see note 7), goodwillincreased approximately U.S.$115.9 million ($1,062.8) and U.S.$1,132 million ($10,780.9), respectively.
10. SHORT-TERM BANK LOANS AND NOTES PAYABLEShort-term debt is summarized by currency as of December 31, 2001 and 2000, as follows:
CONSOLIDATED WEIGHTED AVERAGE WEIGHTED AVERAGE2001 INTEREST RATE 2000 INTEREST RATE
Dollars $ 8,180.4 4.56% 18,429.5 7.61%Euros 806.5 4.07% 9,249.0 6.20%Egyptian Pounds 324.9 11.42% 405.9 11.40%Philippine Pesos 91.4 13.67% 59.2 16.80%Other currencies 19.4 9.80% 63.6 19.90%
$ 9,422.6 28,207.2
Short-term debt by currency summarized in the above table, includes the current maturities of long-term debt. As ofDecember 31, 2001, short-term debt included, among others, $2,475.9 of Euro medium-term notes, $1,834.0 underrevolving lines of credit, $1,650.6 under commercial paper programs, $1,217.5 of current maturity of other notespayable and $780.4 of syndicated loans. As of December 31, 2000, short-term debt included a bridge loan related tothe Cemex, Inc. (formerly Southdown) acquisition for $5,238.1 and a bridge loan negotiated to repay long-term debtfor $8,949.3, which were refinanced in 2001, commercial paper programs for $4,333.3 and current maturity of Euromedium-term notes for $2,571.4, among others.
A total of 100% and 99% of the Parent Company-only short-term debt is denominated in dollars in 2001 and 2000,respectively.
As of December 31, 2001, related to its short-term debt, the Company held an interest rate swap for a notionalamount of U.S.$300 million, negotiated as part of its strategy to reduce financial cost. This instrument, which maturesin November 2002, covers approximately 34% of the short-term debt contracted in dollars, and its estimated fairvalue at December 31, 2001 was U.S$0.2 million ($1.8). Cash flows generated under this instrument are recordedin the income statement within financial expenses, as an adjustment to the effective interest rate of the related debt.Resulting from its accounting characteristics as a hedge, the estimated fair value of this instrument is not recognizedin the balance sheet or in the income statement.
In addition, as of December 31, 2001 and 2000, the Company had negotiated with financial institutions, call optioncontracts to exchange floating for fixed interest rates for a notional amount of U.S.$1,506 million ($13,810.0) andU.S.$800 million ($7,336.0), respectively. For the sale of these options the Company received premiums for approx-imately U.S.$12.2 million ($111.9) during 2001 and U.S.$11.0 million ($100.8) during 2000. These options have dif-ferent maturities until December 2002, and grant the counterparties the option to elect, at maturity of the optionsand on market conditions, to receive from the Company a fixed rate and pay the Company a variable rate for a five-year period starting on the rate exchange date. As of December 31, 2001, premiums received, as well as the esti-mated fair value of these contracts, which presented a valuation loss of U.S.$30.1 million ($276.0), were recognizedin the Comprehensive Financing Result. As of December 31, 2000, the estimated fair value of these contracts was aloss of U.S.$16.3 million ($149.5). During December 2001, one of the contracts negotiated in 2000 covering a notion-al amount of U.S.$100 million was settled. Through this settlement, the Company paid U.S.$3.4 million. Currently,the Company cannot predict if market conditions prevailing at maturity of these options would cause the counter-parties to exercise them or to elect for a cash settlement.
11. LONG-TERM BANK LOANS AND NOTES PAYABLEAs part of a strategy oriented to reduce the overall financial cost of its financial liabilities portfolio, the Company hasnegotiated derivative financial instruments to exchange interest rates and, in some cases, to exchange the interestrates and the currencies in which the related liabilities were originally contracted. As of December 31, 2001 and2000, the consolidated long-term debt, which includes the effects originated by derivative financial instruments,negotiated to exchange interest rates as well as interest rates and currencies, is summarized as follows:
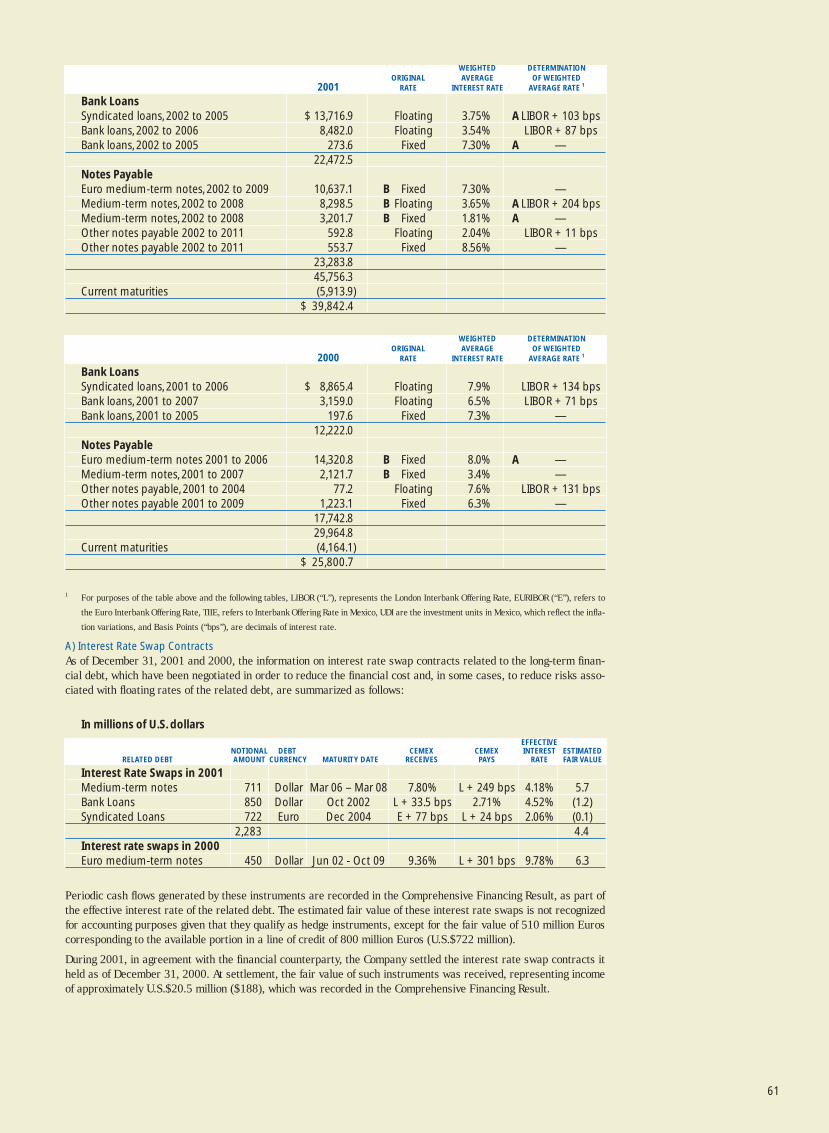
61
WEIGHTED DETERMINATIONORIGINAL AVERAGE OF WEIGHTED
2001 RATE INTEREST RATE AVERAGE RATE 1
Bank LoansSyndicated loans, 2002 to 2005 $ 13,716.9 Floating 3.75% A LIBOR + 103 bpsBank loans, 2002 to 2006 8,482.0 Floating 3.54% LIBOR + 87 bpsBank loans, 2002 to 2005 273.6 Fixed 7.30% A —
22,472.5Notes PayableEuro medium-term notes, 2002 to 2009 10,637.1 B Fixed 7.30% —Medium-term notes, 2002 to 2008 8,298.5 B Floating 3.65% A LIBOR + 204 bpsMedium-term notes, 2002 to 2008 3,201.7 B Fixed 1.81% A —Other notes payable 2002 to 2011 592.8 Floating 2.04% LIBOR + 11 bpsOther notes payable 2002 to 2011 553.7 Fixed 8.56% —
23,283.845,756.3
Current maturities (5,913.9)$ 39,842.4
WEIGHTED DETERMINATIONORIGINAL AVERAGE OF WEIGHTED
2000 RATE INTEREST RATE AVERAGE RATE 1
Bank LoansSyndicated loans, 2001 to 2006 $ 8,865.4 Floating 7.9% LIBOR + 134 bpsBank loans, 2001 to 2007 3,159.0 Floating 6.5% LIBOR + 71 bpsBank loans, 2001 to 2005 197.6 Fixed 7.3% —
12,222.0Notes PayableEuro medium-term notes 2001 to 2006 14,320.8 B Fixed 8.0% A —Medium-term notes, 2001 to 2007 2,121.7 B Fixed 3.4% —Other notes payable, 2001 to 2004 77.2 Floating 7.6% LIBOR + 131 bpsOther notes payable 2001 to 2009 1,223.1 Fixed 6.3% —
17,742.829,964.8
Current maturities (4,164.1)$ 25,800.7
1 For purposes of the table above and the following tables, LIBOR (“L”), represents the London Interbank Offering Rate, EURIBOR (“E”), refers to
the Euro Interbank Offering Rate, TIIE, refers to Interbank Offering Rate in Mexico, UDI are the investment units in Mexico, which reflect the infla-
tion variations, and Basis Points (“bps”), are decimals of interest rate.
A) Interest Rate Swap ContractsAs of December 31, 2001 and 2000, the information on interest rate swap contracts related to the long-term finan-cial debt, which have been negotiated in order to reduce the financial cost and, in some cases, to reduce risks asso-ciated with floating rates of the related debt, are summarized as follows:
In millions of U.S. dollars
EFFECTIVENOTIONAL DEBT CEMEX CEMEX INTEREST ESTIMATED
RELATED DEBT AMOUNT CURRENCY MATURITY DATE RECEIVES PAYS RATE FAIR VALUE
Interest Rate Swaps in 2001Medium-term notes 711 Dollar Mar 06 – Mar 08 7.80% L + 249 bps 4.18% 5.7Bank Loans 850 Dollar Oct 2002 L + 33.5 bps 2.71% 4.52% (1.2)Syndicated Loans 722 Euro Dec 2004 E + 77 bps L + 24 bps 2.06% (0.1)
2,283 4.4Interest rate swaps in 2000Euro medium-term notes 450 Dollar Jun 02 - Oct 09 9.36% L + 301 bps 9.78% 6.3
Periodic cash flows generated by these instruments are recorded in the Comprehensive Financing Result, as part ofthe effective interest rate of the related debt. The estimated fair value of these interest rate swaps is not recognizedfor accounting purposes given that they qualify as hedge instruments, except for the fair value of 510 million Euroscorresponding to the available portion in a line of credit of 800 million Euros (U.S.$722 million).
During 2001, in agreement with the financial counterparty, the Company settled the interest rate swap contracts itheld as of December 31, 2000. At settlement, the fair value of such instruments was received, representing incomeof approximately U.S.$20.5 million ($188), which was recorded in the Comprehensive Financing Result.
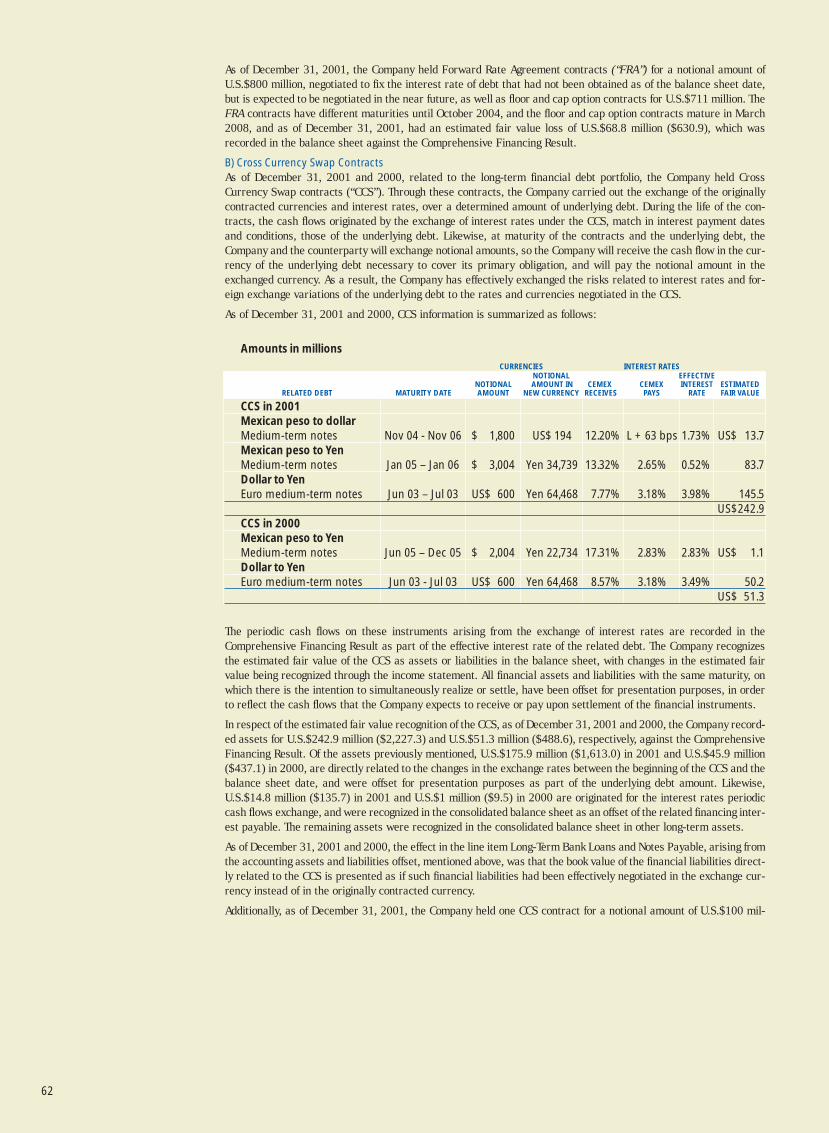
62
As of December 31, 2001, the Company held Forward Rate Agreement contracts (“FRA”) for a notional amount ofU.S.$800 million, negotiated to fix the interest rate of debt that had not been obtained as of the balance sheet date,but is expected to be negotiated in the near future, as well as floor and cap option contracts for U.S.$711 million. TheFRA contracts have different maturities until October 2004, and the floor and cap option contracts mature in March2008, and as of December 31, 2001, had an estimated fair value loss of U.S.$68.8 million ($630.9), which wasrecorded in the balance sheet against the Comprehensive Financing Result.
B) Cross Currency Swap ContractsAs of December 31, 2001 and 2000, related to the long-term financial debt portfolio, the Company held CrossCurrency Swap contracts (“CCS”). Through these contracts, the Company carried out the exchange of the originallycontracted currencies and interest rates, over a determined amount of underlying debt. During the life of the con-tracts, the cash flows originated by the exchange of interest rates under the CCS, match in interest payment datesand conditions, those of the underlying debt. Likewise, at maturity of the contracts and the underlying debt, theCompany and the counterparty will exchange notional amounts, so the Company will receive the cash flow in the cur-rency of the underlying debt necessary to cover its primary obligation, and will pay the notional amount in theexchanged currency. As a result, the Company has effectively exchanged the risks related to interest rates and for-eign exchange variations of the underlying debt to the rates and currencies negotiated in the CCS.
As of December 31, 2001 and 2000, CCS information is summarized as follows:
Amounts in millions
CURRENCIES INTEREST RATESNOTIONAL EFFECTIVE
NOTIONAL AMOUNT IN CEMEX CEMEX INTEREST ESTIMATEDRELATED DEBT MATURITY DATE AMOUNT NEW CURRENCY RECEIVES PAYS RATE FAIR VALUE
CCS in 2001Mexican peso to dollarMedium-term notes Nov 04 - Nov 06 $ 1,800 US$ 194 12.20% L + 63 bps 1.73% US$ 13.7Mexican peso to YenMedium-term notes Jan 05 – Jan 06 $ 3,004 Yen 34,739 13.32% 2.65% 0.52% 83.7Dollar to YenEuro medium-term notes Jun 03 – Jul 03 US$ 600 Yen 64,468 7.77% 3.18% 3.98% 145.5
US$242.9CCS in 2000Mexican peso to YenMedium-term notes Jun 05 – Dec 05 $ 2,004 Yen 22,734 17.31% 2.83% 2.83% US$ 1.1Dollar to YenEuro medium-term notes Jun 03 - Jul 03 US$ 600 Yen 64,468 8.57% 3.18% 3.49% 50.2
US$ 51.3
The periodic cash flows on these instruments arising from the exchange of interest rates are recorded in theComprehensive Financing Result as part of the effective interest rate of the related debt. The Company recognizesthe estimated fair value of the CCS as assets or liabilities in the balance sheet, with changes in the estimated fairvalue being recognized through the income statement. All financial assets and liabilities with the same maturity, onwhich there is the intention to simultaneously realize or settle, have been offset for presentation purposes, in orderto reflect the cash flows that the Company expects to receive or pay upon settlement of the financial instruments.
In respect of the estimated fair value recognition of the CCS, as of December 31, 2001 and 2000, the Company record-ed assets for U.S.$242.9 million ($2,227.3) and U.S.$51.3 million ($488.6), respectively, against the ComprehensiveFinancing Result. Of the assets previously mentioned, U.S.$175.9 million ($1,613.0) in 2001 and U.S.$45.9 million($437.1) in 2000, are directly related to the changes in the exchange rates between the beginning of the CCS and thebalance sheet date, and were offset for presentation purposes as part of the underlying debt amount. Likewise,U.S.$14.8 million ($135.7) in 2001 and U.S.$1 million ($9.5) in 2000 are originated for the interest rates periodiccash flows exchange, and were recognized in the consolidated balance sheet as an offset of the related financing inter-est payable. The remaining assets were recognized in the consolidated balance sheet in other long-term assets.
As of December 31, 2001 and 2000, the effect in the line item Long-Term Bank Loans and Notes Payable, arising fromthe accounting assets and liabilities offset, mentioned above, was that the book value of the financial liabilities direct-ly related to the CCS is presented as if such financial liabilities had been effectively negotiated in the exchange cur-rency instead of in the originally contracted currency.
Additionally, as of December 31, 2001, the Company held one CCS contract for a notional amount of U.S.$100 mil-
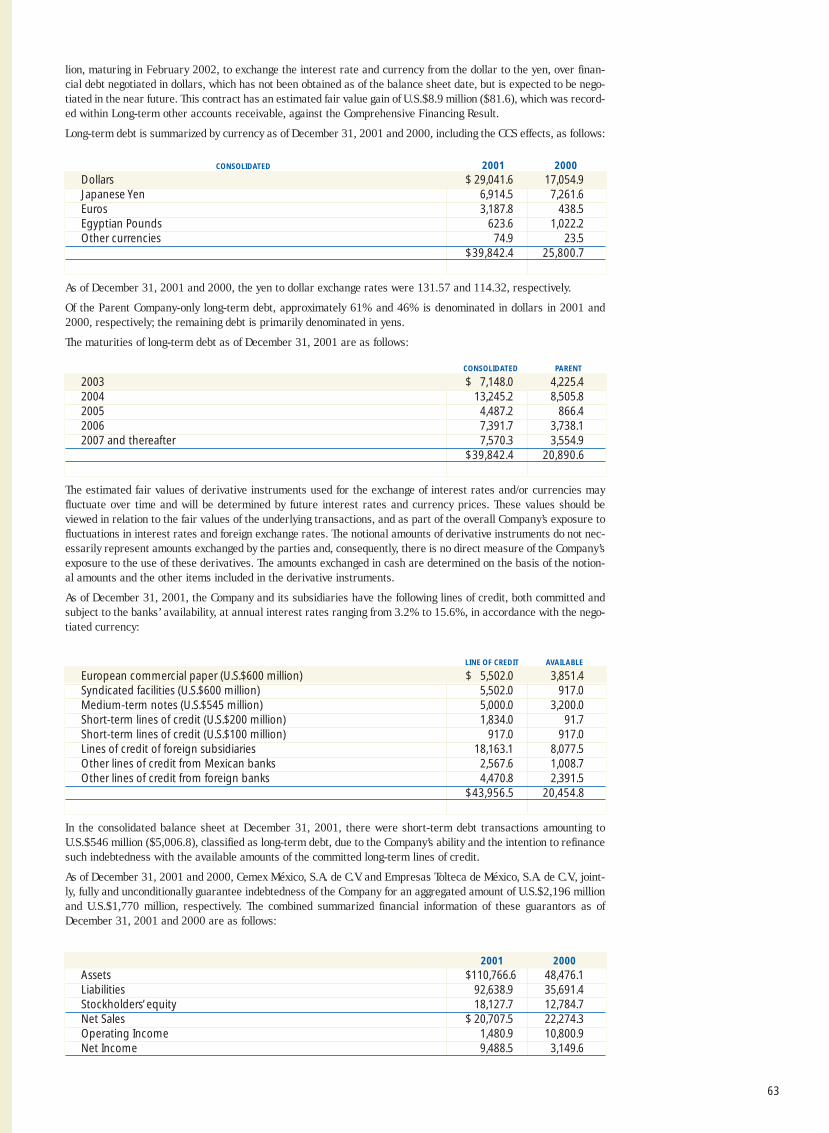
63
lion, maturing in February 2002, to exchange the interest rate and currency from the dollar to the yen, over finan-cial debt negotiated in dollars, which has not been obtained as of the balance sheet date, but is expected to be nego-tiated in the near future. This contract has an estimated fair value gain of U.S.$8.9 million ($81.6), which was record-ed within Long-term other accounts receivable, against the Comprehensive Financing Result.
Long-term debt is summarized by currency as of December 31, 2001 and 2000, including the CCS effects, as follows:
CONSOLIDATED 2001 2000
Dollars $ 29,041.6 17,054.9Japanese Yen 6,914.5 7,261.6Euros 3,187.8 438.5Egyptian Pounds 623.6 1,022.2Other currencies 74.9 23.5
$39,842.4 25,800.7
As of December 31, 2001 and 2000, the yen to dollar exchange rates were 131.57 and 114.32, respectively.
Of the Parent Company-only long-term debt, approximately 61% and 46% is denominated in dollars in 2001 and2000, respectively; the remaining debt is primarily denominated in yens.
The maturities of long-term debt as of December 31, 2001 are as follows:
CONSOLIDATED PARENT
2003 $ 7,148.0 4,225.42004 13,245.2 8,505.82005 4,487.2 866.42006 7,391.7 3,738.12007 and thereafter 7,570.3 3,554.9
$39,842.4 20,890.6
The estimated fair values of derivative instruments used for the exchange of interest rates and/or currencies mayfluctuate over time and will be determined by future interest rates and currency prices. These values should beviewed in relation to the fair values of the underlying transactions, and as part of the overall Company’s exposure tofluctuations in interest rates and foreign exchange rates. The notional amounts of derivative instruments do not nec-essarily represent amounts exchanged by the parties and, consequently, there is no direct measure of the Company’sexposure to the use of these derivatives. The amounts exchanged in cash are determined on the basis of the notion-al amounts and the other items included in the derivative instruments.
As of December 31, 2001, the Company and its subsidiaries have the following lines of credit, both committed andsubject to the banks’ availability, at annual interest rates ranging from 3.2% to 15.6%, in accordance with the nego-tiated currency:
LINE OF CREDIT AVAILABLE
European commercial paper (U.S.$600 million) $ 5,502.0 3,851.4Syndicated facilities (U.S.$600 million) 5,502.0 917.0Medium-term notes (U.S.$545 million) 5,000.0 3,200.0Short-term lines of credit (U.S.$200 million) 1,834.0 91.7Short-term lines of credit (U.S.$100 million) 917.0 917.0Lines of credit of foreign subsidiaries 18,163.1 8,077.5Other lines of credit from Mexican banks 2,567.6 1,008.7Other lines of credit from foreign banks 4,470.8 2,391.5
$43,956.5 20,454.8
In the consolidated balance sheet at December 31, 2001, there were short-term debt transactions amounting toU.S.$546 million ($5,006.8), classified as long-term debt, due to the Company’s ability and the intention to refinancesuch indebtedness with the available amounts of the committed long-term lines of credit.
As of December 31, 2001 and 2000, Cemex México, S.A. de C.V. and Empresas Tolteca de México, S.A. de C.V., joint-ly, fully and unconditionally guarantee indebtedness of the Company for an aggregated amount of U.S.$2,196 millionand U.S.$1,770 million, respectively. The combined summarized financial information of these guarantors as ofDecember 31, 2001 and 2000 are as follows:
2001 2000
Assets $110,766.6 48,476.1Liabilities 92,638.9 35,691.4Stockholders’ equity 18,127.7 12,784.7Net Sales $ 20,707.5 22,274.3Operating Income 1,480.9 10,800.9Net Income 9,488.5 3,149.6
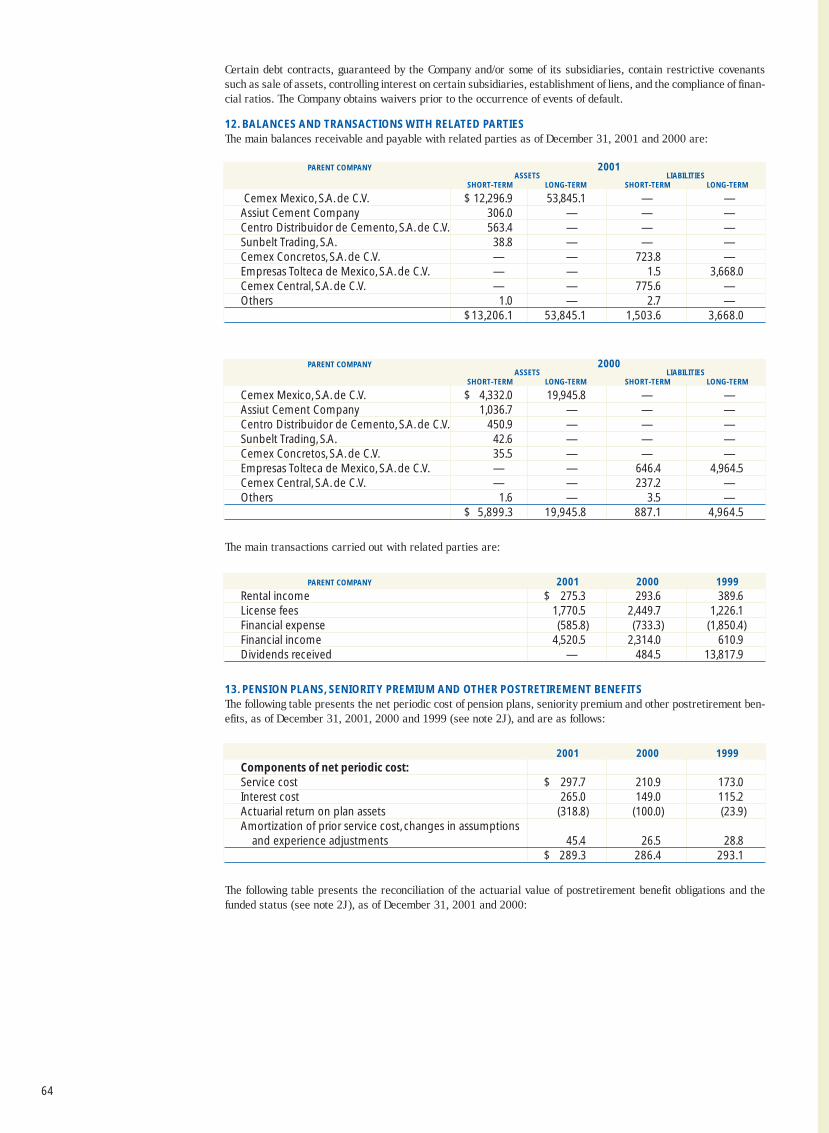
64
Certain debt contracts, guaranteed by the Company and/or some of its subsidiaries, contain restrictive covenantssuch as sale of assets, controlling interest on certain subsidiaries, establishment of liens, and the compliance of finan-cial ratios. The Company obtains waivers prior to the occurrence of events of default.
12. BALANCES AND TRANSACTIONS WITH RELATED PARTIESThe main balances receivable and payable with related parties as of December 31, 2001 and 2000 are:
PARENT COMPANY 2001ASSETS LIABILITIES
SHORT-TERM LONG-TERM SHORT-TERM LONG-TERM
Cemex Mexico, S.A. de C.V. $ 12,296.9 53,845.1 — —Assiut Cement Company 306.0 — — —Centro Distribuidor de Cemento, S.A. de C.V. 563.4 — — —Sunbelt Trading, S.A. 38.8 — — —Cemex Concretos, S.A. de C.V. — — 723.8 —Empresas Tolteca de Mexico, S.A. de C.V. — — 1.5 3,668.0Cemex Central, S.A. de C.V. — — 775.6 —Others 1.0 — 2.7 —
$13,206.1 53,845.1 1,503.6 3,668.0
PARENT COMPANY 2000ASSETS LIABILITIES
SHORT-TERM LONG-TERM SHORT-TERM LONG-TERM
Cemex Mexico, S.A. de C.V. $ 4,332.0 19,945.8 — —Assiut Cement Company 1,036.7 — — —Centro Distribuidor de Cemento, S.A. de C.V. 450.9 — — —Sunbelt Trading, S.A. 42.6 — — —Cemex Concretos, S.A. de C.V. 35.5 — — —Empresas Tolteca de Mexico, S.A. de C.V. — — 646.4 4,964.5 Cemex Central, S.A. de C.V. — — 237.2 —Others 1.6 — 3.5 —
$ 5,899.3 19,945.8 887.1 4,964.5
The main transactions carried out with related parties are:
PARENT COMPANY 2001 2000 1999
Rental income $ 275.3 293.6 389.6 License fees 1,770.5 2,449.7 1,226.1 Financial expense (585.8) (733.3) (1,850.4)Financial income 4,520.5 2,314.0 610.9 Dividends received — 484.5 13,817.9
13. PENSION PLANS, SENIORITY PREMIUM AND OTHER POSTRETIREMENT BENEFITSThe following table presents the net periodic cost of pension plans, seniority premium and other postretirement ben-efits, as of December 31, 2001, 2000 and 1999 (see note 2J), and are as follows:
2001 2000 1999
Components of net periodic cost:Service cost $ 297.7 210.9 173.0 Interest cost 265.0 149.0 115.2 Actuarial return on plan assets (318.8) (100.0) (23.9)Amortization of prior service cost, changes in assumptions
and experience adjustments 45.4 26.5 28.8 $ 289.3 286.4 293.1
The following table presents the reconciliation of the actuarial value of postretirement benefit obligations and thefunded status (see note 2J), as of December 31, 2001 and 2000:
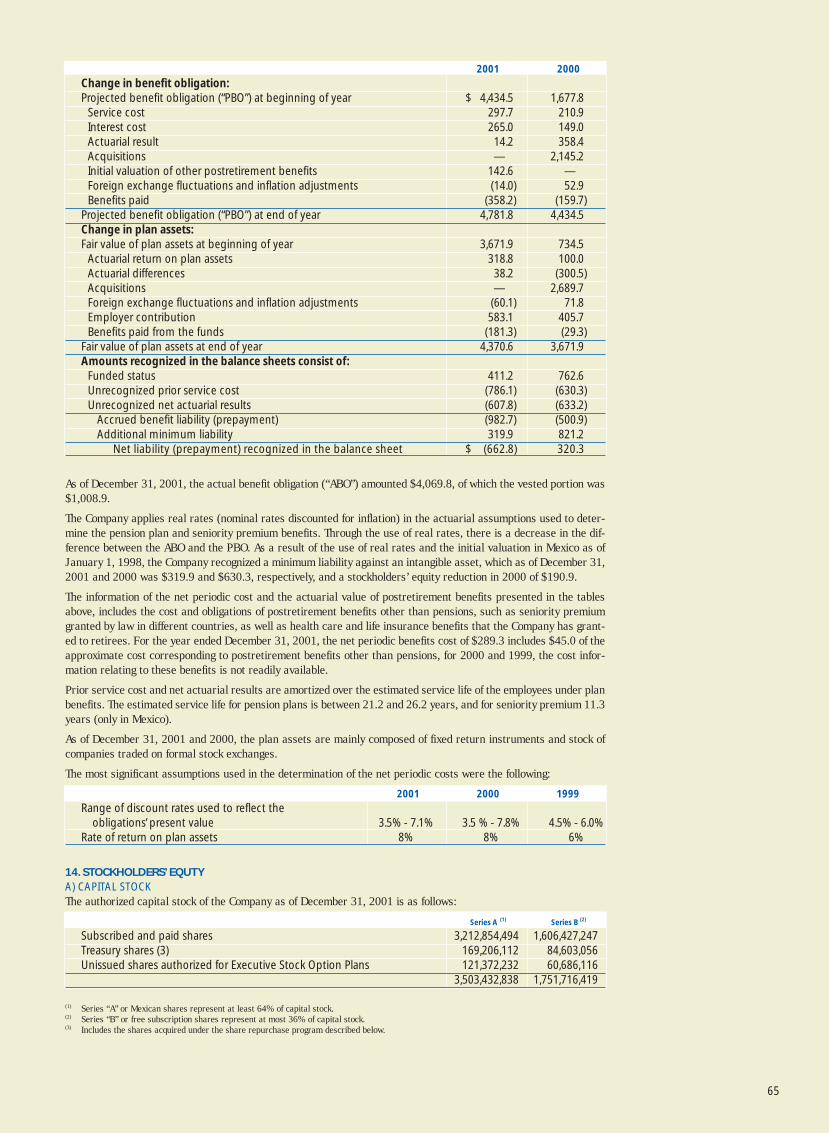
65
2001 2000
Change in benefit obligation:Projected benefit obligation (“PBO”) at beginning of year $ 4,434.5 1,677.8
Service cost 297.7 210.9 Interest cost 265.0 149.0 Actuarial result 14.2 358.4 Acquisitions — 2,145.2 Initial valuation of other postretirement benefits 142.6 —Foreign exchange fluctuations and inflation adjustments (14.0) 52.9 Benefits paid (358.2) (159.7)
Projected benefit obligation (“PBO”) at end of year 4,781.8 4,434.5 Change in plan assets:Fair value of plan assets at beginning of year 3,671.9 734.5
Actuarial return on plan assets 318.8 100.0 Actuarial differences 38.2 (300.5)Acquisitions — 2,689.7 Foreign exchange fluctuations and inflation adjustments (60.1) 71.8 Employer contribution 583.1 405.7 Benefits paid from the funds (181.3) (29.3)
Fair value of plan assets at end of year 4,370.6 3,671.9 Amounts recognized in the balance sheets consist of:
Funded status 411.2 762.6 Unrecognized prior service cost (786.1) (630.3)Unrecognized net actuarial results (607.8) (633.2)
Accrued benefit liability (prepayment) (982.7) (500.9)Additional minimum liability 319.9 821.2
Net liability (prepayment) recognized in the balance sheet $ (662.8) 320.3
As of December 31, 2001, the actual benefit obligation (“ABO”) amounted $4,069.8, of which the vested portion was$1,008.9.
The Company applies real rates (nominal rates discounted for inflation) in the actuarial assumptions used to deter-mine the pension plan and seniority premium benefits. Through the use of real rates, there is a decrease in the dif-ference between the ABO and the PBO. As a result of the use of real rates and the initial valuation in Mexico as ofJanuary 1, 1998, the Company recognized a minimum liability against an intangible asset, which as of December 31,2001 and 2000 was $319.9 and $630.3, respectively, and a stockholders’ equity reduction in 2000 of $190.9.
The information of the net periodic cost and the actuarial value of postretirement benefits presented in the tablesabove, includes the cost and obligations of postretirement benefits other than pensions, such as seniority premiumgranted by law in different countries, as well as health care and life insurance benefits that the Company has grant-ed to retirees. For the year ended December 31, 2001, the net periodic benefits cost of $289.3 includes $45.0 of theapproximate cost corresponding to postretirement benefits other than pensions, for 2000 and 1999, the cost infor-mation relating to these benefits is not readily available.
Prior service cost and net actuarial results are amortized over the estimated service life of the employees under planbenefits. The estimated service life for pension plans is between 21.2 and 26.2 years, and for seniority premium 11.3years (only in Mexico).
As of December 31, 2001 and 2000, the plan assets are mainly composed of fixed return instruments and stock ofcompanies traded on formal stock exchanges.
The most significant assumptions used in the determination of the net periodic costs were the following:
2001 2000 1999
Range of discount rates used to reflect theobligations’ present value 3.5% - 7.1% 3.5 % - 7.8% 4.5% - 6.0%
Rate of return on plan assets 8% 8% 6%
14. STOCKHOLDERS’ EQUTYA) CAPITAL STOCKThe authorized capital stock of the Company as of December 31, 2001 is as follows:
Series A (1) Series B (2)
Subscribed and paid shares 3,212,854,494 1,606,427,247Treasury shares (3) 169,206,112 84,603,056Unissued shares authorized for Executive Stock Option Plans 121,372,232 60,686,116
3,503,432,838 1,751,716,419
(1) Series “A” or Mexican shares represent at least 64% of capital stock.(2) Series “B” or free subscription shares represent at most 36% of capital stock.(3) Includes the shares acquired under the share repurchase program described below.
66
Of the total number of shares, 3,267,000,000 correspond to the fixed portion and 1,988,149,257 correspond to thevariable portion.
During 2001, at the annual stockholders’ meeting, a dividend of $0.60 (nominal amount) per share was approved.Instead of receiving the dividend in cash, shareholders were entitled to elect to receive a stock dividend per share of$0.60 (nominal amount) of additional shares at a price of $38.16 (nominal amount) per additional share. As a resultof the program, a total of 140,749,888 series “A” shares and 70,374,944 series “B” shares were issued, generatingan additional paid-in capital of $2,746.9 and an aggregate of $84 was paid in cash.
On September 15, 2000, the Company established a stock repurchase program through the Mexican Stock Exchange(“MSE”), approved by its board of directors, for up to U.S.$500 million. This program was effective, in accordancewith the procedures validated by the National Banking and Exchange Commission, from October 2000 until December2001. During 2001 and 2000, under this program, a total of 4,978,000 CPOs and 3,086,000 CPOs, respectively, wereacquired, resulting in a capital stock reduction of $0.2 in 2001 and $0.1 in 2000, and in the repurchase reserve of$203.5 in 2001 and $119.9 in 2000. On April 26, 2001, at the stockholders’ meeting, shares equivalent to 3,086,000CPOs, acquired in 2000, were cancelled; the 4,978,000 remaining CPOs were acquired in 2001 after the meeting.
B) RETAINED EARNINGSRetained earnings as of December 31, 2001, include $54,492.8 of earnings generated by subsidiaries and affiliatedcompanies, which would be distributed to the Company when these entities would declare dividends. Additionally,retained earnings include a stock repurchase reserve in the amount of $10,517.3.
Net income for the year is subject to a 5% allocation toward a legal reserve, until such reserve equals one fifth of thecapital stock. As of December 31, 2001, the legal reserve amounted to $1,249.6.
Earnings distributed as dividends, in excess of tax earnings, will be subject to withholding tax as defined by theMexican Income Tax Law, in which case only 65% of such earnings would be distributed to the shareholders.
C) EFFECTS OF INFLATIONThe effects of inflation on majority interest stockholders’ equity as of December 31, 2001 are summarized as follows:
INFLATIONHISTORICAL COST ADJUSTMENT TOTAL
Common stock $ 53.5 3,128.0 3,181.5Additional paid in capital 13,931.6 12,341.8 26,273.4Deficit in equity restatement — (51,218.2) (51,218.2)Cumulative initial deferred income tax effects (4,697.9) (62.8) (4,760.7)Retained earnings 42,897.3 29,465.7 72,363.0Net income 10,773.0 27.5 10,800.5
D) FOREIGN CURRENCY TRANSLATIONThe net foreign currency translation results recorded in stockholders’ equity are summarized as follows:
2001 2000 1999
Foreign currency translation adjustment $ (2,233.9) (799.2) (836.8)Foreign exchange gain (loss) (1) 688.3 (166.5) 604.5
$ (1,545.6) (965.7) (232.3)
(1) Foreign exchange results from the financing identified with the acquisitions of foreign subsidiaries in accordance with Bulletin B-15.
The foreign currency translation adjustment includes foreign exchange results from financing related to the acquisi-tion of foreign subsidiaries generated by the subsidiary of the Company in Spain of $(41.0), $(604.5) and $(1,902.0),in 2001, 2000 and 1999, respectively.
E) PREFERRED STOCKIn November 2000, a Dutch subsidiary of the Company issued preferred stock for an amount of U.S.$1,500 million($14,285.7) in connection with the financing required for the Cemex, Inc (formerly Southdown (see note 7)) acquisi-tion. The preferred stock is mandatorily redeemable at the end of the 18th month, and grants its holders 10% of thesubsidiary’s voting rights, as well as the right to receive a variable guaranteed preferred dividend. The preferred stockmust be redeemed for a total of U.S.$300 million, in three installments of U.S.$100 million each, at the end of months9, 12 and 15, and the balance at the end of month 18. Holders of the preferred stock have the option, in certain cir-cumstances, to subscribe additional preferred or common shares for up to 51% of the voting rights of the subsidiary.As of December 31, 2001, the Company had redeemed preferred stock amounting to U.S.$600 million, the balanceoutstanding amounts to U.S.$900 million ($8,253). This transaction is included as minority interest.
67
As of December 31, 2001, a subsidiary of the Company in Spain had U.S.$250 million of capital securities with anannual dividend rate of 9.66%, issued during 1998. The Company has an option to repurchase the shares onNovember 15, 2004, or on any other subsequent dividend payment date. Additionally, the holders of the shares havethe right to sell them to the Company on May 15, 2005. This transaction is recorded as minority interest.
F) OTHER EQUITY TRANSACTIONSIn December 1999, by means of a public offer in the MSE and the NYSE, the Company issued 105 million apprecia-tion warrants maturing on December 13, 2002, at a subscription price in pesos of $3.2808 per warrant. The war-rants allowed the holder to benefit from the future increases in the market price of the Company’s CPO above thestrike price, which originally was U.S.$6.20 per warrant, within certain limits and subject to technical adjustments.The benefit, should any exist, will be paid in CPOs of the Company. The warrants were issued for a term of three yearsand their exercise is at maturity. A portion of the warrants were subscribed as American Depositary Warrants(“ADWs”) traded on the NYSE, each ADW is equivalent to 5 warrants. The premium received from the warrantsissuance during 1999, net of related expenses, was $264.3.
Relating to the transaction described in the paragraph above, in November 2001, the Company simultaneouslylaunched a voluntary public purchase and sale offer for the existing warrants and an exchange offer for the existingADWs, for new warrants and new ADWs maturing in December 2004, under a one for one exchange scheme. In accor-dance with the offer, which concluded on December 20, 2001, the Company exchanged a new ADW for each old ADWand issued a new warrant for each old warrant. The new warrants trade on the MSE while the new ADWs trade onthe NYSE. The remaining old warrants remain listed on the MSE, while the old ADWs may be probably delisted onthe NYSE. Of the total originally issued 105 million warrants and ADWs, 103,790,945, representing 98.85% of thetotal warrants under this program, were exchanged for new instruments. As of December 31, 2001, except for thenormal fees required to carry out the previously mentioned public offer, the Company did not incur any gains or loss-es on this transaction. All the CPOs and ADSs required to cover the future exercise of the warrants, for the old pro-gram as well as the new warrants, are available through equity forward contracts with a financial institution (seenote 16A).
As of December 31, 2001 and 2000, there was a financial transaction totaling U.S.$96.3 million ($883.1) andU.S.$100.7 million ($959), respectively, in which in December 1995, the Company transferred financial assets to atrust, while simultaneously investors contributed U.S.$123.5 million in exchange of notes representing a beneficialinterest in the trust. This agreement includes certain guarantees. This transaction matures in 2007, and the Companyhas the right to reacquire the related assets at different dates. Since inception, the assets subject to this transactionhave been considered as owned by third parties; therefore, this transaction is included as minority interest.
As of December 31, 2000, the Company had recognized an approximate valuation effect in stockholders’ equity of$727.5, related to investments available for sale (see note 7B). During 2001, as a result of the sale of the Banaccishares, the effect accrued in equity was reversed through the income statement.
G) COMPREHENSIVE NET INCOMEThe main items included in the comprehensive net income for the years ended December 31, 2001, 2000 and 1999,are as follows:
2001 2000 1999
Majority interest net income $ 10,800.5 9,517.3 9,372.7Deficit in equity restatement:
Effects from holding non-monetary assets (2,408.8) (2,710.2) (2,894.0)Foreign currency translation adjustment (2,233.9) (799.2) (836.8)Capitalized foreign exchange result (note 14D) 688.3 (166.5) 604.5Additional minimum liability 190.9 (190.9) —Valuation of investments available for sale (note 7B) (727.5) 197.1 430.8Other hedge derivative instruments (note16) — 84.6 (144.6)Deferred income tax of the year directly recorded to
stockholders’ equity (note 17) 402.5 931.6 —Inflation effect on equity (note 2B) — (15.3) (784.7)
Deficit in equity restatement (4,088.5) (2,668.8) (3,624.8)Cumulative initial deferred income tax effects — (4,760.7) —
Other comprehensive income (cost) (4,088.5) (7,429.5) (3,624.8)Majority comprehensive net income 6,712.0 2,087.8 5,747.9Minority interest 1,405.9 742.5 543.1Total comprehensive net income $ 8,117.9 2,830.3 6,291.0
68
15. EXECUTIVE STOCK OPTION PLANAs of December 31, 2000 and until October 31, 2001, the Company had a single Executive Stock Option Plan (“fixedplan”) for shares of its common stock. Through this plan, the Company was authorized to grant to eligible executives,designated by a Technical Committee, stock option rights to subscribe up to 72,100,000 CPOs. In November 2001,the Company offered to the executives participating in the plan a voluntary exchange program oriented to modify thestructure of the fixed plan, in which at the grant date, the exercise price of the CPO subject to the option was estab-lished in Mexican pesos and it was fixed during the life of the option, by an structure in which the exercise price ofthe CPO subject to the option is established in U.S. dollars and increases annually during the option life, reflectingthe funding cost in the market. This modification was effected with the purpose of better aligning the executives’ inter-ests with those of the shareholders. Under this exchange program, the participating executives elected to resign theirrights to subscribe and/or acquire shares of the Company’s common stock, by the issuance of CPOs, in exchange forcash, representing the intrinsic value of their options at the exchange date; and the issuance of options from the newplan, equivalent in number to the time value of their redeemed options at the exchange date, determined by the appro-priate valuation model for each particular executive.
As a result of the voluntary exchange program, ended on November 9, 2001, executives holding approximately 90.1%of the outstanding old options at the exchange date, elected to participate and terminated their options, resulting ina non-recurring compensation cost in the income statement for the year ended December, 2001 which was record-ed under the caption Other expense, net. In respect of the redeemed options exchange, the issuance of 88,937,805options under the new Executive Stock Option Plan (“variable plan”) took place, with a initial exercise price ofU.S.$4.93 per CPO, which increases gradually at a 7% annual yield to maturity (less dividends paid) during theoption’s life. As of December 31, 2001, the exercise price of the CPO subject to these options was U.S.$4.98.
As of December 31, 2001 and 2000, the Company’s stock option plans balance, considering the effects of the exchangeprogram, is summarized as follows:
2001 2000NUMBER OF OPTIONS EXERCISE PRICE * NUMBER OF OPTIONS EXERCISE PRICE *
Fixed PlanGranted 77,405,675 $ 34.11 64,364,683 $ 35.99Canceled (293,146) 32.88 (55,608) 43.22Repurchased Options (57,448,219) 45.56 — —Exercised (10,968,914) 28.28 (7,840,425) 27.91Outstanding 8,695,396 56,468,650Variable PlanGranted 88,937,805 $ 45.67 — —
* Weighted average exercise price per CPO. The variable plan exercise price is obtained by multiplying U.S.$4.98 by the exchange rate of $9.17 per
dollar.
Resulting from the beginning of the variable plan, and for this issuance only, 50% of the option exercise rights werevested, with an additional 25% annual vesting over the next two anniversaries. For the outstanding options under thefixed plan, and all new options granted beginning in 2002, the executives’ option rights may be exercised up to 25%annually during the first four years after having been granted.
As of December 31, 2001 and 2000, under the fixed plan, the total number of options granted was 13,040,992 and17,364,365, at a weighted average exercise price per CPO of $42.38 and $41.04, respectively; and the number ofoptions exercised was 3,128,489 and 1,915,637 at a weighted average exercise price per CPO of $30.49 in 2001 and$35.09 in 2000. As of December 31, 2001 the outstanding options have a remaining average exercise period ofapproximately 5.8 years. The CPOs issued upon the exercise of options were paid for at their assigned strike prices,generating additional paid-in capital of $105.1 and $49.3, as of December 31, 2001 and 2000, respectively.
In addition, during 1999 and 1998, the Company established voluntary stock option plans (“voluntary plans”) throughwhich executives elected to purchase options for up to 7,293,675 ADSs of the Company. These options are exercis-able quarterly over a period of 5 years, and have a predefined exercise price which increases quarterly in dollars,taking into account the funding cost in the market. For the sale of the options, the Company received a premium equiv-alent to a percentage of the ADS price at the beginning of the program. As of December 31, 2001 and 2000, thereare options outstanding for 4,043,192 ADSs and 4,415,576 ADSs, respectively. The weighted average price of theoptions, as of December 31, 2001, was U.S.$22.37 per ADS.
The Company’s obligations under the fixed plan, consists of the issuance of CPOs on each exercise date, which willresult in an increase in capital. With respect of the variable plan and the voluntary plans, the options exercise ishedged through equity forward contracts, with different financial institutions (see note 16A). As opposed to themechanics in the fixed plan, through the exercise of the variable options and the voluntary options, there is noissuance of CPOs into the market; therefore, these plans do not generate dilution in the number of shares outstand-ing and consequently in the basic earnings per share.
69
Beginning in 2001, the Company supplementary applies Generally Accepted Accounting Principles in the UnitedStates for the accounting of its stock option plans. As a result, for the year ended December 31, 2001, the appreci-ation of the variable and voluntary plans resulting from the difference between the market price and exercise priceof the CPO established in the option, was recognized as compensation cost in the income statement for an amount ofU.S.$14.7 million ($134.8), which represented the accumulated appreciation of the executives’ options at year end,and that was offset by the recognition through the income statement of the estimated fair value gain of equity for-ward contracts designed as hedges of these plans, for an approximate amount of U.S.$28.7 million ($263.2).
16. DERIVATIVE FINANCIAL INSTRUMENTSAs of December 31, 2001 and 2000, the derivative financial instruments negotiated by the Company, other than thoserelated to the financial debt (see notes 10 and 11), are summarized as follows:
IN MILLIONS OF U.S. DOLLARS
2001 2000NOTIONAL ESTIMATED FAIR NOTIONAL ESTIMATED FAIRAMOUNT VALUE AMOUNT VALUE
A) Equity forward contracts 1,395.9 81.0 1,088.8 (113.8)B) Foreign exchange forward contracts 424.0 4.4 421.0 6.8C) Third party equity forward — — 62.4 14.9D) Derivatives on fuel oil 9.5 — — —E) Derivatives related to energy projects 392.0 (4.6) 215.0 15.1
Upon liquidation and at the Company’s option, the equity forward contracts provide for physical settlement or netcash settlement of the estimated fair value, and the effects are recognized in the income statement or as part of thestockholders’ equity, according to their designation and the underlying instrument or program being hedged. At matu-rity, if these forward contracts are not settled or replaced, or if the Company defaults on the agreements establishedwith the financial counterparties, such counterparties may sell the shares underlying the contracts. If such sale wereto occur, it may have an adverse effect on the Company’s and/or its subsidiaries’ stock market price, may reduce theamount of dividends and other distributions that the Company would receive from its subsidiaries, and/or may cre-ate public minority interests that may adversely affect the Company’s ability to realize operating efficiencies as a com-bined group.
A) As of December 31, 2001 and 2000, there is a forward contract maturing in December 2002, for a notionalamount of U.S.$491.0 million and U.S.$508.5 million, respectively, covering 21,000,000 ADSs (105 million CPOs)and 33.8 million of Valenciana’s shares, negotiated to hedge the future exercise of the 105 million warrants, issuedunder the 1999 warrants transaction (see note 14F). The Company sold the shares underlying this forward dur-ing 1999 for approximately U.S.$905.7 million, and simultaneously prepaid approximately U.S.$439.9 milliontoward the forward’s final price. In the financial statements as of December 31, 2001 and 2000, the anticipatedeffect has been given to the liquidation of the forward for the portion corresponding to the Valenciana’s shares,due to the prepayment on the forward and the withholding of all economic and voting rights over such shares. Alleffects arising from this contract will be recognized at maturity, as an adjustment to stockholders’ equity. As ofDecember 31, 2001 and 2000, the estimated fair value of this contract was a gain of approximately U.S.$98.8million and a loss of approximately U.S.$16 million, respectively. In addition, during the life of the contract, theCompany makes additional payments toward the forward’s final price; therefore, as of December 31, 2001 and2000, approximately U.S.$151.8 million ($1,392.0) and U.S.$133 million ($1,266.7), of payments made that areincluded within Other Short-Term and Long-Term Accounts Receivable, respectively (see notes 7B and 4).
As of December 31, 2001, there are forward contracts with different maturities until October 2006, for a notion-al amount of U.S.$408.3 million and covering a total of 15,986,689 ADSs, negotiated to hedge the future exerciseof the options granted under the variable executive stock option plan (see note 15). Starting in 2001, the esti-mated fair value of these contracts is recognized in the balance sheet as an asset or liability against the incomestatement, offsetting the costs under the option plans, which the forwards are hedging. At December 31, 2001, again of approximately U.S.$3.3 million ($30.3) was recognized in the income statement, related to the estimatedfair value of these contracts.
As of December 31, 2001 and 2000, there are forward contracts with different maturities until May 2003, for anotional amount of U.S.$101.8 million and U.S.$104.8 million, respectively, covering a total of 4,699,061 ADSs in2001 and 4,841,719 ADSs in 2000, negotiated to hedge the future exercise of the options in the voluntary pro-grams (see note 15). Starting in 2001, the estimated fair value of these contracts is recognized in the balancesheet as an asset or liability against the income statement, offsetting the costs under the options. As of December31, 2001, a gain of approximately U.S.$25.4 million ($232.9) was recognized in the income statement, related tothe estimated fair value of these contracts. As of December 31, 2000, the estimated fair value of these contractswas an approximate loss of approximately U.S.$7.3 million.
In addition, as of December 31, 2001 and 2000, there are forward contracts with different maturities untilFebruary 2006, for an approximate notional amount of U.S.$394.8 million and U.S.$475.5 million, respectively,covering a total of 13,069,855 ADSs in 2001 and 20,440,360 ADSs in 2000. Based on the Company’s intention atmaturity, which is to physically settle these contracts, the estimated fair value of these contracts is not periodi-cally recognized. The effects of these contracts will be recognized at maturity as an adjustment to stockholders’equity. As of December 31, 2001 and 2000, the estimated fair value of these contracts presented losses of approx-imately U.S.$46.5 million and U.S.$90.5 million, respectively.
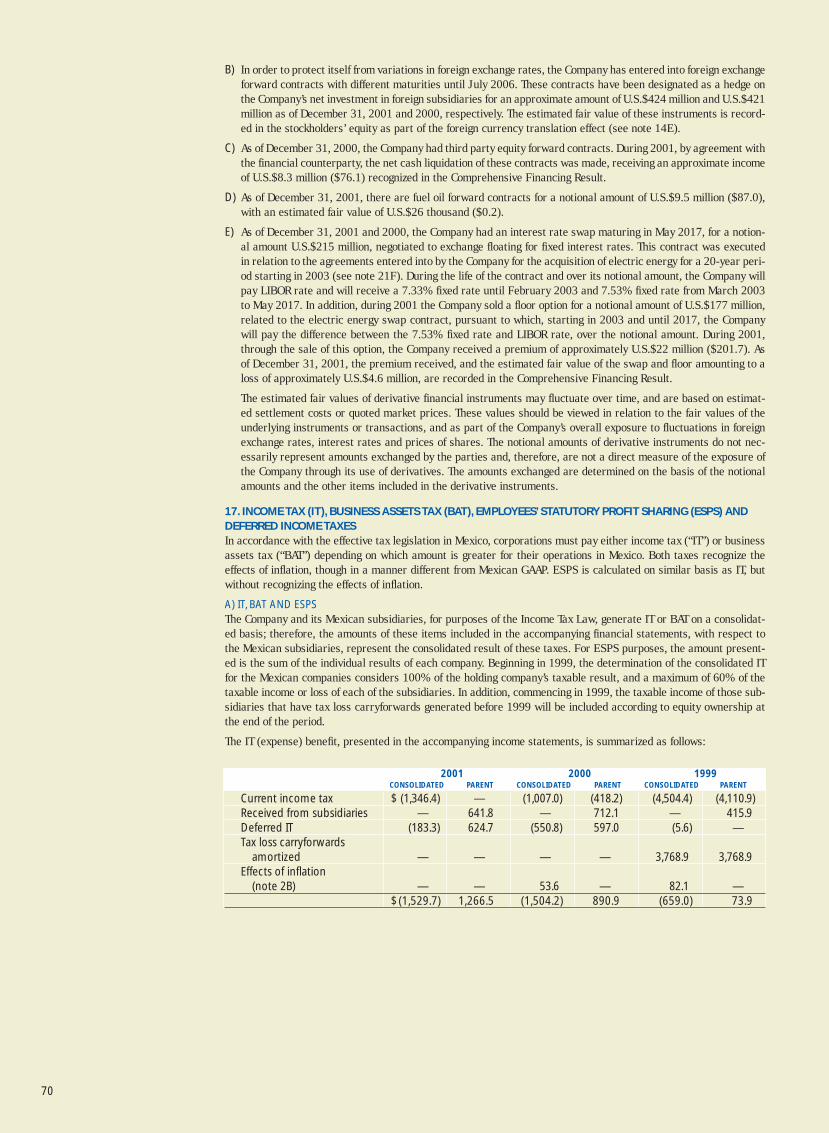
70
B) In order to protect itself from variations in foreign exchange rates, the Company has entered into foreign exchangeforward contracts with different maturities until July 2006. These contracts have been designated as a hedge onthe Company’s net investment in foreign subsidiaries for an approximate amount of U.S.$424 million and U.S.$421million as of December 31, 2001 and 2000, respectively. The estimated fair value of these instruments is record-ed in the stockholders’ equity as part of the foreign currency translation effect (see note 14E).
C) As of December 31, 2000, the Company had third party equity forward contracts. During 2001, by agreement withthe financial counterparty, the net cash liquidation of these contracts was made, receiving an approximate incomeof U.S.$8.3 million ($76.1) recognized in the Comprehensive Financing Result.
D) As of December 31, 2001, there are fuel oil forward contracts for a notional amount of U.S.$9.5 million ($87.0),with an estimated fair value of U.S.$26 thousand ($0.2).
E) As of December 31, 2001 and 2000, the Company had an interest rate swap maturing in May 2017, for a notion-al amount U.S.$215 million, negotiated to exchange floating for fixed interest rates. This contract was executedin relation to the agreements entered into by the Company for the acquisition of electric energy for a 20-year peri-od starting in 2003 (see note 21F). During the life of the contract and over its notional amount, the Company willpay LIBOR rate and will receive a 7.33% fixed rate until February 2003 and 7.53% fixed rate from March 2003to May 2017. In addition, during 2001 the Company sold a floor option for a notional amount of U.S.$177 million,related to the electric energy swap contract, pursuant to which, starting in 2003 and until 2017, the Companywill pay the difference between the 7.53% fixed rate and LIBOR rate, over the notional amount. During 2001,through the sale of this option, the Company received a premium of approximately U.S.$22 million ($201.7). Asof December 31, 2001, the premium received, and the estimated fair value of the swap and floor amounting to aloss of approximately U.S.$4.6 million, are recorded in the Comprehensive Financing Result.
The estimated fair values of derivative financial instruments may fluctuate over time, and are based on estimat-ed settlement costs or quoted market prices. These values should be viewed in relation to the fair values of theunderlying instruments or transactions, and as part of the Company’s overall exposure to fluctuations in foreignexchange rates, interest rates and prices of shares. The notional amounts of derivative instruments do not nec-essarily represent amounts exchanged by the parties and, therefore, are not a direct measure of the exposure ofthe Company through its use of derivatives. The amounts exchanged are determined on the basis of the notionalamounts and the other items included in the derivative instruments.
17. INCOME TAX (IT), BUSINESS ASSETS TAX (BAT), EMPLOYEES’ STATUTORY PROFIT SHARING (ESPS) ANDDEFERRED INCOME TAXESIn accordance with the effective tax legislation in Mexico, corporations must pay either income tax (“IT”) or businessassets tax (“BAT”) depending on which amount is greater for their operations in Mexico. Both taxes recognize theeffects of inflation, though in a manner different from Mexican GAAP. ESPS is calculated on similar basis as IT, butwithout recognizing the effects of inflation.
A) IT, BAT AND ESPSThe Company and its Mexican subsidiaries, for purposes of the Income Tax Law, generate IT or BAT on a consolidat-ed basis; therefore, the amounts of these items included in the accompanying financial statements, with respect tothe Mexican subsidiaries, represent the consolidated result of these taxes. For ESPS purposes, the amount present-ed is the sum of the individual results of each company. Beginning in 1999, the determination of the consolidated ITfor the Mexican companies considers 100% of the holding company’s taxable result, and a maximum of 60% of thetaxable income or loss of each of the subsidiaries. In addition, commencing in 1999, the taxable income of those sub-sidiaries that have tax loss carryforwards generated before 1999 will be included according to equity ownership atthe end of the period.
The IT (expense) benefit, presented in the accompanying income statements, is summarized as follows:
2001 2000 1999CONSOLIDATED PARENT CONSOLIDATED PARENT CONSOLIDATED PARENT
Current income tax $ (1,346.4) — (1,007.0) (418.2) (4,504.4) (4,110.9)Received from subsidiaries — 641.8 — 712.1 — 415.9Deferred IT (183.3) 624.7 (550.8) 597.0 (5.6) —Tax loss carryforwards
amortized — — — — 3,768.9 3,768.9Effects of inflation
(note 2B) — — 53.6 — 82.1 —$ (1,529.7) 1,266.5 (1,504.2) 890.9 (659.0) 73.9
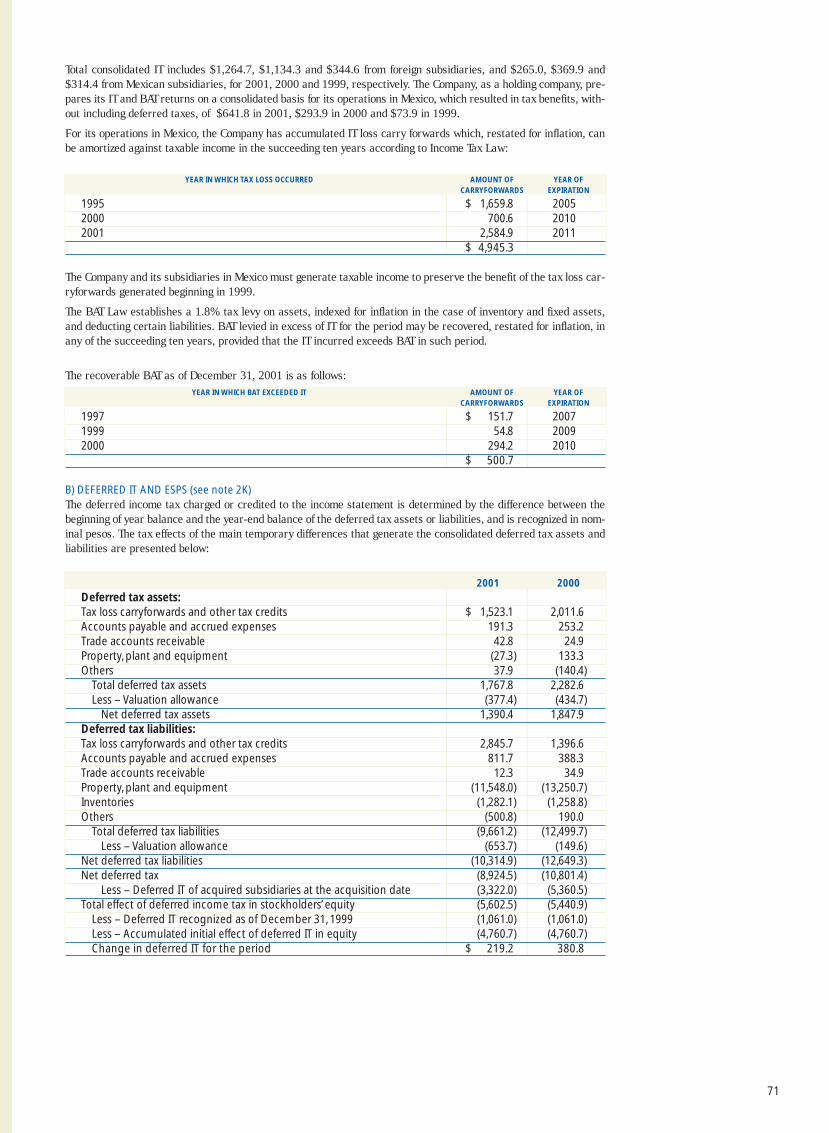
71
Total consolidated IT includes $1,264.7, $1,134.3 and $344.6 from foreign subsidiaries, and $265.0, $369.9 and$314.4 from Mexican subsidiaries, for 2001, 2000 and 1999, respectively. The Company, as a holding company, pre-pares its IT and BAT returns on a consolidated basis for its operations in Mexico, which resulted in tax benefits, with-out including deferred taxes, of $641.8 in 2001, $293.9 in 2000 and $73.9 in 1999.
For its operations in Mexico, the Company has accumulated IT loss carry forwards which, restated for inflation, canbe amortized against taxable income in the succeeding ten years according to Income Tax Law:
YEAR IN WHICH TAX LOSS OCCURRED AMOUNT OF YEAR OFCARRYFORWARDS EXPIRATION
1995 $ 1,659.8 20052000 700.6 20102001 2,584.9 2011
$ 4,945.3
The Company and its subsidiaries in Mexico must generate taxable income to preserve the benefit of the tax loss car-ryforwards generated beginning in 1999.
The BAT Law establishes a 1.8% tax levy on assets, indexed for inflation in the case of inventory and fixed assets,and deducting certain liabilities. BAT levied in excess of IT for the period may be recovered, restated for inflation, inany of the succeeding ten years, provided that the IT incurred exceeds BAT in such period.
The recoverable BAT as of December 31, 2001 is as follows:YEAR IN WHICH BAT EXCEEDED IT AMOUNT OF YEAR OF
CARRYFORWARDS EXPIRATION
1997 $ 151.7 20071999 54.8 20092000 294.2 2010
$ 500.7
B) DEFERRED IT AND ESPS (see note 2K)The deferred income tax charged or credited to the income statement is determined by the difference between thebeginning of year balance and the year-end balance of the deferred tax assets or liabilities, and is recognized in nom-inal pesos. The tax effects of the main temporary differences that generate the consolidated deferred tax assets andliabilities are presented below:
2001 2000
Deferred tax assets:Tax loss carryforwards and other tax credits $ 1,523.1 2,011.6Accounts payable and accrued expenses 191.3 253.2Trade accounts receivable 42.8 24.9Property, plant and equipment (27.3) 133.3Others 37.9 (140.4)
Total deferred tax assets 1,767.8 2,282.6Less – Valuation allowance (377.4) (434.7)
Net deferred tax assets 1,390.4 1,847.9Deferred tax liabilities:Tax loss carryforwards and other tax credits 2,845.7 1,396.6Accounts payable and accrued expenses 811.7 388.3Trade accounts receivable 12.3 34.9Property, plant and equipment (11,548.0) (13,250.7)Inventories (1,282.1) (1,258.8)Others (500.8) 190.0
Total deferred tax liabilities (9,661.2) (12,499.7)Less – Valuation allowance (653.7) (149.6)
Net deferred tax liabilities (10,314.9) (12,649.3)Net deferred tax (8,924.5) (10,801.4)
Less – Deferred IT of acquired subsidiaries at the acquisition date (3,322.0) (5,360.5)Total effect of deferred income tax in stockholders’ equity (5,602.5) (5,440.9)
Less – Deferred IT recognized as of December 31, 1999 (1,061.0) (1,061.0)Less – Accumulated initial effect of deferred IT in equity (4,760.7) (4,760.7)Change in deferred IT for the period $ 219.2 380.8
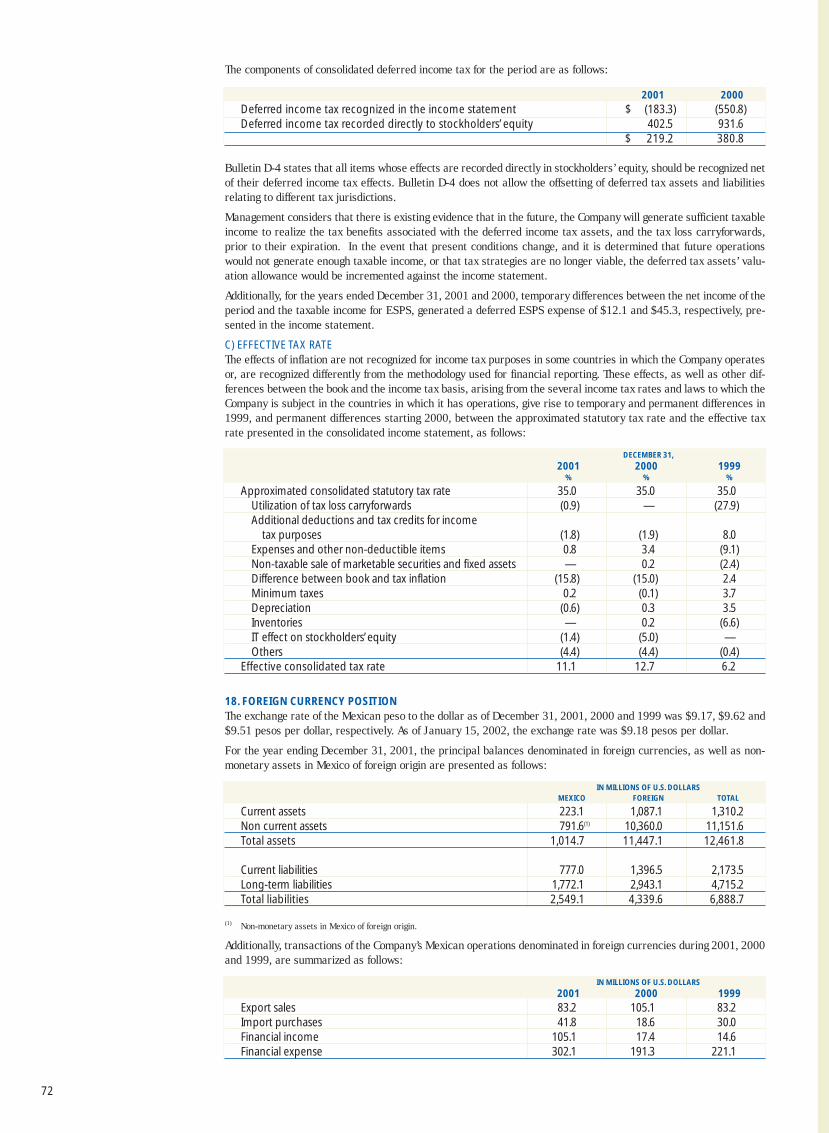
72
The components of consolidated deferred income tax for the period are as follows:
2001 2000
Deferred income tax recognized in the income statement $ (183.3) (550.8)Deferred income tax recorded directly to stockholders’ equity 402.5 931.6
$ 219.2 380.8
Bulletin D-4 states that all items whose effects are recorded directly in stockholders’ equity, should be recognized netof their deferred income tax effects. Bulletin D-4 does not allow the offsetting of deferred tax assets and liabilitiesrelating to different tax jurisdictions.
Management considers that there is existing evidence that in the future, the Company will generate sufficient taxableincome to realize the tax benefits associated with the deferred income tax assets, and the tax loss carryforwards,prior to their expiration. In the event that present conditions change, and it is determined that future operationswould not generate enough taxable income, or that tax strategies are no longer viable, the deferred tax assets’ valu-ation allowance would be incremented against the income statement.
Additionally, for the years ended December 31, 2001 and 2000, temporary differences between the net income of theperiod and the taxable income for ESPS, generated a deferred ESPS expense of $12.1 and $45.3, respectively, pre-sented in the income statement.
C) EFFECTIVE TAX RATEThe effects of inflation are not recognized for income tax purposes in some countries in which the Company operatesor, are recognized differently from the methodology used for financial reporting. These effects, as well as other dif-ferences between the book and the income tax basis, arising from the several income tax rates and laws to which theCompany is subject in the countries in which it has operations, give rise to temporary and permanent differences in1999, and permanent differences starting 2000, between the approximated statutory tax rate and the effective taxrate presented in the consolidated income statement, as follows:
DECEMBER 31,
2001 2000 1999% % %
Approximated consolidated statutory tax rate 35.0 35.0 35.0Utilization of tax loss carryforwards (0.9) — (27.9)Additional deductions and tax credits for income
tax purposes (1.8) (1.9) 8.0Expenses and other non-deductible items 0.8 3.4 (9.1)Non-taxable sale of marketable securities and fixed assets — 0.2 (2.4)Difference between book and tax inflation (15.8) (15.0) 2.4Minimum taxes 0.2 (0.1) 3.7Depreciation (0.6) 0.3 3.5Inventories — 0.2 (6.6)IT effect on stockholders’ equity (1.4) (5.0) —Others (4.4) (4.4) (0.4)
Effective consolidated tax rate 11.1 12.7 6.2
18. FOREIGN CURRENCY POSITIONThe exchange rate of the Mexican peso to the dollar as of December 31, 2001, 2000 and 1999 was $9.17, $9.62 and$9.51 pesos per dollar, respectively. As of January 15, 2002, the exchange rate was $9.18 pesos per dollar.
For the year ending December 31, 2001, the principal balances denominated in foreign currencies, as well as non-monetary assets in Mexico of foreign origin are presented as follows:
IN MILLIONS OF U.S. DOLLARSMEXICO FOREIGN TOTAL
Current assets 223.1 1,087.1 1,310.2Non current assets 791.6(1) 10,360.0 11,151.6Total assets 1,014.7 11,447.1 12,461.8
Current liabilities 777.0 1,396.5 2,173.5Long-term liabilities 1,772.1 2,943.1 4,715.2Total liabilities 2,549.1 4,339.6 6,888.7
(1) Non-monetary assets in Mexico of foreign origin.
Additionally, transactions of the Company’s Mexican operations denominated in foreign currencies during 2001, 2000and 1999, are summarized as follows:
IN MILLIONS OF U.S. DOLLARS
2001 2000 1999
Export sales 83.2 105.1 83.2Import purchases 41.8 18.6 30.0Financial income 105.1 17.4 14.6Financial expense 302.1 191.3 221.1
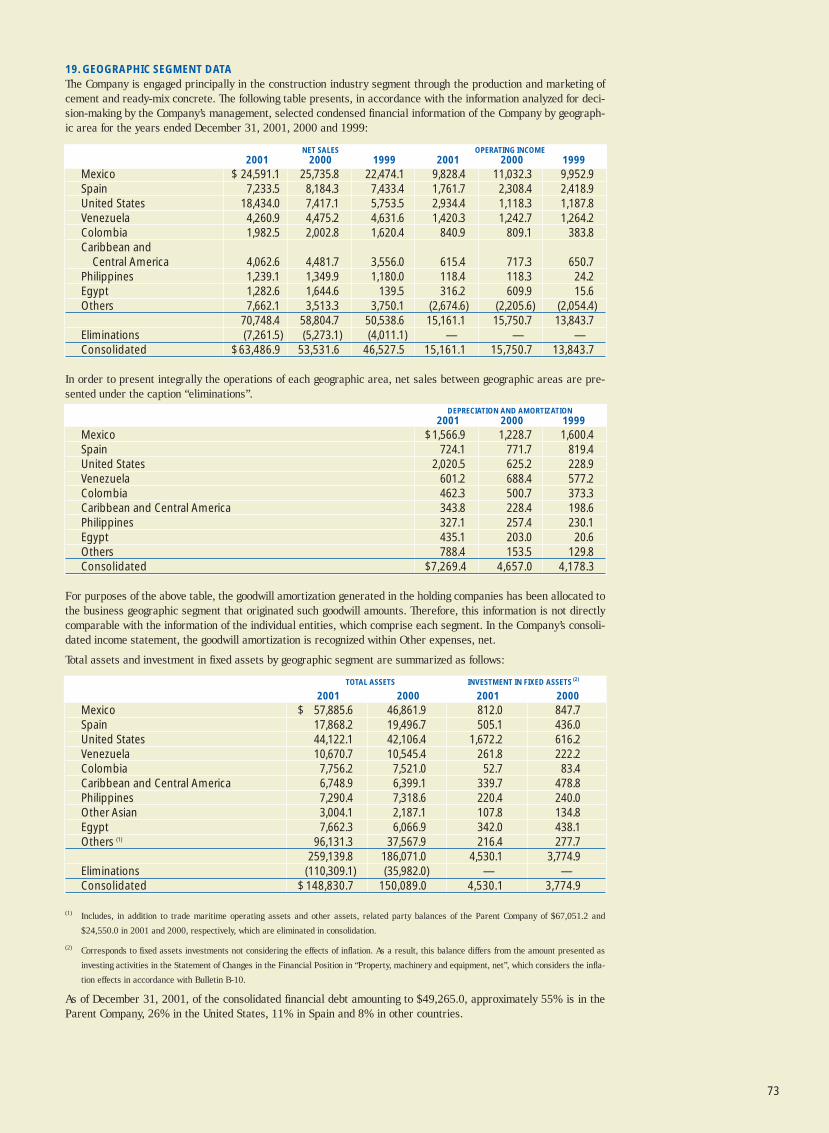
73
19. GEOGRAPHIC SEGMENT DATAThe Company is engaged principally in the construction industry segment through the production and marketing ofcement and ready-mix concrete. The following table presents, in accordance with the information analyzed for deci-sion-making by the Company’s management, selected condensed financial information of the Company by geograph-ic area for the years ended December 31, 2001, 2000 and 1999:
NET SALES OPERATING INCOME2001 2000 1999 2001 2000 1999
Mexico $ 24,591.1 25,735.8 22,474.1 9,828.4 11,032.3 9,952.9Spain 7,233.5 8,184.3 7,433.4 1,761.7 2,308.4 2,418.9United States 18,434.0 7,417.1 5,753.5 2,934.4 1,118.3 1,187.8Venezuela 4,260.9 4,475.2 4,631.6 1,420.3 1,242.7 1,264.2Colombia 1,982.5 2,002.8 1,620.4 840.9 809.1 383.8Caribbean and
Central America 4,062.6 4,481.7 3,556.0 615.4 717.3 650.7Philippines 1,239.1 1,349.9 1,180.0 118.4 118.3 24.2Egypt 1,282.6 1,644.6 139.5 316.2 609.9 15.6Others 7,662.1 3,513.3 3,750.1 (2,674.6) (2,205.6) (2,054.4)
70,748.4 58,804.7 50,538.6 15,161.1 15,750.7 13,843.7Eliminations (7,261.5) (5,273.1) (4,011.1) — — —Consolidated $63,486.9 53,531.6 46,527.5 15,161.1 15,750.7 13,843.7
In order to present integrally the operations of each geographic area, net sales between geographic areas are pre-sented under the caption “eliminations”.
DEPRECIATION AND AMORTIZATION2001 2000 1999
Mexico $ 1,566.9 1,228.7 1,600.4Spain 724.1 771.7 819.4United States 2,020.5 625.2 228.9Venezuela 601.2 688.4 577.2Colombia 462.3 500.7 373.3Caribbean and Central America 343.8 228.4 198.6Philippines 327.1 257.4 230.1Egypt 435.1 203.0 20.6Others 788.4 153.5 129.8Consolidated $7,269.4 4,657.0 4,178.3
For purposes of the above table, the goodwill amortization generated in the holding companies has been allocated tothe business geographic segment that originated such goodwill amounts. Therefore, this information is not directlycomparable with the information of the individual entities, which comprise each segment. In the Company’s consoli-dated income statement, the goodwill amortization is recognized within Other expenses, net.
Total assets and investment in fixed assets by geographic segment are summarized as follows:
TOTAL ASSETS INVESTMENT IN FIXED ASSETS (2)
2001 2000 2001 2000
Mexico $ 57,885.6 46,861.9 812.0 847.7Spain 17,868.2 19,496.7 505.1 436.0United States 44,122.1 42,106.4 1,672.2 616.2Venezuela 10,670.7 10,545.4 261.8 222.2Colombia 7,756.2 7,521.0 52.7 83.4Caribbean and Central America 6,748.9 6,399.1 339.7 478.8Philippines 7,290.4 7,318.6 220.4 240.0Other Asian 3,004.1 2,187.1 107.8 134.8Egypt 7,662.3 6,066.9 342.0 438.1Others (1) 96,131.3 37,567.9 216.4 277.7
259,139.8 186,071.0 4,530.1 3,774.9Eliminations (110,309.1) (35,982.0) — —Consolidated $ 148,830.7 150,089.0 4,530.1 3,774.9
(1) Includes, in addition to trade maritime operating assets and other assets, related party balances of the Parent Company of $67,051.2 and
$24,550.0 in 2001 and 2000, respectively, which are eliminated in consolidation.
(2) Corresponds to fixed assets investments not considering the effects of inflation. As a result, this balance differs from the amount presented as
investing activities in the Statement of Changes in the Financial Position in “Property, machinery and equipment, net”, which considers the infla-
tion effects in accordance with Bulletin B-10.
As of December 31, 2001, of the consolidated financial debt amounting to $49,265.0, approximately 55% is in theParent Company, 26% in the United States, 11% in Spain and 8% in other countries.
74
20. EARNINGS PER SHAREBasic earnings per share are calculated by dividing majority interest net income for the year by the weighted aver-age number of common shares outstanding during the year. Diluted earnings per share reflects, on the weighted aver-age number of common shares outstanding, the effects of any transactions carried out by the Company, which havea potentially diluting effect in such number of shares.
The weighted-average number of shares utilized in the calculation is as follows:
BASIC DILUTED
December 31, 2001 4,264,724,371 4,299,689,171December 31, 2000 4,123,703,259 4,143,760,773December 31, 1999 3,767,646,462 3,787,200,759
The difference between the basic and diluted number of shares in 2001, 2000 and 1999 is attributable to the addi-tional shares to be issued under the Company’s executive stock option plans (see note 15).
21. CONTINGENCIES AND COMMITMENTSA) GUARANTEESAs of December 31, 2001, Cemex, S.A. de C.V. has signed as guarantor of loans made to certain subsidiaries forapproximately U.S.$48.7 million.
B) TAX ASSESSMENTSAs of December 31, 2001, the Company and some of its subsidiaries in Mexico have been notified of several taxassessments determined by the Tax Authorities related to years prior to 1997. These tax assessments total approx-imately $3,114.3. The tax assessments result primarily from: (i) Recalculation of the inflationary tax deduction, sincethe tax authorities claim that “Advance Payments to Suppliers” and “Guaranty Deposits” are not by their nature cred-its; (ii) disallowed restatement of the tax loss carry forwards in the same period in which they occurred and (iii) dis-allowed reduction of BAT by the controlling entity for considering it should be in proportion of the equity interest ithas over the controlled entities. The companies involved are using all the available defense actions granted by law inorder to cancel the tax claims.
C) ANTI-DUMPING DUTIESIn 1990, the United States Department of Commerce (“DOC”) imposed an anti-dumping duty order on imports of grayPortland cement and clinker from Mexico. As a result, certain subsidiaries of the Company, as importers of record,have been subject to payment of anti-dumping duty deposits estimated on imports of gray Portland cement and clink-er from Mexico since April 1990. The order is likely to continue for an indefinite period, until the United States gov-ernment determines, taking into consideration the World Trade Organization new rules, that the conditions for impos-ing the order no longer exist and the cancellation or suspension of the order would follow. In the last quarter of 2000,the United States government continued the order, a resolution that will prevail until it makes a new review. DuringDecember 2001, the United States government (International Trade Commission) determined not to initiate a newreview as the Company requested it.
As of December 31, 2001, the Company has accrued a liability of U.S.$77.1 million, including accrued interest, forthe difference between the amount of anti-dumping duties paid on imports, and the latest findings by the DOC in itsadministrative reviews for all periods under review.
As of December 31, 2001, the Company is in the eleventh administrative review period by the DOC, and expects apreliminary resolution for the eleventh period in the second half of 2002. The United States government duringSeptember 2001 published the preliminary determination in respect of the tenth administrative review period, andduring the first quarter of 2002 the final resolution for the tenth period is expected to be issued. In respect to thefirst four review periods, the DOC has issued a final resolution of the anti-dumping duties. Referring to the remain-ing review periods, the final resolutions are suspended until all the procedures before the North America Free TradeAgreement Panel are concluded. As a result, the final amounts may be different from those recorded in the accom-panying consolidated financial statements. The Company and its subsidiaries have defended their position in this mat-ter and will continue to do so through available means in order to determine the actual dumping margins within eachperiod of the administration reviews carried out by the DOC.
75
During 2001, five Taiwanese cement producers filed before the Tariff Commission under the Ministry of Finance(“MOF”) of Taiwan, an anti-dumping case involving imported gray Portland cement and clinker from the Philippinesand Korea. In July 2001, the MOF informed the petitioners and the producers that a formal investigation had beeninitiated. Among the producers are APO Cement Corporation, Rizal Cement Co., Inc and Solid Cement Corporation,indirect subsidiaries of the Company, which received their anti-dumping questionnaires from the International TradeCommission under the Ministry of Economic Affairs (“ITC-MOEA”) in August 2001 and from the MOF also in August2001. Rizal and Solid replied to the ITC-MOEA by confirming that they have not been exporting cement or clinker dur-ing the review period. On the other hand, APO contested the allegation of “injury” in the anti-dumping proceedingsbefore the ITC-MOEA.
In a communication dated October 2001, the ITC-MOEA informed the petitioners and the respondent producers aboutthe results of the preliminary investigation, and it was determined that there are reasonable indicators that theTaiwanese industry presents material damage due to imports of cement and clinker from South Korea and thePhilippines that supposedly is sold in Taiwan at a price below market price. In order to comply with the regulationsof anti-dumping duties in Taiwan, the ITC-MOEA transferred this affair to the MOF. In November 2001, APO receivedsupplemental questionnaires by the MOF. The answer to these questionnaires was presented by APO duringNovember and December 2001.
A determination from the MOF is expected, depending on an extension that the MOF estimates appropriate, in anytime during January 2002. Actually, the Company cannot predict if the arguments of its subsidiary, in the anti-dump-ing case, will succeed or what will be the resolution of the MOF.
D) LEASES The Company has entered into various non-cancelable operating leases, primarily for the lease of operating facilities,cement storage and distribution facilities and certain transportation and other equipment, in which it is required tomake annual rental payments plus the payment of certain operating expenses. Future minimum rental payments dueunder such leases are summarized as follows:
U.S. DOLLARSYEAR ENDING DECEMBER 31, IN MILLIONS OF
2002 59.52003 51.22004 47.22005 41.72006 33.22007 and thereafter 153.5
386.3
Rental expense for the years ended December 31, 2001, 2000, and 1999 was approximately U.S.$67, U.S.$52 andU.S.$41 million, respectively.
E) PLEDGE ASSETSAs of December 31, 2001, there are liabilities amounting to U.S.$50.6 million secured by property, plant and equip-ment.
F) COMMITMENTSAs of December 31, 2001, subsidiaries of the Company have future commitments for the purchase of raw materialsfor an approximate amount of U.S.$32.7 million.
During 1999, the Company entered into agreements with an international partnership, which will build and operatean electrical energy generating plant. These agreements establish that when the plant begins operations, theCompany will purchase, starting in 2003, all of the energy generated by the plant for a term of no less than 20 years.As part of these agreements, the Company has committed to supply the electrical energy plant with all fuel neces-sary for its operation, a commitment that has been hedged through a 20-year agreement entered into by the Companywith Petróleos Mexicanos. By means of this transaction, the Company expects to have significant decreases in itselectrical energy costs, and the supply will be sufficient to cover approximately 60% of the electrical energy needsof 12 cement plants in Mexico. The Company is not required to make any capital investment in the project.
Under the terms of the agreement between the Company and the Indonesian government in connection with theinvestment in Gresik, the Indonesian government had a sale option, which was originally scheduled to expire inOctober 2001, to require the Company to purchase its 51% interest in Gresik for approximately U.S.$418 million($3,833), plus accrued interest from October 1998 at 8.2% per annum. This sale option was extended until December14, 2001 and expired without being exercised.
76
G) OTHER CONTINGENCIESAs of December 31 2001, Cemex Inc (formerly Southdown (see note 7)) a U.S. subsidiary of the Company acquiredin 2000 has accrued liabilities specifically relating to environmental matters in the aggregate amount of U.S.$28.9million. The environmental matters relate to a) in the past, in accordance with industry practice, disposing of vari-ous materials, which might be categorized as hazardous substances or wastes, and b) the cleanup of sites used oroperated by the Company, including discontinued operations, in regard to the disposal of hazardous substances orwastes, either individually or jointly with other parties. Most of the proceedings are in the preliminary stage, and afinal resolution might take several years. For purposes of recording the provision, the subsidiary considers that it isprobable that a liability has been incurred and the amount of the liability is reasonably estimable, whether or notclaims have been asserted, and without giving effect to any possible future recoveries. Based on information devel-oped to date, the subsidiary does not believe it will be required to spend significant sums on these matters in excessof the amounts previously recorded. Until all environmental studies, investigations, remediation work, and negotia-tions with or litigation against potential sources of recovery have been completed, however, the ultimate cost thatmight be incurred to resolve these environmental issues cannot be assured.
In May 2001, a subsidiary of the Company based in Colombia received a civil liability suit from 42 transporters, alleg-ing that this subsidiary is responsible for the supposed damages caused with the breach of provision of raw materi-als contracts. The plaintiffs have asked for relief in the amount of U.S.$60 million ($550.2). The Company filed aprompt defense response. This proceeding is in a preliminary stage.
In May 1999, several companies filed a lawsuit against two subsidiaries of the Company based in Colombia, alleg-ing that the Ibagué plants were causing a capacity production damage in their lands due to the pollution theygenerate. The plaintiffs demand a relief in the amount of U.S.$12.6 million ($115.5). This proceeding is in thediscovery period.
77
FINANCIAL
Cash earnings is defined as EBITDA minus net financialexpense, cash taxes (including employee statutory profitsharing), income attributable to minority interest (includingpreferred dividends) and other cash expenses (includingdumping charges). Cash earnings is not a GAAP measure.
EBITDA (operating cash flow) is operating income plusdepreciation and amortization. Amortization of goodwillis not included in operating income but is instead record-ed in other income (expense) below the operating line.EBITDA does not include certain extraordinary incomeand expenses that are not included in operating incomeunder Mexican GAAP.
Financial leverage is defined as net debt divided byEBITDA for the previous twelve months.
Free cash flow is defined as EBITDA less net financialexpense, cash taxes (including statutory profit sharing),maintenance and expansion capital expenditures,changes in working capital, preferred dividend payments,and other cash expenses (including dumping duties).Free cash flow is not a GAAP measure.
Interest coverage is defined as EBITDA before operatinglease payments and cost restatements for inflation, divid-ed by the sum of financial expenses and dividends onpreferred capital securities, all for the previous twelvemonths.
Net debt equals total debt plus preferred equity and cap-ital securities minus cash and cash equivalents. CEMEXis conservatively adding the preferred capital securities(US$250 million) because of the put option to CEMEXunder its structure and the remaining preferred equity(US$900 million).
Net working capital equals accounts receivable plusinventories minus trade payables.
INDUSTRY
Aggregates are sand and gravel, which are mined fromquarries. They give ready-mix concrete its necessary vol-ume and add to its overall strength. Under normal cir-cumstances, one cubic meter of fresh concrete containstwo metric tons of gravel and sand.
Clinker is an intermediate cement product. Limestone,clay and iron oxide are sintered in a kiln at around 1,450degrees Celsius to produce clinker. One metric ton ofclinker is used to make approximately 1.1 metric tons ofgray Portland cement.
Gray Portland cement is a hydraulic binding agent witha composition by weight of at least 95% clinker and 0-5% of a minor component (usually calcium sulfate). Itcan set and harden underwater and, when mixed withaggregates and water, produces concrete or mortar.Today, our research and development focuses on blendedcements. These specialty cements not only meet our cus-tomers’ more stringent demands, but they also reduceour energy consumption.
Installed capacity is the theoretical annual productioncapacity of a plant, whereas effective capacity is a plant’sactual optimal annual production capacity, which can be10-20% less than installed capacity.
Metric ton is the equivalent of 1.102 short tons.
Ready-mix concrete is a mixture of cement, aggregates,and water. It is a building material that is produced inbatching plants and delivered directly to the constructionsite. Stringent controls during the manufacturing processguarantee the quality and consistency of the finishedproduct.
White cement is strategic, high potential specialtycement, which is particularly suited for the world’s fastgrowing markets. It is not only used for decorative pur-poses, but it also has a wide range of uses as a structur-al building material.
the terms we use
78
Directors
Lorenzo H. Zambrano Chairman of the Board
Marcelo Zambrano Hellion (†) Honorary Chairman of the Board
Eduardo Brittingham Sumner
Lorenzo Milmo Zambrano
Armando J. García Segovia
Rodolfo García Muriel
Rogelio Zambrano Lozano
Roberto Zambrano Villarreal
Bernardo Quintana Isaac
Dionisio Garza Medina
Alfonso Romo Garza
Alternate Directors
Jorge García Segovia
Tomás Brittingham Longoria
Mauricio Zambrano Villarreal
Examiner
Luis Santos De la Garza
Alternate Examiner
Fernando Ruiz Arredondo
an experiencedmanagement team
Board of Directors
79
Lorenzo H. Zambrano, 57
Chairman of the Board and Chief Executive Officer
Mr. Zambrano joined CEMEX in 1968 and has been involved inall operational aspects of the business. He holds a B.S. degreein mechanical engineering from the Tec de Monterrey and anM.B.A. from Stanford University. He is a member of the Boardof Directors of Alfa, Cydsa, Empresas ICA, Femsa, Televisa,and Vitro. He is also the Chairman of the Board of the Tec deMonterrey, and a member of the Advisory Committee of theStanford Graduate School of Business, the InternationalAdvisory Board of Salomon Smith Barney, and the Chairman'sCouncil of DaimlerChrysler AG.
Héctor Medina, 51
Executive Vice President of Planning and Finance
Mr. Medina, who joined CEMEX in 1988, is a graduate of theTec de Monterrey with a degree in chemical engineering. Hereceived an M.S.C. degree in management from the Universityof Bradford Management Center in England and an M.S.degree from the Escuela de Organización Industrial in Spain.Mr. Medina is responsible for CEMEX’s worldwide strategicplanning and finance.
Francisco Garza, 46
President of the North America Region
Mr. Garza is a graduate of the Tec de Monterrey and has anM.B.A. from Cornell University’s Johnson Graduate School ofManagement. Since he joined CEMEX in 1988, he has occupiedseveral senior management positions in the company. Mr.Garza is directly responsible for CEMEX’s interests and opera-tions in Mexico and the U.S. and the company’s Trading unit.
Víctor M. Romo, 43
President of the South America & Caribbean Region
Mr. Romo joined CEMEX in 1985. He earned his Bachelor’sdegree in accounting and his M.S. degree in administrationfrom the Tec de Monterrey. Before assuming his current posi-tion, Mr. Romo was President of CEMEX’s Venezuelan sub-sidiary. He is now responsible for CEMEX’s interests and oper-ations in Venezuela, Colombia, Panama, the Caribbean, theDominican Republic, Haiti, Costa Rica, Nicaragua, and Chile.
José Luis Sáenz de Miera, 55
President of the Europe & Asia Region
Mr. Sáenz de Miera, who joined CEMEX in 1993, has a degree ineconomics from the Universidad de Madrid and in accountingfrom Spain’s Instituto de Censores Jurados de Cuentas. Hehas held several management positions within CEMEX.Appointed in 1998 to this position, he is directly responsiblefor supervising CEMEX’s interests and operations in Spain, thePhilippines, Indonesia, Egypt, Thailand, Bangladesh, andTaiwan.
Armando J. García, 49
Executive Vice President of Development
Mr. García, who originally joined CEMEX in 1975 and rejoinedthe company in 1985, holds a degree in mechanical engineeringand business administration from the Tec de Monterrey andhas an M.B.A. from the University of Texas. He is responsiblefor managing CEMEX’s operations technology, human resources,energy, procurement, and information technology.
Mario de la Garza, 62
Senior Vice President of Administration
Mr. de la Garza, who joined CEMEX in 1965, is a C.P.A. Hegraduated from the Universidad Autónoma de Nuevo Leónwith a degree in philosophy and attended the Programa deAlta Dirección de Empresas, AD2, at the InstitutoPanamericano de Alta Dirección de Empresa.
Rodrigo Treviño, 45
Chief Financial Officer
Mr. Treviño, who joined CEMEX in 1997, received his B.S. andM.S. degrees in industrial engineering from StanfordUniversity. He is responsible for the company’s finance,reporting, capital markets, treasury, and investor relations.
Juan Pablo San Agustín, 33
President of CxNetworks
Mr. San Agustín, who joined CEMEX in 1997, earned his B.A.
and M.B.A. from the Instituto de Empresa in Madrid. He isthe chief executive of CxNetworks, a CEMEX subsidiary thatis devoted to creating sources of growth by building new andinnovative businesses around CEMEX's strengths.
Executive Officers
80
Bangladesh75 Suhrawardi AvenueBlock K, BaridharaDhaka 1212, BangladeshPhone: (88) 01.181.0318 / 21Fax: (88) 02.881.4521
ColombiaCarrera 14 Nº 93 B-32 Piso 2Bogotá, ColombiaPhone: (571) 634.0030Fax: (571) 634.0333
Costa RicaPlaza Roble, Edificio El Pórtico 3er. NivelAutopista Próspero FernándezGuachipelín de Escazú, Apdo. 6558-1000San José de Costa RicaPhone: (506) 201.8200Fax: (506) 201.8202
Dominican RepublicAv. John F. KennedyEsquina Horacio Blanco FombonaApdo. 285-2Santo Domingo, República DominicanaPhone: (809) 683.4901Fax: (809) 683.4952
Egypt3 Abbas El Akkad Street, Floors 6,7 & 8Nars City, Cairo, EgyptPhone: (202) 497.8600Fax: (202) 260.3325
IndonesiaJakarta Stock Exchange BuildingTower II, 24th FloorSudirman Central Business DistrictJI. Jend. Sudirman Kav. 52-53Jakarta 12190 IndonesiaPhone: (6221) 5299.3400Fax: (6221) 5299.3440
MexicoAv. Presidente Masarik 101 Piso 18Polanco, C.P. 11570México D.F. MéxicoPhone: (5255) 5726.9040Fax: (5255) 5203.2542
NicaraguaKm. 3.5 Carretera Sur, desvío BataholaContiguo NicalitManagua, NicaraguaPhone: (505) 266.1027Fax: (505) 266.2325
PanamaPlaza Credicorp Bank Panamá, Piso 28Calle 50, entre c/59 y 60Bella Vista, Panamá 5C.P. 7262 República de PanamáPhone: (507) 278.8700Fax: (507) 278.8765
Philippines24th Floor, Petron Mega Plaza358 Sen. Gil J. Puyat AvenueMakati City, Philippines 1200Phone: (632) 849.3600Fax: (632) 849.3639
Singapore3 Temasek Avenue, 22-01 Centennial TowerSingapore 039190Phone: (65) 433.0700Fax: (65) 433.0780
SpainHernández de Tejada Nº 1C.P. 28027 Madrid, EspañaPhone: (3491) 377.9200Fax: (3491) 377.9203
TaiwanRoom 132, 17 F/B Nº 167, Tun-Hwa N. Rd.Taipei, Taiwan, R.O.C. 167Phone: (886) 2.2727.2676Fax: (886) 2.2717.1675
Thailand2034/132-161 Ital-Thai Tower Floor 34Bangkapi, Huaykwang, Bangkok 10320ThailandPhone: (622) 716.0003Fax: (622) 716.1555
United StatesU.S. Operations Headquarters:1200 Smith Street Suite 2400Houston, TX 77002 USAPhone: (713) 650.6200Fax: (713) 653.6815
New York Office:590 Madison Ave. 41st FloorNew York, NY 10022 USAPhone: (212) 317.6000Fax: (212) 317.6047
VenezuelaCalle Londres, entre c/Nueva York y TrinidadTorre CEMEX VenezuelaUrbanización Las MercedesCaracas, 1060 VenezuelaPhone: (58212) 999.7000Fax: (58212) 999.7302
Directory
Headquarters
Av. Constitución 444 Pte.
C.P. 64000 Apdo. Postal 392
Monterrey, N.L., México
Phone: (5281) 8328.3000
Fax: (5281) 8328.3188
81
The information presented herein contains certain forward-looking statements and information relating to CEMEX, S.A. de C.V. and its subsidiaries (col-lectively, "CEMEX") that are based on the beliefs of its management as well as assumptions made by and information currently available to CEMEX. Suchstatements reflect the current views of CEMEX with respect to future events and are subject to certain risks, uncertainties, and assumptions. Many fac-tors could cause the actual results, performance, or achievements of CEMEX to be materially different from any future results, performance, or achieve-ments that may be expressed or implied by such forward-looking statements, including, among others, changes in general economic, political, govern-mental, and business conditions globally and in the countries in which CEMEX does business, changes in interest rates, changes in inflation rates, changesin exchange rates, the level of construction generally, changes in cement demand and prices, changes in raw material and energy prices, changes in busi-ness strategy, and various other factors. Should one or more of these risks or uncertainties materialize, or should underlying assumptions prove incor-rect, actual results may vary materially from those described herein as anticipated, believed, estimated, or expected. CEMEX does not intend, and doesnot assume any obligation, to update these forward-looking statements. In addition, certain information presented herein was extracted from informa-tion published by various official sources. This information includes statistical information relating to the cement industry, certain reported rates of infla-tion, exchange rates, and information relating to the countries in which CEMEX operates. CEMEX has not participated in the preparation or compilationof any of such information and accepts no responsibility thereof.
Exchange listings:
Bolsa Mexicana de Valores (BMV), Mexico
New York Stock Exchange (NYSE), U.S.
Share series:
CPO (representing two A shares
and one B share)
BMV ticker symbol:
CEMEX CPO
NYSE ticker symbol:
CX
Investor relations contact:
From the U.S.: 1 877 7CX NYSE
From other countries: (212) 317.6000
Fax: (212) 317.6047
Media relations contact:
Phone: (5281) 8152.2739
Fax: (5281) 8152.2750
Internet:
www.cemex.com
DES
IGN
:SIG
NI/
PH
OTO
:H.A
.HER
RER
A -
G.C
OV
IAN
/PR
INTI
NG
:WET
MO
RE
& C
O
Investor and media information