Embed Size (px)
Citation preview

Trust and Corruption in Transition
Eric M. Uslaner
Trust and Corruption in Transition
Eric M. Uslaner
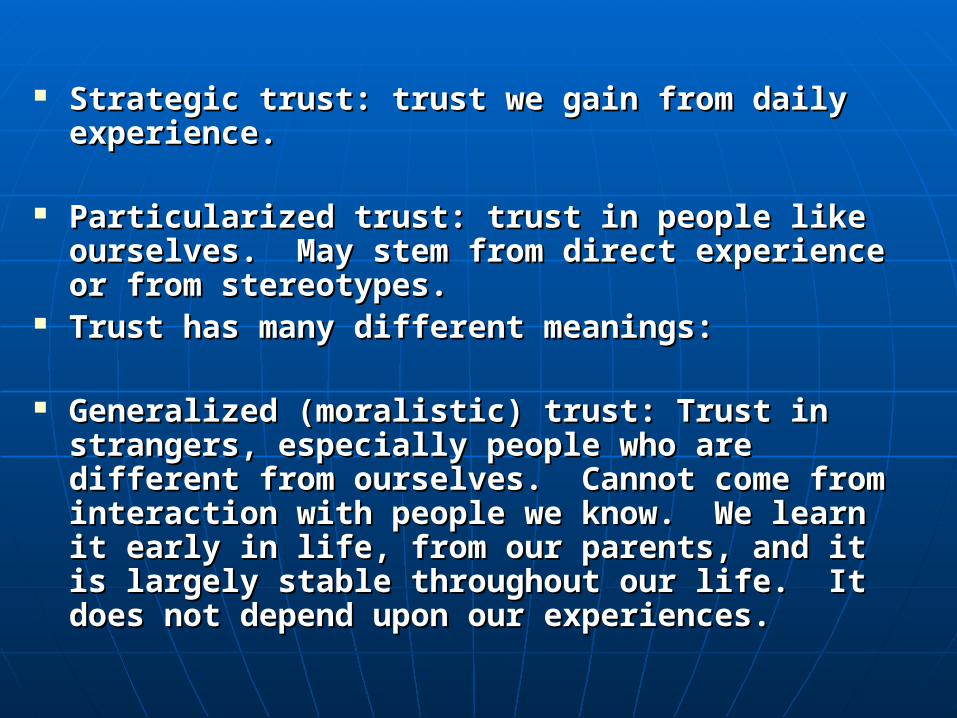
Strategic trust: trust we gain from daily Strategic trust: trust we gain from daily experience.experience.
Particularized trust: trust in people like Particularized trust: trust in people like ourselves. May stem from direct experience ourselves. May stem from direct experience or from stereotypes.or from stereotypes.
Trust has many different meanings:Trust has many different meanings:
Generalized (moralistic) trust: Trust in Generalized (moralistic) trust: Trust in strangers, especially people who are strangers, especially people who are different from ourselves. Cannot come from different from ourselves. Cannot come from interaction with people we know. We learn it interaction with people we know. We learn it early in life, from our parents, and it is early in life, from our parents, and it is largely stable throughout our life. It does largely stable throughout our life. It does not depend upon our experiences.not depend upon our experiences.

Strategic trust reflects our immediate experience. Strategic trust reflects our immediate experience. But generalized trust does not reflect our But generalized trust does not reflect our immediate experience—such as income, life immediate experience—such as income, life experiences (divorce, being the victim of crime, experiences (divorce, being the victim of crime, friendship patterns, or even civic engagement). friendship patterns, or even civic engagement). Instead, generalized trust is learned early in life Instead, generalized trust is learned early in life and doesn’t change much.and doesn’t change much.
Generalized trusters generally dismiss negative Generalized trusters generally dismiss negative experiences as exceptions to the rule. They are experiences as exceptions to the rule. They are optimists who believe that they are in control of optimists who believe that they are in control of their lives. their lives.
We learn generalized trust from our parents, not We learn generalized trust from our parents, not from our political institutions.from our political institutions.
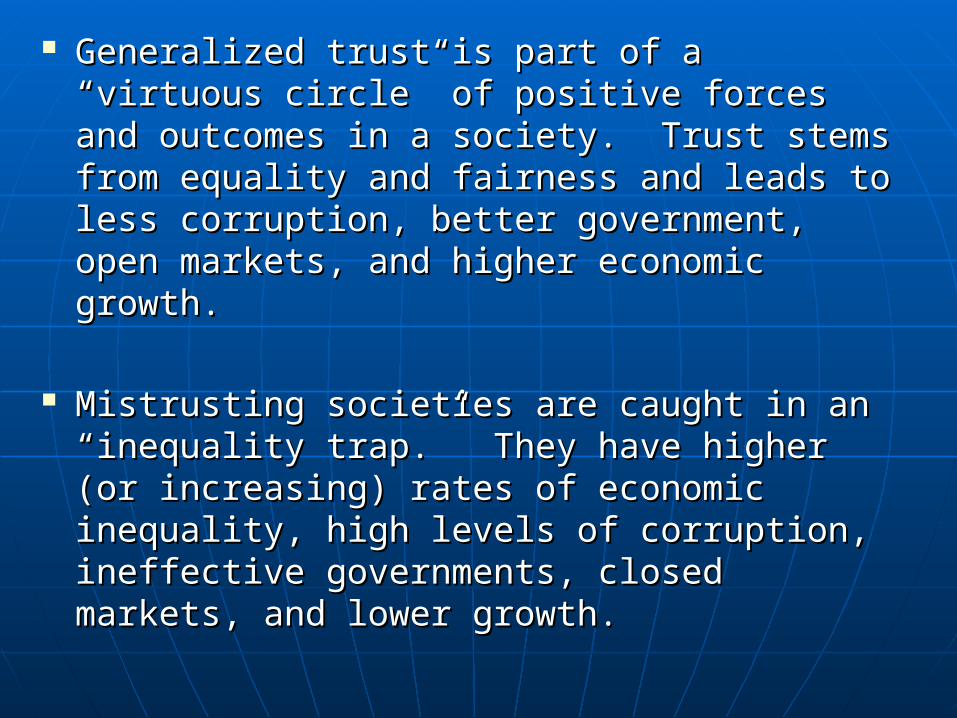
Generalized trust is part of a “virtuous Generalized trust is part of a “virtuous circle” of positive forces and outcomes in a circle” of positive forces and outcomes in a society. Trust stems from equality and society. Trust stems from equality and fairness and leads to less corruption, better fairness and leads to less corruption, better government, open markets, and higher government, open markets, and higher economic growth.economic growth.
Mistrusting societies are caught in an Mistrusting societies are caught in an “inequality trap.” They have higher (or “inequality trap.” They have higher (or increasing) rates of economic inequality, increasing) rates of economic inequality, high levels of corruption, ineffective high levels of corruption, ineffective governments, closed markets, and lower governments, closed markets, and lower growth.growth.

Inequality CorruptionMistrust
Low GrowthBad
Government
Closed Markets

Generalized trust is the key to solving many Generalized trust is the key to solving many collective action problems. Countries with high collective action problems. Countries with high levels of generalized trust have higher growth levels of generalized trust have higher growth rates, more open markets, less corruption, less rates, more open markets, less corruption, less crime, better functioning government, and spend crime, better functioning government, and spend more on redistributive programs that benefit the more on redistributive programs that benefit the poor. Generalized trust is also strongly associated poor. Generalized trust is also strongly associated with universal social welfare programs such as we with universal social welfare programs such as we see in Sweden.see in Sweden.
Generalized trusters are more tolerant of Generalized trusters are more tolerant of minorities and are more likely to support rights for minorities and are more likely to support rights for these groups. They are also more supportive of these groups. They are also more supportive of immigrants and of open markets as well as of an immigrants and of open markets as well as of an active role for their country in world affairs. active role for their country in world affairs.

Democracy does NOT lead to greater trust in Democracy does NOT lead to greater trust in fellow citizens. Many who have written about fellow citizens. Many who have written about trust (Margaret Levi, Bo Rothstein, Jean Cohen, trust (Margaret Levi, Bo Rothstein, Jean Cohen, Claus Offe, Wendy Rahn and John Brehm) argue Claus Offe, Wendy Rahn and John Brehm) argue that the state can produce trust in fellow citizens that the state can produce trust in fellow citizens by impartial institutions that lead people to by impartial institutions that lead people to believe that evil doers will not get away with their believe that evil doers will not get away with their misdeeds.misdeeds.
Trust is but one route to get compliance with the Trust is but one route to get compliance with the law. When trust in other people is high, people law. When trust in other people is high, people are more likely to behave honestly. But they may are more likely to behave honestly. But they may also behave honestly if the government strictly also behave honestly if the government strictly enforces the law. We may not see much enforces the law. We may not see much difference in compliance with the law in high difference in compliance with the law in high trusting societies such as Sweden and countries trusting societies such as Sweden and countries such as Singapore where even minor violations of such as Singapore where even minor violations of the law will be severely punished.the law will be severely punished.

Democratization is not a direct route to trust.
The correlation between change in trust in 22 nations from 1981 to the early 1990s (according to the World Values Survey) and variations in Freedom House scores from 1978 to 1988 is modestly negative (-.381). Yet, even this result turns out to be largely an illusion. Without the outlying cases of Argentina and South Korea, the correlation drops the correlation to -.076. An Indian journalist commented on the sharp cleavages that led to a cycle of unstable coalitions, none of which could form a government: “We have the hardware of democracy, but not the software, and that can’t be borrowed or mimicked.”

There is little empirical evidence that There is little empirical evidence that either strong institutions or faith in either strong institutions or faith in government lead to generalized government lead to generalized trust. Generally, the correlations trust. Generally, the correlations between trust in people and trust in between trust in people and trust in government are not large. Trust in government are not large. Trust in people reflects a deep-seated value people reflects a deep-seated value that doesn’t change readily. Trust in that doesn’t change readily. Trust in government reflects satisfaction with government reflects satisfaction with the performance of the current the performance of the current regime.regime.
Democracy may not create trust, but Communism certainly Democracy may not create trust, but Communism certainly destroyed both trust and participation in voluntary destroyed both trust and participation in voluntary associations. The totalitarian regime made it risky to trust associations. The totalitarian regime made it risky to trust anyoneanyone, even family members. So it is hardly surprising , even family members. So it is hardly surprising that few people in transition countries believe that “most that few people in transition countries believe that “most people can be trusted.” As Marc Morje Howard argued in people can be trusted.” As Marc Morje Howard argued in The Weakness of Civil Society in Postcommunist EuropeThe Weakness of Civil Society in Postcommunist Europe, , people in Communist countries saw civic associations as people in Communist countries saw civic associations as instruments of the state. Even after Communism fell, instruments of the state. Even after Communism fell, people still viewed civic associations with suspicion. They people still viewed civic associations with suspicion. They also remained wary of their fellow citizens.also remained wary of their fellow citizens.
The following tables show the percentage of The following tables show the percentage of group members in Western and transition group members in Western and transition countries, respectively.countries, respectively.
The levels of both trust and civic participation The levels of both trust and civic participation among people in transition countries are low. among people in transition countries are low.
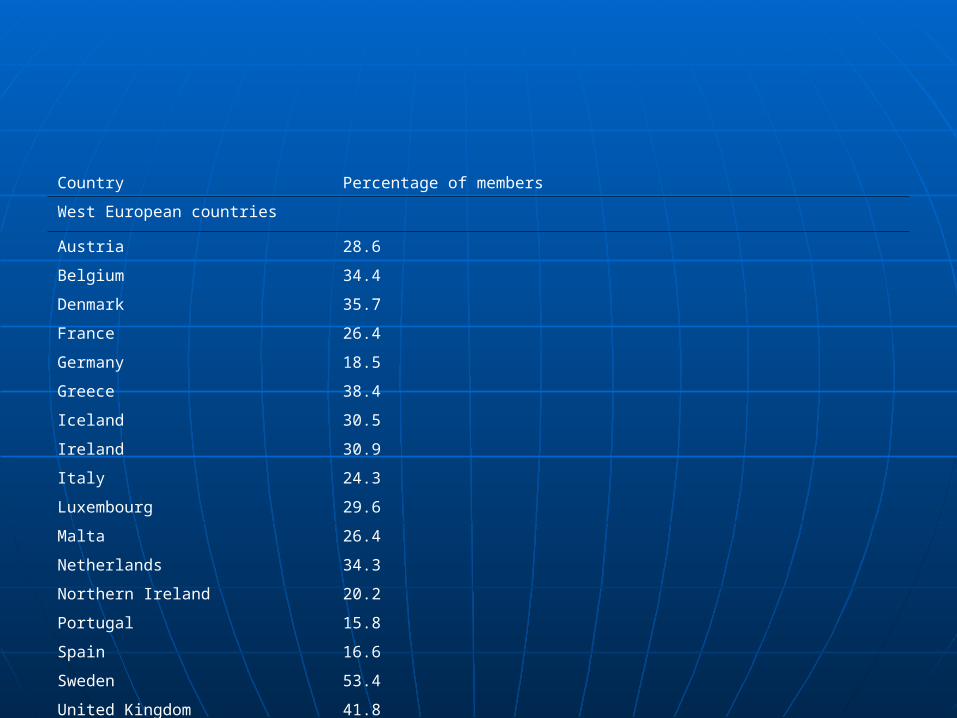
Country Percentage of members
West European countries
Austria 28.6
Belgium 34.4
Denmark 35.7
France 26.4
Germany 18.5
Greece 38.4
Iceland 30.5
Ireland 30.9
Italy 24.3
Luxembourg 29.6
Malta 26.4
Netherlands 34.3
Northern Ireland 20.2
Portugal 15.8
Spain 16.6
Sweden 53.4
United Kingdom 41.8

East European countries
Belarus 14
Bulgaria 13.7
Croatia 21.5
Czech Republic. 30.8
Estonia 17.4
Hungary 14.6
Latvia 20.5
Lithuania 13.8
Poland 12.4
Romania 9.6
Russia 4.6
Slovakia 47
Slovenia 27
Ukraine 9.2

Trust is much lower in transition countries than it is in the Trust is much lower in transition countries than it is in the West. In the World Values Survey, the mean percentage of West. In the World Values Survey, the mean percentage of people who agree that “most people can be trusted” is 42%, people who agree that “most people can be trusted” is 42%, with a standard deviation (spread) of 11.3. There is a wide with a standard deviation (spread) of 11.3. There is a wide range of variation in the level of trust among Western range of variation in the level of trust among Western nations. The most trusting countries include the Nordic nations. The most trusting countries include the Nordic nations: Norway (65%), Sweden (60%), Denmark (58%), the nations: Norway (65%), Sweden (60%), Denmark (58%), the Netherlands (54%), Canada (53%), and Finland (49%).Netherlands (54%), Canada (53%), and Finland (49%).
Transition countries rank much lower in trust than the West. Transition countries rank much lower in trust than the West. The mean share of trusting people is 23.7%, with a tiny The mean share of trusting people is 23.7%, with a tiny standard deviation (5.7). standard deviation (5.7). Transition countries have Transition countries have almost uniformly lower levels of trust, as we see in almost uniformly lower levels of trust, as we see in the following list:the following list:

Share of Trusters in Transition CountriesShare of Trusters in Transition Countries
CountryCountry Trust Share Trust Share ArmeniaArmenia 2525 AzerbaijanAzerbaijan 2121 BelarusBelarus 2424 BosniaBosnia 2828 BulgariaBulgaria 3030 Croatia Croatia 2525 CzechCzech 3030 East GermanyEast Germany 25 25 EstoniaEstonia 2222 GeorgiaGeorgia 2323 HungaryHungary 2525 LatviaLatvia 2525 LithuaniaLithuania 2222 MacedoniaMacedonia 8 8 MoldovaMoldova 2222 MontenegroMontenegro 3232 PolandPoland 1818 RomaniaRomania 1616 RussiaRussia 2424 SerbiaSerbia 3030 SlovakiaSlovakia 2323 SloveniaSlovenia 1616 UkraineUkraine 3131

The eight formerly Communist countries included in the World Values Survey in both 1990 and 1995-97 (Belarus, East Germany, Estonia, Latvia, Lithuania, Poland, Russia, and Slovenia) became five percent less trusting, but the average democracy score from Freedom House increased from a “not free” 11 in 1988 to a more “free” 4.75 in 1998.
Every transition country included in both surveys except for Belarus and (barely) Slovenia had a lower level of trust in 2000 than in 1990. From 1990 to 1995, eight of nine transition countries had lower levels of trust (the exception being Latvia).

Our Romanian survey of the mass public had a companion Our Romanian survey of the mass public had a companion survey of organizational activists in Cluj-Napoca. These survey of organizational activists in Cluj-Napoca. These activists are generally young people, often university activists are generally young people, often university students. Organizational activists are far more participatory, students. Organizational activists are far more participatory, trusting, and tolerant than ordinary citizens in Romania. trusting, and tolerant than ordinary citizens in Romania.
Organizational activists resemble ordinary citizens in Western Organizational activists resemble ordinary citizens in Western democracy more than they do citizens in Romania or other democracy more than they do citizens in Romania or other transition countries.transition countries.
24% of organizational activists volunteer for youth, 24% of organizational activists volunteer for youth, environmental, animal rights, peace, charity, consumer, or environmental, animal rights, peace, charity, consumer, or women’s organizations. 8.7% donate money to these same women’s organizations. 8.7% donate money to these same organizations. 38% volunteer for organizations. 38% volunteer for some type of organizationsome type of organization and 18% give to some charitable cause. Organizational and 18% give to some charitable cause. Organizational activists are also more likely to participate in politics. On our activists are also more likely to participate in politics. On our scale of 12 political acts, organizational activists took part in scale of 12 political acts, organizational activists took part in an average of 2.6, with the most active involved in 3.4 acts, an average of 2.6, with the most active involved in 3.4 acts, compared to .8 for the mass public.compared to .8 for the mass public.
Organizational activists are more trusting (both of other Organizational activists are more trusting (both of other people and political institutions) and are more tolerant:people and political institutions) and are more tolerant:

Activists Most active volunteers General public
Trust
other low 25.8 23.6 41.9
people middle 18.1 16.1 22.8
Trust in
high 56.1 60.3 35.3
Justice2 4.4 4.7 4.3
Trust in EU 5.4 6.1 5.5
Tolerance public meetings 6 6.4 4.3
neighbors 6 6.6 4.2

Across many countries (and over time in the United States), Across many countries (and over time in the United States), there is one “real-life” factor that shapes both optimism and there is one “real-life” factor that shapes both optimism and trust: the level of economic inequality in a country. The more trust: the level of economic inequality in a country. The more inequality, the less trust. Equality promotes the vision of a inequality, the less trust. Equality promotes the vision of a shared fate, where others are part of your “moral shared fate, where others are part of your “moral community.”community.”
ARG
AUS
ASTBEL
BRZ
UK
CAN
CHL
COL
CYP
DEN
DOM
FIN
FRA
GHA
GRE
IND
IRE
ISR
ITA
JPN
LUX
MEX
HOL
NZ
NIG
NOR
PRU
PHL
POR
SAF
SKRSPN
SWE
SWZ
TAI
TUR
USA
URU
VNZ
WGR
0.2
.4.6
Mos
t Peo
ple
Can
Be
Tru
sted
.2 .3 .4 .5 .6Gini index economic inequality
r2 = .391
Former and Current Communist Nations ExcludedTrust in People and Economic Inequality

In an unequal world, it is difficult In an unequal world, it is difficult to establish bonds between those to establish bonds between those at the top and those at the at the top and those at the bottom. Trust also depends upon bottom. Trust also depends upon a foundation of optimism and a foundation of optimism and control. People are optimistic control. People are optimistic and feel that they have control and feel that they have control over their environment when the over their environment when the gap between the rich and the gap between the rich and the poor is small.poor is small.

People in trusting countries, especially the West, People in trusting countries, especially the West, are far more optimistic than people in transition are far more optimistic than people in transition countries. Many people in transition countries have countries. Many people in transition countries have lost faith that the future will be better than the pastlost faith that the future will be better than the past—and they will look upon others with suspicion.—and they will look upon others with suspicion.
The statistical models estimating trust in the West The statistical models estimating trust in the West and in transition countries work well for both sets of and in transition countries work well for both sets of countries. In both sets of countries, using data countries. In both sets of countries, using data from the World Values Survey, I found that from the World Values Survey, I found that optimism for the future was by far the strongest optimism for the future was by far the strongest predictor of generalized trust (Uslaner, “Civic predictor of generalized trust (Uslaner, “Civic Engagement in East and West” in Badescu and Engagement in East and West” in Badescu and Uslaner, eds., Uslaner, eds., Social Capital and the Transition to Social Capital and the Transition to DemocracyDemocracy. .
As the graph shows, the connection As the graph shows, the connection between trust and inequality only between trust and inequality only holds for countries without a legacy of holds for countries without a legacy of Communism. In the transition Communism. In the transition countries, the correlation between countries, the correlation between trust and inequality is very low (r = trust and inequality is very low (r = -.25). -.25).
Some of this may be due to the Some of this may be due to the structure of the economy in the East structure of the economy in the East prior to transition (manufactured prior to transition (manufactured equality) or the poor measurement of equality) or the poor measurement of trust in surveys. trust in surveys.
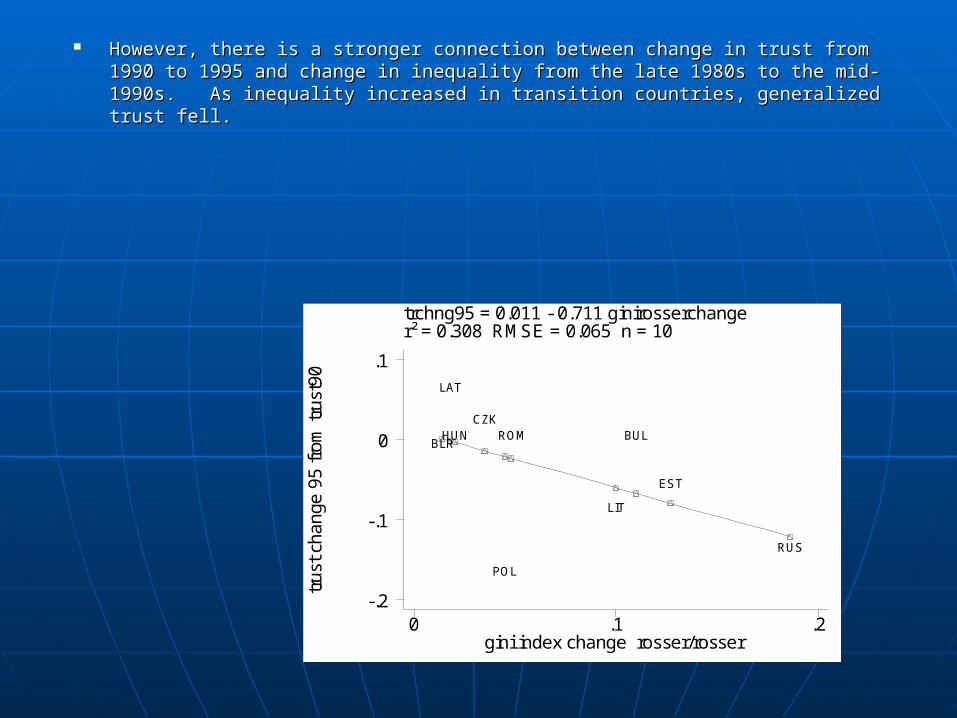
However, there is a stronger connection between change in trust from 1990 to 1995 However, there is a stronger connection between change in trust from 1990 to 1995 and change in inequality from the late 1980s to the mid-1990s. As inequality and change in inequality from the late 1980s to the mid-1990s. As inequality increased in transition countries, generalized trust fell.increased in transition countries, generalized trust fell.
trchng95 = 0.011 - 0.711 ginirosserchanger² = 0.308 RMSE = 0.065 n = 10
tru
st c
ha
nge
95
fro
m t
rust
90
gini index change rosser/rosser0 .1 .2
-.2
-.1
0
.1
BLR
LAT
HUNCZK
POL
ROM
LIT
BUL
EST
RUS

There are two related aspects of There are two related aspects of government that are important for government that are important for generalized trust:generalized trust:
Corruption Corruption Fairness of the legal systemFairness of the legal system Both are key issues in transition Both are key issues in transition
countries.countries.
The roots of corruption lie in the unequal distribution of resources in a society. Economic inequality provides a fertile breeding ground for corruption–and, in turn, it leads to further inequalities. The connection between inequality and the quality of government is not necessarily so simple: As the former Communist nations of Central and Eastern Europe show, you can have plenty of corruption without economic inequality. The path from inequality to corruption may be indirect–through generalized trust–but the connection is key to understanding why some societies are more corrupt than others.
Even though transition countries have had--and still Even though transition countries have had--and still have--lower levels of inequality, increasing inequality have--lower levels of inequality, increasing inequality since transition is linked with increasing corruption.since transition is linked with increasing corruption.

My argument stands in contrast to more traditional institutional accounts of corruption, which often suggest that the cure for malfeasance is to put the corrupt politicians in jail. If we do so (and we ought to do so), they will be replaced by other corrupt leaders. Nor do we need a reformed system of government that either centralizes power to herd in independent “entrepreneurs” who extort businesses or average citizens (Treisman, 1999) or decentralizes power to prevent an all-powerful “grabbing hand” (DiFrancesco and Gitelman, 1984, 618; Fisman and Gatti, 2000; Kunicova and Rose-Ackerman, 2004).

Changing institutions may not be easy, but its difficulty pales by comparison with reshaping a society’s culture or its distribution of wealth (and power). Corruption, inequality, and trust are all “sticky”: They don’t change much over time. Yet, all is not lost: As we shall see, there are more malleable ways to control corruption: Policy choices that countries make also shape corruption. Countries that have very high levels of regulation of business have more corruption. In turn, the level of regulation is shaped by the fairness of the legal system, the openness of the economy, and whether the government is military or civilian.
Corruption is higher in transition countries Corruption is higher in transition countries than in the West. The mean score on than in the West. The mean score on Transparency International’s 2004 Transparency International’s 2004 Corruption Perceptions Index for transition Corruption Perceptions Index for transition countries is 3.5 (0 = completely corrupt, 10 countries is 3.5 (0 = completely corrupt, 10 = completely honest). For the West, the = completely honest). For the West, the mean score is 7.9.mean score is 7.9.
The fairness of the legal system is also The fairness of the legal system is also much lower in transition countries. The much lower in transition countries. The mean score on the mean score on the Economist Intelligence Economist Intelligence Unit’s Unit’s legal fairness measure for 2004 is legal fairness measure for 2004 is 2.6, compared to 4.4 for the West (1 = very 2.6, compared to 4.4 for the West (1 = very unfair, 5 = very fair).unfair, 5 = very fair).
Corruption and an unfair legal system Corruption and an unfair legal system can lead to less trust because they can lead to less trust because they exacerbate inequality. exacerbate inequality.
Corruption thrives in an atmosphere Corruption thrives in an atmosphere of inequality. And the unfairness of of inequality. And the unfairness of the legal system gives advantages to the legal system gives advantages to those with political and economic those with political and economic power.power.

34 percent of people in societies where corruption was seen as widespread thought the only way you could get ahead was by luck, compared to 29 percent in honest societies. People who believed that the future looked bright were significantly less likely to condone buying stolen goods or taking bribes. If you live in a more honest society, you are less likely to condone cheating on taxes.
Corruption leads to the belief that there is no way to get ahead fairly–so that the ideals underlying what Rawls calls a “well-ordered society” do not develop strong roots. In a “well-ordered” society “everyone accepts and knows that the others accept the same principles of justice, and the basic social institutions satisfy and are known to satisfy these principles” (Rawls, 1971:454). It is prosperous and its government earns the approval of its citizens.

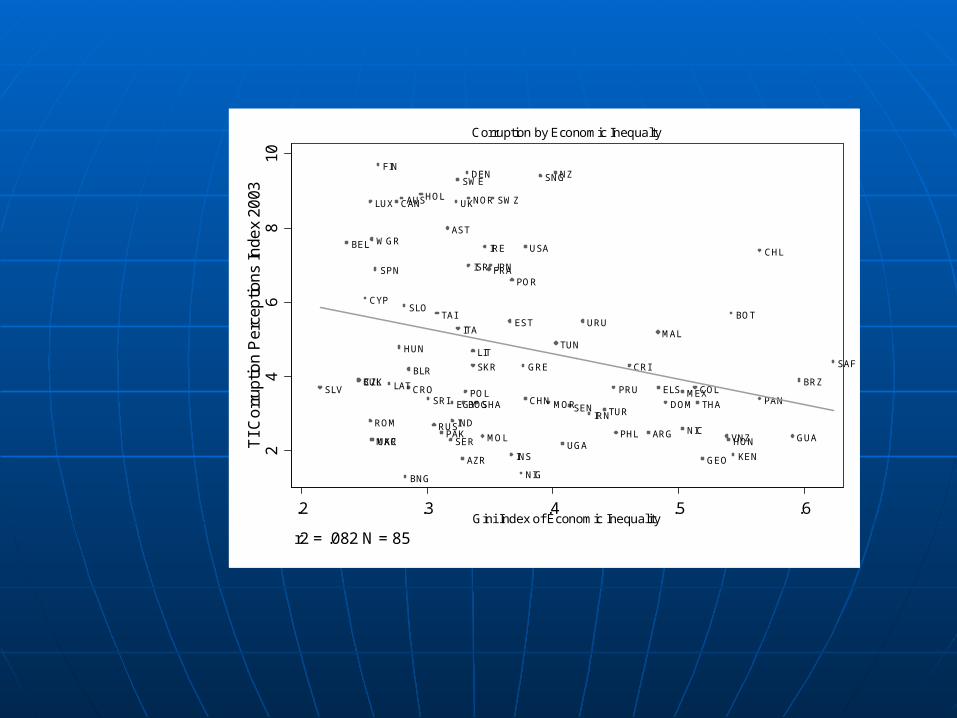
How strong is the How strong is the relationship between relationship between corruption and inequality?corruption and inequality?
The plot of inequality and corruption is striking: Across 85 countries, there is a weak (at best) relationship. The r2 is a paltry .082, suggesting no relationship at all between inequality and corruption. I offer a lowess plot of inequality and corruption. The lowess curve suggests a slight downward slope–more inequality leads to more corruption (or less transparency). But the pattern is not at all clear and we can see from this figure that two groups of countries stand out: the former and present Communist nations, which have lots of corruption and relatively equitable distributions of income (lower left part of the graph), and the Western industrialized nations, which have relatively low inequality and even less corruption than we might expect based upon their distribution of wealth.
WGR
ISR
UK
ITA
POR
USA
DEN
SPN FRA
AUS NOR SWZ
AST
CAN
JPN
SWE
LUX
GRE
BEL
NZFIN
IRE
HOL
ELS
CYP
CHL
URU
PHL ARG
BRZ
TURDOM
MEX
IRN
VNZ
IND
GHA
SKR
TUN
BNG
MAL
EGY
HON
SEN
GUA
KEN
SRI
NIG
PANCOL
CRI
SNG
TAI
UGA
NICPAK
MOR THA
SAF
PRU
INS
BOT
CRO
LIT
MAC
POL
MOL
SLO
RUS
UKR
LAT
HUN
SLV
EST
CHN
BLR
BOS
CZK
ROM
SER
GEO
BUL
AZR
24
68
10T
I Co
rrup
tion
Per
cep
tions
Inde
x 20
03
.2 .3 .4 .5 .6Gini Index of Economic Inequality
r2 = .082 N = 85
Corruption by Economic Inequalty

SLV
BEL
BUL CZK
CYP
ROM
LUXWGR
MACUKR
SPN
FIN
LAT
CAN
HUN
AUS
SLO
BNG
CRO
BLR
HOL
SRI
RUS
TAI
PAK
AST
SER
EGYIND
UK
SWE
ITA
AZR
BOSPOL
DEN
NOR
ISR
SKRLIT
GHA
MOL
IRE
FRAJPN
SWZ
VTN
EST
INS
POR
NIG
GRE
USA
CHN
ALG
SNG
MOR
NZ
TUN
JOR
UGASEN
URU
IRN
TURPRU
PHL
CRI
ARG
MAL
ELS
DOMMEX
NIC
COL
THA
GEOVNZ
HON
BOT
KEN
PAN
CHL
ZIM GUA
BRZSAF
24
68
10T
I Co
rrup
tion
Per
cep
tions
Inde
x 20
04
.2 .3 .4 .5 .6Gini index economic inequality
bandwidth = .2
Lowess Plot of Corruption and Inequality

Corruption thrives in an atmosphere of Corruption thrives in an atmosphere of low trust. When people trust their low trust. When people trust their fellow citizens, they are more likely to fellow citizens, they are more likely to behave honestly toward them.behave honestly toward them.
Corruption is high when generalized Corruption is high when generalized
trust is low and particularized trust is trust is low and particularized trust is strong, as Gambetta argues for the strong, as Gambetta argues for the Italian Mafia. Particularized trust makes Italian Mafia. Particularized trust makes it easier for people to cheat people who it easier for people to cheat people who are different from themselves.are different from themselves.

This does not mean that inequality is not a This does not mean that inequality is not a critical factor in corruption. High levels of critical factor in corruption. High levels of inequality lead to low levels of generalized inequality lead to low levels of generalized trust--and high levels of in-group trust. Low trust--and high levels of in-group trust. Low generalized trust is strongly related to high generalized trust is strongly related to high levels of corruption.levels of corruption.
I argue that the relationship between I argue that the relationship between inequality and corruption may be indirect inequality and corruption may be indirect and reciprocal, and reciprocal, leading to an leading to an inequality inequality traptrap::
inequality –> low generalized trust & high in-group trust –> corruption –> inequality

There is a strong relationship between trust There is a strong relationship between trust and corruption across 83 countries.and corruption across 83 countries.
ARG
ARM
AUS
AST
AZR
BNG
BLR
BEL
BOS
BOT
BRZ BUL
CAN
CHL
COL
CRI
CRO
CYP
CZK
DEN
DOMEGY
ELS
EST
FIN
FRA
GEO
GHA
GRE
GUAHON
HUN
ICE
IND
INS
IRN
IRE
ISR
ITA
JPN
KEN
LAT
LIT
LUX
MAC
MAL
MEX
MOL
MOR
HOL
NZ
NIC
NIG
NOR
PAK
PAN
PRU
PHL
POL
POR
ROMRUS
SAU
SEN
SER
SNG
SLV
SLO
SAFSKR
SPN
SRI
SWE
SWZ
TAI
THA
TUN
TUR
UK
USA
UGAUKR
URU
VNZ
WGR
24
68
10T
I Co
rrup
tion
Per
cep
tions
Inde
x 20
03
0 .2 .4 .6Most People Can Be Trusted [Imputed]
r2 = .420 N = 83
Corruption by Generalized Trust [Imputed]

Another factor that exacerbates inequality is an unfair legal system.
The justice system is especially important for two reasons. First, a corrupt court system can shield dishonest elites from retribution. Second, the courts, more than any other branch of the polity, is presumed to be neutral and fair.
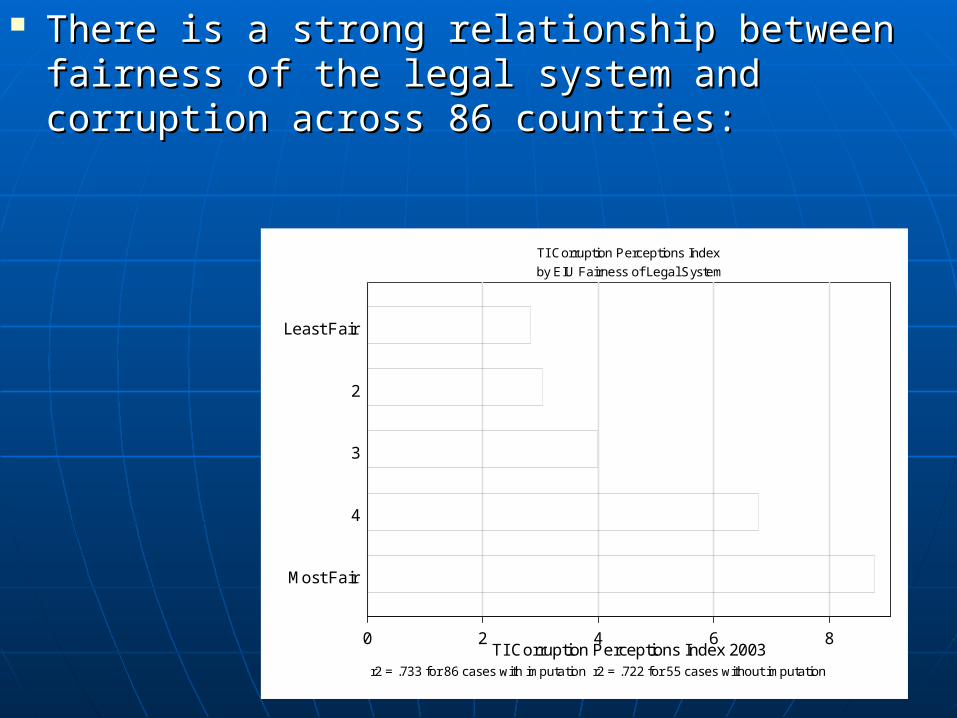
There is a strong relationship between fairness There is a strong relationship between fairness of the legal system and corruption across 86 of the legal system and corruption across 86 countries:countries:
0 2 4 6 8TI Corruption Perceptions Index 2003
Most Fair
4
3
2
Least Fair
r2 = .733 for 86 cases with imputation r2 = .722 for 55 cases without imputation
by EIU Fairness of Legal System
TI Corruption Perceptions Index
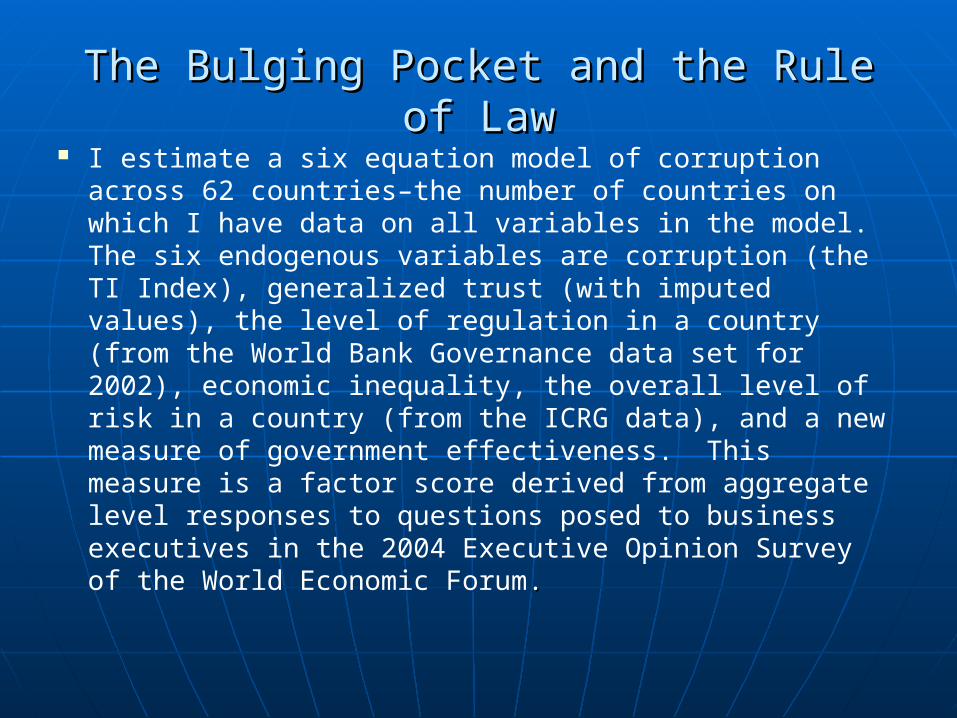
The Bulging Pocket and the Rule of LawThe Bulging Pocket and the Rule of Law I estimate a six equation model of corruption across
62 countries–the number of countries on which I have data on all variables in the model. The six endogenous variables are corruption (the TI Index), generalized trust (with imputed values), the level of regulation in a country (from the World Bank Governance data set for 2002), economic inequality, the overall level of risk in a country (from the ICRG data), and a new measure of government effectiveness. This measure is a factor score derived from aggregate level responses to questions posed to business executives in the 2004 Executive Opinion Survey of the World Economic Forum..

The key questions I pose are:
Is there a direct relationship between trust and corruption?
Is there a direct relationship between economic inequality and trust–and does it flow from inequality to trust (Uslaner, 2002, ch. 8), trust to inequality (Knack and Keefer, 1997), or both ways? A direct relationship between inequality and trust and a similar connection between trust and corruption would provide support for my argument that inequality has an indirect impact on corruption.

Does corruption in turn lead to more inequality? Corruption slows economic growth (Leite and Weidemann, 1999; Mauro, 1995, 701; Tanzi, 1998, 585). It reduces the amount of money available for various government programs, including the government share of the gross domestic product and expenditures on the public sector, for education, and transfers from the rich to the poor (Mauro, 1998, 269; Tanzi, 1998, 582-586). So we should expect that it would lead to more inequality–even if there is not a direct link from inequality to corruption.
Is the fairness of the legal system an important determinant of corruption? The fairness of the legal system should also shape the level of regulation in a society. An independent and fair judiciary should also lead to less regulation. Political leaders would not attempt to control business if they believe that the courts would step in and challenge attempts to capture the state.
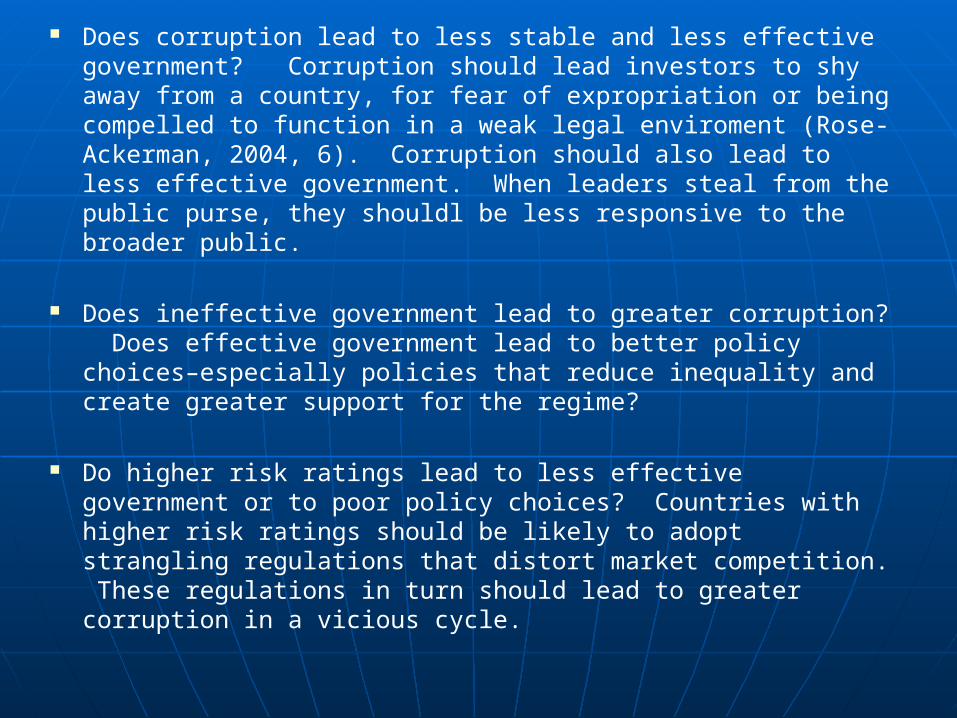
Does corruption lead to less stable and less effective government? Corruption should lead investors to shy away from a country, for fear of expropriation or being compelled to function in a weak legal enviroment (Rose-Ackerman, 2004, 6). Corruption should also lead to less effective government. When leaders steal from the public purse, they shouldl be less responsive to the broader public.
Does ineffective government lead to greater corruption? Does effective government lead to better policy choices–especially policies that reduce inequality and create greater support for the regime?
Do higher risk ratings lead to less effective government or to poor policy choices? Countries with higher risk ratings should be likely to adopt strangling regulations that distort market competition. These regulations in turn should lead to greater corruption in a vicious cycle.

Do trust, corruption, a country’s risk rating, and effective government rest upon institutional foundations–or upon cleavages within society? I expect that structural factors should not be the key determinants of trust, corruption, a country’s risk rating, or effective government–except for the fairness of the legal system. Rather, corruption should depend upon trust and policy choices; risk ratings and government effectiveness should depend upon corruption and the health of a country’s economy–and on its domestic conflicts. And trust, in turn, depends on economic equality and its historical legacies of culture and conflict.
Putnam (1993, 111, 180) argues that trust and good government go hand-in-hand: Good government promotes trust (cf. Levi, 1998; Rothstein, 2001) and trust promotes good government. Is there a reciprocal relationship or does it only go one way–and, if so, which way? I expect that trust will encourage good government, but that good government should not lead to greater trust (Uslaner, 2002, chs. 2, 7).

A key part of my argument is that A key part of my argument is that clean government--low corruption--is clean government--low corruption--is largely shaped by economic largely shaped by economic inequality, culture, and policy--rather inequality, culture, and policy--rather than institutions.than institutions.
Clean government leads to effective Clean government leads to effective government rather than the other government rather than the other way around.way around.
An enduring question is how we An enduring question is how we measure effective government. This is measure effective government. This is an issue on which there is little an issue on which there is little agreement. Effective government must agreement. Effective government must be more than clean government--and it be more than clean government--and it must be more than popular government.must be more than popular government.
Here I use country-level indicators from Here I use country-level indicators from the 2004 Executive Opinion Survey of the 2004 Executive Opinion Survey of the World Economic Forum.the World Economic Forum.
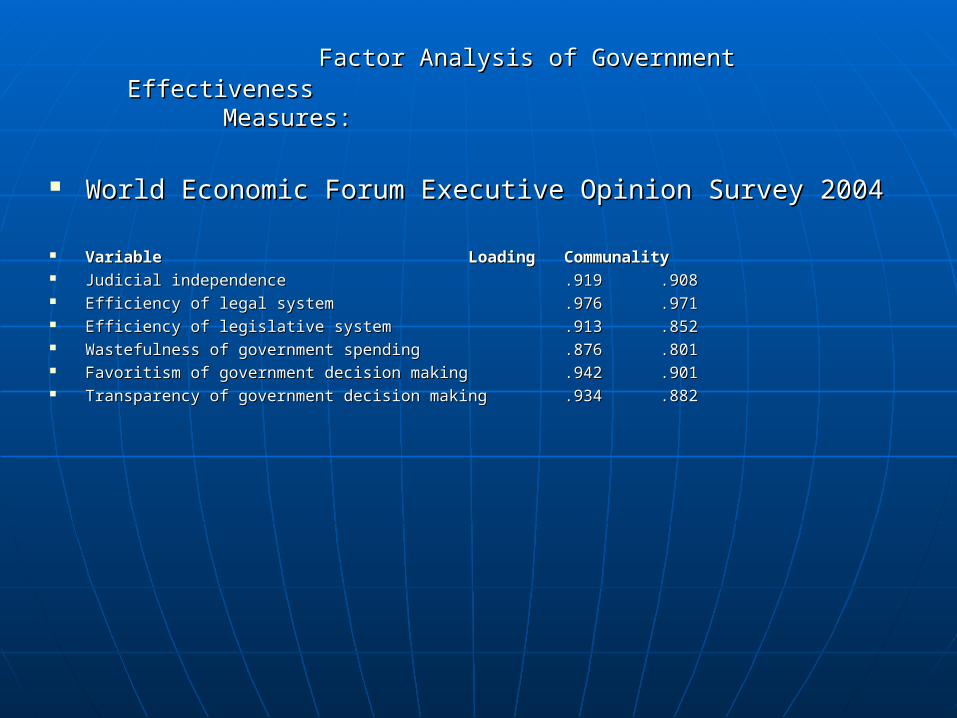
Factor Analysis of Government Effectiveness Factor Analysis of Government Effectiveness Measures:Measures:
World Economic Forum Executive Opinion Survey 2004World Economic Forum Executive Opinion Survey 2004
VariableVariable LoadingLoading CommunalityCommunality Judicial independenceJudicial independence .919.919 .908.908 Efficiency of legal systemEfficiency of legal system .976.976 .971.971 Efficiency of legislative systemEfficiency of legislative system .913.913 .852.852 Wastefulness of government spendingWastefulness of government spending .876.876 .801.801 Favoritism of government decision makingFavoritism of government decision making .942.942 .901.901 Transparency of government decision makingTransparency of government decision making .934.934 .882.882
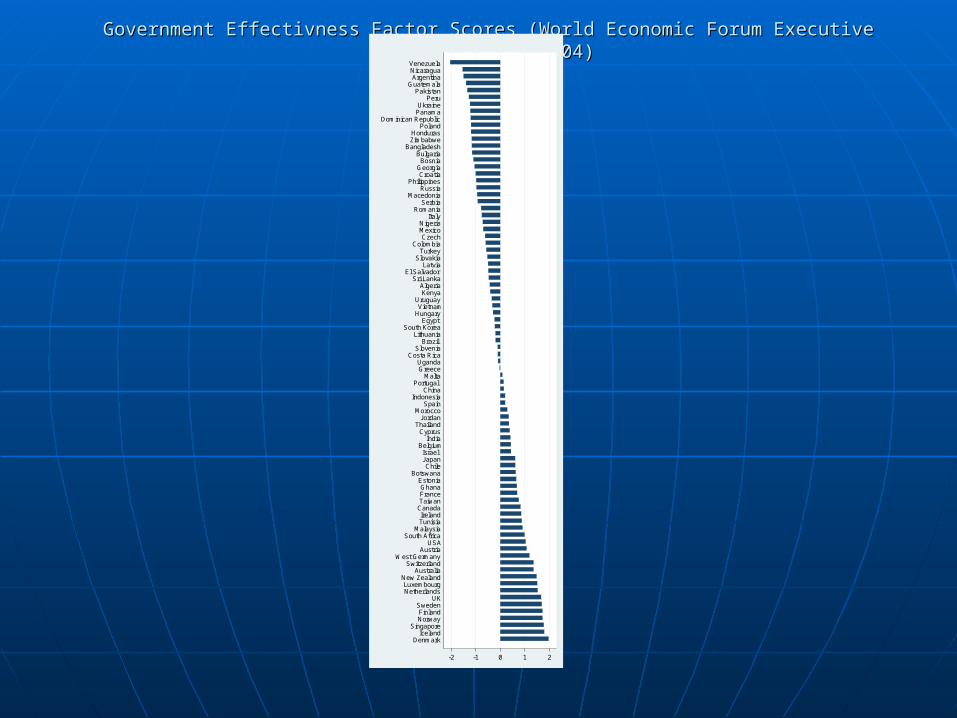
Government Effectivness Factor Scores (World Economic Forum Executive Opinion Survey 2004)Government Effectivness Factor Scores (World Economic Forum Executive Opinion Survey 2004)
-2 -1 0 1 2
DenmarkIceland
SingaporeNorwayFinland
SwedenUK
NetherlandsLuxembourg
New ZealandAustralia
SwitzerlandWest Germany
AustriaUSA
South AfricaMalaysia
TunisiaIreland
CanadaTaiwanFranceGhana
EstoniaBotswana
ChileJapanIsrael
BelgiumIndia
CyprusThailand
JordanMorocco
SpainIndonesia
ChinaPortugal
MaltaGreeceUganda
Costa RicaSlovenia
BrazilLithuania
South KoreaEgypt
HungaryVietnamUruguay
KenyaAlgeria
Sri LankaEl Salvador
LatviaSlovakia
TurkeyColombia
CzechMexicoNigeria
ItalyRomania
SerbiaMacedonia
RussiaPhilippines
CroatiaGeorgiaBosnia
BulgariaBangladesh
ZimbabweHonduras
PolandDominican Republic
PanamaUkraine
PeruPakistan
GuatemalaArgentina
NicaraguaVenezuela
Across a wide range of countries, I Across a wide range of countries, I have found strong support for a have found strong support for a model with the following linkages:model with the following linkages:
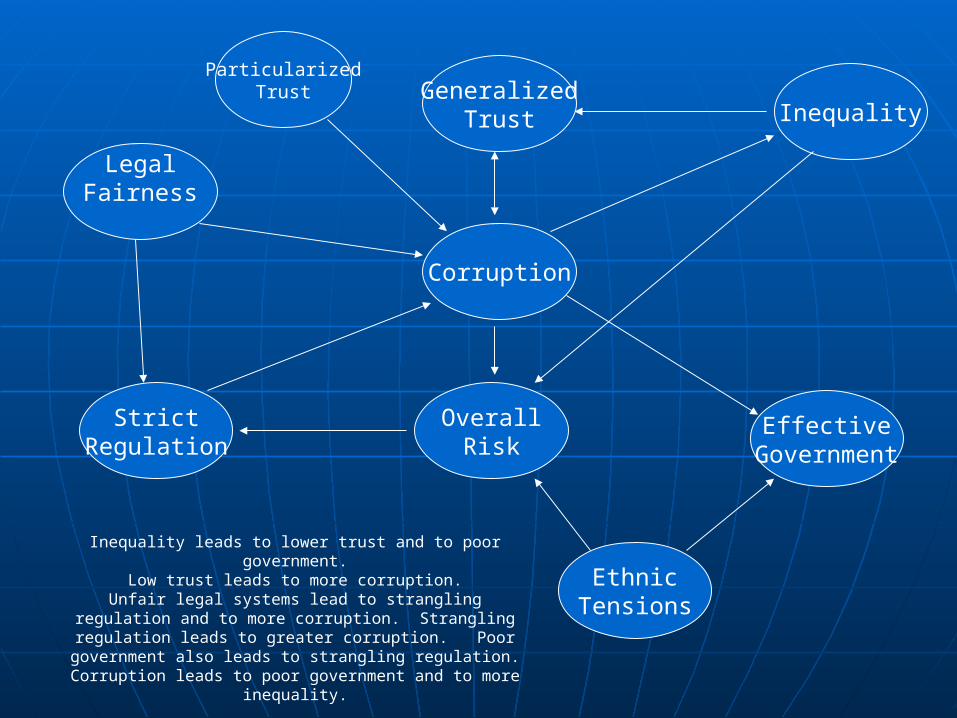
LegalFairness
GeneralizedTrust Inequality
Corruption
StrictRegulation
OverallRisk
EffectiveGovernment
EthnicTensions
ParticularizedTrust
Inequality leads to lower trust and to poor government.Low trust leads to more corruption.
Unfair legal systems lead to strangling regulation and to more corruption. Strangling regulation leads to greater corruption. Poor government also leads to strangling
regulation.Corruption leads to poor government and to more
inequality.
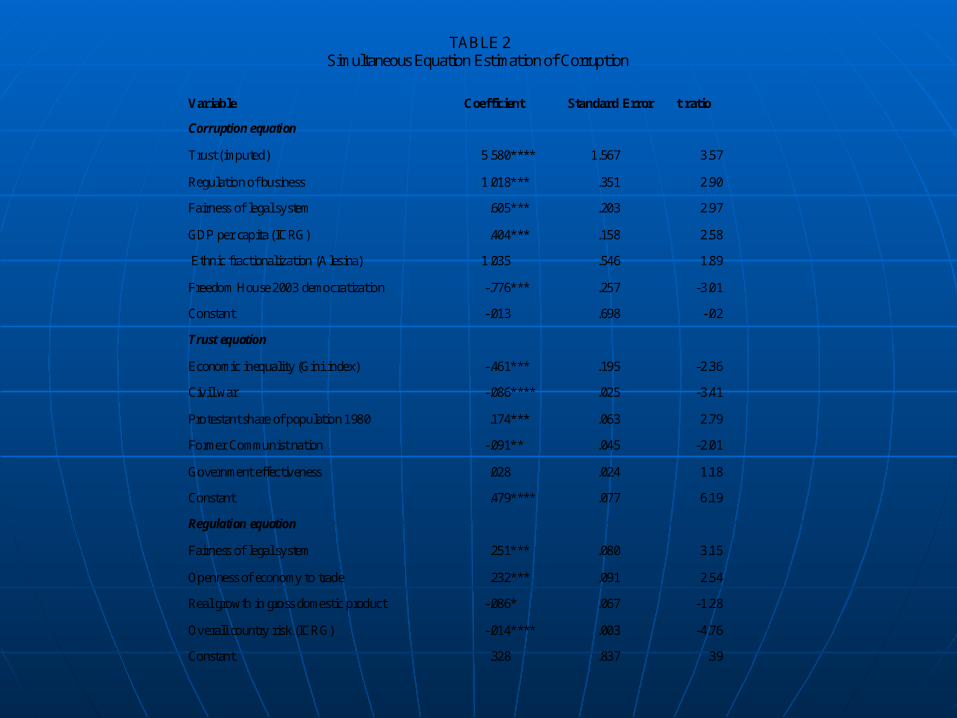
TABLE 2Simultaneous Equation Estimation of Corruption
Variable Coefficient Standard Error t ratio
Corruption equation
Trust (imputed) 5.580**** 1.567 3.57
Regulation of business 1.018*** .351 2.90
Fairness of legal system .605*** .203 2.97
GDP per capita (ICRG) .404*** .158 2.58
Ethnic fractionalization (Alesina) 1.035 .546 1.89
Freedom House 2003 democratization -.776*** .257 -3.01
Constant -.013 .698 -.02
Trust equation
Economic inequality (Gini index) -.461*** .195 -2.36
Civil war -.086**** .025 -3.41
Protestant share of population 1980 .174*** .063 2.79
Former Communist nation -.091** .045 -2.01
Government effectiveness .028 .024 1.18
Constant .479**** .077 6.19
Regulation equation
Fairness of legal system .251*** .080 3.15
Openness of economy to trade .232*** .091 2.54
Real growth in gross domestic product -.086* .067 -1.28
Overall country risk (ICRG) -.014**** .003 -4.76
Constant .328 .837 .39

Inequality equation
Trust (imputed) -.152 .187 -.81
Corruption -.028*** .009 -3.23
Former Communist nation -.166**** .025 -6.59
Protestant share of population 1980 .123 .052 2.38
Muslim percent of population -.001**** .000 -3.77
Constant .583**** .035 16.77
Overall risk equation
Economic inequality (GINI) 35.602* 25.180 1.41
Corruption -8.209**** .952 -8.62
Internal conflicts (ICRG) -7.564**** 1.416 -5.34
Ethnic tensions (ICRG) -3.650** 1.607 -2.27
Constant 170.527**** 15.812 10.78
Government effectiveness equation
Trust (Imputed) 1.738** .934 1.86
Corruption .436**** .065 6.69
Ethnic tensions (ICRG) -.098** .046 -2.12
Poverty level 2005 (ICRG) -.313**** .091 -3.42
Former Communist nation -.390*** .144 -2.70
Constant -1.475**** .228 -6.47

EquationEquation R2R2 S.E.E.S.E.E. MeanMean F StatisticF Statistic CorruptionCorruption .893.893 .859.859 5.2525.252 79.1379.13 TrustTrust .664.664 .081.081 .296.296 21.3521.35 Regulation of businessRegulation of business .821.821 .388.388 .612.612 68.2068.20 Inequality (Gini)Inequality (Gini) .534.534 .072.072 .360.360 12.3412.34 Overall risk (ICRG)Overall risk (ICRG) .854.854 13.74913.749 51.714 51.714 84.0984.09 GovernmentGovernment EffectivenessEffectiveness .831.831 .431.431 .146.146 53.0953.09
Instrumental variables: Religious fractionalization (from Alesina, Devleeschauwer, Easterly, Kurlat, and Wacziarg, Instrumental variables: Religious fractionalization (from Alesina, Devleeschauwer, Easterly, Kurlat, and Wacziarg, 2003); English legal tradition (from the Levine-Loyaza-Beck data set at 2003); English legal tradition (from the Levine-Loyaza-Beck data set at http://www.worldbank.org/research/growth/llbdata.htmhttp://www.worldbank.org/research/growth/llbdata.htm ), GNP per capita (State Failure Data), constraints on the ), GNP per capita (State Failure Data), constraints on the executive branch of government (Glaeser, La Porta, Lopez-de-Silanes, and Shleifer, 2004); military in politics (at executive branch of government (Glaeser, La Porta, Lopez-de-Silanes, and Shleifer, 2004); military in politics (at www.freetheworld.comwww.freetheworld.com ); terrorism risk (ICRG); bureaucratic quality (ICRG), parliamentary system and proportional ); terrorism risk (ICRG); bureaucratic quality (ICRG), parliamentary system and proportional representation (from the Data Base of Political Institutions at representation (from the Data Base of Political Institutions at
http://www.worldbank.org/wbi/governance/pubs/wps2283.htmlhttp://www.worldbank.org/wbi/governance/pubs/wps2283.html ) )

EquationEquation R2R2 S.E.E.S.E.E. MeanMean F StatisticF Statistic CorruptionCorruption .893.893 .859.859 5.2525.252 79.1379.13 TrustTrust .664.664 .081.081 .296.296 21.3521.35 Regulation of businessRegulation of business .821.821 .388.388 .612.612 68.2068.20 Inequality (Gini)Inequality (Gini) .534.534 .072.072 .360.360 12.3412.34 Overall risk (ICRG)Overall risk (ICRG) .854.854 13.74913.749 51.714 51.714 84.0984.09 GovernmentGovernment EffectivenessEffectiveness .831.831 .431.431 .146.146 53.0953.09
Instrumental variables: Religious fractionalization (from Alesina, Devleeschauwer, Easterly, Kurlat, and Wacziarg, 2003); Instrumental variables: Religious fractionalization (from Alesina, Devleeschauwer, Easterly, Kurlat, and Wacziarg, 2003); English legal tradition (from the Levine-Loyaza-Beck data set at English legal tradition (from the Levine-Loyaza-Beck data set at http://www.worldbank.org/research/growth/llbdata.htmhttp://www.worldbank.org/research/growth/llbdata.htm ), ), GNP per capita (State Failure Data), constraints on the executive branch of government (Glaeser, La Porta, Lopez-de-Silanes, GNP per capita (State Failure Data), constraints on the executive branch of government (Glaeser, La Porta, Lopez-de-Silanes, and Shleifer, 2004); military in politics (at and Shleifer, 2004); military in politics (at www.freetheworld.comwww.freetheworld.com ); terrorism risk (ICRG); bureaucratic quality (ICRG), ); terrorism risk (ICRG); bureaucratic quality (ICRG), parliamentary system and proportional representation (from the Data Base of Political Institutions at parliamentary system and proportional representation (from the Data Base of Political Institutions at
http://www.worldbank.org/wbi/governance/pubs/wps2283.htmlhttp://www.worldbank.org/wbi/governance/pubs/wps2283.html ) )
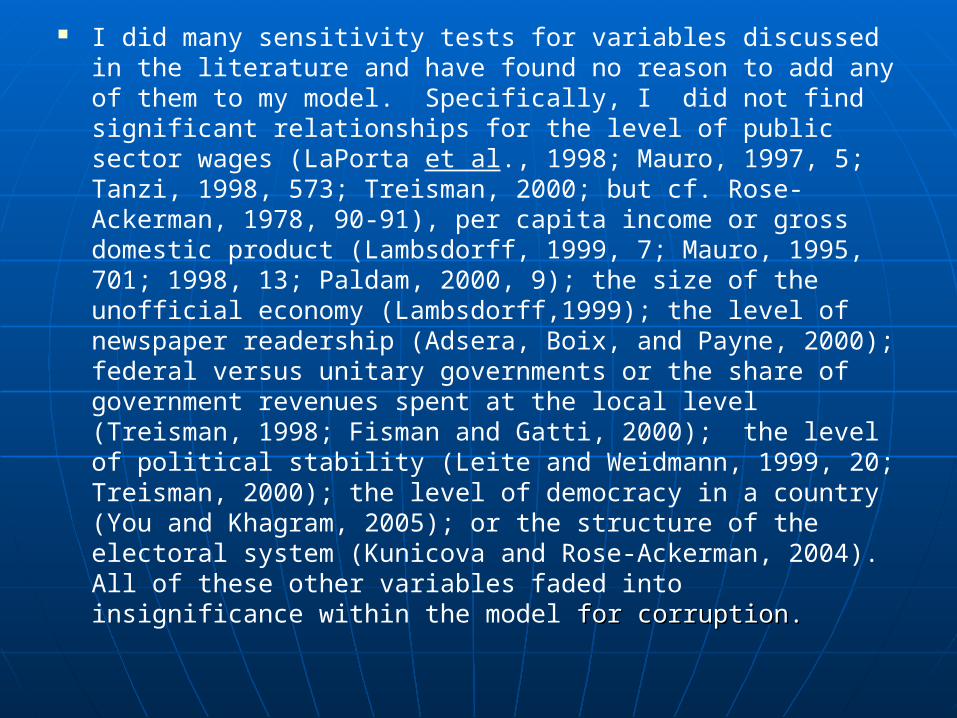
I did many sensitivity tests for variables discussed in the literature and have found no reason to add any of them to my model. Specifically, I did not find significant relationships for the level of public sector wages (LaPorta et al., 1998; Mauro, 1997, 5; Tanzi, 1998, 573; Treisman, 2000; but cf. Rose-Ackerman, 1978, 90-91), per capita income or gross domestic product (Lambsdorff, 1999, 7; Mauro, 1995, 701; 1998, 13; Paldam, 2000, 9); the size of the unofficial economy (Lambsdorff,1999); the level of newspaper readership (Adsera, Boix, and Payne, 2000); federal versus unitary governments or the share of government revenues spent at the local level (Treisman, 1998; Fisman and Gatti, 2000); the level of political stability (Leite and Weidmann, 1999, 20; Treisman, 2000); the level of democracy in a country (You and Khagram, 2005); or the structure of the electoral system (Kunicova and Rose-Ackerman, 2004). All of these other variables faded into insignificance within the model for corruption. for corruption.
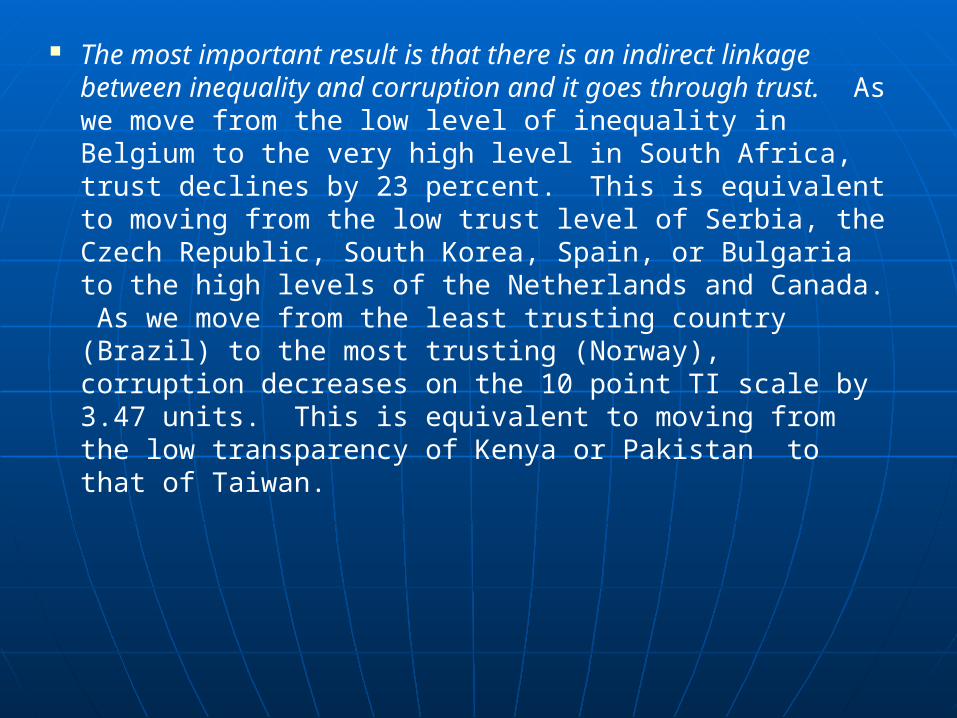
The most important result is that there is an indirect linkage between inequality and corruption and it goes through trust. As we move from the low level of inequality in Belgium to the very high level in South Africa, trust declines by 23 percent. This is equivalent to moving from the low trust level of Serbia, the Czech Republic, South Korea, Spain, or Bulgaria to the high levels of the Netherlands and Canada. As we move from the least trusting country (Brazil) to the most trusting (Norway), corruption decreases on the 10 point TI scale by 3.47 units. This is equivalent to moving from the low transparency of Kenya or Pakistan to that of Taiwan.

A shift from a country ranking highest on legal fairness to one at the bottom corresponds to a shift of 2.42 on the TI index–from Kenya or Pakistan to the level of Greece or South Korea. A shift from the most strict regulatory regime to the least (from Nigeria to Luxembourg) would bring a country to the level of Portugal (6 on the 10 point scale), while moving from a “not free” to a “free” country has a more modest shift of 1.55 points: More democracy in Pakistan would put it on a par with Ghana, Thailand, and Mexico–still quite far from even the middle of the TI rankings. Ethnic diversity seems to lead to less corruption rather than more: The coefficient is positive rather than negative (the simple correlation is -.386).

Institutional factors do not loom large in determining the level of corruption in a country except insofar as they lead to more or less equitable treatment of citizens before the law or except insofar as they promote economic equality and an economic system free of political interference. This does not imply that governments cannot regulate the economy–the Western European countries that have the least “regulation” are all welfare states. It does suggest that politicians must take care in how they regulate. The equation for corruption performs extremely well without any standard institutional variables such as centralization, parliamentary system, type of electoral list, the type of executive–each of which fell to insignificance when added.

There is a causal spiral from inequality to corruption (and back again) and from both inequality to lower levels of trust and from low levels of out-group trust–and high levels of in-group (or particularized) trust to corruption (Gambetta, 1993). Perhaps most critical in this vicious circle is the link between inequality and trust. Countries with high levels of trust enact policies that help reduce inequality–they spend more on the poor and more on programs such as education that help equalize opportunities (Uslaner, 2002, 245-246).
How well does this framework apply How well does this framework apply to transition countries? Transition to transition countries? Transition countries had--and still have--much countries had--and still have--much lower levels of inequality. They also lower levels of inequality. They also have low levels of trust. But have low levels of trust. But transition countries also have transition countries also have increasing levels of inequality.increasing levels of inequality.

The greatest threats to trust (social The greatest threats to trust (social solidarity) in the transition countries are:solidarity) in the transition countries are:
Rising inequalityRising inequality. . Wealth is a sign of strong connections and especially of dishonesty (Mateju, 1997, 4-5; Stoyanov et al., 2000, 35). While most Westerners believe that the path to wealth stems from hard work, 80 percent of Bulgarians, Hungarians, and Russians say that high incomes reflect dishonesty (Kluegel and Mason, 2000, 167; cf. Orkeny, 2000, 109). Market democracy seems a false promise to many in transition countries and their citizens see little prospect that things will improve any time soon.

Corruption. Corruption has increased in almost all countries Corruption. Corruption has increased in almost all countries for which we have data from 1998 to 2003:for which we have data from 1998 to 2003:
CountryCountry Change in CorruptionChange in Corruption
BelarusBelarus -1.9 -1.9 BulgariaBulgaria -3.2 -3.2 CzechCzech -1.3 -1.3 EstoniaEstonia 1.2 1.2 HungaryHungary -.2 -.2 LatviaLatvia -3.5 -3.5 PolandPoland -1.8 -1.8 RomaniaRomania -4.2 -4.2 RussiaRussia -4.9 -4.9 SlovakiaSlovakia -2.4 -2.4 UkraineUkraine -4.9 -4.9
A positive score indicates less corruption, a negative score A positive score indicates less corruption, a negative score indicates more corruption. The index ranges from 1 (very indicates more corruption. The index ranges from 1 (very corrupt) to 10 (very honest).corrupt) to 10 (very honest).

In the transition countries, there has been a In the transition countries, there has been a sharp rise in inequality. And this rise in sharp rise in inequality. And this rise in inequality has led people to become inequality has led people to become pessimistic.pessimistic.
CZK
HUN
BLR
LAT
ROM
BUL
LITEST
RUS
1.4
1.5
1.6
1.7
1.8
Can
Cou
nt o
n S
ucce
ss in
Life
Wor
ld V
alue
s S
urve
ys
.2 .25 .3 .35 .4 .45Gini Index of Economic Inequality (Rosser / Rosser / Ahmed)
r2 = .326
Can Count on Success in Life by Economic Inequality

Every country for which there are data on changes in economic inequality save one (Slovakia) showed an increase in economic inequality from 1989 to the mid-1990s (Rosser, Rosser, and Ahmed, 2000).
All but one (Hungary) of the 17 countries for which there are data had a sharp increase (from .3 to 42 percent) in the size of the shadow economy (Schneider, 2003).
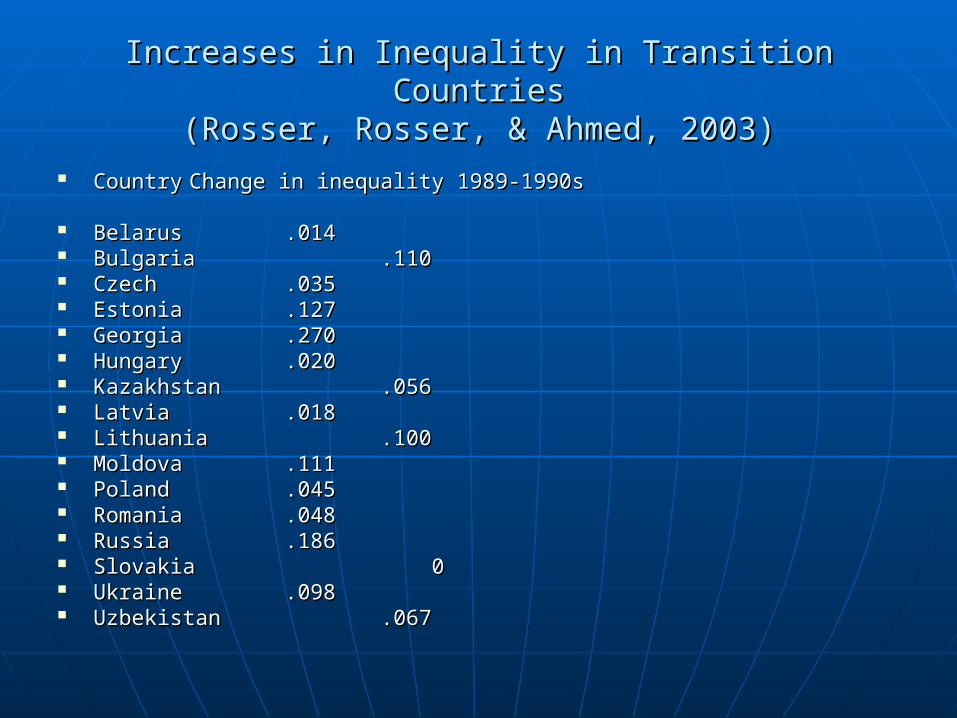
Increases in Inequality in Transition CountriesIncreases in Inequality in Transition Countries(Rosser, Rosser, & Ahmed, 2003)(Rosser, Rosser, & Ahmed, 2003)
CountryCountry Change in inequality 1989-1990sChange in inequality 1989-1990s
BelarusBelarus .014.014 BulgariaBulgaria .110.110 CzechCzech .035.035 EstoniaEstonia .127.127 GeorgiaGeorgia .270.270 HungaryHungary .020.020 KazakhstanKazakhstan .056.056 LatviaLatvia .018.018 LithuaniaLithuania .100.100 MoldovaMoldova .111.111 PolandPoland .045.045 RomaniaRomania .048.048 RussiaRussia .186.186 SlovakiaSlovakia 0 0 UkraineUkraine .098.098 UzbekistanUzbekistan .067.067

The unofficial economy has contributed to The unofficial economy has contributed to the rise in economic inequality:the rise in economic inequality:
CZK
SLV
ROM
POL
LAT
LIT
HUN
BUL
RUS
UKR KAZ
GEO
.2.3
.4.5
.6G
ini I
ndex
of E
cono
mic
Ineq
ualit
y (R
osse
r / R
osse
r / A
hmed
)
20 30 40 50Size of Unofficial Economy
r2 = .603
Economic Inequality by Size of the Unofficial Economy
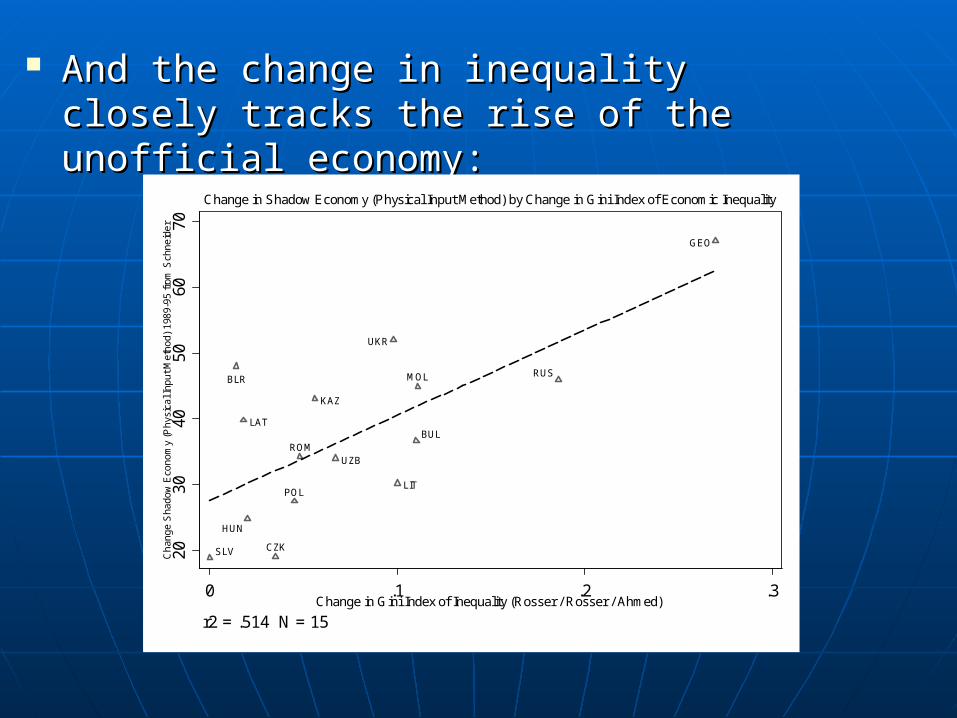
And the change in inequality closely And the change in inequality closely tracks the rise of the unofficial economy:tracks the rise of the unofficial economy:
SLV
BLR
LAT
HUN
CZK
POL
ROM
KAZ
UZB
UKR
LIT
BUL
MOL RUS
GEO
2030
4050
6070
Ch
ange
Sha
dow
Eco
nom
y (P
hysi
cal I
npu
t Met
hod
) 19
89-
95
fro
m S
chn
eide
r
0 .1 .2 .3Change in Gini Index of Inequality (Rosser / Rosser / Ahmed)
r2 = .514 N = 15
Change in Shadow Economy (Physical Input Method) by Change in Gini Index of Economic Inequality

Economic inequality is also connected to an Economic inequality is also connected to an unfair legal system:unfair legal system:
EST
UZB
SLO
POL
HUN
ARM
SLV
CZK
LAT
ROM
BLR
SER
LIT
CRO
BOS
ALB
TAJ
MACMOL
BUL
UKR KAZKGZ
RUS
AZR GEO
12
34
56
TI C
orru
ptio
n P
erc
ept
ions
inde
x 20
03
.3 .4 .5 .6 .7Courts Not Fair BEEPS 2002 Survey from World Bank
r2 = .442
Corruption by Fairness of Courts

And corruption is also linked to an unfair And corruption is also linked to an unfair legal system:legal system:
EST
UZB
SLO
POL
HUN
ARM
SLV
CZK
LAT
ROM
BLR
SER
LIT
CRO
BOS
ALB
TAJ
MACMOL
BUL
UKR KAZKGZ
RUS
AZR GEO
12
34
56
TI C
orru
ptio
n P
erc
ept
ions
inde
x 20
03
.3 .4 .5 .6 .7Courts Not Fair BEEPS 2002 Survey from World Bank
r2 = .442
Corruption by Fairness of Courts
A modern democratic market economy where people trust each other and their institutions should not be dependent upon “gift payments” that violate norms of trust and reciprocity or special connections that are not available to all citizens. Special treatment for some could undermine the social solidarity that is encapsulated in generalized trust (in other people) and might lead people to lose confidence in impartial governmental institutions and the development of a market democracy.
A third possibility is that lower-level corruption such as the informal sector plays only a mininal role in shaping people’s attitudes toward each other or government. People do care about corruption, but their ire is focused on high-level corruption (corrupt politicians, judges, business executives) rather than on the lower-level corruption of the informal sector
From a survey of Romanians in 2003:From a survey of Romanians in 2003:
Rising inequality makes people less Rising inequality makes people less optimistic for the future—and less trusting optimistic for the future—and less trusting of their fellow citizens and of the of their fellow citizens and of the government (and of government government (and of government performance). It also makes people more performance). It also makes people more willing to limit incomes of the rich.willing to limit incomes of the rich.
Corruption makes people less optimistic Corruption makes people less optimistic about the future, less trusting of their about the future, less trusting of their fellow citizens and of government, more fellow citizens and of government, more critical of government performance, and critical of government performance, and more willing to limit incomes of the rich.more willing to limit incomes of the rich.

The model of optimism, trust, inequality change, corruption, confidence in The model of optimism, trust, inequality change, corruption, confidence in government, informal connections, and support for the market from a survey of government, informal connections, and support for the market from a survey of
Romanians in 2003.Romanians in 2003.
Perceptions of increasing inequality reflect negative evaluations of government economic performance and of corrupt leaders. Trust in other people largely reflects optimism for the future and perceptions that inequality is decreasing, as well as the belief that politicians are not corrupt.
Support for democracy reflects expectations of economic performance and perceptions of how well the government is handling large-scale corruption. Support for the market economy reflects similar economic judgments as well as perceptions that private firms are trustworthy and large-scale corruption is being controlled.
Communist societies relied heavily upon informal Communist societies relied heavily upon informal connections—which often substituted for a more connections—which often substituted for a more generalized sense of trust. Even though people generalized sense of trust. Even though people don’t need to stand in line for basic goods, people don’t need to stand in line for basic goods, people still use connections in daily life in societies where still use connections in daily life in societies where markets have not taken firm hold.markets have not taken firm hold.
There is no direct connection between trust and There is no direct connection between trust and having connections to help in dealing with having connections to help in dealing with government, the police, for getting a loan, for government, the police, for getting a loan, for dealing with business, for finding a job, or even in dealing with business, for finding a job, or even in a foreign country. a foreign country.

For each of these measures: (1) the informal sector plays a minor role in shaping public evaluations; and (2) the institutions that do have some impact are those that are perceived to be most fair and impartial: the courts and the police. Gift payments are almost always insignificant predictors of trust in fellow citizens satisfaction with democracy and the market, and even perceptions of rising inequality. Using informal connections is sometimes associated with perceptions of rising inequality, but also with better performance of democratic government (where its effects are moderately strong).
People see connections and gift payments as part of the routine of getting by in daily life in contemporary Romania. They do not condemn their fellow citizens for relying on these techniques for making life a little bit less difficult in most circumstances. Making “gift payments” to courts do make citizens believe that their fellow citizens are less trustworthy, that inequality is increasing, and that democracy is not working well.
As economic inequality increases, we As economic inequality increases, we might find that people who have to might find that people who have to rely upon connections would be more rely upon connections would be more pessimistic about the future and pessimistic about the future and more willing to limit the incomes of more willing to limit the incomes of the rich.the rich.
However, people with connections However, people with connections are are less likely to see inequality less likely to see inequality increasing increasing and and are less likely to favor are less likely to favor limiting the incomes of the rich.limiting the incomes of the rich.

Beyond connections are “gift” or “extra” payments, Beyond connections are “gift” or “extra” payments, vzyatka vzyatka in Russian (the “take”). Extra payments in Russian (the “take”). Extra payments were common under Communism and remain were common under Communism and remain widespread after the transition. widespread after the transition.
It is routine for people in transition countries to It is routine for people in transition countries to make extra payments if they visit a doctor’s office, make extra payments if they visit a doctor’s office, if they are caught speeding, if they go to court or if they are caught speeding, if they go to court or even to the municipal building.even to the municipal building.
Barely more than a third of Hungarians see a moral problem when doctors demand “gratitude payments” for medical services (Kornai 2000: 3, 7, 9). Almost all doctors accept “gratitude money”; 62 percent of physicians’ total income came off the books.
A majority of Russians found it necessary to use connections to get clothes and medicine and ten percent still needed someone’s help in getting into a hospital after the fall of Communism (Ledeneva 1998: 8).

A majority of public officials in the Czech Republic, Slovakia, Bulgaria, and Ukraine in 1997-98 found it acceptable to receive extra payments from clients. Between 11 and 39 percent of citizens of those countries (in that order) reported offering a “small present” to officials and between 6 and 24 percent offered “money or an expensive present” (Miller et al., 2001, 217, 241).
Across the four countries, from 47 percent to 78 percent of officials admitted accepting a gift from a client. The police and legal services were the most “honest” and health services personnel were most likely to admit accepting a favor (Miller et al, 2000, 10).
As with the use of connections, making As with the use of connections, making “gift” payments did not reduce trust “gift” payments did not reduce trust among Romanian survey respondents among Romanian survey respondents either in their fellow citizens, their either in their fellow citizens, their government, the market economy, or government, the market economy, or democracy.democracy.
There is one exception to this general There is one exception to this general pattern: Gift payments to the courts pattern: Gift payments to the courts do do reduce all kinds of trust and confidencereduce all kinds of trust and confidence..

Why do extra payments not reduce trust—and Why do extra payments not reduce trust—and why do payments in court stand out?why do payments in court stand out?
These payments reflect petty corruption, rather These payments reflect petty corruption, rather than the “grand corruption” people associate with than the “grand corruption” people associate with politicians and business people. The small politicians and business people. The small payments to the doctors, the police officers, and payments to the doctors, the police officers, and other functionaries may be bothersome—but they other functionaries may be bothersome—but they do not generally make the recipients rich. do not generally make the recipients rich.
These gift payments, like connections, do These gift payments, like connections, do not increase economic inequality. They are not increase economic inequality. They are reasonable strategies for coping in a system reasonable strategies for coping in a system where markets don’t work well.where markets don’t work well.
The measures of the informal economy are mostly insignificant across the 36 estimations (nine measures of connections for each of four dependent variables). But there are some important exceptions. Making extra payments to the courts makes people less satisfied with democracy in Romania and also less likely to trust their fellow citizens. Making a gift payment to the court reduces the likelihood of trust by 15.6 percent. This is the fourth strongest effect, after the direction of the country (effect = .218), trust in government (.197), and whether most politicians are corrupt (.185). It is, as Rothstein (2001) expected, the only form of gift payment that reduces generalized trust.

Extra payments to doctors marginally decreases satisfaction with democracy, but this part of the informal economy is barely significant (p < .10). Informal “gift” payments to the courts violate the expectation of fairness in the judiciary. Otherwise, such payments seem to be largely irrelevant to how Romanians view their political and economic systems. Perhaps most critically, no form of extra payment–not even to the courts–leads to perceptions of growing inequality or to dissatisfaction with the market.
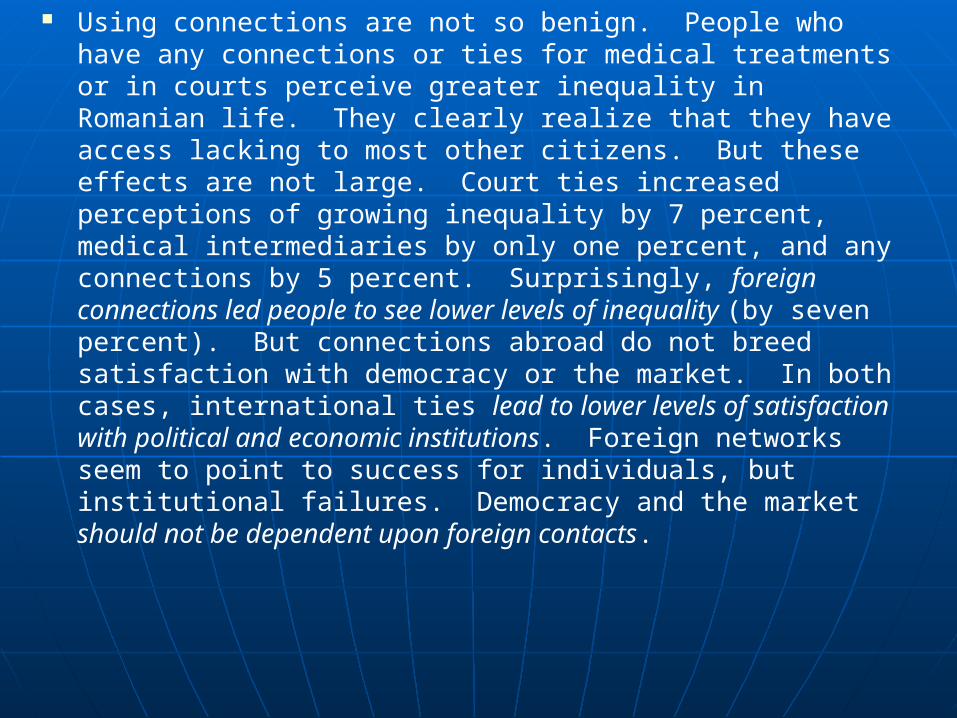
Using connections are not so benign. People who have any connections or ties for medical treatments or in courts perceive greater inequality in Romanian life. They clearly realize that they have access lacking to most other citizens. But these effects are not large. Court ties increased perceptions of growing inequality by 7 percent, medical intermediaries by only one percent, and any connections by 5 percent. Surprisingly, foreign connections led people to see lower levels of inequality (by seven percent). But connections abroad do not breed satisfaction with democracy or the market. In both cases, international ties lead to lower levels of satisfaction with political and economic institutions. Foreign networks seem to point to success for individuals, but institutional failures. Democracy and the market should not be dependent upon foreign contacts.

Police connections raise satisfaction by 8.5 percent, bank ties by 7.8 percent, help in finding a job by 10.8 percent, and any connections by 19.5 percent (using a dichotomized measure of satisfaction with democracy). But relying on ties outside the country reduces satisfaction with democracy by 2.6 percent–perhaps reflecting the feeling that you need to rely upon friends abroad to get what you want from the system.
Even though Romanians do see a connection between connections and growing economic inequality–and inequality and trust in both people and in government (not shown)–they also recognize that having such ties makes democracy work with fewer hitches. They seem generally unbothered by using informal ties–and not much at all by having to make “extra” gift payments for routine services. Having used connections and having made gift payments for so long under Communism, transition citizens do not see these parts of the informal economy as moral quandaries. Instead, they are part of daily life and they are very different from the high-level corruption that underlies their more fundamental frustrations.
Payments to courts stand out because the justice Payments to courts stand out because the justice system, as Bo Rothstein argues, is supposed to system, as Bo Rothstein argues, is supposed to be fair and impartial. We demand that courts be be fair and impartial. We demand that courts be impartial and we do not insist that other impartial and we do not insist that other institutions of government be so fair. We often institutions of government be so fair. We often assume that they are not.assume that they are not.
People also associate unfair legal systems with People also associate unfair legal systems with special advantages by people who are both rich special advantages by people who are both rich and corrupt.and corrupt.
People who see the legal system as unfair are People who see the legal system as unfair are much less likely to trust their fellow citizens, our much less likely to trust their fellow citizens, our Romanian survey shows. An unfair legal system Romanian survey shows. An unfair legal system exacerbates inequality—and thus destroys social exacerbates inequality—and thus destroys social solidarity.solidarity.
Even where corruption seems under Even where corruption seems under control, it still may contribute to low trust control, it still may contribute to low trust in both other citizens and in government. in both other citizens and in government. Ordinary citizens are far more likely to see Ordinary citizens are far more likely to see corruption as rampant than are elites—and corruption as rampant than are elites—and this contributes to perceptions of unfair this contributes to perceptions of unfair advantages for those who are well off. advantages for those who are well off.
Estonia is, together with Slovenia, the least Estonia is, together with Slovenia, the least
corrupt transition country. In 2004 its corrupt transition country. In 2004 its score on the TI index was 6.0, better than score on the TI index was 6.0, better than Taiwan and slightly below Uruguay, Taiwan and slightly below Uruguay, Portugal, and Israel. Estonia is the only Portugal, and Israel. Estonia is the only transition country where the TI corruption transition country where the TI corruption index improved from 1998 to 2003.index improved from 1998 to 2003.

The measures of the informal economy are mostly insignificant across the 36 estimations (nine measures of connections for each of four dependent variables). But there are some important exceptions. Making extra payments to the courts makes people less satisfied with democracy in Romania and also less likely to trust their fellow citizens. Making a gift payment to the court reduces the likelihood of trust by 15.6 percent. This is the fourth strongest effect, after the direction of the country (effect = .218), trust in government (.197), and whether most politicians are corrupt (.185). It is, as Rothstein (2001) expected, the only form of gift payment that reduces generalized trust.

Extra payments to doctors marginally decreases satisfaction with democracy, but this part of the informal economy is barely significant (p < .10). Informal “gift” payments to the courts violate the expectation of fairness in the judiciary. Otherwise, such payments seem to be largely irrelevant to how Romanians view their political and economic systems. Perhaps most critically, no form of extra payment–not even to the courts–leads to perceptions of growing inequality or to dissatisfaction with the market.

Yet ordinary Estonians, in a survey Yet ordinary Estonians, in a survey commissioned by the government in commissioned by the government in 2003, saw many forms of corruption 2003, saw many forms of corruption as widespread. Companion surveys as widespread. Companion surveys of business people and government of business people and government officials showed that the elites saw officials showed that the elites saw corruption as rare.corruption as rare.
This is a sign of inequality: Citizens This is a sign of inequality: Citizens see far more corruption than do see far more corruption than do elites.elites.

Do people in transition countries with more Do people in transition countries with more honest governments have different perceptions honest governments have different perceptions of corruption?of corruption?
Estonia ranked as the 27th most honest country Estonia ranked as the 27th most honest country in the world (out of 160) in the 2005 in the world (out of 160) in the 2005 Transparency International Corruption Transparency International Corruption Perceptions Index (between Portugal and Israel).Perceptions Index (between Portugal and Israel).
Slovakia ranked 47th, compared to Romania Slovakia ranked 47th, compared to Romania which was tied for 75th.which was tied for 75th.
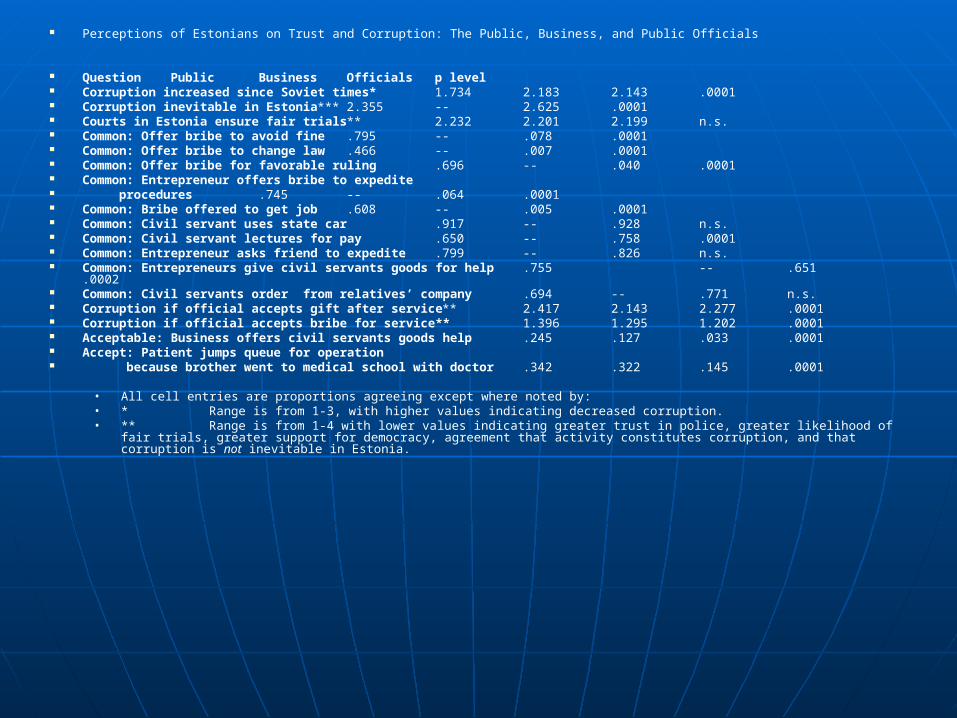
Perceptions of Estonians on Trust and Corruption: The Public, Business, and Public Officials
Question Public Business Officials p level Corruption increased since Soviet times* 1.734 2.183 2.143 .0001 Corruption inevitable in Estonia*** 2.355 -- 2.625 .0001 Courts in Estonia ensure fair trials** 2.232 2.201 2.199 n.s. Common: Offer bribe to avoid fine .795 -- .078 .0001 Common: Offer bribe to change law .466 -- .007 .0001 Common: Offer bribe for favorable ruling .696 -- .040 .0001 Common: Entrepreneur offers bribe to expedite procedures .745 -- .064 .0001 Common: Bribe offered to get job .608 -- .005 .0001 Common: Civil servant uses state car .917 -- .928 n.s. Common: Civil servant lectures for pay .650 -- .758 .0001 Common: Entrepreneur asks friend to expedite .799 -- .826 n.s. Common: Entrepreneurs give civil servants goods for help .755 -- .651 .0002 Common: Civil servants order from relatives’ company .694 -- .771 n.s. Corruption if official accepts gift after service** 2.417 2.143 2.277 .0001 Corruption if official accepts bribe for service** 1.396 1.295 1.202 .0001 Acceptable: Business offers civil servants goods help .245 .127 .033 .0001 Accept: Patient jumps queue for operation because brother went to medical school with doctor .342 .322 .145 .0001
• All cell entries are proportions agreeing except where noted by:• * Range is from 1-3, with higher values indicating decreased corruption.• ** Range is from 1-4 with lower values indicating greater trust in police, greater likelihood of fair trials, greater
support for democracy, agreement that activity constitutes corruption, and that corruption is not inevitable in Estonia.
The public and elite have very different The public and elite have very different perceptions about how common corruption perceptions about how common corruption is, what constitutes corruption, and even is, what constitutes corruption, and even how acceptable it is.how acceptable it is.
Ironically, the public seems more willing to Ironically, the public seems more willing to say that at least some forms of corruption say that at least some forms of corruption (in the surveys here, petty corruption) are (in the surveys here, petty corruption) are acceptable. This is consistent with the acceptable. This is consistent with the Romanian data showing that petty Romanian data showing that petty corruption does not destroy trust or lead to corruption does not destroy trust or lead to perceptions of growing inequality. Most perceptions of growing inequality. Most ordinary citizens accept petty corruption as ordinary citizens accept petty corruption as part of life—something beyond their part of life—something beyond their control.control.

World Bank Diagnostic surveys World Bank Diagnostic surveys conducted in Romania and Slovakia conducted in Romania and Slovakia point to very different perceptions of point to very different perceptions of corruption and its effects.corruption and its effects.
The Romanian public is far more The Romanian public is far more likely to see corruption as increasing likely to see corruption as increasing inequality and lowering incomes than inequality and lowering incomes than is the Slovakian public.is the Slovakian public.

The Slovakian public is considerably more The Slovakian public is considerably more concerned than the Romanian public with the effect concerned than the Romanian public with the effect of corruption on moral decline, harming transition, of corruption on moral decline, harming transition, and leading to declining foreign investment.and leading to declining foreign investment.
Slovakian elites were more concerned that Slovakian elites were more concerned that corruption increased crime, led to moral decline corruption increased crime, led to moral decline and dishonesty, affected human rights, and and dishonesty, affected human rights, and threatened the security of the state than were threatened the security of the state than were Romanian entrepreneurs.Romanian entrepreneurs.
People who believe that corruption increases People who believe that corruption increases inequality in Slovakia were less likely to express inequality in Slovakia were less likely to express confidence in government. However, believing that confidence in government. However, believing that corruption leads to more inequality corruption leads to more inequality had no effect had no effect on trust in government for either entrepreneurs or on trust in government for either entrepreneurs or for government officials.for government officials.
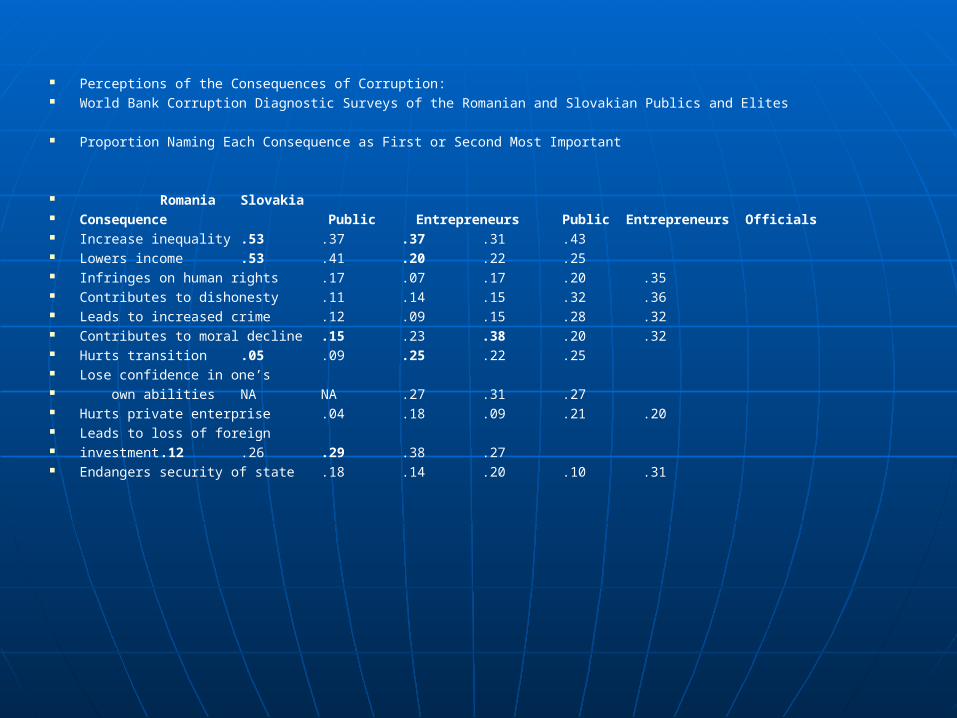
Perceptions of the Consequences of Corruption: World Bank Corruption Diagnostic Surveys of the Romanian and Slovakian Publics and Elites
Proportion Naming Each Consequence as First or Second Most Important
Romania Slovakia Consequence Public Entrepreneurs Public Entrepreneurs Officials Increase inequality .53 .37 .37 .31 .43 Lowers income .53 .41 .20 .22 .25 Infringes on human rights .17 .07 .17 .20 .35 Contributes to dishonesty .11 .14 .15 .32 .36 Leads to increased crime .12 .09 .15 .28 .32 Contributes to moral decline .15 .23 .38 .20 .32 Hurts transition .05 .09 .25 .22 .25 Lose confidence in one’s own abilities NA NA .27 .31 .27 Hurts private enterprise .04 .18 .09 .21 .20 Leads to loss of foreign investment .12 .26 .29 .38 .27 Endangers security of state .18 .14 .20 .10 .31

The transition countries, among others, are stuck in an inequality trap. Inequality leads to low trust. Low trust leads to more corruption. More corruption leads to bad government and resentment among the poor toward others in the society and to demands for restricting markets. This in turn leads to more rather than less inequality.
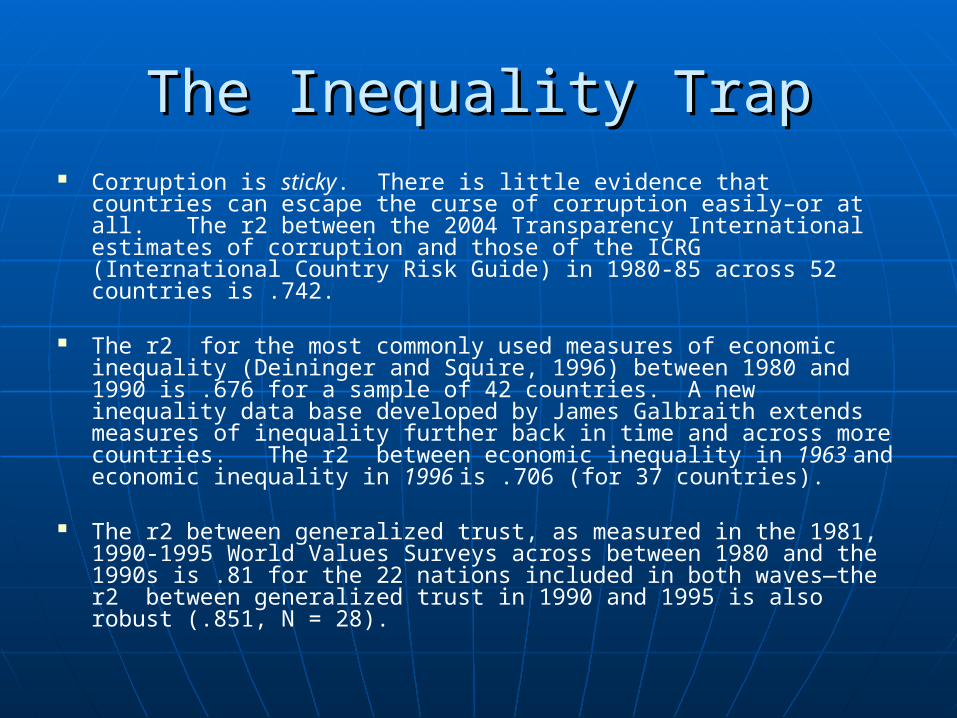
The Inequality TrapThe Inequality Trap Corruption is sticky. There is little evidence that countries can
escape the curse of corruption easily–or at all. The r2 between the 2004 Transparency International estimates of corruption and those of the ICRG (International Country Risk Guide) in 1980-85 across 52 countries is .742.
The r2 for the most commonly used measures of economic inequality (Deininger and Squire, 1996) between 1980 and 1990 is .676 for a sample of 42 countries. A new inequality data base developed by James Galbraith extends measures of inequality further back in time and across more countries. The r2 between economic inequality in 1963 and economic inequality in 1996 is .706 (for 37 countries).
The r2 between generalized trust, as measured in the 1981, 1990-1995 World Values Surveys across between 1980 and the 1990s is .81 for the 22 nations included in both waves—the r2 between generalized trust in 1990 and 1995 is also robust (.851, N = 28).

Institutional Reform Won’t End CorruptionInstitutional Reform Won’t End Corruption
Two of the most widely used indicators of democratization, Freedom House’s political rights and civil liberties indices, are not so stable over time. The r2 for political rights from 1973 to 2003 is .165 and for civil liberties it is .263 (both N = 77). Even excluding countries that were Communist in 1973, the respective r2 values increase only to .264 and .375 (N = 67).
Even more troubling, the changes in political rights and civil liberties from 1973 to 2003 are unrelated to changes in corruption from 1980-85 to 2004 ( r2 = .007 and .038 respectively, N = 38). Moving the democratization measures forward to 1988 does not improve the fit with changes in corruption ( r2 = .004 and .0005 for political rights and civil liberties, N = 39). Institutions are not nearly as sticky as corruption–and structural change does not track the level of transparency.
If corruption depends upon policy If corruption depends upon policy choices as well as from inequality and choices as well as from inequality and low trust (and unfair legal low trust (and unfair legal institutions), how do we get the "good institutions), how do we get the "good policies" that can help combat policies" that can help combat corruption?corruption?
"Good government" is not as critical "Good government" is not as critical as clean government in the quest for as clean government in the quest for positive outcomes and positive positive outcomes and positive policies for economic growth. policies for economic growth.

I estimated regression equations for I estimated regression equations for 15 outcomes and policy options 15 outcomes and policy options across nations. Of the 15 models, across nations. Of the 15 models, corruption was a more significant corruption was a more significant deteminant of good outcomes/policy deteminant of good outcomes/policy choices in 11, effective government choices in 11, effective government in three, and one model showed in three, and one model showed equivalent effects.equivalent effects.

Outcomes for which corruption matters more than government effectiveness:
Growth competitiveness ranking 2003 Tax compliance (WEF) Expropriations risk 1982-97 (Glaeser et al., 2004) Index of state owned enterprises (LaPorta et al., 1999) Government consumption/GDP (freetheworld.org) How ethical are business firms (WEF) Executives involved in charitable causes (WEF) Education spending (LaPorta et al., 1999) Education Gini 1990 (Thomas, Wang, Fan, 2001) Education standard deviation (Lederman) Secondary school enrollment (UN Development Program) Public health expenditures (UN Development Program) Transfer payments (LaPorta et al., 1999) UN Human Development Index (UN Development Program)

Outcomes for which government effectivenss matters more than corruption:
Satisfied with state of environment (Gallup Millennium) Markets open to small/medium firms (LaPorta, et al., in press) Good labor-management relations (WEF)
Outcome for which government effectivenss matters equally to corruption:
Market capitalization (LaPorta, et al., in press)

Effective government has its greatest Effective government has its greatest "advantage" in opening markets. "advantage" in opening markets.
Corruption is most critical in shaping Corruption is most critical in shaping policies that have the potential to reduce policies that have the potential to reduce inequality--especially education spending, inequality--especially education spending, educational inequality and enrollment, educational inequality and enrollment, health expenditures, and the overall UN health expenditures, and the overall UN Human Development Index.Human Development Index.

Universalism, Trust, and EqualityUniversalism, Trust, and Equality
Bo Rothstein and I in a forthcoming article Bo Rothstein and I in a forthcoming article show that education spending is an show that education spending is an especially powerful tool in reducing especially powerful tool in reducing inequality and in boosting trust. inequality and in boosting trust. Universalistic policies produce a sense of Universalistic policies produce a sense of community, while means-tested policies community, while means-tested policies stigmatize the beneficiaries. People who stigmatize the beneficiaries. People who receive means-tested benefits are less receive means-tested benefits are less trusting, even controlling for income, race, trusting, even controlling for income, race, and other factors such as optimism.and other factors such as optimism.

Health spending and especially Health spending and especially eeducation expenditures also have great ducation expenditures also have great potential for reducing inequality--if they potential for reducing inequality--if they are universal benefits. Universalistic are universal benefits. Universalistic benefits are more effective in reducing benefits are more effective in reducing inequality than are means-tested inequality than are means-tested programs--even though means-tested programs--even though means-tested programs are targeted at people who are programs are targeted at people who are most needy.most needy.
If the key to combatting If the key to combatting corruption is reducing inequality, corruption is reducing inequality, it seems as the path to less it seems as the path to less inequality is through less inequality is through less corruption as well. This is the corruption as well. This is the fundamental dilemma of the fundamental dilemma of the inequality trap.inequality trap.

In transition countries, tIn transition countries, the growth of a market he growth of a market economy has meant displacement of many economy has meant displacement of many former state workers guaranteed employment former state workers guaranteed employment and a living wage. Communism already had and a living wage. Communism already had depressed levels of generalized trust. depressed levels of generalized trust.
Overcoming both poverty and low levels of trust Overcoming both poverty and low levels of trust loomed large on the political agenda of these loomed large on the political agenda of these countries—but there has been little support for countries—but there has been little support for the universal policies that might create a more the universal policies that might create a more vibrant economy and society. Instead, there vibrant economy and society. Instead, there seems to be support for a more radical seems to be support for a more radical redistribution of income that would exacerbate redistribution of income that would exacerbate tensions and make the transition more difficult.tensions and make the transition more difficult.
As inequality increases in transition As inequality increases in transition countries, there are more demands for countries, there are more demands for redistribution of wealth and confiscation of redistribution of wealth and confiscation of the fortunes of the newly rich (as our data the fortunes of the newly rich (as our data from Romania show).from Romania show).
The best policy response to growing The best policy response to growing inequality is to enact universalistic social inequality is to enact universalistic social welfare programs. However, the social welfare programs. However, the social strains stemming from increased inequality strains stemming from increased inequality make it almost impossible to enact such make it almost impossible to enact such policies. Demands for redistribution will policies. Demands for redistribution will thus lead to inefficient poverty reduction thus lead to inefficient poverty reduction strategies—and ever more increasing social strategies—and ever more increasing social strains.strains.

Starting from a base of relative equality, the Starting from a base of relative equality, the transition states had a golden opportunity to enact transition states had a golden opportunity to enact universalistic social welfare policies. Yet, these universalistic social welfare policies. Yet, these states also had corrupt governments with states also had corrupt governments with widespread tax evasion and little public confidence. widespread tax evasion and little public confidence. Transition states had only one of the key elements Transition states had only one of the key elements (relative equality) for the enactment of universalistic (relative equality) for the enactment of universalistic policies. Lacking the other (honest government), policies. Lacking the other (honest government), they have been unable to stem the growing they have been unable to stem the growing inequality and increased social strains that follow inequality and increased social strains that follow from it. Many transition states from it. Many transition states hadhad universalistic universalistic social welfare policies under Communist regimes, social welfare policies under Communist regimes, and most still do as official policy—but the and most still do as official policy—but the implementation of such policies in transition has implementation of such policies in transition has focused more on targeted benefits and health care focused more on targeted benefits and health care
often depends upon the ability to pay for insurance.often depends upon the ability to pay for insurance.
The envy of the rich and the unwillingness of The envy of the rich and the unwillingness of majorities in post-socialist societies to enact majorities in post-socialist societies to enact universalistic social welfare policies reinforce universalistic social welfare policies reinforce the inequality trap.the inequality trap.
Increasing inequality is associated with a rise Increasing inequality is associated with a rise in political support for Communist parties, in political support for Communist parties, which target benefits to the lower income which target benefits to the lower income groups rather than enact universalistic groups rather than enact universalistic policies. Ironically, these policies reinforce policies. Ironically, these policies reinforce inequality rather than reduce it.inequality rather than reduce it.
Many would find much to agree with the comment of the satirical group, The Royal Canadian Air Farce, in the 1980s: “Things are going to get a lot worse before they turn bad.”