Embed Size (px)
Citation preview
Electoral Systems, District Magnitude and Corruption
Eric C.C. Chang Department of Political Science
Michigan State University [email protected]
and
Miriam A. Golden
Department of Political Science University of California at Los Angeles
October 2005; version 5
Accepted for publication by the British Journal of Political Science.
i
Acknowledgements
Earlier versions of this paper were presented at a meeting on political accountability,
Waseda University, Tokyo, March 6–8, 2004 and at the 2003 annual meetings of the
American Political Science Association, August 28–August 31. We are also grateful for
suggestions from Toke Aidt, John Gerring, Fabrice Lehoucq and Mathew Shugart, and to
Matt Golder and Daniel Treisman for making their data available to us. Some of the
Italian data were gathered by Miriam Golden under funding from the National Science
Foundation (SES-0074860). Golden also acknowledges the support of the Academic
Senate of the University of California at Los Angeles and the hospitality of the Russell
Sage Foundation.
ii
Abstract
We analyze the relationship between electoral systems and corruption in a large
sample of contemporary democratic nations. Whereas previous studies have shown that
closed- list proportional representation is associated with greater (perceived) corruption
than open-list PR, we demonstrate that this relationship fails to hold once district
magnitude is considered. The theory underlying our study draws on work on “the
personal vote” that suggests that the incentives to amass resources — and perhaps even to
do so illegally — increase with district magnitude in open- list settings but decrease in
closed- list contexts. Extending this insight, we show that political corruption gets more
(less) severe as district magnitude increases under open- list PR (closed- list PR) systems.
In addition, once district magnitude exceeds a certain threshold — our estimates are that
this is as low as 15 — corruption is greater under open list than closed list. Only at small
district magnitudes (below 15) is closed-list PR associated with more corruption, as
conventionally held. Our results hold for alternate measures of corruption, for different
sets of countries analyzed, for different measures of district magnitude, and regardless of
whether the political system is presidential or parliamentary and the number of parties.
Using an objective measure of corruption in public works contracting, we also
present corroborating evidence across Italian electoral districts. In Italy’s open- list
environment in the period prior to 1994, larger districts are more susceptible to corruption
than smaller ones.
1
Why some nations experience more political corruption than others is a question of
both empirical and normative interest. Corruption constitutes a drag on economic
performance (Knack and Keefer 1995; Mauro 1995; Lambsdorff 1999), and also reduces the
legitimacy of government in the eyes of the governed (Seligson 2002; Anderson and
Tverdova 2003). It it thus consequential for both economics and politics. When the
proceeds of corrupt transactions are directed into electoral contests, as appears to be the case
in various advanced democratic nations where political competition is expensive and winning
public office highly desirable, corruption is also directly corrosive of democratic
accountability. If elections are the primary mechanism that ensures accountability
(Schumpeter 1942; Manin, Przeworski and Stokes 1999), then accountability is patently
sabotaged when electoral campaigns are funded in part by monies raised through illegal
activities.
Nor are illegal activities on the part of public officials confined to the developing or
transition economies, or merely incidental aspects of political life in economically developed
countries. While the poor, often authoritarian countries of the world suffer most from corrupt
behaviors by public officials, we nonetheless observe a substantial frequency of perceived
corruption even among some of the very richest democratic nations. The 1996 index of
perceived corruption due to Transparency International (the Corruption Perceptions Index, or
CPI )1 finds that countries with per capita GDP of greater than $10,000 (in 1990 US dollars)
take values larger than 9 in countries like Denmark and New Zealand, indicating very little
perceived corruption, but fall below 5 in countries like Spain and Italy, suggesting very
widespread perceived corruption. Corruption does not necessarily evaporate with economic
1 The index, really an aggregation of various indices, is now a standard barometer of perceived corruption across a large number of countries. A good description is in Lancaster and Montinola 1997. But see also the important observations in Aron 2000.
2
development, and, as the CPI reveals, a substantial amount occurs even in some developed
nations.
Variation in the extent of corruption in democratic nations merits investigation. The
determining factors of corruption are likely to be different in democratic institutional
environments than in non-democratic settings, because access to public office is regulated so
differently in these two settings. In democratic contexts, apparently slight variations in the
otherwise similar institutions regulating access to public office — such as electoral laws,
political parties, campaign finance regulations, and executive-legislative relations — may
well significantly affect the propensity of public officials to engage in the illegal (mis)use of
public office for private or party gain, as corruption is typically defined.2
In this study, we focus on whether different electoral systems have systematically
different effects on the degree of corruption observed. We investigate whether open- list
proportional representation (PR) or closed- list PR is more conductive to corrupt activities,
and we show that the effect of the type of list hinges on district magnitude. We also control
for the effective number of political parties, for whether the polity is presidential or
parliamentary, and whether it is federal or unitary. Finally, we include a battery of what are
by now standard additional controls used in crossnational studies of corruption.
Our focus on the type of electoral system has both empirical and theoretical
justification. Most of the world’s democratic countries use proportional electoral systems.
2 Available crossnational measures of corruption do not allow us to distinguish political corruption (that is, illegal activities on the part of elected public officials) from other types of corruption, such as corruption by appointed officials (o r bureaucrats) and the increasingly public phenomenon of corporate corruption. Nor can we distinguish empirically between corruption directed at personal gain and that directed at political and partisan (that is, electoral) ends. Our theoretical interest in this paper is specifically in political corruption directed at electoral ends. Although our crossnational measure of corruption cannot isolate this from other aspects of corruption, the Italian data analyzed in the second part of this paper are more precisely targeted. Our crossnational results suggest that much of what is measured as corruption crossnationally is likely directed at electoral ends.
3
Variations in how this electoral system is implemented may prove substantively important
for political accountability. One theoretical justification for focusing on how the type of
electoral system affects accountability derives from the literature on the personal vote. This
has argued that politicians ’ incentives to amass (possibly illegal) resources to out-campaign
their opponents during elections increase with district magnitude in open- list settings but
decrease in closed- list contexts (Carey and Shugart 1995; Shugart, Ellis and Suominen 2005).
Building on this insight, we suggest that political corruption becomes more (less) severe as
district magnitude increases under open- list PR (closed- list PR) systems. Our analysis is
conducted at two levels: cross-nationally, among the world’s 40-odd democratic countries
using proportional representation in the latter part of the 1990s, and subnationally, across
Italy’s 32 electoral districts in the 1990s.
Our findings are consistent at both the crossnational and subnational levels, despite
the fact that the measures of corruption we use at the two levels are necessarily quite
different. Evidence from the crossnational data analysis corroborates our theory: corruption
becomes more (less) severe as district magnitude increases under open-list (closed- list) PR.
At small district magnitudes, closed- list PR is associated with more corruption, but
corruption is more widespread in open-list PR than in closed-list systems once district
magnitudes exceed a threshold that we estimate to be as low as 15. Within Italy, which used
open- list PR prior to 1994, political corruption rises with district magnitude. In brief, our
findings show that political corruption gets more (less) severe as district magnitude increases
under open-list PR (closed- list PR) systems.
Our argument runs against a growing body of literature, including empirical cross-
national studies by Kunicova and Rose-Ackerman (2005), Persson and Tabellini (2003), and
4
Persson, Tabellini and Trebbi (2003), claiming that closed- list PR is more susceptible to
corruption than alternative types of electoral systems. The theory underlying these studies is
that closed- list PR diminishes individua l accountability on the part of elected officials,
thereby increasing corruption. We hypothesize and find the opposite for larger electoral
districts. Our understanding of how list type affects political incentives mirrors that of
Lederman, Loayza and Soares (2005), who hypothesize that closed- list PR reduces
corruption because it encourages politicians to develop concerns with the reputation of the
party as a whole.
The reason that previous studies have generated what we contend are empirically
inaccurate findings is because they have failed to control for district magnitude (as in
Lederman, Loayza and Soares, who as a result identify no systematic relationship between
list type and corruption) or, where district magnitude and corruption are considered together
(as in Persson and Tabellini 2003, ch. 7), because the analysis fails to differentiate open from
closed list PR. Once we study corruption under both different district magnitudes and
different rules governing candidate selection within proportiona l representation electoral
systems, we find that open- list PR is associated with greater corruption than closed- list
systems at large district magnitudes.
Our paper proceeds in four sections. We first summarize the theories of the impact of
electoral arrangements on corruption that we examine empirically. We next present a cross-
national empirical test and then a subnational (Italian) empirical test. A final section
concludes.
5
I. Theories of the Impact of Electoral Systems on Corruption
We start with empirical implications drawn from the literature on the “personal vote”
(Cain, Ferejohn and Fiorina 1987). The theory underlying the idea of the personal vote
posits that in electoral systems where electoral competition takes the form of intraparty
competition, the desire for public office gives candidates incentives to cultivate personal
reputations, or reputations that distinguish them from the party labels with which they
affiliate. Open-list PR, which allows voters some mechanism to select individual candidates
off party lists, means these candidates need ways to differentiate themselves politically from
their partisan compatriots. Hence, they seek to acquire personal reputations (Katz 1986).3
In closed- list PR, by contrast, where candidate selection is controlled by the (national)
party leadership, candidates of the same party are effectively prevented from competing
electorally with each other. Voters are denied the opportunity to cast votes for individuals in
these settings. Hence candidates compete for the attention and endorsement of their
superiors in the party hierarchy, or for the approbation of those groups in the party who
control candidate nomination, rather than for votes. Because voters have no means to select
specific individuals off the party list whom they wish to see elected, individual candidate
identity is not relevant to electoral competition.
The type of electoral system is not the only factor affecting the extent to which
candidates seek to acquire personal reputations distinguishing them from others running for
3 Note that within open-list PR systems, a candidate’s optimal electoral choice between personalistic and party-centered campaigning depends on the extent to which his party controls the candidate nomination process. See Samuels (1999) for a discussion of the case of Brazil. For obvious reasons, we are not able to incorporate party-level variables into our crossnational analysis, but the argument appears borne out by what is known of Italian corruption, which was apparently much more extensive in the parties with lower levels of central control (see the evidence in Ricolfi 1993 on the Christian Democrats compared with the Italian Communist Party, for instance). For a counterexample, see Maravall’s (1999) discussion of the Spanish Socialist Party (PSOE), which apparently combined centralized control, including over the nomination process, and extensive involvement in corruption.
6
office under the same party label. Carey and Shugart (1995) contend that where candidates
of the same party compete electorally against each other — that is, in open- list environments
— the extent of competitiveness tends to increase with the number of candidates, or with
what is called district magnitude. The reasoning underlying this view is that “as the number
of other copartisans from which a given candidate must distinguish herself grows, the
importance of establishing a unique personal reputation, distinct from that of the party, also
grows” (Carey and Shugart 1995: 430).
We might think of this as a simple information problem for electors. In an open- list
setting, candidates from the same party will have little difficulty gaining name recognition
where there are few of them. However, as candidate numbers increase, so too does the
need for the financial resources adequate to disseminate information to voters in order to
achieve name recognition. By extension, Carey and Shugart (1995) and Shugart, Ellis and
Suomenin (2005) hypothesize that as district magnitude increases under open-list PR, so
too do the associated activities of constituency service and pork barrel politics; in other
words, all those activities in which individual officeholders can successfully claim credit
for services and outputs delivered to specific clienteles of voters.
Under closed- list PR, by contrast, precisely the reverse relationship should be
expected to obtain, according to Shugart and Carey. In closed- list PR, electors do not
enjoy opportunities to allocate votes across contenders from the same party. In these
circumstances, when district magnitude is large, party reputation overshadows the
reputations of individual candidates, since there are too many candidates for voters to
uniquely identify them and no incentives for voters to acquire the information to do so.
Where district magnitude is small, however, the party has an incentive to select candidates
7
who already have distinct individual political profiles, because doing so will advantage
these candidates against those associated with other parties. Hence, Shugart and Carey
hypothesize that individual reputation becomes more important as district magnitude falls
in closed- list settings.
These hypotheses about the importance of individual reputation and personal vote
seeking have clear and testable implications for the extent to which elected officials engage
in corruption. They lead us to expect that political corruption will rise as the need for
acquiring the personal vote rises.4 The need for acquiring the personal vote should in turn
increase under open- list PR as district magnitude increases.
Political corruption is a complex set of activities that often involves multiple actors
— the politicians who are the recipients of kickbacks, the businesses who are the payers, and
the bureaucrats who facilitate the illegal transactions between public officials and businesses
— and multiple goals, including both personal enrichment and campaign financing. Our
conceptual focus is on the transactions that are used to raise monies illegally for political
campaigns. Empirically, of course, we cannot know with any confidence what corrupt
politicians do with the ill-gotten gains they pocket. But our expectation that corruption rises
in settings where incentives to amass personal votes increase hinges on the assumption that it
does so precisely because elected officials use illegal proceeds to fund electoral competition;
this is the necessary link between “the personal vote” and corruption. If candidates for public
office were not using some of the proceeds of corrupt transactions to fund their political
careers, there would be no reason to expect that the search for the personal vote would also
entail greater overall levels of corruption.
4 Kunicova and Rose-Ackerman (2005) contend that corruption rises in open-list PR precisely because legislators have difficulty in multi-member settings claiming credit for the delivery of services to their districts. We believe this is empirically questionable. For some evidence, see Golden (2005)
8
Our reasoning goes as follows. Where the incentives for the personal vote rise,
candidates need larger baskets of individual campaign funds. They need money to advertise
their individual candidacy. The relevant political activities vary across countries, but may
entail the purchase of television advertising time, printing and distribution of campaign
posters, gift-giving and the distribution of candidate-related trinkets, and other such matters
during the campaign itself, as well as myriad costly candidate-centric activities while holding
public office. All of these activities, which require money that the party itself is unlikely to
provide, may tempt candidates to seek illegal campaign contributions, especially in contexts
in which the abilities of individual candidates to raise campaign funds may be legally
circumscribed in various ways. Parties will typically fund electoral competition directed
against other parties, not the candidacies of various co-partisans against each other.
Individuals must raise their own funds to compete with contenders from the same party.
These funds are necessary for building a personal reputation in the eyes of voters.
Our argument is thus that corruption is an illegal variant of the search for the personal
vote, which in its licit form typically involves the distribution of geographically targetable
local public goods, such as public works and infrastructure investments, as well as patronage,
in the form of government jobs. Previous studies have found that policy outputs that are
geographically targetable — rivers, bridges, and other “pork barrel” policy goods — are
relatively more common in majoritarian electoral systems than under PR, where more
broadly redistributive transfers obtain instead (Milesi-Ferretti, Perotti and Rostagno 2002;
see also Lizzeri and Persico 2001; Persson, Roland and Tabellini 2004; Stratmann and Baur
2002). Our work builds on — and by implication potentially amends — these studies, by
extending research on “pork barrel” politics to corruption, which is also geographically
9
targetable but which is characterized specifically by illegality, and by distinguishing the
impact of open list from closed list PR. Like pork barrel policies, corruption is
geographically targetable; indeed, in many instances, corruption is more precisely targetable,
because opportunities for corrupt exchanges are embedded in pork barrel politics and can be
even directed at single firms (by permitting only preselected firms to win public tenders, for
instance). Note, however, that the content of the exchange differs between the two: pork
barrel politics are aimed at winning votes for individual candidates in the localities so
targeted, whereas corrupt exchanges are aimed at ext racting financial resources. For present
purposes, this final distinction is not pertinent. Rather, we emphasize that we see corruption
as one likely by-product of the need to establish personal political reputations. Unlike
Kunicova and Rose-Ackerman (2005), we expect that pork barrel politics and corruption to
vary in tandem, as two facets of the search for the personal vote.
In sum, the hypotheses that we test in the following pages are two:
1) Corruption increases with district magnitude under open-list PR;
2) Corruption decreases with district magnitude under closed-list PR.
We use two empirical strategies to test these hypotheses. First, we analyze a widely-
used crossnational measure of corruption perceptions based on surveys of businesspeople and
others to study the relationship between open/closed list PR and the extent of corruption in
countries that use proportional representation. Although activities identified in this dataset
include both political and bureaucratic corruption, it is now commonly accepted that the two
tend to go together, and that the CPI constitutes an acceptable proxy for political corruption
(Lambsdorff 1999). As a check on our findings using that index, we also undertake a parallel
analysis using an alternate but largely similar measure of corruption developed by the World
10
Bank (Kaufmann, Kraay and Zoido-Lobatón 1999; Kaufmann, Kraay and Zoido-Lobatón
2002; and Kaufmann, Kraay and Mastruzzi 2003). Kaufmann, Kraay and Zoido-Lobatón
(KKZ) use a methodologically sophisticated unobserved components model to construct an
alternate composite index (although the underlying data is the same).
Second, we analyze a subnational measure of corruption drawn from Golden and
Picci (2005), which consists of the difference between the cumulative amounts of monies
paid by government to construct public infrastructure and the actually existing amounts of
infrastructure. Where more money is used to build the same amount of infrastructure across
localities in the same country, we assume these “missing” funds are siphoned off in fraud,
mismanagement, deliberate inefficiency, waste and corruption. The measure, which we have
recreated for the present paper at the level of Italy’s 32 electoral districts, allows us to study
whether, in the open list context that existed in Italy until 1994, corruption in public works
corruption increase with district magnitude. Our hypotheses lead us to expect that corruption
under open- list PR (closed-list PR) will be greater (less) as district magnitude increases, and
that suspected political corruption in Italy will therefore also rise with district magnitude.
We now turn to the first of our empirical analyses, the cross-national investigation.
II. A Cross-National Investigation II.1 Data
We begin our empirical analysis with a cross-national investigation of data on
perceived corruption across 40-odd contemporary democratic nations. We build on the
foundations established by Treisman (2000), using Transparency International’s Corruption
Perceptions Index to study corruption cross-nationally. Later, we also report results using an
alternate measure developed by the World Bank.
11
We collect information on the world’s democratic countries that use proportional
representation electoral systems, and we study how the extent of political corruption differs
between open- list PR systems and their closed- list counterparts. We also include a measure
of district magnitude in our analysis, and its interaction with our variable for list type (open
or closed) to examine how district magnitude may condition and moderate the effect of
electoral systems on corruption. Finally, as we detail shortly, we include controls for other
important political variables, such as the nature of the political system (presidential versus
parliamentary) and the effective number of parties, as well as for the other variables (such as
level of economic development, religion, certain historical factors) that previous studies have
identified as significantly contributing to corruption across nations.5
We compile our data by first using Treisman’s (2000) dataset from his canonical
cross-national study of the determinants of corruption. We then incorporate the data on
electoral systems and district magnitude from the Database on Political Institutions
(DPI2000), documented in Beck et al. (2001).6 Since our conceptual focus is on the effect of
different types of PR on corruption in a democratic setting, we exclude non-democratic
countries from our dataset. To determine whether a country qualifies as a democracy, we
rely on the Freedom House index, which classes countries as “free,” “partly free,” or “not
free.”7 We include in our dataset all those countries that Freedom House ranks as “free” or
5 Ideally, we would include information on campaign finance regulations as well, since these are likely to be important regulators of political competitiveness. However, we know of no systematic data on this important phenomenon, and unusually tough conceptual issues would be involved in attempting to assemble such a dataset. 6 This dataset, maintained by the World Bank, codes 177 countries on various items, including whether they use plurality electoral rules or proportional representation, and whether they use open or closed lists. The DPI2000 dataset also contains a measure of district magnitude. 7 Countries whose combined averages for political rights and for civil liberties fall between 1.0 and 2.5 are designated “free;” between 3.0 and 5.5. “partly free;” and between 5.5 and 7.0 “not free.”
12
“partly free” and that the DPI2000 accurately codes8 as using PR9 for 1996, 1997 and 1998,
for an initial total of 47 countries. A few countries appear in the Freedom House index as
“partly free” for only one or two of our three years, rendering their democratic status
marginal.10 For these countries, we turn to the Polity IV dataset to verify that Polity too
classes these four marginal nations as non-democratic. These countries were therefore
excluded from our dataset. One country11 changed its electoral system from majoritarian to
proportional during the three years we consider, and we also drop it from the analysis. After
dropping countries for the reasons just identified, we are left with a dataset of 42 nations, all
of which are democratic and all of which use proportional representation. 12
We also incorporate into our dataset Gerring and Thacher’s (2004) coding for
parliamentarism and presidentialism, which is available for all 42 cases, and Golder’s (2005)
coding of the effective number of parties. Golder codes 41 of our 42 countries,13 so we
preserve almost all our countries when we add his measure of competitiveness of the
electoral environment.14
8 We identified and corrected some errors in the DPI2000 coding. We enumerate these in Appendix A.2. 9 Plurality systems and mixed-member ma joritarian systems are excluded from the analysis. Note that the countries included in our dataset also cover mixed-member proportional countries (Bolivia, Germany, New Zealand, and Venezuela), as well as one (Taiwan) in which closed-list PR and SNTV coexist. As we elaborate below, our findings are insensitive to the inclusion or exclusion of these five cases. See Shugart and Watterberg (2001) for a discussion of the differences between mixed-member majoritarian and mixed-member proportional systems. For details on our coding of mixed systems, see Appendix A.2. 10 This is true for Senegal, Singapore, Uganda and Kuwait. 11 El Salvador. 12 Note that the usable number of observations is 39 when the CPI index is used as the dependent variable, since the index does not provide scores for Malta, the Dominican Republic and Sri Lanka. When the KKZ index is used as the dependent variable instead, the usable number of observations increases to 41 (but not 42, because KKZ does not have information on Namibia). 13 He does not code Paraguay. 14 We also experiment with two measures of district magnitude available in Golder’s dataset: average district magnitude in the lowest electoral tier and median district magnitude in the lowest electoral tier. These are each highly correlated with the DPI2000 measure of district magnitude (correlation = 0.91 for each) and do not change our substantive findings.
13
We choose to use information from the years 1996, 1997 and 1998 as the basis on
which to construct our dataset in the first instance because Treisman’s (2000) dataset is
coded for these years. Other studies (most notably for our purposes Gerring and Thacker
(2004)), also use data from the latter part of the 1990s. By confining our analysis to the same
time period, we render it most comparable to these other investigations; to the extent that our
results differ, it cannot be because of a slight alteration in the years considered. Because our
results only partially corroborate a main finding reported in Gerring and Thacker (2005), we
particularly wanted to use data from the same years as they did, even if it meant our dataset
would be slightly outdated. However, we doubt that our results would substantially alter
were we to update the data (on either the dependent or independent variables) by two years to
2000, which is the most recent year for which it might be feasible to collect all the relevant
data. Appendix A.1 provides a description of the cross-national data used in this study, and
Appendix A.2 enumerates the vital information for the 42 democratic nations examined in
our analysis.
II. 2. Empirical Results
We begin our analysis using with the largest, most inclusive dataset we could create
for democratic countries using proportional representation, the one just described. Our
statistical work prceeds in a series of steps, first dropping questionable cases of mixed-
member proportional electoral systems and then dropping outlier countries with unusually
large district magnitudes. At each step, we report parallel regression results, verifying that
our basic argument is substantiated regardless of how we cut the data. We include important
control variables at each step, and an alternative measure of corruption. Finally, we also
14
perform simulations aimed at generating intuitively meaningful and substantively interesting
interpretations of our findings.
Our analysis of how district magnitude affects corruption under closed- list and open-
list systems begins with an examination of the unconditional impacts of the district
magnitude variable (DM) and the electoral system variable (OPEN) on the CPI (averaged
over 1996 through 1998 and rescaled so that higher values represent more corruption rather
than the reverse). We use ordinary linear regression with robust standard errors to deal with
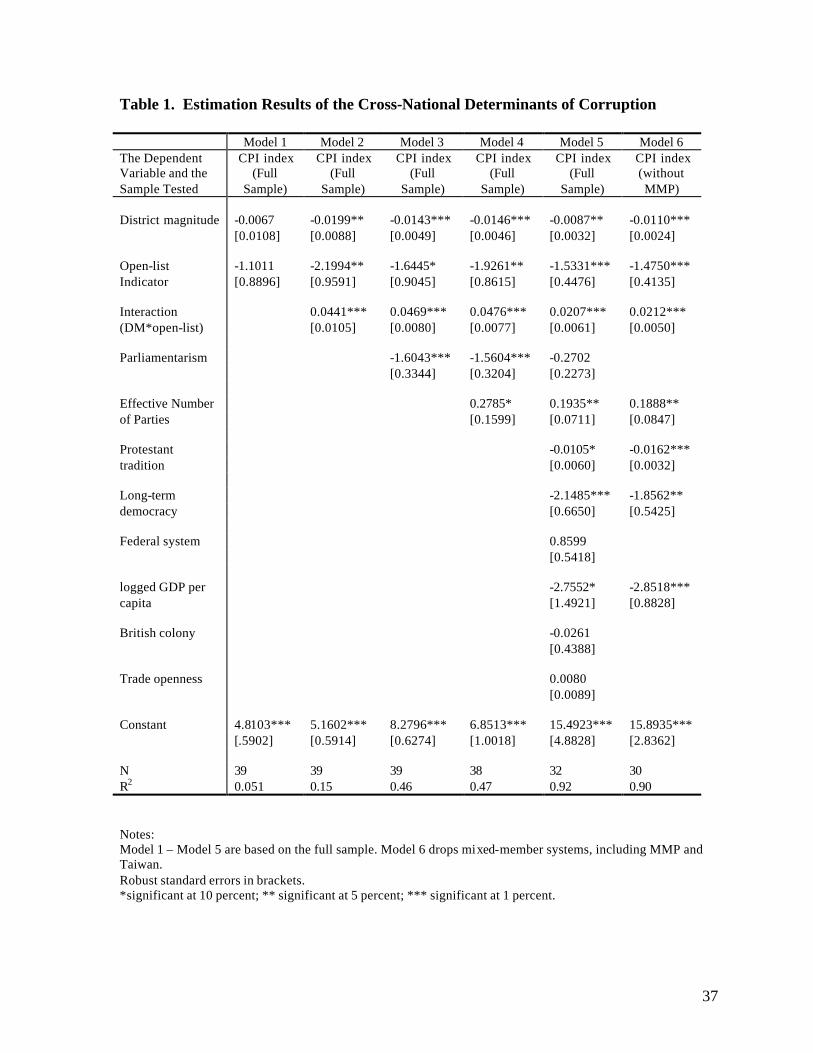
the potential threat of heteroskedasticity among countries. At the results presented in Model
1 of Table 1 reveal, none of the variables is statistically significant. However, since this
initial specification fails to capture our main prediction that district magnitude increases
(reduces) corruption under open- list (closed-list) PR systems, it would be a mistake to infer
from it that electoral systems and district magnitude were not associated with corruption.
Once we include the interaction terms for OPEN and DM (OPENxDM), we find
unambiguous support for our expectation. The results reported in Model 2 of Table 1 show
that the relationship between political corruption and district magnitude under open- list PR
systems is characterized by the following equation:
OPENiDMOPEN
iDMOPENiTI 02.004.3)04.00199.0()2.216.5( +=+−+−= (1)
whereas under closed- list PR systems the relationship between corruption and district
magnitude is described by:
CLOSEDi
CLOSEDi DMTI 0199.016.5 −= (2)
In other words, as district magnitude increases under open-list PR, corruption rises. Under
closed- list PR arrangements, political corruption becomes less prevalent as district magnitude
increases.
15
[Table 1 about here]
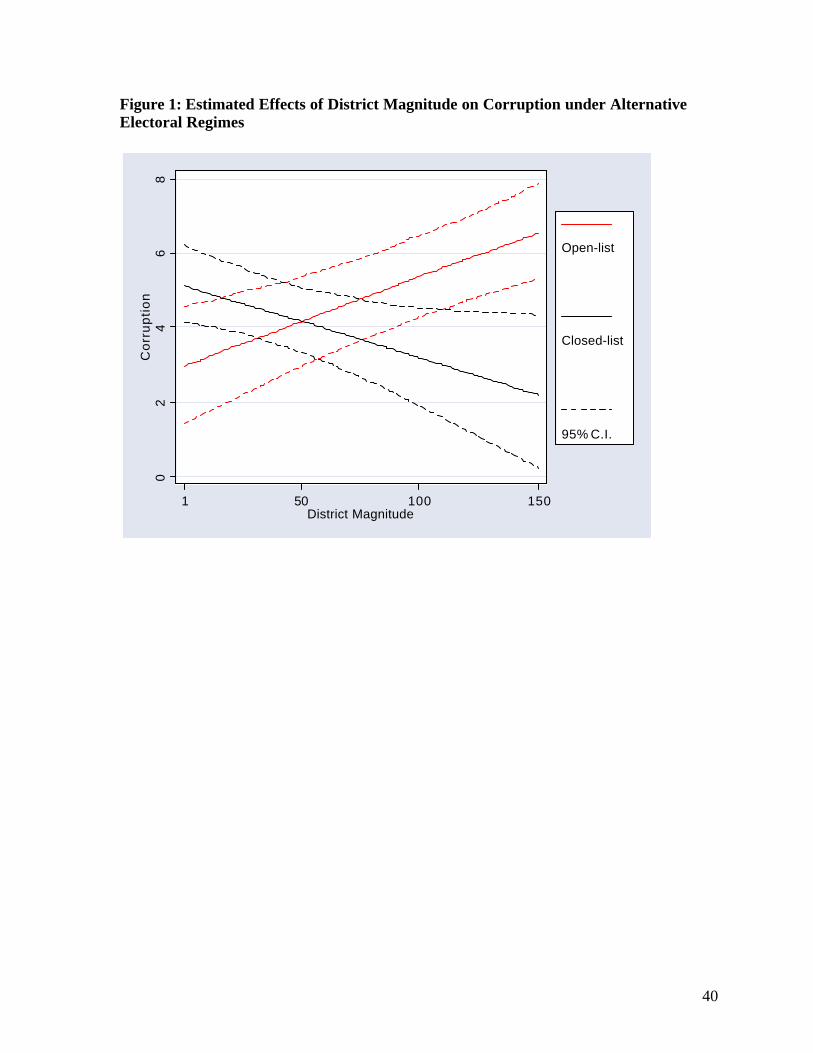
To ascertain whether the effects of district magnitude on corruption under alternative
electoral regimes are indeed significant, we use Clarify15 (King, Tomz and Wittenberg 2000;
Tomz, Wittenberg and King 2003) to graphically enrich our understanding of how the effect
of district magnitude is conditioned by the difference between open- list and closed- list PR.
Figure 1 graphs the estimated relationship between the CPI and district magnitude under the
two electoral systems, and also depicts the 95 percent confidence intervals. As we can see
from the results displayed in the figure, the empirical evidence indicates that the key to
understanding which type of PR system is more prone to corruption lies in the extent of
district magnitude. Closed- list PR is more corrupt than its open- list counterpart only when
district magnitude is relatively small. More importantly, since the confidence intervals
overlap at smaller district magnitudes, there is no district magnitude at which we can assert
with enough statistical precision to be sufficiently confident of our results that closed- list PR
is associated with more corruption. Finally, we can see that once district magnitude gets
sufficiently large, corruption becomes greater under open- list PR than in closed- list
settings.16
[Figure 1 about here]
The simple model just presented is obviously underspecified. Drawing on existing
studies of the specifically political determinants of corruption (Lederman, Loayza and Soares
2005; Montinola and Jackman 2002; Gerring and Thacker 2004), we incorporate other
15 Clarify is a program that simulates quantities of substantive interest from statistical models. See King, Tomz and Wittenberg (2000) for a discussion. 16 We also ran identical regressions using each of Golder’s (2004) measures of district magnitude in place of the measure from the DPI2000, and results were unaffected. For reasons of space, we do not report these results here, which are available from the authors on request.
16
important institutional variables into our initial specification. 17 We first take into account the
effect of constitutional form, distinguishing parliamentary from presidential systems. Gerring
and Thacker (2004) and Kunicova (2005) report that presidential systems exhibit greater
levels of corruption than their parliamentary counterparts. Using Gerring and Thacker’s
coding of regimes, the results reported in Model 3 of Table 1 initially substantiate their
findings. We find a negative and statistically significant relationship between regime type
and the CPI, meaning that presidential democracies are associated with greater perceived
corruption. More importantly for our purposes, however, controlling for regime type leaves
our primary variable of interest unaltered. Larger open-list systems are still significantly
more likely to report higher levels of corruption than closed- list systems.
We next incorporate a measure of the effective number of parties, as a proxy for
transparency. 18 Our intuition is that in the multiparty environments characteristic of
proportional representation, as the number of parties increases, it becomes that much more
difficult for the press and the public to monitor the behavior and activities of politicians and
public officials. This increases the scope for corruption. Model 4 in Table 1 adds Golder’s
(2005) measures of the effective number of parties. Our initial results remain robust to the
17 We attempted to include a measure of judicial independence, which we hypothesize should be negatively related to levels of corruption for intuitively obvious reasons. However, because coding provided by La Porta et al. (2004) is available for only 26 of our countries, including this variable leads to low degrees of freedom for the open-list PR countries. In any event, given the fact that democratic nations do not vary a much in judicial independence, we suspect that including judicial independence would be unlikely to yield very meaningful results for our sample of countries even if more data were available. 18 A more standard measure of transparency is independence of the press. However, there is inadequate variation on freedom of the press among the democratic nations in our dataset. (Documentation on freedom of the press is available from Freedom House.) Alternative measures, such as newspaper readership or number of newspapers in circulation, seem to us largely spurious. The first is a development measure, and does not capture the extent to which citizens have access to or obtain information about the political regime and political officials. The second is a measure of industry concentration that likewise speaks only peripherally to freedom of the press, especially in an age in which most citizens get a great deal of their political information from television rather than print media.
17
inclusion of this variable. As expected, it emerges as significantly associated with greater
values of perceived corruption.
Finally, using Treisman’s (2000) dataset, we incorporate an additional six control
variables that he found important in accounting for the crossnational variance of perceptions
of corruption: Protestantism, a history of British rule, per capita wealth, a higher volume of
trade imports, federalism, and the length of exposure to democracy. The results, presented as
Model 5 in Table 1, also substantiate those initially reported for Model 1. As we can see
from the data displayed in the table, the effect of district magnitude on corruption is positive
(-0.0087+0.02 ≈ 0.011) under open- list PR, whereas it is negative (-0.0087) in a closed- list
context. Our results confirm Treisman’s findings for the variables that he reports as
important. In his study, which uses a larger sample of countries than we do, not only those
democracies whose electoral systems utilize proportional representation, he finds, as we
confirm, that countries with Protestant traditions, higher levels of economic development,
unitary political systems, and a long exposure to democracy suffer from less corruption. In
our results, the coefficients for the variables measuring British rule and federalism have the
expected signs but are indistinguishable from 0 by conventional standards.
Our initial dataset comprises all democracies that use PR and a few countries that use
mixed member proportional systems (see footnote 9). We now drop these mixed cases and
reestimate the model based on the variables that were found to be significant in Model 5.
Nonetheless, as the information reported in Model 6 in Table 1 shows, our results are
substantially unaffected. The signs on all the variables remain unaltered, and the variables
that were statistically significant in Model 5 retain their significance.
II. 3. Robustness Checks
18
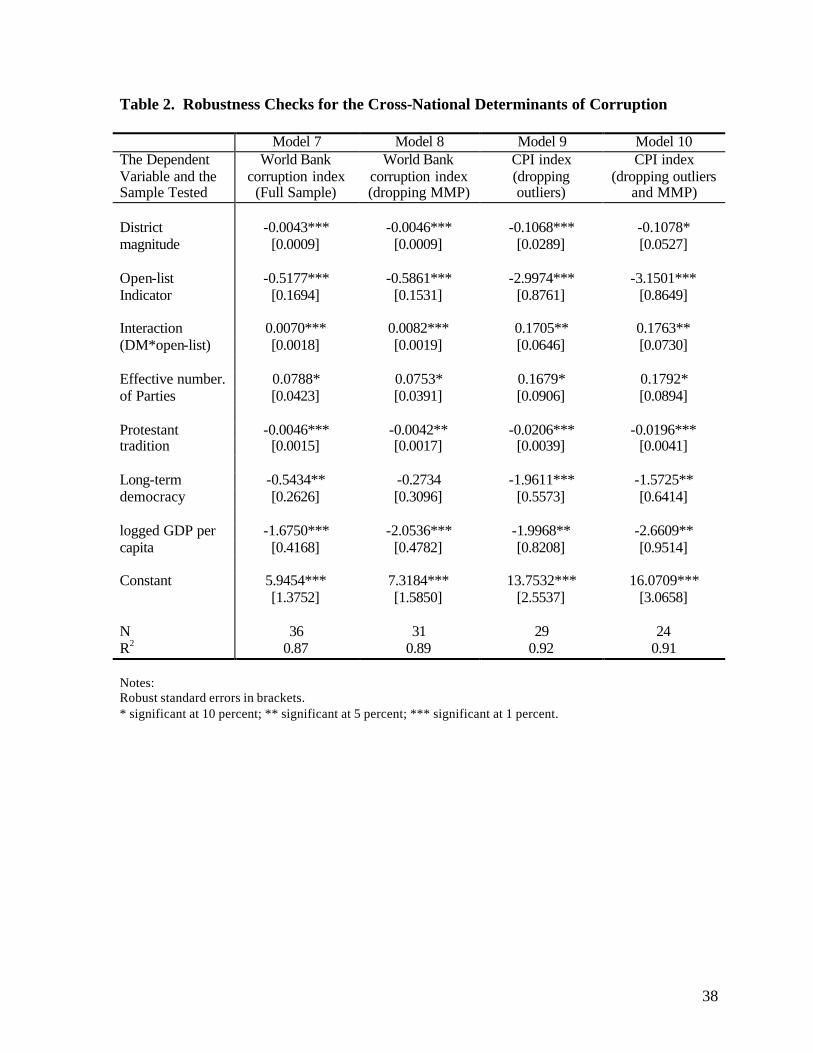
How robust are our findings? We undertook two different types of sensitivity
analyses. First, we reestimated the model using a different measure of corruption, and,
second, we dropped outliers. We report the findings of these additional regressions in Table
2.
[Table 2 about here]
Models 7 and 8 report regression results when we use a World Bank indicator of
perceptions of corruption (initially reported in Kaufmann, Kraay and Zoido-Lobatón 1999).
As was the case in the regression results reported in Table 1, we find that using this measure
also confirms that the effect of district magnitude on corruption is positive under open- list
PR, whereas it is negative in a closed- list context. This is true both for our initial set of
countries, as we see from the results under Model 7, and after we drop the mixed-member
proportional systems, as reported in Model 8.
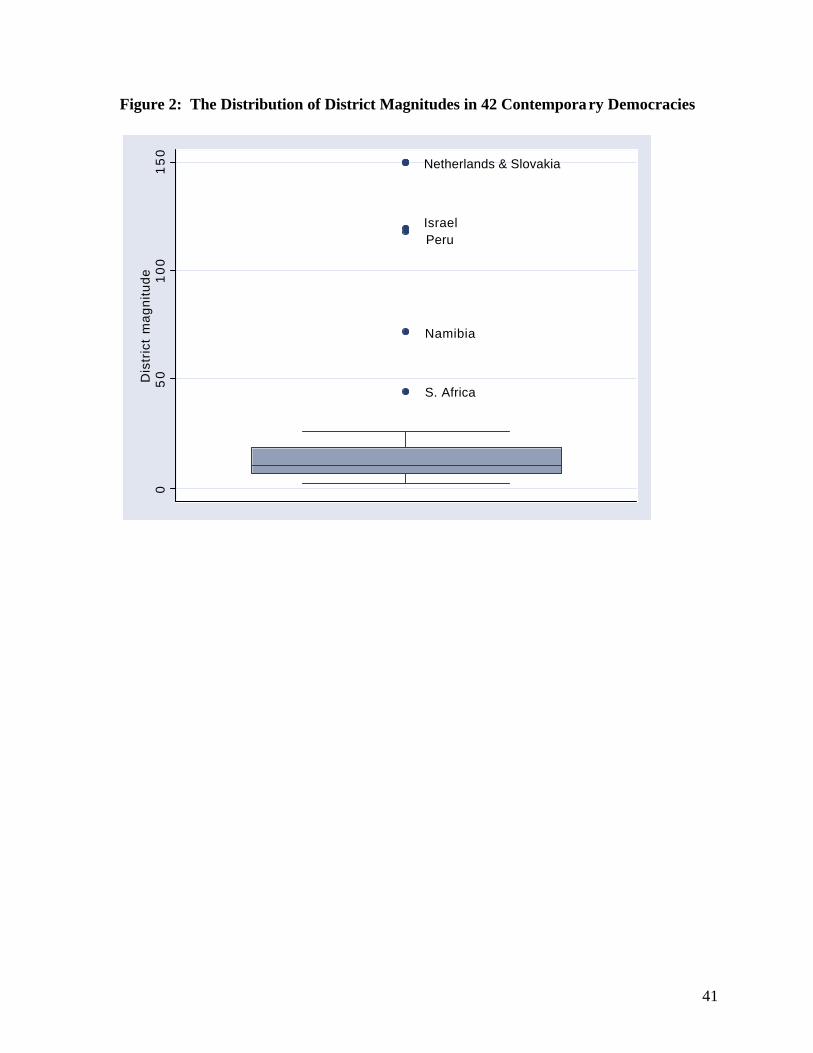
The average size of electoral districts varies considerably among our countries, from
a low of 2 to a high of 150 among the 42 countries in our initial dataset. As we can see in
Figure 2, the distribution of district magnitude is right skewed, and there are several notable
outliers, such as the Netherlands, Slovakia, Israel and Peru. 19 This leads us to ask whether
our results are driven by outliers, whose district magnitudes each average 40 representatives
or more. We test whether our basic results continue to hold even if we drop the countries
with unusually large electoral districts, and report the results as Models 9 and 10 in Table 2.
The results again corroborate our earlier findings. In Model 9, we report results
without six outliers, using the CPI as the measure of corruption, and in Model 10, we report
results without either outliers or mixed-member proportional systems. Once again, we find
19 Some of these, such as Israel and the Netherlands, are countries whose “district” is the entire nation; others have simply established unusually large district boundaries.
19
that the effect of district magnitude on corruption is positive under open- list PR, whereas it is
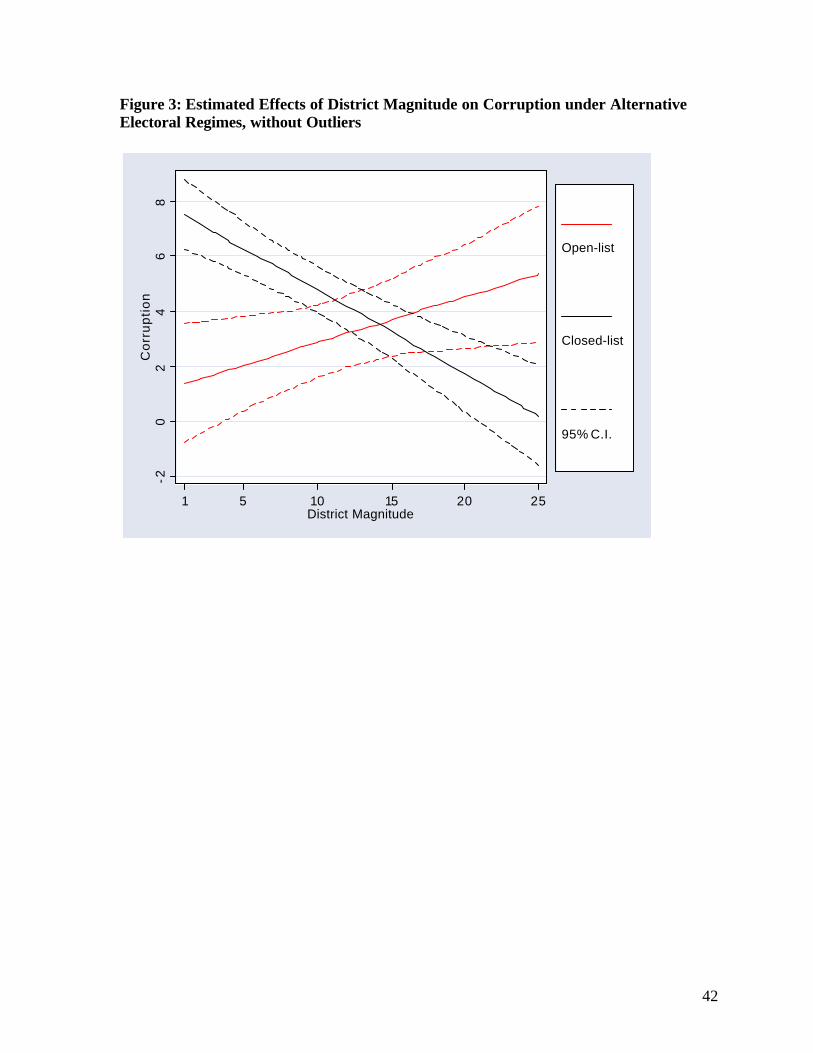
negative in a closed- list context. In addition, once we drop outliers, we can get a more
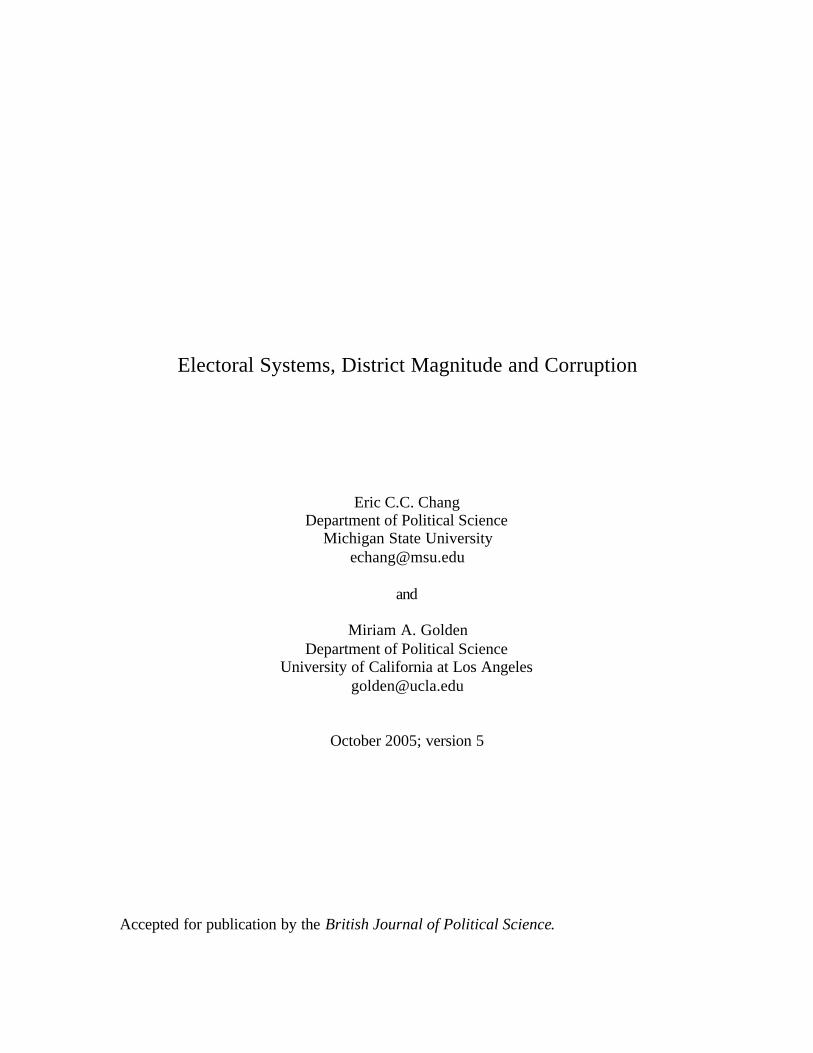
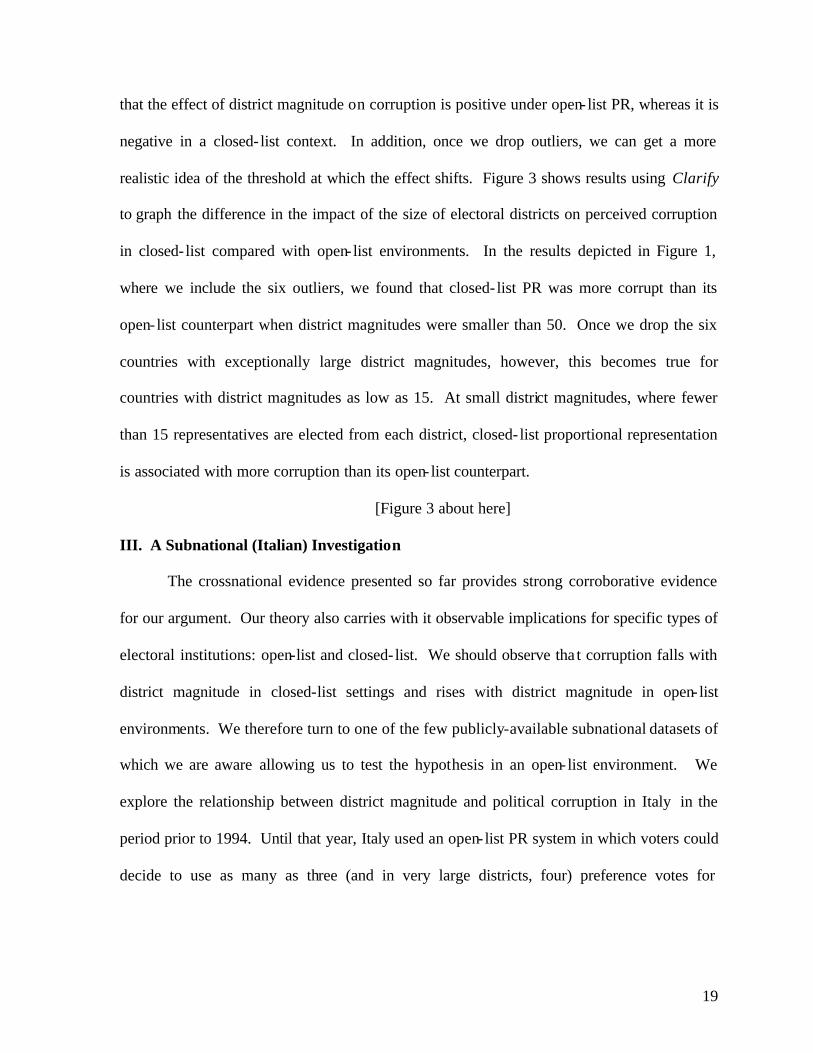
realistic idea of the threshold at which the effect shifts. Figure 3 shows results using Clarify
to graph the difference in the impact of the size of electoral districts on perceived corruption
in closed- list compared with open- list environments. In the results depicted in Figure 1,
where we include the six outliers, we found that closed- list PR was more corrupt than its
open- list counterpart when district magnitudes were smaller than 50. Once we drop the six
countries with exceptionally large district magnitudes, however, this becomes true for
countries with district magnitudes as low as 15. At small district magnitudes, where fewer
than 15 representatives are elected from each district, closed- list proportional representation
is associated with more corruption than its open- list counterpart.
[Figure 3 about here]
III. A Subnational (Italian) Investigation
The crossnational evidence presented so far provides strong corroborative evidence
for our argument. Our theory also carries with it observable implications for specific types of
electoral institutions: open-list and closed- list. We should observe tha t corruption falls with
district magnitude in closed-list settings and rises with district magnitude in open- list
environments. We therefore turn to one of the few publicly-available subnational datasets of
which we are aware allowing us to test the hypothesis in an open- list environment. We
explore the relationship between district magnitude and political corruption in Italy in the
period prior to 1994. Until that year, Italy used an open- list PR system in which voters could
decide to use as many as three (and in very large districts, four) preference votes for
20
individual candidates on the party list of their choice.20 Individual candidates won office on
the basis of the number of preference votes they received, giving each candidate a powerful
incentive to attempt to amass preference votes. In addition, political resources and positions
within many parties were distributed on the basis of the number of preference votes won.
This system encouraged intraparty competition (Katz 1985). With an average district
magnitude of 20, but ranging in the number of representatives elected from one to 54, we
expect that corruption rises in Italy’s open- list setting as district magnitude increases.
By estimating corruption across Italian electoral districts, we hold relatively constant
an array of factors that usually vary crossnationally, including culture, language, legal
tradition and institutions, and other aspects of the national political and party systems. This
is useful if we suspect that the choice of electoral system and/or district magnitude may itself
be endogenous to government performance and policy outputs. The Italian case is also
useful because our measure of corruption exhibits a lot of variation across electoral districts.
We use an index of corruption in public works contracting, which is normalized so that 100
represents the Italian average. This varies from a low of .24 (meaning a district whose
infrastructure goods are only 24 percent of the national average for the same cumulative
amounts of money) to a high of 1.9 (meaning a district whose infrastructure goods are nearly
twice the national average for the same cumulative amounts of money).
III.1. Data
Using Italy’s 32 electoral districts as the unit of analysis, 21 we measure political
corruption in a given district as the difference between the cumulative amounts of
20 Preference votes were restricted to one in the 1992 parliamentary elections. 21 One of Italy’s electoral districts (Valle d’Aosta) is effectively majoritarian rather than PR, because it only elects a single legislator. Because of this, and also because of data limitations pertaining specifically to that district, we drop it from our analysis.
21
government monies historically allocated to public capital up to 1997 and the actually
existing amounts of public infrastructure (kilometers of highways, numbers of hospital beds,
number of phone lines, etc.) as of approximately 1997. The procedures involved in
aggregating the various data into an index are detailed in Golden and Picci (2005). The
intuition underlying the index is that where more government money is needed to produce
the same quantity of public infrastructure, political authorities are siphoning off more monies
in the form of bribes and kickbacks connected to the contracting process. In order to explore
whether this type of corruption varies systematically with district magnitude, we rebuild the
Golden-Picci index at the level of electoral districts by aggregating both parts (spending and
physical goods) from provincial data.
The Golden-Picci index is available for 1997 only, because the measures of physical
goods used to create it are available only for that year. Italy switched from a pure open- list
PR system to a mixed system with the 1994 legislative elections. We study the impact of
district magnitude prior to 1994 — under open- list PR, in other words — on corruption in
public works contracting, where the latter measure is taken from 1997. Our justification for
this minor temporal misalignment is that the measure of corruption in public works
contracting that we use moves very slowly year to year. It reflects the historically
accumulated amounts of corruption, because the relationship between government monies
allocated on public capital and the amounts of public infrastructure that exist do not change
much from one year to the next. Bridges do not get built in a day, and physical
infrastructure accumulates slowly. Cumulative spending on public capital is an obviously
slow-moving measure, since every year’s addition is only a small part of total spending over
many decades. Both components of our measure of corruption are thus unlikely to have
22
experienced much modification between 1994 — the year we measure district magnitude —
and 1997 — the year we measure corruption. If our theory is correct, we should find more
corruption in public works contracting in larger districts, all else equal.
III.2 Empirical Analysis
We compile a cross-sectional (district level) dataset. The dependent variable is the
index of public works corruption, constructed as a standardized and normalized index of
physical goods divided by the cumulative amounts of monies spent on public infrastructure
minus deprecation (PUBWORKS) as of about 1997, and the key independent variable is
district magnitude (DMAG) in the pre-1994 electoral system.
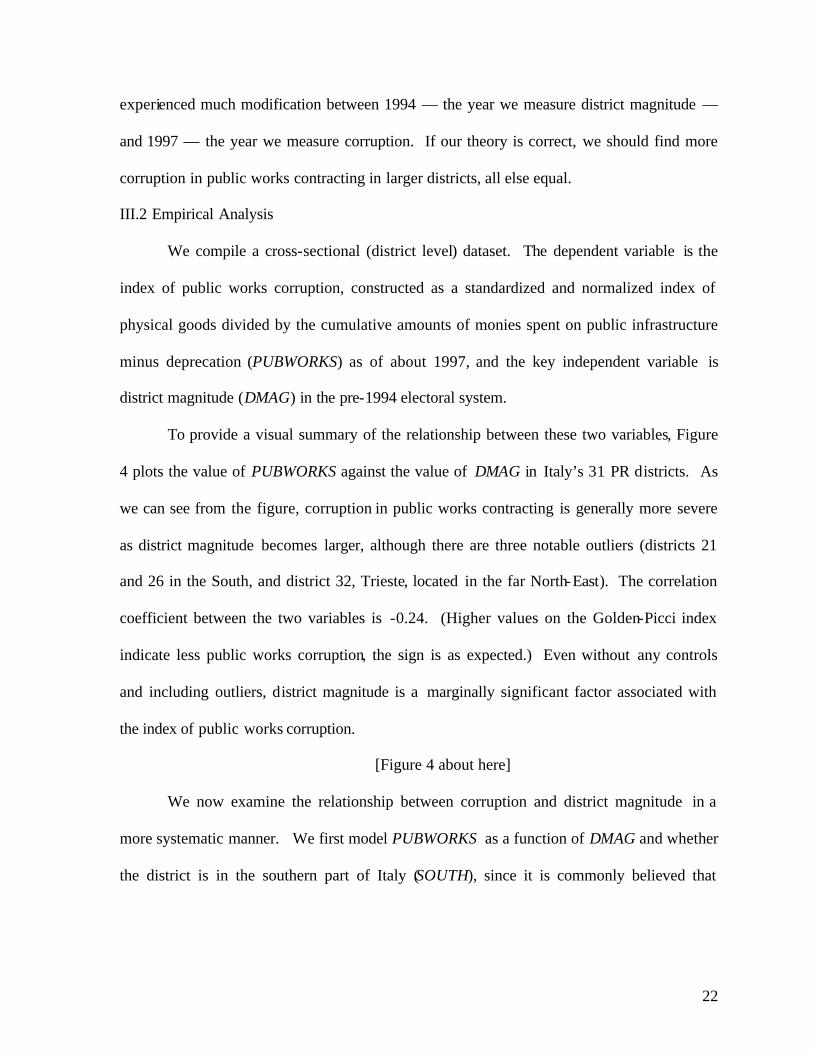
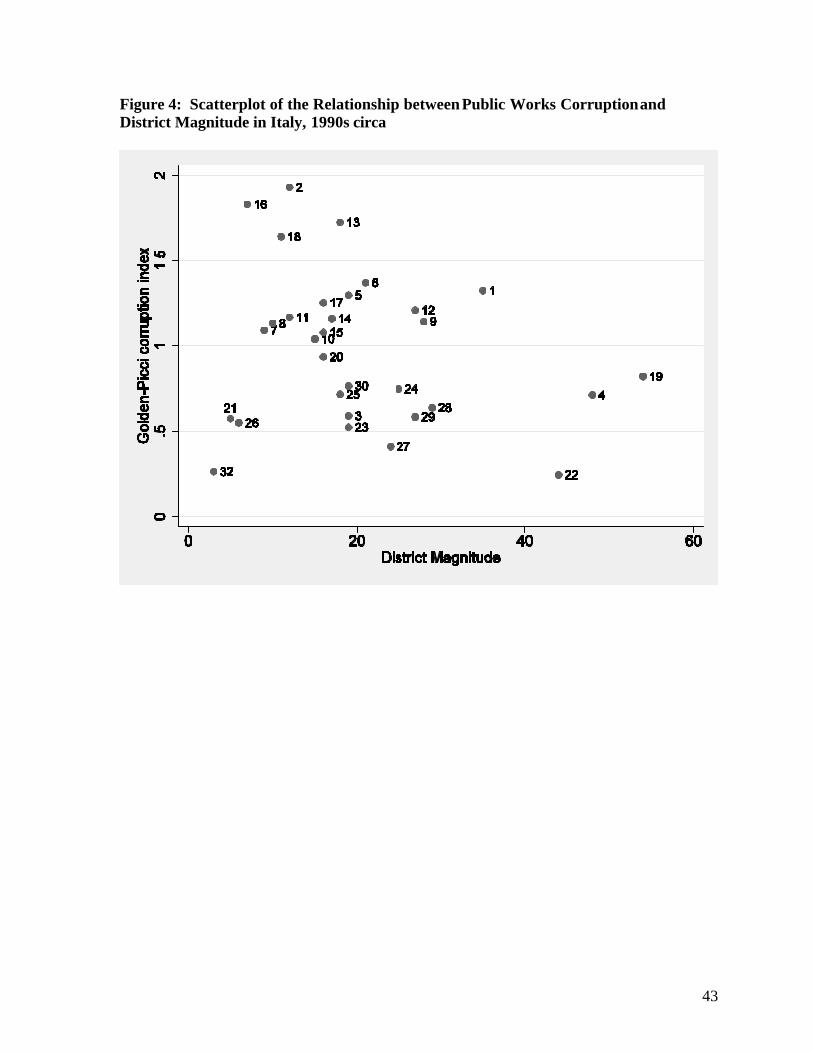
To provide a visual summary of the relationship between these two variables, Figure
4 plots the value of PUBWORKS against the value of DMAG in Italy’s 31 PR districts. As
we can see from the figure, corruption in public works contracting is generally more severe
as district magnitude becomes larger, although there are three notable outliers (districts 21
and 26 in the South, and district 32, Trieste, located in the far North-East). The correlation
coefficient between the two variables is -0.24. (Higher values on the Golden-Picci index
indicate less public works corruption, the sign is as expected.) Even without any controls
and including outliers, district magnitude is a marginally significant factor associated with
the index of public works corruption.
[Figure 4 about here]
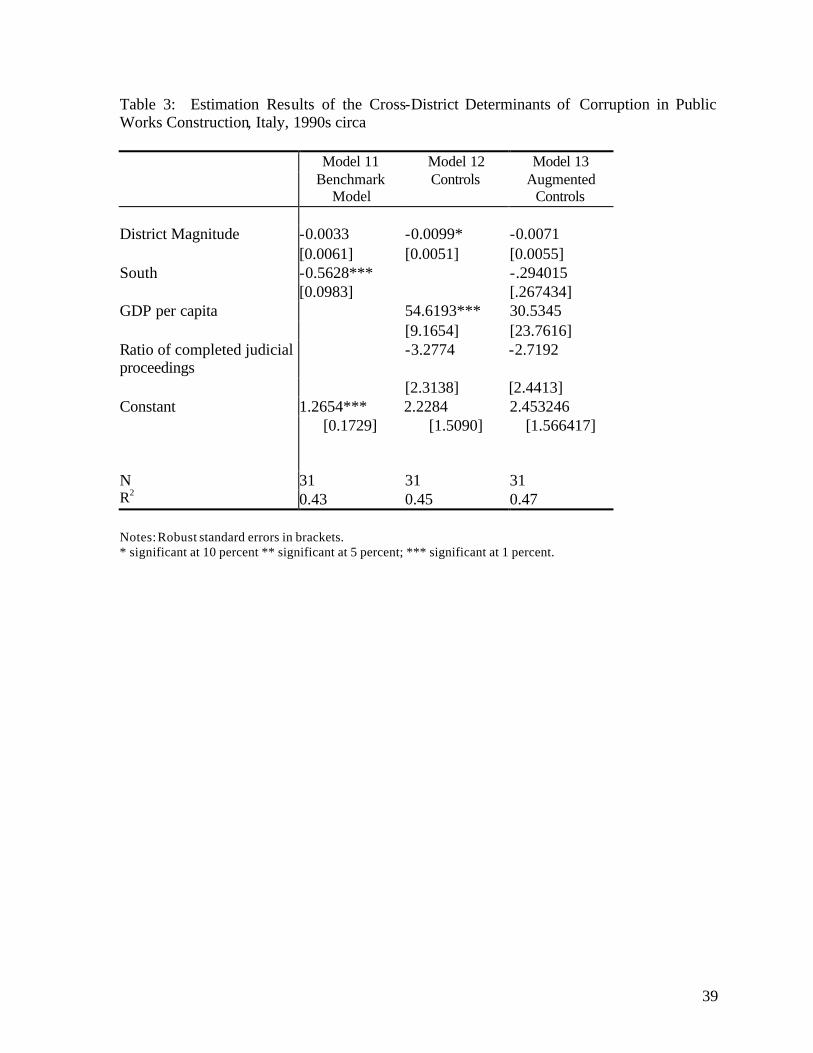
We now examine the relationship between corruption and district magnitude in a
more systematic manner. We first model PUBWORKS as a function of DMAG and whether
the district is in the southern part of Italy (SOUTH), since it is commonly believed that
23
corruption is greater in the southern half of Italy (cf. Putnam 1993).22 The results, reported in
Model 11 of Table 3, do not reject our theory. The coefficient on DMAG is negative, as
expected, but statistically insignificant. Location, by contrast, is a highly significant
predictor of corruption in public works construction, which tends to be higher in the southern
part of Italy.
[Table 3 about here]
Model 11 is obviously underspecified, serving only as an initial benchmark. To
provide a fuller understanding of the causes of corruption, we add two control variables. We
follow the lead provided by Alt and Lassen (2003), and include a measure of district levels of
economic wealth (WEALTH). Alt and Lassen find economic development is important in
accounting for corruption in a crosssectional study of US states. Likewise, many have
suggested that economic development reduces corruption, and GDP is the single most
important correlate of corruption at the crossnational level (Treisman 2000).23 Second, we
include a measure of judicial efficiency. 24 It is intuitive to expect that politicians are less
likely to systematically extort firms to pay kickbacks in exchange for public works contracts
in environments where the judiciary is hard-working, efficient and itself incorruptible. The
measure of judicial efficiency that we use is the average annual ratio of completed judicial
proceedings in civil cases to the total pending, in the lower courts (IPEST) in the period of
the Eleventh Legislasture (1992-94). This measure is one of the standard proxies for judicial
efficiency in Italian regions (Bianco, Jappelli and Pagano 2004; Fabbi 2001; Guiso, Sapienza
and Zingales 2002). We have reaggregated it to correspond to then-existing electoral
22 South is defined in conventional fashion, encompassing all electoral districts from Rome down. 23 It may also be the case that corruption inhibits economic development, thereby reducing wealth, but for the moment we ignore endogeneity issues. 24 The very high correlation between the two measures (r = -.97) means we cannot include both in the same regression equation.
24
districts. We expect there will be less corruption in public works contracting in areas where
the judicial branch is more efficient and where wealth is higher.
Results of this expanded model are reported in Model 12 of Table 3. As we can see,
the coefficients of DMAG remain negative but are now statistically significant. Both of the
additional control variables enter with the expected signs. Wealth is higher where public
investments are more productive and as the ratio of completed judicial proceedings to the
total increases (IPEST), so too do public investments produce more units of public capital.25
This specification reconfirms that corruption is worse in larger open- list electoral districts.
Finally, Model 13 of Table 3 reports results with all possible control variables
included. In this new specification, perhaps because of problems of collinearity, no regressor
exhibits a coefficient that meets standard criteria for statistical significance. District
magnitude continues to exhibit the expected sign, however, suggesting once again that larger
districts are associated with more corruption.
IV. Conclusions
This study analyzes the relationship between institutional details of proportional
representation electoral systems and corruption. Whereas previous studies have shown that
closed- list proportional representation is associated with greater (perceived) corruption than
open- list PR or majoritarian systems, we demonstrate that this relationship fails to hold once
district magnitude is incorporated into the model. Extending insights from the personal vote
literature, we show that political corruption gets more (less) severe as district magnitude
25 We also estimated an identical model but using an alternate measure of judicial efficiency, the annual average length of civil trials in the lower courts during the period of the Eleventh Legislature (1992-1994). In this model, district magnitude again emerged as significantly and positively related to corruption; as corruption increased, so did district magnitude. Both per capita wealth and this alternate measure of judicial efficiency exhibited statistically significant coefficients. However, the sign on the latter variable was in the wrong direction. We have no explanation for why this is the case. However, we note as well that the overall fit of the model using our preferred measure of judicial efficiency (IPEST) was better.
25
increases under open- list PR (closed- list PR) systems. In addition, once district magnitude
exceeds a certain threshold — our cross-national empirical estimates put this at 15 — we
demonstrate that corruption is greater in open list than in closed list settings. Using an
alternative, objective proxy for corruption across Italian electoral districts in the 1990s, we
find consistent evidence that suggests that larger electoral districts are associated with more
corruption in the construction of public infrastructure.
Our results have empirical interest. One obvious policy implication of our main
finding is that countries using open- list rules should keep district magnitudes small in order
to discourage the intense intraparty political competition that we believe constitutes an
important driving force behind political corruption. Erecting barriers to entry so as to
discourage the formation of large numbers of political parties, which appears to hinder the
ability of the public to monitor elected officials, thereby decreasing accountability, is another
policy implication of our findings.
Our results also have theoretical importance. We have shown that open- list
proportional representation is conductive to political corruption, at least where electoral
districts are somewhat large. This underscores that corruption and the search for the personal
vote go hand in hand. Legislators who engage in illegal activities may not be less moral than
the rest of us, just a lot more pressured in their search for job security.
Finally, our findings are not intuitively obvious. Take the case of open list PR, for
instance, where we have documented that corruption rises with district magnitude. Where
there are more candidates, one might imagine that monitoring on the part of co-partisans
would discourage corruption. Given the sheer numbers involved, at least some candidates
ought to have low moral thresholds for tolerating illegal behavior among their competitors,
26
and ought therefore to be predisposed to denounce them. This should, in equilibrium, make
actual corrupt transactions less likely to occur in large districts. Instead, we find the reverse,
suggesting that the incentives for amassing illegal funds must be pronounced indeed if
candidates regularly expose themselves to the potential dangers of doing so despite the large
number of competitors (and potential denunciations) they face.
Our study opens the way for additional research. Although theoretically consistent,
our study calls out for a formal analysis of the conditions under which elected officials
engage in criminal wrongdoing in order to enhance their prospects for reelection.
Specifically, it is important to sort out the relative effects of institutional incentives behind
corruption and monitoring difficulties allowing it to occur. Is it merely that the incentives for
corruption rise with larger numbers of competitors, both within one’s party and outside it,
because it is more expensive to compete with 20 other candidates than with two? Or could it
be that more contestants reduce the ability of the press and the judiciary to monitor
campaigning by candidates, thereby permitting them greater opportunities to engage in illegal
activities? Finally, and relatedly, is illegal behavior among public officials merely anomic,
isolated wrongdoing, or does collusion among copartisans play a systematic role in inducing
corruption? These questions merit theoretical investigation informed by the empirical
regularities we have observed thus far.
Empirically, our study suggests the need for the collection of data on and the
development of measures of judicial independence, campaign financing laws, and
government regulation of the economy, none of which we successfully incorporated into our
analysis because of lack of data. Finally, an obvious empirical extension of our concern
with the personal vo te is to incorporate single-member electoral districts into the analysis.
27
Our expectation is that single member districts with open primaries should resemble large
districts with open lists in the extent of corruption generated, whereas closed primaries and
single member districts should resemble large districts under closed lists. But this awaits
future analysis.
28
References Cited
Alt, James and David Lassen. 2003. “The Political Economy of Institutions and Corruption in American States.” Journal of Theoretical Politics, vol. 15, no. 3: 341-65. Anderson, Christopher J. and Yuliya V. Tverdova. 2003. “Corruption, Political Allegiances, and Attitudes toward Government in Contemporary Democracies.” American Journal of Political Science, vol. 47, no. 1: 91-109. Aron, Janine. 2000. “Growth and Institutions: A Review of the Evidence.” World Bank Research Observer, vol. 15, no. 1 (Feb.): 99-135. Bianco, Magda; Jappelli, Tullio and Marco Pagano. 2005. “Courts and Banks: Effects of Judicial Enforcement on Credit Markets.” Journal of Money, Credit, and Banking, vol. 37, no. 1 (April): 223-44. Beck, Nathaniel and Jonathan Katz. 1995. “What To Do (and Not to Do) with Time-Series-Cross-Section Models.” American Political Science Review, vol. 89: 634-47.
Beck, Thorsten; Clarke, George; Groff, Alberto; Keefer, Philip and Patrick Walsh. 2001. “New Tools in Comparative Political Economy: The Database of Political Institutions.” World Bank Economic Review, vol. 15, no. 1 (Jan.): 165-76. Cain, Bruce; Ferejohn, John and Morris Fiorina. 1987. The Personal Vote: Constituency Service and Electoral Independence. Cambridge: Harvard University Press. Carey, John and Matthew Shugart. 1995. “Incentives to Cultivate a Personal Vote: A Rank Ordering of Electoral Formulas.” Electoral Studies, vol. 14: 417-39. Cazzola, Franco. 1988. Dalla corruzione. Fisiologia e patologia di un sistema politico. Bologna: Il Mulino. Chang, Eric C.C. 2004. “Electoral Incentives for Political Corruption under Open- list Proportional Representation.” Journal of Politics, vol. 67, no. 3 (Aug.): 716-30. D’Aniello, Marinella and Francesco Sclafani. 1991. Autorizzazioni a procedure. Analisi del fenomeno nel Parlamento Italiano (1948–1991). Il Senato della Repubblica. Naples: Edizioni Scientifiche Italiane. Fabbi, Daniela. 2001. “Legal Institutions, Corporate Governance and Aggregate Activity: Theory and Evidence.” Center for Studies in Economics and Finance Working Paper No. 72, Univesity of Salerno. Gerring, John and Strom C. Thacker. 2004. “Political Institutions and Corruption: The Role of Unitarism and Parliamentarism.” British Journal of Political Science, vol. 34: 295-330.
29
Goel, Rajeev and Michael Nelson. 1998. “Corruption and Government Size: A Disaggregated Analysis.” Public Choice, vol. 97: 107-20. Golden, Miriam A. 2003. “Electoral Connections: The Effects of the Personal Vote on Political Patronage, Bureaucracy and Legislation in Postwar Italy.” British Journal of Political Science, vol. 33 (April): 189-212. Golden, Miriam A. 2004. “Datasets on Italian Parliamentary Malfeasance, Preference Votes, and Members of the Chamber of Deputies, Legislatures I-XI (1948–1992).” Http://www.golden.polisci.ucla.edu. Golden, Miriam A. and Eric C.C. Chang. 2001. “Competitive Corruption: Factional Conflict and Political Malfeasance in Postwar Italian Christian Democracy.” World Politics, vol. 52 (July): 588-622. Golden, Miriam A. and Lucio Picci. 2005. “Proposal for a New Measure of Corruption, Illustrated with Italian Data.” Economics & Politics, vol. 17 (March): 37-75. Golder, Matt. 2004. “Democratic Electoral Systems Around the World, 1946-2000.” Electoral Studies, vol. 23. Guiso, Luigi; Sapienza, Paola and Luigi Zingales. 2002. “Does Local Financial Development Matter?” NBER Working Paper 8923 (May). Katz, Richard S. 1985. “Preference Voting in Italy: Votes of Opinion, Belonging, or Exchange.” Comparative Political Studies, vol. 18, no. 2 (July): 229-49. Katz, Richard S. 1986. “Intraparty Preference Voting.” In Electoral Laws and Their Political Consequences, ed. Bernard Grofman and Arend Lijphart. New York: Agathon Press. Kaufmann, Daniel; Kraay, Aart and Pablo Zoido-Lobatón. 1999. “Governance Matters.” World Bank Policy Research Working Paper No. 2196. Kaufmann, Daniel; Kraay, Aart and Pablo Zoido-Lobatón. 2002. “Governance Matters II — Updated Indicators for 2000/01.” World Bank Policy Research Working Paper No. 2772. Kaufmann, Daniel; Kraay, Aart and Massimo Mastruzzi. 2003. “Governance Matters III: Governance Indicators for 1996–2002.” Unpublished paper, The World Bank. Knack, Stephen and Philip Keefer. 1995. “Institutions and Economic Performance: Cross-Country Tests Using Alternative Institutional Measures.” Economics and Politics, vol. 12 (Nov.): 207-27.

30
King, Gary; Tomz, Michael and Jason Wittenberg. 2000. “Making the Most of Statistical Analyses: Improving Interpretation and Presentation.” American Journal of Political Science, vol. 44 (April): 341-55. Kunicová,, Jana. 2005. “Political Corruption: Another Peril of Presidentialism?” Unpublished paper, California Institute of Technology. Kunicová, Jana and Susan Rose-Ackerman. 2005. “Electoral Rules and Constitutional Structures as Constraints on Corruption.” British Journal of Political Science, vol. 35, no. 4 (Oct.): 573-606. Lambsdorff, Johann. 1999. “Corruption in Empirical Research - A Review.” Unpublished manuscript. University of Goettingen. Lancaster, Thomas D. and Gabriella R. Montinola. 1997. “Toward a Methodology for the Comparative Study of Political Corruption.” Crime, Law and Social Change, vol. 27: 185-206. La Porta, Rafael; López-de-Silanes, Florencio; Pop-Eleches, Cristian and Andrei Shleifer. 2004. “Judicial Checks and Balances.” Journal of Political Economy, vol. 112, no. 2: 445-70. Lederman, Daniel; Loayza, Norman and Rodrigo Soares. 2005. “Accountability and Corruption: Political Institutions Matter.” Economics & Politics, vol. 17, no. 1 (March): 1-35. Lizzeri, Alessandro and Nicola Persico. 2001. “The Provision of Public Goods under Alternative Electoral Incentives.” American Economic Review, vol. 91, no. 1: 225-39. Manin, Bernard; Przeworski, Adam and Susan C. Stokes. 1999. “Elections and Representation.” In Democracy, Accountability, and Representation, ed. Adam Przeworski, Susan C. Stokes and Bernard Manin. New York: Cambridge University Press. Maravall, José María. 1999. “Accountability and Manipulation.” In Democracy, Accountability, and Representation, ed. Adam Przeworski, Susan C. Stokes and Bernard Manin. New York: Cambridge University Press. Mauro, Paolo. 1995. “Corruption and Growth.” Quarterly Journal of Economics, vol. 110, no. 3 (August): 681-712. Meier, Kenneth and Thomas Holbrook. 1992. “I Seen My Opportunities and I Took Em:’ Political Corruption in the United States.” Journal of Politics, vol. 54: 135-55. Milesi-Ferretti, Gian Maria; Perotti, Roberto and Massimo Rostagno. 2002. “Electoral Systems and Public Spending.” Quarterly Journal of Economics, vol. 117, no. 2 (May): 609-57.
31
Montinola, Gabriella R. and Robert W. Jackman. 2002. “Sources of Corruption: A Cross-National Study.” British Journal of Political Science, vol. 32: 147-70. Persson, Torsten and Guido Tabellini. 2003. The Economic Effects of Constitutions: What Do the Data Say? Cambridge: MIT Press. Persson, Torsten; Roland, Gerard and Guido Tabellini. 2003. “How Do Electoral Rules Shape Party Structures, Government Coalitions and Economic Policies?” NBER Working Paper No. 10176. Persson, Torsten; Tabellini, Guido and Francesco Trebbi. 2003. “Electoral Rules and Corruption,” Journal of the European Economic Association, vol. 1, no. 4 (June): 958-89. Putnam, Robert. 1993. Making Democracy Work: Civic Traditions in Modern Italy. Princeton: Princeton University Press. Ricolfi, Luca. 1993. L'ultimo Parlamento. Sulla fine della prima Repubblica. Rome: La Nuova Italia Scientifica. Rose-Ackerman, Susan. 1999. Government and Corruption: Causes, Consequences, and Reform. New York: Cambridge University Press. Samuels. David J. 1999. “Incentives to Cultivate a Party Vote in Candidate-Centric Electoral Systems: Evidence From Brazil.” Comparative Political Studies, vol. 32, no. 4: 487-518 Seligson, Mitchell. 2002. “The Impact of Corruption on Regime Legitimacy: A Comparative Study of Four Latin American Countries.” Journal of Politics, vol. 64, no. 2: 408-33. Schumpeter, Joseph A. 1942. Capitalism, Socialism, and Democracy. New York: Harper & Brothers. Shugart, Matthew and Martin Wattenberg. 2001. “Mixed-member Electoral Systems: A Definition and Typology.” In Matthew Shugart and Martin Wattenberg, eds., Mixed-member Electoral Systems: The Best of Both Worlds? New York: Oxford University Press. Shugart, Matthew Soberg; Valdini, Melody Ellis and Kati Suominen. 2005. “Looking for Locals: Voter Information Demands and Personal Vote-Earning Attributes of Legislators under Proportional Representation.” American Journal of Political Science, vol. 49, no. 2 (April): 437-49. Stratmann, Thomas and Martin Baur. 2002. “Plurality Rule, Proportional Representation, and the German Bundestag: How Incentives to Pork-Barrel Differ Across Electoral Systems.” American Journal of Political Science, vol. 46, no. 3 (July): 506-14.
32
Tomz, Michael; Jason Wittenberg and Gary King. 2003. CLARIFY: Software for Interpreting and Presenting Statistical Results. Version 2.1. Stanford University, University of Wisconsin, and Harvard University. January 5. Http://gking.harvard.edu/. Treisman, Daniel. 2000. “The Causes of Corruption: A Cross-National Study.” Journal of Public Economics, vol. 76 (June): 399-457.
33
DATA APPENDICES
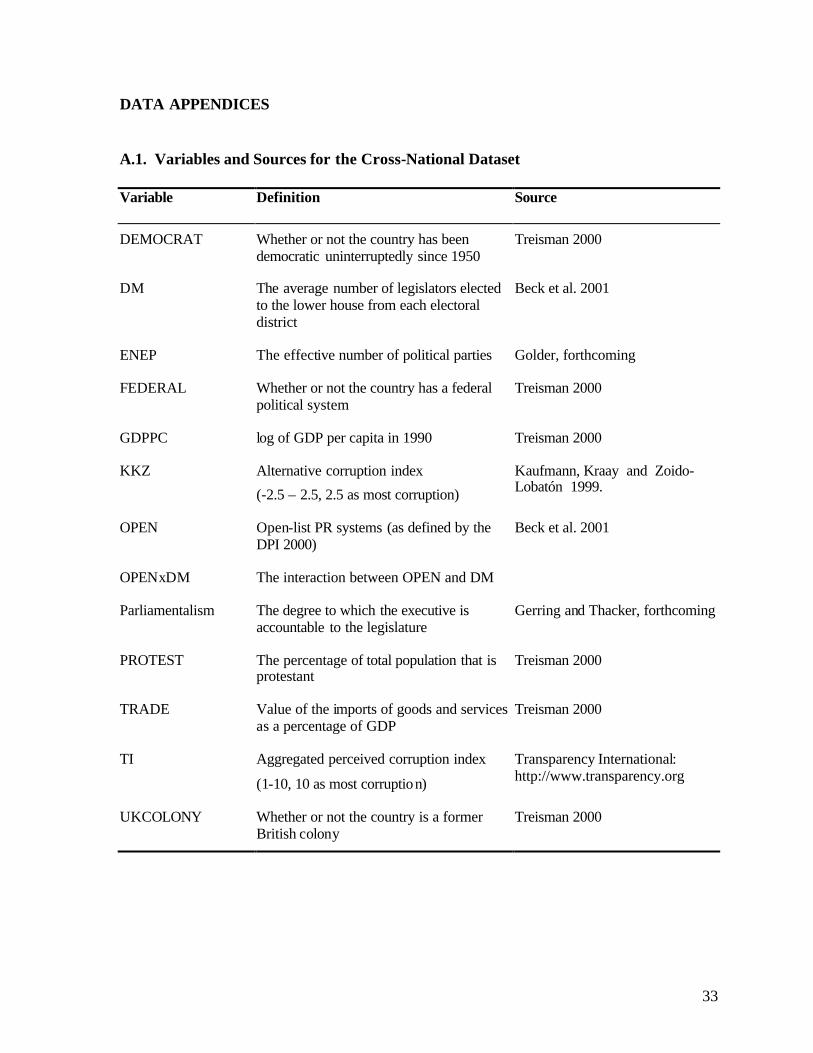
A.1. Variables and Sources for the Cross-National Dataset Variable Definition Source
DEMOCRAT Whether or not the country has been democratic uninterruptedly since 1950
Treisman 2000
DM The average number of legislators elected to the lower house from each electoral district
Beck et al. 2001
ENEP The effective number of political parties Golder, forthcoming
FEDERAL Whether or not the country has a federal political system
Treisman 2000
GDPPC log of GDP per capita in 1990 Treisman 2000
KKZ Alternative corruption index
(-2.5 – 2.5, 2.5 as most corruption)
Kaufmann, Kraay and Zoido-Lobatón 1999.
OPEN Open-list PR systems (as defined by the DPI 2000)
Beck et al. 2001
OPENxDM The interaction between OPEN and DM
Parliamentalism The degree to which the executive is accountable to the legislature
Gerring and Thacker, forthcoming
PROTEST The percentage of total population that is protestant
Treisman 2000
TRADE Value of the imports of goods and services as a percentage of GDP
Treisman 2000
TI Aggregated perceived corruption index
(1-10, 10 as most corruption)
Transparency International: http://www.transparency.org
UKCOLONY Whether or not the country is a former British colony
Treisman 2000

34
A.3. Coding for Democratic Countries using PR Included in the Cross-National Dataset Country CPI KKZ District.
Magnitude Effective Number
Of Parties Parlia -
mentalism Open-
list MMP
Argentina 6.92 0.27 10.7 3.46 1 0 0 Austria 2.43 -1.45 20.3 3.70 3 0 0 Belgium 4.17 -0.67 7.5 9.82 3 0 0 Bolivia 7.25 0.43 3.8 5.92 2 0 1 Brazil 6.49 -0.05 19.0 8.14 1 1 0 Bulgaria 7.10 0.55 7.7 3.02 2 0 0 Chile 3.45 -1.02 2.0 6.95 1 1* 0 Colombia 7.61 0.49 5.0 3.50 1 0 0 Costa Rica 3.97 -0.57 8.1 3.35 1 0 0 Czech Rep. 4.87 -0.38 25.0 5.02 3 1 0 Denmark 0.24 -2.12 10.5 4.74 3 1 0 Dominican Rep. 0.77 5.0 2.73 1 0 0 Ecuador 7.25 0.81 7.4 6.30 1 0 0 Estonia 4.30 -0.59 9.2 6.40 3 1 0 Finland 0.62 -2.08 14.2 5.85 2 1 0 Germany 1.86 -1.62 11.2 3.79 3 0 1 Iceland 0.70 -1.60 7.9 3.92 3 0 0 Ireland 1.69 -1.56 4.0 3.95 3 1 0 Israel 2.40 -1.27 120.0 7.79 3 0 0 Latvia 7.30 0.26 20.0 8.27 3 1 0 Luxemburg 1.34 -1.67 16.0 4.62 3 1 0 Malta -0.49 5.0 2.05 3 1 0 Namibia 4.70 72.0 1.67 1 0 0 Netherlands 1.08 -2.02 150.0 5.13 3 0 0 New Zealand 0.64 -2.07 25.8 4.12 3 0 1 Nicaragua 7.00 0.83 7.6 2.92 1 0 0 Norway 1.07 -1.68 10.0 5.07 3 0 0 Paraguay 8.50 0.95 4.4 1 0 0 Peru 5.50 0.20 118.0 5.02 1 0 0 Poland 4.91 -0.49 16.7 4.59 2 0 0 Portugal 3.33 -1.21 10.5 3.14 2 0 0 Romania 6.78 0.45 7.8 6.06 1 0 0 S. Africa 4.72 -0.29 44.4 2.16 3 0 0 Slovakia 6.10 -0.03 150.0 5.26 3 1 0 Spain 4.56 -1.21 6.9 3.27 3 0 0 Sri Lanka 0.12 11.5 2.31 2 1 0 Sweden 0.69 -2.08 13.9 4.54 3 0 0 Switzerland 1.24 -2.07 9.1 6.34 2 1 0 Taiwan 4.90 -0.62 11.5 3.14 2 1* 0 Turkey 6.61 0.34 7.0 6.45 3 0 0 Uruguay 5.78 -0.43 5.2 3.12 1 0 0
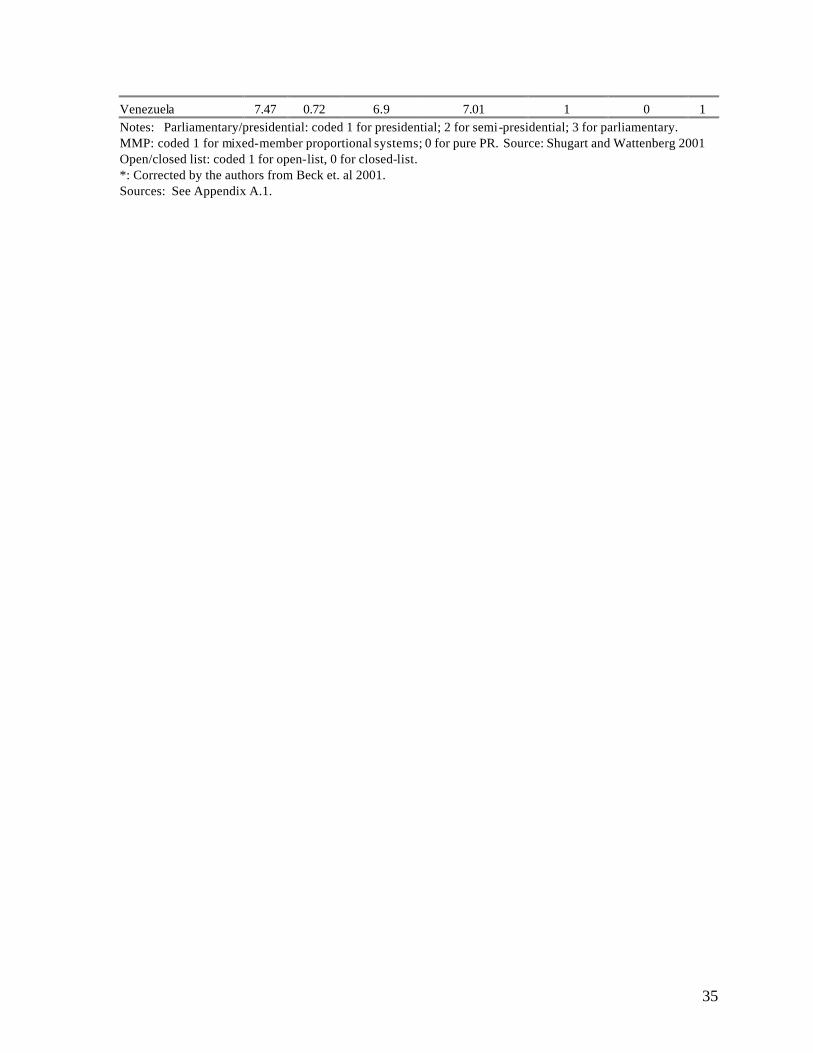
35
Venezuela 7.47 0.72 6.9 7.01 1 0 1 Notes: Parliamentary/presidential: coded 1 for presidential; 2 for semi-presidential; 3 for parliamentary. MMP: coded 1 for mixed-member proportional systems; 0 for pure PR. Source: Shugart and Wattenberg 2001 Open/closed list: coded 1 for open-list, 0 for closed-list. *: Corrected by the authors from Beck et. al 2001. Sources: See Appendix A.1.
36
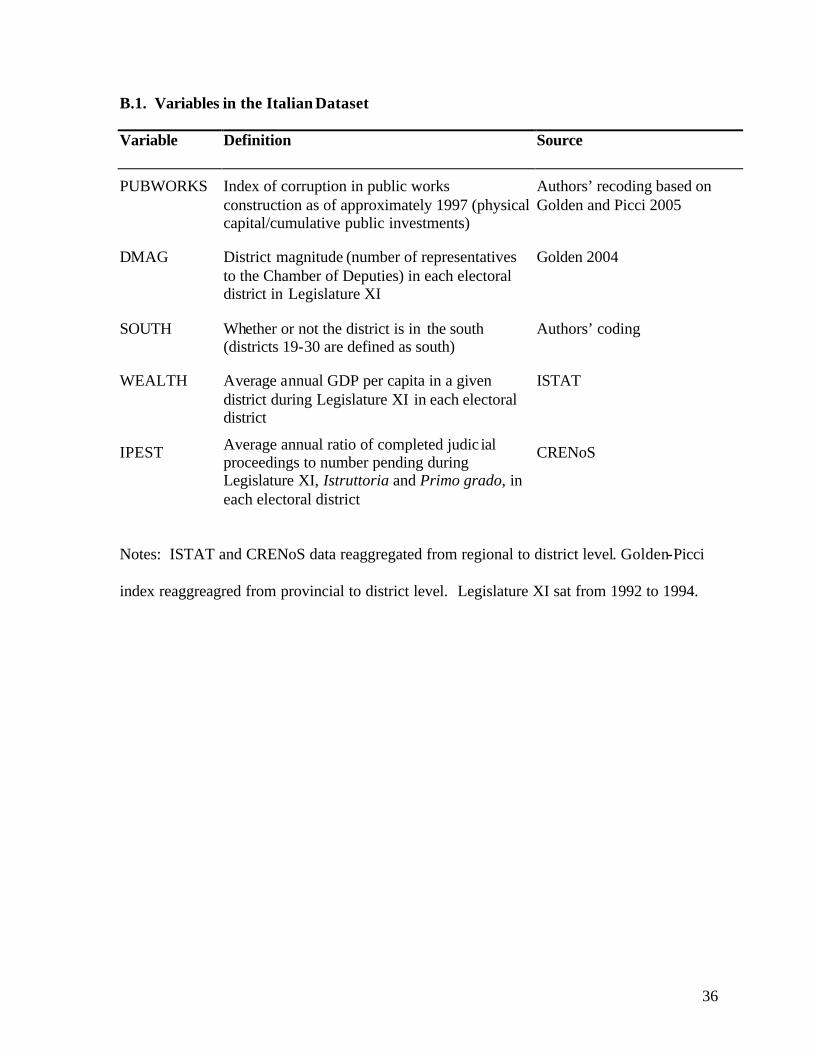
B.1. Variables in the Italian Dataset Variable Definition Source
PUBWORKS Index of corruption in public works construction as of approximately 1997 (physical capital/cumulative public investments)
Authors’ recoding based on Golden and Picci 2005
DMAG District magnitude (number of representatives to the Chamber of Deputies) in each electoral district in Legislature XI
Golden 2004
SOUTH Whether or not the district is in the south (districts 19-30 are defined as south)
Authors’ coding
WEALTH Average annual GDP per capita in a given district during Legislature XI in each electoral district
ISTAT
IPEST Average annual ratio of completed judic ial proceedings to number pending during Legislature XI, Istruttoria and Primo grado, in each electoral district
CRENoS
Notes: ISTAT and CRENoS data reaggregated from regional to district level. Golden-Picci
index reaggreagred from provincial to district level. Legislature XI sat from 1992 to 1994.
37
Table 1. Estimation Results of the Cross-National Determinants of Corruption
Model 1 Model 2 Model 3 Model 4 Model 5 Model 6 The Dependent Variable and the Sample Tested
CPI index (Full
Sample)
CPI index (Full
Sample)
CPI index (Full
Sample)
CPI index (Full
Sample)
CPI index (Full
Sample)
CPI index (without MMP)
-0.0067 -0.0199** -0.0143*** -0.0146*** -0.0087** -0.0110*** District magnitude [0.0108] [0.0088] [0.0049] [0.0046] [0.0032] [0.0024]
-1.1011 -2.1994** -1.6445* -1.9261** -1.5331*** -1.4750*** Open-list
Indicator [0.8896] [0.9591] [0.9045] [0.8615] [0.4476] [0.4135]
0.0441*** 0.0469*** 0.0476*** 0.0207*** 0.0212*** Interaction (DM*open-list) [0.0105] [0.0080] [0.0077] [0.0061] [0.0050]
-1.6043*** -1.5604*** -0.2702 Parliamentarism [0.3344] [0.3204] [0.2273]
0.2785* 0.1935** 0.1888** Effective Number
of Parties [0.1599] [0.0711] [0.0847]
-0.0105* -0.0162*** Protestant tradition [0.0060] [0.0032]
-2.1485*** -1.8562** Long-term democracy [0.6650] [0.5425]
0.8599 Federal system [0.5418]
-2.7552* -2.8518*** logged GDP per
capita [1.4921] [0.8828]
-0.0261 British colony [0.4388]
0.0080 Trade openness [0.0089]
4.8103*** 5.1602*** 8.2796*** 6.8513*** 15.4923*** 15.8935*** Constant [.5902] [0.5914] [0.6274] [1.0018] [4.8828] [2.8362]
N 39 39 39 38 32 30 R2 0.051 0.15 0.46 0.47 0.92 0.90 Notes: Model 1 – Model 5 are based on the full sample. Model 6 drops mixed-member systems, including MMP and Taiwan. Robust standard errors in brackets. *significant at 10 percent; ** significant at 5 percent; *** significant at 1 percent.
38
Table 2. Robustness Checks for the Cross-National Determinants of Corruption
Model 7 Model 8 Model 9 Model 10 The Dependent Variable and the Sample Tested
World Bank corruption index
(Full Sample)
World Bank corruption index (dropping MMP)
CPI index (dropping outliers)
CPI index (dropping outliers
and MMP)
-0.0043*** -0.0046*** -0.1068*** -0.1078* District magnitude [0.0009] [0.0009] [0.0289] [0.0527]
-0.5177*** -0.5861*** -2.9974*** -3.1501*** Open-list Indicator [0.1694] [0.1531] [0.8761] [0.8649]
0.0070*** 0.0082*** 0.1705** 0.1763** Interaction (DM*open-list) [0.0018] [0.0019] [0.0646] [0.0730]
0.0788* 0.0753* 0.1679* 0.1792* Effective number. of Parties [0.0423] [0.0391] [0.0906] [0.0894]
-0.0046*** -0.0042** -0.0206*** -0.0196*** Protestant tradition [0.0015] [0.0017] [0.0039] [0.0041]
-0.5434** -0.2734 -1.9611*** -1.5725** Long-term democracy [0.2626] [0.3096] [0.5573] [0.6414]
-1.6750*** -2.0536*** -1.9968** -2.6609** logged GDP per capita [0.4168] [0.4782] [0.8208] [0.9514]
5.9454*** 7.3184*** 13.7532*** 16.0709*** Constant [1.3752] [1.5850] [2.5537] [3.0658]
N 36 31 29 24 R2 0.87 0.89 0.92 0.91 Notes: Robust standard errors in brackets. * significant at 10 percent; ** significant at 5 percent; *** significant at 1 percent.
39
Table 3: Estimation Results of the Cross-District Determinants of Corruption in Public Works Construction, Italy, 1990s circa Model 11 Model 12 Model 13
Benchmark Model
Controls Augmented Controls
District Magnitude -0.0033 -0.0099* -0.0071 [0.0061] [0.0051] [0.0055] South -0.5628*** -.294015 [0.0983] [.267434] GDP per capita 54.6193*** 30.5345 [9.1654] [23.7616] Ratio of completed judicial proceedings
-3.2774 -2.7192
[2.3138] [2.4413] 1.2654*** 2.2284 2.453246 Constant
[0.1729] [1.5090] [1.566417]
N 31 31 31 R2 0.43 0.45 0.47 Notes: Robust standard errors in brackets. * significant at 10 percent ** significant at 5 percent; *** significant at 1 percent.
40
Figure 1: Estimated Effects of District Magnitude on Corruption under Alternative Electoral Regimes
02
46
8C
orr
up
tio
n
1 50 100 150District Magnitude
Open-list
Closed-list
95% C.I.
41
Figure 2: The Distribution of District Magnitudes in 42 Contemporary Democracies
Netherlands & Slovakia
IsraelPeru
Namibia
S. Africa
05
01
00
15
0D
istr
ict
mag
nitu
de
42
Figure 3: Estimated Effects of District Magnitude on Corruption under Alternative Electoral Regimes, without Outliers
-20
24
68
Co
rru
pti
on
1 5 10 15 20 25District Magnitude
Open-list
Closed-list
95% C.I.
43
Figure 4: Scatterplot of the Relationship between Public Works Corruption and District Magnitude in Italy, 1990s circa