Embed Size (px)
Citation preview
Trump vs. Hillary: What went Viral during the
2016 US Presidential Election
Kareem Darwish1, Walid Magdy2, and Tahar Zanouda1
1 Qatar Computing Research Institute, HBKU, Doha, Qatar
{kdarwish,tzanouda}@hbku.edu.qa,2 School of Informatics, The University of Edinburgh, Scotland
Abstract. In this paper, we present quantitative and qualitative analysis
of the top retweeted tweets (viral tweets) pertaining to the US presidential
elections from September 1, 2016 to Election Day on November 8, 2016.
For everyday, we tagged the top 50 most retweeted tweets as supporting or
attacking either candidate or as neutral/irrelevant. Then we analyzed the
tweets in each class for: general trends and statistics; the most frequently
used hashtags, terms, and locations; the most retweeted accounts and
tweets; and the most shared news and links. In all we analyzed the 3,450
most viral tweets that grabbed the most attention during the US election
and were retweeted in total 26.3 million times accounting over 40% of the
total tweet volume pertaining to the US election in the aforementioned
period. Our analysis of the tweets highlights some of the differences
between the social media strategies of both candidates, the penetration
of their messages, and the potential effect of attacks on both.
Keywords: US elections, quantitative analysis, qualitative analysis, com-
putational Social Science.
Introduction
Social media is an important platform for political discourse and political cam-
paigns [26,31]. Political candidates have been increasingly using social media
platforms to promote themselves and their policies and to attack their opponents
and their policies. Consequently, some political campaigns have their own social
media advisers and strategists, whose success can be pivotal to the success of the
campaign as a whole. The 2016 US presidential election is no exception, in which
the Republican candidate Donald Trump won over his main rival Hilary Clinton.
In this work, we showcase some of the Twitter trends pertaining to the US
presidential election by analyzing the most retweeted tweets in the sixty eight
days leading to the election and election day itself. In particular, we try to answer
the following research questions:
1) Which candidate was more popular in the viral tweets on Twitter? What
proportion of viral tweets in terms of number and volume were supporting or
attacking either candidate?
2) Which election related events, topics, and issues pertaining to each candi-
date elicited the most user reaction, and what were their effect on each candidate?
Which accounts were the most influential?
arX
iv:1
707.
0337
5v1
[cs
.SI]
11
Jul 2
017
2 Kareem Darwish et al.
3) How credible were the links and news that were shared in viral tweets?
To answer these questions, we analyze the most retweeted (viral) 50 tweets per
day starting from September 1, 2016 and ending on Election Day on November
8, 2016. The total number of unique tweets that we analyze is 3,450, whose
retweet volume of 26.3 million retweets accounts for over 40% of the total
tweets/retweets volume concerning the US election during that period. We have
manually tagged all the tweets in our collection as supporting or attacking either
candidate, or neutral (or irrelevant). For the different classes, we analyze retweet
volume trends, top hashtags, most frequently used words, most retweeted accounts
and tweets, and most shared news and links. Our analysis of the tweets shows
some clear differences between the social media strategies of each candidate and
subsequent user responses. For example, our observations show that the Trump
campaign seems to be more effective than the Clinton campaign in achieving
better penetration and reach for: the campaign’s slogans, attacks against his rival,
and promotion of campaign activities in different US states. We also noticed that
the prominent vulnerabilities for each candidate were Trump’s views towards
women and Clinton’s email leaks and scandal. In addition, our analysis shows
that the majority of tweets benefiting Clinton were actually more about attacking
Trump rather than supporting Clinton, while for Trump, tweets in his favor had
more balance between supporting him and attacking Clinton. By analyzing the
links in the viral tweets, the tweets attacking Clinton had the most number of
links (accounting for 58% of the volume of shared links), where approximately
half were to highly credible sites and the remaining were to sites of mixed
credibility. We hope that our observations and analysis would aid political and
social scientists in understanding some of the factors that may have led to the
eventual outcome of the election.
Background
Social media is a fertile ground for developing tools and algorithms that can
capture the opinions of the general population at a large scale [13]. Much work has
studied the potential possibility of predicting the outcome of political elections
from social data. Yet, there is no unified approach for tackling this problem.
While Bollen et al. [4] analyzed people’s emotions (not sentiment) towards the
US 2008 Presidential campaign, the authors used both US 2008 Presidential
campaign and election of Obama as a case study. Sentiment typically signifies
preconceived positions towards an issue, while emotions, such as happiness or
sadness, are temporary responses to external stimulus. Though the authors
mentioned the feasibility of using such data to predict election results, they
did not offer supporting results. Using the same approach, O’Connor et al. [23]
discussed the feasibility of using Twitter data to replace polls. Tumasjan et al. [27]
provided one of the earliest attempts for using this kind of data to estimate
election results. They have used twitter data to forecast the national German
federal election, and investigated whether online interactions on Twitter validly
mirrored offline political sentiment. The study was criticized for being contingent
on arbitrary experimental variables [9, 10, 14, 21]. Metaxas et al. [21] argued
Trump vs. Hillary 3
that the predictive power of Twitter is exaggerated and it cannot be accurate
unless we are able to identify unbiased representative sample of voters. However,
these early papers kicked off a new wave of research initiatives that focus on
studying the political discourse on Twitter, and how this social platform can be
used as a proxy for understanding people’s opinions [22]. On the other hand,
many studies have questioned the accuracy, and not just the feasibility, of using
social data to predict and forecast [9, 10]. Without combining the contextual
information, together with social interactions, the results might lead to biased
findings. One of the main problems of studying political social phenomena on
Twitter is that users tend to interact with like-minded people, forming so-called
“echo chambers” [1,6, 18]. Thus, the social structure of their interactions will
limit their ability to interact in a genuinely open political space. Though the
literature on the predictive power of twitter is undoubtedly relevant, the focus
of this work is on performing post-election analysis to better understand the
potential strengths and weaknesses of the social media strategies of political
campaigns and how they might have contributed to eventual electoral outcomes.
A step closer to our politically motivated work, we find some studies that
focused on studying the US presidential election. For the 2012 US presidential
election, Shi et al. [25] analyzed millions of tweets to predict the public opinion
towards the Republican presidential primaries. The authors trained a linear
regression model and showed good results compared to pre-electoral polls during
the early stages of the campaign. In addition, the Obama campaign data analytics
system3, a decision-making tool that harnesses different kind of data ranging from
social media to news, was developed to help the Obama team sense the pulse of
public opinion and strategically manage the campaign. With an attempt to study
the recent US presidential election, early studies have showed promising results.
For example, Wang et al. [29] studied the growth pattern of Donald Trump’s
followers at a very early stage. They characterized individuals who ceased to
support Hillary Clinton and Donald Trump, by focusing on three dimensions of
social demographics: social status, gender, and age. They also analyzed Twitter
profile images to reveal the demographics of both Donald Trump and Hillary
followers. Wang et al. [30] studied the frequency of ‘likes’ for every tweet that
Trump published. More recently, Bovet et al. [5] developed an analytical tool
to study the opinion of Twitter users, in regards to their structural and social
interactions, to infer their political affiliation. Authors showed that the resulting
Twitter trends follow the New York Times National Polling Average.
Concerning disseminating information, recent research has focused on how
candidates engaged in spreading fake news and in amplifying their message
via the use of social bots, which are programmatically controlled accounts that
produce content and automatically interact with other users [7, 15]. Bessi and
Ferrara [3] investigated how the presence of social media bots affected political
discussion around the 2016 U.S. presidential election. Authors suggest that the
presence of social media bots can negatively affect democratic political discussion
rather than improving it, which in turn can potentially alter public opinion and
3 edition.cnn.com/2012/11/07/tech/web/obama-campaign-tech-team/index.html
4 Kareem Darwish et al.
endanger the integrity of the presidential election. In the same context, Giglietto
et al. [11] studied the role played by “fake-news” circulating on social media
during the 2016 US Presidential election. In this study, we provide a quantitative
and qualitative analysis of tweets related to the 2016 US presidential election. By
tapping into the wealth of Twitter data, we focus on analyzing and understanding
the possible factors underlying the success and failure of candidates. Our work
builds upon the aforementioned research in social and computer sciences to study
and measure the volume and diversity of support for the two main candidates
for the 2016 US presidential elections, Donald Trump and Hillary Clinton.
Data Collection and Labeling
To acquire the tweets that are relevant to the US presidential election, we obtained
the tweets that were collected by TweetElect.com from September 1, 2016 to
November 8, 2016 (Election Day). TweetElect is a public website that aggregates
tweets that are relevant to the 2016 US presidential election. It shows the most
retweeted content on Twitter including text tweets, images, videos, and links.
The site uses state-of-the-art adaptive filtering methods for detecting relevant
tweets on broad and dynamic topics, such as politics and elections [19, 20].
TweetElect used an initial set of 38 keywords related to the US elections for
streaming relevant tweets. Consequently, adaptive filtering continuously enriches
the set of keywords with additional terms that emerge over time [20]. The 38
seeding keywords included all candidate names and common keywords (including
hashtags) about the elections and participating parties. During the period of
interest, the total number of aggregated tweets per day (including retweets)
related to the US elections typically ranged between 200K and 600K. This
number increased dramatically after specific events or revelations, such as after
the presidential debates and Election Day, when the number of tweets exceeded
3.5 million tweets. The total number of unique tweets collected by TweetElect
between September 1 and November 8 was 6.8 million, while the full volume of
tweets including retweets was 65.8 million.
In this work, we are interested in analyzing the most “viral” tweets pertain to
the US presidential elections, as they typically express the topics that garnered
the most attention on Twitter [17]. Specifically, we constructed a set of the
most retweeted 50 tweets for everyday in the period of interest. Thus, our
collection contained 3,450 unique tweets that were retweeted 26.6 million times,
representing more than 40% of the total volume of tweets during that period. Out
of the 3,450 tweets in our collection, 700 were authored by the official account
of Donald Trump, accounting for 8.7 million retweets, and 698 were authored by
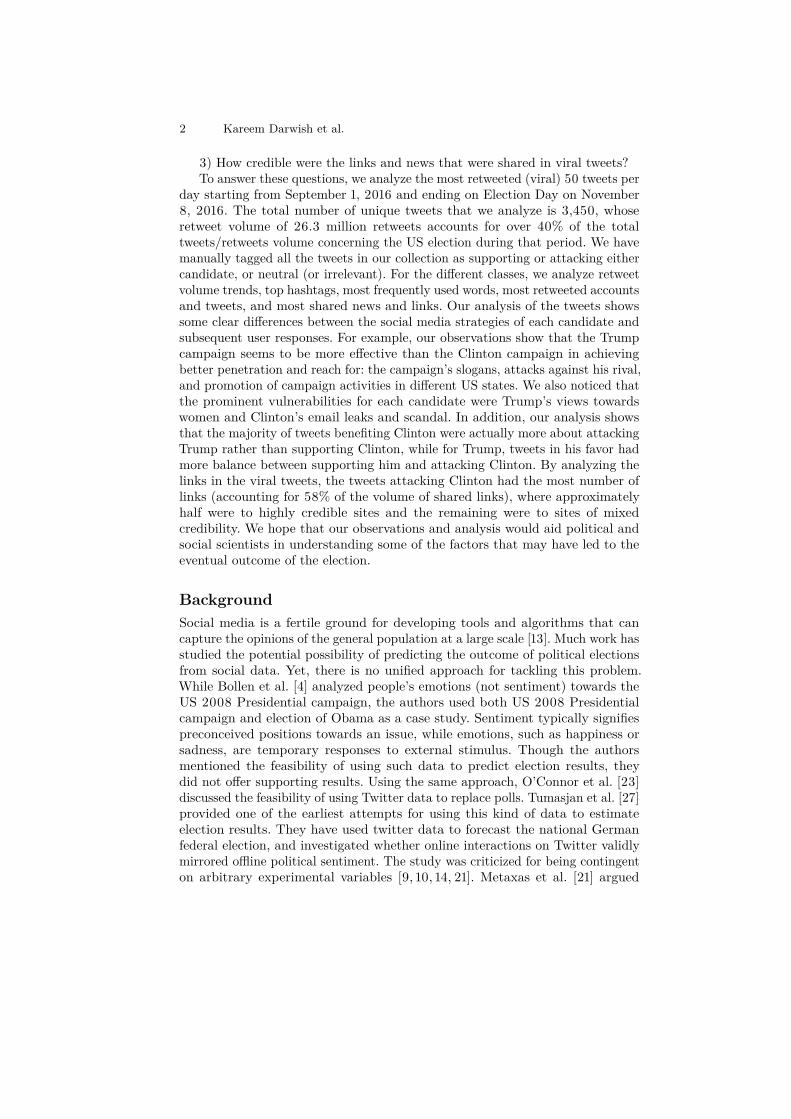
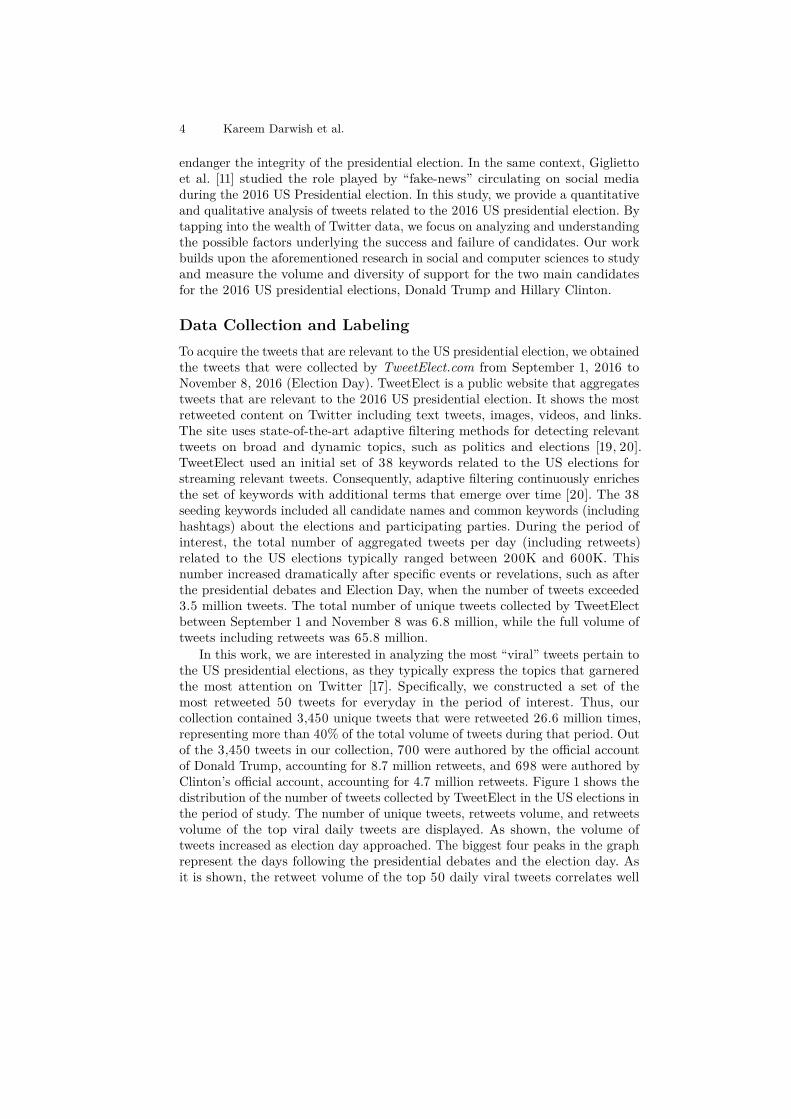
Clinton’s official account, accounting for 4.7 million retweets. Figure 1 shows the
distribution of the number of tweets collected by TweetElect in the US elections in
the period of study. The number of unique tweets, retweets volume, and retweets
volume of the top viral daily tweets are displayed. As shown, the volume of
tweets increased as election day approached. The biggest four peaks in the graph
represent the days following the presidential debates and the election day. As
it is shown, the retweet volume of the top 50 daily viral tweets correlates well
Trump vs. Hillary 5
0
1,000,000
2,000,000
3,000,000
01/09
03/09
05/09
07/09
09/09
11/09
13/09
15/09
17/09
19/09
21/09
23/09
25/09
27/09
29/09
01/10
03/10
05/10
07/10
09/10
11/10
13/10
15/10
17/10
19/10
21/10
23/10
25/10
27/10
29/10
31/10
02/11
04/11
06/11
08/11
Volume of tweets/retweets of collected data and Top 50 daily viral tweets
# tweets# retweets# retweets (top 50)
Fig. 1. Volume of retweets the top 50 daily viral tweets on the US collection compared
to the full volume of tweets and retweets.
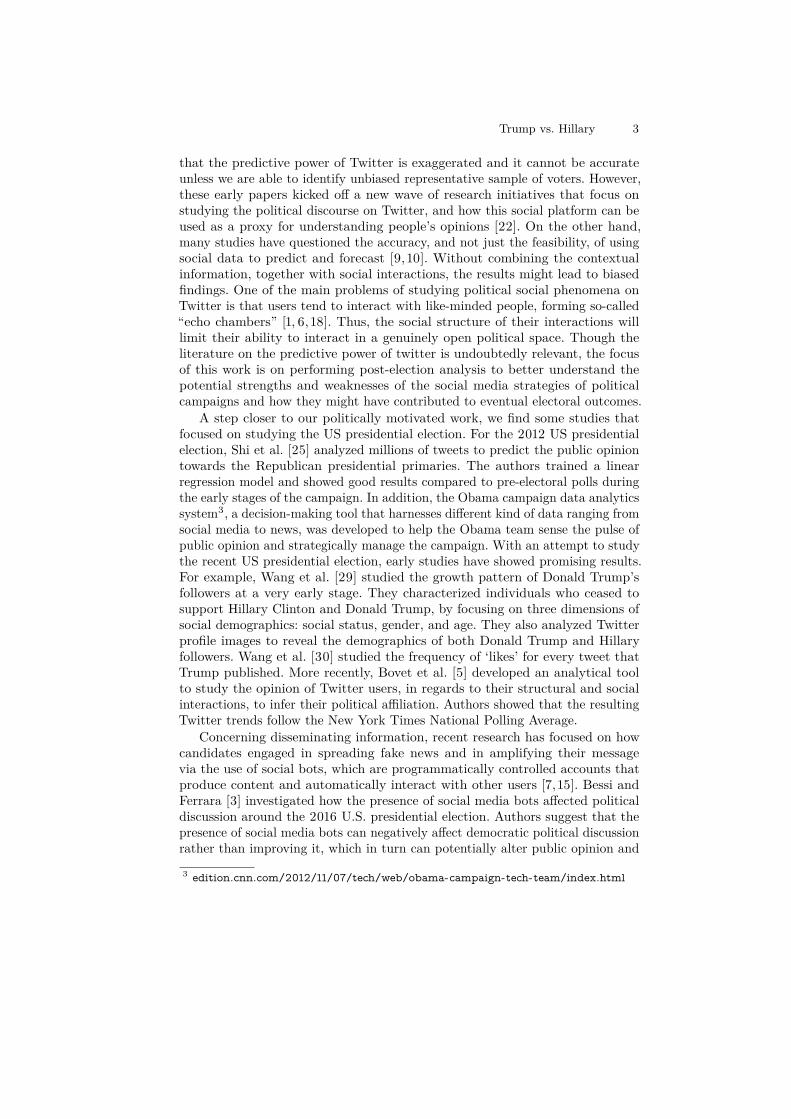
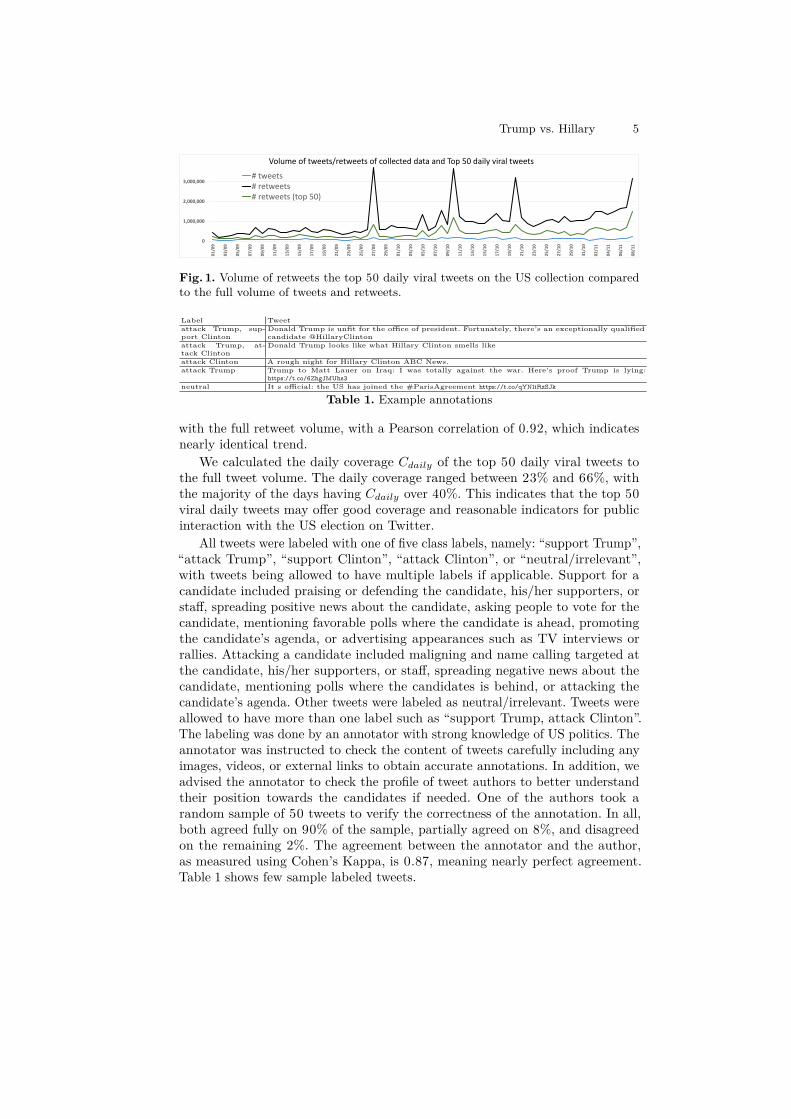
Label Tweet
attack Trump, sup-
port Clinton
Donald Trump is unfit for the office of president. Fortunately, there’s an exceptionally qualified
candidate @HillaryClinton
attack Trump, at-
tack Clinton
Donald Trump looks like what Hillary Clinton smells like
attack Clinton A rough night for Hillary Clinton ABC News.
attack Trump Trump to Matt Lauer on Iraq: I was totally against the war. Here’s proof Trump is lying:
https://t.co/6ZhgJMUhs3
neutral It s official: the US has joined the #ParisAgreement https://t.co/qYN1iRzSJk
Table 1. Example annotations
with the full retweet volume, with a Pearson correlation of 0.92, which indicates
nearly identical trend.
We calculated the daily coverage 𝐶𝑑𝑎𝑖𝑙𝑦 of the top 50 daily viral tweets to
the full tweet volume. The daily coverage ranged between 23% and 66%, with
the majority of the days having 𝐶𝑑𝑎𝑖𝑙𝑦 over 40%. This indicates that the top 50
viral daily tweets may offer good coverage and reasonable indicators for public
interaction with the US election on Twitter.
All tweets were labeled with one of five class labels, namely: “support Trump”,
“attack Trump”, “support Clinton”, “attack Clinton”, or “neutral/irrelevant”,
with tweets being allowed to have multiple labels if applicable. Support for a
candidate included praising or defending the candidate, his/her supporters, or
staff, spreading positive news about the candidate, asking people to vote for the
candidate, mentioning favorable polls where the candidate is ahead, promoting
the candidate’s agenda, or advertising appearances such as TV interviews or
rallies. Attacking a candidate included maligning and name calling targeted at
the candidate, his/her supporters, or staff, spreading negative news about the
candidate, mentioning polls where the candidates is behind, or attacking the
candidate’s agenda. Other tweets were labeled as neutral/irrelevant. Tweets were
allowed to have more than one label such as “support Trump, attack Clinton”.
The labeling was done by an annotator with strong knowledge of US politics. The
annotator was instructed to check the content of tweets carefully including any
images, videos, or external links to obtain accurate annotations. In addition, we
advised the annotator to check the profile of tweet authors to better understand
their position towards the candidates if needed. One of the authors took a
random sample of 50 tweets to verify the correctness of the annotation. In all,
both agreed fully on 90% of the sample, partially agreed on 8%, and disagreed
on the remaining 2%. The agreement between the annotator and the author,
as measured using Cohen’s Kappa, is 0.87, meaning nearly perfect agreement.
Table 1 shows few sample labeled tweets.
6 Kareem Darwish et al.
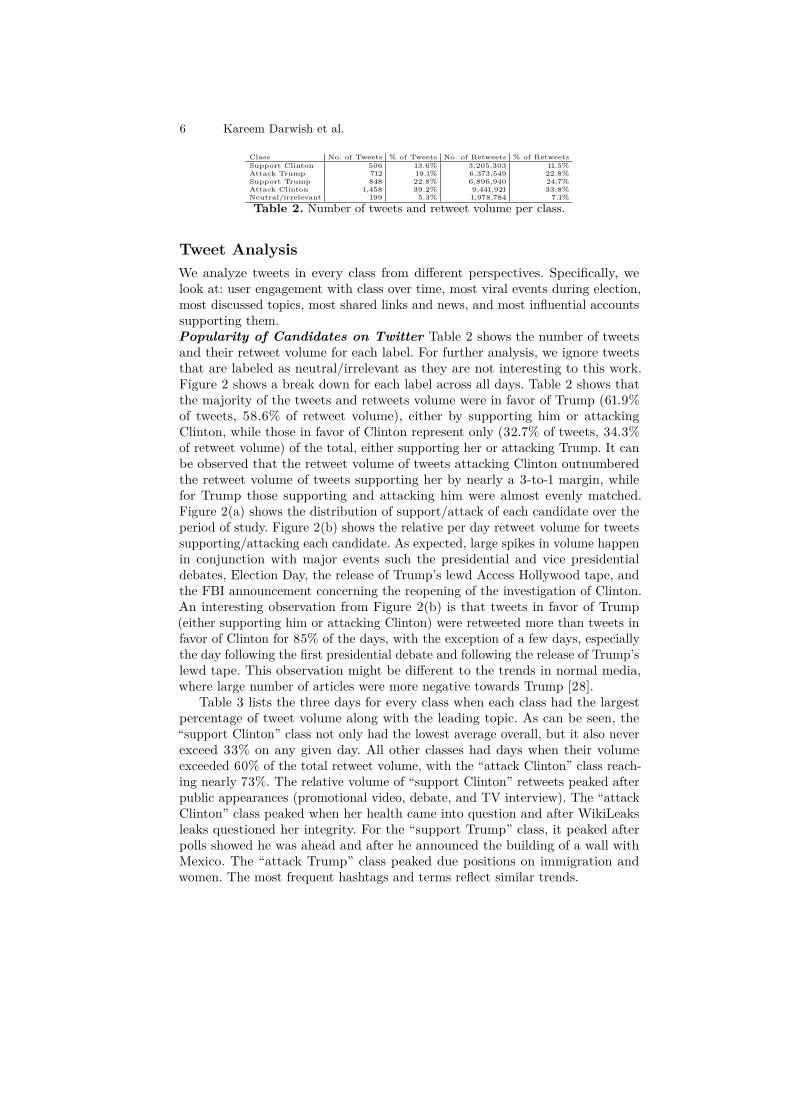
Class No. of Tweets % of Tweets No. of Retweets % of Retweets
Support Clinton 506 13.6% 3,205,303 11.5%
Attack Trump 712 19.1% 6,373,549 22.8%
Support Trump 848 22.8% 6,896,940 24.7%
Attack Clinton 1,458 39.2% 9,441,921 33.8%
Neutral/irrelevant 199 5.3% 1,978,784 7.1%
Table 2. Number of tweets and retweet volume per class.
Tweet Analysis
We analyze tweets in every class from different perspectives. Specifically, we
look at: user engagement with class over time, most viral events during election,
most discussed topics, most shared links and news, and most influential accounts
supporting them.
Popularity of Candidates on Twitter Table 2 shows the number of tweets
and their retweet volume for each label. For further analysis, we ignore tweets
that are labeled as neutral/irrelevant as they are not interesting to this work.
Figure 2 shows a break down for each label across all days. Table 2 shows that
the majority of the tweets and retweets volume were in favor of Trump (61.9%
of tweets, 58.6% of retweet volume), either by supporting him or attacking
Clinton, while those in favor of Clinton represent only (32.7% of tweets, 34.3%
of retweet volume) of the total, either supporting her or attacking Trump. It can
be observed that the retweet volume of tweets attacking Clinton outnumbered
the retweet volume of tweets supporting her by nearly a 3-to-1 margin, while
for Trump those supporting and attacking him were almost evenly matched.
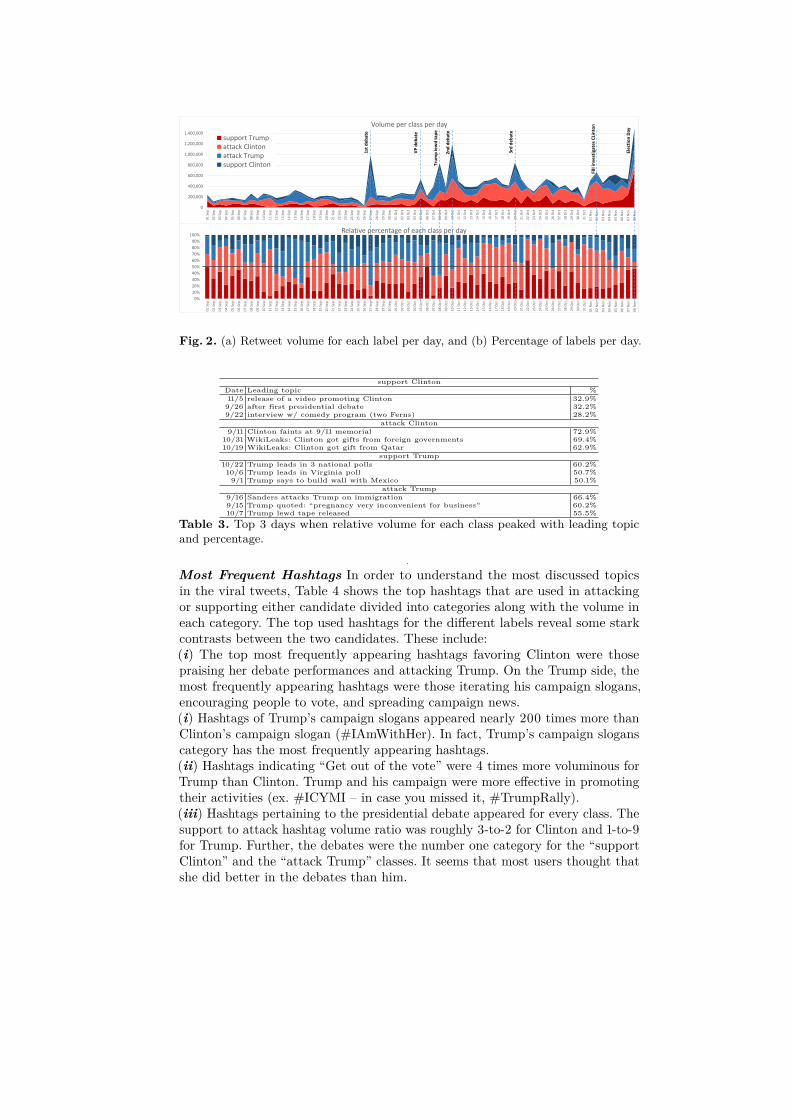
Figure 2(a) shows the distribution of support/attack of each candidate over the
period of study. Figure 2(b) shows the relative per day retweet volume for tweets
supporting/attacking each candidate. As expected, large spikes in volume happen
in conjunction with major events such the presidential and vice presidential
debates, Election Day, the release of Trump’s lewd Access Hollywood tape, and
the FBI announcement concerning the reopening of the investigation of Clinton.
An interesting observation from Figure 2(b) is that tweets in favor of Trump
(either supporting him or attacking Clinton) were retweeted more than tweets in
favor of Clinton for 85% of the days, with the exception of a few days, especially
the day following the first presidential debate and following the release of Trump’s
lewd tape. This observation might be different to the trends in normal media,
where large number of articles were more negative towards Trump [28].
Table 3 lists the three days for every class when each class had the largest
percentage of tweet volume along with the leading topic. As can be seen, the
“support Clinton” class not only had the lowest average overall, but it also never
exceed 33% on any given day. All other classes had days when their volume
exceeded 60% of the total retweet volume, with the “attack Clinton” class reach-
ing nearly 73%. The relative volume of “support Clinton” retweets peaked after
public appearances (promotional video, debate, and TV interview). The “attack
Clinton” class peaked when her health came into question and after WikiLeaks
leaks questioned her integrity. For the “support Trump” class, it peaked after
polls showed he was ahead and after he announced the building of a wall with
Mexico. The “attack Trump” class peaked due positions on immigration and
women. The most frequent hashtags and terms reflect similar trends.
Trump vs. Hillary 7
0%
10%
20%
30%
40%
50%
60%
70%
80%
90%
100%
01
Se
p
02
Se
p
03
Se
p
04
Se
p
05
Se
p
06
Se
p
07
Se
p
08
Se
p
09
Se
p
10
Se
p
11
Se
p
12
Se
p
13
Se
p
14
Se
p
15
Se
p
16
Se
p
17
Se
p
18
Se
p
19
Se
p
20
Se
p
21
Se
p
22
Se
p
23
Se
p
24
Se
p
25
Se
p
26
Se
p
27
Se
p
28
Se
p
29
Se
p
30
Se
p
01
Oct
02
Oct
03
Oct
04
Oct
05
Oct
06
Oct
07
Oct
08
Oct
09
Oct
10
Oct
11
Oct
12
Oct
13
Oct
14
Oct
15
Oct
16
Oct
17
Oct
18
Oct
19
Oct
20
Oct
21
Oct
22
Oct
23
Oct
24
Oct
25
Oct
26
Oct
27
Oct
28
Oct
29
Oct
30
Oct
31
Oct
01
No
v
02
No
v
03
No
v
04
No
v
05
No
v
06
No
v
07
No
v
08
No
v
Relative percentage of each class per day
0
200,000
400,000
600,000
800,000
1,000,000
1,200,000
1,400,000
01
Se
p
02
Se
p
03
Se
p
04
Se
p
05
Se
p
06
Se
p
07
Se
p
08
Se
p
09
Se
p
10
Se
p
11
Se
p
12
Se
p
13
Se
p
14
Se
p
15
Se
p
16
Se
p
17
Se
p
18
Se
p
19
Se
p
20
Se
p
21
Se
p
22
Se
p
23
Se
p
24
Se
p
25
Se
p
26
Se
p
27
Se
p
28
Se
p
29
Se
p
30
Se
p
01
Oct
02
Oct
03
Oct
04
Oct
05
Oct
06
Oct
07
Oct
08
Oct
09
Oct
10
Oct
11
Oct
12
Oct
13
Oct
14
Oct
15
Oct
16
Oct
17
Oct
18
Oct
19
Oct
20
Oct
21
Oct
22
Oct
23
Oct
24
Oct
25
Oct
26
Oct
27
Oct
28
Oct
29
Oct
30
Oct
31
Oct
01
No
v
02
No
v
03
No
v
04
No
v
05
No
v
06
No
v
07
No
v
08
No
v
Volume per class per day
support Trumpattack Clintonattack Trumpsupport Clinton
1st
deb
ate
VP
deb
ate
Tru
mp
lew
dta
pe
2n
d d
ebat
e
3rd
deb
ate
FBI i
nve
stig
ate
sC
Lin
ton
Elec
tio
n D
ay
Fig. 2. (a) Retweet volume for each label per day, and (b) Percentage of labels per day.
support Clinton
Date Leading topic %
11/5 release of a video promoting Clinton 32.9%
9/26 after first presidential debate 32.2%
9/22 interview w/ comedy program (two Ferns) 28.2%
attack Clinton
9/11 Clinton faints at 9/11 memorial 72.9%
10/31 WikiLeaks: Clinton got gifts from foreign governments 69.4%
10/19 WikiLeaks: Clinton got gift from Qatar 62.9%
support Trump
10/22 Trump leads in 3 national polls 60.2%
10/6 Trump leads in Virginia poll 50.7%
9/1 Trump says to build wall with Mexico 50.1%
attack Trump
9/16 Sanders attacks Trump on immigration 66.4%
9/15 Trump quoted: “pregnancy very inconvenient for business” 60.2%
10/7 Trump lewd tape released 55.5%
Table 3. Top 3 days when relative volume for each class peaked with leading topic
and percentage.
.
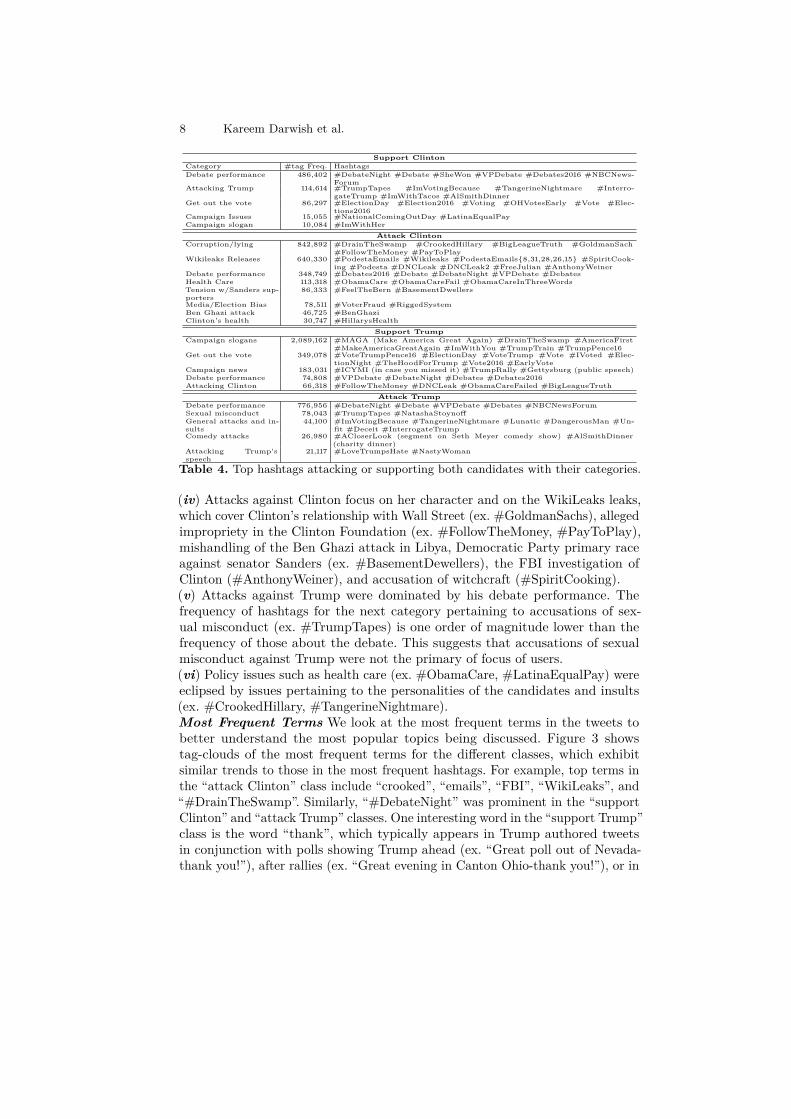
Most Frequent Hashtags In order to understand the most discussed topics
in the viral tweets, Table 4 shows the top hashtags that are used in attacking
or supporting either candidate divided into categories along with the volume in
each category. The top used hashtags for the different labels reveal some stark
contrasts between the two candidates. These include:
(i) The top most frequently appearing hashtags favoring Clinton were those
praising her debate performances and attacking Trump. On the Trump side, the
most frequently appearing hashtags were those iterating his campaign slogans,
encouraging people to vote, and spreading campaign news.
(i) Hashtags of Trump’s campaign slogans appeared nearly 200 times more than
Clinton’s campaign slogan (#IAmWithHer). In fact, Trump’s campaign slogans
category has the most frequently appearing hashtags.
(ii) Hashtags indicating “Get out of the vote” were 4 times more voluminous for
Trump than Clinton. Trump and his campaign were more effective in promoting
their activities (ex. #ICYMI – in case you missed it, #TrumpRally).
(iii) Hashtags pertaining to the presidential debate appeared for every class. The
support to attack hashtag volume ratio was roughly 3-to-2 for Clinton and 1-to-9
for Trump. Further, the debates were the number one category for the “support
Clinton” and the “attack Trump” classes. It seems that most users thought that
she did better in the debates than him.
8 Kareem Darwish et al.
Support ClintonCategory #tag Freq. Hashtags
Debate performance 486,402 #DebateNight #Debate #SheWon #VPDebate #Debates2016 #NBCNews-
ForumAttacking Trump 114,614 #TrumpTapes #ImVotingBecause #TangerineNightmare #Interro-
gateTrump #ImWithTacos #AlSmithDinnerGet out the vote 86,297 #ElectionDay #Election2016 #Voting #OHVotesEarly #Vote #Elec-
tions2016Campaign Issues 15,055 #NationalComingOutDay #LatinaEqualPay
Campaign slogan 10,084 #ImWithHer
Attack ClintonCorruption/lying 842,892 #DrainTheSwamp #CrookedHillary #BigLeagueTruth #GoldmanSach
#FollowTheMoney #PayToPlayWikileaks Releases 640,330 #PodestaEmails #Wikileaks #PodestaEmails{8,31,28,26,15} #SpiritCook-
ing #Podesta #DNCLeak #DNCLeak2 #FreeJulian #AnthonyWeinerDebate performance 348,749 #Debates2016 #Debate #DebateNight #VPDebate #Debates
Health Care 113,318 #ObamaCare #ObamaCareFail #ObamaCareInThreeWords
Tension w/Sanders sup-
porters
86,333 #FeelTheBern #BasementDwellers
Media/Election Bias 78,511 #VoterFraud #RiggedSystem
Ben Ghazi attack 46,725 #BenGhazi
Clinton’s health 30,747 #HillarysHealth
Support TrumpCampaign slogans 2,089,162 #MAGA (Make America Great Again) #DrainTheSwamp #AmericaFirst
#MakeAmericaGreatAgain #ImWithYou #TrumpTrain #TrumpPence16Get out the vote 349,078 #VoteTrumpPence16 #ElectionDay #VoteTrump #Vote #IVoted #Elec-
tionNight #TheHoodForTrump #Vote2016 #EarlyVoteCampaign news 183,031 #ICYMI (in case you missed it) #TrumpRally #Gettysburg (public speech)
Debate performance 74,808 #VPDebate #DebateNight #Debates #Debates2016
Attacking Clinton 66,318 #FollowTheMoney #DNCLeak #ObamaCareFailed #BigLeagueTruth
Attack TrumpDebate performance 776,956 #DebateNight #Debate #VPDebate #Debates #NBCNewsForum
Sexual misconduct 78,043 #TrumpTapes #NatashaStoynoff
General attacks and in-
sults
44,100 #ImVotingBecause #TangerineNightmare #Lunatic #DangerousMan #Un-
fit #Deceit #InterrogateTrumpComedy attacks 26,980 #ACloserLook (segment on Seth Meyer comedy show) #AlSmithDinner
(charity dinner)Attacking Trump’s
speech
21,117 #LoveTrumpsHate #NastyWoman
Table 4. Top hashtags attacking or supporting both candidates with their categories.
(iv) Attacks against Clinton focus on her character and on the WikiLeaks leaks,
which cover Clinton’s relationship with Wall Street (ex. #GoldmanSachs), alleged
impropriety in the Clinton Foundation (ex. #FollowTheMoney, #PayToPlay),
mishandling of the Ben Ghazi attack in Libya, Democratic Party primary race
against senator Sanders (ex. #BasementDewellers), the FBI investigation of
Clinton (#AnthonyWeiner), and accusation of witchcraft (#SpiritCooking).
(v) Attacks against Trump were dominated by his debate performance. The
frequency of hashtags for the next category pertaining to accusations of sex-
ual misconduct (ex. #TrumpTapes) is one order of magnitude lower than the
frequency of those about the debate. This suggests that accusations of sexual
misconduct against Trump were not the primary of focus of users.
(vi) Policy issues such as health care (ex. #ObamaCare, #LatinaEqualPay) were
eclipsed by issues pertaining to the personalities of the candidates and insults
(ex. #CrookedHillary, #TangerineNightmare).
Most Frequent Terms We look at the most frequent terms in the tweets to
better understand the most popular topics being discussed. Figure 3 shows
tag-clouds of the most frequent terms for the different classes, which exhibit
similar trends to those in the most frequent hashtags. For example, top terms in
the “attack Clinton” class include “crooked”, “emails”, “FBI”, “WikiLeaks”, and
“#DrainTheSwamp”. Similarly, “#DebateNight” was prominent in the “support
Clinton” and “attack Trump” classes. One interesting word in the “support Trump”
class is the word “thank”, which typically appears in Trump authored tweets
in conjunction with polls showing Trump ahead (ex. “Great poll out of Nevada-
thank you!”), after rallies (ex. “Great evening in Canton Ohio-thank you!”), or in
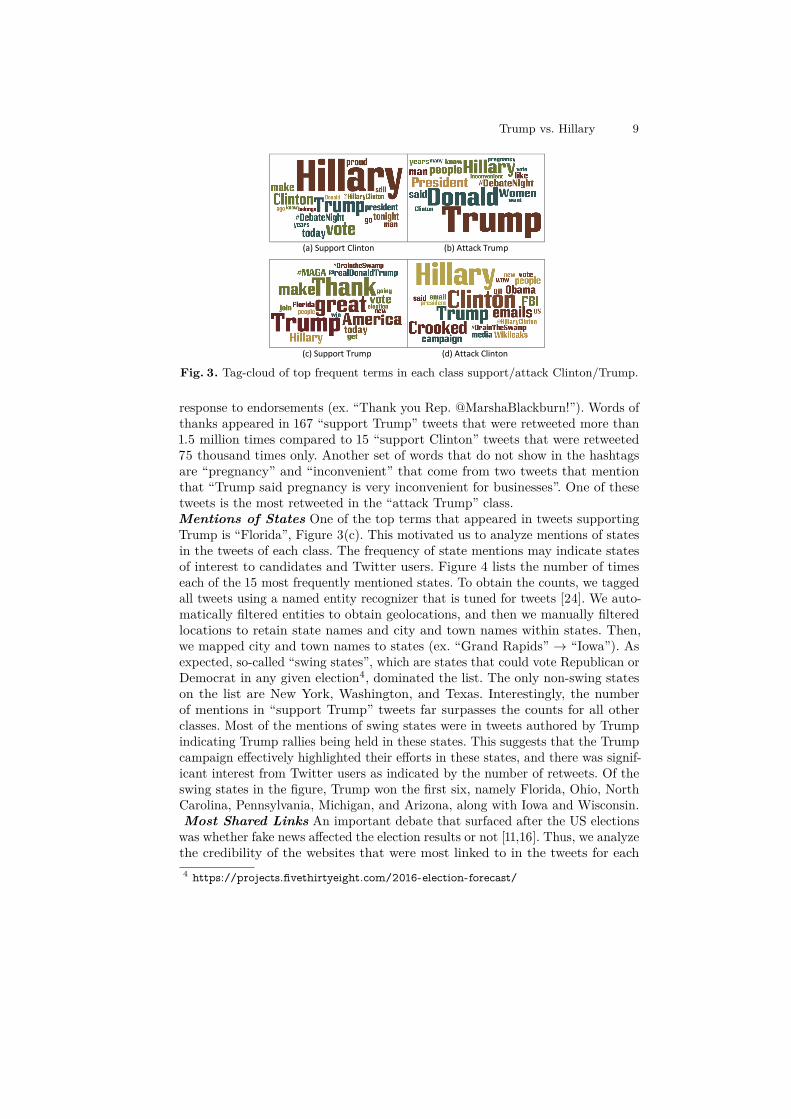
Trump vs. Hillary 9
(a) Support Clinton (b) Attack Trump
(c) Support Trump (d) Attack Clinton
Fig. 3. Tag-cloud of top frequent terms in each class support/attack Clinton/Trump.
response to endorsements (ex. “Thank you Rep. @MarshaBlackburn!”). Words of
thanks appeared in 167 “support Trump” tweets that were retweeted more than
1.5 million times compared to 15 “support Clinton” tweets that were retweeted
75 thousand times only. Another set of words that do not show in the hashtags
are “pregnancy” and “inconvenient” that come from two tweets that mention
that “Trump said pregnancy is very inconvenient for businesses”. One of these
tweets is the most retweeted in the “attack Trump” class.
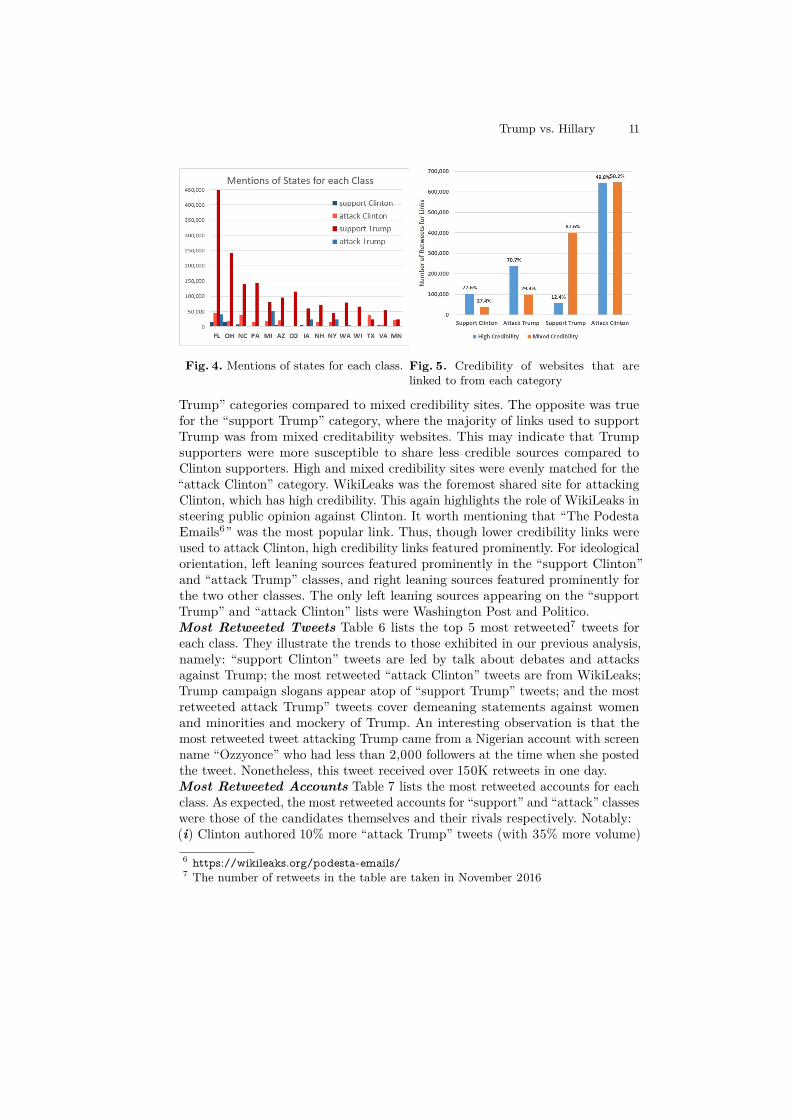
Mentions of States One of the top terms that appeared in tweets supporting
Trump is “Florida”, Figure 3(c). This motivated us to analyze mentions of states
in the tweets of each class. The frequency of state mentions may indicate states
of interest to candidates and Twitter users. Figure 4 lists the number of times
each of the 15 most frequently mentioned states. To obtain the counts, we tagged
all tweets using a named entity recognizer that is tuned for tweets [24]. We auto-
matically filtered entities to obtain geolocations, and then we manually filtered
locations to retain state names and city and town names within states. Then,
we mapped city and town names to states (ex. “Grand Rapids” → “Iowa”). As
expected, so-called “swing states”, which are states that could vote Republican or
Democrat in any given election4, dominated the list. The only non-swing states
on the list are New York, Washington, and Texas. Interestingly, the number
of mentions in “support Trump” tweets far surpasses the counts for all other
classes. Most of the mentions of swing states were in tweets authored by Trump
indicating Trump rallies being held in these states. This suggests that the Trump
campaign effectively highlighted their efforts in these states, and there was signif-
icant interest from Twitter users as indicated by the number of retweets. Of the
swing states in the figure, Trump won the first six, namely Florida, Ohio, North
Carolina, Pennsylvania, Michigan, and Arizona, along with Iowa and Wisconsin.
Most Shared Links An important debate that surfaced after the US elections
was whether fake news affected the election results or not [11,16]. Thus, we analyze
the credibility of the websites that were most linked to in the tweets for each
4 https://projects.fivethirtyeight.com/2016-election-forecast/
10 Kareem Darwish et al.
Support Clinton Attack Trump
Link Count Volume Leaning Credibility Link Count Volume Leaning Credibility
Hillaryclinton.com 63 363,153 Left – Hillaryclinton.com 65 236,126 Left –
Democrats.org 8 120,026 Left – WashingtonPost.com 23 102,179 -2 High
IWillVote.com 26 101,996 Left – IWillVote.com 11 95,126 Left –
SnappyTV.com 14 58,926 N/A Mixed SnappyTV.com 14 86,100 N/A Mixed
CNN.com 6 43,355 -3 High Democrats.org 3 67,843 Left –
WashingtonPost.com 10 27,264 -2 High Newsweek.com 11 55,663 -3 High
Medium.com 8 27,187 -2 Mixed NYTimes.com 9 37,993 -2 High
BusinessInsider.com 4 16,010 -2 High CNN.com 6 27,275 -3 High
NYTimes.com 6 15,886 -2 High Vox.com 4 13,992 -4 High
YouTube.com 2 11,564 N/A Mixed Facebook.com 2 11,973 N/A Mixed
Support Trump Attack Clinton
DonaldJTrump.com 77 503,375 right WikiLeaks.org 47 406,607 2 High
Facebook.com 25 164,995 N/A Mixed DailyCaller.com 22 195,695 4 Mixed
WashingtonPost.com 7 56,855 -2 Hight FoxNews.com 28 146,571 4 Mixed
Lifezette.com 3 49,132 4 Mixed YouTube.com 29 107,915 N/A Mixed
SnappyTV.com 4 36,663 N/A Mixed Breitbart.com 17 102,949 5 Mixed
Instagram.com 5 36,132 N/A Mixed Politico.com 11 93,165 -2 High
DailyCaller.com 3 35,474 4 Mixed NYPost.com 14 92,147 3 Mixed
NYPost.com 4 34,930 3 Mixed CNN.com 11 78,797 Right
Periscope.tv 3 22,596 N/A Mixed Vox.com 16 77,340 3 High
YouTube.com 5 20,046 N/A Mixed Facebook.com 9 63,896 3 High
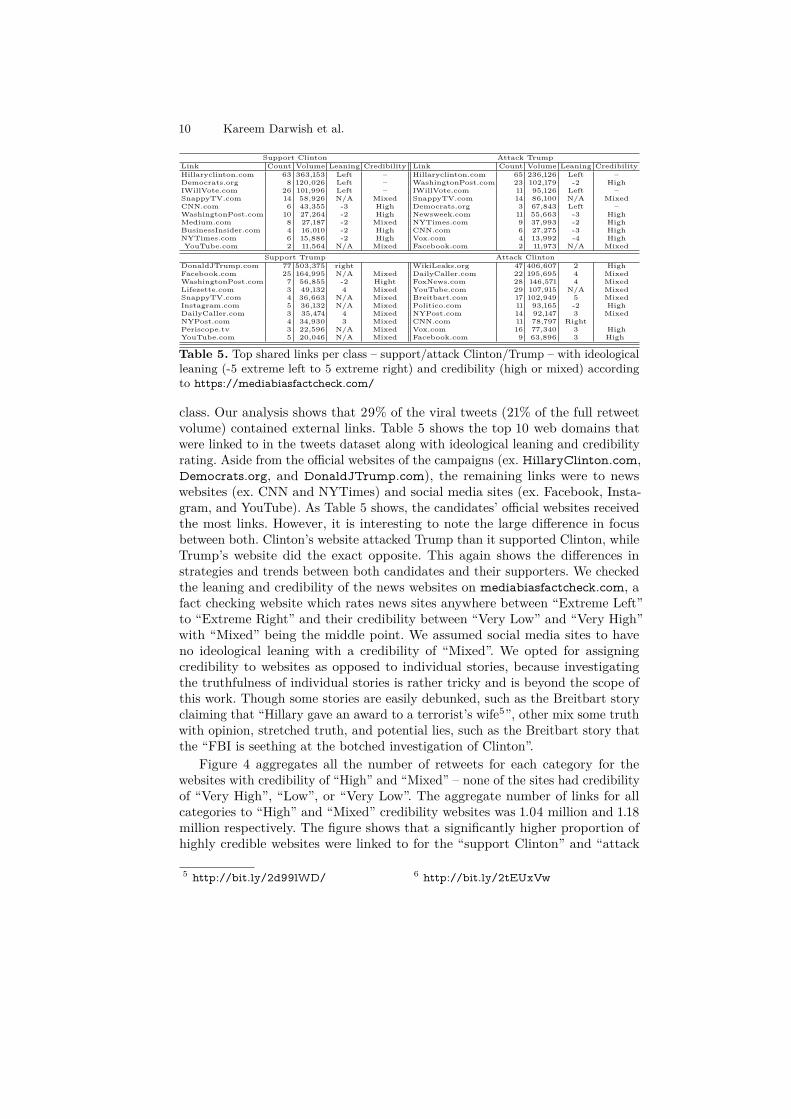
Table 5. Top shared links per class – support/attack Clinton/Trump – with ideological
leaning (-5 extreme left to 5 extreme right) and credibility (high or mixed) according
to https://mediabiasfactcheck.com/
class. Our analysis shows that 29% of the viral tweets (21% of the full retweet
volume) contained external links. Table 5 shows the top 10 web domains that
were linked to in the tweets dataset along with ideological leaning and credibility
rating. Aside from the official websites of the campaigns (ex. HillaryClinton.com,
Democrats.org, and DonaldJTrump.com), the remaining links were to news
websites (ex. CNN and NYTimes) and social media sites (ex. Facebook, Insta-
gram, and YouTube). As Table 5 shows, the candidates’ official websites received
the most links. However, it is interesting to note the large difference in focus
between both. Clinton’s website attacked Trump than it supported Clinton, while
Trump’s website did the exact opposite. This again shows the differences in
strategies and trends between both candidates and their supporters. We checked
the leaning and credibility of the news websites on mediabiasfactcheck.com, a
fact checking website which rates news sites anywhere between “Extreme Left”
to “Extreme Right” and their credibility between “Very Low” and “Very High”
with “Mixed” being the middle point. We assumed social media sites to have
no ideological leaning with a credibility of “Mixed”. We opted for assigning
credibility to websites as opposed to individual stories, because investigating
the truthfulness of individual stories is rather tricky and is beyond the scope of
this work. Though some stories are easily debunked, such as the Breitbart story
claiming that “Hillary gave an award to a terrorist’s wife5”, other mix some truth
with opinion, stretched truth, and potential lies, such as the Breitbart story that
the “FBI is seething at the botched investigation of Clinton”.
Figure 4 aggregates all the number of retweets for each category for the
websites with credibility of “High” and “Mixed” – none of the sites had credibility
of “Very High”, “Low”, or “Very Low”. The aggregate number of links for all
categories to “High” and “Mixed” credibility websites was 1.04 million and 1.18
million respectively. The figure shows that a significantly higher proportion of
highly credible websites were linked to for the “support Clinton” and “attack
5 http://bit.ly/2d99lWD/ 6 http://bit.ly/2tEUxVw
Trump vs. Hillary 11
Fig. 4. Mentions of states for each class. Fig. 5. Credibility of websites that are
linked to from each category
Trump” categories compared to mixed credibility sites. The opposite was true
for the “support Trump” category, where the majority of links used to support
Trump was from mixed creditability websites. This may indicate that Trump
supporters were more susceptible to share less credible sources compared to
Clinton supporters. High and mixed credibility sites were evenly matched for the
“attack Clinton” category. WikiLeaks was the foremost shared site for attacking
Clinton, which has high credibility. This again highlights the role of WikiLeaks in
steering public opinion against Clinton. It worth mentioning that “The Podesta
Emails6” was the most popular link. Thus, though lower credibility links were
used to attack Clinton, high credibility links featured prominently. For ideological
orientation, left leaning sources featured prominently in the “support Clinton”
and “attack Trump” classes, and right leaning sources featured prominently for
the two other classes. The only left leaning sources appearing on the “support
Trump” and “attack Clinton” lists were Washington Post and Politico.
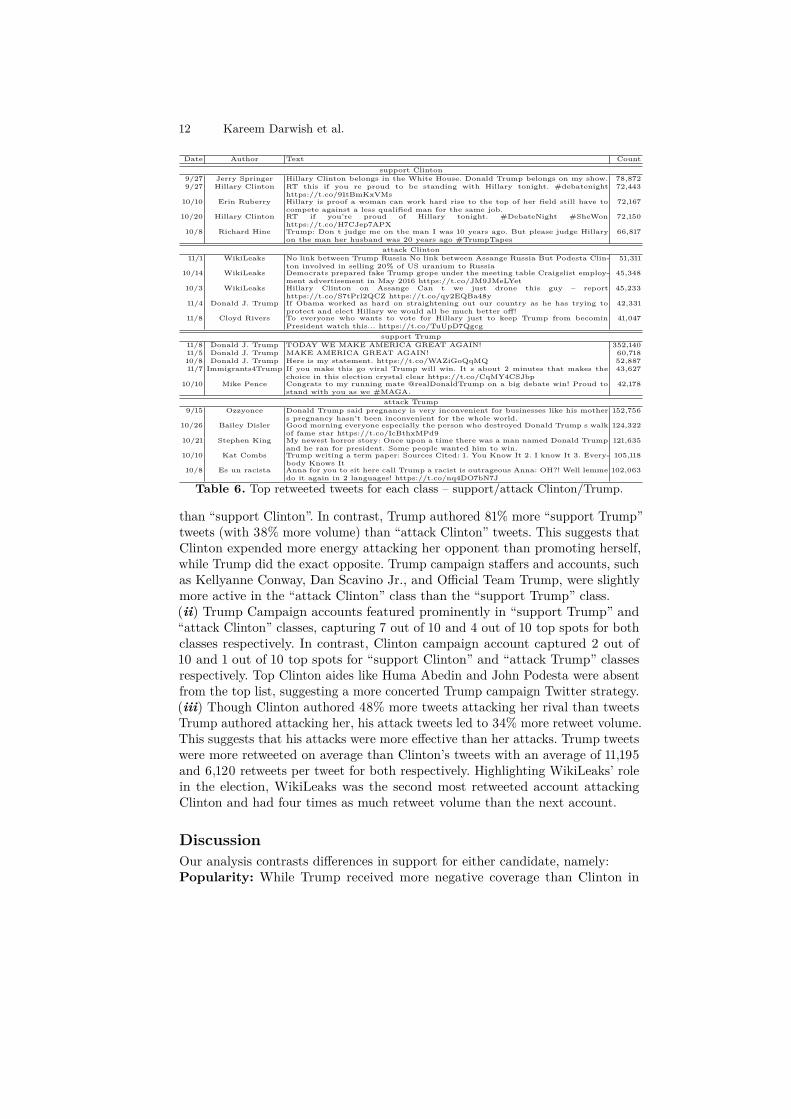
Most Retweeted Tweets Table 6 lists the top 5 most retweeted7 tweets for
each class. They illustrate the trends to those exhibited in our previous analysis,
namely: “support Clinton” tweets are led by talk about debates and attacks
against Trump; the most retweeted “attack Clinton” tweets are from WikiLeaks;
Trump campaign slogans appear atop of “support Trump” tweets; and the most
retweeted attack Trump” tweets cover demeaning statements against women
and minorities and mockery of Trump. An interesting observation is that the
most retweeted tweet attacking Trump came from a Nigerian account with screen
name “Ozzyonce” who had less than 2,000 followers at the time when she posted
the tweet. Nonetheless, this tweet received over 150K retweets in one day.
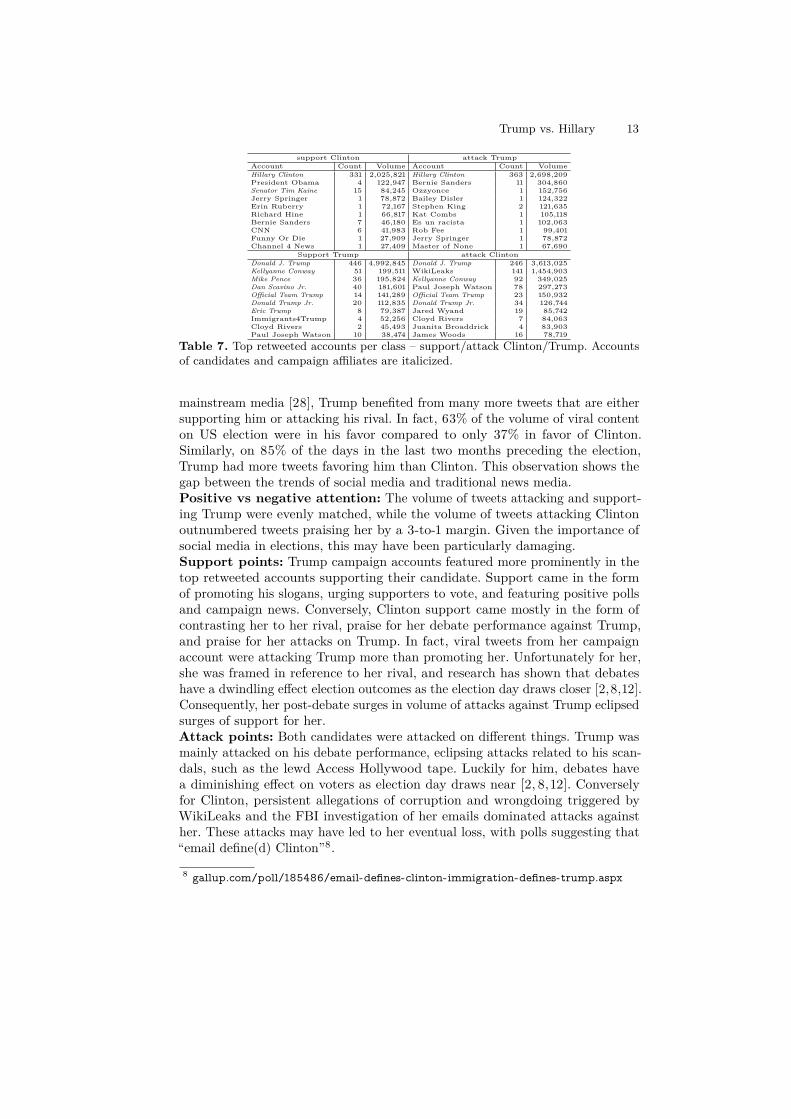
Most Retweeted Accounts Table 7 lists the most retweeted accounts for each
class. As expected, the most retweeted accounts for “support” and “attack” classes
were those of the candidates themselves and their rivals respectively. Notably:
(i) Clinton authored 10% more “attack Trump” tweets (with 35% more volume)
6 https://wikileaks.org/podesta-emails/7 The number of retweets in the table are taken in November 2016
12 Kareem Darwish et al.
Date Author Text Count
support Clinton
9/27 Jerry Springer Hillary Clinton belongs in the White House. Donald Trump belongs on my show. 78,872
9/27 Hillary Clinton RT this if you re proud to be standing with Hillary tonight. #debatenight
https://t.co/91tBmKxVMs
72,443
10/10 Erin Ruberry Hillary is proof a woman can work hard rise to the top of her field still have to
compete against a less qualified man for the same job.
72,167
10/20 Hillary Clinton RT if you’re proud of Hillary tonight. #DebateNight #SheWon
https://t.co/H7CJep7APX
72,150
10/8 Richard Hine Trump: Don t judge me on the man I was 10 years ago. But please judge Hillary
on the man her husband was 20 years ago #TrumpTapes
66,817
attack Clinton
11/1 WikiLeaks No link between Trump Russia No link between Assange Russia But Podesta Clin-
ton involved in selling 20% of US uranium to Russia
51,311
10/14 WikiLeaks Democrats prepared fake Trump grope under the meeting table Craigslist employ-
ment advertisement in May 2016 https://t.co/JM9JMeLYet
45,348
10/3 WikiLeaks Hillary Clinton on Assange Can t we just drone this guy – report
https://t.co/S7tPrl2QCZ https://t.co/qy2EQBa48y
45,233
11/4 Donald J. Trump If Obama worked as hard on straightening out our country as he has trying to
protect and elect Hillary we would all be much better off!
42,331
11/8 Cloyd Rivers To everyone who wants to vote for Hillary just to keep Trump from becomin
President watch this... https://t.co/TuUpD7Qgcg
41,047
support Trump
11/8 Donald J. Trump TODAY WE MAKE AMERICA GREAT AGAIN! 352,140
11/5 Donald J. Trump MAKE AMERICA GREAT AGAIN! 60,718
10/8 Donald J. Trump Here is my statement. https://t.co/WAZiGoQqMQ 52,887
11/7 Immigrants4Trump If you make this go viral Trump will win. It s about 2 minutes that makes the
choice in this election crystal clear https://t.co/CqMY4CSJbp
43,627
10/10 Mike Pence Congrats to my running mate @realDonaldTrump on a big debate win! Proud to
stand with you as we #MAGA.
42,178
attack Trump
9/15 Ozzyonce Donald Trump said pregnancy is very inconvenient for businesses like his mother
s pregnancy hasn’t been inconvenient for the whole world.
152,756
10/26 Bailey Disler Good morning everyone especially the person who destroyed Donald Trump s walk
of fame star https://t.co/IcBthxMPd9
124,322
10/21 Stephen King My newest horror story: Once upon a time there was a man named Donald Trump
and he ran for president. Some people wanted him to win.
121,635
10/10 Kat Combs Trump writing a term paper: Sources Cited: 1. You Know It 2. I know It 3. Every-
body Knows It
105,118
10/8 Es un racista Anna for you to sit here call Trump a racist is outrageous Anna: OH?! Well lemme
do it again in 2 languages! https://t.co/nq4DO7bN7J
102,063
Table 6. Top retweeted tweets for each class – support/attack Clinton/Trump.
than “support Clinton”. In contrast, Trump authored 81% more “support Trump”
tweets (with 38% more volume) than “attack Clinton” tweets. This suggests that
Clinton expended more energy attacking her opponent than promoting herself,
while Trump did the exact opposite. Trump campaign staffers and accounts, such
as Kellyanne Conway, Dan Scavino Jr., and Official Team Trump, were slightly
more active in the “attack Clinton” class than the “support Trump” class.
(ii) Trump Campaign accounts featured prominently in “support Trump” and
“attack Clinton” classes, capturing 7 out of 10 and 4 out of 10 top spots for both
classes respectively. In contrast, Clinton campaign account captured 2 out of
10 and 1 out of 10 top spots for “support Clinton” and “attack Trump” classes
respectively. Top Clinton aides like Huma Abedin and John Podesta were absent
from the top list, suggesting a more concerted Trump campaign Twitter strategy.
(iii) Though Clinton authored 48% more tweets attacking her rival than tweets
Trump authored attacking her, his attack tweets led to 34% more retweet volume.
This suggests that his attacks were more effective than her attacks. Trump tweets
were more retweeted on average than Clinton’s tweets with an average of 11,195
and 6,120 retweets per tweet for both respectively. Highlighting WikiLeaks’ role
in the election, WikiLeaks was the second most retweeted account attacking
Clinton and had four times as much retweet volume than the next account.
Discussion
Our analysis contrasts differences in support for either candidate, namely:
Popularity: While Trump received more negative coverage than Clinton in
Trump vs. Hillary 13
support Clinton attack Trump
Account Count Volume Account Count Volume
Hillary Clinton 331 2,025,821 Hillary Clinton 363 2,698,209
President Obama 4 122,947 Bernie Sanders 11 304,860
Senator Tim Kaine 15 84,245 Ozzyonce 1 152,756
Jerry Springer 1 78,872 Bailey Disler 1 124,322
Erin Ruberry 1 72,167 Stephen King 2 121,635
Richard Hine 1 66,817 Kat Combs 1 105,118
Bernie Sanders 7 46,180 Es un racista 1 102,063
CNN 6 41,983 Rob Fee 1 99,401
Funny Or Die 1 27,909 Jerry Springer 1 78,872
Channel 4 News 1 27,409 Master of None 1 67,690
Support Trump attack Clinton
Donald J. Trump 446 4,992,845 Donald J. Trump 246 3,613,025
Kellyanne Conway 51 199,511 WikiLeaks 141 1,454,903
Mike Pence 36 195,824 Kellyanne Conway 92 349,025
Dan Scavino Jr. 40 181,601 Paul Joseph Watson 78 297,273
Official Team Trump 14 141,289 Official Team Trump 23 150,932
Donald Trump Jr. 20 112,835 Donald Trump Jr. 34 126,744
Eric Trump 8 79,387 Jared Wyand 19 85,742
Immigrants4Trump 4 52,256 Cloyd Rivers 7 84,063
Cloyd Rivers 2 45,493 Juanita Broaddrick 4 83,903
Paul Joseph Watson 10 38,474 James Woods 16 78,719
Table 7. Top retweeted accounts per class – support/attack Clinton/Trump. Accounts
of candidates and campaign affiliates are italicized.
mainstream media [28], Trump benefited from many more tweets that are either
supporting him or attacking his rival. In fact, 63% of the volume of viral content
on US election were in his favor compared to only 37% in favor of Clinton.
Similarly, on 85% of the days in the last two months preceding the election,
Trump had more tweets favoring him than Clinton. This observation shows the
gap between the trends of social media and traditional news media.
Positive vs negative attention: The volume of tweets attacking and support-
ing Trump were evenly matched, while the volume of tweets attacking Clinton
outnumbered tweets praising her by a 3-to-1 margin. Given the importance of
social media in elections, this may have been particularly damaging.
Support points: Trump campaign accounts featured more prominently in the
top retweeted accounts supporting their candidate. Support came in the form
of promoting his slogans, urging supporters to vote, and featuring positive polls
and campaign news. Conversely, Clinton support came mostly in the form of
contrasting her to her rival, praise for her debate performance against Trump,
and praise for her attacks on Trump. In fact, viral tweets from her campaign
account were attacking Trump more than promoting her. Unfortunately for her,
she was framed in reference to her rival, and research has shown that debates
have a dwindling effect election outcomes as the election day draws closer [2,8,12].
Consequently, her post-debate surges in volume of attacks against Trump eclipsed
surges of support for her.
Attack points: Both candidates were attacked on different things. Trump was
mainly attacked on his debate performance, eclipsing attacks related to his scan-
dals, such as the lewd Access Hollywood tape. Luckily for him, debates have
a diminishing effect on voters as election day draws near [2,8, 12]. Conversely
for Clinton, persistent allegations of corruption and wrongdoing triggered by
WikiLeaks and the FBI investigation of her emails dominated attacks against
her. These attacks may have led to her eventual loss, with polls suggesting that
“email define(d) Clinton”8.
8 gallup.com/poll/185486/email-defines-clinton-immigration-defines-trump.aspx
14 Kareem Darwish et al.
Message penetration: Trump’s slogan, “Make America Great Again”, had a
far greater reach than that of his rival, “Stronger Together”. Similarly, his policy
positions and agenda items, such as the proposal to build a wall with Mexico,
attracted significantly more attention than those of Clinton, where her proposed
policy positions received very little mention.
Geographical focus: Trump and his supporters effectively promoted his cam-
paign’s efforts in swing state, with frequent mentions of rallies and polls from
these states along with messages of thanks for people turning-out for his rallies.
The volume of tweets mentioning swing states and supporting Trump were typi-
cally two orders of magnitude larger than similar tweets supporting Clinton. This
might have contributed to the narrow victory he achieved in many of them.
Low credibility links: Trump supporters were more likely to share links from
websites of questionable credibility than Clinton supporters. However, WikiLeaks,
which has high credibility, was the most prominent source attacking Clinton.
To better understand the presented results, a few limitations that need to be
considered. First, the top 50 viral tweets do not have to be representative of the
whole collection. Nonetheless, they still represent over 40% of the tweets volume
on the US elections during the period of the study. Second, the results are based
on tweets collected from TweetElect. Although it is highly robust, the site uses
automatic filtering methods that are not perfect [19]. Therefore, there might be
other relevant viral tweets that were not captured by the filtering method. Lastly,
measuring support for a candidate using viral tweets does not have to represent
actual support on the ground for many reasons. Some of these reasons include
the fact that demographics of Twitter users may not match the general public,
more popular accounts have a better chance of having their tweets go viral, or
either campaign may engage in astroturfing, in which dedicated groups or bots
may methodically tweet or retweet pro-candidate messages [3].
Conclusion
In this paper, we presented quantitative and qualitative analysis of the top
retweeted tweets pertaining to the US presidential elections from September
1, 2016 to election day on November 8, 2016. For everyday, we tagged the
top 50 most retweeted tweets as supporting/attacking either candidate or as
neutral/irrelevant. Then we analyzed the tweets in each class from the perspective
of: general trends and statistics; most frequent hashtags, terms, and locations;
and most retweeted accounts and tweets. Our analysis highlights some of the
differences between the social media strategies of both candidates, the effectiveness
of both in pushing their messages, and the potential effect of attacks on both. We
show that compared to the Clinton campaign, the Trump campaign seems more
effective in: promoting Trump’s messages and slogans, attacking and framing
Clinton, and promoting campaign activities in “swing” states. For future work,
we would like to study the users who retweeted the viral tweets in our study to
ascertain such things as political leanings and geolocations. This can help map
the political dynamics underlying the support and opposition of both candidates.
Trump vs. Hillary 15
References
1. Barberá, P., Jost, J.T., Nagler, J., Tucker, J.A., Bonneau, R.: Tweeting from left to
right is online political communication more than an echo chamber? Psychological
science (2015)
2. Benoit, W.L., Hansen, G.J., Verser, R.M.: A meta-analysis of the effects of viewing
us presidential debates. Communication Monographs 70(4), 335–350 (2003)
3. Bessi, A., Ferrara, E.: Social bots distort the 2016 us presidential election online
discussion. First Monday 21(11) (2016)
4. Bollen, J., Mao, H., Pepe, A.: Modeling public mood and emotion: Twitter sentiment
and socio-economic phenomena. ICWSM 11, 450–453 (2011)
5. Bovet, A., Morone, F., Makse, H.A.: Predicting election trends with twitter: Hillary
clinton versus donald trump. arXiv preprint arXiv:1610.01587 (2016)
6. Colleoni, E., Rozza, A., Arvidsson, A.: Echo chamber or public sphere? predicting
political orientation and measuring political homophily in twitter using big data.
Journal of Communication 64(2), 317–332 (2014)
7. Davis, C.A., Varol, O., Ferrara, E., Flammini, A., Menczer, F.: Botornot: A system
to evaluate social bots. In: Proceedings of the 25th International Conference
Companion on World Wide Web. pp. 273–274. International World Wide Web
Conferences Steering Committee (2016)
8. Erikson, R.S., Wlezien, C.: The timeline of presidential elections: How campaigns
do (and do not) matter. University of Chicago Press (2012)
9. Gayo-Avello, D.: Don’t turn social media into another’literary digest’poll. Commu-
nications of the ACM 54(10), 121–128 (2011)
10. Gayo Avello, D., Metaxas, P.T., Mustafaraj, E.: Limits of electoral predictions using
twitter. In: Proceedings of the Fifth International AAAI Conference on Weblogs
and Social Media. Association for the Advancement of Artificial Intelligence (2011)
11. Giglietto, F., Iannelli, L., Rossi, L., Valeriani, A.: Fakes, news and the election: A
new taxonomy for the study of misleading information within the hybrid media
system (2016)
12. Hillygus, D.S., Jackman, S.: Voter decision making in election 2000: Campaign
effects, partisan activation, and the clinton legacy. American Journal of Political
Science 47(4), 583–596 (2003)
13. Jungherr, A.: Analyzing political communication with digital trace data. Cham,
Switzerland: Springer (2015)
14. Jungherr, A., Jürgens, P., Schoen, H.: Why the pirate party won the german election
of 2009 or the trouble with predictions: A response to tumasjan, a., sprenger, to,
sander, pg, & welpe, im “predicting elections with twitter: What 140 characters
reveal about political sentimen”. Social science computer review 30(2), 229–234
(2012)
15. Kollanyi, B., Howard, P.N., Woolley, S.C.: Bots and automation over twitter during
the first us presidential debate. Comprop Data Memo (2016)
16. Kucharski, A.: Post-truth: Study epidemiology of fake news. Nature 540(7634),
525–525 (2016)
17. Magdy, W., Darwish, K.: Trump vs. hillary analyzing viral tweets during us presi-
dential elections 2016. arXiv preprint arXiv:1610.01655 (2016)
18. Magdy, W., Darwish, K., Abokhodair, N., Rahimi, A., Baldwin, T.: # isisisnotislam
or# deportallmuslims?: Predicting unspoken views. In: Proceedings of the 8th ACM
Conference on Web Science. pp. 95–106. ACM (2016)
16 Kareem Darwish et al.
19. Magdy, W., Elsayed, T.: Adaptive method for following dynamic topics on twitter.
In: ICWSM (2014)
20. Magdy, W., Elsayed, T.: Unsupervised adaptive microblog filtering for broad
dynamic topics. Information Processing & Management 52(4), 513–528 (2016)
21. Metaxas, P.T., Mustafaraj, E., Gayo-Avello, D.: How (not) to predict elections. In:
Privacy, Security, Risk and Trust (PASSAT) and 2011 IEEE Third Inernational
Conference on Social Computing (SocialCom), 2011 IEEE Third International
Conference on. pp. 165–171. IEEE (2011)
22. Mislove, A., Lehmann, S., Ahn, Y.Y., Onnela, J.P., Rosenquist, J.N.: Understanding
the demographics of twitter users. ICWSM 11, 5th (2011)
23. O’Connor, B., Balasubramanyan, R., Routledge, B.R., Smith, N.A.: From tweets
to polls: Linking text sentiment to public opinion time series. ICWSM 11(122-129),
1–2 (2010)
24. Ritter, A., Clark, S., Etzioni, O., et al.: Named entity recognition in tweets: an
experimental study. In: Proceedings of the Conference on Empirical Methods
in Natural Language Processing. pp. 1524–1534. Association for Computational
Linguistics (2011)
25. Shi, L., Agarwal, N., Agrawal, A., Garg, R., Spoelstra, J.: Predicting us primary
elections with twitter. URL: http://snap. stanford. edu/social2012/papers/shi. pdf
(2012)
26. Shirky, C.: The political power of social media: Technology, the public sphere, and
political change. Foreign affairs pp. 28–41 (2011)
27. Tumasjan, A., Sprenger, T.O., Sandner, P.G., Welpe, I.M.: Predicting elections
with twitter: What 140 characters reveal about political sentiment. ICWSM 10,
178–185 (2010)
28. Van Aelst, P., Van Erkel, P., DâĂŹheer, E., Harder, R.A.: Who is leading the cam-
paign charts? comparing individual popularity on old and new media. Information,
Communication & Society 20(5), 715–732 (2017)
29. Wang, Y., Li, Y., Luo, J.: Deciphering the 2016 us presidential campaign in the
twitter sphere: A comparison of the trumpists and clintonists. arXiv preprint
arXiv:1603.03097 (2016)
30. Wang, Y., Luo, J., Niemi, R., Li, Y., Hu, T.: Catching fire via"likes": Inferring topic
preferences of trump followers on twitter. arXiv preprint arXiv:1603.03099 (2016)
31. West, D.M.: Air wars: Television advertising and social media in election campaigns,
1952-2012. Sage (2013)