Embed Size (px)
Citation preview
Amira Adel Taha AL-Hosary
Lecturer of Infectious Diseases
Faculty of Vet. Medicine – Assiut University
Troubleshooting of Real Time PCR
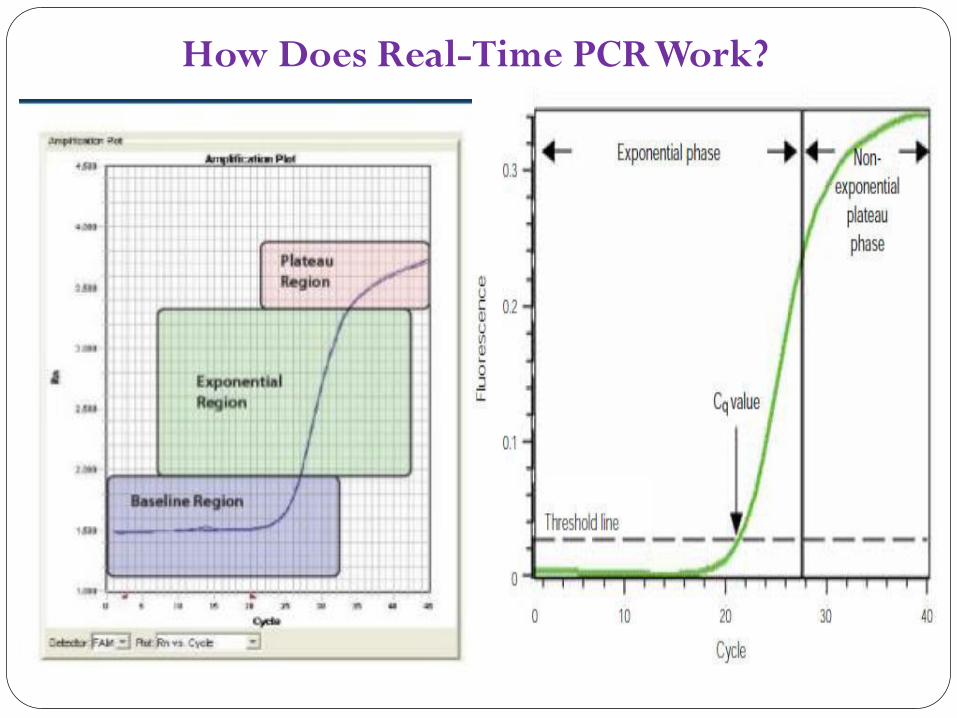
How Does Real-Time PCR Work?
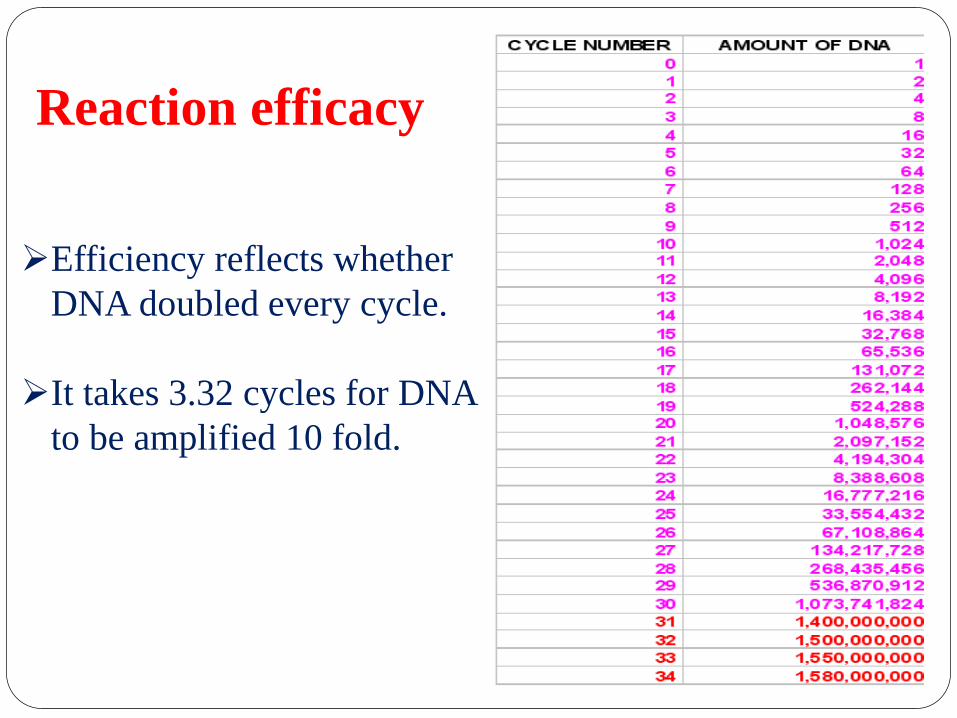
Reaction efficacy
Efficiency reflects whether
DNA doubled every cycle.
It takes 3.32 cycles for DNA
to be amplified 10 fold.

Troubleshooting
It is always best to
follow the
recommendations of
the manufacturer.

Troubleshooting in the real-time PCR reaction seems to be
absent when, assuming proper assay design was taken into
consideration.
Common real-time PCR difficulties can be grouped into four
main areas:
• Formation of primer-dimers
• Storing primers and probes
• Real-time PCR inhibition and poor reaction efficiency
• Software analysis settings
Formation of primer-dimers
Primer-dimers form when partial sequence homology exists
between the members of the primer pair.
If the primers anneal to each other during the PCR reaction,
the Taq DNA polymerase may be able to extend them.
Depending on its length, it is also possible for a primer to fold
upon itself and therefore set up a competitive environment
with the template.
Problems caused by primer-dimers
The effect that primer-dimers mainly affected by the
type of RT-PCR.
Fluorogenic probe-based reactions:
Not greatly affected by primer-dimers
Because a probe annealing and being cleaved in a
primer-dimer region is an extremely rare event.
Reactions that rely on double-stranded DNA-binding
dyes:- It is a serious problem
Because the dye would bind to them nonspecifically
and therefore contribute to fluorescence signal being
monitored during the reaction.
This will shifts the Ct and gives false results.
It is best to take simple precautions during primer
design to avoid dimerization in the first place.
Problems caused by primer-dimers
Determining if primer-dimers are
present
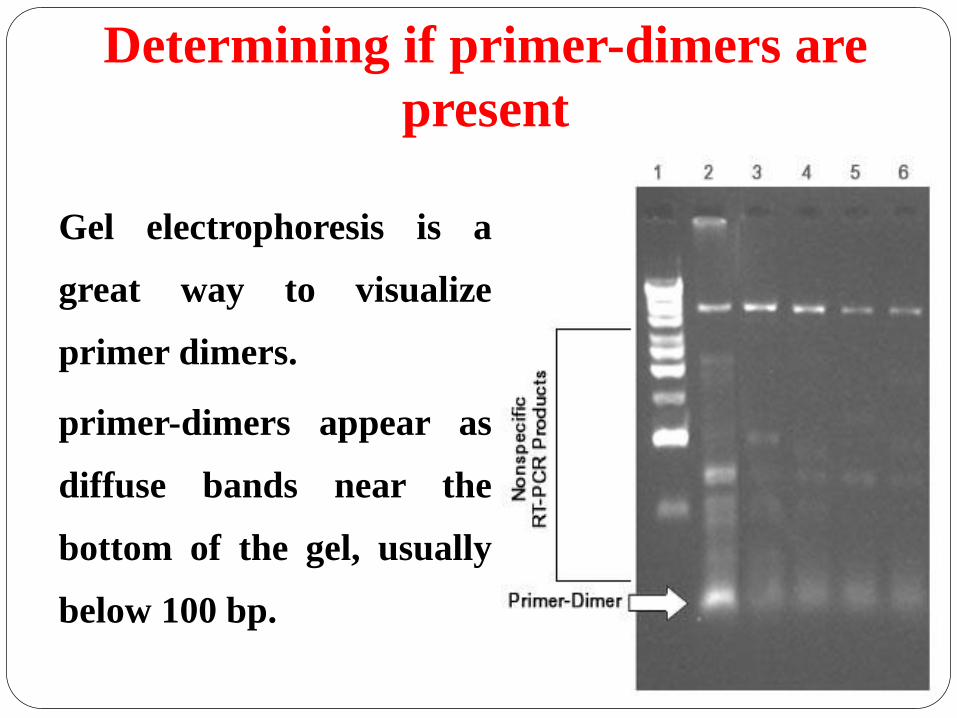
Gel electrophoresis is a
great way to visualize
primer dimers.
primer-dimers appear as
diffuse bands near the
bottom of the gel, usually
below 100 bp.
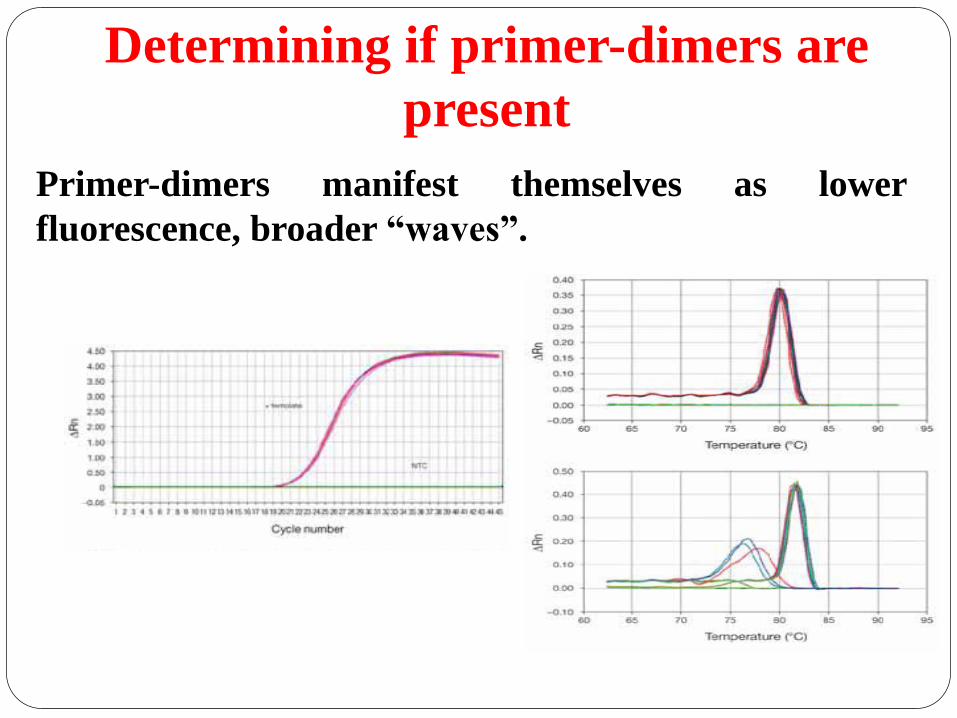
Primer-dimers manifest themselves as lower
fluorescence, broader “waves”.
Determining if primer-dimers are
present
Reducing or removing primer-dimers
1. The first is optimization of the thermo cycling
conditions, which mainly involves raising the
annealing temperature.
2. Primer concentration can always be lowered. In
most cases, a final concentration of 200 nM per
primer is ideal, but this can be reduced to 60 nM if
necessary.
3. Magnesium is usually best at a concentration of
about 3 mM, primer-dimers are favored at
concentrations above this.
4. If primers were not evaluated for their propensity
toward dimerization, evaluate them and as usual,
hot-start DNA polymerases and reaction setup on
ice are also preferable.
Reducing or removing primer-dimers
Keep in mind that dimers
may be more of a concern in
one-step qRT-PCR reactions
due to the lower temperature
of the RT reaction in the
presence of the primer pair.
Storing primers and probes
Primer and probe storage can have a major effect on
the success and consistency of a real-time PCR assay.
The main factors that affect primer and probe
stability are:
1. The storage temperature.
2. The length of storage time.
3. Prolonged exposure to light.
4. The concentration of the stored primer or probe.
5. The composition of the storage solution.
Problems caused by poor storage of
primers and probes
Improper storage of primers and probes can cause them
to degrade and lose specificity, which in turn affects the
reaction efficiency.
In assays that rely on fluorescently labeled primers and
probes, degraded probe releases free dye, which
increases background and decreases the signal-to-noise
ratio.
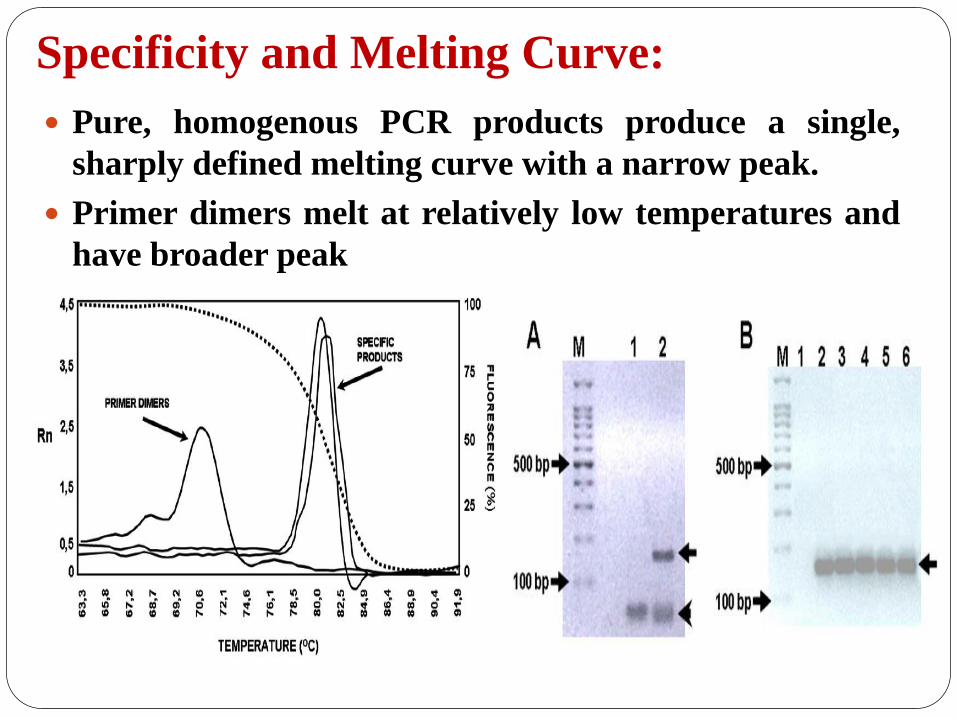
Specificity and Melting Curve:
Pure, homogenous PCR products produce a single,
sharply defined melting curve with a narrow peak.
Primer dimers melt at relatively low temperatures and
have broader peak
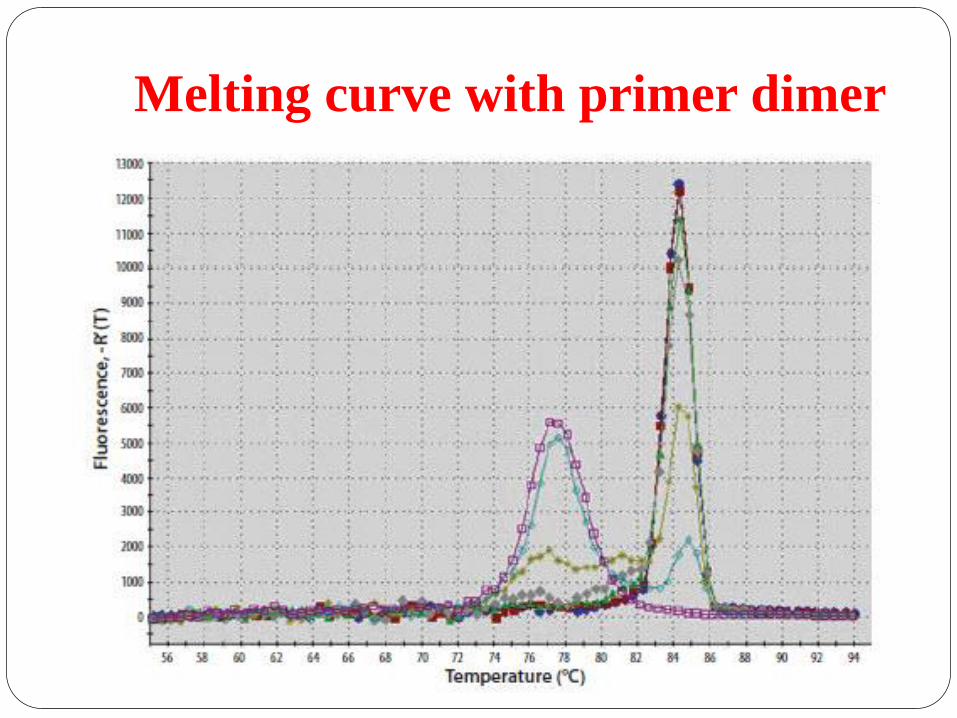
Melting curve with primer dimer

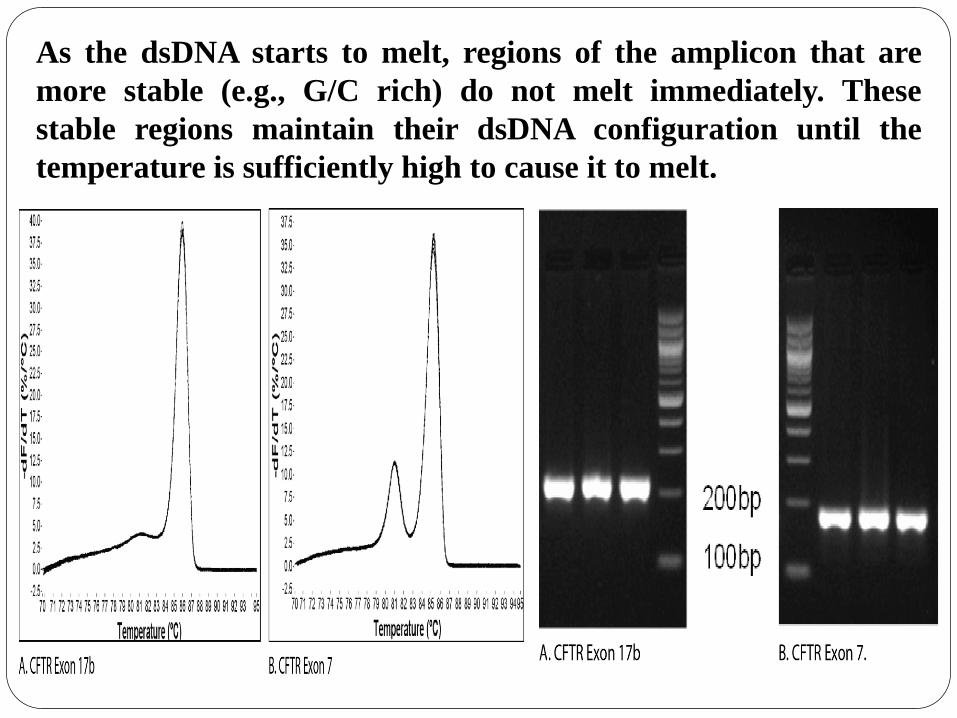
As the dsDNA starts to melt, regions of the amplicon that are
more stable (e.g., G/C rich) do not melt immediately. These
stable regions maintain their dsDNA configuration until the
temperature is sufficiently high to cause it to melt.
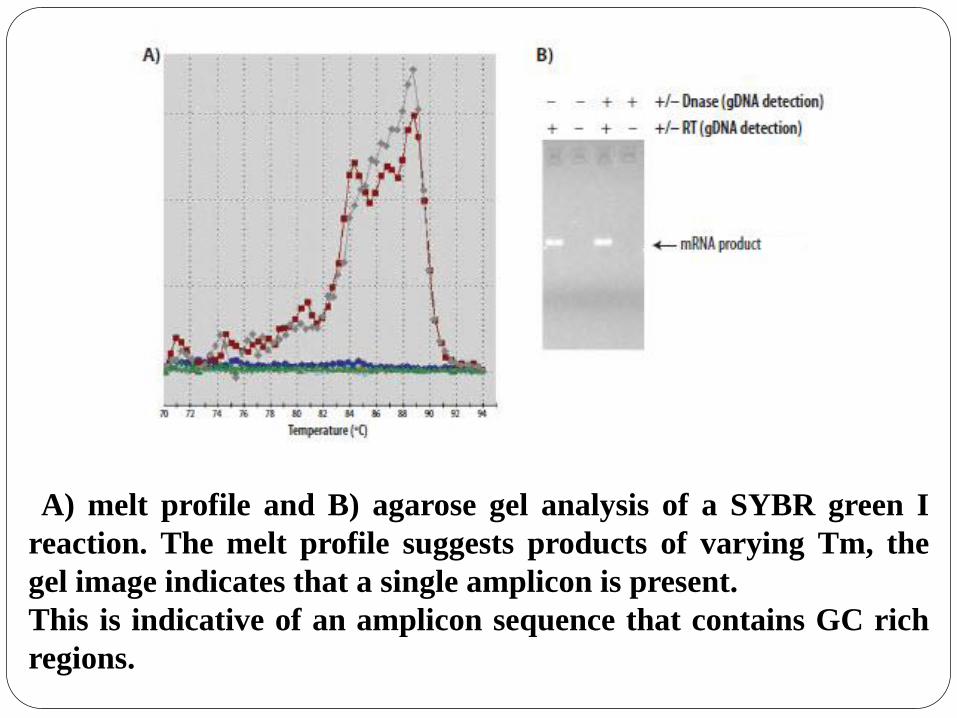
A) melt profile and B) agarose gel analysis of a SYBR green I
reaction. The melt profile suggests products of varying Tm, the
gel image indicates that a single amplicon is present.
This is indicative of an amplicon sequence that contains GC rich
regions.

Abnormal Standard curve
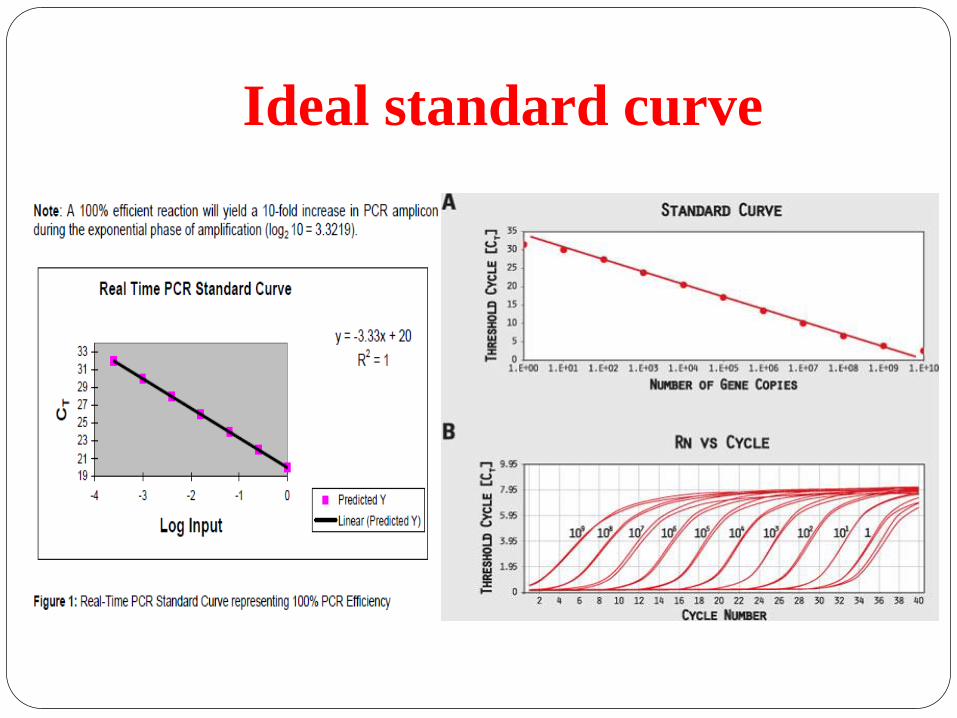
Ideal standard curve
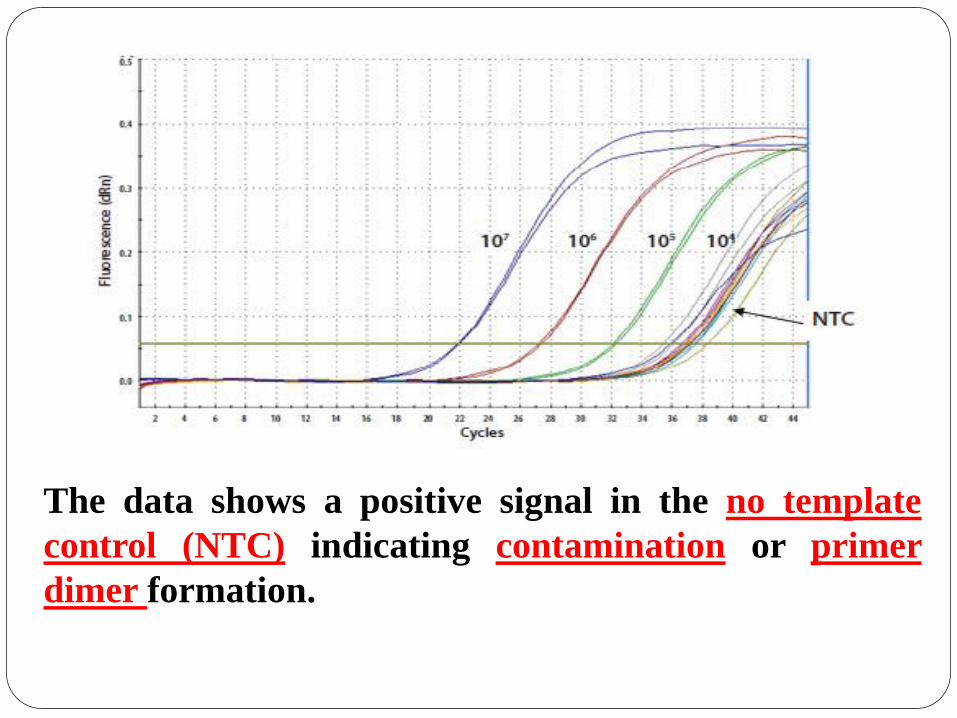
The data shows a positive signal in the no template
control (NTC) indicating contamination or primer
dimer formation.
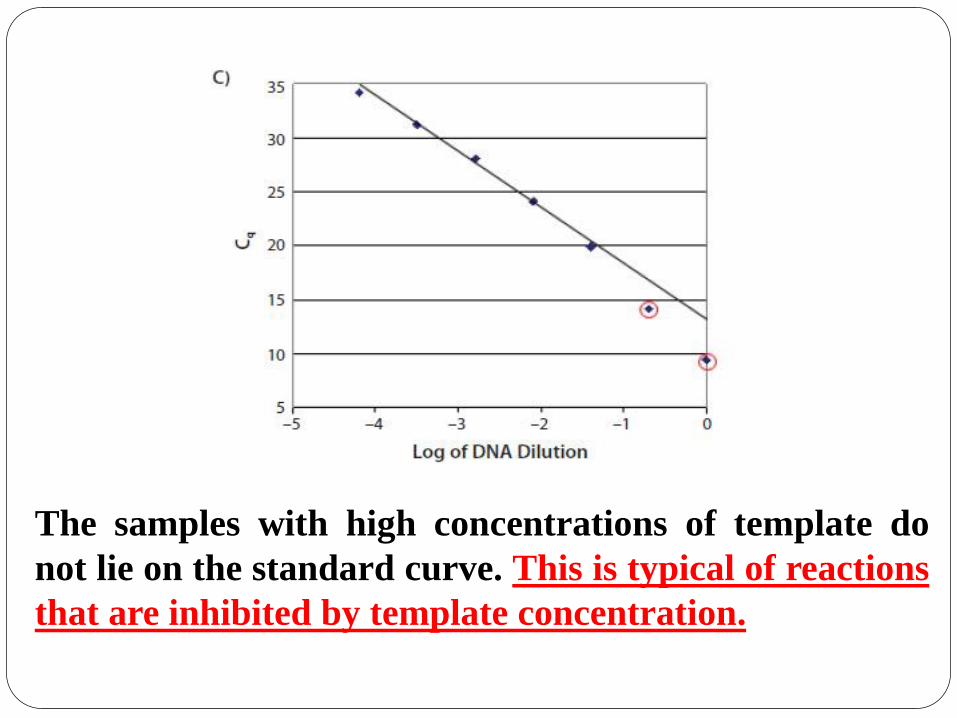
The samples with high concentrations of template do
not lie on the standard curve. This is typical of reactions
that are inhibited by template concentration.
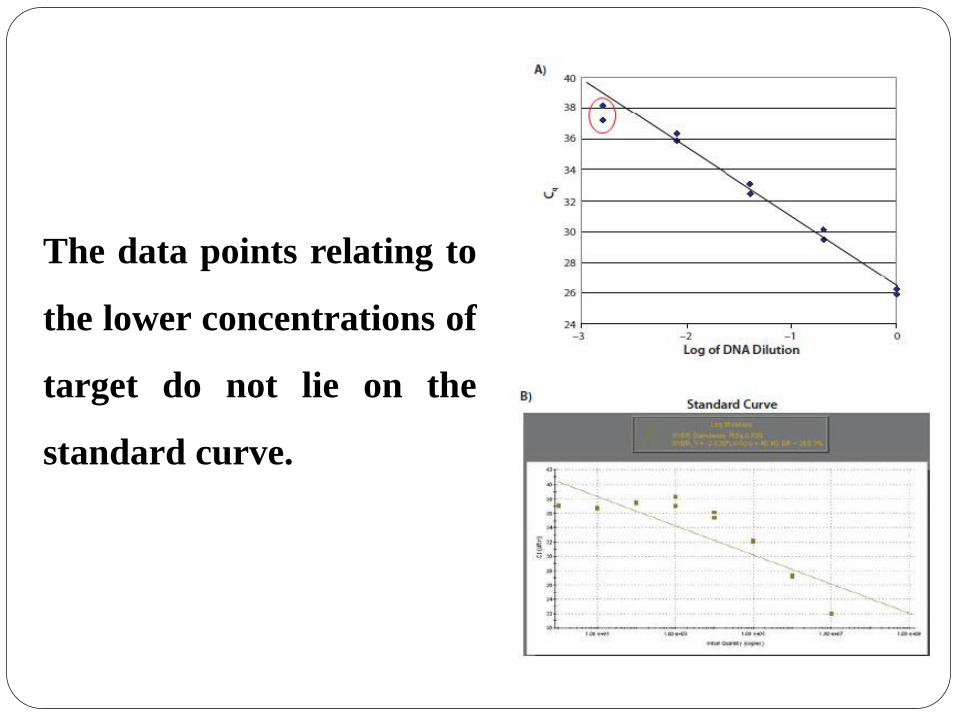
The data points relating to
the lower concentrations of
target do not lie on the
standard curve.
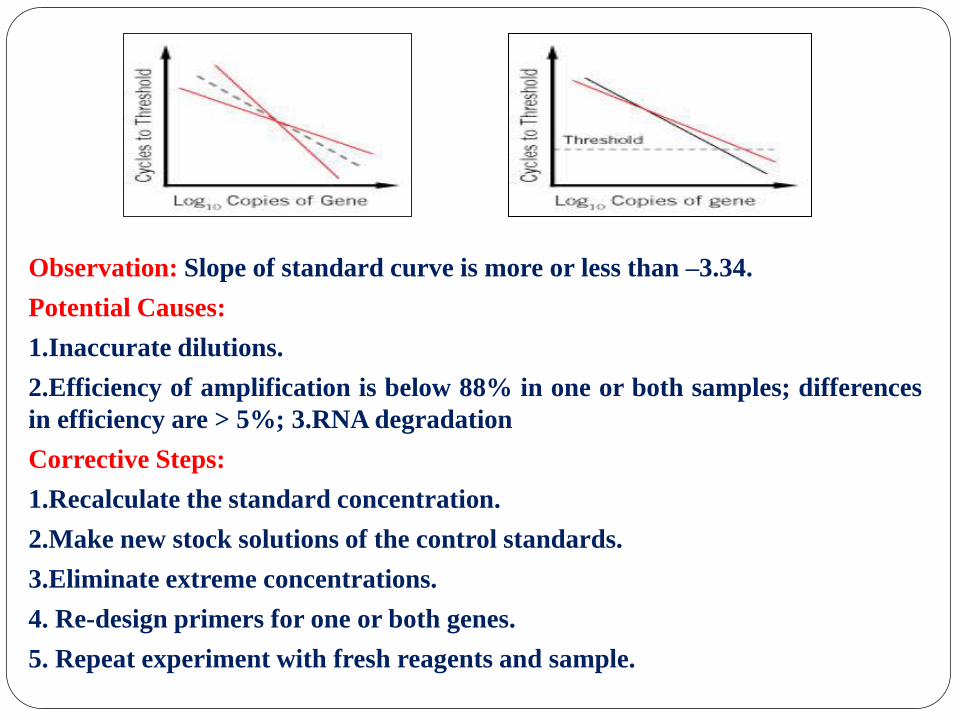
Observation: Slope of standard curve is more or less than –3.34.
Potential Causes:
1.Inaccurate dilutions.
2.Efficiency of amplification is below 88% in one or both samples; differences
in efficiency are > 5%; 3.RNA degradation
Corrective Steps:
1.Recalculate the standard concentration.
2.Make new stock solutions of the control standards.
3.Eliminate extreme concentrations.
4. Re-design primers for one or both genes.
5. Repeat experiment with fresh reagents and sample.

Amplification Curve
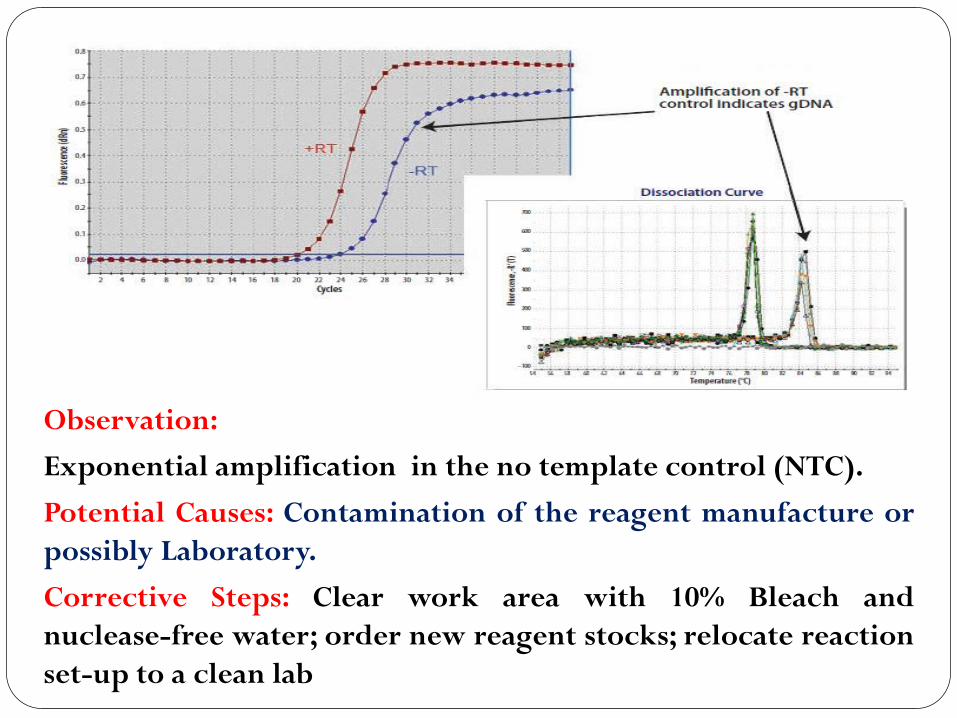
Observation:
Exponential amplification in the no template control (NTC).
Potential Causes: Contamination of the reagent manufacture or
possibly Laboratory.
Corrective Steps: Clear work area with 10% Bleach and
nuclease-free water; order new reagent stocks; relocate reaction
set-up to a clean lab
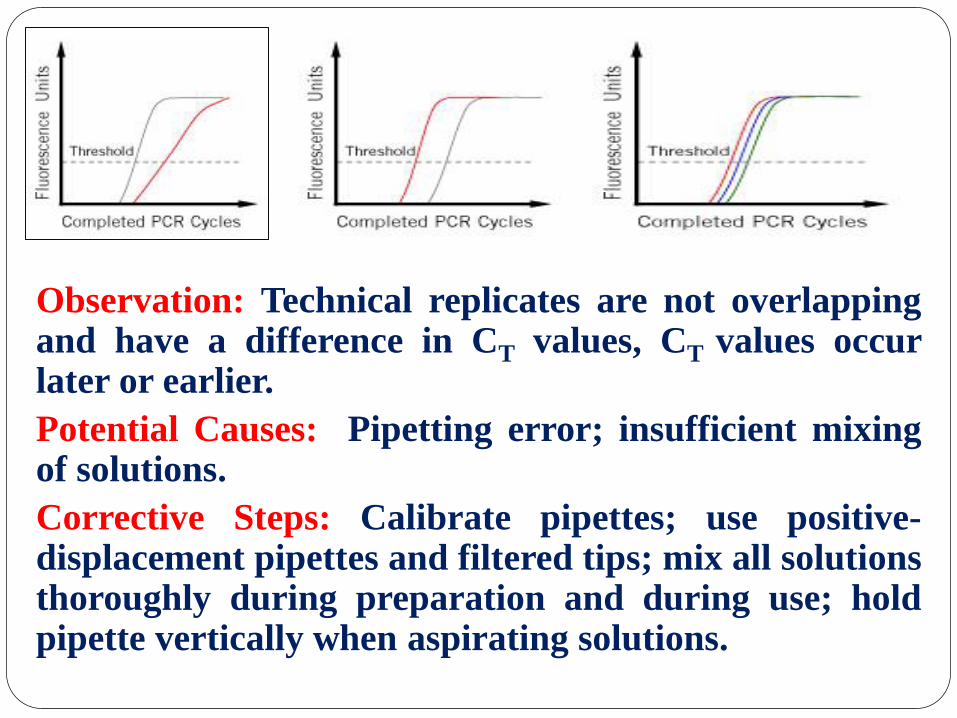
Observation: Technical replicates are not overlapping and have a difference in CT values, CT values occur later or earlier.
Potential Causes: Pipetting error; insufficient mixing of solutions.
Corrective Steps: Calibrate pipettes; use positive-displacement pipettes and filtered tips; mix all solutions thoroughly during preparation and during use; hold pipette vertically when aspirating solutions.
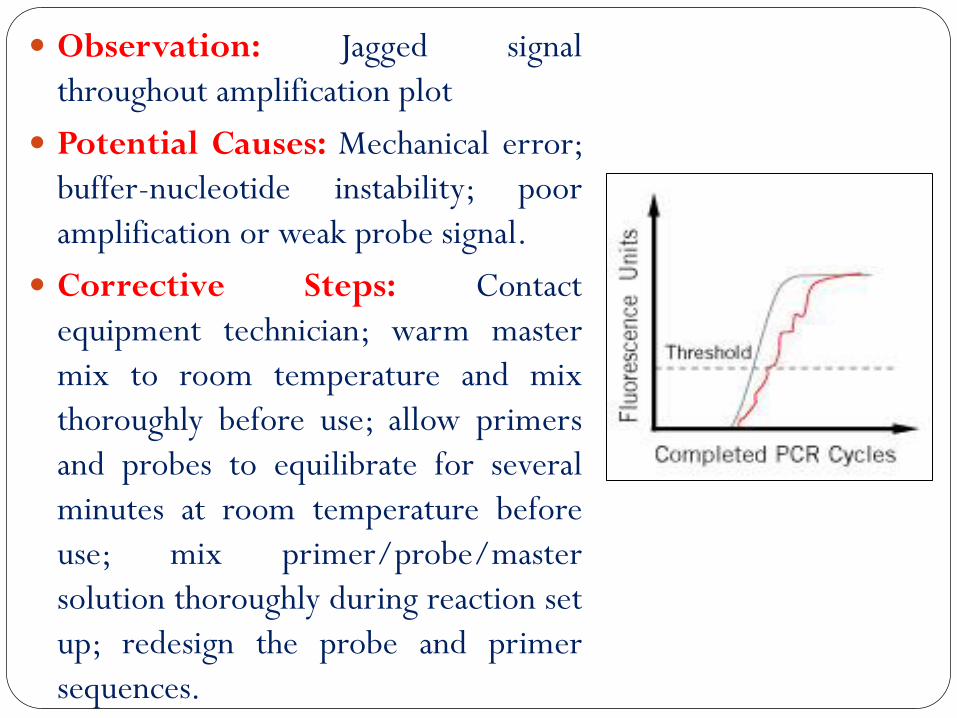
Observation: Jagged signal
throughout amplification plot
Potential Causes: Mechanical error;
buffer-nucleotide instability; poor
amplification or weak probe signal.
Corrective Steps: Contact
equipment technician; warm master
mix to room temperature and mix
thoroughly before use; allow primers
and probes to equilibrate for several
minutes at room temperature before
use; mix primer/probe/master
solution thoroughly during reaction set
up; redesign the probe and primer
sequences.
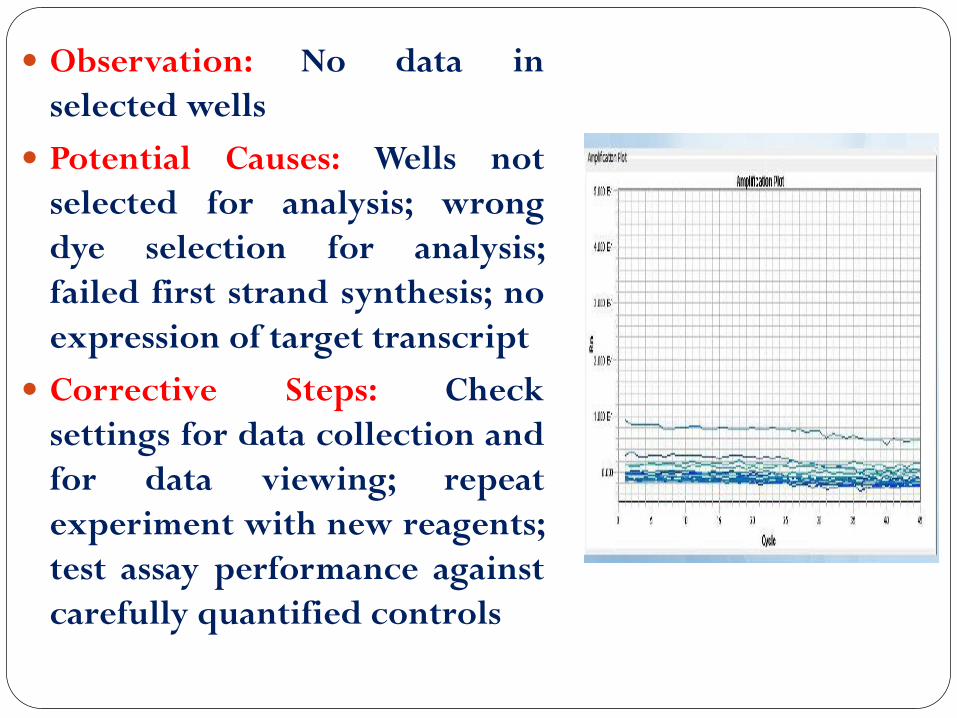
Observation: No data in
selected wells
Potential Causes: Wells not
selected for analysis; wrong
dye selection for analysis;
failed first strand synthesis; no
expression of target transcript
Corrective Steps: Check
settings for data collection and
for data viewing; repeat
experiment with new reagents;
test assay performance against
carefully quantified controls

Thanks a lot with my Best Regards and My Best wishes
Amira A. AL-Hosary
E-mail: Amiraelhosary @yahoo.com
Mob. (002) 01004477501