Embed Size (px)
Citation preview
8/6/2019 RealTime PCR VS Traditional PCR
http://slidepdf.com/reader/full/realtime-pcr-vs-traditional-pcr 1/15
For Reference Only Page 1 of 15
Real-Time PCR Vs. Traditional PCR
Description
This tutorial will discuss the evolution of traditional PCR methods towardsthe use of Real-Time chemistry and instrumentation for accuratequantitation.
Objectives
This tutorial will provide an understanding of the following:
· Limitations of traditional PCR
· Introduction to Real-Time PCR
· Advantages of Real-Time chemistries over traditional PCRmethods
8/6/2019 RealTime PCR VS Traditional PCR
http://slidepdf.com/reader/full/realtime-pcr-vs-traditional-pcr 2/15
For Reference Only Page 2 of 15
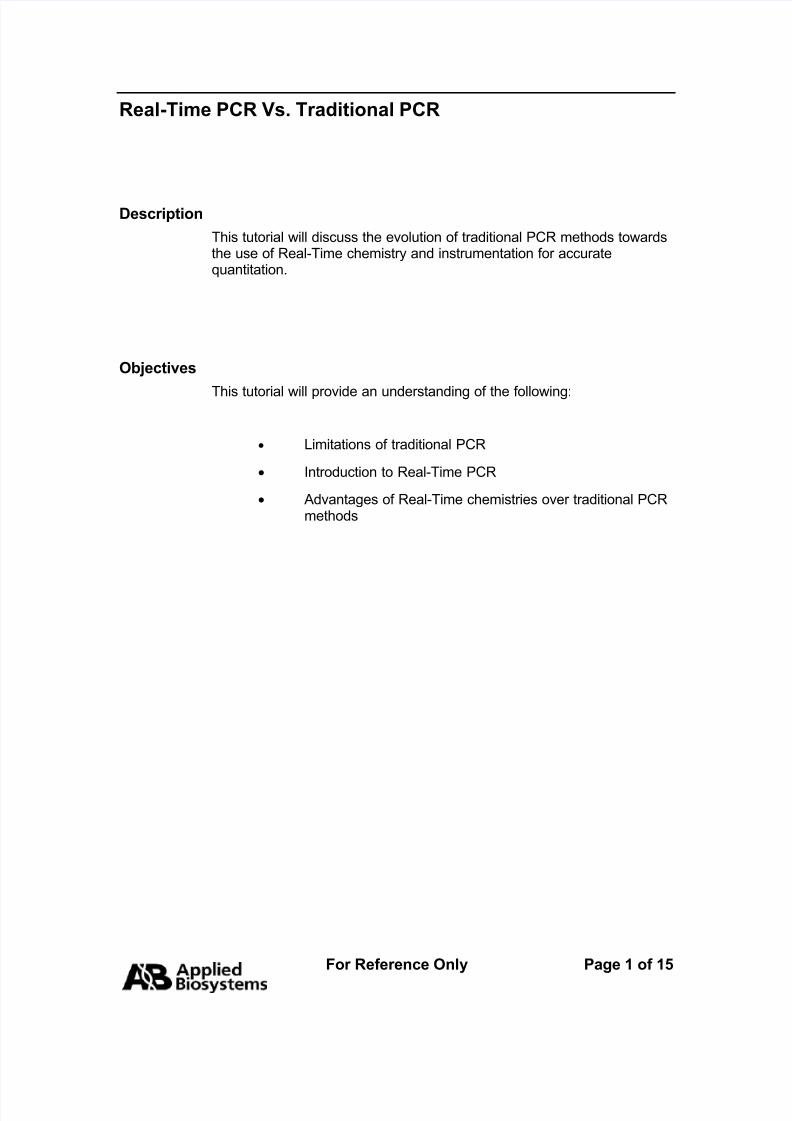
The Evolution of PCR to Real-Time
PCR has completely revolutionized the detection of RNA and DNA.Traditional PCR has advanced from detection at the end-point of thereaction to detection while the reaction is occurring.
Figure 1: Real-Time PCR Evolution
DNA Extraction PCR
Real Time
Detection
Real-Time Vs Traditional PCR
Real-Time chemistries allow for the detection of PCR amplification duringthe early phases of the reaction. Measuring the kinetics of the reaction inthe early phases of PCR provides a distinct advantage over traditionalPCR detection. Traditional methods use Agarose gels for detection of PCR amplification at the final phase or end-point of the PCR reaction.
8/6/2019 RealTime PCR VS Traditional PCR
http://slidepdf.com/reader/full/realtime-pcr-vs-traditional-pcr 3/15
For Reference Only Page 3 of 15
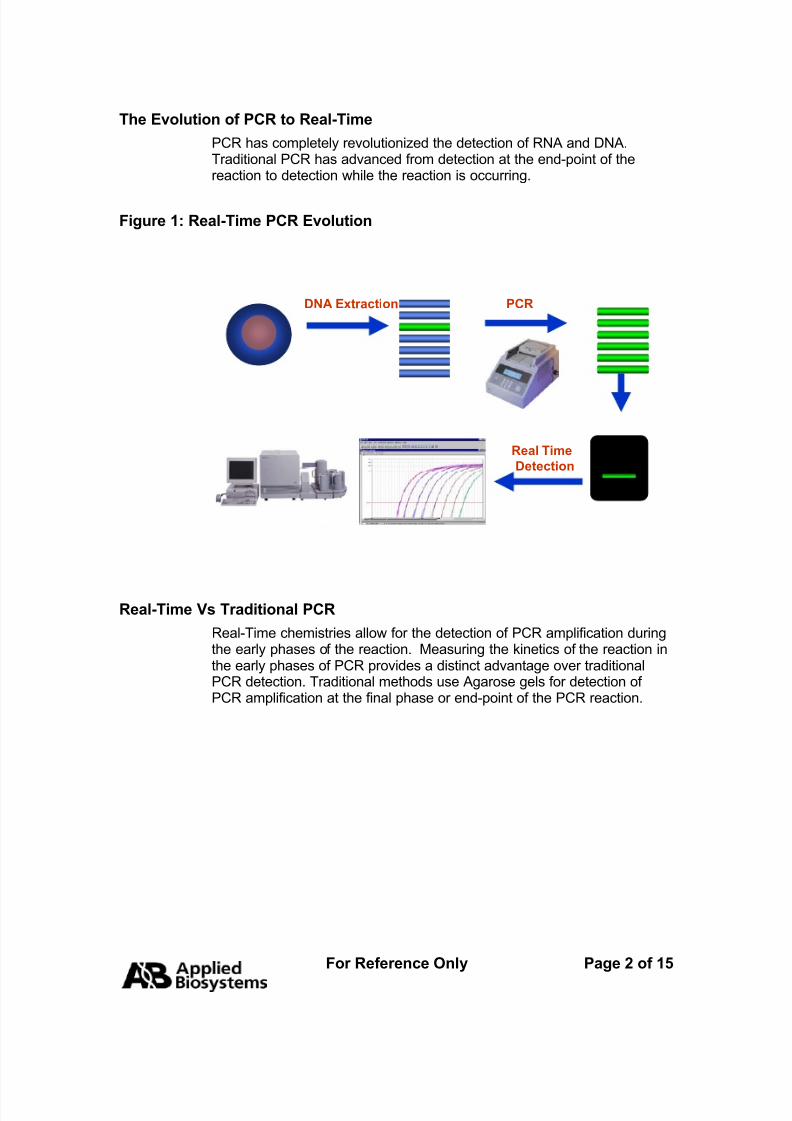
Limitations of End-Point PCR
Agarose gel results are obtained from the end point of the reaction. End-point detection is very time consuming. Results may not be obtained for days. Results are based on size discrimination, which may not be very
precise. As seen later in the section, the end point is variable fromsample to sample. While gels may not be able to resolve thesevariabilities in yield, real-time PCR is sensitive enough to detect thesechanges. Agarose Gel resolution is very poor, about 10 fold. Real-TimePCR can detect as little as a two-fold change!
Some of the problems with End-Point Detection:
· Poor Precision
· Low sensitivity
· Short dynamic range < 2 logs
· Low resolution
· Non - Automated
· Size-based discrimination only
· Results are not expressed as numbers
· Ethidium bromide for staining is not very quantitative
· Post PCR processing
Figure 2: Agarose Gel
As you can see from the figure, the samples in the gel contain 10 copiesand 50 copies, respectively. It is hard to differentiate between the 5-foldchange on the Agarose gel. Real-Time PCR is able detect a two-foldchange (i.e. 10 Vs. 20 copies).
10 copy 50 copy
8/6/2019 RealTime PCR VS Traditional PCR
http://slidepdf.com/reader/full/realtime-pcr-vs-traditional-pcr 4/15
For Reference Only Page 4 of 15
PCR Phases:
To understand why end-point PCR is limiting, it is important to understandwhat happens during a PCR reaction.
A basic PCR run can be broken up into three phases:
· Exponential: Exact doubling of product is accumulating atevery cycle (assuming 100% reaction efficiency). Thereaction is very specific and precise.
· Linear (High Variability): The reaction components arebeing consumed, the reaction is slowing, and products arestarting to degrade.
· Plateau (End-Point: Gel detection for traditionalmethods): The reaction has stopped, no more productsare being made and if left long enough, the PCR productswill begin to degrade.
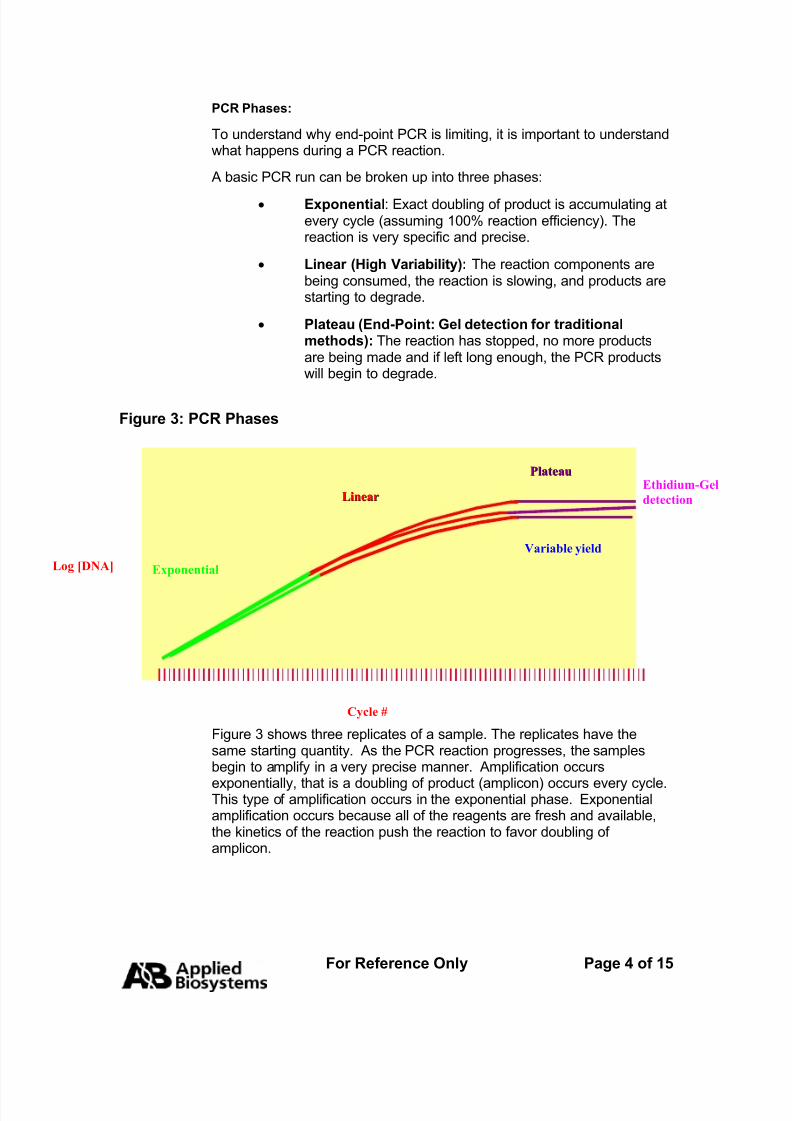
Figure 3: PCR Phases
Figure 3 shows three replicates of a sample. The replicates have thesame starting quantity. As the PCR reaction progresses, the samplesbegin to amplify in a very precise manner. Amplification occurs
exponentially, that is a doubling of product (amplicon) occurs every cycle.This type of amplification occurs in the exponential phase. Exponentialamplification occurs because all of the reagents are fresh and available,the kinetics of the reaction push the reaction to favor doubling of amplicon.
Log [DNA]
Cycle #
Exponential
PPllaatteeaauu
LLiinneeaarrEthidium-Gel
detection
Variable yield
8/6/2019 RealTime PCR VS Traditional PCR
http://slidepdf.com/reader/full/realtime-pcr-vs-traditional-pcr 5/15
For Reference Only Page 5 of 15
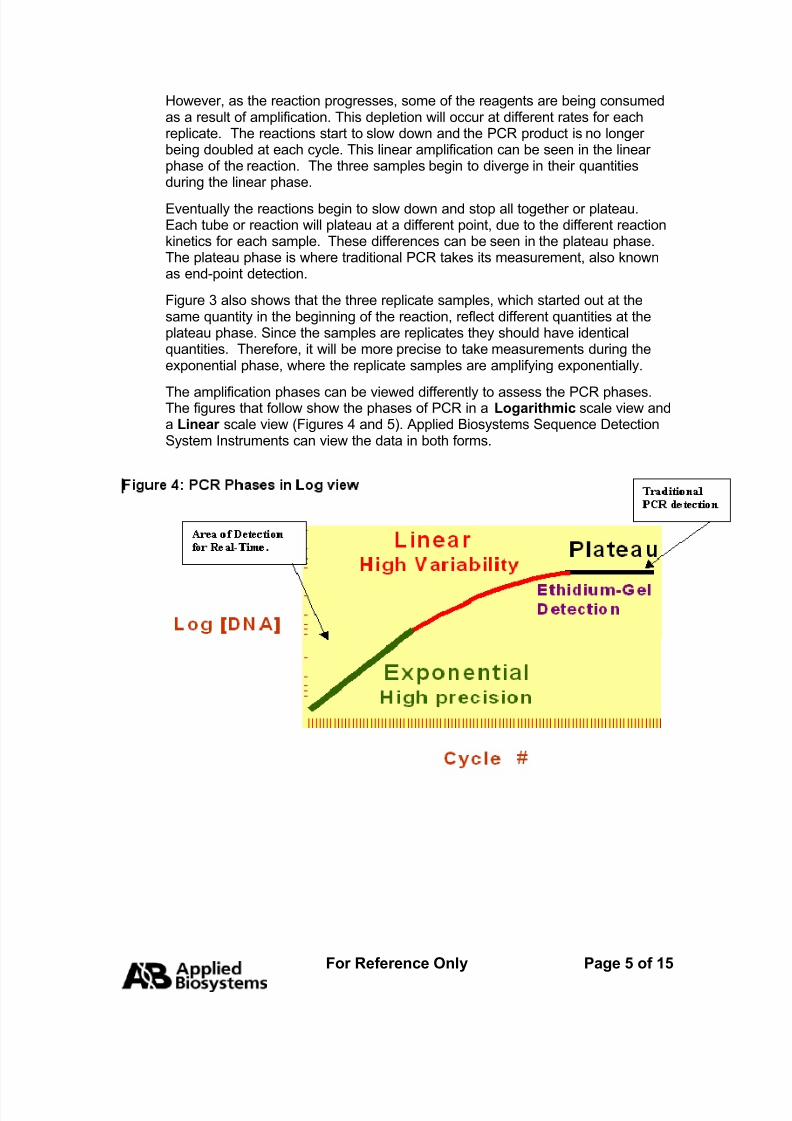
However, as the reaction progresses, some of the reagents are being consumedas a result of amplification. This depletion will occur at different rates for eachreplicate. The reactions start to slow down and the PCR product is no longer being doubled at each cycle. This linear amplification can be seen in the linear phase of the reaction. The three samples begin to diverge in their quantitiesduring the linear phase.
Eventually the reactions begin to slow down and stop all together or plateau.Each tube or reaction will plateau at a different point, due to the different reactionkinetics for each sample. These differences can be seen in the plateau phase.The plateau phase is where traditional PCR takes its measurement, also knownas end-point detection.
Figure 3 also shows that the three replicate samples, which started out at thesame quantity in the beginning of the reaction, reflect different quantities at theplateau phase. Since the samples are replicates they should have identicalquantities. Therefore, it will be more precise to take measurements during theexponential phase, where the replicate samples are amplifying exponentially.
The amplification phases can be viewed differently to assess the PCR phases.The figures that follow show the phases of PCR in a Logarithmic scale view anda Linear scale view (Figures 4 and 5). Applied Biosystems Sequence DetectionSystem Instruments can view the data in both forms.
8/6/2019 RealTime PCR VS Traditional PCR
http://slidepdf.com/reader/full/realtime-pcr-vs-traditional-pcr 6/15
For Reference Only Page 6 of 15
Problems with detection in the Plateau phase of PCR
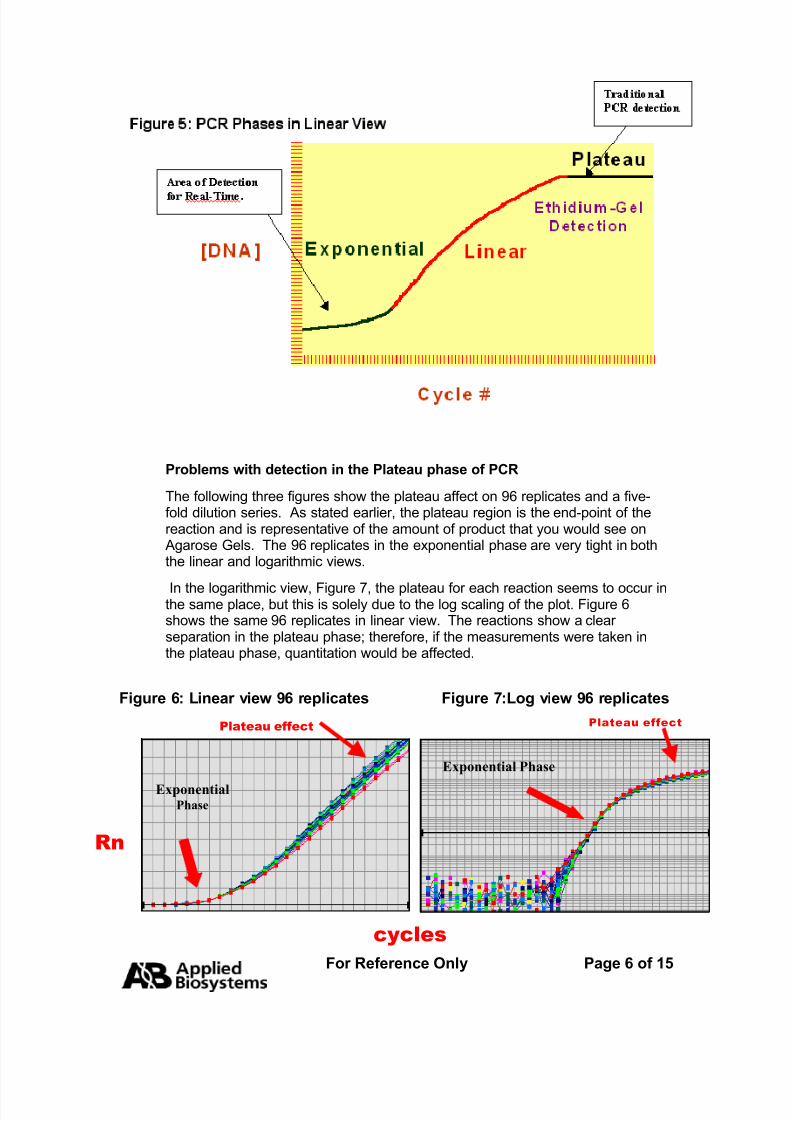
The following three figures show the plateau affect on 96 replicates and a five-fold dilution series. As stated earlier, the plateau region is the end-point of thereaction and is representative of the amount of product that you would see onAgarose Gels. The 96 replicates in the exponential phase are very tight in boththe linear and logarithmic views.
In the logarithmic view, Figure 7, the plateau for each reaction seems to occur inthe same place, but this is solely due to the log scaling of the plot. Figure 6shows the same 96 replicates in linear view. The reactions show a clear separation in the plateau phase; therefore, if the measurements were taken inthe plateau phase, quantitation would be affected.
Figure 6: Linear view 96 replicates Figure 7:Log view 96 replicates
Plateau effect
Exponential
Phase
ExponentialPhase
cycles
Exponential Phase
Plateau effect
Rn
8/6/2019 RealTime PCR VS Traditional PCR
http://slidepdf.com/reader/full/realtime-pcr-vs-traditional-pcr 7/15
For Reference Only Page 7 of 15
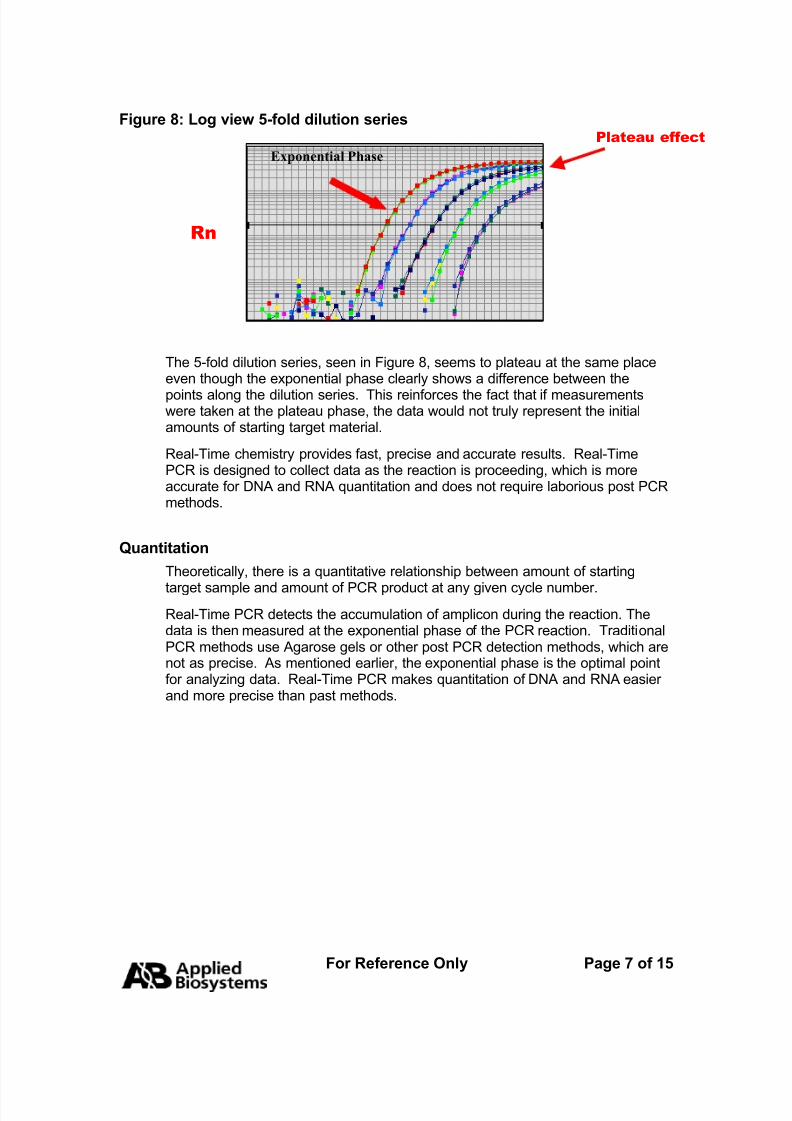
Figure 8: Log view 5-fold dilution series
The 5-fold dilution series, seen in Figure 8, seems to plateau at the same placeeven though the exponential phase clearly shows a difference between the
points along the dilution series. This reinforces the fact that if measurementswere taken at the plateau phase, the data would not truly represent the initialamounts of starting target material.
Real-Time chemistry provides fast, precise and accurate results. Real-TimePCR is designed to collect data as the reaction is proceeding, which is moreaccurate for DNA and RNA quantitation and does not require laborious post PCRmethods.
Quantitation
Theoretically, there is a quantitative relationship between amount of starting
target sample and amount of PCR product at any given cycle number.
Real-Time PCR detects the accumulation of amplicon during the reaction. Thedata is then measured at the exponential phase of the PCR reaction. TraditionalPCR methods use Agarose gels or other post PCR detection methods, which arenot as precise. As mentioned earlier, the exponential phase is the optimal pointfor analyzing data. Real-Time PCR makes quantitation of DNA and RNA easier and more precise than past methods.
Exponential Phase
Rn
Plateau effect
8/6/2019 RealTime PCR VS Traditional PCR
http://slidepdf.com/reader/full/realtime-pcr-vs-traditional-pcr 8/15
For Reference Only Page 8 of 15
The 5¢ Nuclease Assay
5¢ Nuclease Activity
AmpliTaq GoldÒ DNA Polymerase has 5¢ exo-nuclease activity. The 5¢
exo-nuclease activity of AmpliTaq® Polymerase and FRET (Fluorescent Resonant Energy Transfer ) makes it possible to detect PCR amplification
in Real-Time. The 5¢ exo-nuclease activity of the enzyme acts upon thesurface of the template to remove obstacles downstream of the growing
amplicon that may interfere with its’ generation. The 5¢ nuclease assayuses this activity in real time detection.
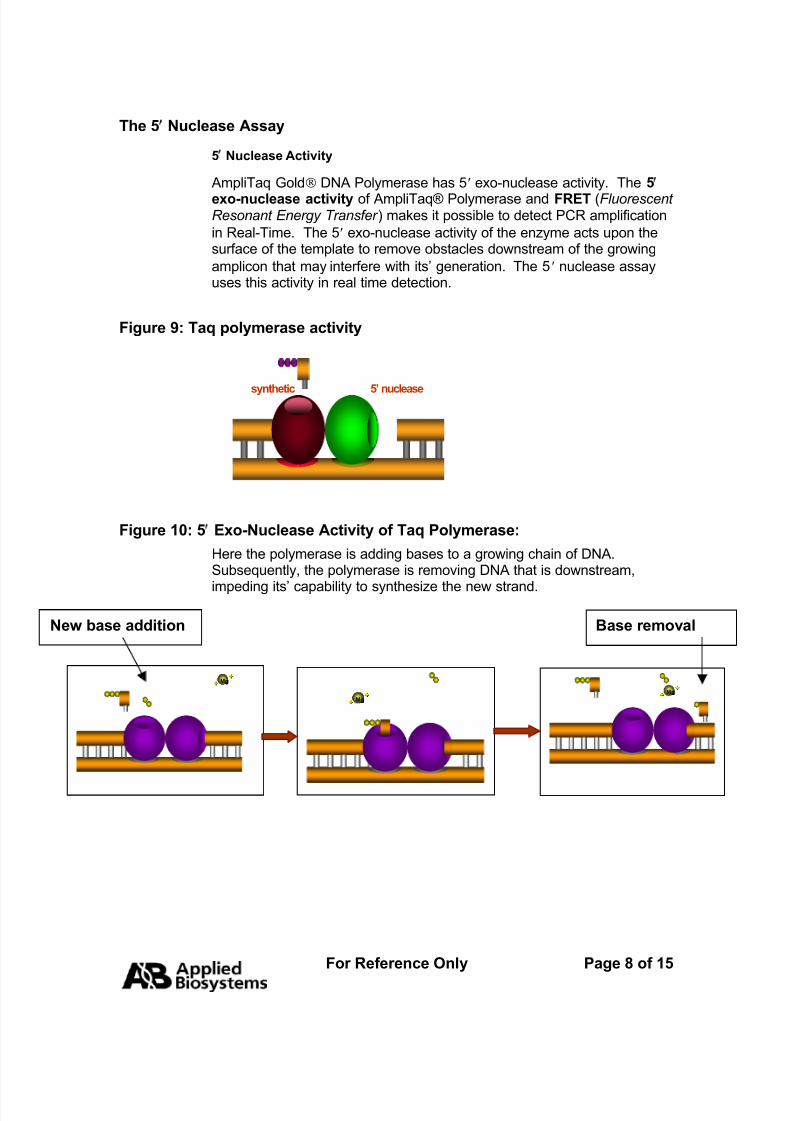
Figure 9: Taq polymerase activity
Figure 10: 5¢ Exo-Nuclease Activity of Taq Polymerase:
Here the polymerase is adding bases to a growing chain of DNA.Subsequently, the polymerase is removing DNA that is downstream,
impeding its’ capability to synthesize the new strand.
5’ nucleasesynthetic
New base addition Base removal
Mg++++
Mg++++
Mg++++
Mg++++
Mg++++
Mg++++
Mg++
++Mg
++++
Mg++
++
8/6/2019 RealTime PCR VS Traditional PCR
http://slidepdf.com/reader/full/realtime-pcr-vs-traditional-pcr 9/15
For Reference Only Page 9 of 15
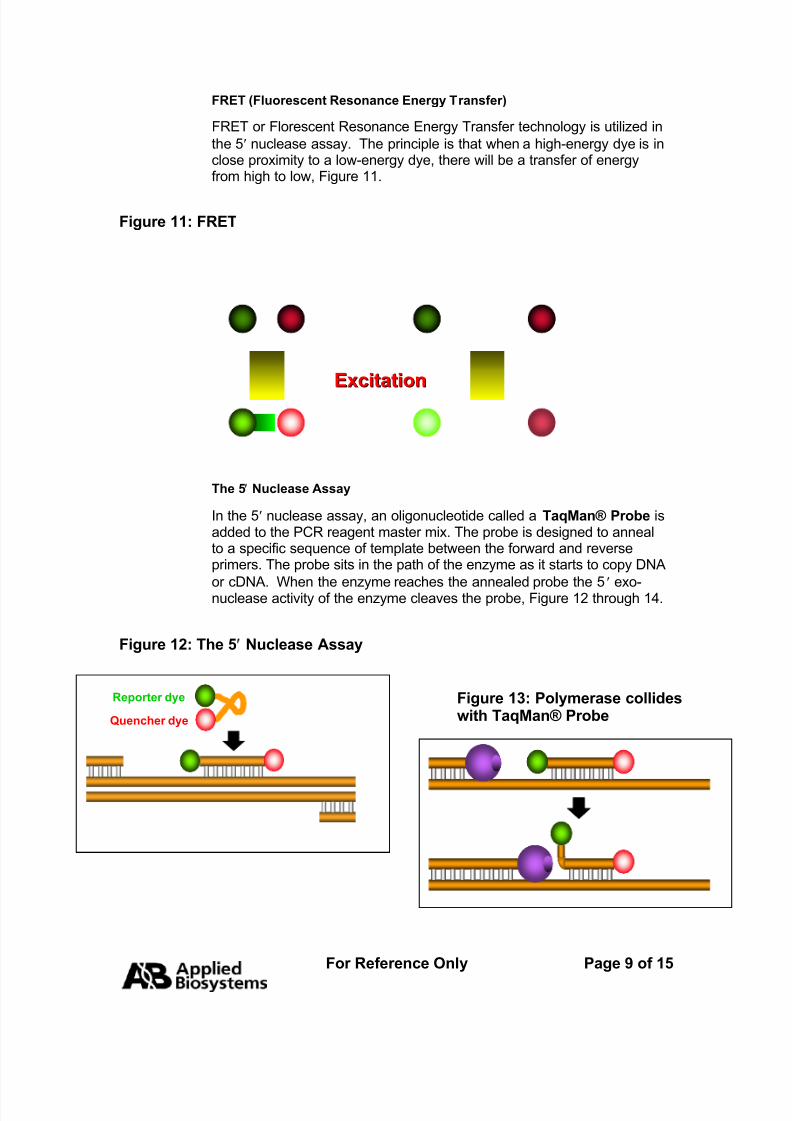
FRET (Fluorescent Resonance Energy Transfer)
FRET or Florescent Resonance Energy Transfer technology is utilized in
the 5¢ nuclease assay. The principle is that when a high-energy dye is inclose proximity to a low-energy dye, there will be a transfer of energyfrom high to low, Figure 11.
Figure 11: FRET
The 5¢ Nuclease Assay
In the 5¢ nuclease assay, an oligonucleotide called a TaqMan® Probe isadded to the PCR reagent master mix. The probe is designed to annealto a specific sequence of template between the forward and reverseprimers. The probe sits in the path of the enzyme as it starts to copy DNA
or cDNA. When the enzyme reaches the annealed probe the 5¢
exo-nuclease activity of the enzyme cleaves the probe, Figure 12 through 14.
Figure 12: The 5¢ Nuclease Assay
Excitation Excitation
Reporter dye
Quencher dye
Reporter dye
Quencher dye
Figure 13: Polymerase collideswith TaqMan® Probe
8/6/2019 RealTime PCR VS Traditional PCR
http://slidepdf.com/reader/full/realtime-pcr-vs-traditional-pcr 10/15
For Reference Only Page 10 of 15
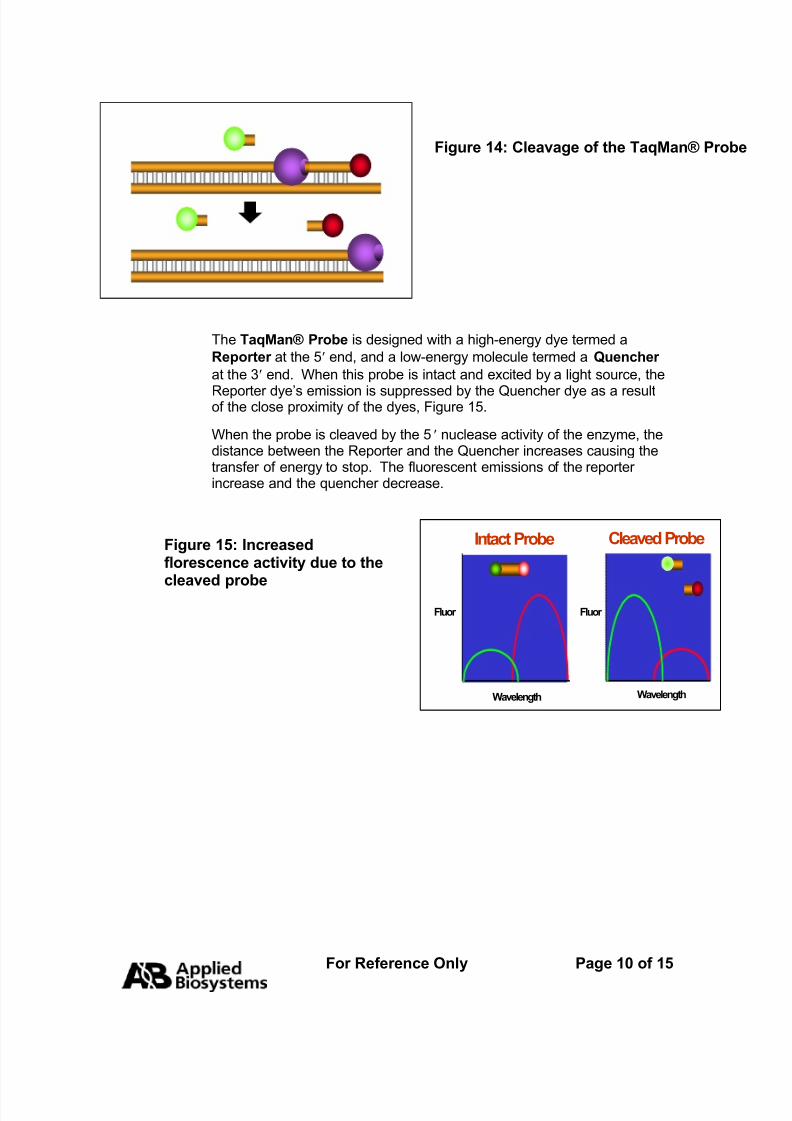
The TaqMan® Probe is designed with a high-energy dye termed a
Reporter at the 5¢ end, and a low-energy molecule termed a Quencher
at the 3¢ end. When this probe is intact and excited by a light source, the
Reporter dye’s emission is suppressed by the Quencher dye as a resultof the close proximity of the dyes, Figure 15.
When the probe is cleaved by the 5¢ nuclease activity of the enzyme, thedistance between the Reporter and the Quencher increases causing thetransfer of energy to stop. The fluorescent emissions of the reporter increase and the quencher decrease.
Figure 14: Cleavage of the TaqMan® Prob
Figure 15: Increasedflorescence activity due to thecleaved probe
Fluor
Wavelength
Fluor
Wavelength
Intact Probe Cleaved Probe
8/6/2019 RealTime PCR VS Traditional PCR
http://slidepdf.com/reader/full/realtime-pcr-vs-traditional-pcr 11/15
For Reference Only Page 11 of 15
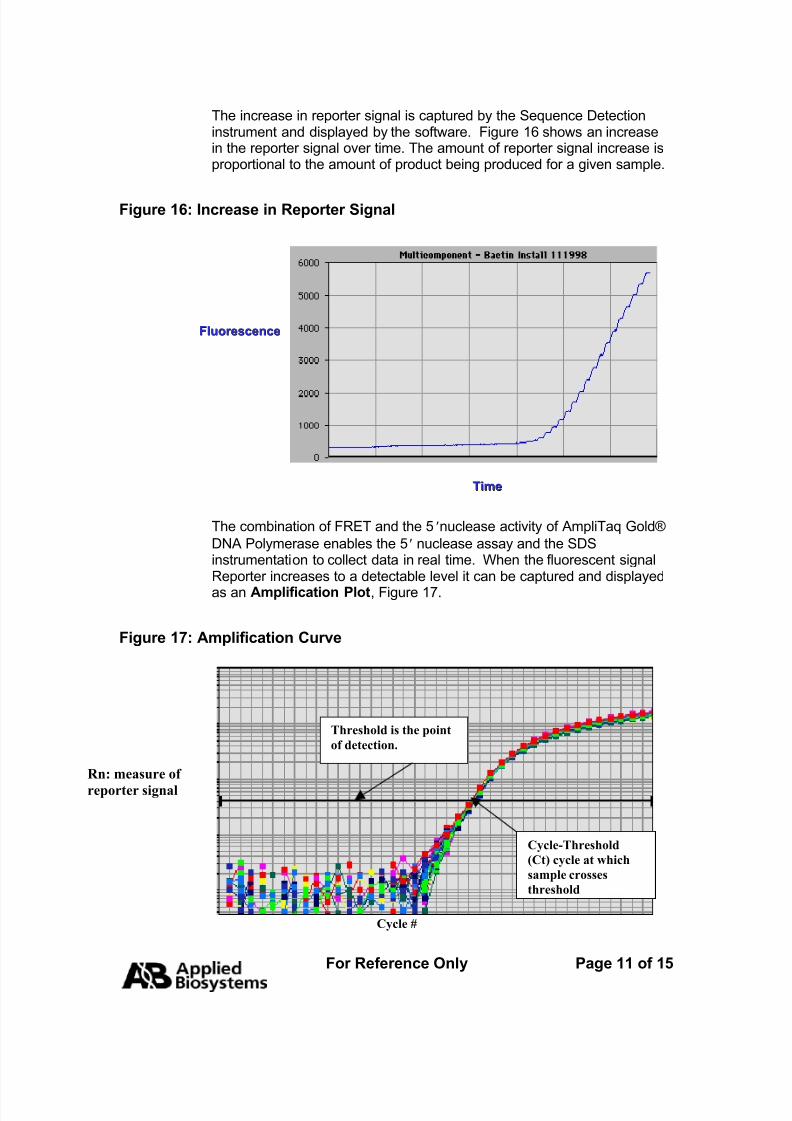
The increase in reporter signal is captured by the Sequence Detectioninstrument and displayed by the software. Figure 16 shows an increasein the reporter signal over time. The amount of reporter signal increase isproportional to the amount of product being produced for a given sample.
Figure 16: Increase in Reporter Signal
The combination of FRET and the 5¢nuclease activity of AmpliTaq Gold®
DNA Polymerase enables the 5¢ nuclease assay and the SDSinstrumentation to collect data in real time. When the fluorescent signalReporter increases to a detectable level it can be captured and displayed
as an Amplification Plot, Figure 17.
Figure 17: Amplification Curve
Cycle #
Rn: measure of
reporter signal
Threshold is the point
of detection.
Cycle-Threshold
(Ct) cycle at which
sample crosses
threshold
FluorescenceFluorescence
TimeTime
8/6/2019 RealTime PCR VS Traditional PCR
http://slidepdf.com/reader/full/realtime-pcr-vs-traditional-pcr 12/15
For Reference Only Page 12 of 15
The Amplification Plot contains valuable information for the quantitativemeasurement of DNA or RNA. The Threshold line is the level of detection or the point at which a reaction reaches a fluorescent intensityabove background. The threshold line is set in the exponential phase of the amplification for the most accurate reading. The cycle at which thesample reaches this level is called the Cycle Threshold, Ct. These two
values are very important for data analysis using the 5¢ nuclease assay.
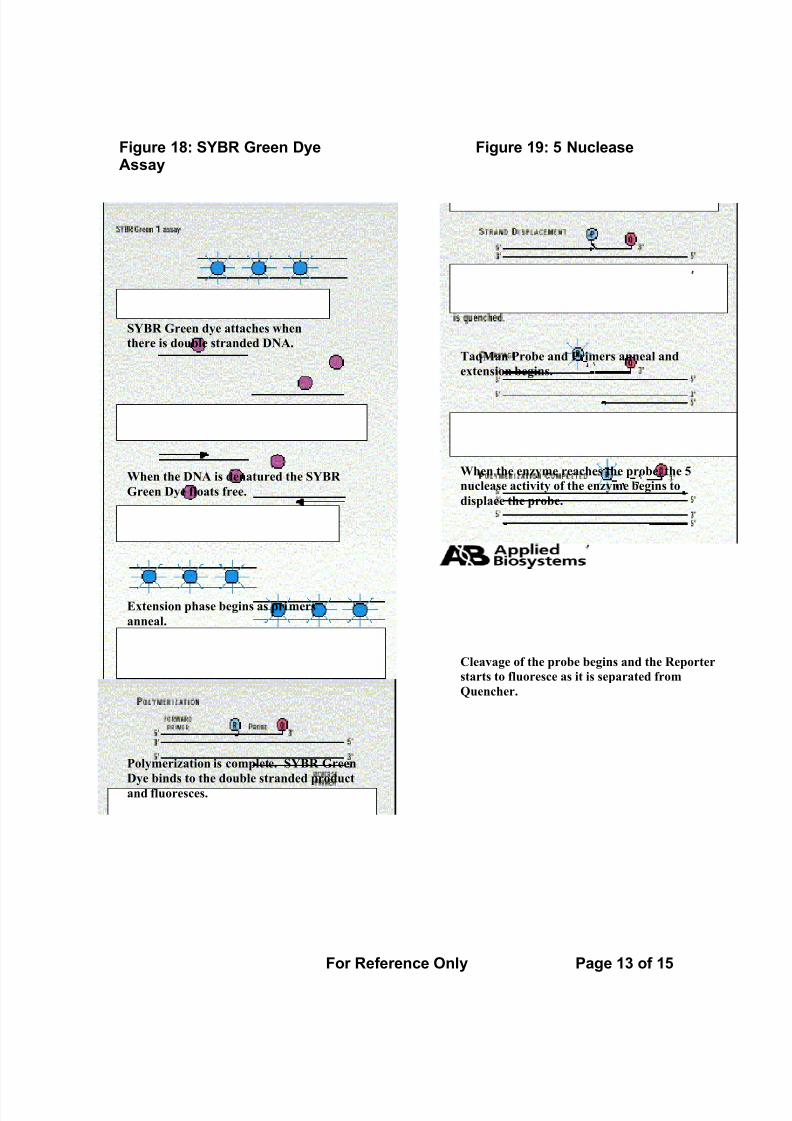
SYBR Green Dye
SYBR Green chemistry is an alternate method used to perform real-timePCR analysis. SYBR Green is a dye that binds the Minor Groove of double stranded DNA. When SYBR Green dye binds to double strandedDNA, the intensity of the fluorescent emissions increases. As moredouble stranded amplicons are produced, SYBR Green dye signal willincrease. Figures 18 & 19 show the entire process of each type of real-
time chemistry. SYBR Green dye will bind to any double stranded DNAmolecule, while the 5¢ Nuclease assay is specific to a pre-determinedtarget.
8/6/2019 RealTime PCR VS Traditional PCR
http://slidepdf.com/reader/full/realtime-pcr-vs-traditional-pcr 13/15
For Reference Only Page 13 of 15
Figure 18: SYBR Green Dye Figure 19: 5¢NucleaseAssay
SYBR Green dye attaches when
there is double stranded DNA.
When the DNA is denatured the SYBR
Green Dye floats free.
Extension phase begins as primers
anneal.
Polymerization is complete. SYBR Green
Dye binds to the double stranded product
and fluoresces.
TaqMan Probe and Primers anneal and
extension begins.
When the enzyme reaches the probe, the 5¢
nuclease activity of the enzyme begins to
displace the probe.
Cleavage of the probe begins and the Reporter
starts to fluoresce as it is separated from
Quencher.
8/6/2019 RealTime PCR VS Traditional PCR
http://slidepdf.com/reader/full/realtime-pcr-vs-traditional-pcr 14/15
For Reference Only Page 14 of 15
Real-Time PCR Applications
Real-Time PCR can be applied to traditional PCR applications as well asnew applications that would have been less effective with traditional PCR.With the ability to collect data in the exponential growth phase, the power of PCR has been expanded into applications such as:
· Viral Quantitation
· Quantitation of Gene Expression
· Array Verification
· Drug Therapy Efficacy
· DNA Damage measurement
· Quality Control and Assay Validation
· Pathogen detection
· Genotyping
Summary
Advantages of using Real-Time PCR:
· Traditional PCR is measured at End-Point (plateau), while Real-Time PCR collects data in the exponential growth phase
· An increase in Reporter fluorescent signal is directly proportionalto the number of amplicons generated
· The cleaved probe provides a permanent record amplification of an Amplicon
· Increase dynamic range of detection
· No-post PCR processing
· Detection is capable down to a 2-fold change
8/6/2019 RealTime PCR VS Traditional PCR
http://slidepdf.com/reader/full/realtime-pcr-vs-traditional-pcr 15/15
For Reference Only Page 15 of 15
For Research Use Only. Not for use in diagnostic procedures.
Practice of the patented polymerase chain reaction (PCR) process requires a license.
The PCR process and 5’ nuclease process are covered by patents owned by Roche Molecular Systems, Inc. and F. Hoffmann-La Roche Ltd.
Applied Biosystems is a registered trademark and the AB design and Applera are trademarks of
Applera Corporation or its subsidiaries in the US and other countries.
AmpliTaq Gold and TaqMan are registered trademarks of Roche Molecular Systems inc.
SYBR Green is a registered trademark of Molecular Probes, Inc.