Embed Size (px)
DESCRIPTION
Troubleshooting and Rectification of a C3 Splitter Tower
Citation preview
Page 1
Troubleshooting and Rectification of a Giant C3 Splitter Tower
Problem
Part 1: Troubleshooting
Henry Z. Kister, Fluor, Aliso Viejo, CA
Brian Clancy-Jundt and Randy Miller, PetroLogistics Corp., Houston, Texas
and
Daniel R. Summers, Sulzer Chemtech USA, Inc., Tulsa, OK
Presented at the Distillation Topical Conference, AIChE Spring Meeting, New Orleans, Louisiana, March 30 - April 3, 2014
UNPUBLISHED Copyright 2014 Henry Z. Kister, Fluor, Brian Clancy-Jundt, Randy Miller, and Daniel R. Summers. The AIChE shall not be responsible for statements or opinions contained in its publications.

Page 2
Troubleshooting and Rectification of a Giant C3 Splitter Tower Problem Part 1: Troubleshooting By Henry Z. Kister, Fluor, Aliso Viejo, CA, Brian Clancy-Jundt and Randy Miller, PetroLogistics Corp., Houston, Texas, and Daniel R. Summers, Sulzer Chemtech USA, Tulsa, OK Summary The PetroLogistics Propylene Dehydrogenation Unit (PDH) 28 feet ID C3 Splitter started up in October 2010 and experienced low tray efficiencies and premature flooding in its first year of operation. Due to the low tray efficiency it could not produce on-spec polymer grade propylene. PetroLogistics, Fluor (who was not involved in the tower design), and Sulzer formed a taskforce to conduct a troubleshooting investigation to determine the root cause of the poor performance and to propose a fix. Our troubleshooting investigation combined hydraulic analysis and detailed multipass distribution calculations with the specialized technique of multichordal gamma scanning with quantitative analysis7. The hydraulic analysis and multipass calculations did not identify a reason for the low tray efficiencies, but confirmed that the trays are prone to channeling and maldistribution due to their large open areas. The gamma scans showed a maldistributed pattern on the trays, with high L/V ratios on the inside panels and low L/V ratios on the outside panels. The scans showed vapor cross flow channeling (VCFC) on the outside panels. Flooding was observed on the inside panels well below the calculated flood point. The scans pointed at a combination of VCFC and multipass maldistribution as the root cause. Our investigation identified the open slot area (15% of the active area) of the fixed valves to be the prime factor inducing the channeling and maldistribution. A likely initiator of the multipass maldistribution was liquid preferentially flowing to the inside panels from the false downcomers distributing the flashing reflux to the top tray’s panels. This preferential flow is believed to have occurred through the gap at which the reflux pipes entered the false downcomers. The high ratios of flow path length to tray spacing (2.4 to 3.7), high weir loads, and integral trusses projecting a significant depth (4”) into the vapor space were other conditions that promoted the channeling. To the best of our knowledge, this is the very first time that field measurements demonstrated interaction between VCFC with the inside-to-outside-pass maldistribution. A lesson learnt is that this interaction must be considered when designing and operating large-diameter towers. Finally, our investigation highlights that excessive open areas render trays prone to channeling and maldistribution, especially in large diameter towers containing multipass trays.

Page 3
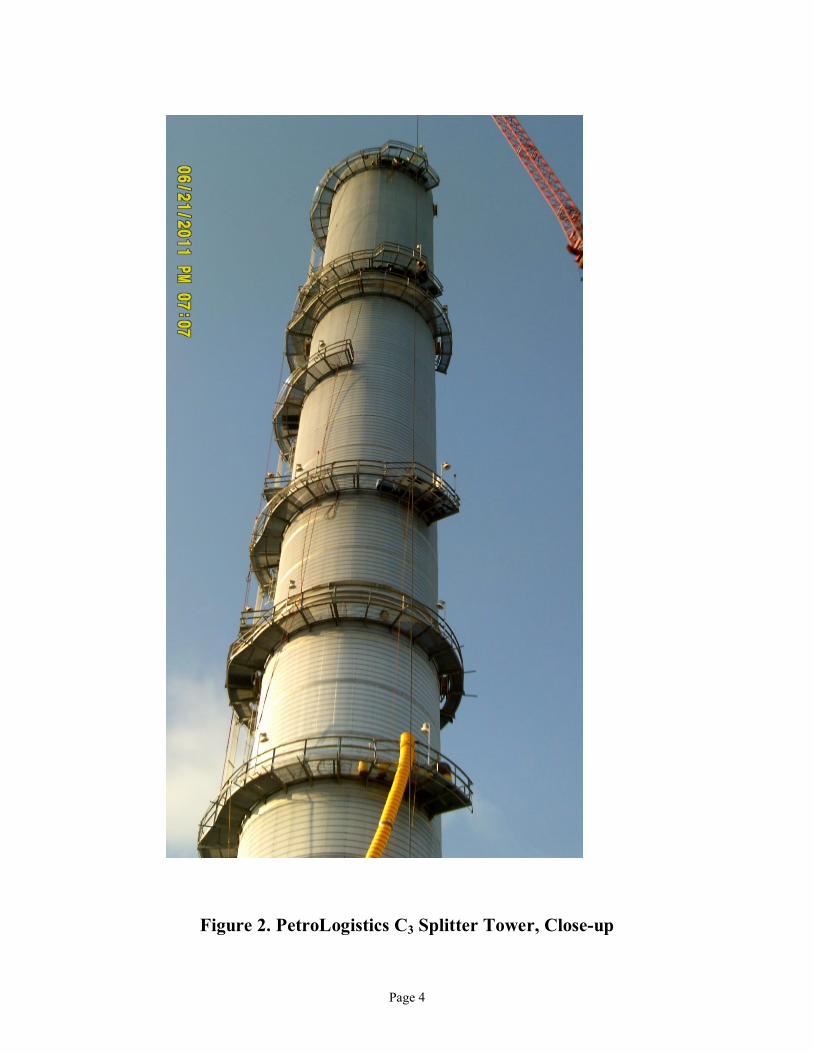
Background The PetroLogistics giant C3 Splitter (Fig. 1 and 2) is a heat-pumped 28 ft ID tower operating at 105 psig at the top. The tower contains 4-pass equal-bubbling-area Sulzer MVG™ fixed valve trays with mod-arc downcomers (MOAD’s) on the outside panels. Open area on the trays was 15% of the active area.
Figure 1. PetroLogistics C3 Splitter Tower, Overall view
Page 4
Figure 2. PetroLogistics C3 Splitter Tower, Close-up

Page 5
The tower started up in October 2010 and had experienced operational difficulties during its initial 8-months run. The tower had difficulty making on-spec polymer grade propylene. Tray efficiency appeared to be very low, about 40-50%, compared to a typical 80 - 90% tray efficiency experienced with conventional trays in a C3 Splitter. The separation did not improve (if anything, it had gotten worse) upon turndown. Initial gamma scans through the center panels indicated flooding. To investigate and solve the problem, a troubleshooting task force was formed comprising of representatives from PetroLogistics, Fluor, and Sulzer. The strategy was to conduct a field investigation aimed at identifying possible root causes to the operation difficulties, and proposing a fix. The PetroLogistics expertise in operating the C3 Splitter was combined with other specialty resources. Fluor, who was not involved in the tower design, but has extensive experience in distillation design and troubleshooting, was requested to assist with investigating the root cause of the poor performance and with engineering the fix. Sulzer’s expertise in tray design, evaluation, and modification was crucial to the modifications and improvement. Tracerco was later brought in to provide diagnostic expertise in anticipation of extensive use of gamma scanning in identifying the root cause. Together, the task force identified the root cause and came up with an effective fix that solved the problem. Part 1 of our paper describes the troubleshooting investigation. Part 2 will focus on the rectification of the tower problem based on the troubleshooting diagnosis.
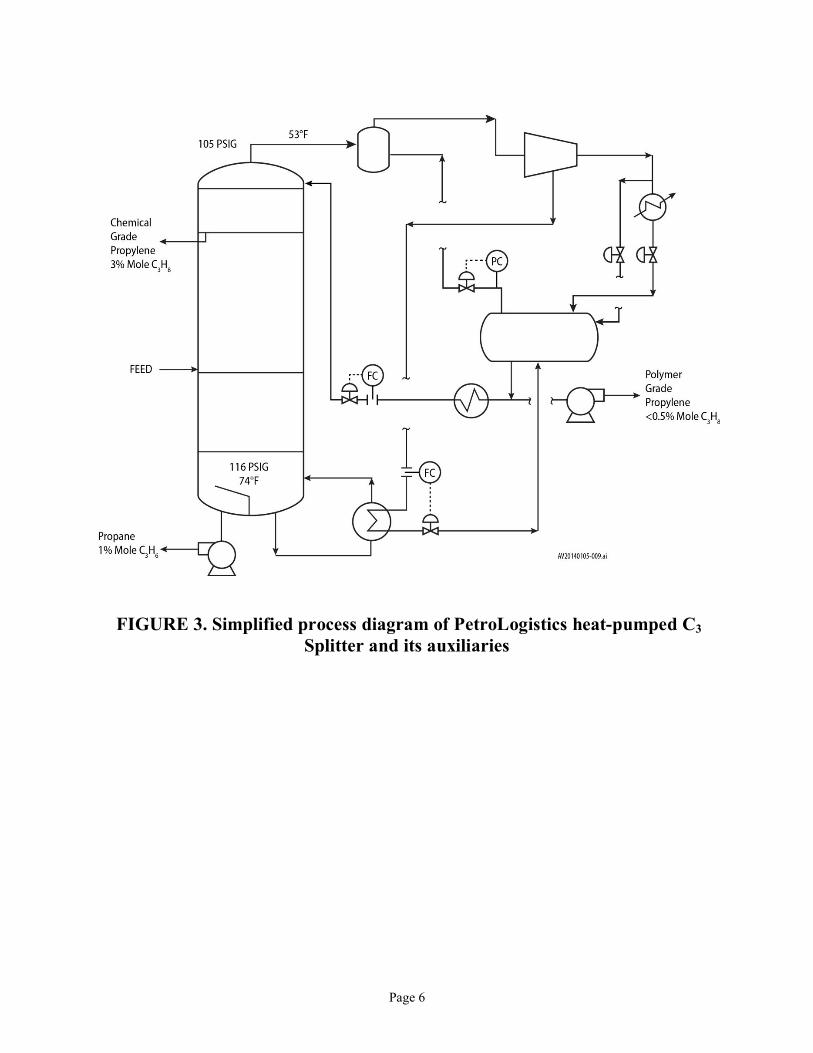
PART 1 TROUBLESHOOTING Hydraulic Evaluation at Initial Operating Conditions Fig. 3 is a simplified process sketch of the C3 Splitter tower and its auxiliaries. Data for typical initial operation were collected at the highest rates at which operation was stable, about 20-30% below the design. There is uncertainty about the reflux flow rate due to a metering error that plagued the reflux meter. The propylene product contained 3.4% propane (by mole) compared to 0.5% design. The propylene content of the bottom stream was a little higher than the design. The tower temperatures and pressures were similar to the design. There was a question whether the trays in the tower were flooding or not. A typical pressure drop for good operation is normally about 0.1 psi per tray, while pressure drops of 0.2 psi per tray indicates flooding. For the C3 Splitter the pressure drop per tray at the operating conditions was about 0.09 psi per tray, which argues against flood. In contrast, the gamma scans concluded that many of the trays were flooded. There was a need to reconcile the two conflicting observations. To determine whether the tower was flooded, a plot of the measured tower pressure drop against the tower internal vapor traffic was prepared (Fig. 4). The internal vapor traffic is approximately the sum of the reflux and product meters. A point of inflection in such a curve indicates the vapor load at which liquid begins to accumulate in the tower, and is a good indicator of flood(1).
Page 6
FIGURE 3. Simplified process diagram of PetroLogistics heat-pumped C3 Splitter and its auxiliaries

Page 7
Figure 4 C3 Splitter pressure drop vs. internal vapor load from plant operating data In Fig. 4, the upper curve is for the entire tower, the lower curve is for the trays between the propylene side draw and the feed. Both curves show a point of inflection at vapor traffic just above 2000 MPH, or a total tower pressure drop of 13.5 -14 psi. This suggests that at the initial operating loads in the tower were right at incipient flooding. While some flooding could have started earlier, the significant accumulation of liquid started above these loads. With the loads at which flooding initiated in the tower shown to be well below the design loads, it was concluded that the flooding was premature. A simulation was prepared based on the operating conditions on 12/31/2010. Vapor and liquid loadings from that simulation provided the basis for hydraulic calculations. Table 1 shows the results of these hydraulic calculations. Fluor’s values are more conservative than Sulzer’s, but even Fluor’s calculations do not indicate proximity to any flood limits. This analysis verified the conclusion that the flood observed in the tower was premature.
Page 8
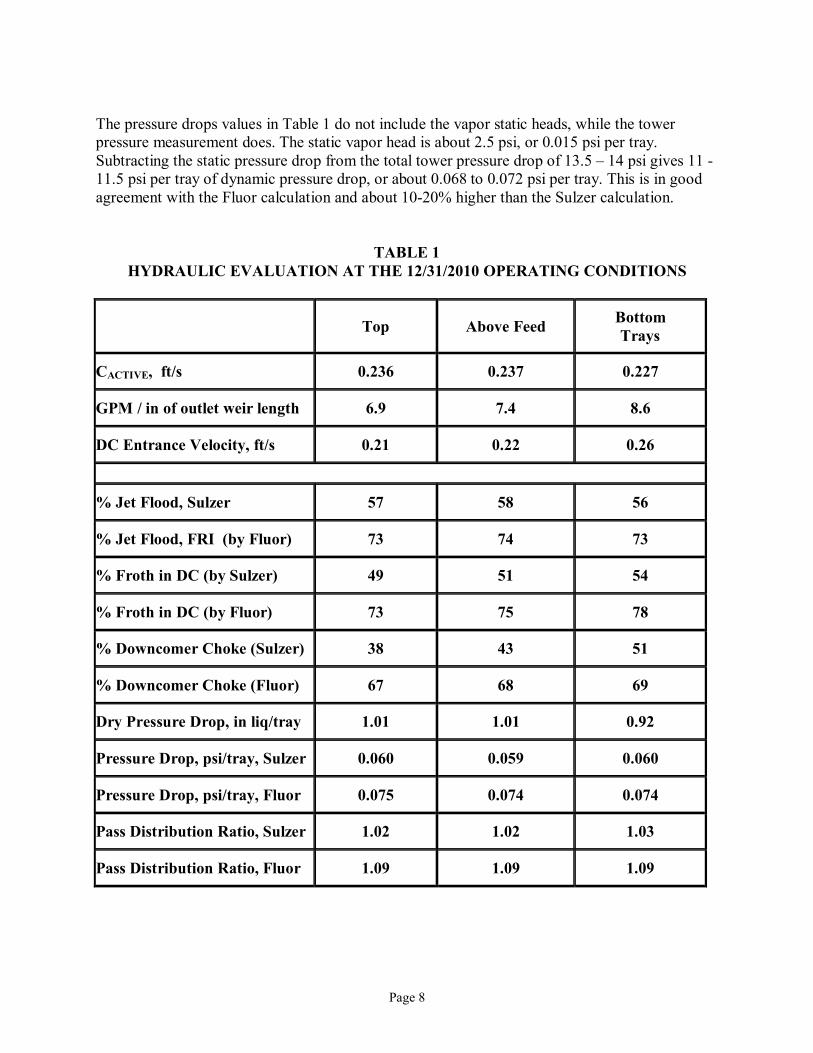
The pressure drops values in Table 1 do not include the vapor static heads, while the tower pressure measurement does. The static vapor head is about 2.5 psi, or 0.015 psi per tray. Subtracting the static pressure drop from the total tower pressure drop of 13.5 – 14 psi gives 11 -11.5 psi per tray of dynamic pressure drop, or about 0.068 to 0.072 psi per tray. This is in good agreement with the Fluor calculation and about 10-20% higher than the Sulzer calculation.
TABLE 1 HYDRAULIC EVALUATION AT THE 12/31/2010 OPERATING CONDITIONS
Top Above Feed Bottom Trays
CACTIVE, ft/s 0.236 0.237 0.227
GPM / in of outlet weir length 6.9 7.4 8.6
DC Entrance Velocity, ft/s 0.21 0.22 0.26
% Jet Flood, Sulzer 57 58 56
% Jet Flood, FRI (by Fluor) 73 74 73
% Froth in DC (by Sulzer) 49 51 54
% Froth in DC (by Fluor) 73 75 78
% Downcomer Choke (Sulzer) 38 43 51
% Downcomer Choke (Fluor) 67 68 69
Dry Pressure Drop, in liq/tray 1.01 1.01 0.92
Pressure Drop, psi/tray, Sulzer 0.060 0.059 0.060
Pressure Drop, psi/tray, Fluor 0.075 0.074 0.074
Pass Distribution Ratio, Sulzer 1.02 1.02 1.03
Pass Distribution Ratio, Fluor 1.09 1.09 1.09
Page 9
Overall, the main issues identified in the tower were low tray efficiencies and premature flooding. Possible Theories Several theories were advanced for the low efficiency and premature flood. The task force performed a preliminary review of the theories to guide the field tests required to narrow in on the root cause. The following alternative theories were proposed:
1. Multi-pass trays maldistribution.
The non-symmetry of multi-pass trays makes them prone to maldistribution. In four-pass trays, the inside panels are non-symmetrical to the outside panels. For good performance, the L/V ratio needs to be the same for the inside and outside panels. Maldistribution among the panels of multi-pass trays is a common source of tray efficiency loss(3, 11-14). Lockett and Billingham(14) show that the efficiency loss depends on the degree of L/V unevenness, as well as the proximity of the pinch.
Variations in the L/V ratio from pass to pass also adversely affect tray capacity. Regions where maldistribution increases the vapor or liquid loads are pushed closer to flooding, while other regions where the loads are reduced have surplus capacity.
Bolles(12) defined the distribution ratio Φ as the ratio of the maximum pass L/V to the minimum pass L/V, and recommended keeping this distribution ratio below 1.2 to ascertain good tray efficiency. Summers(11) tightened Bolles’ criterion to 1.1. Summers’ stricter criterion also keeps the loss of capacity due to maldistribution minimal(3).
To address this theory, we applied the Kister et. al.(3) and the Summers(11) multi-pass maldistribution models. These models are among the most advanced and most reliable in the industry. Table 1 shows that both the Fluor calculation (using the Kister et. al. method) and the Sulzer calculation (using the Summers method) were in good agreement, and both gave distribution ratios below the stringent value of 1.1 maximum. There were some concerns that with MOAD’s, it would be difficult to adequately model the outlet weir length, flow path length, and hydraulic gradient. We therefore reran the models with several variations. All showed that the distribution ratios for trays in this tower were robust to changes in these parameters and remained small. There was nothing in the calculations that would explain the observed large drop in tray efficiency and severe premature flooding.
Pros: Large maldistribution would explain the efficiency loss and premature flooding.
Cons: Hydraulic calculations showed low distribution ratios. The calculations verified that by itself this theory cannot explain the observations.

Page 10
The theory of pass maldistribution was regarded unlikely, but it may be combined with other theories.
2. Channeling combined with multi-pass maldistribution. The large open slot areas (15% of the active areas), provided as part of the original design to keep pressure drop low for the heat pump system, can render trays prone to various forms of channeling such as vapor cross flow channeling (VCFC) at the high liquid loadings. High ratios of flow path length to tray spacing (2.4 to 3.7), high weir loads (7- 9 gpm/inch of outlet weir) and integral trusses projecting a significant depth (4 inches) into the vapor space, are conditions that when they come together with high open areas lead to VCFC(2). VCFC is not the only form of channeling previously experienced on distillation trays. There are reports(7) of other forms of channeling, such as due to excessive forward push (reverse vapor cross flow channeling, RVCFC) or due to vapor maldistribution. One thing they have in common is that they were only experienced at large tray open areas, high ratios of flow path lengths to tray spacing, and high liquid loads, conditions that apply also for the current trays. In multi-pass trays, channeling is likely to interact with the split of vapor and liquid between the passes, generating or aggravating inside-to-outside-pass maldistribution. The large open slot area is also conducive to maldistribution between passes in multi-pass trays(3, 15). Pros: This theory explains the premature flooding. This theory also agrees with the observation of efficiency loss without apparent flooding below 13.5 to 14 psi pressure drop. This theory explains the inability to operate at lower loads. Cons: No experiences have been previously reported of interaction between tray channeling and multi-pass maldistribution. This theory leaves unanswered questions regarding the nature of the channeling and its propagation, and these needed to be investigated in the test program. This became by far the leading theory, even though at this point the details were not understood.
3. Downcomer unsealing Downcomer unsealing was argued to be caused by vapor entering the off-center and center downcomers via large gaps where the supports go through the downcomers. This theory can combine with channeling on the trays. Pros: This theory explains the premature flooding and low efficiencies. Cons: Hydraulic calculations showed that to lose the downcomer seal it would take a gap about 1 square foot in area, so if the gaps were properly welded this is unlikely. The trays were thoroughly inspected, and no gaps were seen, let alone gaps of this magnitude. This theory was therefore regarded highly unlikely.

Page 11
4. Excessive hydraulic loads and poor metering Excessive reflux and boilup rates due to incorrect metering can overload and flood the trays, giving low efficiencies. Pros: Metering problems have caused poor operation in many towers, and there is such a case reported for a C3 Splitter(4). In the current tower, the reflux flow was measured by an annubarTM with no independent check. There is a meter on the heat pump compressed gas, but that meter was bad. Reliability problems had been experienced with annubars in the past, but their manufacturers claim higher reliability for recent models. Pros: This theory explains the premature flood and low efficiencies. Cons: The annubar was checked and rechecked several times. While the compressed gas meter was working, a check found the annubar measurement to be within 1% of the value inferred from the compressed gas meter. During a crash shutdown the gas meter was fixed, and again verified the reflux measurement. Also, the annubar needed to be out by quite a factor to explain the observed poor performance. This theory does not explain the inability to operate at lower rates and the poor operation below flood. This theory was therefore regarded highly unlikely.
5. Foaming Foaming is known to induce premature flood. Pros: It explains the premature flood. Also, some of the gamma scan reports mentioned the possibility of foaming. Cons: We are not aware of any foaming cases in C3 Splitters. Our survey of tower failures reported in the literature(4) does not include a single case of foaming in a C3 Splitter. This theory does not explain the poor efficiencies at low rates and below flood. The tower feed does not appear to contain foaming components in significant concentration. This theory was therefore regarded highly unlikely.
6. Damage Damage may possibly induce premature flood. Pros: It explains the premature flood. Although uncommon, tray damage incidents may occur in heat-pumped C3 Splitters. The heat pump starts up at near full rates, which renders the tower startup bumpy. At startup, base liquid level is sometimes raised above the reboiler return inlet in anticipation of rapid boiling upon heat pump startup. Generally, base liquid level rise above the reboiler return inlet is a common cause

Page 12
of tray damage, as the reboiler vapor tends to travel through the liquid as slugs that can uplift trays(1). Cons: In C3 Splitters, the potential for slug formation is relatively low due to the small reboiler temperature difference; as the liquid head above the reboiler rises, so does the boiling point, reducing the reboiler temperature difference and the boiling rate. Other sources of damage may be rapid pressuring or depressuring. We have not seen this kind of damage in C3 Splitters. The huge volume in this tower is likely to cushion the tower from this mechanism. Also, the high open area and low dry pressure permit easy spread of vapor. Another source of damage is flow-induced vibrations(5). This kind of damage tends to occur near weeping, which may be the case here due to the high open area. However, vibrations can be felt, heard and measured. Also, Sulzer who have expertise in this type of damage and wrote the paper cited here, closely examined this possibility and determined that it is unlikely in this tower. Another argument against tray damage is that the top to bottom gamma scans did not show any severe local variations. Usually damage shows local flooding or disturbance (e.g., if high liquid level damage, near the bottom). In contrast, in the C3 Splitter, the problem appears to initiate in every column section. In the top-to-bottom scans, almost clear vapor was reached near each manhole, but the section above showed much the same pattern as the section below. The damage theory was therefore regarded unlikely.
7. Unbolted Manways Unbolted manways is likely to induce channeling and premature flood. Pros: It agrees with the premature flood. Manways not installed, or poorly bolted (and therefore lifted), are common issues in all towers. The number of manways in this tower is well above 1000. This is the largest number of manways we have seen in a single tower, and a huge number to be bolted up prior to startup. We often see people leaving manways unbolted in a 20-tray single pass tower! If all, or even some, of the manways at the center panels were left unbolted, vapor would be channeled into the unbolted region, initiating poor efficiency and possible flooding. Cons: The installers swore that all manways were bolted adequately. PetroLogistics personnel were well aware of the risk and very closely inspected the manways installation. They too were sure that all, or at least almost all, the manways were properly installed. The gamma scans show a consistent phenomenon throughout the tower. This pattern may be consistent with unbolted manways throughout the tower. Just a few unbolted manways are unlikely to produce the scanning pattern observed.
Page 13
The unbolted manways theory was therefore regarded unlikely. Likely Theory In summary, the channeling/maldistribution theory towered high above the others. However, the nature of the channeling and/or maldistribution remained poorly defined. Gamma Scans Investigation To diagnose the nature of the suspected channeling or maldistribution, and to implement an effective fix, we performed extensive multi-chordal gamma scans together with quantitative analysis of the gamma scans. The gamma scanning technique normally practiced for distillation trays shoots a single chord, or at most one chord per panel, with qualitative interpretation. Often downcomer chords are also shot. The early gamma scans of the C3 splitter used this technique. This simple technique is excellent for detecting gross abnormalities such as flooding, missing trays, foaming, fouling, and high base levels, but is unable to detect subtle abnormalities such as channeling, abnormal froth structure, and blow-by in unsealed downcomers. For the C3 splitter, the early qualitative gamma scans established that the inside active areas were flooded. Center and off-center downcomers were flooded in some scans, not flooded in others. This tied up well with the conclusion based on Fig. 4 that the trays were at incipient flood at the operating rates. To identify more subtle abnormalities, multi-chordal gamma scans with quantitative analysis is invaluable. This technique, seldom applied by gamma scan vendors due to its high costs, was first proposed by Harrison(6), and later developed by Kister(7). The lead author has used it with great success to diagnose a multitude of subtle abnormalities on trays including various modes of channeling, abnormal froth structure, blow-by in unsealed downcomers, and many others. This technique requires top-quality multi-chordal scans of each tray panel. Froth heights, froth densities, clear liquid heights, and hydraulic gradients can be calculated as described in references 7 and 8. Initial multi-chordal scans confirmed presence of channeling both on the outside and inside active areas of the trays. The scans showed a similar and quite uniform channeling pattern throughout the tower. There were no signs of unbolted manways. The uniformity of the channeling pattern throughout the tower made it possible to focus on a relatively small section, map it in detail, and use this section to represent most of the tower. This “mapping” provided a cost effective way of gaining a concise definition of the nature of the channeling. The costs of multi-chordal scanning with quantitative analysis rapidly escalate with the number of trays scanned and the number of chords per tray. The small section “mapping” permitted shooting a large number of chords per tray to give a good definition of the channeling while keeping the costs down by limiting the number of trays scanned.

Page 14
In this “mapping” study, five chords were shot on the inside eastern panels, another five chords on the inside western panels, and three more chords on the outside western panels (Fig. 5). The spacing between any two successive inside panel chords was about 6 inches, and their locations were chosen to minimize interference from the support trusses (also shown on Fig. 5). Spacing between successive outside chords was 23 to 29 inches. Two of the three outside chords passed through the mod arc downcomers (MOAD’s). These MOAD’s are marked as dashed lines on Fig.5 (extending to 63” from the tower end). For each of these chords, froth heights, froth densities, entrainment indexes, and clear liquid heights were calculated. Due to scan quality issues, some chords needed re-shooting to verify repeatability. Quantitative Analysis of Gamma Scans: Results Fig. 6 shows the results derived from the multi-chordal gamma scans of the active areas. As described in Reference 7, these results are shown on “Kistergrams”, which are tray sketches drawn to scale with the various measurements also shown to-scale on these diagrams. As such, they give a visualization of the key hydraulic parameters. The quantitative interpretation required several estimates. In the interpretation, allowance was made for variation in chord length and, where relevant, for the liquid in the mod arc downcomer above the outside even numbered panels. No allowance was made for the radiation absorption by the support trusses above the odd numbered trays, but these trusses are shown on Fig. 6 and where relevant were considered in the interpretation. Also, the chords were chosen in a manner that minimizes interference of the beams with the measurements. Even though the numbers on Fig. 6 are not accurate, the inferred trends are quite independent of the estimates and are therefore real and valid. Fig. 6 shows the results only for the western half of the tower. The results from the eastern and western inside panels were very similar to each other. From left to right on each diagram (west to east in the tower) are the side downcomers, the outside panels, the off-center downcomers, the inside active areas, and finally the center downcomers. Each sketch terminates just to the right (just east of) the center downcomer.

Page 15
Figure 5 Chords used for the mapping gamma scan study Figure 6a shows the froth densities (using 1.0 for pure liquid propane/propylene, 0 for pure vapor). The values plotted were obtained by numerical integration of the gamma scan transmission vs. height above the tray for each scan chord(7) and are drawn on a scale of 0 to 0.5, so that a point on the tray above means a froth density of 0.5, i.e., 50% liquid and 50% vapor by volume. On this diagram, blue shading indicates high froth density, red shading low froth density. A high froth density generally indicates a high L/V ratio, with a low froth density indicating a low L/V ratio. Figure 6a shows higher froth densities in the inside than the outside panels, indicative of lower L/V ratios on the outside panels, higher L/V ratios on the inside panels.

Page 16
Figure 6. Results from Multi-chordal gamma scans of active areas (a) Froth densities (b) Froth heights (c) Clear liquids heights (d) Entrainment

Page 17
The only places on the outside panels where the froth densities are similar to those in the inside panels are at the outside panel inlets. The difference between the high densities (at the inside panels and at the inlets to the outside panels) and those in the middle and outlets of the outside panels is typically of the order of 50%. The scans are showing higher L/V ratios at the inlets of the outside panels compared to the middle and outside of these panels. This behavior is typical of vapor cross flow channeling (VCFC). On the inside panels, the froth densities are highest in the middle. The froths at the tray outlets and inlets are less dense than near the tray middle. Therefore, the highest L/V ratios are at the middle of the inside panels, with lower L/V ratios at the panels inlets and outlets. The high L/V ratios in the panel middle suggest liquid accumulation, possibly flood initiation, right there. Fig. 6b shows the froth heights, using a scale of 0” to tray spacing. A froth height of tray spacing or more indicates flooding and shows up as a point right on the tray above. A froth height less than tray spacing, i.e., a point well below the tray above indicates non-flooded operation. The accuracy of the froth height determination is plus or minus 20%, so many points show proximity to flood. The shading shown on the diagram is the same as that shown in Fig. 6a and represents froth densities, with blue being high froth density and red low froth density. Fig. 6b shows that most of the flood occurred near the middle of the inside panels. No flood was observed in the chord closest to the off-center downcomers and only in two trays in the chord closest to the center downcomers. In the chord closest to the off-center downcomers, froth heights were comparatively low. The regions where the flood was observed were those of high froth density. Fig.6b shows flood also at the outlets of the off-center to side outside panels. In the outside panels, no flood was observed in the middle, near the off-center downcomers, and in all but one of the inlet side to off-center panels. The flood observed here was different from that observed in the inside panels in that it always took place in the low density regions. Again, this flood is characteristic of VCFC. Fig. 6c shows the clear liquid heights on the trays. The scale is 0” to 10”, so that a point at the floor of the tray above coincides with 10” clear liquid height. Each clear liquid height is simply the froth height multiplied by the froth density. The shading shown on the diagram is the same as that shown in Fig. 6a and represents froth densities, with blue being high and red low. As expected, the clear liquid heights were taller in the regions where the froth density was higher and shorter where the froth density was lower. The clear liquid heights on the inside panels, especially in the middle, were high. There appeared to be a maximum in clear liquid height in the middle of the inside panels. For the three middle chords of the inside panels, most clear liquid heights ranged between 6 and 8 inches. These are very high and coincide with flood or near-flood operation. Most clear liquid heights for the chord closest to the off-center downcomer ranged from 3 inches to 5 inches. For the chord closest to the center downcomer, the clear liquid heights ranged from 4 to 7 inches.
Page 18
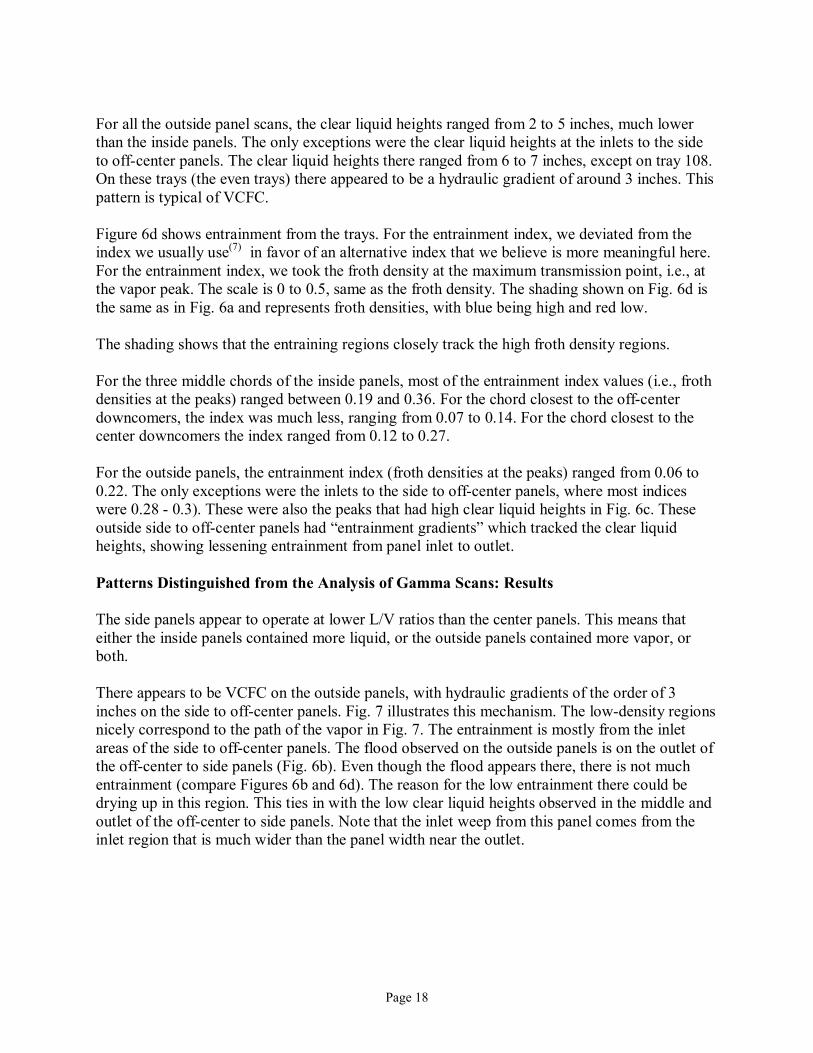
For all the outside panel scans, the clear liquid heights ranged from 2 to 5 inches, much lower than the inside panels. The only exceptions were the clear liquid heights at the inlets to the side to off-center panels. The clear liquid heights there ranged from 6 to 7 inches, except on tray 108. On these trays (the even trays) there appeared to be a hydraulic gradient of around 3 inches. This pattern is typical of VCFC. Figure 6d shows entrainment from the trays. For the entrainment index, we deviated from the index we usually use(7) in favor of an alternative index that we believe is more meaningful here. For the entrainment index, we took the froth density at the maximum transmission point, i.e., at the vapor peak. The scale is 0 to 0.5, same as the froth density. The shading shown on Fig. 6d is the same as in Fig. 6a and represents froth densities, with blue being high and red low. The shading shows that the entraining regions closely track the high froth density regions. For the three middle chords of the inside panels, most of the entrainment index values (i.e., froth densities at the peaks) ranged between 0.19 and 0.36. For the chord closest to the off-center downcomers, the index was much less, ranging from 0.07 to 0.14. For the chord closest to the center downcomers the index ranged from 0.12 to 0.27. For the outside panels, the entrainment index (froth densities at the peaks) ranged from 0.06 to 0.22. The only exceptions were the inlets to the side to off-center panels, where most indices were 0.28 - 0.3). These were also the peaks that had high clear liquid heights in Fig. 6c. These outside side to off-center panels had “entrainment gradients” which tracked the clear liquid heights, showing lessening entrainment from panel inlet to outlet. Patterns Distinguished from the Analysis of Gamma Scans: Results The side panels appear to operate at lower L/V ratios than the center panels. This means that either the inside panels contained more liquid, or the outside panels contained more vapor, or both. There appears to be VCFC on the outside panels, with hydraulic gradients of the order of 3 inches on the side to off-center panels. Fig. 7 illustrates this mechanism. The low-density regions nicely correspond to the path of the vapor in Fig. 7. The entrainment is mostly from the inlet areas of the side to off-center panels. The flood observed on the outside panels is on the outlet of the off-center to side panels (Fig. 6b). Even though the flood appears there, there is not much entrainment (compare Figures 6b and 6d). The reason for the low entrainment there could be drying up in this region. This ties in with the low clear liquid heights observed in the middle and outlet of the off-center to side panels. Note that the inlet weep from this panel comes from the inlet region that is much wider than the panel width near the outlet.

Page 19
Figure 7. Clear liquid heights diagram with VCFC on outside panels

Page 20
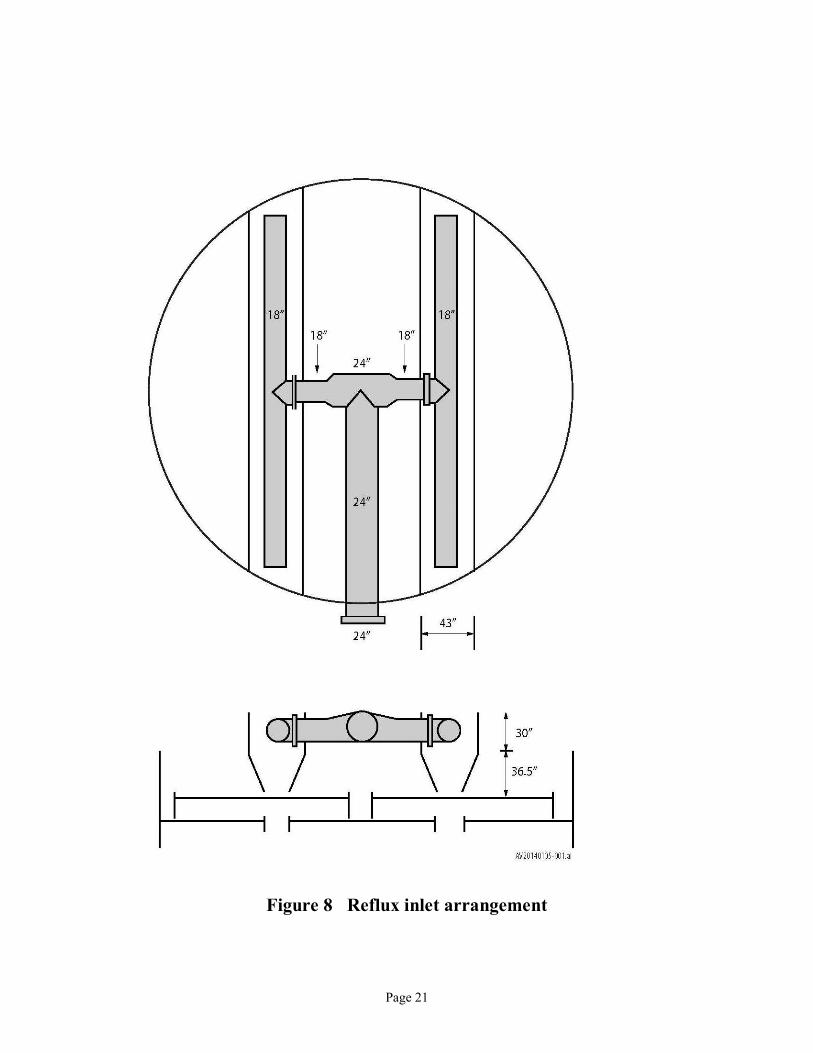
With the outside panels operating at VCFC, there will be an easy path for the vapor to travel without encountering a high liquid head. This will induce preferential vapor flow through the outside panels and induce multi-pass maldistribution. The horizontal vapor velocity component through the outlet regions of the even outside panels may blow liquid across the off-center downcomers from the outside into the inside panels. This too may induce multi-pass maldistribution. O’Bara(9) who consulted our team on maldistribution identified additional sources conducive to diversion of vapor and liquid into the inside panels. These include the effective length of the modified arc downcomer (MOAD) being less than that used in the design calculations, making it shorter than the center weir length; the formation of regions of retrograde flow on the outer panels caused by the impact of the liquid on the outlet weir near the tower wall on both sides of the MOAD; and the 4” deep integral trusses perpendicular to the liquid flow, which would cause more hydraulic resistance on the side panels. This theory of VCFC alone explained the resulting flood initiation on the inside panels. The lower efficiency is then both due to the VCFC and the multi-pass maldistribution. The channeling pattern on the inside chords was more difficult to explain. One hypothesis was that above the off-center downcomers, the VCFC on the outside panels generated a strong horizontal vapor velocity component in the direction of the inside panels. This velocity component would supply the horizontal push in a direction opposite to the liquid flow on the inside center to off-center panels. Although possible, this hypothesis was not considered likely. It was realized that there was still a missing link. Reflux Inlet While closely reviewing the tower internals, we found our missing link: reflux entry maldistribution. The reflux entering the tower is a flashing liquid. Upon flashing to the tower top pressure, it generated about 3% vapor by weight at the operating conditions. That may not seem much, but 3% by weight is 48% vapor by volume due to the density difference. The flashed reflux enters the tower via an H-distributor (Fig.8). The inlet nozzle and the pipe feeding the H are 24”, branching into two short 18” pipes which later split into four 18” laterals. Each lateral has more than 40 2.5” diameter holes, squirting the feed horizontally onto the walls of two off-center false downcomers that serve as flash boxes. Each false downcomer is 43” wide at the top, tapering towards the bottom. The false downcomers begin tapering 6 inches below the bottom of the laterals. In the false downcomers, vapor disengages upwards, while liquid descends and flows onto the top tray through 2” clearances in the bottom of each false downcomer.
Page 21
Figure 8 Reflux inlet arrangement
Page 22
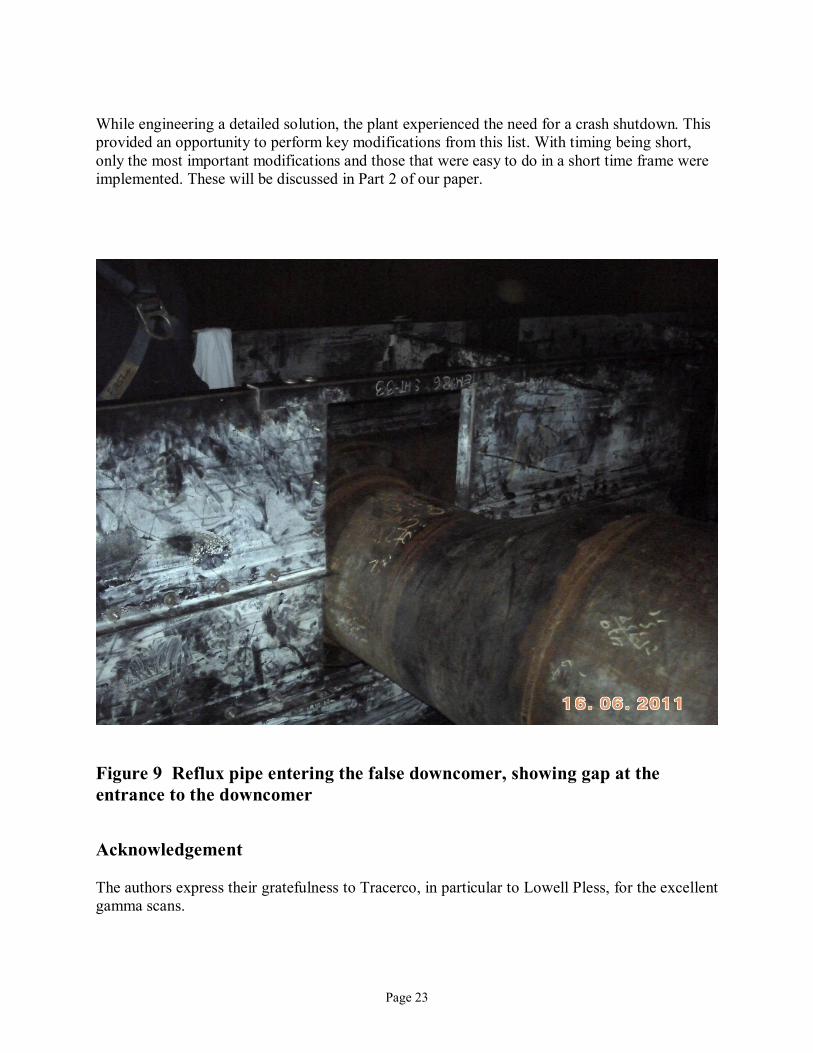
The feed mixture is discharged horizontally towards the wall of the false downcomer at a velocity of about 10 ft/s, and the distance from the holes to the false downcomer walls is only about a foot. This is likely to produce some upward lift on the feed liquid when it hits the false downcomer walls, and generate turbulence in this region. The downward liquid velocity in the false downcomer at the holes elevation is about 0.2 ft/s, which is quite typical of downcomer entrance velocities, a region of considerable turbulence. The presence of vapor at this region will aggravate the turbulence. The top of the false downcomer is only 21” above the centerline of the holes, and it is possible that some of the feed liquid lifted up would overflow the top of the false downcomers. Such overflow is likely to be maldistributed. Fig. 9 shows the entry of one of the 18” branch pipes into the false downcomer. Where each pipe enters there is an 18.5” x 12” gap, mostly above the pipe, through which liquid would pour out if froth or liquid built up above the reflux pipe or if there was turbulence in the region. A calculation using the Francis weir formula(10, 16) showed that if liquid built to the top of the false downcomer, 40% of the reflux would pour through the gap above the pipe. If it only built up to 6” above the gap, this fraction would decline to 15%. Either way there would be a large scale maldistribution with excess liquid pouring through the gaps into the inside panels. The validity of the assumption of pure liquid may be questioned. The region of the gap did not have any pipe holes on either side of the pipe, so it is likely to be liquid-rich. So while the assumption may not be precise, it should be quite a reasonable first approximation. Mysteries Explained The VCFC observed on the outside panels can now be combined with the reflux downpour through the gaps in Fig.9 to explain all the observations. The reflux downpour through the gaps would be totally directed to the inside panels, making the inside panels liquid-rich. The high liquid heads generated on the inside panels would induce vapor to preferentially flow into the outside panels. With the high open area of the trays, the dry tray pressure drop is too low to counter this maldistribution, so the maldistribution would persist throughout the tower. The result is high froth densities on the inside panels and low froth densities on the outside panels as seen in the gamma scans. Modifications for Overcoming the Problem Based on the above diagnosis, the key to solving the problem is to reduce the excessive open area (from 15% to about 11%) on the trays and to close the gaps at the reflux pipe entry into the false downcomers. Reducing the open area will eliminate the VCFC and will counter sources of multi-pass maldistribution. In addition, it would be beneficial to add anti-jump baffles to stop any horizontal velocity component from the outside panels that may blow vapor or carry liquid into the inside panels. Finally, raising the height of the reflux inlet false downcomers can help prevent overflow. There were several other less prominent modifications proposed and discussed.
Page 23
While engineering a detailed solution, the plant experienced the need for a crash shutdown. This provided an opportunity to perform key modifications from this list. With timing being short, only the most important modifications and those that were easy to do in a short time frame were implemented. These will be discussed in Part 2 of our paper.
Figure 9 Reflux pipe entering the false downcomer, showing gap at the entrance to the downcomer Acknowledgement The authors express their gratefulness to Tracerco, in particular to Lowell Pless, for the excellent gamma scans.
Page 24
References
1. Kister, H. Z., “Distillation Operation”, McGraw-Hill, NY, 1990.
2. Kister, H. Z., K. F. Larson and P. E. Madsen “Vapor Cross Flow Channeling on Sieve Trays: Fact or Myth?” Chem. Eng. Prog., p.86, November 1992.
3. Kister, H. Z., R. W. Dionne, W. J. Stupin, and M. Olsson, “Preventing Maldistribution in
Four-Pass Trays” (cover story), Chemical Engineering Progress, April, 2010.
4. Kister, H. Z. “Distillation Troubleshooting”, John Wiley & Sons, NJ, 2006.
5. Summers, D. R., "Harmonic Vibrations Cause Tray Damage", Paper 307g, presented at the AIChE Annual Meeting, San Francisco, CA, November 18, 2003.
6. Harrison, M. E., "Gamma Scan Evaluation for Distillation Column Debottlenecking",
Chem. Eng. Prog. 86 (3), p.37-44, March 1990.
7. Kister, H. Z., “Use Quantitative Gamma Scans to Troubleshoot Maldistribution on Trays”, Chem. Eng. Progr., February 2013.
8. Kister, H. Z., “Is the Hydraulic Gradient on Sieve and Valve Trays Negligible?” Paper
presented at the Topical Conference on Distillation, the AIChE Meeting, Houston, TX, April 2012.
9. O’Bara, J., Consultant Report, Carmagen, April 2011.
10. Kister, H. Z., P. M. Mathias, D. E. Steinmeyer, W. R. Penney, B. B. Crocker, and J. R.
Fair, “Equipment for Distillation, Gas Absorption, Phase Dispersion and Phase Separation”, in D. W. Green and R. H. Perry “Perry’s Chemical Engineers’ Handbook” 8th Ed., Section 14, McGraw-Hill, New York, 2008.
11. Summers, D. R., “Designing Four Pass Trays” Chem. Eng. Progr., p.26, April 2010.
12. Bolles, W., “Multipass Flow Distribution and Mass Transfer Efficiency for Distillation Plates”, AIChEJ, 22 (1), 153, 1976
13. Jaguste, S. D., and J. V. Kelkar, “Optimize Separation Efficiency for Multipass Tray”, Hydroc. Proc., p. 85, March 2006.
14. Lockett, M. J., and Billingham, Trans. IChemE., 80, Part A, p. 373, May 2002; Trans. IChemE., 81, Part A, p. 131, January 2003.
15. Summers, D. R., “Tray Stability at Low Vapor Load”, Conference Proceedings of “Distillation and Absorption 2010”, p.611, Eindhoven, The Netherlands, September 12-15, 2010.

Page 25
16. Francis, J. B., Lowell Hydraulic Experiments, “Flow of Water Over Weirs, and in Canals of Uniform Rectangular Section and of Short Length”, Little, Brown and Company, Boston, 1855.