Embed Size (px)
Citation preview
Chapter 1 Introduction to the AtmosphereThe state of the atmosphere, the weather, is often a topic of conversation at
parties and in elevators. Weather conversations are common because it is a common
experience shared by all people and one that influences almost every aspect of our lives.
Mark Twain said "everyone talks about the weather, but nobody does anything about it".
You may not be able to change the weather, but you can discover the processes that
determine our weather.
Atmospheric phenomena are very complicated yet easily observable. Through
careful observations you can collect explicit and complete information about phenomena
you are interested in. Analyze your observations by applying concepts presented in this
book to explain your observations. This will lead to an improved understanding of
weather and climate and better elevator conversations.
Scientists rely on observations to achieve a better understanding of the world
around us. The weather satellite has provided an important platform for observing
weather. An example of the type of satellite observations shown on every television
weather report is given in Figure 1.1. Hundreds of miles above Earth's surface, satellite
images of the weather provide a unique perspective of weather patterns. A perspective
that enables us to observe changing weather patterns across the globe. This chapter
introduces the basic structure of the atmosphere and how observations are represented
on weather maps.
1
Weather and ClimateWeather is the condition of the atmosphere at a particular location and moment.
Each day current weather conditions are given in local
weather reports. Typically, these reports include current
temperature, relative humidity, dew point, pressure, wind
speed and direction, cloud cover and precipitation. This weather information is
important to us as it influences our everyday activities and plans. Before going out for
the day we want to know how cold or hot it will be and if and whether it will rain or
snow. Meteorology is the study of these weather variables, the processes that cause
weather, and the interaction of the atmosphere with the Earth's surface, ocean, and
biosphere.
The fundamental cause of weather is an uneven heating of the Earth’s surface by
the Sun. At any time, only half of the Earth is heated by the Sun, while the Earth’s other
side is shadowed. This uneven daily heating by the Sun causes temperature differences
between the regions of the Earth that are in day and night. Earth's spherical shape also
causes the sun’s energy to be unevenly distributed between Earth's poles and equator.
Seasonal weather patterns result from variations in the heating caused by the Earth's orbit
about the Sun. The global distribution of ocean, land, and the topography of the land all
contribute to determining Earth's weather patterns. Uneven heating of the Earth by the
Sun is a fundamental cause of weather and climate and an important topic of Chapter 2.
The climate of a region describes the condition of the atmosphere over a given
longer time period (e.g., 30 years). Along with current weather conditions, weather
reports also include the average temperature for the day and the record maximum and
minimum temperatures. These temperatures represent one aspect of the region's climate.
Meteorology is the study of atmosphere and its interaction with the Earth’s surface, ocean and biosphere.
2
Climate studies often focus on long-term averages of atmospheric conditions such as
temperature, moisture, winds, pressure, clouds, visibility, and precipitation type and
amount. The climate of a region also includes a description of how much these
atmospheric parameters vary and the extreme values of these parameters. Climatology is
the study of climate.
A relationship exists between meteorology and climatology--both fields study the
atmosphere. As with daily weather, the climate of a region changes with time, though on
much longer time scales than the weather changes. Climate is sometimes considered as a
statistical representation of the weather. The basic structure of the atmosphere is the
focus of this chapter with emphasis on the meaning of atmospheric pressure. Before
discussing pressure, it is beneficial to review some basic characteristics of Earth and its
atmosphere.
The Earth's Major Surface FeaturesThe surface of the Earth exchanges energy and water with the atmosphere. The
distribution of land and water plays a major role in determining climatic conditions and
weather patterns. Approximately 70% of Earth's surface is water. The four major water
bodies are the Pacific, Atlantic, Indian, and Arctic Oceans.
Africa, Asia, Antarctica, Australia, Europe, North America, and South America
are the seven continents. More than two-thirds of these landmasses are located in the
Northern Hemisphere (Figure 1.2). Differences in current climate and weather patterns
The climate of a region is a statistical representation of the region’s weather over a given period of time.
3
between the northern and southern hemispheres can often be attributed to differences in
the amount of land in the two hemispheres.
Surrounding Earth’s surface is the atmosphere--a thin envelope of gases that
makes the planet habitable. The atmosphere protects us from the Sun’s high-energy
radiation, provides the air we breathe and the water we drink.
What is the Atmosphere?-Basic IdeasThe atmosphere is made primarily of a mixture of gases that includes a
suspension of liquid and solid particles. Air is a mixture of gases and its volume
will change depending on temperature and pressure. Air can be expanded and
compressed much more than liquids or solids. The ocean is a liquid and is not very
compressible. Rocks are a solid and it is difficult to change their volume. Only water
exists naturally in all three phases. So, meteorology is concerned with water in the form
of a gas, liquid, and solid (or vapor, water, and ice).
Because temperature and pressure are constantly changing molecules are in
continual motion. Gas and liquid molecules will spread out or diffuse from regions of
high concentration to regions of low concentration. If someone peels an orange the smell
will slowly permeate throughout the entire room. How fast the molecules diffuse is a
function of temperature. The warmer the air the faster the aromatic molecules of the
orange spread. If a fan is blowing the molecules will mix even faster. Diffusion results
from the random motion of molecules. If molecules are in continual motion, why don’t
all the air molecules diffuse out to space?
Gravity is the force that holds the atmosphere in place. Gravity exerts a pull on
gas molecules in the atmosphere and keeps them from diffusing out to space. Gravity is
4
the mutual attraction between objects. Gravity keeps the moon orbiting the Earth, the
planets orbiting the sun and you from floating out to space. Gravitational attraction is a
function of the mass of the objects. If an object has a large mass, it will have a strong
gravitational attraction. Gravitational attraction also depends on how far apart the objects
are from one another and quickly weakens with increasing distance. Gravitational
attraction plays an important role in the evolution of the concentration of gases in our
atmosphere.
Atmospheric Evolution
Since its formation approximately 4.5 billion years ago the Earth and its
atmosphere have undergone numerous changes. During its formation, the Earth’s
atmosphere was hot and consisted mostly of hydrogen (H), helium (He), methane (CH4)
and ammonia (NH4). Only small amounts of these gases remain in today’s atmosphere.
The gases composing today’s atmosphere are mostly nitrogen (N2) and oxygen (O2). The
composition of the atmosphere has changed over time.
Table 1.1 lists the gases composing our current atmosphere. If you measured the
percentage of the different gases in some fixed volume of air, you would find 78% of the
gas molecules to be nitrogen and approximately 21% would be oxygen. You would find
only traces of other atmospheric gases. Water vapor is on e of these trace gases. The
amount of water vapor in the atmosphere varies from day to day and from place to place.
This variability underlies many aspects of weather, including changes in the weight of air
(Box 1.1).
The gases in today’s atmosphere are largely a result of emissions by volcanoes. A
volcanic eruption also throws ash and earth into the atmosphere. In addition, an eruption
5
spews large amounts of gases into the atmosphere. The major gases in a volcanic plume
are water vapor (H2O), carbon dioxide (CO2) and some nitrogen (N2). What happened to
these gases after their release into the atmosphere?
After its formation, the Earth began to cool. During the cooling process the water
vapor from volcanic eruptions condensed and formed clouds. Precipitation from the
clouds eventually formed the oceans, glaciers, lakes and rivers. The development of the
oceans affected atmospheric concentrations of carbon dioxide. Some carbon dioxide from
the atmosphere dissolved and accumulated in the oceans while they formed. What
happens to the nitrogen outgassed by volcanoes?
Nitrogen is a heavy molecule, so the gravitational force is relatively large.
Nitrogen is also a chemically stable gas, which means it does not interact with other
gases or the Earth’s surface. For these reasons, once nitrogen enters the atmosphere it
stays there for a long time. This accounts for the high concentration in today’s
atmosphere; nitrogen has been accumulating over billions of years.
Volcanoes emit very little oxygen. How did oxygen come to comprise such a
large amount of today’s gas? Approximately 3 billion years ago tiny one-celled green-
blue algae evolved in the ocean. Water protected the one-celled organisms from the sun’s
lethal ultraviolet light. The algae produced oxygen through photosynthesis, the process
through which plants convert solar energy, water and carbon dioxide into food. Today’s
oxygen levels are a result of billions of years of accumulation. As the oxygen from plants
slowly accumulated in the atmosphere, ozone (O3) began to form. Ozone provided
protection from damaging ultraviolet energy emitted by the sun, allowing life to move
out of the oceans and onto land.
6
Atmospheric Composition
From the perspective of weather and climate, the three major trace gases in the
atmosphere are carbon dioxide, water vapor, and ozone. These gases play an important
role in the energy cycles of the atmosphere. Other important gases for atmospheric
studies include methane and chlorofluorocarbons (CFCs). These gases are important
because of how they interact with the other gases or how they modify the energy balance
of the atmosphere, a topic discussed in the next chapter. In addition to gases, small
particles suspended in the atmosphere are also important in determining the quality of the
air we breathe and the transfer of energy in the atmosphere. For climatic predictions, it is
important to know how the concentration of these gases and particles change with time.
The cycle of a gas describes how the gas enters and leaves the atmosphere. In this
section we first consider the carbon dioxide and hydrologic cycles before moving on to
discuss methane, CRC's and aerosols. (The formation and destruction of ozone is
discussed in the next chapter.) As we consider cycles and the concentration of gases in
the atmosphere we concern ourselves with sources and sinks. A source is a mechanism
that supplies a gas to the atmosphere and a sink removes a gas from the atmosphere.
Carbon Dioxide CycleThe atmospheric carbon dioxide cycle describes how carbon dioxide moves
between the atmosphere, ocean and biomass reservoirs. Nearly half the carbon dioxide
that enters the atmosphere moves between the ocean and plants. Here we review how
carbon dioxed enters and leaves the atmosphere. The atmospheric carbon dioxide cycle is
illustrated in Figure 1.3.
7
As mentioned earlier, volcanoes inject carbon dioxide into the atmosphere and are
therefore an atmospheric source of carbon dioxide. Plants, through the process of
photosynthesis, use sunlight, water and carbon dioxide to manufacture food. Plants
remove carbon dioxide from the atmosphere during photosynthesis and store it in their
fibers. Photosynthesis is a sink of atmospheric carbon dioxide. When the plants die and
decay they release the stored carbon dioxide into the atmosphere, and thus plant
decomposition is a source of carbon dioxide. Plant decompostion over geological time
has generated coal and oil fields. The burning of these fuels returns carbon dioxide into
the atmosphere. Animals require oxygen to survive. Through respiration animals inhale
atmospheric oxygen and exhale carbon dioxide and are therefore a source of atmospheric
carbon dioxide.
The atmospheric concentration of carbon dioxide is monitored throughout the
world. The concentrations that have been measured at Mauna Loa, Hawaii since 1958 are
shown in Figure 1.4. The steady increase in carbon dioxide concentration is attributed to
the burning of fossil fuels and, to a lesser extent, deforestation. Imposed on this
increasing trend is a repetitive cycle of peaks and valleys. Peaks in the carbon dioxide
concentrations occur in the Northern Hemisphere winter and valleys in the Northern
Hemisphere summer. The life cycle of plants in the Northern Hemisphere drives the
seasonal cycle of peaks and valleys. During winter, dormant plants stop removing carbon
dioxide from the atmosphere decaying plants release the carbon dioxide stored in their
fibers into the atmosphere, increasing atmospheric concentrations. In summer,
photosynthesis is at a maximum and carbon dioxide is removed from the atmosphere in
large quantities, causing the yearly minimum.
8
The amount of carbon dioxide in the atmosphere is an important factor that
influences atmospheric temperature. Warm periods in the Earth’s long term history are
associated with high levels of atmospheric carbon dioxide. As we shall discuss in the
next chapter and Chapter 15, the increase of atmospheric carbon dioxide due to burning
of fossil fuels plays a vital role in the planet’s warming. When discussing predictions of
global climate warming you should keep in mind that large quantities of carbon dioxide
are dissolved or stored in the oceans. The ocean contains 50 times more carbon dioxide
than the atmosphere. Some of the carbon dioxide in the oceans is used by marine
organisms to build shells. When they die, their shells accumulate on the bottom of the
ocean and form carbonate rocks removing carbon from the cycle. Scientists do not
completely understand how much carbon dioxide the oceans will be able to absorb as the
amount of carbon dioxide in the atmosphere changes.
Hydrologic Cycle
In the atmospheric sciences, water is very important because it couples, or
connects, the atmosphere with the surface of the Earth. Water is also the only substance
that exists naturally in the atmosphere in all three phases: gas, solid and liquid. Changing
from one phase of water to another, such as from liquid to gas, is an important means of
transferring energy in the atmosphere.
The hydrological cycle explains the
circulation of water from the ocean to the
land. Water is constantly evaporated into the
atmosphere as vapor and clouds, and returned to the surface as precipitation. Figure 1.5
illustrates the water or hydrological cycle. A major source of atmospheric water vapor,
The hydrologic cycle gives a complete description of how water cycles between the atmosphere, the seas, and the land, and in doing so moves through all three phases.
9
i.e., water in the gas phase, is evaporation from the oceans. Evaporation is the change of
phase of liquid water to water vapor. Evaporation from lakes and glaciers supplies a
relatively small amount of water to the atmosphere. Transpiration, the process by which
plants release water vapor into the atmosphere, is also a source of atmospheric water
vapor. Since the surface of the Earth is the major source of atmospheric water vapor, the
amount of water vapor in the atmosphere is generally largest near the surface and rapidly
decreases with distance from the surface.
Often atmospheric water vapor changes phase to form solid and liquid particles.
A cloud is a collection of these particles. On average about 50% of the globe is covered
with clouds. The occurrence of clouds is more frequent in some areas of the world and
less frequent in others. Figure 1.6 depicts the cloud cover on a single as measured from
different satellites. Patterns in cloud cover are evident. A lack of clouds is observed at
about 30 north and south latitude, particularly over the deserts of Africa. A band of
clouds is observed in the vicinity of the equator, at approximately 5N. the reasons for the
global cloud patterns shown in Figure 1.6 are discussed in Chapter 7.
Precipitation falls from clouds. Precipitation is a sink of atmospheric water as it
removes water from the atmosphere. Rain, snow, sleet, freezing rain and hail are
different types of precipitation. Precipitation returns water to the Earth's surface and
completes the cycle. Precipitation on land may collect in lakes, run in rivers directly back
to the sea, or percolate into the soil.
Water vapor, also referred to as atmospheric moisture, is water in the gas phase.
10
Precipitation may fall as snow and be stored in glaciers. The occurrence and areal
extent of glaciers are functions of the temperature of the atmosphere and the amount of
precipitation. The presence of glaciers will also affect the atmospheric temperature, as
more solar energy is reflected back to space reducing the amount that can be absorbed
and therefore heat the Earth. Like rivers, glaciers flow, but usually extremely slowly. As
glaciers slowly move they carve the earth’s surface. An example of glacial erosion is
Yosemite Valley in Yosemite National Park, California.
Evaporation from lakes returns water to the atmosphere. Lake water and
precipitation seep below the surface of the earth and form ground water or aquifers. The
water table marks the top of the ground water reservoir. Water stored in the soil
ultimately flows back to the oceans, as does precipitation, river and glacier flows,
completing the cycle.
Since water plays a major role in weather and climate, it is important to
understand the hydrologic cycle. A change in one component of the hydrologic cycle will
affect weather. For example, a decrease in the amount of cloud cover over land during
the day, will allow more solar energy to reach the surface and warm the ground and the
atmosphere above.
Methane
In addition to adding CO2 to the atmosphere, human activities are changing
atmospheric concentration of other trace gases, such as methane. Figure 1.7 shows that
the concentration of methane has doubled since the beginning of the Industrial
Revolution! We do not fully understand the observed increases in atmospheric methane.
Human activities that contribute to the increased methane concentration include the
11
decay of organic substances in rice paddies (the cultivation of rice has doubled since
1940), burning of forests, coal mining, and cows (a by-product of digestion).
Methane, as with carbon dioxide, plays a role in global warming you read about
in newspapers. An understanding of how gases such as methane and carbon dioxide
increase the global average temperature requires us to revisit so-called greenhouse
warming throughout this book. Water vapor is the most important gas in the greenhouse
warming scenario. Other important gases that contribute to greenhouse warming are
chlorofluorocarbons.
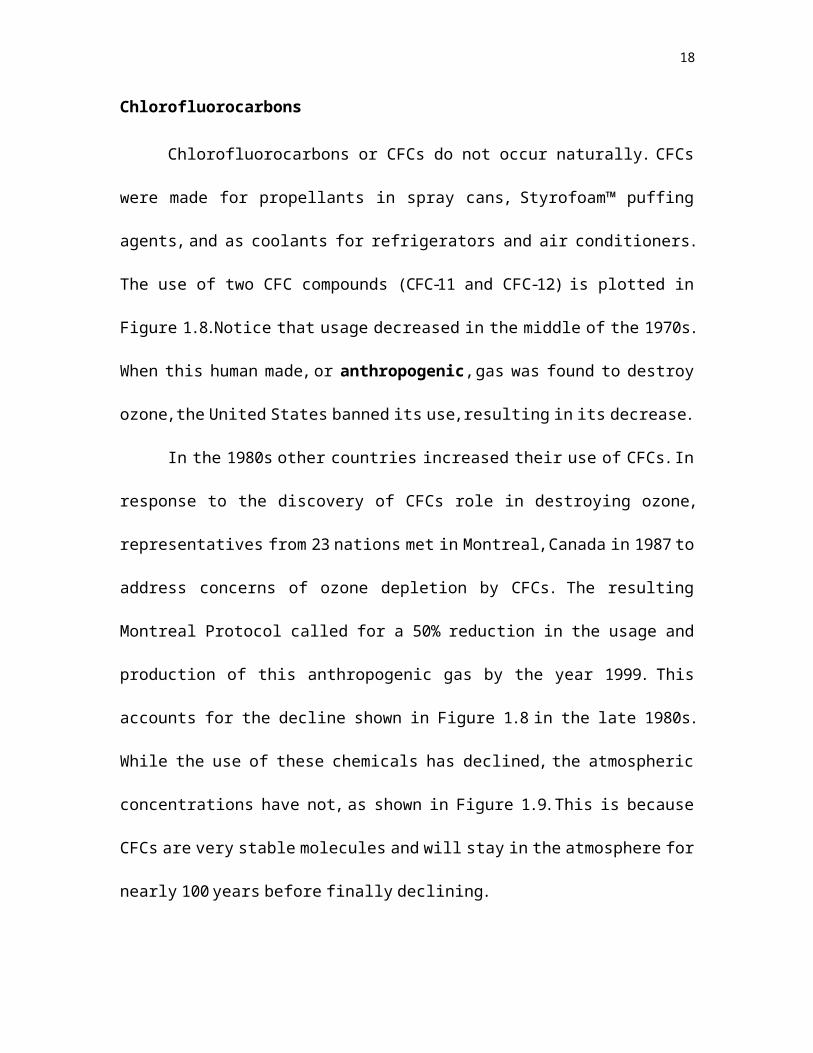
Chlorofluorocarbons
Chlorofluorocarbons or CFCs do not occur naturally. CFCs were made for
propellants in spray cans, Styrofoam™ puffing agents, and as coolants for refrigerators
and air conditioners. The use of two CFC compounds (CFC-11 and CFC-12) is plotted in
Figure 1.8. Notice that usage decreased in the middle of the 1970s. When this human
made, or anthropogenic, gas was found to destroy ozone, the United States banned its
use, resulting in its decrease.
In the 1980s other countries increased their use of CFCs. In response to the
discovery of CFCs role in destroying ozone, representatives from 23 nations met in
Montreal, Canada in 1987 to address concerns of ozone depletion by CFCs. The resulting
Montreal Protocol called for a 50% reduction in the usage and production of this
anthropogenic gas by the year 1999. This accounts for the decline shown in Figure 1.8 in
the late 1980s. While the use of these chemicals has declined, the atmospheric
concentrations have not, as shown in Figure 1.9. This is because CFCs are very stable
molecules and will stay in the atmosphere for nearly 100 years before finally declining.
12
Aerosols
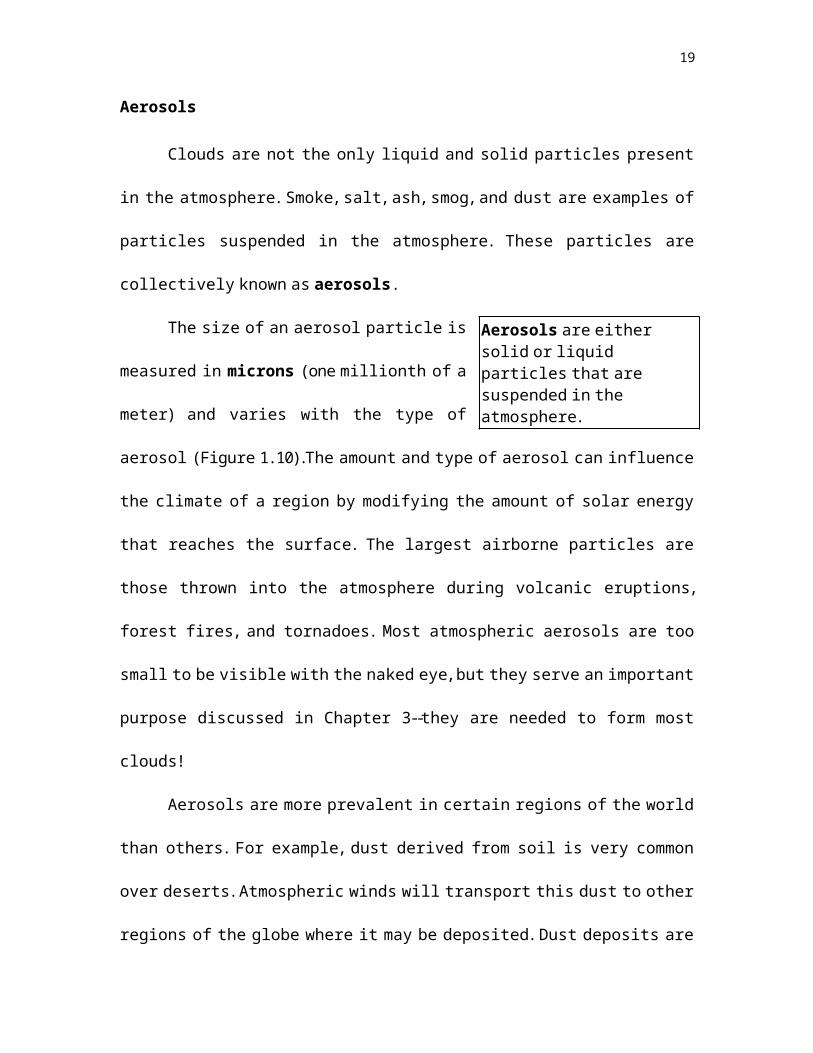
Clouds are not the only liquid and solid particles present in the atmosphere.
Smoke, salt, ash, smog, and dust are examples of particles suspended in the atmosphere.
These particles are collectively known as aerosols.
The size of an aerosol particle is measured in
microns (one millionth of a meter) and varies with
the type of aerosol (Figure 1.10). The amount and
type of aerosol can influence the climate of a region by modifying the amount of solar
energy that reaches the surface. The largest airborne particles are those thrown into the
atmosphere during volcanic eruptions, forest fires, and tornadoes. Most atmospheric
aerosols are too small to be visible with the naked eye, but they serve an important
purpose discussed in Chapter 3--they are needed to form most clouds!
Aerosols are more prevalent in certain regions of the world than others. For
example, dust derived from soil is very common over deserts. Atmospheric winds will
transport this dust to other regions of the globe where it may be deposited. Dust deposits
are found on the ice sheets of Greenland. Dust is not generated over Greenland and so
deposits must have originated in another location and then transported towards the
Arctic. Analysis of the Greenland ice sheet indicates an increased amount of dust present
in the atmosphere at the end of the last glacial period, suggesting conditions favorable for
dust generation such as below normal precipitation for several years. Dust deposits over
glaciers are a window into the weather of centuries past.
Sea salt is an aerosol that commonly occurs over the oceans and along shorelines.
Sea salt enters the atmosphere from the oceans when spray from waves evaporates
Aerosols are either solid or liquid particles that are suspended in the atmosphere.
13
leaving behind tiny salt particles in the atmosphere. Sea salt particles are important in the
formation of clouds.
Other sources of aerosols are primarily wind erosion, fires, volcanoes, human
activity, and gas. Wind erosion is a natural way of getting aerosols into the atmosphere.
Winds lift soil particles off the bare ground and transport them into the atmosphere. Fires
produce large amounts of aerosols. Air heated by the fire can carry particles several
thousand feet above the ground.
Volcanic eruptions spew huge amounts of particles into the atmosphere. The
eruption of Mount St. Helens in Washington state on May 18, 1980 injected
approximately 520 million tons of ash into the atmosphere! Chapter 15 presents a
discussion of how aerosols generated in volcanic eruptions can lower Earth’s
temperature.
Airborne particles generated by human activity are referred to as anthropogenic
aerosols. Such production activities include transportation, fuel combustion,
construction, crop spraying, and industrial processes. Large anthropogenic aerosols are
generated in mechanical processes such as grinding and spraying. The smaller particles
are generated in processes where combustion is incomplete, such as in automobiles.
Atmospheric Pressure
Pressure is force per unit area. The atmosphere is made up of gas molecules that
are constantly in motion. These molecules exert a pressure when they strike an object.
The pressure exerted by the molecules hitting you is a function of:
1) the speed of the molecules
2) how number of molecules
14
3) the mass of the molecules.
Molecules that comprise the air are moving in all directions. These molecules
exert a pressure on objects as they collide with them. Since the molecules are moving in
all directions, the pressure is omnidirectional. An empty aluminum can does not collapse
because the pressure exerted by the molecules on the outside of the can balance the
pressure exerted by the molecules on the inside of the can.
Concentration of molecules is measured in terms of density. Density is mass per
volume. The pressure, temperature and density of a gas are related to one another
through a mathematical formula known as the ideal gas law (Box 1.2). Changing one of
these variables will cause a change in one or both of the others. .
Air is a gas and will take on the shape of the container. As the size of the
container shrinks, the gas is compressed. Compressing the air increases its density since it
increases the number of molecules in a given volume. If we increase the number of
molecules on the inside of a balloon by pumping air into the balloon (but not allowing
the temperature to change), we increase the number of molecules colliding and therefore
exerting a pressure on the walls of the balloon. If we pump enough molecules in, the
balloon will bulge outward because of the pressure differences between air outside and
inside the balloon. Pressure differences not only allow us to blow up balloons, it also
pushes bad guys out of planes, cause sounds to propagate through the air (see web page),
and affect our hearing (Box 1.3).
Air has mass and because of gravity has weight. Because air is compressible, the
air near the surface is compressed by the weight of the air above. Figure 1.11 plots how
density decreases with distance from the surface. As you move away from the surface
15
you are decreasing the amount of air above you, and therefore, its weight. As a result, as
the distance from the surface increases, the density of the air decreases. Decrease in
density results in a decrease in pressure, because there are fewer molecules in the same
volume of air.
Television weather reports show atmospheric pressure in terms of millimeters or
inches of mercury. The TV meteorologist is reporting atmospheric pressure in terms of
the height of a column of mercury. Consider Figure 1.12 in which a tube with no air in it
is placed up-side down in a liquid. Because
gravity pulls objects towards the center of the
earth, the weight of an object exerts a downward pressure on a surface it rests on. Air has
mass and because of gravity exerts a downward pressure on objects. The molecules of air
collide and exert a pressure on the surface of the fluid. This pressure pushes the fluid up
the tube. The greater the pressure the higher the column of fluid. As we go higher in the
atmosphere, the number of molecules colliding with the fluid surface decreases and so
the pressure exerted on the fluid is less. This causes the height of the fluid column to
drop as the apparatus is raised. For this reason, atmospheric pressure always decreases
with increasing distance from the surface (Figure 1.12). You may find it is useful to think
of atmospheric pressure as the weight of a column of air above you. This will help you to
understand the rule: atmospheric pressure always decreases with increasing altitude.
In meteorology it is more common to report atmospheric pressure in millibars,
rather than inches of mercury. One millibar (mb) equals 0.03 inches (0.76 millimeters) of
mercury. Pressure is also expressed in terms of pounds per square inch (psi); air pressure
Atmospheric pressure, also referred to as barometric pressure, is the pressure exerted by column of air due to gravitational attraction.
16
in tires is measured in psi. One millibar is equivalent to 0.0145 psi. The average surface
pressure at sea level is 1013.3 mb.
Denver is approximately one mile above sea level, while San Francisco is at sea
level. Because pressure always decreases with altitude, the pressure measured at Denver
will always be lower than that measured at San Francisco. When comparing the pressure
of two cities it is important to reference the pressure measurements to the same altitude.
If the pressures are not referenced to the same altitude, when analyzing differences in
pressure between the two cities, we will just see differences in the altitude of the cities. It
is common in meteorology and climatology to adjust the measured surface pressure to
what the pressure would be if the city were at sea level. Atmospheric pressure is reported
as referenced to sea level pressure.
Dividing up the Atmosphere
Meteorologists find it useful to divide the atmosphere into layers. We can divide
the atmosphere vertically according to pressure. For example, we often will discuss the
winds at an altitude where the atmospheric pressure equals 500 mb. Why are we
interested in 500 mb? Since the average atmospheric pressure at the Earth’s surface is
1013 mb, if we were at an altitude of 500 mb, approximately half the atmosphere lies
above us and half below us. We can also divide the atmosphere according to temperature.
Unlike pressure, temperature does not always decrease with increasing distance
from the surface. If we were to average temperature over many years at many different
locations across the globe for many different altitudes, a distinct pattern would emerge
between temperature and distance from the surface. Figure 1.13 is an example of this
17
pattern. Based on this temperature profile, the atmosphere can be divided into four
layers: troposphere, stratosphere, mesosphere and thermosphere.
From the surface up to approximately 10-16 km (6 to 10 miles), temperature
generally decreases with altitude. This region of decreasing temperature is called the
troposphere. The word troposphere is derived from the Greek word tropein meaning “to
change.” The weather that occurs in the troposphere, which is always changing, is the
focus of this book. The top of the troposphere is referred to as the tropopause. The
height of the tropopause is a function of latitude. It is higher in the equatorial regions
than in the polar regions.
Above the tropopause lies the stratosphere, where temperature increases with
altitude. Temperature is increasing because ozone molecules are absorbing solar energy
near the top of the stratosphere. Airflow in the stratosphere is much less turbulent than
weather in the troposphere. For this reason jet aircraft travel is less "bumpy". The
increasing temperature with altitude of the stratosphere makes it difficult for tropospheric
air to mix into the stratospheric air. The tropopause marks a barrier that inhibits vertical
mixing. Occasionally, particularly in the vicinity of storms, stratospheric air mixes into
the tropopause.
The stratopause marks the top of the stratosphere and the beginning of the
mesosphere. On average the stratopause occurs at an altitude of approximately 50
kilometers or 31 miles. Temperature decreases with altitude in the mesosphere. The
mesopause separates the mesosphere from the thermosphere. In the thermosphere the
temperature again increases with altitude. Some interesting meteorological phenomena
18
occur in the mesosphere and thermosphere, such as the aurora. This book is primarily
concerned with weather in the troposphere because this is where we live.
An Introduction to Weather Maps
You will find it useful to follow the weather conditions throughout your studies
and apply what you learn in class to the weather conditions you observe. To understand
the weather we have to understand the relationships between weather variables and how
they are distributed throughout the atmosphere. This requires us to look at, or analyze,
many numbers. To understand the relationships between weather variables we plot the
variables on a weather map. To paraphrase the saying, “A picture is worth a thousand
words,” a map is worth a thousand numbers. This section gives a brief introduction to
weather maps.
By experience we know that when a cold front passes it gets colder outside. On
the other hand the passage of a warm front brings warmer temperatures. A front is a
boundary between two masses of air that have different meteorological properties, such
as temperature and humidity. All weather reports track the movements of fronts because
fronts represent changing weather conditions. A cold front denotes a region where cold
air is replacing warmer air. A warm front indicates that warm air is replacing cooler air.
We will discuss fronts in detail in Chapters 8 and 9 of this book. Since it is valuable to
follow the weather as you study for this course let us discuss how fronts are represented
on weather maps.
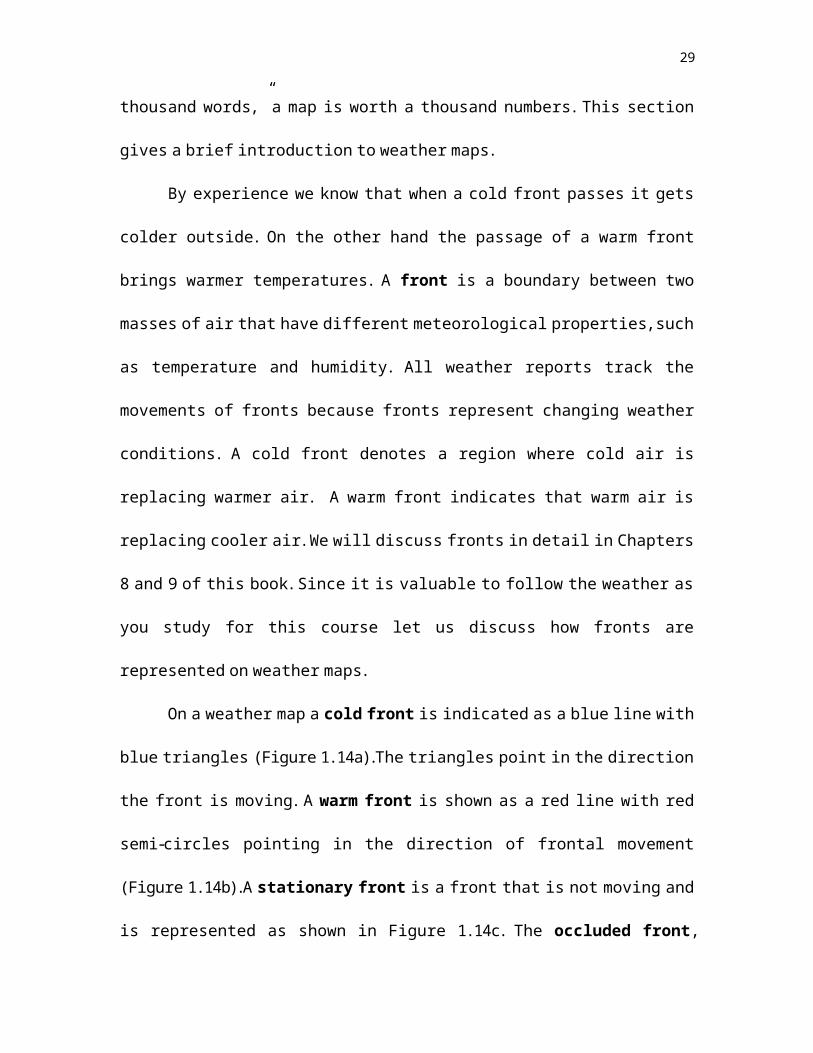
On a weather map a cold front is indicated as a blue line with blue triangles
(Figure 1.14a). The triangles point in the direction the front is moving. A warm front is
shown as a red line with red semi-circles pointing in the direction of frontal movement
19
(Figure 1.14b). A stationary front is a front that is not moving and is represented as
shown in Figure 1.14c. The occluded front, represented as a purple line with alternating
triangles and semi-circles (Figure 1.14d), is discussed in Chapter 9. The frontal lines
drawn on a weather map represent the locations where the fronts meet the Earth’s
surface.
To locate the position and type of a front on any given day requires the analysis
of the weather conditions from cities and towns over a wide geographic area. To help in
this analysis we often draw lines connecting locations that have the same temperature.
Lines of constant temperature are isotherms and are often depicted in newspaper weather
maps. We can also draw lines connecting cities that have the same wind speed (isotachs)
or the same pressure (isobars). Isopleths are lines along which a variable is constant (iso
means equal). An isotherm is one type of isopleth.
Television weather reports represent weather conditions with smiling suns, rainy
clouds and flashing bolts of lightning. In studying the weather we need to know where it
is raining and where it is sunny, the wind speed and direction, humidity, visibility,
pressure and temperature. To understand the weather we need to know how these
meteorological variables are changing and how they relate to one another. To understand
these relationships it is best to represent weather variables in a simple graph. For the
purposes of this book, smiling suns do not contain enough information about the weather.
On the other hand too many isopleths drawn on a single map presents a confusing
picture. Weather conditions observed at a city or town are best represented on a map
using the station model.
20
A simplified example of a station model plot used to represent meteorological
conditions near the surface is shown in Figure 1.15. The station model depicts current
weather conditions, cloud cover, wind speed, wind direction, visibility, temperature,
dewpoint temperature, atmospheric pressure adjusted to sea level, and the change in
pressure over the last three hours. In Figure 1.15 nine weather variables commonly
reported on the evening news are plotted.
The circle in the station model is centered on the latitude and longitude of the city
where the weather observations are made. Total cloud cover is expressed as the fraction
of cloud covering the sky. An open circle represents a clear sky and an overcast sky is
represented by a filled-in circle. The coding legend for all types of cloud cover is given
in Figure 1.15.
In the United States surface temperature is expressed in degrees Fahrenheit. In the
station model plot, temperature is plotted where the number 10 is on a clock (TT). The
dewpoint temperature (TdTd) is plotted below (at about 8 o’clock) and in the same units
as temperature. (The meaning and importance of the dewpoint temperature are discussed
in Chapter 4.) Visibility (VV) is how far we can see and (in the United States) is
expressed in units of miles. On the station model, visibility is plotted between
temperature and dew point (at about 9 o’clock). Immediately to the right of visibility is
current weather conditions (ww). Common weather symbols are given in the figure inset.
Wind speed (ff) and direction (dd) are represented in the station model plot by the
position of the “flag pole.” The pole points to the direction from which the wind is
coming. You can tell which direction the “pole” is pointing by the end that has the flags
or barbs. The measured atmospheric pressure is adjusted to sea level and plotted in the
21
upper-right hand section of the station plot (PPP). The units are in mb. The leading 9 or
10 are dropped as is the decimal point. So 234 represents a pressure of 1023.4 mb while
834 represents a pressure of 983.4 mb. The change in surface pressure over the last three
hours (pp) is plotted in the lower left of the station plot. The change in pressure is
represented by a value and a line that tells us how the pressure was changing. A table for
decoding this variable is given on the Web.
Examples and exercises designed to help you understand the station weather
model are on the Web. The different weather variables plotted in the station model are
discussed in specific detail in different chapters. The book’s Web page contains current
weather maps that use the surface station model. An example of a surface weather map is
given in Figure 1.16. It includes station model plots and isobars. This map corresponds to
the satellite image shown in Figure 1.1. The surface weather map also shows western
Nebraska to be cloud free while much of the Southeast is covered with cloud. The time
the weather observations were made is printed in one of the corners of each weather map.
Unlike television programming, Eastern Standard Time is not the reference time for these
maps!
Time Zones
To depict current weather patterns using a weather map and to predict future
weather, it is important to coordinate the time of global weather observations. To aid in
this coordination weather organizations throughout the world have adopted the
Coordinated Universal Time (UTC for Universel Temps Coordonné) as the reference
clock. UTC is also denoted by the abbreviations GMT (Greenwich Meridian Time) or Z
(Zulu).
22
An imaginary line drawn from the center of the sun to the center of Earth
intersects a specific longitude on Earth. This is the sun’s longitude. Because the Earth
spins, the sun’s longitude changes approximately 1 every 4 minutes, or 15 in one hour.
Thus, to reference time the Earth is divided into 24 time zones each of approximately 15
longitude. The reference time zone for UTC is centered on Greenwich, England. The
international date line (180 longitude) separates one day from the next. Just east of the
date line is 24 hours earlier than just to the west of the date line.
Meteorology also uses the 24-hour clock. For example, 1:30 p.m. UTC is 1330
UTC while 0130 UTC is 1:30 am. Observations of the upper atmosphere are coordinated
internationally to be made at 0000 UTC (midnight at Greenwich) and 1200 UTC (noon at
Greenwich). The Eastern Standard Time zone of the US is 5 hours earlier than
Greenwich time. Central Standard Time zone is 6 hours earlier, Mountain Standard Time
7 hours, Pacific Standard Time 8, Alaskan Standard Time is 9 and Hawaiian Standard
Time 10 hours earlier than Greenwich.
Weather Warning, Watches and Advisories
As you follow the weather you will notice that certain meteorological conditions
may exist that pose a threat. Under these conditions weather watches and weather
warnings are issued. A weather watch informs us that current atmospheric conditions are
favorable for hazardous weather. When the hazardous weather is imminent, then a
warning is issued. Weather watches and warnings are issued for tornadoes, hurricanes,
lightning, severe thunderstorms, hail, winter storms, and flooding. Figure 1.17 denotes
the weather warnings and watches issued on the day corresponding to Figure 1.16. The
National Weather Service issues weather watches and warning under specific weather
23
conditions (Table 1.2). It is important to understand the difference between a weather
watch, a weather warning and a weather advisory. The term warning implies you should
be alert for the possibility of the weather hazard. Weather warnings are issued when the
condition is imminent. An advisory is used to alert the public to a situation that may
cause some inconvenience or difficulty for travelers or people who have to be outdoors.
Weather Term Watch WarningHurricane Issued when hurricane conditions are
expected in a given region within a day or more.
Issued when the arrival of a hurricane is expected within the next 24 hours.
Severe thunderstorm Conditions are favorable for the development of severe thunderstorms in and close to the watch area.
A severe thunderstorm has been sighted visually or by radar. Issued when a thunderstorm produces hail 3/4 of an nche or larger in diameter and/or winds equal to or exceed 58 mph.
Tornado Conditions are favorable for the development of tornadoes in and close to the watch area.
A tornado has been sighted visually or by radar
Flash Flood Conditions are detected that could result in flash flooding in or close to the watch area
Flash flood will occur within 6 hours and be life/property threatening. Dam breaks or ice jams can also create flash flooding.
Winter Storm Issued when conditions are favorable for the development of hazardous weather such as heavy snow or blizzard condition or freezing rain or sleet.
Issued when hazardous winter weather are imminent or very likely.
Table 1.2 The criteria used by National Weather Service for issuing some of the weather watches and warnings.
24
Summary
Meteorology and climatology are both fields that study the atmosphere. Climate
is sometimes considered as a statistical representation of the weather. As with daily
weather, the climate of a region changes with time, though on much longer time scales
than the weather. Earth’s atmosphere is composed primarily of nitrogen and oxygen in
the form of a gas. Atmospheric concentrations of water vapor, carbon dioxide, and ozone
are small but very important to the study of weather and climate.
The different molecules of the atmosphere are continually moving, exerting a
pressure in all directions. Air pressure is strongly dependent on the number of molecules
in a given volume and how fast the molecules are moving. There is a direct relationship
between pressure and volume. Suppose air is in a container and the temperature is fixed
at a constant value. If the size of the container shrinks, the pressure inside increases. The
temperature of a gas is a measure of how fast its molecules are moving. There is a
relationship between temperature and pressure. If the container size is fixed, heating the
air increases the pressure on the inside of the container. Pressure, volume, and
temperature are related to one another. If you cool air and want the pressure to remain
the same, you have to decrease the size of the container. So, at the same pressure, cold air
is more dense than warm air because the same number of molecules occupy a smaller
volume.
Atmospheric pressure is related to the weight of the column of air above you. If
molecules are removed from a column of air, the weight of the column decreases and the
pressure at the Earth’s surface will decrease. Adding molecules above a region of the
Earth increases the atmospheric pressure. As you increase your altitude you are reducing
25
the number of molecules above you. For this reason atmospheric pressure always
decreases with distance from the surface. This simple concept is very important for the
formation of clouds and for transferring energy in the atmosphere.
Unlike pressure, temperature does not always decrease with increasing distance
from the surface. The vertical temperature structure is used to categorize the atmosphere
into four distinctive layers, the troposphere, stratosphere, mesosphere, and thermosphere.
Pressure and temperature are two important meteorological variables. Other
important weather variables are humidity, cloud cover and type, wind speed, wind
direction, and precipitation. It is important to remember that all these weather variables
are related to one another. Precipitation requires clouds whose presence or absence is
partly determined by the winds. The winds are driven by pressure differences over a
horizontal distance. Temperature differences can lead to pressure differences that in turn
generate winds. The type of precipitation--rain, snow, sleet, and freezing rain--is a
function of how the temperature changes with height above the surface. Humidity, a
measure of how much water vapor is in the atmosphere is dependent on the atmosphere’s
temperature. High humidities are favorable for cloud formation, also a requirement for
precipitation.
26
Terminology You should understand all of the following terms. Use the glossary and this Chapter to
improve your understanding of these terms.
Aerosols
Anthropogenic
Atmospheric pressure
Climatology
Climate
Carbon dioxide
CFC
Density
Diffuse
Front
Gravity
Hydrological cycle
Mesosphere
Meteorology
Micron
Isobar
Isotach
Isotherm
Ozone
Pressure
Station model
Stratopause
Stratosphere
Thermosphere
Time zones
Transpiration
Troposphere
Tropopause
Water vapor
Weather
Weather watches and warnings
27
Review Questions
1. Take a balloon and place it over the open end of an empty glass bottle. Run hot water
over the bottle (not the balloon). What happens to the balloon? Explain what you
observe.
2. What is the difference between weather and climate?
3. Fill a balloon with air and place it in a refrigerator. Remove it from the refrigerator
after twenty minutes and describe its appearance. Explain what you observed.
1. Why might it be easier to hit a home run in a Denver baseball diamond than one in Miami?
4. Explain the difference between weather and climate.
5. Why is there no such field as lunar meteorology?
6. Why aren’t the north and south poles assigned a longitude?
7. Why does a hot air balloon rise?
8. Why does atmospheric pressure decrease with altitude?
9. What is the difference between a weather watch and a warning?
10. How is the atmosphere categorized?
11. If a raft filled with air is thrown into a cold lake it appears to deflate, even though no
air escapes. Explain.
12. Why does air that is rapidly compressed into a small volume got hot?
13. List the differences between a solid, a liquid and a gas.
Web Activities
Review of latitude and longitude
Review of mass, matter, and gravity
Ideal Gas Law
28
Hydrostatic Equation
Measuring Pressure
Weather symbol chart
Weather maps and charts
Mean conditions of the tropics, middle latitudes and polar regions
Atmospheres of other planets
Explore the hydrological cycles
A look at the current weather
Exercise to decode a surface weather station plot
Practice multiple choice exam
Practice true/false exam
29
Box 1.1 -- Moist air is lighter than dry air
For now we will define moist air as a volume of air with lots of water molecules
and dry air as a volume of air that contains only a few water vapor molecules. To
understand why moist air is lighter than dry air we have to define a few concepts.
A molecule is the smallest particle of a substance that still has the properties of that
substance. Molecules are composed of atoms. A molecule of water has the properties
of water and is composed of two hydrogen atoms and one oxygen atom.
The weight of an individual atom is represented by its atomic weight. The atomic
weight of hydrogen (H) is 1, oxygen (O) is 16, nitrogen (N) 14 and carbon (C) has an
atomic weight of 12. The weight of a molecule is determined by summing the atomic
weights of its atoms. A water molecule (H2O) has a molecular weight of 18
(1+1+16). Free nitrogen (N2) has a molecular weight of 28 (14+14) and an oxygen
molecule (O2) a weight of 32.
A fixed volume of a gas at constant pressure and temperature has the same number of
molecules. It does not matter what the gas is, the same number of molecules will
exist in that volume. This is known as Avogadro’s Law.
To make a given volume of air more moist, we need to add water vapor
molecules to the volume. To add water molecules to the volume, we must remove other
molecules to conserve the total number of molecules in the volume (Avogadro’s Law). A
fixed volume of air consists mostly of nitrogen and oxygen atoms, which weigh more
than water vapor molecules. Thus to make a given volume of air more moist we replace
heavy molecules with ones that are lighter. Thus moist air is lighter than dry air. Why is
it important that moist air is lighter than dry air? As we shall see later an ingredient for
30
the formation of severe thunderstorms is dry air above moist air, a condition we refer to
as an unstable atmosphere.
31
Box 1.2 -- The ideal gas law
Mathematics is a convenient and powerful tool for expressing physical ideas.
Most atmospheric processes can be explained in descriptive terms; however,
mathematical equations provide further insight. The ideal gas law describes the
relationship between pressure, temperature and volume of a gas. It is written as:
Pressure Volume = k Temperature
In this equation k is a constant of proportionality that depends on the size of the gas
sample. Although this law is an approximation of how a gas behaves, it is an excellent
one for atmospheric studies. The ideal gas law can also be written as
Pressure = R density Temperature
where R is a constant that depends on the gas. For dry air, the value of R is 287.05 J per
kg per K.
We will use the ideal gas law to understand the relationship between pressure,
volume and temperature of a gas. Changing one of these properties changes the other. To
do this it is common practice to fix or keep constant one variable. Let us start by
considering a fixed volume of a gas. You can envision this as a gas stored in a thick
metal container. If we double the absolute temperature of the gas, then, to make sure that
the left hand side of the equation equals the right hand side, the pressure inside the
container doubles. If we fix pressure at a constant value, then doubling the temperature
of the gas would also double the volume of the gas.
It is worthwhile to note that how one variable changes with respect to another
variable is the primary concept of calculus.
32
Box 1.3 - Why your ears pop.
Commercial airplanes fly at an altitude of about 33,000 feet where atmospheric
pressure is so low the plane must be pressurized, or all the passengers would have to
wear pressurized suits with a supply of oxygen. Although the plane cabin is pressurized,
the cabin pressure does change as the plane takes off and lands. Sometimes as the plane
rapidly ascends or descends our ears hurt. In fact, anytime you change altitude in a short
amount of time your ears may hurt or “pop.” Have you noticed that this discomfort
intensifies if you have a cold? Chewing gum or yawning alleviates this uncomfortable
feeling.
If you chart the changes in pressure throughout the day, you will observe that
pressure does not change much. Because pressure varies slowly with time, our bodies,
which have adapted to many different weather conditions, have had no need to adapt to
rapid changes in pressure. If there is a rapid change in pressure our bodies are slow to
react to it. To understand how a rapid pressure change hurts our ears we have to review
some biology.
The pinna (the part of the ear that is visible) collects sounds and directs the sound
waves down the auditory canal to the eardrum (tympanic membrane). Sound waves
traveling through air are variations in pressure. When these pressure variations strike the
eardrum they cause the eardrum to vibrate. Tiny bones (the hammer, anvil and stirrup)
sense these vibrations and pass them to the inner ear. To hear sounds distinctly requires
the tympanic membrane to vibrate freely, or to move in two directions equally. Air on
either side of the membrane exerts a pressure that maintains the proper tension for the
eardrum to vibrate. The ear is connected to the nasal passage and throat by the
33
Eustachian tube. This tube is a passageway for air to enter and leave the middle ear to
balance the pressure exerted by air on the auditory canal side of the eardrum.
A rapid change in altitude results in a pressure imbalance on the eardrum. When
the air pressure rapidly drops the eardrum bulges outward, causing discomfort. To
balance this pressure difference at the eardrum air molecules must escape through the
Eustachian tube. When you yawn or swallow you are allowing the Eustachian tube to
open and equalize this pressure difference. When the pressure inside your middle ear
adjusts to the outside pressure the eardrum returns to its normal tension. This movement
of the eardrum makes a popping sound. A cold may block the Eustachian tube making it
more difficult to adjust to changes in air pressure increasing the distortion of the eardrum
and causing pain.
34
Table 1.1 Water vapor, ozone and carbon dioxide, though they comprise a relatively small amount of
the atmosphere, are very important in weather and climate.
Gas % by volume
Nitrogen 78.08
Oxygen 20.95
Argon 0.93
Trace Gases
Carbon dioxide 0.035
Methane 0.00014
Ozone 0.000007
CFCs 0.00000001
Water vapor Highly Variable
35
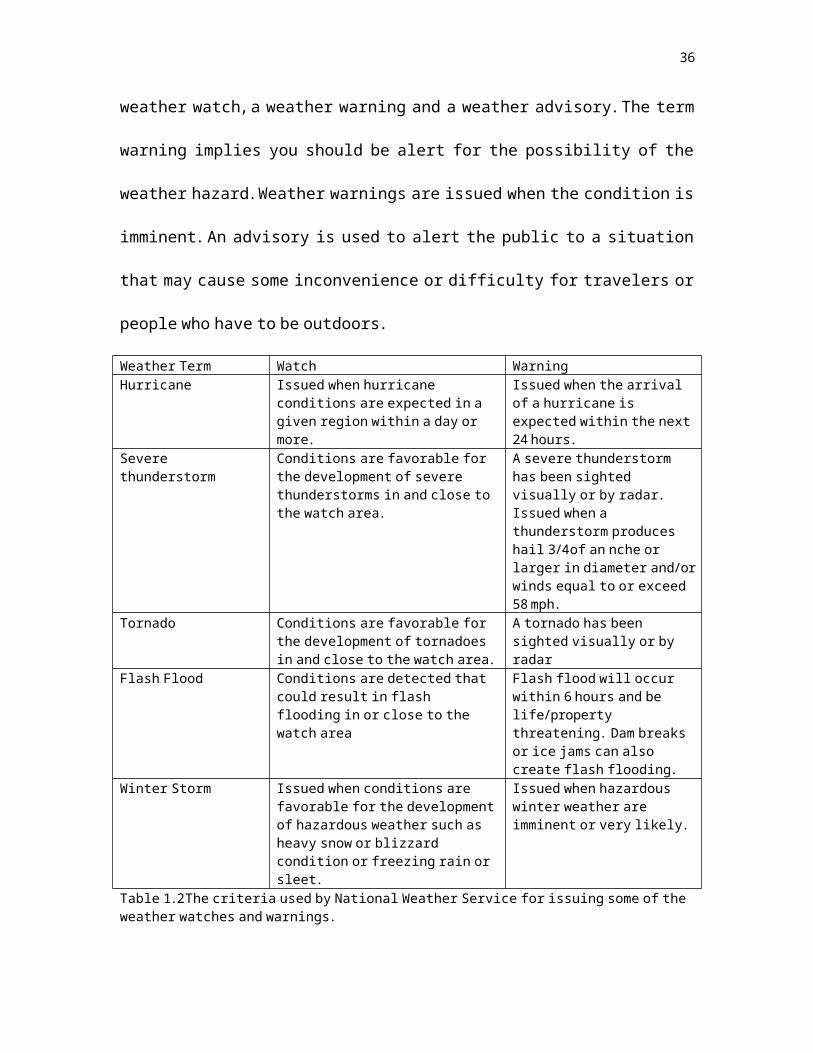
Table 1.2 Weather conditions associated with issuing watches and warnings.
Watch WarningHurricane Issued when hurricane
conditions are expected in a given region within a day or more.
Issued when the arrival of a hurricane is expected within the next 24 hours.
Severe thunderstorm wat A severe thunderstorm has been sighted visually or by radar
Tornado wat A tornado has been sighted visually or by radar
Flash Flood Conditions are detected that could result in flash flooding
Flash flooding has been reported or is imminent.
36
37