Embed Size (px)
Citation preview
HAL Id: tel-02573939https://tel.archives-ouvertes.fr/tel-02573939
Submitted on 14 May 2020
HAL is a multi-disciplinary open accessarchive for the deposit and dissemination of sci-entific research documents, whether they are pub-lished or not. The documents may come fromteaching and research institutions in France orabroad, or from public or private research centers.
L’archive ouverte pluridisciplinaire HAL, estdestinée au dépôt et à la diffusion de documentsscientifiques de niveau recherche, publiés ou non,émanant des établissements d’enseignement et derecherche français ou étrangers, des laboratoirespublics ou privés.
Tropical forest dynamics modeling for managementGrégoire Vincent
To cite this version:Grégoire Vincent. Tropical forest dynamics modeling for management. Systématique, phylogénie ettaxonomie. Université Montpellier 2 (Sciences et Techniques), 2015. �tel-02573939�
1
UNIVERSITE DE MONTPELLIER II
Sciences et Techniques du Languedoc
École Doctorale Systèmes Intégrés en Biologie, Agronomie, Géosciences, Hydrosciences, Environnement (SIBAGHE)
Mémoire d’Habilitation à Diriger des Recherches
“Tropical forest dynamics modeling for management » Présenté par Grégoire Vincent chargé de recherches à l’Institut de Recherche pour le Développement Soutenance le 03 février 2015 Jury composé de :
Mme Uta Berger, Professeure, HDR, Technische Universität Dresden , rapporteur Mme Catherine Collet, Chargée de recherche, HDR INRA LERFoB M Jean-François Dhôte, Directeur de recherche, HDR INRA – EFPA, rapporteur Mme Sylvie Durrieu, Ingénieure en Chef des Ponts des Eaux et des Forêts , IRSTEA – TETIS Mme Meriem Fournier, Ingénieure en Chef des Ponts des Eaux et des Forêts, HDR AgroParisTech LERFOB (Dir) M Valery Gond, Chargé de recherche, HDR CIRAD – BSEF M Bernard Riéra, Chargé de recherche, HDR CNRS, rapporteur

2
Content
Curriculum vitae .................................................................................................................................. 3
List of figures ....................................................................................................................................... 8
Introduction - Foreword ...................................................................................................................... 9
Tree-tree interactions and the modeling of tree stand dynamics ...................................................... 9
Competition for light and space ...................................................................................................... 9
Response to limiting light .............................................................................................................. 11
Light diffusion through complex canopies .................................................................................... 11
Canopy description ........................................................................................................................ 12
Laser scanners for canopy description .......................................................................................... 13
How predictable is whole tree response to light? ........................................................................ 15
Conclusion/open questions ........................................................................................................... 17
On the often elusive interpretation of “functional” trait values....................................................... 19
Box 3 : Intrinsic Water Use Efficiency measurement .................................................................... 20
Taking a new look at the forest: the LiDAR revolution ..................................................................... 24
Forest type mapping...................................................................................................................... 24
Forest degradation and recovery monitoring ............................................................................... 25
LAI estimate from ALS ................................................................................................................... 26
Detecting change in mortality rates over time and space ............................................................ 28
Can Bayes help break the curse of rare species? .............................................................................. 29
General concluding remarks ............................................................................................................. 31
References cited ................................................................................................................................ 32
Publication list (with students names underlined) ............................................................................... 38
Peer reviewed journal articles ........................................................................................................... 38
Book chapters .................................................................................................................................... 39
Conference proceedings.................................................................................................................... 39
Conference paper without proceedings............................................................................................ 40
Other papers (reports, working papers, software documentation) ................................................. 41
3
Curriculum vitae
Higher Education Ingénieur agronome ENSAIA-INPL, MSc in Agronomy (funded by Institut National de Recherche en Agronomie)
PhD in modelling/morphogenetics from Claude Bernard University Lyon I (funded by the French Ministry of Research and Technology)
Professional Experience 1989-1991 : Agronomist at CIRAD-La Réunion – Semi arid mountainous cropping systems
1991-1994 : Modelling the response of aromatic Pelargonium to pruning in order to improve mechanical harvesting efficiency (PhD program)
1995-1996 : Joined IRD as a member of the Research Unit 112 « Entre forêt et agriculture de la déforestation aux dynamiques agroforestières: pratiques paysannes, institutions locales et politiques d’environnement ». Posted one year at Laboratoire ERMES (Enseignement et Recherche sur les Milieux et les Sociétés) in Orléans, then
1996-2002 : Seconded to ICRAF (World agroforestry Center, CGIAR member) in Indonesia.
In charge of developing a program on ecology and modeling of agroforests. I started to set-up a permanent plot network in rubber agroforest, and to develop a traditional knowledge base on tree management while developing an individual-based model of tree-tree interactions. Rapidly I extended my research agenda from plot based-ecology to landscape scale (including biodiversity conservation and land-use change characterization through remote sensing techniques) and to socio-economics drivers of change in Sumatra. While posted in Indonesia I had the opportunity to train 14 Indonesian students and 5 French students who actively contributed to my research program.
My work was part of and partially funded by two international projects: RUPES : Rewarding Upland Poors for the Environmental Services they provide (funded by International Fund for Agricultural Development); Improving the Productivity of Rubber Smallholdings through Rubber Agroforestry System (funded by the Common Fund for commodities);
2002-2006: Re-located at AgroParisTech Montpellier (formerly ENGREF) for 3 years and joined AMAP research unit in 2005;
I continued to work on ecology and modeling of Indonesians agroforests (notably supervising 3 MSc Students and one PhD student working in Indonesia) while I was based in Montpellier. I also developed a process based tree growth model as a contribution to the HiSAFE model a model of temperate tree-crop system (Project SAFE : Silvoarable Agroforestry For Europe, PI C Dupraz funded by EU).
2006-2010: Posted in Kourou, French Guiana to study natural forest ecology
Worked principally on forest sapling ecology (regeneration ecology and hydrological niche characterization), and forest structure and dynamics assessment using airborne lidar (Light Detection and Ranging).

4
My activity was funded through various projects
BRIDGE : Bridging Information on Tree Diversity in French Guiana, and a Test of Ecological Theories (PI J Chave and C Baralotto, Funding ANR Agence Nationale pour la Recherche)
GUYAFOR : un réseau de dispositifs permanents pour un suivi à long terme des écosystèmes forestiers guyanais 2007-2010 : Estimation du stockage de carbone des forêts guyanaises (PI L Blanc, Funding FEDER Fond Européen de Développement Régional)
DYGEPOP : DYnamique et GEstion des POPulations d’arbres en forêt guyanaise aménagée (PI S. Guitet Funding FEDER Fond Européen de Développement Régional)
2010-2013: AMAP Montpellier
Since 2010 I have relocated to AMAP Montpellier still mostly involved in French Guiana. Current activities in French Guiana are funded through the following projects
DIADEMA : DIssecting Amazonian Diversity by Enhancing a Multiple taxonomic-groups Approach (PI C Baralotto, funding CEBA)
CANOPOR : Short term tropical forest canopy dynamics unveiled by Airborne Lidar Scanning (PI G. Vincent, funding CEBA)
STEMLEAF: STudies based on Experimental and Modelled waveforms for the LEAF (Lidar for Earth and Forests) mission (PI S. Durrieu, funding CNES)
I’ve also been animating a transversal project aiming at developing CEBA geocataloging platform of spatial data for CEBA (Centre d‘Etude de la Biodiversité Amazonienne)
Project money leveraged and managed (Since 2006) Guyafor 50k€; DygePop 80k€; Canopor 20 k€;
Additionally I was/am responsible for managing project money of BRIDGE for AMAP (33 k€), and DIADEMA (20k€)
Students supervision (15 BSc, 25 MSc) Authar S (1998) « Variability in Chlrophyll and Nitrogen content of leaves in a few forest species in
relation with canopy openness and location in tree crown ». BSc thesis Faculty of Forestry Bogor Agricultural Institute
Setiawan I (1998) “Photosynthetic Light-response curves of a few forest species; Comparison of curves obtained on intact or cut twigs” BSc thesis Faculty of Forestry Bogor Agricultural Institute
Harja Degi (1999) « An object oriented model of light capture by trees in a canopy » BSc Faculty of statistics and computer science Bogor Agricultural Institute
Azhima F. (1999). "Characterization of spatio-temporal variation of light under a rubber agroforest canopy" BSc thesis Faculty of Agrometeorology BSc Bogor Agricultural Institute
Asterinadewi T.(2000) "3D visualization of trees using Java object oriented language" BSc thesis Faculty of statistics and computer science, Bogor Agricultural Institute
5
Agus Ruhyana A. (2000) "Comparative study of growth and morphophysiological adaptations of tropical seedlings grown under a range of light levels" (MSc thesis Forestry Faculty, Bogor Agricultural Institute)
Cahyio Tri Hartono (2001) "Natural regeneration of woody species in Damar agroforest : tentative classification of their light requirement" MSc thesis Forestry Faculty, Bogor Agricultural Institute
Rasnovi S (2000) "A test of consistency between leaf morphotypes and taxa in the tree flora of Sumatra" MSc thesis, Conservation biology faculty, Bogor Agricultural Institute
Kartika R. S.(2000) "Influence of canopy structure on natural regeneration of rubber seedlings in rubber agroforests" BSc thesis Forestry department, Bogor Agricultural Institute
Martini E. (2001)"Water relations in seedlings of 5 species under gradual water stress with or without having experienced previous stress" BSc thesis Faculty of forestry, Bogor Agricultural Institute
Philippe L. (2001) "An analysis of abundance of timber species in rubber agroforests in two villages territory in Jambi- Sumatra" BSc Institut Supérieur Technique d'Outre-Mer
Carrier J. (2002) “Relationship between age of agroforest and understorey diversity” MSc thesis Tropical forestry Montpellier ENGREF (co-supervisor H de Foresta)
Smets K. (2001) “A preliminary assessment of insect predators importance in damar agroforest” MSc Tropical forestry Montpellier ENGREF (co-supervisor H de Foresta)
Nugraha H (2002) “Leaf survival analysis in a shading experiment using cox proportional hazard regression” BSc thesis Faculty of statistics and computer science, Bogor Agricultural Institute
Deasy Susanti D. (2002) "Stomata response of selected seedlings to water vapour pressure deficit" BSc thesis Faculty of Agrometeorology BSc Bogor Agricultural Institute
Remi Girault (2002) "Impact of neighbouring land-use on sapling richness in rubber agroforests" MSc thesis DEA Environnement Temps et Sociétés, Université d'Orléans
Ricard MC (2002) "Implementing a reward mechanism to support biodiversity conservation in rubber agroforests in Sumatra, a feasibility study for the MuaraBungo district" MSc thesis, ENITA Bordeaux
Marwan (2003) “Relationship between spectral signature and basal area and LAI in rubber agroforests” BSc thesis Bogor Agricultural Institute
Indu (2003) “High resolution hyperspectral imagery application to tree diversity survey” BSc thesis Bogor Agricultural Institute
Cerbonney L. (2003) « Ecocertification des bois issus des agroforêts à Hévéa dans la pénéplaine de Sumatra- Etude de faisabilité » MSc thesis DESS Conception de projets en éco-développement, Université de Lille 1
Calestrémé M. (2004) « Evaluation rapide de la biodiversité en mammifères des agroforêts à hévéas du district de Muara Bungo, à partir des connaissances écologiques locales, Province de Jambi, île de Sumatra », Mastère spécialisé en Sciences Forestières Option « Foresterie rurale et tropicale » ENGREF Montpellier
Rossi X. (2005) “Intensification of timber production in traditional rubber agroforestry systems in Jambi-Sumatra”, MSc Tropical forestry ENGREF Montpellier
Hmimina, G. (2007). « Comparaison interspécifique de la plasticité de traits foliaires : analyse des composantes de la variabilité fonctionnelle des arbres de forêt tropicale ». Stage de césure Agro-ParisTech, Paris-Grignon.
6
Fonty E. (2008). « Étude de l’écologie des peuplements forestiers de la Crique Plomb : Création et pérennisation d’un objet d’étude ». Mastère FNS ENGREF Département Foresterie Rurale et Tropicale. Montpellier: AgroParisTech
Danquechin-Dorval A. (2008). « Plasticité comparée des relations hydriques de trois espèces congénères de forêt tropicale du genre Eperua au stade plantule ». Master Fonctionnement des Ecosystèmes Naturels Et Cultivés (p. 31).Université de Montpellier 2
Cochet P. (2008). « Fonctionnement hydrique de trois espèces tropicales du genre Eperua. Lien entre plasticité des relations hydriques et niche écologique ». Master Agronomie, Forêt, Eau et Environnement (p. 35). Université Henry Poincaré Nancy I
Barkaoui K. (2009). « Importance relative de l’effet de niche et de la limitation par le recrutement dans la composition floristique stationnelle des arbres en forêt tropicale humide guyanaise ». (p. 56). Montpellier: SupAgro (co-encadrement J-F. Molino)
Benoist V. (2009). “Étude de la mortalité des arbres en forêt tropicale humide par laser aéroporté ». In, Master 2 Statistique et Informatique Socio-Économiques (p. 41). Université Lumière Lyon II (co-encadrement E. Rutishauser)
Rhoné M. (2009). « Fonctionnement hydrique de quelques espèces tropicales agrégatives ». Etude au stade juvénile en conditions semi contrôlées. Master 2 Agrobiologie (p. 33). Pau: Université de Pau et des pays de l'Adour
Alpha Niango C. (2010). « Segmentation de types forestiers sur la base de levé lidar aéroporté en forêt tropicale ». Master Statistiques (p. 61). Université Joseph Fourier, Grenoble (co-encadrement V. Rossi)
Artru S. (2010). « Régulation stomatique et niche écologique des espèces de forêt tropicale humide. » Master Fonctionnement des Ecosystèmes Naturels Et Cultivés, (p. 28). Montpellier 2 (USTL)
Rhijn M.v. (2010). « Diversité, plasticité et signification écologique des trajectoires allométriques, le cas d’une trentaine d’espèces en Guyane française. » Master Faculté des Sciences exactes et naturelles - Biodiversité tropicale (p. 66): Université des Antilles et de la Guyane (co-encadrement E. Nicollini)
Arias L. (2011). « Etude de la dynamique de juvéniles de 15 espèces d’arbre en forêt tropicale guyanaise », Master Bio évaluation des Ecosystèmes et Expertise de la Biodiversité (p. 101). Université Claude Bernard, Lyon I (co-encadrement M. Laurans)
Tramon M. (2012). « Apports des indices de texture dérivés d’un modèle numérique de canopée dans la stratification des forêts pour l’amélioration des prédictions de surfaces terrières ». Formation des Ingénieurs Forestiers (p. 93). Montpellier: AgroParisTech.
Robles-leon R. (2012) « Allocation de croissance en hauteur et en diamètre chez les arbres : apports du dispositif québécois » ; Rapport d’année de césure Formation des Ingénieurs Forestiers AgroParisTech Nancy
Chalant A. (2013). Modélisation de la croissance des espèces forestières tropicales. Master statistiques appliquées Institut Supérieur des Sciences Agronomiques, Agroalimentaires, Hor-ticoles et du Paysage (p.46) Rennes : Agrocampus Ouest (co-encadrement G Vieilledent)
Adjoudeme R. (2013) Evolution saisonnière de la densité de végétation analysée par lidar terrestre Master 1 Biologie Végétale Tropicale, Montpellier 2
Gin P. (2013) Développement d’un géocatalogue de métadonnées sur les données spatialisées de la biodiversité amazonienne guyanaise au sein d’un réseau pluridisciplinaire d’équipes de recherche (LabEx CEBA). Master 2 Géomatique mention « Science de l’Information Géoréférencée pour la Maîtrise de l’environnement et l’Aménagement des territoires » (SIGMA) (p.72)- Université de Toulouse (co-encadrement G. Viennois)

7
Alexandre, P. (2013). Développement d'outils de géovisualisation directement intégrables au géocatalogage sur la biodiversité Amazonienne. Master 2 Professionnel Mention informatique et Mention IGT Ingénierie et Gestion Territoriale Spécialité Géomatique. (p. 63) – Universités Montpellier 2 et Montpellier 3
Huertas C. (2013) Segmentation automatique ou semi-automatique des couronnes d’arbres en forêt tropicale à partir d’images satellites à haute résolution et de scans laser (LiDAR), (p.35). Montpellier : AgroParisTech
PhD students supervision (3)
• Rasnovi, S. (2006). Regeneration ecology of trees in rubber agroforests PhD (p. 186). BOGOR: Bogor Agricultural Institute (co-supervisor Cecep Kusmana and Soekisman Tjitrosemito)
• Laurans M. (2013) Rôle de la lumière dans la coexistence des espèces d’arbre de forêt tropicale humide : analyse des variations inter- et intra spécifiques des performances et traits fonctionnels (151 p.) Ecole doctorale Sibaghe (Dir. R Pélissier)
• Blaise T. (on going) Étude de la structure et de la dynamique forestière à l'échelle du paysage dans la zone des Nouragues grâce à l'apport de la technologie LiDAR (Dir. J Chave)
Additionally, I have supervised four groups of students during their 2 weeks field project in French Guiana in 2009, 2010, 2012, 2013.
8
List of figures Figure 1: Mean annual growth rate fluctuation over a two year period in a mixed rubber based agroforest in MuaraBungo district in Sumatra Indonesia (source World Agroforestry Center, unpublished). Monthly measurements were made at three heights on 10 trees per species ............. 10 Figure 2: Growth reduction in annual stem increment in exceptionally dry years in two sites of damar agroforest in Sumatra Indonesia; redrawn from (Vincent et al. 2009). ................................................ 10 Figure 3: Mango peripheral foliage display revealed by half crown pruning........................................ 12 Figure 4: Raw 3D point cloud of natural forest produced by airborne laser scanning (plot of 6 ha French Guiana, Montagne Plomb) ........................................................................................................ 13 Figure 5: A evergreen holm oak forest transect obtained from TLS at the experimental site of Puéchabon, France. ............................................................................................................................... 14 Figure 6: High density planting along the row and wide interrows in rubber generates alternate tilting to maximize space and light use (Indonesian Rubber Research Insitute, Sembawa Sumatra) ............ 15 Figure 7: Windbreak of Casuarina sp. (Tamil Nadu, India) a nitrogen fixator able pionneer species : main stem stays perfectly vertical despite strong anisotropy of light (© IRD - Nambiar-Veetil, Mathish). ............................................................................................................................................... 15 Figure 8: left: A simulated stand with random spacing. Right: A 3D view of the highlighted tree on the left side view.......................................................................................................................................... 16 Figure 9: A Sexi-FS simulated stand with arbitrary parameters and leafy texture at year 10, 20 and 30 (from top to bottom); left : front view, right : top view; note that a toric space is considered by which border trees on one side act as neighbors of border trees of the opposite side. ................................ 17 Figure 10 : Leaf isotopic discrimination of 16 Amazonian species (corrected for light exposure) (r, Pearson correlation coefficient) ............................................................................................................ 22 Figure 11: Leaf level ∆𝟏𝟏𝑪 content obtained in a greenhouse under contrasting water availability. Despite the contrasted hydrological niche of the species considered, the species effect is an order of magnitude less important than the water shortage effect on isotopic discrimination and intrinsic Water Use Efficiency. EF Eperua falcata, EG Epeura grandiflora, ER Eperua rubuginosa. ................... 22 Figure 12: Leaf level ∆𝟏𝟏𝑪 of Spirotropis longifolia saplings sampled either in a thalweg or on a ridge and either in a gap or in the understorey . ........................................................................................... 23 Figure 13: Snapshots of Canopy Height Model for different forest type (rows). Left: 64x64m² plots, Right: 32x32m² plots. The texture of the Canopy Height Model is key to distinguishing forest types when mean height is not discriminant (Kennel et al. 2013) ................................................................. 24 Figure 14: Fifteen years after logging, LiDAR echo point cloud profile reveals strong difference in mean height canopy. Processing LiDAR data using ray tracing further reveals a qualitative change in vegetation vertical distribution and notably higher maximum vegetation density in logged over forest. Logging intensities increase from T0 (control) to T3 (ca. half of initial Basal Area removed). Paracou, French Guiana. ....................................................................................................................... 26 Figure 15: Cumulated “pseudo” backscattered cross-section per shot (assuming 100% target reflectivity). ........................................................................................................................................... 27 Figure 16: To get large trees have to live long enough. Mean mortality rates of 150 abundant species in Paracou (over the period 1991-2011) plotted against species stature. Dotted line 95% regression line ......................................................................................................................................................... 30
9
Introduction - Foreword This report explores some issues related to the use of tropical forest dynamics modeling as a management tool. A large part of my experience as a scientist has indeed been acquired in the field of tropical forest modeling. My initial work on plant morphogenesis modeling using L-systems conducted while working for CIRAD in La Réunion is not covered in this report. I have also left out the research conducted in Indonesia on forest biodiversity conservation value of agroforests. The selection of topics reflects current major thrusts of my work at AMAP. The first section is a brief essay on tree-tree interaction in a stand and builds heavily on the studies of rubber and damar agroforests in Sumatra, Indonesia. The second section exposes – through the example of water relations in trees – some of the difficulties one faces when using functional traits to describe and decipher functional diversity in tropical moist forests. A third section discusses recent advances in forest modeling stemming from the application of LiDAR to forest characterization. The last section is a brief comment on the potential role I foresee for Hierarchical Bayesian Modeling in modeling of hyper diverse tropical forest.
Tree-tree interactions and the modeling of tree stand dynamics Longer lifespan, larger stature, more complex architecture and wider range of phenological options of trees compared to annual crops make modeling of multispecies tree stands dynamics somewhat specific.
Tropical tree species display a wide range of leafing patterns deciduous with synchronous or asynchronous leaf drop, or evergreen with continuous or seasonal leaf flushing. The typically longer lifespan of trees confers particular importance to processes such as reserves storage and remobilization (of carbohydrates or nutrients) and hence temporality of growth within an annual cycle and between years and the nutrient budget over the years. Another consequence of long term development is that any particular development path may constrain the future development for many years ahead and notably the future options in terms of space occupation.
Competition for light and space Trees at a competitive disadvantage die from crowding and suppression as a stand approaches a limiting number of trees of a given average size that can coexist within the area. This so-called self-thinning mortality is the ultimate fate of the outcompeted trees unless a change in local resource availability allows them to recover from their suppressed status. In this competition for growth and survival access to light plays a critical role but space, water and nutrients are other resources which neighbouring trees compete for. From a managerial point of view identifying which is the most limiting resource may be extremely relevant but may also prove quite difficult. It may not even be possible in principle. According to the optimal foraging hypothesis “Plants should adjust allocation so that all resources equally limit growth” (Bloom et al. 1985) and therefore plant growth may predominantly be co-limited by various resources rather than by a single resource. Furthermore in multispecies stands requirements may differ between species (and vary during the course of their development) so the concept of single most limiting resource may be quite elusive indeed. In the following however we, somewhat arbitrarily, focus on light rather than belowground resources. This is not meant to downplay the role of soil fertility which is essential to consider in any agroforestry system including multispecies tree stands. There is nonetheless a practical reason to focus on light and space apportioning in a tree mixture since this may be the most readily controllable parameter in an agroforest. By carefully planning the spatial arrangement of the co-
10
planted species the practitioner can shape the current and future local competitive environment of each tree. The practitioner’s role does not end with planting of course and later intervention may include thinning a standard practice in forest management, but also pruning, transplanting, etc…
Box 1: The temporal dimension of tree-tree interaction
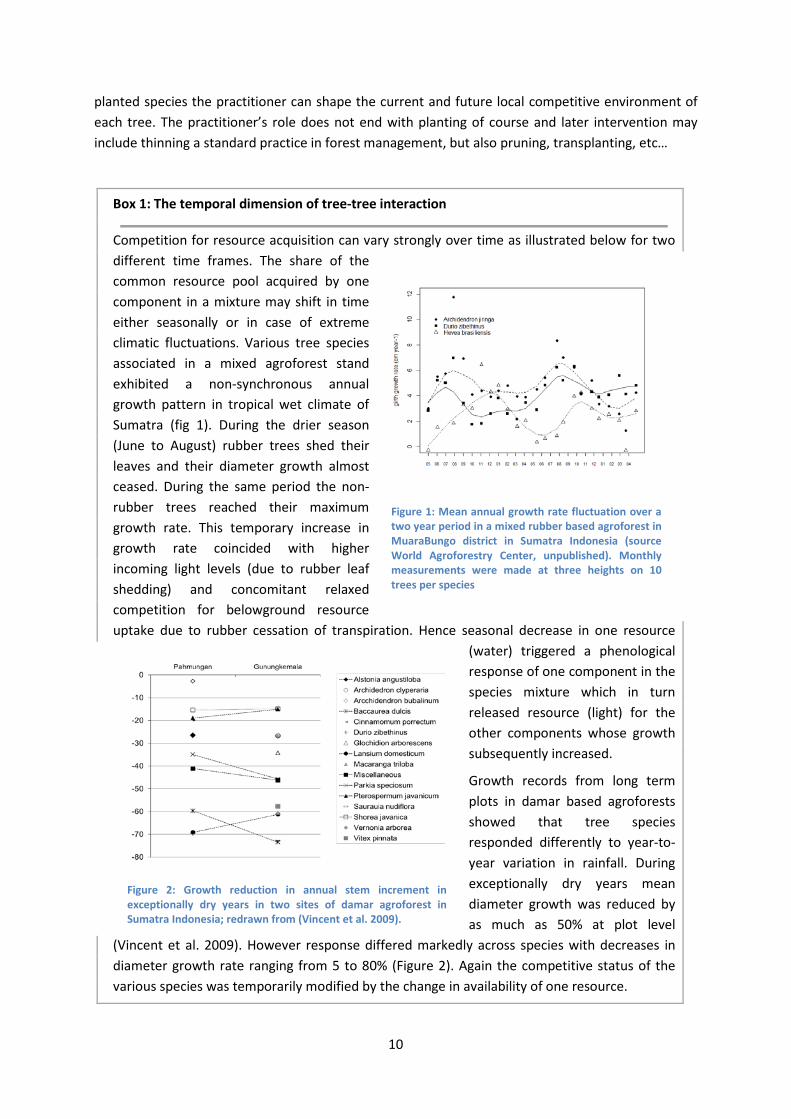
Competition for resource acquisition can vary strongly over time as illustrated below for two different time frames. The share of the common resource pool acquired by one component in a mixture may shift in time either seasonally or in case of extreme climatic fluctuations. Various tree species associated in a mixed agroforest stand exhibited a non-synchronous annual growth pattern in tropical wet climate of Sumatra (fig 1). During the drier season (June to August) rubber trees shed their leaves and their diameter growth almost ceased. During the same period the non-rubber trees reached their maximum growth rate. This temporary increase in growth rate coincided with higher incoming light levels (due to rubber leaf shedding) and concomitant relaxed competition for belowground resource uptake due to rubber cessation of transpiration. Hence seasonal decrease in one resource
(water) triggered a phenological response of one component in the species mixture which in turn released resource (light) for the other components whose growth subsequently increased.
Growth records from long term plots in damar based agroforests showed that tree species responded differently to year-to-year variation in rainfall. During exceptionally dry years mean diameter growth was reduced by as much as 50% at plot level
(Vincent et al. 2009). However response differed markedly across species with decreases in diameter growth rate ranging from 5 to 80% (Figure 2). Again the competitive status of the various species was temporarily modified by the change in availability of one resource.
Figure 1: Mean annual growth rate fluctuation over a two year period in a mixed rubber based agroforest in MuaraBungo district in Sumatra Indonesia (source World Agroforestry Center, unpublished). Monthly measurements were made at three heights on 10 trees per species
Figure 2: Growth reduction in annual stem increment in exceptionally dry years in two sites of damar agroforest in Sumatra Indonesia; redrawn from (Vincent et al. 2009).
11
Response to limiting light A fairly general pattern of adaptation observed under deep shade entails a series of physiological changes such as reduction in dark respiration, reduction in leaf mass per area, alteration of chlorophyll a:b ratio as well as less conspicuous changes such as reduction in leaf turnover rates (Henry and Aarssen 2001; Laurans et al. 2012; Vincent 2001; Vincent 2006). Plants and notably trees may also display a shade avoidance response. The shade avoidance response entails modifying the growth characteristics such as the height:diameter ratio of the stem but also the branching intensity and the leaf area ratio (Henry and Aarssen 2001; Laurans and Vincent in prep). The increase in height growth relative to diameter increment has long been noted and this “etiolation” response is known to be triggered by the reduction in the ratio of Red (R) to Far Red (FR) radiation in crowded conditions (Aphalo et al. 1999; Gilbert et al. 2001). However recent analyses on (large) trees suggest that plasticity in H:DBH is not systematically related to species light requirement neither in tropical species (Harja et al. 2012) nor temperate species (Robles-Leon 2012). Nonetheless the ranking of species by light requirement and plasticity would appear to be consistent within particular phylogenetic groups (e.g. Pinaceae) in which species share common developmental/architectural constraints (Robles-Leon 2012). This suggests that the architectural model sets some limits to the possible morphogenetic paths a tree may take in response to specific light constraints. Foraging for light in plants is not restricted to increased allocation to height growth but may include several morphogenetic responses. Phototropism which allows plants to develop preferentially towards canopy gaps is mediated by blue light photoreceptors (Ballare et al. 1995; Franklin and Whitelam 2005). In trees such a capability probably contributes much to asymmetric crown development and efficient canopy space filling (Brisson 2001; Muth and Bazzaz 2002; Muth and Bazzaz 2003; Olesen 2001). Overtopped trees may adapt to low light levels by altering their architecture. Yellow birch (Betula alleghaniensis) is considered an extremely plastic species and is capable of displaying a variety of morphological responses including basal reiteration and lateral development when overtopped (Millet 2012). Reduced height extension and lateral expansion of crown by non-sequential (delayed) more orthotropic shoots on lower branches may be a common habit of individuals of the shade tolerant Balsam Fir (Abies balsamea) growing under closed canopy (Y Caraglio pers. Comm.). Evaluating the role of light in shaping the outcome of competition in a mixed species stand first requires assessing how light is apportioned between plants within the mixture, which in turn implies a/ to describe the stand i.e. the individual trees and their relevant 3D geometrical and optical characteristics to a convenient degree of detail b/ to identify and quantify the whole tree individual growth and development given the level of intercepted light.
Light diffusion through complex canopies There is an abundant literature dealing with the modeling of solar radiation diffusion through a canopy. The basics are covered in (Campbell and Norman 1997). Various degrees of refinement of light partitioning over time and in a stand may be required depending on the agrosystem considered, the degree of seasonality (see box 1), the specific questions to be addressed, etc.
12
The general approach for computing light interception by a canopy is directional sampling of the sky hemisphere and spatial sampling of the scene and to determine for each corresponding ray if there is a direct path to the top of canopy. Photosynthetically Active Radiation (PAR, 400-700 nm) apportioning among individuals is computed by summation for each time step over all directions of the intercepted light energy. Light impinging on a leaf can be absorbed or scattered (transmitted or reflected), leaf absorptance is typically > 90% in woody plant species between 400 and 700nm wavelength (Bauerle et al. 2004). Scattering is therefore usually considered to be negligible when computing PAR transmission through a canopy which is not the case for Infra-Red wave length (Chelle and Andrieu 2007).
A radiation model is needed to compute the energy associated with each ray. The entire hemisphere is divided into sectors. Each corresponding direction is given a weight equivalent to the incoming light from that sector which depends on the extraterrestrial solar radiation (and thus latitude, longitude, date and time) modified by atmospheric characteristics (Campbell and Norman 1997). Incoming light is decomposed into two components direct solar radiation and diffuse (scattered by the atmosphere). The diffuse and direct light components can be modeled from global daily radiation (Spitters et al. 1986).
There are a number of computer programs available to compute light within a heterogeneous tree canopy. They come as standalone software (e.g. MAPFLUX (Bartelink 1995; Bartelink 1998), MIXLIGHT (Stadt and Lieffers 2000), SLIM (Vincent and Harja 2002), MμSLIM (Da Silva et al. 2011) or as modules in libraries SAMSARALIGHT (Courbaud et al. 2003) available under the CAPSIS modeling platform (Dufour-Kowalski et al. 2012) or MMR (Dauzat et al. 2008; Dauzat et al. 2001) available through the AMAPStudio plant architecture software modeling suite (Griffon and Coligny 2012). They differ in the specifics of the radiation model, the time step at which computations are carried out, the geometrical description of the trees.
Canopy description Our ability to describe light diffusion within a heterogeneous tree stand canopy is often primarily limited by our capability to describe the relevant physical features of the stand in a sufficiently precise way due to the geometrical complexity of a tree crown. Foliage spatial arrangement characteristics such as leaf area density, spatial distribution within the crown and notably degree of clumping and leaf angular distribution significantly affect the amount of intercepted light for a given light regime. A general approach is to apply a modified Beer Lambert’s law to describe the attenuation of light along the optical path through the crown (e.g. (Gower et al. 1999)).
𝐼𝐼0
= 𝑒−𝑘𝜃.Ω𝜃.𝐿𝐿𝐿.𝑑
Where Ω𝜃 is a clumping factor (1 if random, <1 if clumped and >1 if regular) 𝑘𝜃 the specific extinction factor (which will depend on the angular distribution of leaves and
their optical properties); if leaves are considered opaque then k is the fraction of leaf area projected on a plane perpendicular to the beam direction 𝜃.
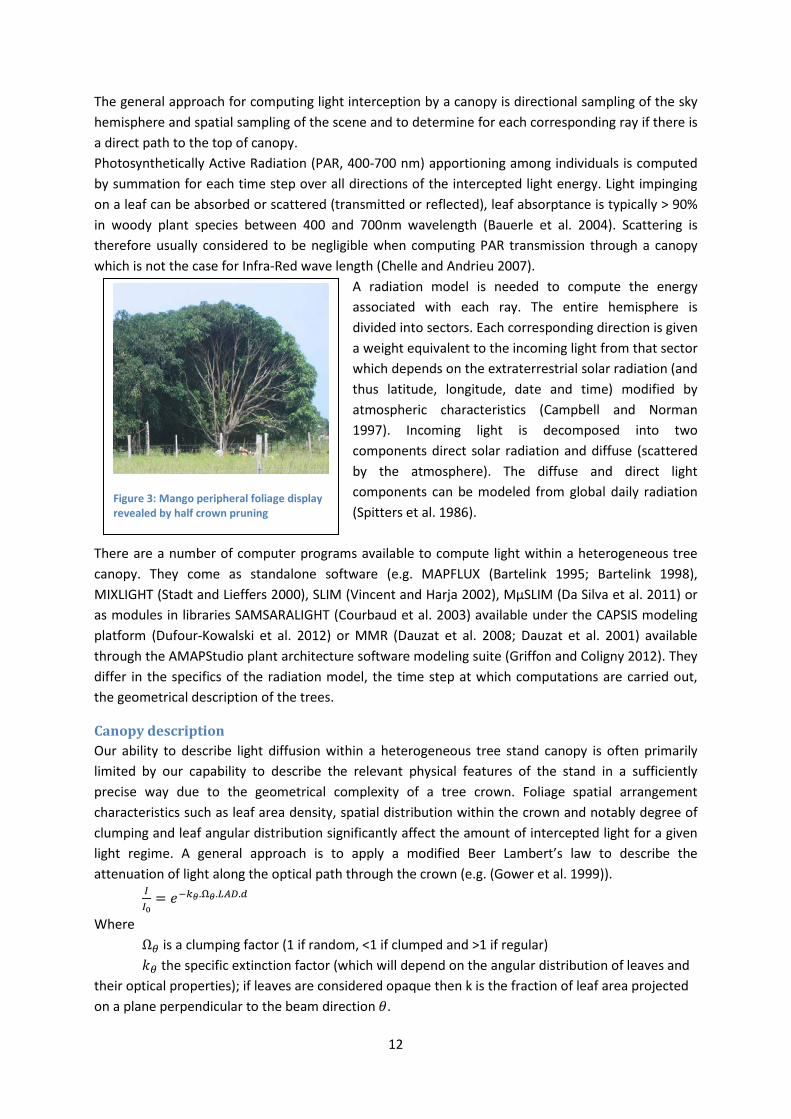
Figure 3: Mango peripheral foliage display revealed by half crown pruning
13
LAD the Leaf Area Density (the ratio of leaf area per unit crown volume) d the path length through the crown I outgoing light intensity I0 incoming light intensity. The relevance of simple functions to describe the leaf distribution angles is examined and
discussed in (Campbell 1986). Note that in the above branches are simply neglected (treated as foliage). The crown envelop of a tree has typically been described by more or less regular surfaces constrained by a small set of points derived from field measurements of tree height, crown base height, crown radial extension in a few directions (Boudon and Moguedec 2006; Cescatti 1997; Da Silva D. 2008; Vincent and Harja 2002). As an alternative to the turbid medium approach to modeling light extinction within a crown a surface based approach has been proposed (Vincent and Harja 2002). Essentially when the leaves are preferentially located at the periphery of the crown as it may be the case (fig 3) and porosity to light is independent of the direction of the incoming light then representing crown as a porous envelop may be a relevant approximation much more tractable in terms of parameterization. Recent
developments of the Capsis module SAMARALIGHT (http://capsis.cirad.fr/capsis/models) implement both approaches thereby providing a way to compare the two easily. More generally modeling can help define the relevant level of detail to be used to achieve a particular precision in light partitioning description (Da Silva et al. 2011).
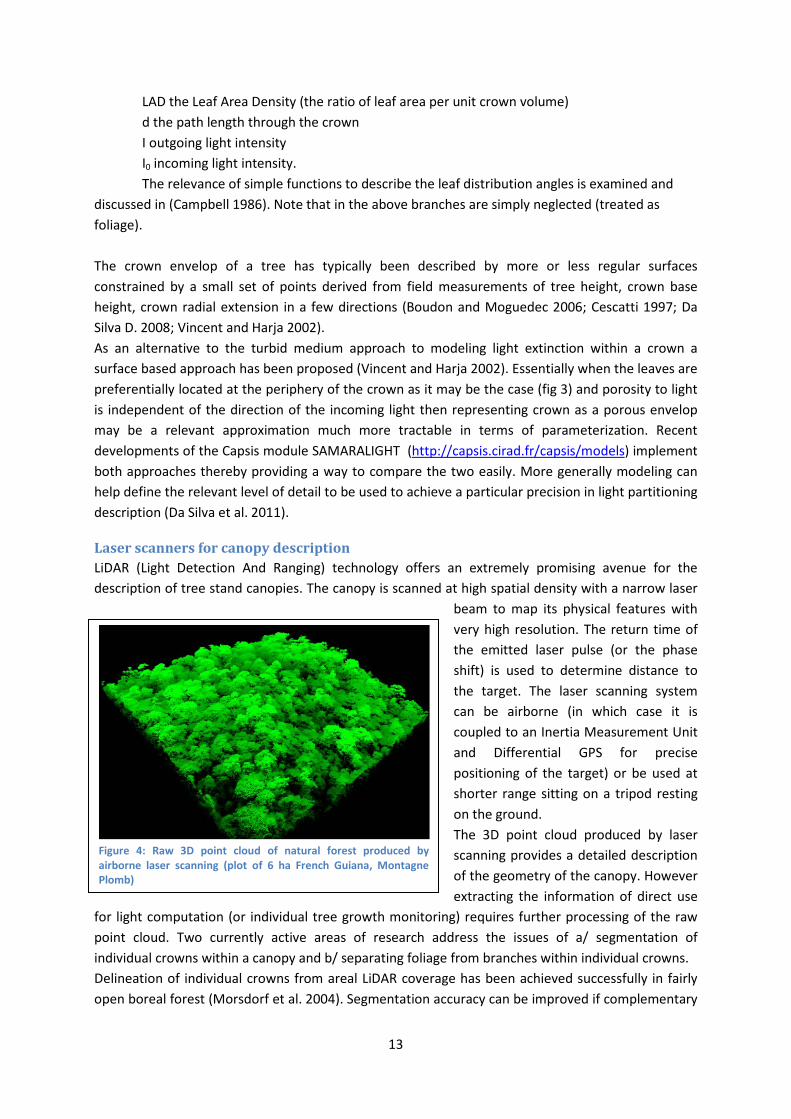
Laser scanners for canopy description LiDAR (Light Detection And Ranging) technology offers an extremely promising avenue for the description of tree stand canopies. The canopy is scanned at high spatial density with a narrow laser
beam to map its physical features with very high resolution. The return time of the emitted laser pulse (or the phase shift) is used to determine distance to the target. The laser scanning system can be airborne (in which case it is coupled to an Inertia Measurement Unit and Differential GPS for precise positioning of the target) or be used at shorter range sitting on a tripod resting on the ground. The 3D point cloud produced by laser scanning provides a detailed description of the geometry of the canopy. However extracting the information of direct use
for light computation (or individual tree growth monitoring) requires further processing of the raw point cloud. Two currently active areas of research address the issues of a/ segmentation of individual crowns within a canopy and b/ separating foliage from branches within individual crowns. Delineation of individual crowns from areal LiDAR coverage has been achieved successfully in fairly open boreal forest (Morsdorf et al. 2004). Segmentation accuracy can be improved if complementary
Figure 4: Raw 3D point cloud of natural forest produced by airborne laser scanning (plot of 6 ha French Guiana, Montagne Plomb)
14
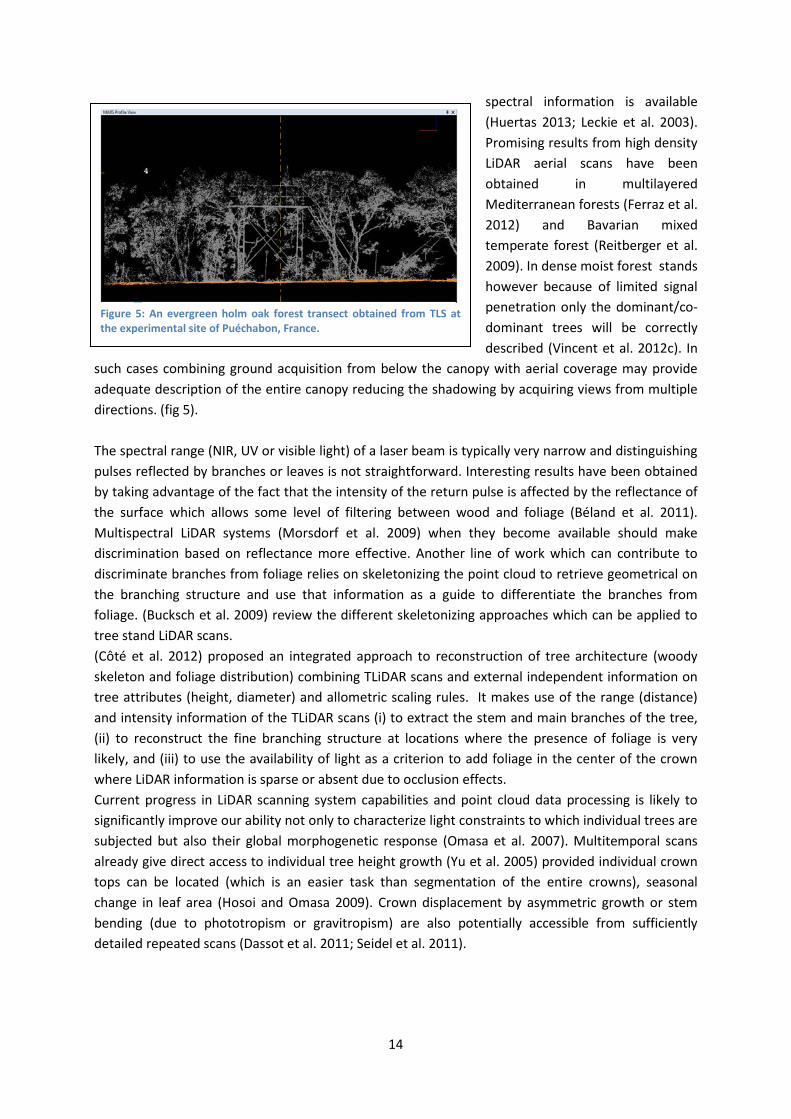
spectral information is available (Huertas 2013; Leckie et al. 2003). Promising results from high density LiDAR aerial scans have been obtained in multilayered Mediterranean forests (Ferraz et al. 2012) and Bavarian mixed temperate forest (Reitberger et al. 2009). In dense moist forest stands however because of limited signal penetration only the dominant/co-dominant trees will be correctly described (Vincent et al. 2012c). In
such cases combining ground acquisition from below the canopy with aerial coverage may provide adequate description of the entire canopy reducing the shadowing by acquiring views from multiple directions. (fig 5). The spectral range (NIR, UV or visible light) of a laser beam is typically very narrow and distinguishing pulses reflected by branches or leaves is not straightforward. Interesting results have been obtained by taking advantage of the fact that the intensity of the return pulse is affected by the reflectance of the surface which allows some level of filtering between wood and foliage (Béland et al. 2011). Multispectral LiDAR systems (Morsdorf et al. 2009) when they become available should make discrimination based on reflectance more effective. Another line of work which can contribute to discriminate branches from foliage relies on skeletonizing the point cloud to retrieve geometrical on the branching structure and use that information as a guide to differentiate the branches from foliage. (Bucksch et al. 2009) review the different skeletonizing approaches which can be applied to tree stand LiDAR scans. (Côté et al. 2012) proposed an integrated approach to reconstruction of tree architecture (woody skeleton and foliage distribution) combining TLiDAR scans and external independent information on tree attributes (height, diameter) and allometric scaling rules. It makes use of the range (distance) and intensity information of the TLiDAR scans (i) to extract the stem and main branches of the tree, (ii) to reconstruct the fine branching structure at locations where the presence of foliage is very likely, and (iii) to use the availability of light as a criterion to add foliage in the center of the crown where LiDAR information is sparse or absent due to occlusion effects. Current progress in LiDAR scanning system capabilities and point cloud data processing is likely to significantly improve our ability not only to characterize light constraints to which individual trees are subjected but also their global morphogenetic response (Omasa et al. 2007). Multitemporal scans already give direct access to individual tree height growth (Yu et al. 2005) provided individual crown tops can be located (which is an easier task than segmentation of the entire crowns), seasonal change in leaf area (Hosoi and Omasa 2009). Crown displacement by asymmetric growth or stem bending (due to phototropism or gravitropism) are also potentially accessible from sufficiently detailed repeated scans (Dassot et al. 2011; Seidel et al. 2011).
Figure 5: An evergreen holm oak forest transect obtained from TLS at the experimental site of Puéchabon, France.
15
How predictable is whole tree response to light? The lack of adequate data have so far largely prevented effectively taking into account morphogenetic qualitative or quantitative response of trees to local crowding in models except in an fairly exploratory mode (Vincent and Harja Asmara 2008). There is abundant evidence that tree alllometric relations between height, diameter and crown size of individual trees depend on the local competitive context (Antin et al. 2013; Fortin et al. 2009; Harja et al. 2012; Pretzsch and Dieler 2012; Vincent et al. 2012a) and that this response is very much species dependent.
We conducted an analysis of 77876 stems height records of 15 abundant species from the Forest Inventory of Québec (Ministère des Ressources Naturelles et de la Faune, Québec). Competitive status was defined as the difference between subject tree diameter and plot mean quadratic diameter. It was found that height:diameter ratio varied in a non-monotonic fashion with competitive status in many species. Even though all species gradually increased height as the competitive status moved from dominant to co-dominant, suppressed trees tended to be either squatter or more slender depending on the species (Vincent et al. in prep). Hence many species did not display the expected increased slenderness over the entire range of social statuses explored from dominant to suppressed. The peculiar shade acclimation response which translates into preferred increase in diameter over height growth when overtopped requires further scrutiny as its morphogenetic basis is likely to vary across species (Millet 2012).
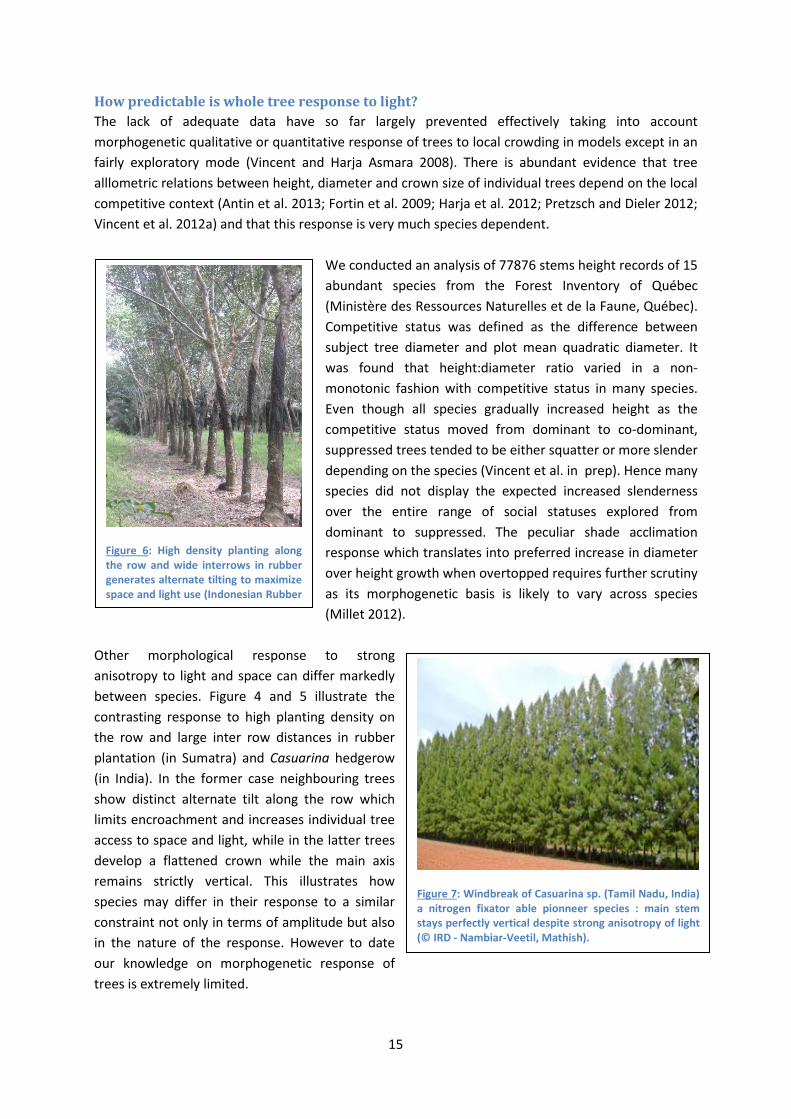
Other morphological response to strong anisotropy to light and space can differ markedly between species. Figure 4 and 5 illustrate the contrasting response to high planting density on the row and large inter row distances in rubber plantation (in Sumatra) and Casuarina hedgerow (in India). In the former case neighbouring trees show distinct alternate tilt along the row which limits encroachment and increases individual tree access to space and light, while in the latter trees develop a flattened crown while the main axis remains strictly vertical. This illustrates how species may differ in their response to a similar constraint not only in terms of amplitude but also in the nature of the response. However to date our knowledge on morphogenetic response of trees is extremely limited.
Figure 6: High density planting along the row and wide interrows in rubber generates alternate tilting to maximize space and light use (Indonesian Rubber
Figure 7: Windbreak of Casuarina sp. (Tamil Nadu, India) a nitrogen fixator able pionneer species : main stem stays perfectly vertical despite strong anisotropy of light (© IRD - Nambiar-Veetil, Mathish).
16
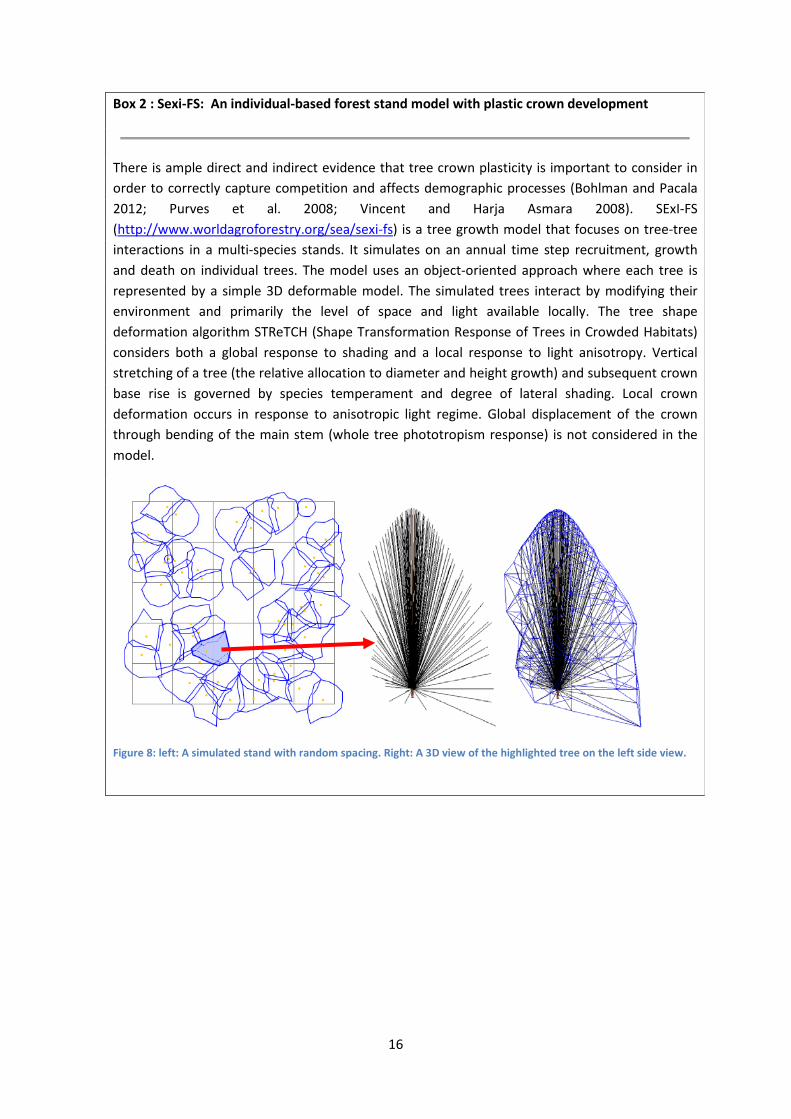
Box 2 : Sexi-FS: An individual-based forest stand model with plastic crown development
There is ample direct and indirect evidence that tree crown plasticity is important to consider in order to correctly capture competition and affects demographic processes (Bohlman and Pacala 2012; Purves et al. 2008; Vincent and Harja Asmara 2008). SExI-FS (http://www.worldagroforestry.org/sea/sexi-fs) is a tree growth model that focuses on tree-tree interactions in a multi-species stands. It simulates on an annual time step recruitment, growth and death on individual trees. The model uses an object-oriented approach where each tree is represented by a simple 3D deformable model. The simulated trees interact by modifying their environment and primarily the level of space and light available locally. The tree shape deformation algorithm STReTCH (Shape Transformation Response of Trees in Crowded Habitats) considers both a global response to shading and a local response to light anisotropy. Vertical stretching of a tree (the relative allocation to diameter and height growth) and subsequent crown base rise is governed by species temperament and degree of lateral shading. Local crown deformation occurs in response to anisotropic light regime. Global displacement of the crown through bending of the main stem (whole tree phototropism response) is not considered in the model.
Figure 8: left: A simulated stand with random spacing. Right: A 3D view of the highlighted tree on the left side view.
17
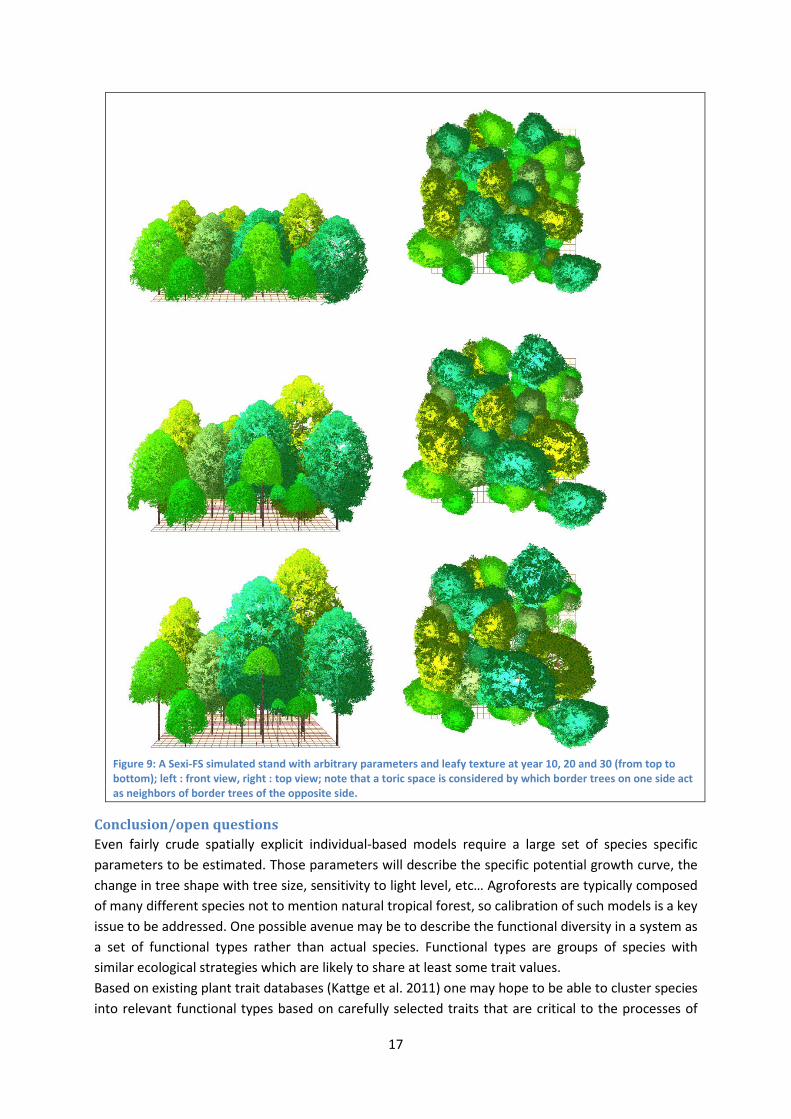
Figure 9: A Sexi-FS simulated stand with arbitrary parameters and leafy texture at year 10, 20 and 30 (from top to bottom); left : front view, right : top view; note that a toric space is considered by which border trees on one side act as neighbors of border trees of the opposite side.
Conclusion/open questions Even fairly crude spatially explicit individual-based models require a large set of species specific parameters to be estimated. Those parameters will describe the specific potential growth curve, the change in tree shape with tree size, sensitivity to light level, etc… Agroforests are typically composed of many different species not to mention natural tropical forest, so calibration of such models is a key issue to be addressed. One possible avenue may be to describe the functional diversity in a system as a set of functional types rather than actual species. Functional types are groups of species with similar ecological strategies which are likely to share at least some trait values. Based on existing plant trait databases (Kattge et al. 2011) one may hope to be able to cluster species into relevant functional types based on carefully selected traits that are critical to the processes of
18
interest. The paradigm on which such a hope rests is that particular combinations of traits (or trait values) define plant functional types with consistent niche and ecological performance (Kraft et al. 2008). This could significantly alleviate the calibration efforts to be made. However identifying which functional traits and functional types should be considered is far from obvious. Potentially useful candidate traits include traits such as nitrogen fixing capability, rooting depth, hydraulic conductance (xylem resistance to cavitation (Cochard et al. 2008) but see (Maherali et al. 2004)), leaf mass per area, wood density, life history traits (age of sexual maturity, seed production,…), stature (maximum tree height or diameter). To date the largest public plant trait database http://www.try-db.org/de/TabDetails.php contains both plant functional traits sensu (Violle et al. 2007) which are traits measurable at individual plant level and species parameters (life history traits such as lifespan or global species characteristics such as tolerance to fire). Few traits in the TRY database are related to tree architecture (mostly physiognomy based like the furcation ratio rather than architecture based) and virtually no traits related to morphogenetic plasticity are yet included. The incorporation of morphogenetic traits in addition to more conventional plant traits would add explicit consideration of time in development of plant body. Ontogeny is of particular resonance for plants which typically show indeterminate growth and often face varied environmental (biotic and abiotic) stresses throughout their life time. The architectural development (and its plasticity) will control the precise spatial placement and timing of organ display and turnover and thereby affect growth performance and fitness. However development strategy does not easily lend itself to being broken down into elementary traits and the quest for relevant architectural functional traits is still open. Nonetheless because morphological, physiological and architectural traits are expected to co-evolve rather than to be independently selected, consistent morphogenetic strategies are likely to be correlated to syndromes of traits more regularly measured and collected. More on functional traits in the next section…
19
On the often elusive interpretation of “functional” trait values In this section I present unpublished research results to illustrate some of the difficulties that need to be overcome before meaningfully incorporating a functional trait approach to forest dynamics modeling.
Commonly used traits in plant ecology can often be attached to a specific dimension of the functional traits space such as resource capture and use (Specific leaf area, leaf N content, body size), or life history traits (seed mass, seed number, age of sexual maturity...) and survival strategy (wood density, leaf toughness,…). However, it seems that functional traits which are measured on individual trees are often chosen based on an accessibility criterion rather than because they can consistently be linked to a particular function or set of functions. While some species traits (growth form, size, fruit type, deciduousness, presence of pneumatophores,…) unequivocally inform on species niche or species strategy, many tree level traits may be much more difficult to interpret (bark thickness, wood density or even 13C content). In this section we examine the case of 13C content which is easy to measure and therefore is commonly recorded.
The climate in French Guiana is driven by the north/south movements of the Inter-Tropical Convergence Zone, which cause large seasonal variations in rainfall. During the dry season in French Guiana there is a measurable decrease of transpiration in spite of the observed increase of evaporative demand (Bonal et al. 2000; Granier et al. 1992; Roche 1983). Furthermore intra-annual variation in growth rate has been related to soil water content (Wagner et al. 2012). Hence it is safe to consider that water availability is, at least at times, limiting in the area. One may therefore expect that differences in Water Use Efficiency (WUE) will contribute to shaping the hydrological niche of co-occurring species. Species more efficient in their water use should have a competitive advantage over less efficient species in areas where soil water deficit is likely to occur on a regular basis. Conversely in areas where water is always abundant maximizing carbon uptake irrespective to water use efficiency should prove a better competitive strategy. Is this the case? We must first critically examine the reliability of WUE values. Instantaneous WUE, the ratio of CO2 uptake to H20 loss can be measured by gas exchange measurements conducted at leaf level. Instantaneous WUE is however highly dependent on current environmental conditions and subject to short term variations of high amplitude (Jones 1993). On the other hand « intrinsic » WUE which is accessible through dosage of isotopic content of leaf tissue is more integrative. This ratio is commonly used as a long term indicator of leaf internal regulation of C02/H20 fluxes (Griffiths 1991). Environmental conditions (and notably evaporative demand, Photosynthetic Photon Flux Density (PPFD), Soil Water Content (SWC)) may however greatly affect this intrinsic WUE. Hence when comparing individuals/species care should be taken so as to control as much as possible for those environmental factors, and ideally comparison should be conducted on organs of similar age collected on the same site at the same time. In an attempt to assess robustness of this trait we have compared estimates for a set of species obtained from isotopic dosage in two different data sets. In the BRIDGE project leaves of adult trees were systematically sampled from 9 one ha plots of terra firme forest scattered over French Guiana and their local light exposure recorded (Baraloto et al. 2010). In the DyGEPop project leaves were

20
collected in two sites (Paracou Experimental Station, and Piste Saint Elie) from saplings belonging to 16 species growing in a range of Canopy Openness (Vincent et al. 2012b) but excluding water logged areas. In both cases WUE was corrected for light exposure by introducing a Light index co-variable. Box 3 : Intrinsic Water Use Efficiency measurement
Two stable isotopes of carbon exist in the atmosphere 12C et 13C (molecular ratio 89 :1). The value of this ratio in plants is informative of plant functioning because diffusive and carboxylation processes discriminate differently against 13C . 𝛿13𝐶 laboratory values of 13C dosage are usually expressed as concentration relative to a international standard (Vienna PeeDee Belemnite). These values are typically negative (average -27 ‰) and are converted into discrimination values relative to the source (𝛿13𝐶𝑎𝑎𝑎) and noted ∆13𝐶 (Farquhar et al. 1989).
∆13𝐶=𝛿13𝐶𝑎𝑎𝑎 − 𝛿13𝐶𝑝𝑝𝑎𝑝𝑎
1 + 𝛿13𝐶𝑝𝑝𝑎𝑝𝑎
Note that positive values of ∆13𝐶 are indicative of a reduction in 13C content (i.e. discrimination against 13C). A simple model proposed by (Farquhar and Sharkey 1982) and discussed in (Seibt et al. 2008) relates the photosynthetic discrimination ∆ of 13C resulting from fractionation during diffusion and carboxylation to the ratio of stomata internal to atmospheric concentration in CO2 in the following way:
∆𝑝𝑙𝑝= 𝑎 + (𝑏ʹ − 𝑎)𝐶𝑙𝐶𝑎
Where Ci is the intra-stomata concentration in CO2 Ca is the concentration of CO2 in ambient air a is the fractionation of CO2 during diffusion (4,4 ‰) b’ is the fractionation of CO2 due to carboxylation (Rubisco ~27 ‰).
In the above formulation it is clear that ∆ depends on the CO2 ratio ci/ca which itself depends on stomatal conductance. When stomata close the internal concentration will diminish and so will ∆. More generally ci/ca reflects the equilibrium between net assimilation rate A and CO2 stomatal conductance gsc. According to Fick’s law A=gsc(ca-ci). Noting that water and CO2 stomatal conductance are proportional gsw=1.6 gsc the linear relation between ci/ca and Δ can be used to compute the intrinsic WUE.
𝑊𝑔.𝑝𝑙𝑝 =𝐴𝑔𝑠𝑠
=𝐶𝑎1.6�
𝑏ʹ − ∆𝑝𝑙𝑝𝑏ʹ − 𝑎 �
Daily average CO2 atmospheric content can be significantly higher and 𝛿13𝐶𝑎𝑎𝑎 significantly lower in the understorey than in the upper canopy (values 𝛿13𝐶𝑎𝑎𝑎 =- 11.4‰ vs -7.7‰ cited in (Jones 1993)
21
and similar estimates are found in (Buchmann et al. 1997; Sternberg et al. 1989). In this analysis we considered an atmospheric reference value of - 11‰ for samples taken in the understory and -8‰ for samples from canopy trees. Seasonal variation in 𝛿13𝐶𝑎𝑎𝑎 were neglected in this study (Buchmann et al. 1997).
Finally it should be noted that the calculations presented above neglect differences in mesophyll conductance and photorespiration which also affect albeit moderately leaf level discrimination of 13C (Seibt et al. 2008). In addition this WUE is limited to leaf and does not integrate heterotrophic tissue respiration or water loss through the cuticle or lenticels.
The full model proposed by (Farquhar and Sharkey 1982) is the following
Δc = 𝑎 + (𝑏 − 𝑎)𝐶𝑙𝐶𝑎
− (𝑏 − 𝑎𝑎)𝐴
𝑔𝑙𝐶𝑎− 𝑓
Γ∗𝐶𝑎
Where
g I = internal mesophyll conductance CO2 in mol.m-2.s-1; am = fractionation due to mesophyll transport (1.8‰) Γ∗ = CO2 compensation point in μmol.mol-1 f = fractionation during photorespiration (8‰) The full model above is not commonly used because it requires knowledge of the CO2
compensation point and the internal mesophyll conductance value.
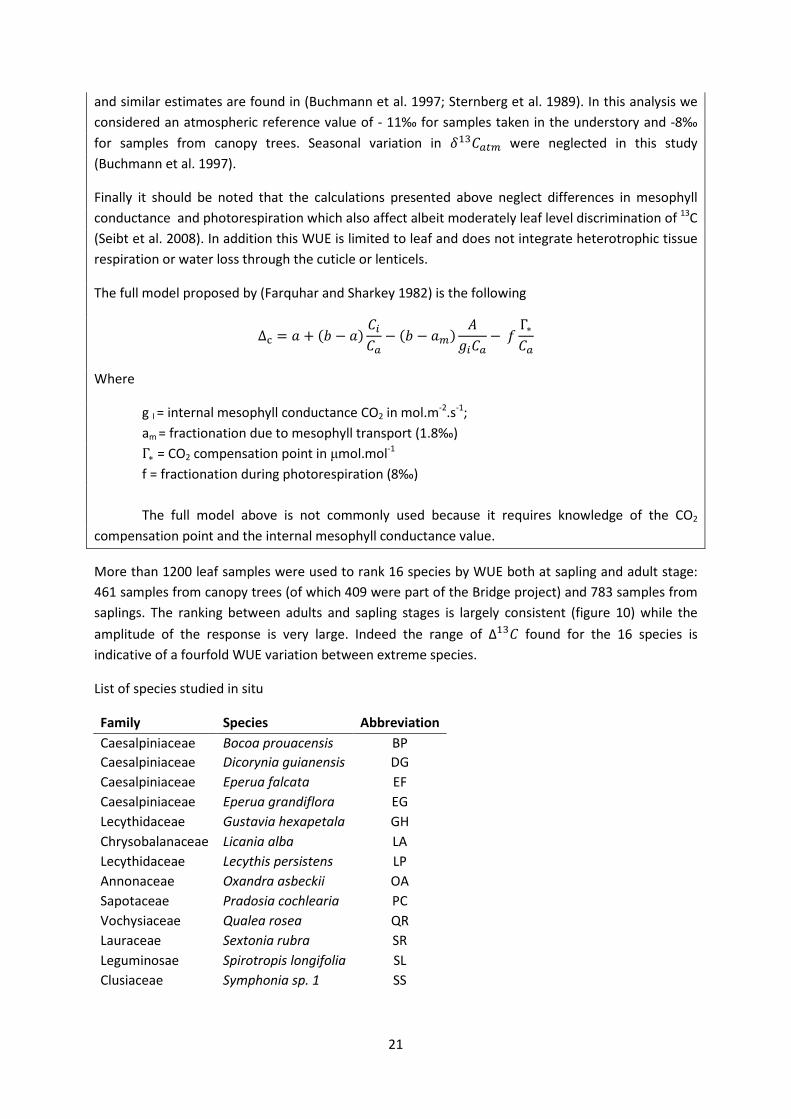
More than 1200 leaf samples were used to rank 16 species by WUE both at sapling and adult stage: 461 samples from canopy trees (of which 409 were part of the Bridge project) and 783 samples from saplings. The ranking between adults and sapling stages is largely consistent (figure 10) while the amplitude of the response is very large. Indeed the range of ∆13𝐶 found for the 16 species is indicative of a fourfold WUE variation between extreme species.
List of species studied in situ
Family Species Abbreviation Caesalpiniaceae Bocoa prouacensis BP Caesalpiniaceae Dicorynia guianensis DG Caesalpiniaceae Eperua falcata EF Caesalpiniaceae Eperua grandiflora EG Lecythidaceae Gustavia hexapetala GH Chrysobalanaceae Licania alba LA Lecythidaceae Lecythis persistens LP Annonaceae Oxandra asbeckii OA Sapotaceae Pradosia cochlearia PC Vochysiaceae Qualea rosea QR Lauraceae Sextonia rubra SR Leguminosae Spirotropis longifolia SL Clusiaceae Symphonia sp. 1 SS
22
However large the variation in WUE it does not seem to relate with species known hydrological preferences (Sabatier et al. 1997; Vincent et al. 2011a). No correlation exists between leaf isotopic discrimination and the hydrological index derived from species association with local drainage condition proposed in (Vincent et al. 2011a) for the 14 species common to both studies. As a matter of fact Eperua species which have contrasted distribution (Eperua falcata tolerating more hydromorphic conditions than E grandiflora) fall at the same end of the ∆13𝐶 gradient.
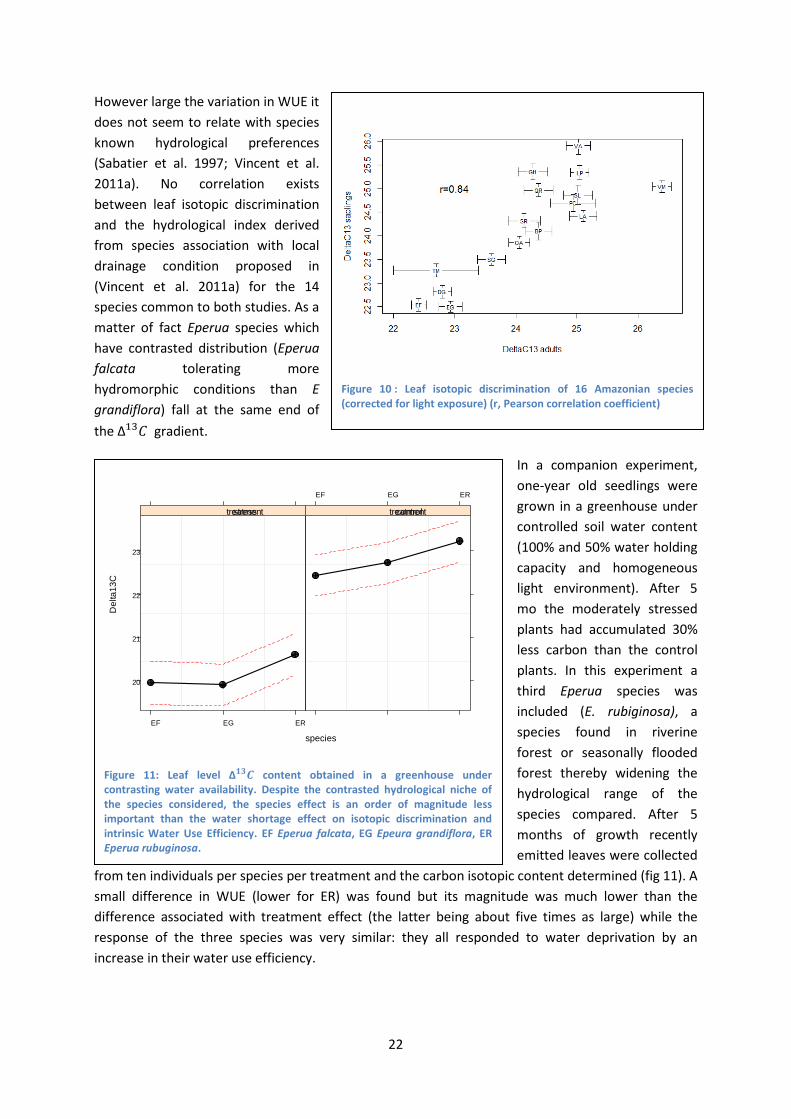
In a companion experiment, one-year old seedlings were grown in a greenhouse under controlled soil water content (100% and 50% water holding capacity and homogeneous light environment). After 5 mo the moderately stressed plants had accumulated 30% less carbon than the control plants. In this experiment a third Eperua species was included (E. rubiginosa), a species found in riverine forest or seasonally flooded forest thereby widening the hydrological range of the species compared. After 5 months of growth recently emitted leaves were collected
from ten individuals per species per treatment and the carbon isotopic content determined (fig 11). A small difference in WUE (lower for ER) was found but its magnitude was much lower than the difference associated with treatment effect (the latter being about five times as large) while the response of the three species was very similar: they all responded to water deprivation by an increase in their water use efficiency.
Figure 11: Leaf level ∆𝟏𝟏𝑪 content obtained in a greenhouse under contrasting water availability. Despite the contrasted hydrological niche of the species considered, the species effect is an order of magnitude less important than the water shortage effect on isotopic discrimination and intrinsic Water Use Efficiency. EF Eperua falcata, EG Epeura grandiflora, ER Eperua rubuginosa.
species
Del
ta13
C
20
21
22
23
EF EG ER
: treatmentstress
EF EG ER
: treatmentcontrol
Figure 10 : Leaf isotopic discrimination of 16 Amazonian species (corrected for light exposure) (r, Pearson correlation coefficient)
23
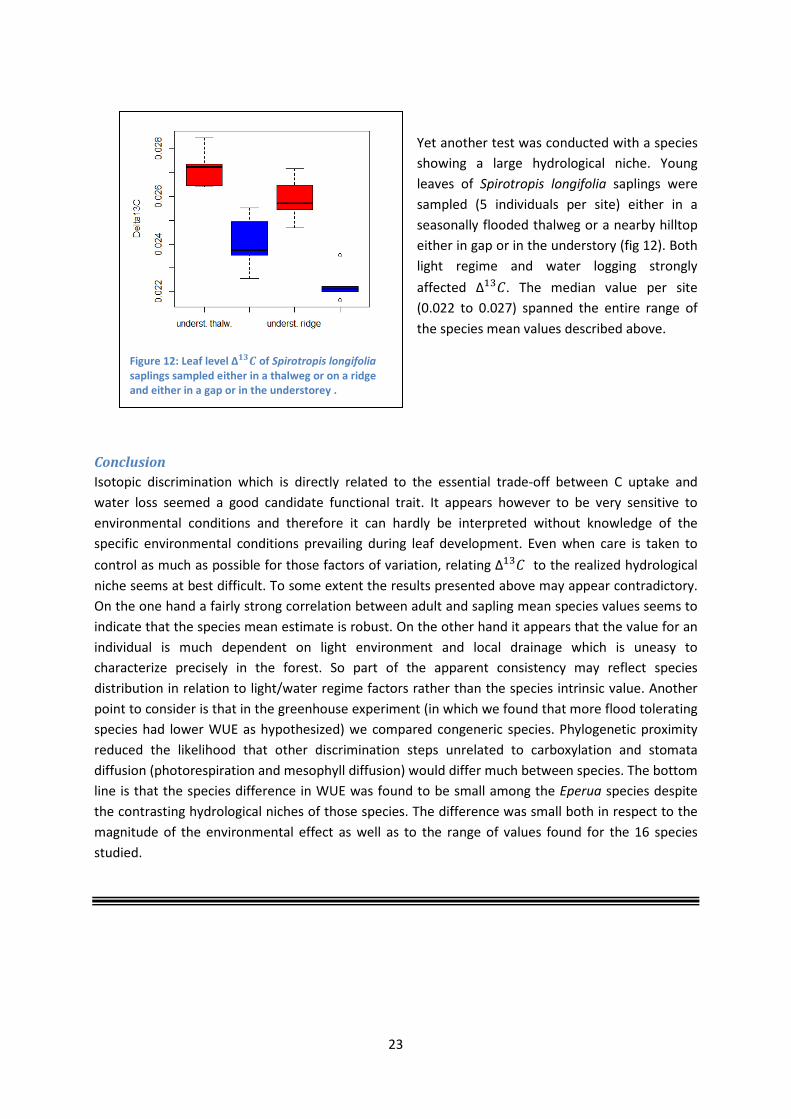
Yet another test was conducted with a species showing a large hydrological niche. Young leaves of Spirotropis longifolia saplings were sampled (5 individuals per site) either in a seasonally flooded thalweg or a nearby hilltop either in gap or in the understory (fig 12). Both light regime and water logging strongly affected ∆13𝐶. The median value per site (0.022 to 0.027) spanned the entire range of the species mean values described above.
Conclusion Isotopic discrimination which is directly related to the essential trade-off between C uptake and water loss seemed a good candidate functional trait. It appears however to be very sensitive to environmental conditions and therefore it can hardly be interpreted without knowledge of the specific environmental conditions prevailing during leaf development. Even when care is taken to control as much as possible for those factors of variation, relating ∆13𝐶 to the realized hydrological niche seems at best difficult. To some extent the results presented above may appear contradictory. On the one hand a fairly strong correlation between adult and sapling mean species values seems to indicate that the species mean estimate is robust. On the other hand it appears that the value for an individual is much dependent on light environment and local drainage which is uneasy to characterize precisely in the forest. So part of the apparent consistency may reflect species distribution in relation to light/water regime factors rather than the species intrinsic value. Another point to consider is that in the greenhouse experiment (in which we found that more flood tolerating species had lower WUE as hypothesized) we compared congeneric species. Phylogenetic proximity reduced the likelihood that other discrimination steps unrelated to carboxylation and stomata diffusion (photorespiration and mesophyll diffusion) would differ much between species. The bottom line is that the species difference in WUE was found to be small among the Eperua species despite the contrasting hydrological niches of those species. The difference was small both in respect to the magnitude of the environmental effect as well as to the range of values found for the 16 species studied.
Figure 12: Leaf level ∆𝟏𝟏𝑪 of Spirotropis longifolia saplings sampled either in a thalweg or on a ridge and either in a gap or in the understorey .
24
Taking a new look at the forest: the LiDAR revolution Much of my current activity is geared towards LiDAR application to forest ecology. LiDAR has indeed literally revolutionized the way foresters access to forest 3D structure and is largely recognized as holding enormous promise for the future of forest resource management (Hudak et al. 2009; Palminteri et al. 2012; Vierling et al. 2008).
I have previously mentioned some areas where LiDAR is already making a direct contribution to forest modeling. These include tree allometry (Vincent et al. 2012a), and morphological plasticity description (mostly via Terrestrial Laser Scanners), LAI estimate (Hopkinson and Chasmer 2007; Hopkinson et al. 2013; Richardson et al. 2009). We illustrate other potential application of LiDAR which may greatly serve forest dynamic modeling with some of our recent work. We also propose a novel approach to LAI estimates from full waveform ALS data.
Forest type mapping Mapping forests is a major challenge and a logical preliminary step to any rational management. While satellite imagery has been largely used to stratify forest at the landscape scale (Gond et al. 2011) there is a need to bridge the gap between plot level data (which typically cover < 10-6 of the total forested area) and satellite imagery. Areal Laser Scanning is well suited for this purpose. ALS conveys information which can relate both to plot level information e.g. (Vincent et al. 2012c) and to satellite imagery (LAI, Fraction of Vegetation Cover,…)
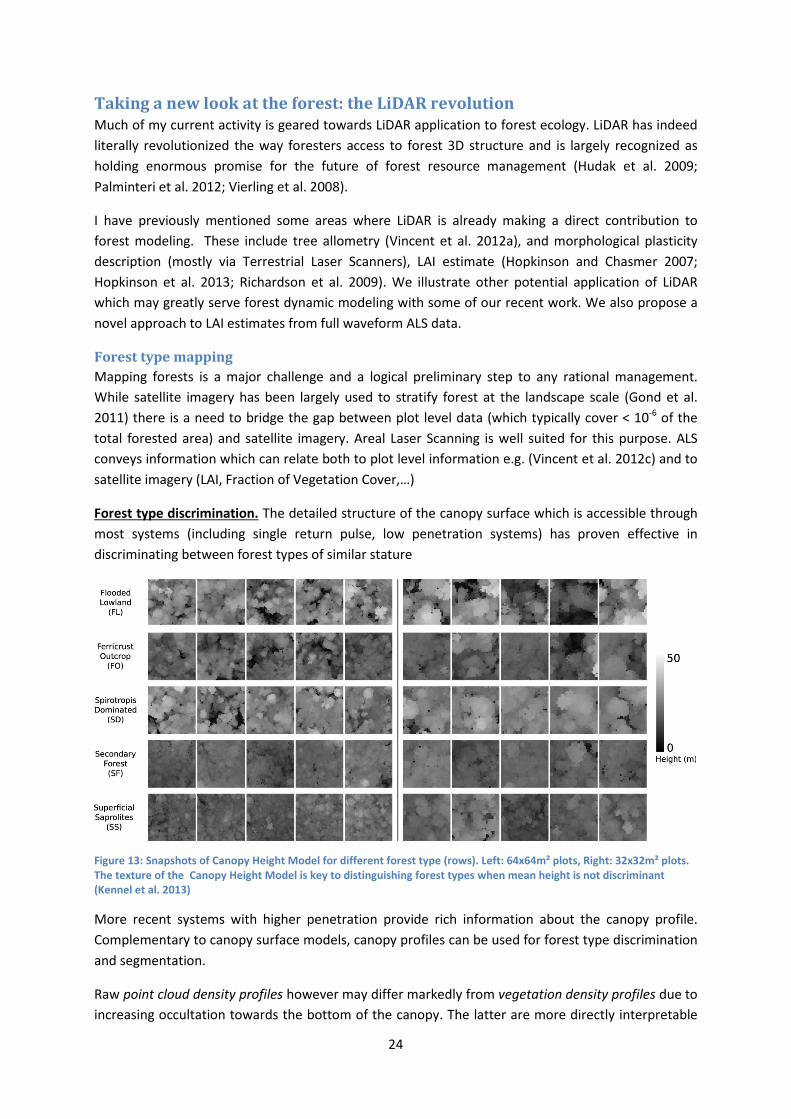
Forest type discrimination. The detailed structure of the canopy surface which is accessible through most systems (including single return pulse, low penetration systems) has proven effective in discriminating between forest types of similar stature
Figure 13: Snapshots of Canopy Height Model for different forest type (rows). Left: 64x64m² plots, Right: 32x32m² plots. The texture of the Canopy Height Model is key to distinguishing forest types when mean height is not discriminant (Kennel et al. 2013)
More recent systems with higher penetration provide rich information about the canopy profile. Complementary to canopy surface models, canopy profiles can be used for forest type discrimination and segmentation.
Raw point cloud density profiles however may differ markedly from vegetation density profiles due to increasing occultation towards the bottom of the canopy. The latter are more directly interpretable
25
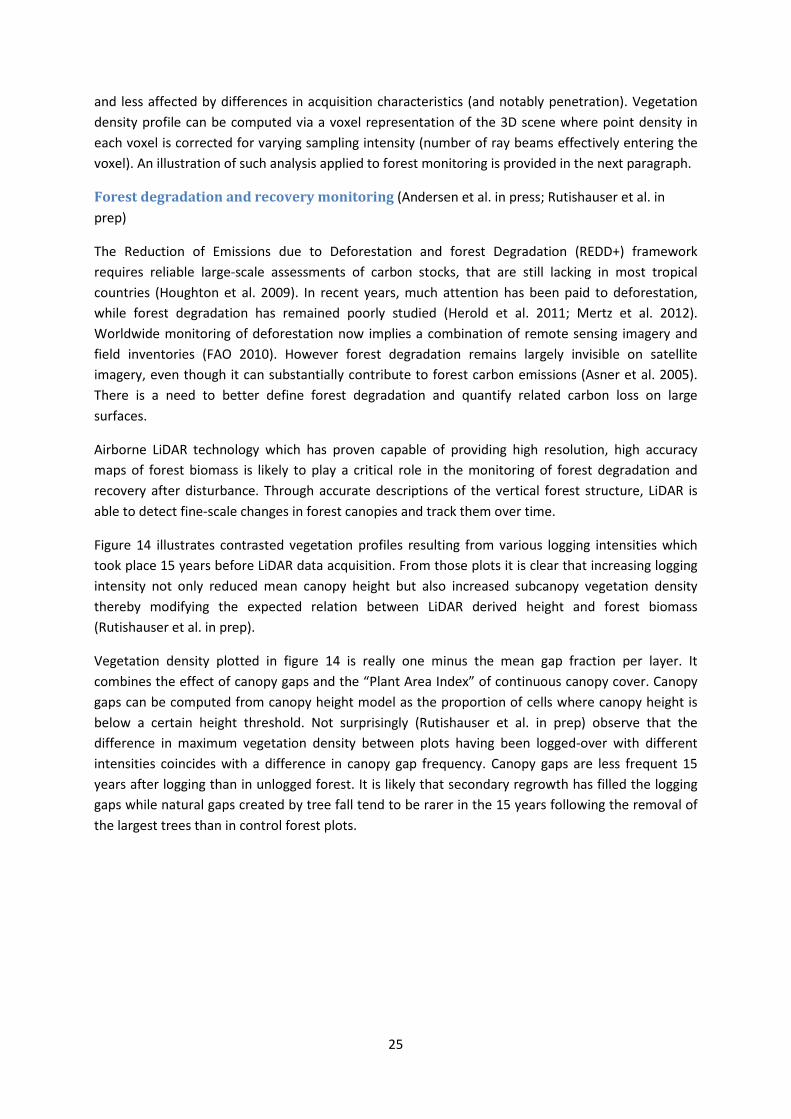
and less affected by differences in acquisition characteristics (and notably penetration). Vegetation density profile can be computed via a voxel representation of the 3D scene where point density in each voxel is corrected for varying sampling intensity (number of ray beams effectively entering the voxel). An illustration of such analysis applied to forest monitoring is provided in the next paragraph.
Forest degradation and recovery monitoring (Andersen et al. in press; Rutishauser et al. in prep)
The Reduction of Emissions due to Deforestation and forest Degradation (REDD+) framework requires reliable large-scale assessments of carbon stocks, that are still lacking in most tropical countries (Houghton et al. 2009). In recent years, much attention has been paid to deforestation, while forest degradation has remained poorly studied (Herold et al. 2011; Mertz et al. 2012). Worldwide monitoring of deforestation now implies a combination of remote sensing imagery and field inventories (FAO 2010). However forest degradation remains largely invisible on satellite imagery, even though it can substantially contribute to forest carbon emissions (Asner et al. 2005). There is a need to better define forest degradation and quantify related carbon loss on large surfaces.
Airborne LiDAR technology which has proven capable of providing high resolution, high accuracy maps of forest biomass is likely to play a critical role in the monitoring of forest degradation and recovery after disturbance. Through accurate descriptions of the vertical forest structure, LiDAR is able to detect fine-scale changes in forest canopies and track them over time.
Figure 14 illustrates contrasted vegetation profiles resulting from various logging intensities which took place 15 years before LiDAR data acquisition. From those plots it is clear that increasing logging intensity not only reduced mean canopy height but also increased subcanopy vegetation density thereby modifying the expected relation between LiDAR derived height and forest biomass (Rutishauser et al. in prep).
Vegetation density plotted in figure 14 is really one minus the mean gap fraction per layer. It combines the effect of canopy gaps and the “Plant Area Index” of continuous canopy cover. Canopy gaps can be computed from canopy height model as the proportion of cells where canopy height is below a certain height threshold. Not surprisingly (Rutishauser et al. in prep) observe that the difference in maximum vegetation density between plots having been logged-over with different intensities coincides with a difference in canopy gap frequency. Canopy gaps are less frequent 15 years after logging than in unlogged forest. It is likely that secondary regrowth has filled the logging gaps while natural gaps created by tree fall tend to be rarer in the 15 years following the removal of the largest trees than in control forest plots.
26
LAI estimate from ALS
Leaf Area Index of tropical moist forest is still poorly characterized (Clark et al. 2008) both in its absolute range and in terms of its temporal and spatial variation (Doughty and Goulden 2008). Most modern airborne scanning systems record multiple return pulses per laser shot (or even the entire digitized return wave while wave form analysis is done offline like in the case of the Riegl LMSQ560). Potential of ALS for estimating Plant Area Index (i.e. without distinguishing leaves and woody material) has long been noted. A classical approach exposed in (Morsdorf et al. 2006) has been to evaluate the LAI index by the contact frequency method in which the laser beam is treated as a probe. Noting that the area index is proportional to the contact frequency N of a vertical line through the canopy, i.e. LAI=N/k where k is the extinction coefficient, a function of the angular distribution of the elements of the canopy k=0.5 in case of random spherical distribution (Campbell and Norman 1997). Hence the cumulated number of vegetation returns per number of shots provides an estimate of the LAI. Of course the result will depend on the sensor specification (emitted energy, detection threshold, footprint size notably) and hence needs to be calibrated for each system (and vegetation type). In the previous approach a necessary first step is to cluster canopy into gaps and non-gaps and then to restrict the analysis to vegetation so as to capture the first level of heterogeneity (horizontal clumping) and thereby improve LAI estimates at scene scale. In the contact frequency approach however one must assume that the beam width is negligible. This assumption is hardly tenable since the foot print typical size will be of a few decimeters and well above the typical leaf size. Conversely
Figure 14: Fifteen years after logging, LiDAR echo point cloud profile reveals strong difference in mean height canopy. Processing LiDAR data using ray tracing further reveals a qualitative change in vegetation vertical distribution and notably higher maximum vegetation density in logged over forest. Logging intensities increase from T0 (control) to T3 (ca. half of initial Basal Area removed). Paracou, French Guiana.
27
this relatively large footprint allows for the laser beam to penetrate the vegetation and record more than one return per shot. Laser scanners also register the intensity of each echo which is an index of the backscattered energy associated with that echo (Jutzi and Gross 2009). These characteristics may be used to improve the LAI estimates as suggested below.
In September 2013 ALS acquisition over the Paracou experimental site was undertaken (with a Riegl LMS Q560 emitting à 1500nm +/-20 degree swath angle flown 500m above ground level). A 60x60cm Spectralon© panel was exposed in an open area on site. Spectralon© is a fluoropolymer which exhibits highly Lambertian behavior and high (>95%) reflectance in near infrared. Eight shots hit the Spectralon© panel.
The intensity information provided by ALS systems describes the amount of backscattered pulse energy (Ullrich and Pfennigbauer 2011; Wagner et al. 2008). The echo waveform received by full-waveform ALS systems is the result of a convolution of the system waveform and the backscattering cross-section of the illuminated object surface (Jutzi and Stilla 2006). The backscattering cross-section (in units of square meters) is a measure of the electromagnetic energy intercepted and re-radiated by objects backwards towards the sensor. Let 𝜎𝑙 be the backscatter cross-section of target i,
𝜎𝑙 =4𝜋Ω𝑙
𝜌𝑙 𝐴𝑙
where Ω𝑙 is the scattering solid angle of the target in steradians, 𝜌𝑙 is the reflectivity of the target, and 𝐴𝑙 is the effective area of collision of target i. Because in ALS the wavelength is always much smaller than the size of the targets, 𝐴𝑙 is simply the projected area of the scatterer.
If it is assumed that different echoes associated to one lidar shot are produced by one target type characterized by similar scattering characteristics (reflectivity and scattering solid angle) then the backscattering cross-section of each echo is proportional to the effective area of collision of the different targets.
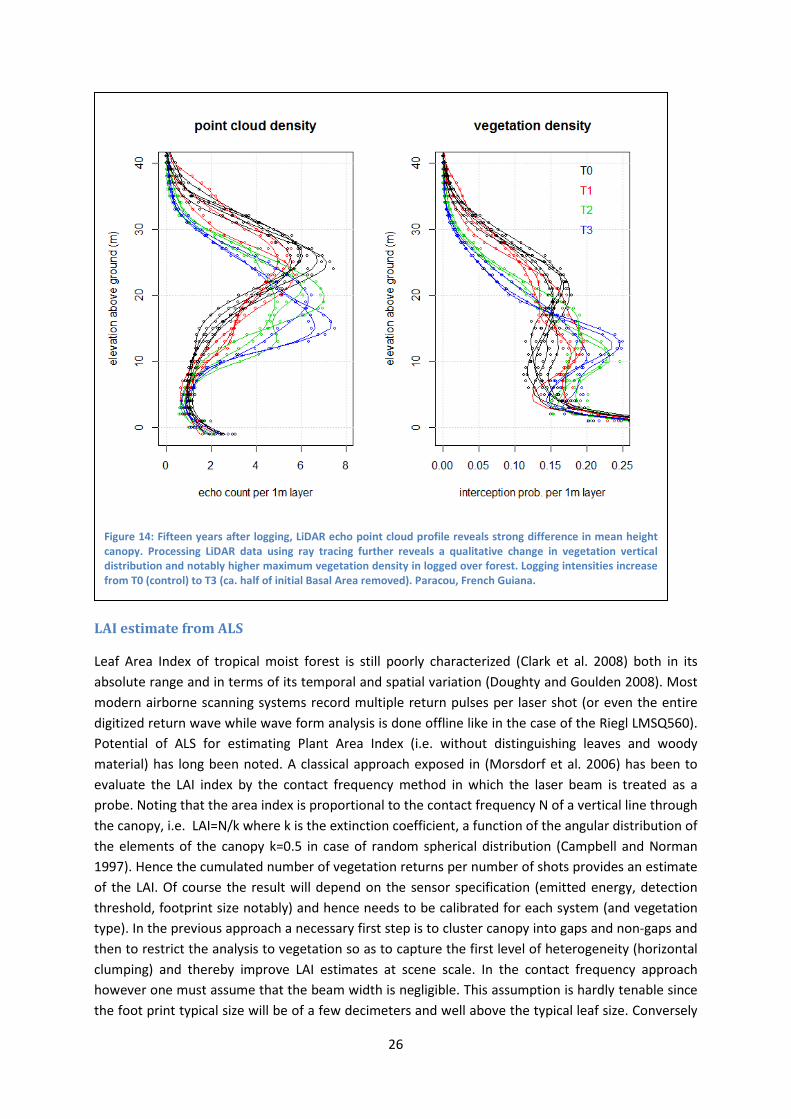
However since the emitted pulse is attenuated by the successive hits the effective area of the footprint is reduced accordingly. As laser fires downward one may assume that the entire pulse interacts with targets and is subsequently backscattered towards the sensor (i.e. we assume here that no specular backscattering occurs). Noticeably, the mean cumulated energy of shots not reaching the ground is stable and independent of the number of hits (Fig 15). Considering only canopy single
Figure 15: Cumulated “pseudo” backscattered cross-section per shot (assuming 100% target reflectivity).
28
returns the median registered energy for vegetation is ~17% of a purely lambertian 100% reflectivity target. Those estimates should be considered in the light of the “typical” 20% reflectance of broad leaf forest (Baldridge et al. 2009; Pu 2008) at 1550nm.
This consistent energy retrieval (consistent on a statistical basis) opens-up different possible avenues to make better use of the information available from full wave form lidar. For instance vegetation density profiles could be based on the ratio between individual backscattering area of the successive echoes along a pulse and the estimated remaining effective sampling area of the down going pulse. Of course this supposes to know reflectivity of the targets.
A fairly straightforward application of the consistent energy retrieval observed can lead to improved LAI estimates. Assuming that ground has stable scattering characteristics (but making no assumption of reflectance regularity of the vegetation component) one can estimate the proportion of each pulse reaching the ground, by comparing single ground returns energy (not intercepted by canopy) with higher order ground returns. For each shot the energy reaching the ground is then 0 if no ground echo is detected or the ratio of the returned intensity to the typical energy of single return hitting the ground.
Extinction rate=1 – (energy reaching the ground/total emitted energy)
=1-( actual ground backscatter cross-section/ single ground return backscatter cross-section)
Hence by considering the average extinction rate of all shots aiming at a particular area and applying a simple model of extinction we obtain a first estimate of effective LAI for that area. If clumping is neglected and distribution of foliage assumed to be random spherical we may apply the simple relation I/I0=exp(-0.5*LAI). Interestingly this LAI estimate does not require radiometric calibration. Of course it will need to be fine-tuned since the distribution of canopy elements will likely depart from random spherical distribution and this will need to be estimated separately, for example from high resolution terrestrial lidar scans (Béland et al. 2011). It should also be noted that ground reflectance shows considerable variability as can be seen in Figure 15. Statistics shown in Figure 15 are based on 150000 shots in a quarter km2 in Paracou of which less than 10% reached the ground and only 3% reached the ground without triggering a vegetation echo on the way. The sample area included closed canopy forest but also a dirt track and a sandy helicopter drop zone. Local estimate of fraction of energy reaching the ground will need to be based on a sufficiently large number of single return ground hits if variability in ground reflectance does not follow a predictable pattern (which has not been examined yet).
Detecting change in mortality rates over time and space (Thomas et al. 2013; Vincent et al. 2011b). Mortality rates may already be affected by climate change (Phillips 1998; Phillips et al. 2010). Change in tropical forest trees turnover rates may affect both carbon stock and carbon mean-residence-time and impact the global carbon balance. However field monitoring plots are scarce and cover limited area and may be inadequate to detect global changes in mortality rates not to mention possibly different trends across space (Fisher et al. 2008). Repeated aerial LiDAR coverage which provides high resolution 3D characterization of forest structure can yield high resolution maps of canopy turnover which can readily fill this data gap.
29
Can Bayes help break the curse of rare species? One major difficulty in tropical forest modeling lies in the abundance of rare species in any local community or pool of local communities (ter Steege et al. 2013). This means that estimating demographic parameters and response to environmental constraints of those numerous species is extremely difficult. Since rare species (i.e. species with few individuals recorded in a given dataset) are frequent and may represent a significant part of the tree community our understanding and ability to predict community dynamics is much dependent on the (in)accuracy of the rare species parameter estimates.
Bayesian modeling approach has much to offer in the context of high biological diversity of tropical forest. The essence of Bayesian inference is in the rule, known as Bayes' theorem, that tells us how to update our initial probabilities P(H) if we see evidence E, in order to find out P(H|E). P(H/E)=P(E/H)*P(H)/P(E) Bayesian modeling allows blending in a rigorous framework a priori expert knowledge and experimental data. Bayesian statistics are gaining wide popularity in ecological science (Clark 2005). Bayesian modeling indeed has many attractive features. It can deal with large number of predictors while controlling risks of over-parameterization. It can formally accommodate for uncertainty in the predictors (as well as in the response variables). It offers a possibility of modeling latent variables (non-observable variables). It can deal with multiple level of stochasticity (nested random structure, autocorrelation,…) Hierarchical Bayesian Models (HBM) treating species specific parameters as random and using non-informative prior distribution will lead to shrinkage of rare species estimates towards the grand mean (Hoff 2010). This so called trade-off between variance and bias provides an interesting way to reduce the prediction error made on rare species parameter estimates (Chalant 2013). A fairly straight forward extension of this approach - which we have not tested yet - is to group species (according for instance to a priori knowledge or functional traits syndromes) and to posit similarity between groups (i.e. shrink species towards the group mean rather than a grand mean).
An alternative approach to functional grouping which is apparently gaining momentum (Aubry-Kientz et al. 2013; Hérault et al. 2011) introduces functional trait values as predictors of growth or mortality rates in lieu of species identity. The upholders of the functional trait “direct” approach argue that it has the merit of limiting parameter number inflation associated with high species richness since instead of parameterizing the function for each species in the community, functional traits are used to parameterize a global function which depends only on the selected functional traits.
We contend that the approach based on grouping species on the basis of syndrome of traits while keeping species identity may be preferable for a number of reasons. First the data reduction process achieved by using functional traits as direct predictors may be far from optimal, and much information in the data can be lost during that step. This is especially likely since the current knowledge base on functional traits of tropical trees is extremely limited. Many species may not have known trait values and a large fraction of traits measured may have little relevance to characterize species ecological strategy. Another issue is that the shape of the sub-models used to relate trait values to parameter values of the model - usually taken to be linear for computational simplicity and lack of compelling evidence against it e.g. (Rüger et al. 2012) - may be inadequate. While a particular ecological strategy may be well captured through a combination of traits (a syndrome of traits), there seems to be little a priori reason to expect that a particular parameter (e.g. diameter of maximum
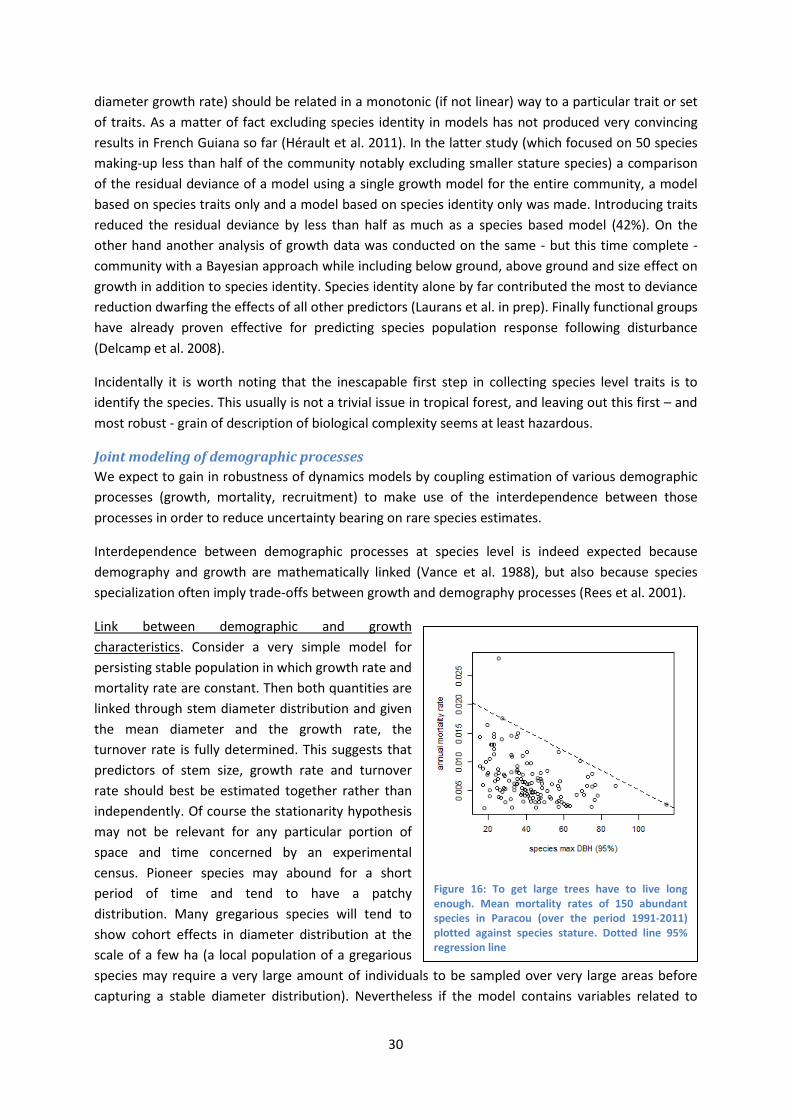
30
diameter growth rate) should be related in a monotonic (if not linear) way to a particular trait or set of traits. As a matter of fact excluding species identity in models has not produced very convincing results in French Guiana so far (Hérault et al. 2011). In the latter study (which focused on 50 species making-up less than half of the community notably excluding smaller stature species) a comparison of the residual deviance of a model using a single growth model for the entire community, a model based on species traits only and a model based on species identity only was made. Introducing traits reduced the residual deviance by less than half as much as a species based model (42%). On the other hand another analysis of growth data was conducted on the same - but this time complete - community with a Bayesian approach while including below ground, above ground and size effect on growth in addition to species identity. Species identity alone by far contributed the most to deviance reduction dwarfing the effects of all other predictors (Laurans et al. in prep). Finally functional groups have already proven effective for predicting species population response following disturbance (Delcamp et al. 2008).
Incidentally it is worth noting that the inescapable first step in collecting species level traits is to identify the species. This usually is not a trivial issue in tropical forest, and leaving out this first – and most robust - grain of description of biological complexity seems at least hazardous.
Joint modeling of demographic processes We expect to gain in robustness of dynamics models by coupling estimation of various demographic processes (growth, mortality, recruitment) to make use of the interdependence between those processes in order to reduce uncertainty bearing on rare species estimates.
Interdependence between demographic processes at species level is indeed expected because demography and growth are mathematically linked (Vance et al. 1988), but also because species specialization often imply trade-offs between growth and demography processes (Rees et al. 2001).
Link between demographic and growth characteristics. Consider a very simple model for persisting stable population in which growth rate and mortality rate are constant. Then both quantities are linked through stem diameter distribution and given the mean diameter and the growth rate, the turnover rate is fully determined. This suggests that predictors of stem size, growth rate and turnover rate should best be estimated together rather than independently. Of course the stationarity hypothesis may not be relevant for any particular portion of space and time concerned by an experimental census. Pioneer species may abound for a short period of time and tend to have a patchy distribution. Many gregarious species will tend to show cohort effects in diameter distribution at the scale of a few ha (a local population of a gregarious species may require a very large amount of individuals to be sampled over very large areas before capturing a stable diameter distribution). Nevertheless if the model contains variables related to
Figure 16: To get large trees have to live long enough. Mean mortality rates of 150 abundant species in Paracou (over the period 1991-2011) plotted against species stature. Dotted line 95% regression line
31
species intrinsic characteristics (potential growth rate, maximum size, potential fecundity, etc…) then considering the logical constraints between those elementary variables as latent relations may bring about some robustness in model estimates and prediction.
Trade-offs between life history traits. The existence of trade-offs between life history traits is well established. The classical r vs. K distinction opposes r-species with high fecundity, quick sexual maturity, high mortality typically adapted to highly variable environment and K-species with are long lived, produce fewer larger seeds. For instance pioneer species will typically produce many propagules persistent in the soil bank thereby decoupling recruitment rates from current adult density of conspecific (Vincent et al. 2011a). Late successional species tend to be less sensitive to light availability than early successional species both in terms of growth rate (Laurans et al. in prep) and mortality rate (Rees et al. 2001).
Multiple response models can be addressed in a Bayesian framework with existing dedicated software (Hadfeld 2010) so the relevance of the proposed approach consisting in jointly modeling recruitment, growth and mortality processes could be assessed shortly. Grouping species into functional types provides a straightforward way of capturing this interdependency between the various processes which are jointly estimated. Rare species estimates would thereby be shrunk towards their group mean for the various parameters to be estimated and the interdependence between those parameters (across processes) factored in the model. Another possible strategy would be to explicitly include a covariance term in parameter distributions. However the latter option is likely to be less efficient in case of non-linear dependency between parameters or multimodal parameter distribution and therefore will be hard to capture in a simple variance-covariance matrix. Second this approach would not make the most of our a priori knowledge available on species. Expert knowledge will almost certainly be easier to elicit in terms of common or resembling strategies between species rather than correlation between parameters which themselves may not always have a straight forward biological interpretation.
General concluding remarks Dynamic models are highly simplified representations of the reality which yet are expected to shed new light on that reality. The general purpose of modeling activity can be stated as to better describe or to better understand a natural ecosystem. In the framework of Natural Resource Management the purpose of a model is usually more specific: one hopes to be able to predict the evolution of the system considered under particular scenarios (logging intensity, climate change, fire regime...) in order to better manage the system so as to achieve particular goals. Setting well bounded purpose to a modeling exercise is critical because the most difficult part in modeling is probably selecting the processes/variables which matter for the intended purpose/scale. This suggests that complex large multipurpose models are likely to be outperformed by models tailored to answer a particular NRM question.
Having said that, we believe that Bayesian modeling has much to offer in the field of operational modeling notably because it has the capacity of accommodating different kinds of information within a consistent framework: expert knowledge (prior information) and experimental data (observation)
32
while recognizing that both sources carry some uncertainty. Bayesian models as briefly discussed seem particularly well suited for the modeling of hyperdiverse tropical forest dynamics.
Finally one should be aware that model predictions are often wrong… However, even in the operational context of NRM, this may not always be a reason to invalidate the modeling effort. Indeed the ultimate benefit of developing models may rest in their ability to build common understanding between stakeholders. Sharing views is often a critical step in any collective human project and in our modest experience we found that models often serve as effective transactional tools. The development of participatory modeling to assist collective decision-making processes in the domain of natural resource management epitomizes the idea.
G. Vincent
Montpellier, January 2014
References cited Andersen H-E, Reutebuch SE, McGaughey RJ, d'Oliveira MVN, Keller M (in press) Monitoring selective
logging in western Amazonia with repeat lidar flights. Remote Sensing of Environment Antin C, Pélissier R, Vincent G, Couteron P (2013) Crown allometries are less responsive than stem
allometry to tree size and habitat variations in an Indian monsoon forest. Trees 27:1485-1495 Aphalo PJ, Ballare CL, Scopel AL (1999) Plant-plant signalling, the shade-avoidance response and
competition. J. Exp. Bot. 50:1629-1634 Asner GP, Knapp DE, Broadbent EN, Oliveira PJC, Keller M, Silva JN (2005) Selective Logging in the
Brazilian Amazon. Science 310:480-482 Aubry-Kientz M, Hérault B, Ayotte-Trépanier C, Baraloto C, Rossi V (2013) Toward Trait-Based
Mortality Models for Tropical Forests. PLoS ONE 8 Baldridge AM, Hook SJ, Grove CI, Rivera G (2009) The ASTER spectral library version 2.0. Remote
Sensing of Environment 113:711-715 Ballare CL, Scopel AL, Roush ML, Radosevich SR (1995) How Plants Find Light in Patchy Canopies. A
Comparison between Wild-Type and Phytochrome-B-Deficient Mutant Plants of Cucumber. Functional Ecology 9:859-868
Baraloto C, Timothy Paine CE, Patiño S, Bonal D, Hérault B, Chave J (2010) Functional trait variation and sampling strategies in species-rich plant communities. Functional Ecology 24:208-216
Bartelink HH (1995) MAPFLUX: a spatial model of light transmision through forest canopies. In. Vakgroep Bosbouw, Landtbouwuniversiteit Wageningen
Bartelink HH (1998) Radiation interception by forest trees: a simulation study on effects of stand density and foliage clustering on absorption and transmission. Ecological Modelling 105:213-225
Bauerle WL, Weston DJ, Bowden JD, Dudley JB, Toler JE (2004) Leaf absorptance of photosynthetically active radiation in relation to chlorophyll meter estimates among woody plant species. Scientia Horticulturae 101:169-178
Béland M, Widlowski J-L, Fournier RA, Côté J-F, Verstraete MM (2011) Estimating leaf area distribution in savanna trees from terrestrial LiDAR measurements. Agricultural and Forest Meteorology 151:1252-1266
Bloom AJ, Chapin FS, Mooney HA (1985) Resource Limitation in Plants-An Economic Analogy. Annual Review of Ecology and Systematics 16:363-392
33
Bohlman S, Pacala S (2012) A forest structure model that determines crown layers and partitions growth and mortality rates for landscape-scale applications of tropical forests. Journal of Ecology 100:508-518
Bonal D, Barigah TS, Granier A, Guehl JM (2000) Late-stage canopy tree species with extremely low delta C-13 and high stomatal sensitivity to seasonal soil drought in the tropical rainforest of French Guiana. Plant Cell and Environment 23:445-459
Boudon F, Moguedec GL (2006) Déformation asymétrique de houppiers pour la génération de représentations paysagères réalistes. In: Journées de l’Association Francophone d’Informatique Graphique Bordeaux
Brisson J (2001) Neighborhood competition and crown asymmetry in Acer saccharum. Can. J. For. Res./Rev. Can. Rech. For. 31:2151-2159
Buchmann N, Guehl JM, Barigah TS, Ehleringer JR (1997) Interseasonal comparison of CO2 concentrations, isotopic composition, and carbon dynamics in an Amazonian rainforest (French Guiana). Oecologia 110:120-131
Bucksch A, Lindenbergh R, Menenti M, Rahman MZ (2009) Skeleton-based botanic tree diameter estimation from dense LiDAR data. In: Proc. SPIE 7460, Lidar Remote Sensing for Environmental Monitoring X, pp 746007-746007
Campbell GS (1986) Extinction coefficients for radiation in plant canopies calculated using an ellipsoidal inclination angle distribution. Agricultural and Forest Meteorology 36:317-321
Campbell GS, Norman JM (1997) An Introduction to Environmental Biophysics. Springer-Verlag, New-York
Cescatti A (1997) Modelling the radiative transfer in discontinuous canopies of asymmetric crowns. I. Model structure and algorithms. Ecological Modelling 101:263-274
Chalant A (2013) Modélisation de la croissance des espèces forestières tropicales. In: Statistiques Appliquées, vol. Master de l’Institut Supérieur des Sciences Agronomiques, Agroalimentaires, Hor-ticoles et du Paysage. AgroCampus Ouest, p 46
Chelle M, Andrieu B (2007) Modelling the light environment of virtual crop canopies. In: J. Vos LFMM, P.H.B. de Visser, P.C. Struik and J.B. Evers (ed) Functional-Structural Plant Modelling in Crop Production, pp 75-89
Clark DB, Olivas PC, Oberbauer SF, Clark DA, Ryan MG (2008) First direct landscape-scale measurement of tropical rain forest Leaf Area Index, a key driver of global primary productivity. Ecology Letters 11:163-172
Clark JS (2005) Why environmental scientists are becoming Bayesians. Ecology Letters 8:2-14 Cochard H, Barigah ST, Kleinhentz M, Eshel A (2008) Is xylem cavitation resistance a relevant criterion
for screening drought resistance among Prunus species? Journal of Plant Physiology 165:976-982
Côté J-F, Fournier RA, Frazer GW, Olaf Niemann K (2012) A fine-scale architectural model of trees to enhance LiDAR-derived measurements of forest canopy structure. Agricultural and Forest Meteorology 166–167:72-85
Courbaud B, Coligny Fd, Cordonnier T (2003) Simulating radiation distribution in a heterogeneous Norway spruce forest on a slope. Agricultural and Forest Meteorology 116:1-18
Da Silva D, Balandier P, Boudon F, Marquier A, Godin C (2011) Modeling of light transmission under heterogeneous forest canopy: an appraisal of the effect of the precision level of crown description. Annals of Forest Science:1-13
Da Silva D. BF, Godin C., Sinoquet H.. (2008) Multiscale framework for modeling and analyzing light interception by trees. Multiscale modelling and simulation 7 910-933
Dassot M, Constant T, Fournier M (2011) The use of terrestrial LiDAR technology in forest science: application fields, benefits and challenges. Annals of Forest Science 68:959-974
Dauzat J, Clouvel P, Luquet D, Martin P (2008) Using Virtual Plants to Analyse the Light-foraging Efficiency of a Low-density Cotton Crop. Annals of Botany 101:1153-1166
34
Dauzat J, Rapidel B, Berger A (2001) Simulation of leaf transpiration and sap flow in virtual plants: model description and application to a coffee plantation in Costa Rica. Agricultural and Forest Meteorology 109:143-160
Delcamp M, Gourlet–Fleury S, Flores O, Garnier E (2008) Can functional classification of tropical trees predict population dynamics after disturbance? Journal of Vegetation Science 19::209-220
Doughty CE, Goulden ML (2008) Seasonal patterns of tropical forest leaf area index and CO2 exchange. Journal of Geophysical Research: Biogeosciences 113:G00B06
Dufour-Kowalski S, Courbaud B, Dreyfus P, Meredieu C, Coligny F (2012) Capsis: an open software framework and community for forest growth modelling. Annals of Forest Science 69:221
FAO (2010) Global Forest Resources Assessment 2010. In: FAO FORESTRY PAPER. FOOD AND AGRICULTURE ORGANIZATION OF THE UNITED NATIONS, ROME
Farquhar GD, Ehleringer JR, Hubick KT (1989) Carbone isotope discrimination and photosynthesis. Annu. Rev. Plant Physiol. Plant Mol. Biol. 40:503-537
Farquhar GD, Sharkey TD (1982) Stomatal Conductance and Photosynthesis. Ann. Rev. Plant Physiol. 33:317-345
Ferraz A et al. (2012) 3-D mapping of a multi-layered Mediterranean forest using ALS data. Remote Sensing of Environment 121:210-223
Fisher JI, Hurtt GC, Thomas RQ, Chambers JQ (2008) Clustered disturbances lead to bias in large-scale estimates based on forest sample plots. Ecology Letters 11:554-563
Fortin M, Bernier S, Saucier J-P, Labbé F (2009) Une relation hauteur-diamètre tenant compte de l'influence de la station et du climat pour 20 espèces commerciales du Québec. . In: Mémoire de recherche forestière, vol. 153. Ministère des Ressources naturelles et de la Faune. Direction de la recherche forestière, p 22
Franklin KA, Whitelam GC (2005) Phytochromes and Shade-avoidance Responses in Plants. Annals of Botany 96:169-175
Gilbert IR, Jarvis PG, Smith H (2001) Proximity signal and shade avoidance differences between early and late successional trees. Nature 411:792-795
Gond V et al. (2011) Broad-scale spatial pattern of forest landscape types in the Guiana Shield. International Journal of Applied Earth Observation and Geoinformation 13:357-367
Gower ST, Kucharik CJ, Norman JM (1999) Direct and Indirect Estimation of Leaf Area Index, fAPAR, and Net Primary Production of Terrestrial Ecosystems. Remote Sensing of Environment 70:29-51
Granier A, Huc R, Colin F (1992) Transpiration and stomatal conductance of two rain forest species growing in plantations (Simarouba amara and Goupia glabra) in French Guyana. Ann. For. Sci. 49:17-24
Griffiths H (1991) Applications of stable isotope technology in physiological ecology. Functional Ecology 5:254-269
Griffon S, Coligny Fd (2012) AMAPstudio: A Software Suite for Plants Architecture Modelling. In: PMA'12: 2012 IEEE Fourth International Symposium on Plant Growth, Modeling, Simulation, Vizualization and Applications. IEEE, Shanghai, China 2012
Hadfeld J (2010) MCMC methods for Multi-esponse Generalised Linear Mixed Models: The MCMCglmm R Package. Journal of Statistical Software 33:1-22.
Harja D, Vincent G, Mulia R, Noordwijk M (2012) Tree shape plasticity in relation to crown exposure. Trees 26:1275-1285
Henry HAL, Aarssen LW (2001) Inter- and intraspecific relationships between shade tolerance and shade avoidance in temperate trees. Oikos
Hérault B et al. (2011) Functional traits shape ontogenetic growth trajectories of rain forest tree species. Journal of Ecology 99:1431-1440
Herold M et al. (2011) Options for monitoring and estimating historical carbon emissions from forest degradation in the context of REDD+. Carbon Balance and Management 6:13
Hoff DP (2010) A first course in bayesian statiscal methods

35
Hopkinson C, Chasmer LE (2007) Modeling canopy gap fraction from lidar intensity. In: ISPRS Workshop on Laser Scanning 2007 and SilviLaser 2007, Espoo, Finland
Hopkinson C, Lovell J, Chasmer L, Jupp D, Kljun N, van Gorsel E (2013) Integrating terrestrial and airborne lidar to calibrate a 3D canopy model of effective leaf area index. Remote Sensing of Environment 136:301-314
Hosoi F, Omasa K (2009) Detecting seasonal change of broad-leaved woody canopy leaf area density profile using 3D portable LIDAR imaging. Functional Plant Biology 36:998-1005
Houghton RA, Hall F, Goetz SJ (2009) Importance of biomass in the global carbon cycle. J. Geophys. Res. 114:G00E03
Hudak AT, Evans JS, Smith AMS (2009) LiDAR utility for natural resource managers. Remote Sens. 1:934-951
Huertas C (2013) Segmentation automatique ou semi-automatique des couronnes d’arbres en forêt tropicale à partir d’images satellites à haute résolution et de scans laser (LiDAR). In: Systèmes d’informations localisées pour l’aménagement des territoires (SILAT), vol. Mastère Spécialisé accrédité par la Conférence des Grandes Ecoles AgroParisTech, Paris, p 35
Jones MB (1993) Plant microclimate. In: Hall DO, Scurlock JMO, Bolhar-Nordenkampf HR, Leegood RC, Long SP (eds) Photosynthesis and production in a changing environment. Chapman & Hall, London, pp 47-64
Jutzi B, Gross H (2009) Normalization of lidar intensity data based on range and surface incidence angle. In: Bretar F P-DM, Vosselman G (ed) Laser scanning 2009, vol. Vol. XXXVIII, Part 3/W8. IAPRS, Paris, France
Kattge J et al. (2011) TRY – a global database of plant traits. Global Change Biology 17:2905-2935 Kennel P, Tramon M, Barbier N, Vincent G (2013) Canopy height model characteristics derived from
airbone laser scanning and its effectiveness in discriminating various tropical moist forest types. International Journal of Remote Sensing 34:8917-8935
Kraft NJB, Valencia R, Ackerly DD (2008) Functional Traits and Niche-Based Tree Community Assembly in an Amazonian Forest. Science 322:580-582
Laurans M, Herault B, Vieilledent G, Vincent G (in prep) Vertical stratification reduces competition for light in dense tropical forest.
Laurans M, Martin O, Nicolini E, Vincent G (2012) Functional traits and their plasticity predict tropical trees regeneration niche even among species with intermediate light requirements. Journal of Ecology 100:1440-1452
Laurans M, Vincent G (in prep) Plastic and evolutionary variations of tropical trees crown depth are not related to light harvesting strategy.
Leckie D, Gougeon F, Hill D, Quinn R, Armstrong L, Shreenan R (2003) Combined high-density lidar and multispectral imagery for individual tree crown analysis. Canadian Journal of Remote Sensing 29:633-649
Maherali H, Pockman WT, Jackson RB (2004) Adaptive variation in the vulnerability of woody plants to xylem cavitation. Ecology 85:2184-2199
Mertz O et al. (2012) The forgotten D: challenges of addressing forest degradation in complex mosaic landscapes under REDD+. Geografisk Tidsskrift-Danish Journal of Geography 112:63-76
Millet J (2012) L’architecture des arbres des régions tempérées. Multimondes Morsdorf F, Kötz B, Meier E, Itten KI, Allgöwer B (2006) Estimation of LAI and fractional cover from
small footprint airborne laser scanning data based on gap fraction. Remote Sensing of Environment 104:50–61
Morsdorf F, Meier E, Kotz B, Itten KI, Dobbertin M, Allgower B (2004) LIDAR-based geometric reconstruction of boreal type forest stands at single tree level for forest and wildland fire management. Remote Sensing of Environment 92:353-362
Morsdorf F, Nichol C, Malthus T, Woodhouse IH (2009) Assessing forest structural and physiological information content of multi-spectral LiDAR waveforms by radiative transfer modelling. Remote Sensing of Environment 113:2152-2163

36
Muth CC, Bazzaz FA (2002) Tree canopy displacement at forest gap edges. Canadian Journal of Forest Research Revue Canadienne De Recherche Forestiere 32:247-254
Muth CC, Bazzaz FA (2003) Tree canopy displacement and neighborhood interactions. Canadian Journal of Forest Research Revue Canadienne De Recherche Forestiere 33:1323-1330
Olesen T (2001) Architecture of a cool-temperate rain forest canopy. Ecology 82:2719-2730 Omasa K, Hosoi F, Konishi A (2007) 3D lidar imaging for detecting and understanding plant responses
and canopy structure. J. Exp. Bot. 58:881-898 Palminteri S, Powell GVN, Asner GP, Peres CA (2012) LiDAR measurements of canopy structure
predict spatial distribution of a tropical mature forest primate. Remote Sensing of Environment 127:98-105
Phillips OL (1998) Increasing tree turnover in tropical forests as measured in permanent plots. In: Dallmeier F, Comiskey JA (eds) Forest Biodiversity Research, Monitoring and Modeling
Conceptual Background and Old World Case Studies, vol 20. UNESCO, Paris, France, pp 221-245 Phillips OL et al. (2010) Drought-mortality relationships for tropical forests. New. Phytol. 187:631-646 Pretzsch H, Dieler J (2012) Evidence of variant intra- and interspecific scaling of tree crown structure
and relevance for allometric theory. Oecologia 169:637-649 Pu R (2008) An exploratory analysis of in situ hyperspectral data for broadleaf species recognition.
The International Archives of the Photogrammetry, Remote Sensing and Spatial Information Sciences XXXVII:255-260
Purves DW, Lichstein JW, Strigul N, Pacala SW (2008) Predicting and understanding forest dynamics using a simple tractable model. Proceedings of the National Academy of Sciences 105:17018-17022
Rees M, Condit R, Crawley M, Pacala S, Tilman D (2001) Long-Term Studies of Vegetation Dynamics. Science 293:650-655
Reitberger J, Schnörr C, Krzystek P, Stilla U (2009) 3D segmentation of single trees exploiting full waveform LIDAR data. ISPRS Journal of Photogrammetry and Remote Sensing 64:561-574
Richardson JJ, Moskal LM, Kim S-H (2009) Modeling approaches to estimate effective leaf area index from aerial discrete-return LIDAR. Agricultural and Forest Meteorology 149:1152-1160
Robles-Leon R (2012) Allocation de croissance en hautueur et en diamètre chez les arbres: apport du dispositif québécois. In. AgroParisTech, Formation d’Ingénieurs Forestiers, Montpellier, p 118
Roche M-A (1983) Evapotranspiration réelle de la forêt amazonienne en Guyane. In: Le Projet ECEREX (Guyane) : analyse de l'écosystème forestier tropical humide et des modifications apportées par l'homme. GERDAT-ORSTOM, Cayenne
Rüger N, Wirth C, Wright SJ, Condit R (2012) Functional traits explain light and size response of growth rates in tropical tree species. Ecology 93:2626-2636
Rutishauser E, Sabatier D, Vincent G (in prep) Assessing forest degradation and related carbon loss in tropical forests through airborne LiDAR: limits and perspectives.
Sabatier D et al. (1997) The influence of soil cover organization on the floristic and structural heterogeneity of a Guianan rain forest. Plant Ecology 131:81-108
Seibt U, Rajabi A, Griffiths H, Berry J (2008) Carbon isotopes and water use efficiency: sense and sensitivity. Oecologia 155:441-454
Seidel D, Leuschner C, Müller A, Krause B (2011) Crown plasticity in mixed forests—Quantifying asymmetry as a measure of competition using terrestrial laser scanning. Forest Ecology and Management 261:2123-2132
Spitters CJT, Toussaint HAJM, Goudriaan J (1986) Separating the diffuse and direct component of global radiation and its implications for modeling canopy photosynthesis Part I. Components of incoming radiation. Agricultural and Forest Meteorology 38:217-229
Stadt KJ, Lieffers VJ (2000) MIXLIGHT: a flexible light transmission model for mixed-species forest stands. Agricultural and Forest Meteorology 102:235-252
Sternberg LDSL, Mulkey SS, Wright SJ (1989) Ecological Interpretation of Leaf Carbon Isotope Ratios: Influence of Respired Carbon Dioxide. Ecology 70:1317-1324
37
ter Steege H et al. (2013) Hyperdominance in the Amazonian Tree Flora. Science 342 Thomas RQ, Kellner JR, Clark DB, Peart DR (2013) Low mortality in tall tropical trees. Ecology 94:920-
929 Ullrich A, Pfennigbauer M (2011) Echo Digitization and Waveform Analysis in Airborne and Terrestrial
Laser Scanning In: Fritsch D (ed) Photogrammetrische Woche Vance RR, Newman WI, Sulsky D (1988) The demographic meanings of the classical population
growth models of ecology. Theoretical Population Biology 33:199-225 Vierling K, Vierling L, Gould W, Martinuzzi S, Clawges R (2008) Lidar: shedding new light on habitat
characterization and modeling. Frontiers in Ecology and the Environment 6 Vincent G (2001) Leaf photosynthetic capacity and nitrogen content adjustment to canopy openness
in tropical forest tree seedlings. Journal of Tropical Ecology 17:495-509 Vincent G (2006) Leaf life span plasticity in tropical seedlings grown under contrasting light regimes
Annals of Botany 97:245-255 Vincent G, de Foresta H, Mulia R (2009) Co-occurring tree species show contrasting sensitivity to
ENSO-related droughts in planted Dipterocarp forests. Forest Ecology and Management 258 1316-1322
Vincent G, F.Caron, Sabatier D, Blanc L (2012a) LiDAR shows that higher forests have more slender trees. Bois et Forêts des Tropiques 314:51-56
Vincent G, Harja Asmara D (2008) Exploring ecological significance of tree crown plasticity through three-dimensional modelling. Annals of Botany 101:1221-1231
Vincent G, Harja D (2002) SLIM software: a simple light interception model for multi-species, multi-strata forests. Bois et Forêts des Tropiques 2:97-100
Vincent G et al. (2011a) The relative importance of dispersal limitation and habitat preference in shaping spatial distribution of saplings in a tropical moist forest: a case study along a combination of hydromorphic and canopy disturbance gradients. Annals of Forest Science 68:357-370
Vincent G, Nicolini E, Laurans M (2012b) Autécologie de 6 espèces agrégatives de forêt guyanaise caractérisation du fonctionnement hydrique et de la réponse à l’ouverture de la canopée. Compte rendu DyGePop octobre 2012 – Rapport technique d’exécution de l’IRD-AMAP. In. IRD, p 28
Vincent G, Robles-Leon R, Laurans M, Fortin M, Taugourdeau O (in prep) Contrasting plasticity of Height –Diameter relation in North American tree species. Canadian Journal Forest Research
Vincent G et al. (2012c) Accuracy of small footprint airborne LiDAR in its predictions of tropical moist forest stand structure. Remote Sensing of Environment 125:23-33
Vincent G, Sabatier D, Caron F, Véga C (2011b) Multitemporal LiDAR applications to tropical forest dynamics studies. In: International Conference on Tropical Silviculture, Montpellier, France
Violle C et al. (2007) Let the concept of trait be functional! Oikos 116:882-892 Wagner F, Rossi V, Stahl C, Bonal D, Hérault B (2012) Water Availability Is the Main Climate Driver of
Neotropical Tree Growth. PLoS ONE 7 Wagner W, Hollaus M, Briese C, Ducic V (2008) 3D vegetation mapping using small-footprint full-
waveform airborne laser scanners. International Journal of Remote Sensing 29:1433-1452 Yu X, Hyyppä J, Kaartinen H, Hyyppä H, Maltamo M, Rönnholm P (2005) Measuring the growth of
individual trees using multi-temporal airborne laser scanning point clouds. In: ISPRS WG III/3, III/4, V/3 Workshop "Laser scanning 2005", Enschede, the Netherlands,
38
Publication list (with students names underlined)
Peer reviewed journal articles 1. G. Vincent, Etude expérimentale de la ramification acrotone d'un Pelargonium ligneux
(géranium rosat). Canadian Journal of Botany - Revue Canadienne de Botanique 73, 1557 (1995). 2. G. Vincent, Effet de la limitation du potentiel de croissance global sur l'architecture de Géranium
Rosat (Pelargonium sp.). Acta Botanica Gallica 142 (5), 451 (1995). 3. G. Vincent, Le potentiel de développement d'un rameau de Géranium rosat (Pelargonium sp.)
est déterminé par les conditions de croissance présidant à la formation du bourgeon dont il est issu. Acta Botanica Gallica 143, 37 (1996).
4. G. Vincent, Leaf photosynthetic capacity and nitrogen content adjustment to canopy openness in tropical forest tree seedlings. Journal of Tropical Ecology 17, 495 (2001).
5. G. Vincent, H. De Foresta, R. Mulia, Predictors of tree growth in a Dipterocarp based agroforest: a critical assessment. Forest Ecology and Management 161, 39 (2002).
6. G. Vincent, Leaf life span plasticity in tropical seedlings grown under contrasting light regimes Annals of Botany 97, 245 (2006).
7. H. Beukema, F. Danielsen, G. Vincent, S. Hardiwinoto, J. van Andel, Plant and bird diversity in rubber agroforests in the lowlands of Sumatra, Indonesia. Agroforestry Systems 70, 217 (2007).
8. C. Madelaine, R. Pélissier, G. Vincent, J. F. Molino, D. Sabatier, M ;F. Prévost, C. de Namur, Mortality and recruitment in a lowland tropical rain forest of French Guiana: effects of soil type and species guild. Journal of Tropical Ecology 23, 277 (2007).
9. N. Khasana, T. Wijaya, T. June, G. Vincent, M. van Noordwijk, G. Wibawa Growth of Rubber (Hevea brasiliensis) in Monoculture and Mixed Systems with Acacia (Acacia Mangium). A Case Study in Sembawa, South Sumatra : I. Measurement of Water Status and Radiation Environment. Indonesian J. Nat. Rubb. Res. 26 (2008).
10. G. Vincent, D. Harja Asmara, Exploring ecological significance of tree crown plasticity through three-dimensional modelling. Annals of Botany 101, 1221 (2008).
11. G. Vincent, H. de Foresta, R. Mulia, Co-occurring tree species show contrasting sensitivity to ENSO-related droughts in planted Dipterocarp forests. Forest Ecology and Management 258 1316 (2009).
12. G. Vincent, E. Weissenbacher, D. Sabatier, L. Blanc, C. Proisy, P. Couteron, Détection des variations de structure de peuplements en forêt dense tropicale humide par Lidar aéroporté (Small foot-print airborn LiDAR proves highly sensitive to changes in structure of moist tropical forest). Revue Française de Photogrammétrie et Télédétection 191, 42 (2010).
13. A. Ekadinata, G. Vincent, Rubber agroforests in a changing landscape: Analysis of Land Use/Cover Trajectories in Bungo District, Indonesia. Forests, Trees and Livelihoods 20, 3 (2011).
14. G. Vincent, F. Azhima, L. Joshi, J. R. Healey, Are permanent rubber agroforests an alternative to rotational rubber cultivation? An agro-ecological perspective. Forests, Trees and Livelihoods 20, 85 (2011).
15. G. Vincent, L. Joshi, Susilowati, Is flexibility or productivity the key to persistence of rubber agroforests in Jambi province (Sumatra)? . Forests, Trees and Livelihoods 20, 51 (2011).
16. G. Vincent et al., J.F. Molino, L. Marescot, K. Barkaoui, D. Sabatier, V. Freycon, J.B. Roelens, The relative importance of dispersal limitation and habitat preference in shaping spatial distribution of saplings in a tropical moist forest: a case study along a combination of hydromorphic and canopy disturbance gradients. Annals of Forest Science 68, 357 (2011).
17. P. Couteron, N. Barbier, C. Proisy, R. Pélissier, G. Vincent, Linking Remote-Sensing Information to Tropical Forest Structure: The Crucial Role of Modelling. Earthzine, 10 (2012).
18. D. Harja, G. Vincent, R. Mulia, M. Noordwijk, Tree shape plasticity in relation to crown exposure. Trees 26, 1275 (2012).
39
19. M. Laurans, O. Martin, E. Nicolini, G. Vincent, Functional traits and their plasticity predict tropical trees regeneration niche even among species with intermediate light requirements. Journal of Ecology 100, 1440 (2012).
20. G. Vincent, F.Caron, D. Sabatier, L. Blanc, LiDAR shows that higher forests have more slender trees. Bois et Forêts des Tropiques 314, 51 (2012).
21. G. Vincent, D. Sabatier, L. Blanc, J. Chave, E. Weissenbacher, R. Pélissier, E. Fonty, J.F. Molino, P. Couteron, Accuracy of small footprint airborne LiDAR in its predictions of tropical moist forest stand structure. Remote Sensing of Environment 125, 23 (2012).
22. C. Antin, R. Pélissier, G. Vincent, P. Couteron, Crown allometries are less responsive than stem allometry to tree size and habitat variations in an Indian monsoon forest. Trees 27, 1485 (2013).
23. P. Kennel, M. Tramon, N. Barbier, G. Vincent, Canopy height model characteristics derived from airbone laser scanning and its effectiveness in discriminating various tropical moist forest types. International Journal of Remote Sensing,34:8917-8935, (2013).
24. G. Vincent , D. Sabatier, E. Rutishauser (2014) Revisiting a universal airborne LiDAR approach for tropical forest carbon mapping: scaling-up from tree to stand to landscape. Oecologia accepted
Book chapters
1. G. Vincent, H. De Foresta, A three dimensional dynamic model of Damar agroforest in Sumatra (Indonesia) in Tropical Forest Dynamics, Gloria L. Enriquez, Upik Rosalina Wasrin, D. Murdiyarso, Eds. (SEMEAO BIOTROP, Bogor - INDONESIA, 1998), pp. 139-157.
2. G. Schroth et al., Agroforestry and biodiversity conservation in tropical landscapes in Agroforestry and biodiversity conservation in tropical landscapes. (Washington USA: Island Press., 2004), pp. 487-501.
3. G. Schroth, C. A. Harvey, G. Vincent, Complex agroforests - their structure, diversity and potential role in landscape conservation strategies in Agroforestry and biodiversity conservation in tropical landscapes. (Island Press, 2004), pp. 227-260.
4. A. Ekadinata, G. Vincent, in Belajar Dari Bungo, Mengelola Sumber Daya Alam di Era Desentralisasi, D. T. Hasantoha Adnan, E. Linda Yuliani, Heru Komarudin, Dicky Lopulalan, Yuliana L. Siagian dan Dani Wahyu Munggoro, Ed. (CIFOR -Center for International Forestry Research, Bogor, 2008), pp. 53-62.
5. S. Rasnovi, G. Vincent, C. Kusmana, S. Tjitrosemito, in Belajar Dari Bungo, Mengelola Sumber Daya Alam di Era Desentralisasi, H. Adnan et al., Eds. (CIFOR - Center for International Forestry Research, Bogor, 2008), pp. 239-256.
6. D. Harja, G. Vincent. 2013. Simple light interception model (SLIM). Pages 94-97 in L. B. van Noordwijk M, Leimona B, Dewi S, Wulandari D, Eds. Negotiation-support toolkit for learning landscapes (World Agroforestry Centre (ICRAF) Southeast Asia Regional Program Bogor, Indonesia 2013).
7. D. Harja, G. Vincent. 2013. Spatially explicit individual-based forest simulator (SExI-FS): for management of agroforests. Pages 103-106 in L. B. van Noordwijk M, Leimona B, Dewi S, Wulandari D, Eds. Negotiation-support toolkit for learning landscapes (World Agroforestry Centre (ICRAF) Southeast Asia Regional Program Bogor, Indonesia, 2013).
Conference proceedings
1. Ruhiyana, G. Vincent, Supriyanto, Adaptation of rubber (Hevea brasiliensis) seedlings to different light levels in Indonesian Rubber Conference and International Rubber Research Development Board Annual Symposium K. R.Azwar, G. Wibawa, H Suryaningtyas, R Arizal, S. Honggokusumo, D. Suparto, M Supriadi, C Anwar and Ayuni-Dewi Suwana, Ed. (Indonesian Rubber Research Institute, Bogor, 2000), vol. 1, pp. 113-125.
40
2. G. Vincent, G. Wibawa, G. Manurung, in Indonesian Rubber Conference and International Rubber Research Development Board Annual Symposium, R. .Azwar et al., Eds. (Indonesian Rubb. Res. Inst, Bogor. Indonesia, 2000), vol. 2, pp. 517-527.
3. D. Harja, Grégoire Vincent, Pratiknyo Purnomosidhi, S. Rahayu, L. Joshi, Impact of rubber tree planting pattern on Imperata cylindrica dynamics - Exploring weed control through shading using SExI-FS, a forest stand simulator in Smallholder agroforestry options for degraded tropical soils. Pp. 101-104 (World Agroforestry Center, Malang, Indonesia, 2005).
Conference paper without proceedings
1. G. Vincent, S. Authar, H. De Foresta, A simple model of light interception by trees in multi-species, multi-strata forests in Multistrata Agroforestry systems with perennial crops F. Jimenez, J. Beer, Eds. (CATIE, Turrialba, Costa Rica, 1999).
2. G. Vincent, H. De Foresta, How much variability in growth can crown form, crown position and local crowding indices in complex damar agroforests account for? in Multistrata Agroforestry systems with perennial crops F. Jimenez, J. Beer, Eds. (CATIE, Turrialba, Costa Rica, 1999).
3. G. Vincent, L. Veillon, H. De Foresta, A spatially explicit individual-based forest dynamic simulator in Multistrata Agroforestry systems with perennial crops F. Jimenez, J. Beer, Eds. (CATIE, Turrialba, Costa Rica, 1999).
4. L. Joshi, M. van-Noordwijk, G. Wibawa, G. Vincent, Gap replanting - an emerging trend in rejuvenation of jungle rubber agroforests in Jambi, Indonesia in Evolution and sustainability of "intermediate systems" of forest management. (Lofoten - Norway, 2000).
5. K. Smets, H. de Foresta, G. Vincent, Reproductive biology of Pygoplatys bugs (Heteroptera, Tessaratomidae) in Sumatra in Ninth Benelux Congress of Zoology. (Antwerp, 2002), vol. Abstractbook, pp. 188.
6. C. Dupraz, G. Vincent, R. Mulia, HiSAFE : un modèle 3D de croissance d’arbre en compétition avec une strate cultivée herbacée in Secondes Rencontres d’Ecophysiologie de l’Arbre. (La Rochelle, 2003).
7. A. Ekadinata, A. Widayati, G. Vincent, Rubber Agroforest Identification Using Object Based Classification in Bungo District, Jambi. in Asian Conference on Remote Sensing. (Thailand, 2004).
8. C. Dupraz, I. Lecomte, M. Mayus, R. Mulia, Vincent, G., Van Noordwijk, M. Integrating tree-crop interactions with the HySAFE model in World Agroforestry Congress. (2004).
9. G. Vincent, D. Harja Asmara, Jasnari, A generic crown development model for multi-species forest stand modelling in Functional-Structural Plant Models. (Montpellier, 2004).
10. E. Martini, G. Vincent, Contrasting patterns of stomatal conductance in seedlings of two co-occurring tropical timber species in VIII-èmes Journées d'Ecologie Fonctionnelle ( NOUAN le FUZELIER – FRANCE, 2006).
11. M. Laurans, G. Vincent, E. Nicolini, Caractérisation des stratégies de plasticité morphogénétique, au stade juvénile, d’un groupe d’espèces généralistes de forêt tropicale humide in « Plasticité Phénotypique des arbres », Groupe d’Etude de l’Arbre. (Montpellier., 2008).
12. C. Madelaine, M. Laurans, G. Vincent, D. Harja, Etude de la dynamique des communautés forestières. Apport d’un modèle individu centré explicitement tridimensionnel in Colloque INRA sur la Modélisation pour les ressources naturelles. (Montpellier, 2008).
13. S. Rasnovi, G. Vincent, H. d. Foresta, E. Martini, M. v. Noordwijck, Landscape assessment of tree diversity confirms high conservation value of rubber agroforest in Sumatra in Association for Tropical Biology and Conservation annual meeting. (Paramaribo, 2008).
14. L. Marescot, G. Vincent, J.-F. Molino, K. Barkaoui, The relative importance of dispersal limitation and ecological niche in shaping spatial distribution of trees in tropical moist forest in Knowledge-based management of tropical rainforests. (Cayenne, French Guyana, 2009).
41
15. M. A. Ngo Bieng, R. Mulia, C.Dupraz, M.Laurans, G. Talbot, G. Vincent, M. Van Noordwijk, Incorporating plant plasticity in agroforestry simulation models in 2nd World Congress of Agroforestry. (Nairobi Kenya, 2009).
16. G. Vincent, D. Sabatier, F. Caron, C. Véga, Multitemporal LiDAR applications to tropical forest dynamics studies in International Conference on Tropical Silviculture. (Montpellier, France, 2011).
Other papers (reports, working papers, software documentation) 1. L. Joshi, G. Wibawa,G. Vincent, D. Boutin, R. Akiefnawati, G. Manurung, M van Noordwijk, S.
Williams, Jungle rubber: a traditional agroforestry system under pressure. (ICRAF, Bogor, 2002).
2. G. Vincent, D. Harja, SLIM software: a simple light interception model for multi-species, multi-strata forests. Bois et Forêts des Tropiques 2, 97 (2002).
3. C. Dupraz et al., Synthesis of the Silvoarable Agroforestry For Europe project. (INRA-UMR System Editions, Montpellier, 2005), pp. 254.
4. D. Harja, G. Vincent. SExI-FS Spatially Explicit Forest Simulator (World Agroforestry System & Institut de Recherche pour le Développement, 2008), pp. User Guide and Software (83 p.).
5. G. Vincent, E. Nicolini, M. Laurans, “Autécologie de 6 espèces agrégatives de forêt guyanaise caractérisation du fonctionnement hydrique et de la réponse à l’ouverture de la canopée. Compte rendu DyGePop octobre 2012 – Rapport technique d’exécution de l’IRD-AMAP” (IRD, 2012).