Embed Size (px)
Citation preview
Modeling tropical forest dynamics using an individual-
based forest simulator
Sophie Fauset
Tim Baker, Bradley Christoffersen, Nikos Fyllas, David Galbraith, Manuel Gloor, Michelle Johnson
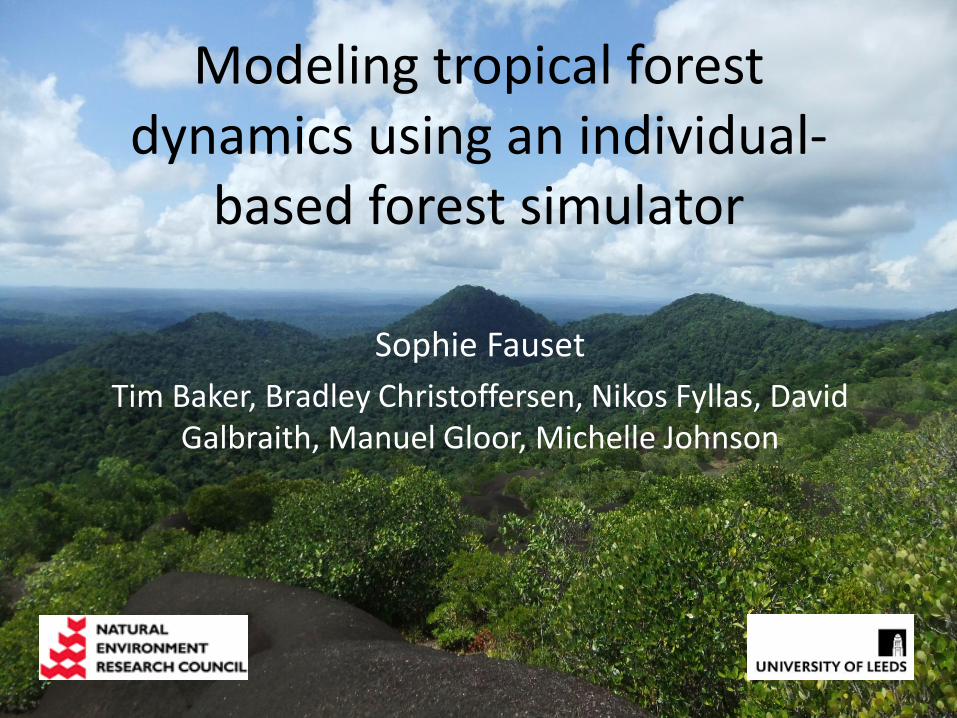
• Contain 50 % of the Earth’s plant and animal species. • Provide income and commodities. • House many species used in medicine. • Used for climate change mitigation.
• Gas exchange – water, CO2, O2. • Estimated intact forest sink – 1.19 Pg C yr-1. • An important unknown in global climate models.
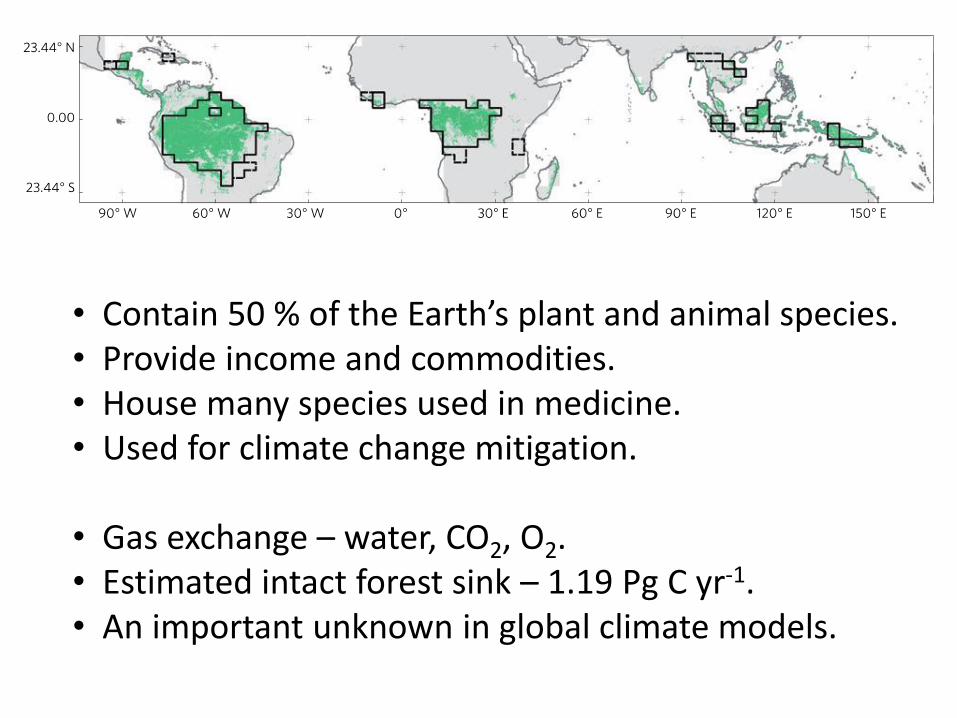
Malhi 2012
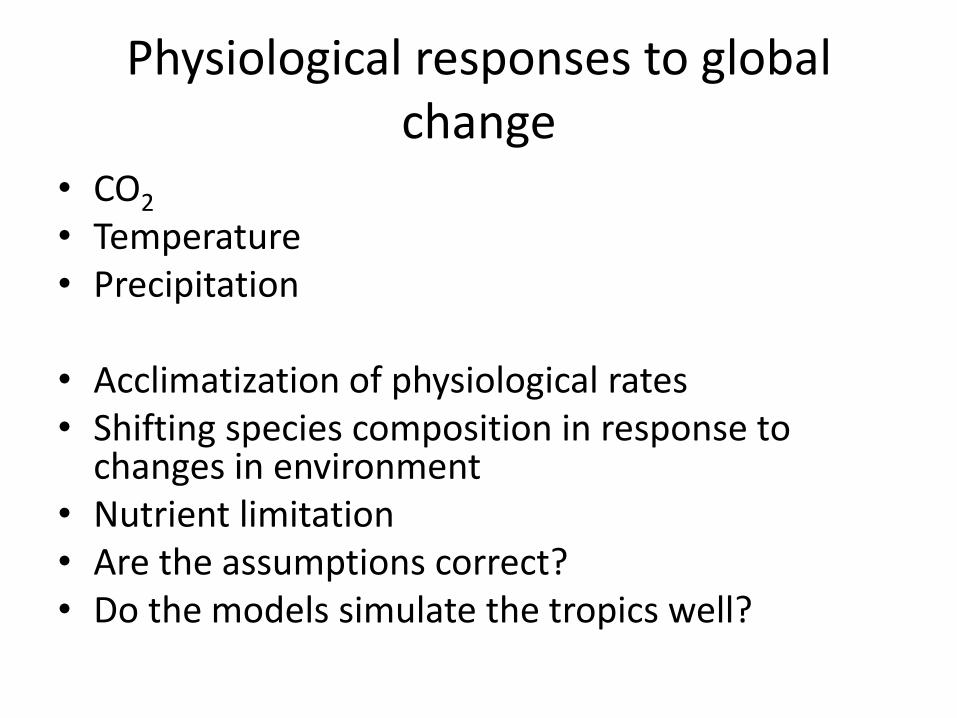
Physiological responses to global change
• CO2 • Temperature • Precipitation
• Acclimatization of physiological rates • Shifting species composition in response to
changes in environment • Nutrient limitation • Are the assumptions correct? • Do the models simulate the tropics well?
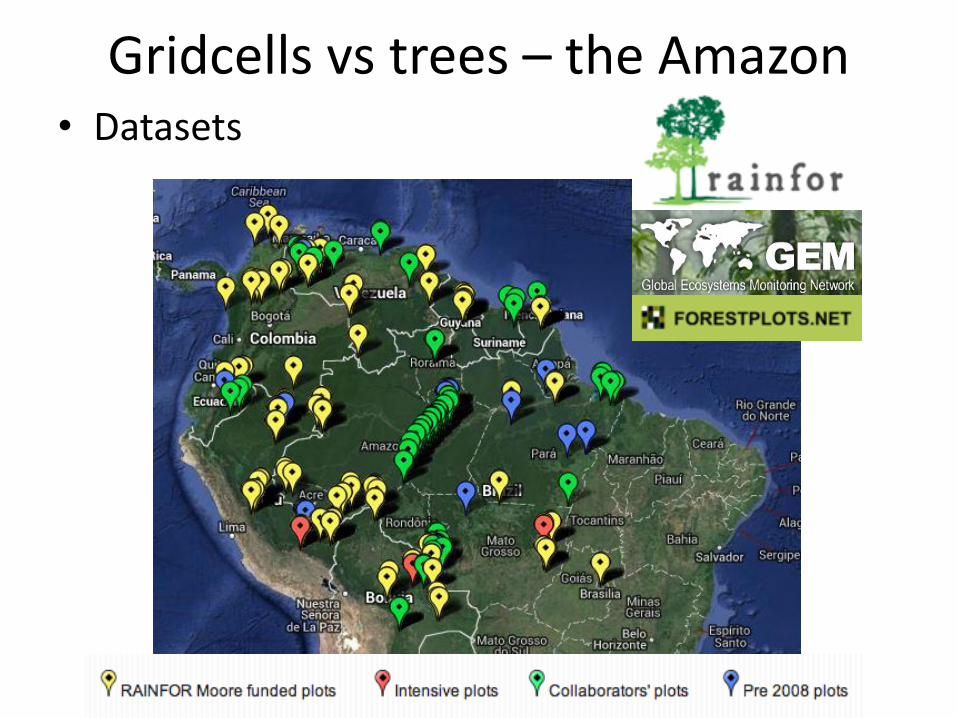
Gridcells vs trees – the Amazon • Datasets
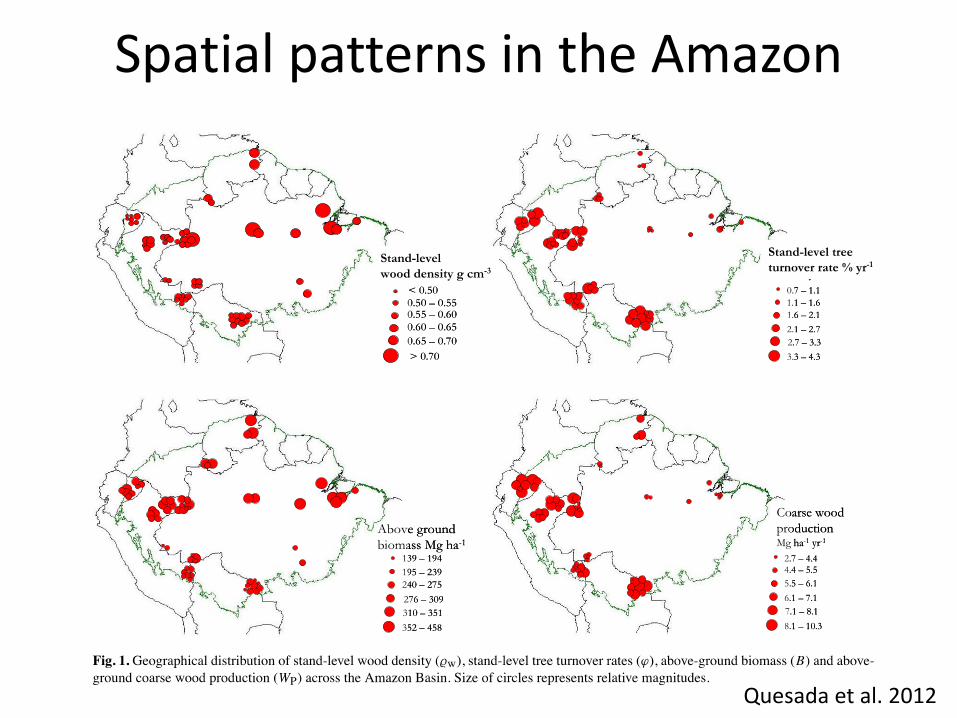
Spatial patterns in the Amazon
Quesada et al. 2012
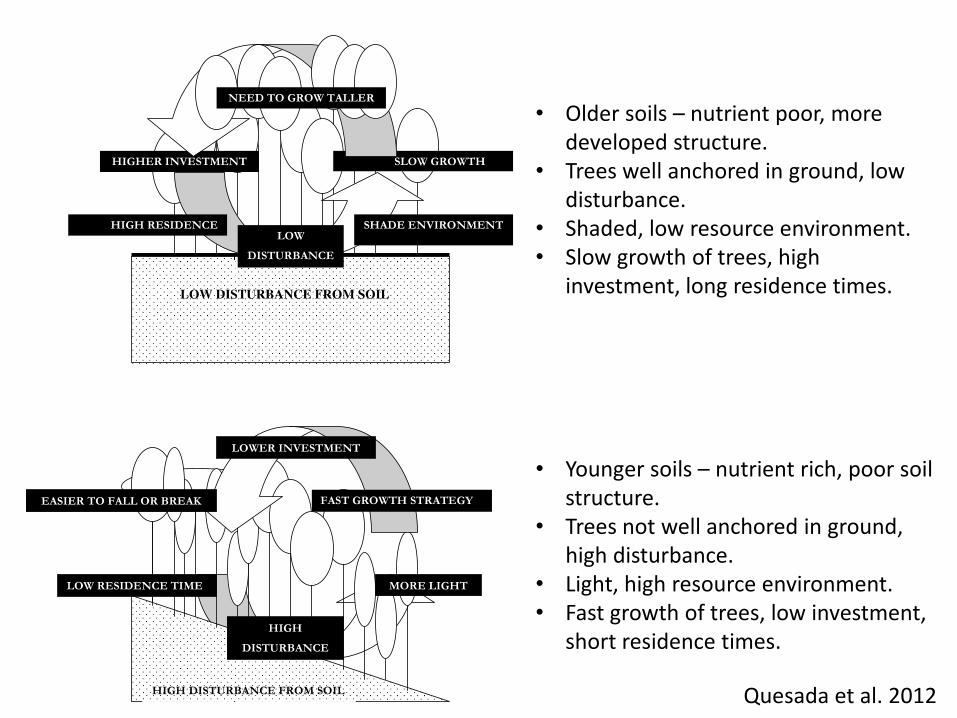
• Older soils – nutrient poor, more developed structure.
• Trees well anchored in ground, low disturbance.
• Shaded, low resource environment. • Slow growth of trees, high
investment, long residence times.
• Younger soils – nutrient rich, poor soil structure.
• Trees not well anchored in ground, high disturbance.
• Light, high resource environment. • Fast growth of trees, low investment,
short residence times.
Quesada et al. 2012

Above ground biomass gain Above ground biomass C
Obs v Models for RAINFOR plots
Individuals and traits
• Tropical forests are incredibly species rich.
• Different species have different characteristics and habitat associations.
• Phenotypic expression of traits is dependent on species and modulated by the environment (Fyllas et al. 2009).
• Representing the variation in life strategies present at a single site may be important…
1 4
Biomass Change
(Mg ha-1 yr-1)
0.1 0.9
‘Dry Forest
Score’ Change
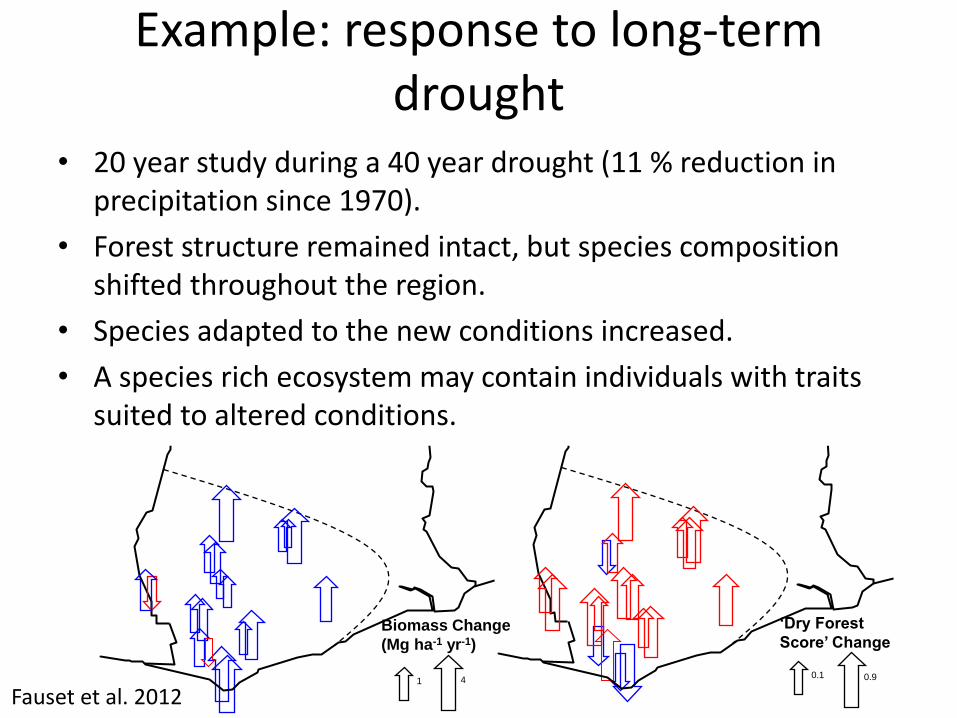
Example: response to long-term drought
• 20 year study during a 40 year drought (11 % reduction in precipitation since 1970).
• Forest structure remained intact, but species composition shifted throughout the region.
• Species adapted to the new conditions increased.
• A species rich ecosystem may contain individuals with traits suited to altered conditions.
Fauset et al. 2012
TFS: Trait-based Forest Simulator
• We need to account for variation in species/traits within and between sites.
• Can we predict the spatial variation in Amazon forest functioning by accounting for trait variation?
• Does the outcome of simulations under different scenarios vary if we allow shifts in species/traits?
• Hopefully a more realistic model will give us more realistic results.

• Steady state model developed by Nikos Fyllas, further development to produce a fully dynamic model.
• Designed to utilise the large forest plots database.
• Current version is initialised from data to give the between and within site variation in traits and forest structure.
TFS: Trait-based Forest Simulator

Trait-Based Forest Simulator (TFS)
Figure: N. Fyllas
Inputs Size class distribution Traits distribution Climate Soil
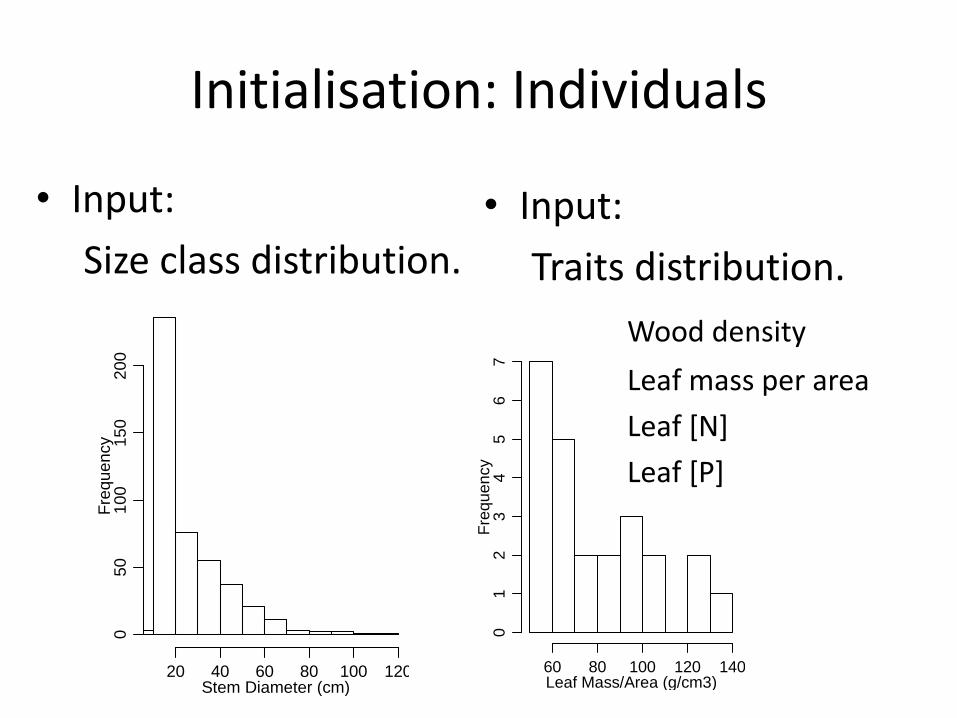
Initialisation: Individuals
• Input:
Size class distribution.
Stem Diameter (cm)
Fre
que
ncy
20 40 60 80 100 120
050
10
01
50
20
0
• Input:
Traits distribution.
Wood density
Leaf mass per area
Leaf [N]
Leaf [P]
Leaf Mass/Area (g/cm3)
Fre
que
ncy
60 80 100 120 140
01
23
45
67
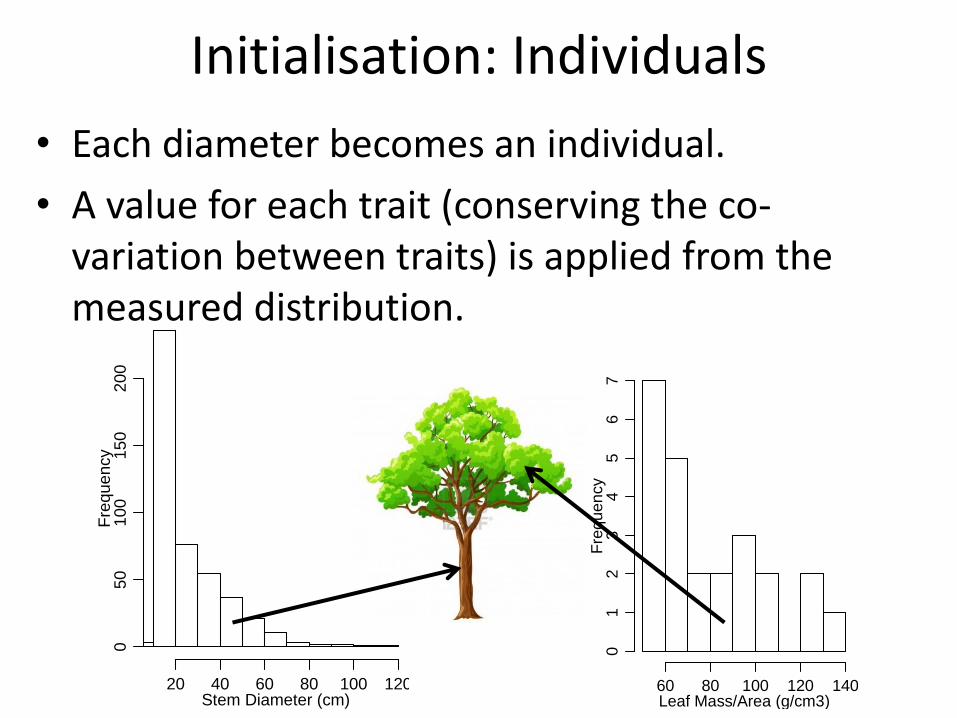
Initialisation: Individuals
• Each diameter becomes an individual.
• A value for each trait (conserving the co-variation between traits) is applied from the measured distribution.
Stem Diameter (cm)
Fre
que
ncy
20 40 60 80 100 120
050
10
01
50
20
0
Leaf Mass/Area (g/cm3)
Fre
que
ncy
60 80 100 120 140
01
23
45
67

Initialisation: Individuals From diameter and traits we use allometry to further describe the tree structure.
Tree height, crown area, crown volume, crown depth, biomass pools (stem, leaf, roots), foliage area, leaf area index, rooting depth.

50 100 150 200
10
20
30
40
DBH (cm)
He
igh
t (m
)
50 100 150 200
05
00
10
00
15
00
DBH (cm)C
row
n A
rea
(m
2)
Using Bongers, Bongers & Poorter 2006
Using equation from Rosie Goodman
Example allometries
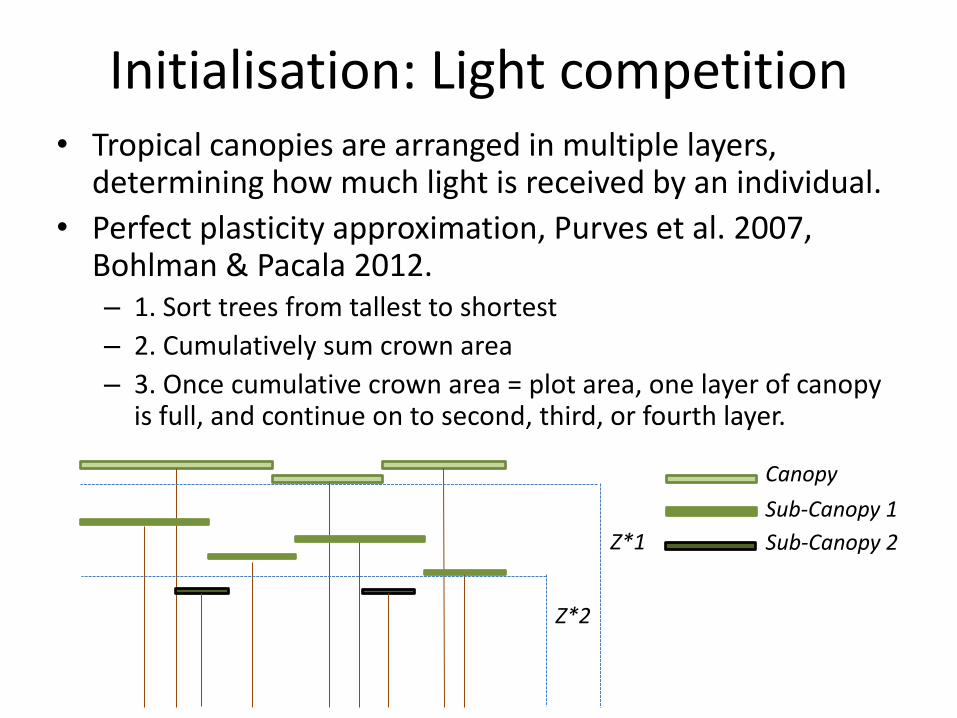
Initialisation: Light competition • Tropical canopies are arranged in multiple layers,
determining how much light is received by an individual.
• Perfect plasticity approximation, Purves et al. 2007, Bohlman & Pacala 2012. – 1. Sort trees from tallest to shortest
– 2. Cumulatively sum crown area
– 3. Once cumulative crown area = plot area, one layer of canopy is full, and continue on to second, third, or fourth layer.
Z*1
Canopy
Sub-Canopy 1
Z*2
Sub-Canopy 2
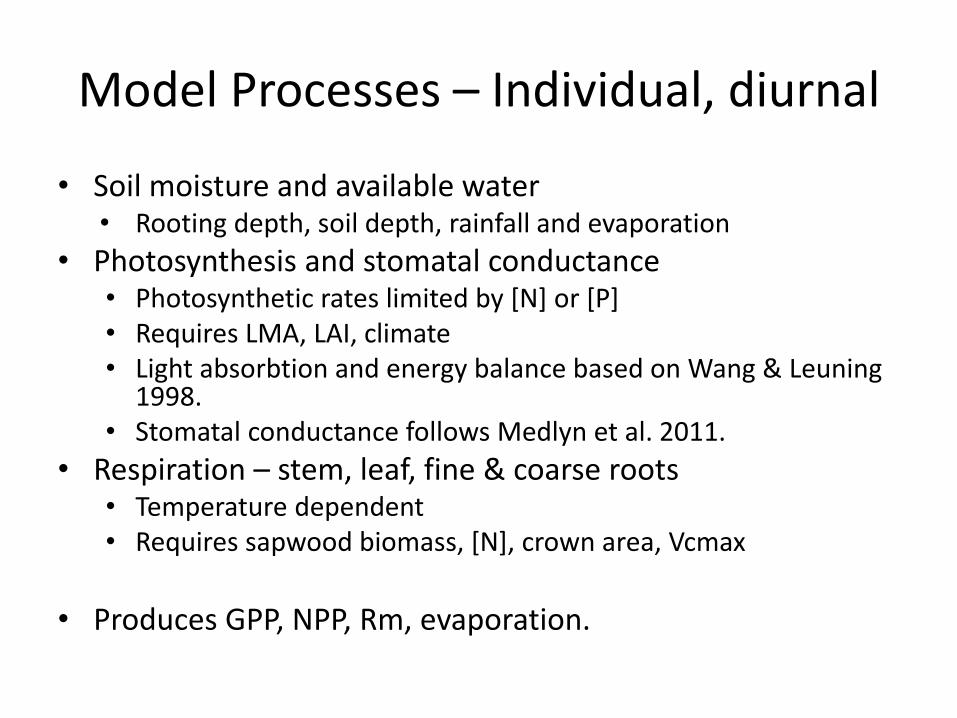
Model Processes – Individual, diurnal
• Soil moisture and available water • Rooting depth, soil depth, rainfall and evaporation
• Photosynthesis and stomatal conductance • Photosynthetic rates limited by [N] or [P] • Requires LMA, LAI, climate • Light absorbtion and energy balance based on Wang & Leuning
1998. • Stomatal conductance follows Medlyn et al. 2011.
• Respiration – stem, leaf, fine & coarse roots • Temperature dependent • Requires sapwood biomass, [N], crown area, Vcmax
• Produces GPP, NPP, Rm, evaporation.
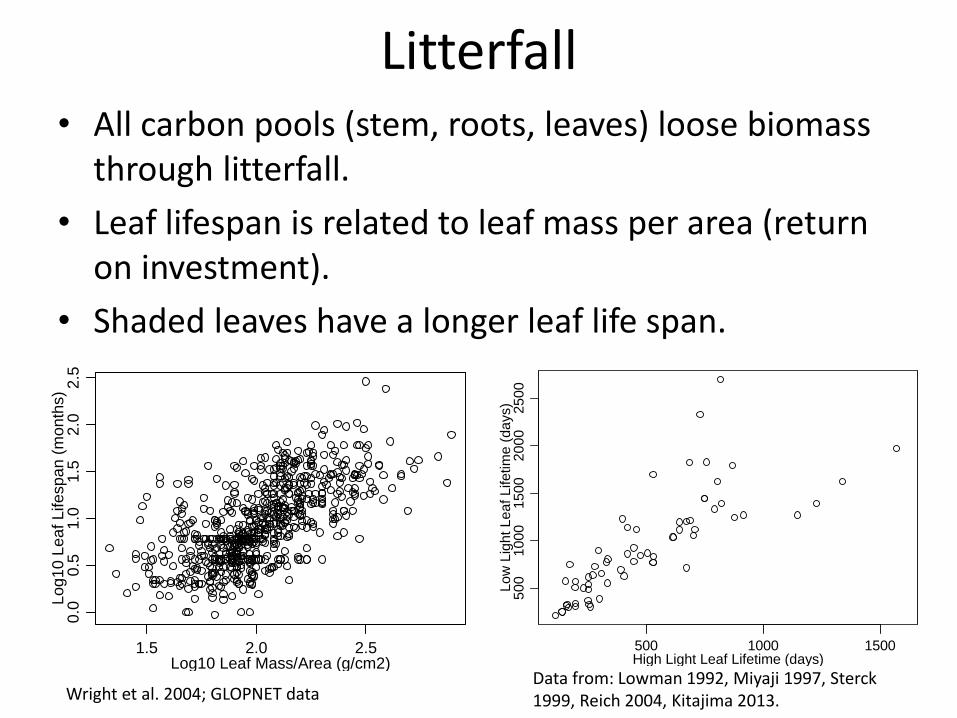
Litterfall • All carbon pools (stem, roots, leaves) loose biomass
through litterfall.
• Leaf lifespan is related to leaf mass per area (return on investment).
• Shaded leaves have a longer leaf life span.
1.5 2.0 2.5
0.0
0.5
1.0
1.5
2.0
2.5
Log10 Leaf Mass/Area (g/cm2)
Lo
g1
0 L
ea
f Life
sp
an (
mon
ths)
Wright et al. 2004; GLOPNET data Data from: Lowman 1992, Miyaji 1997, Sterck 1999, Reich 2004, Kitajima 2013.
500 1000 1500
50
01
00
01
500
20
00
25
00
High Light Leaf Lifetime (days)
Low
Lig
ht
Lea
f Lifetim
e (
da
ys)
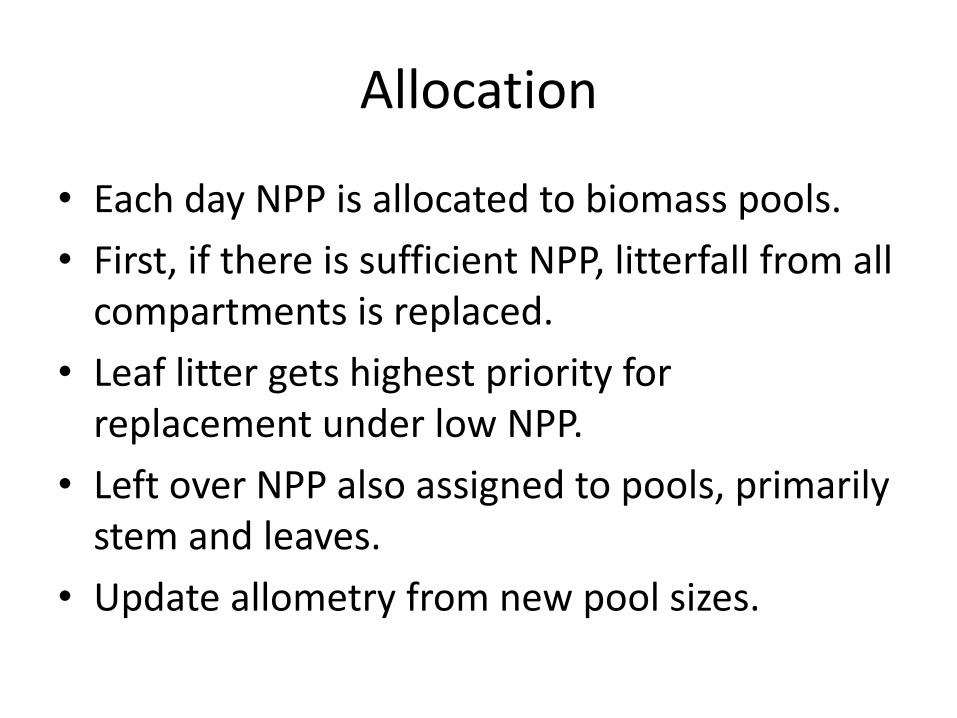
Allocation
• Each day NPP is allocated to biomass pools.
• First, if there is sufficient NPP, litterfall from all compartments is replaced.
• Leaf litter gets highest priority for replacement under low NPP.
• Left over NPP also assigned to pools, primarily stem and leaves.
• Update allometry from new pool sizes.

Population Dynamics - Mortality
• Probability of mortality for each tree based on growth and wood density.
• Used RAINFOR plot data to come up with an equation – ML logistic regression based on Lines et al. 2010 and Chao et al. 2008.
• Growth rates based on penultimate census period.
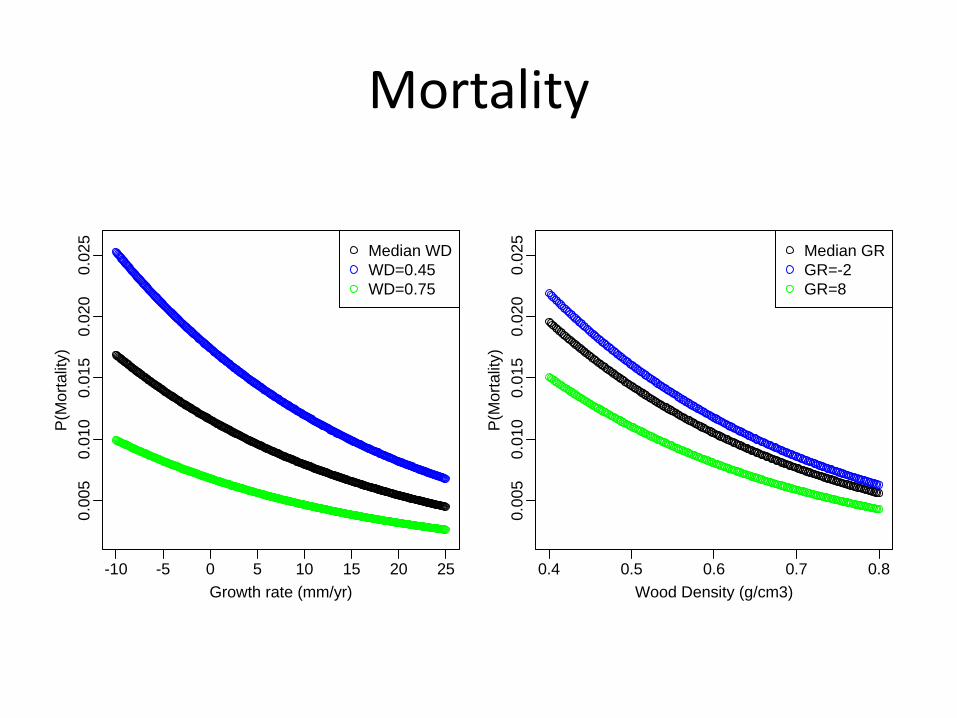
Mortality
-10 -5 0 5 10 15 20 25
0.0
05
0.0
10
0.0
15
0.0
20
0.0
25
Growth rate (mm/yr)
P(M
ort
alit
y)
Median WD
WD=0.45
WD=0.75
0.4 0.5 0.6 0.7 0.8
0.0
05
0.0
10
0.0
15
0.0
20
0.0
25
Wood Density (g/cm3)
P(M
ort
alit
y)
Median GR
GR=-2
GR=8
Population Dynamics - Recruitment
• At present set to 2 % per year.
• To be developed
– create ‘seeds’ from the current tree population
– ‘plant’ a subsample at random locations
– calculate photosynthesis (considering shading)
– only those with highest photosynthesis survive

Simulated vs observed AGB dynamics (preliminary)
Observed Simulated
Biomass map, Malhi et al. 2006
Recruits Growth Mortality
AGP-01
Ab
ove
gro
und
Bio
ma
ss (
Mg
/ha
/yr)
01
23
45
67
Recruits Growth Mortality
BNT-04
Ab
ove
gro
und
Bio
ma
ss (
Mg
/ha
/yr)
01
23
4
Recruits Growth Mortality
CAX-06
Ab
ove
gro
und
Bio
ma
ss (
Mg
/ha
/yr)
01
23
4
Recruits Growth Mortality
HCC-21
Ab
ove
gro
und
Bio
ma
ss (
Mg
/ha
/yr)
05
10
15
Recruits Growth Mortality
TAM-05
Ab
ove
gro
und
Bio
ma
ss (
Mg
/ha
/yr)
01
23
45
67

Simulated vs observed AGB dynamics (preliminary)
0.2 0.6 1.0 1.4
0.2
0.6
1.0
1.4
AGB Recruits Obs. (Mg/ha/yr)
AG
B R
ecru
its S
im.
(Mg
/ha
/yr)
5 10 15
51
01
5
AGB Gain Obs. (Mg/ha/yr)
AG
B G
ain
Sim
. (M
g/h
a/y
r)
Obs. Sim.
0.4
0.6
0.8
1.0
1.2
AG
B R
ecru
its (
Mg
/ha/y
r)
Obs. Sim.
24
68
10
14
AG
B G
ain
(M
g/h
a/y
r)
Obs. Sim.
23
45
67
AG
B M
ort
alit
y O
bs.
(Mg
/ha
/yr)
2 4 6 8
24
68
AGB Mortality Obs. (Mg/ha/yr)
AG
B M
ort
alit
y S
im. (M
g/h
a/y
r)

Tree by tree growth
2000
-2 0 1 2 3 4 5
01
00
20
030
040
0 2001
-2 0 1 2 3 4 5
01
00
20
030
040
0 2002
-2 0 1 2 3 4 5
01
00
20
030
040
0 2003
-2 0 1 2 3 4 5
01
00
20
030
040
0 2004
-2 0 1 2 3 4 5
01
00
20
030
040
0 2005
-2 0 1 2 3 4 5
01
00
20
030
040
0 2006
-2 0 1 2 3 4 5
01
00
20
030
040
0
Annual Growth (cm)-2 0 1 2 3 4 5
05
01
00
20
03
00
Annual Growth (cm)-2 0 1 2 3 4 5
05
01
00
20
03
00
Annual Growth (cm)-2 0 1 2 3 4 5
05
01
00
20
03
00
Annual Growth (cm)-2 0 1 2 3 4 5
05
01
00
20
03
00
Annual Growth (cm)-2 0 1 2 3 4 5
05
01
00
20
03
00
Annual Growth (cm)-2 0 1 2 3 4 5
05
01
00
20
03
00
Annual Growth (cm)-2 0 1 2 3 4 5
05
01
00
20
03
00
Observations Simultations AGP-01
HCC-21
Recruits Growth Mortality
AGP-01
Ab
ove
gro
und
Bio
ma
ss (
Mg
/ha
/yr)
01
23
45
67
Recruits Growth Mortality
HCC-21
Ab
ove
gro
und
Bio
ma
ss (
Mg
/ha
/yr)
05
10
15

GPP, NPP, RM
2000 2003 2006
01
02
030
40
CAX
Year
Mg C
ha Y
r
GPP
NPP
RM
2000 2003 2006
01
02
030
40
MAN
Year
Mg C
ha Y
r
2000 2003 2006
01
02
030
40
TAM-05
Year
Mg C
ha Y
r
2000 2003 2006
01
02
030
40
TAM-06
Year
Mg C
ha Y
r
Summary
• Sensitivity of tropical forest ecosystems to global change still unclear.
• Currently used models to not perform well in replicating spatial patterns in the Amazon.
• Models incorporating the variation in plant traits within and between communities may improve realism and accuracy.
• Using individual based models has some additional challenges and may highlight key ecological tradeoffs, eg. LMA-leaf lifespan
Acknowledgements
Model Development Nikos Fyllas Manuel Gloor Tim Baker Michelle Johnson Bradley Christoffersen David Galbraith
Datasets All RAINFOR and GEM collaborators and field participants Oliver Phillips Gabriela Lopez Gonzalez