Embed Size (px)
Citation preview

Tropical Ecology Assessment and Monitoring Network
Climate Monitoring Protocol Implementation Manual
Version 3.1
October 2011
Cite as: TEAM Network. 2011. Climate Monitoring Protocol, v. 3.1. Tropical Ecology, Assessment and Monitoring Network, Science and Knowledge Division, Conservation
International, Arlington, VA, USA.
2 TEAM Climate Monitoring Protocol 3.1
Acknowledgments This protocol and all other TEAM protocols are collective works. They were developed and reviewed by numerous scientists. We especially thank Helene Muller-Landau, Bill Munger, Karl Kauffman and Steve Wofsy. Previous versions of this protocol were reviewed by Hilêndia Brandão, Idemê Gomes Amaral, Lee Hannah, James Heath, Antonio Carlos Lôla da Costa, Yadvinder Malhi, Marcelo Matsumura, Patrick Meir, Terry Root, Steve Schneider, Rebecca Shaw, Ansmarie Soetosenoj, Marc Steinenger and Rudi van Kanten. This protocol follows minimum guidelines of the World Meteorological Organization (WMO). Jorge A. Ahumada, Eric H. Fegraus, and James D. MacCarthy, Tropical Ecology, Assessment and Monitoring Network, Science and Knowledge Division, Conservation International, compiled and wrote the TEAM Implementation Manual. Series Editor, TEAM Protocol Implementation Manuals is Sandy J. Andelman, Vice President, Tropical Ecology, Assessment and Monitoring Network, Science and Knowledge Division, Conservation International. The TEAM Monitoring Protocols are published by: The Tropical Ecology, Assessment and Monitoring (TEAM) Network Conservation International 2011 Crystal Drive, Suite 500 Arlington, VA 22202 703.341.2400 TEAM is a partnership between Conservation International, The Missouri Botanical Garden, The Smithsonian Institution and The Wildlife Conservation Society. TEAM Network online: www.teamnetwork.org Conservation International online: www.conservation.org Conservation International is a private, nonprofit organization exempt from federal income tax under section 501(c)(3) of the Internal Revenue Code.
TEAM Climate Monitoring Protocol 3.1 3
Contents
1 INTRODUCTION AND SCOPE ................................................................................................. 52 GOALS AND IMPLEMENTATION .............................................................................................. 73 BASIC EQUIPMENT DESCRIPTION ........................................................................................... 7
3.1 Base – Campbell Scientific UT10 Tower .............................................................................. 83.2 Data logger – Campbell Scientific CR1000 ......................................................................... 83.3 Sensors ............................................................................................................................. 8
3.3.1 Temperature/Relative Humidity Sensor – Vaisala HMP45C ........................................... 93.3.2 Precipitation Gauge – Hydrological Services TB4 .......................................................... 93.3.3 Solar Radiation – Licor LI200X ..................................................................................... 9
3.4 Power supply ..................................................................................................................... 93.4.1 Solar Panel – Yingli YL-85 ............................................................................................ 93.4.2 Battery – Universal Power Group UB121000 .............................................................. 103.4.3 Charge Regulator – Morningstar Sunsaver 10 (12V) ................................................... 10
4 CLIMATE STATION SITING PROTOCOL ................................................................................. 114.1 Basic Siting Requirements ................................................................................................. 114.2 Level 1 Siting ................................................................................................................... 124.3 Level 2 Siting ................................................................................................................... 14
4.3.1 Choosing a location ................................................................................................. 144.3.2 Siting the Radiation Sensor ........................................................................................ 18
4.4 Level 3 Siting ................................................................................................................... 184.5 Ordering the Equipment ................................................................................................... 19
5 ASSEMBLY OF THE CLIMATE STATION ................................................................................... 195.1 Testing all the instrumentation upon receipt ....................................................................... 19
5.1.1 Connect and setup the data logger ............................................................................ 195.1.2 Upload the data collection program ........................................................................... 225.1.3 Connect all the sensors ............................................................................................. 235.1.4 Extract the data from the data logger ......................................................................... 245.1.5 Extracting the Data from a Memory Card ................................................................... 25
5.2 Climate Station Pre-installation Preparations ...................................................................... 265.3 Installing the base tower .................................................................................................. 27
5.3.1 Base Installation ....................................................................................................... 275.3.2 Tower Installation ..................................................................................................... 285.3.3 Grounding ............................................................................................................... 28
5.4 Installing the Data Logger and Battery ............................................................................... 285.5 Installing the Solar Panel .................................................................................................. 29
5.5.1 Connecting the Solar Panel to the Charge Regulator ................................................... 295.5.2 Orientation and Inclination of the Solar Panel ............................................................ 31
5.6 Installing the sensors ........................................................................................................ 315.6.1 Vaisala HMP45C Temperature/RH sensor .................................................................. 315.6.2 Licor LI200X Solar Radiation sensor ........................................................................... 355.6.3 Rain Gauge (TB4) ..................................................................................................... 36
5.7 Finishing steps ................................................................................................................. 385.7.1 Secure the weather resistant enclosure ....................................................................... 385.7.2 Site Metadata Protocol .............................................................................................. 39
5.8 Managing sensors ........................................................................................................... 435.9 Test run the station .......................................................................................................... 44
4 TEAM Climate Monitoring Protocol 3.1
6 RUNNING THE CLIMATE STATION ......................................................................................... 466.1 Regular maintenance ....................................................................................................... 46
6.1.1 Core area maintenance ............................................................................................ 466.1.2 Tower maintenance .................................................................................................. 476.1.3 Enclosure maintenance ............................................................................................. 476.1.4 Sensor maintenance ................................................................................................. 476.1.5 Power systems maintenance ...................................................................................... 48
6.2 Manually collecting data from the field ............................................................................. 496.3 Uploading data to the TEAM portal ................................................................................... 50
6.3.1 Uploading climate station measurements: .................................................................. 516.3.2 Uploading the Climate Maintenance Log ................................................................... 52
6.4 Checking rainfall measurements against the manual rain gauge ........................................ 536.4.1 Measure and record the event ................................................................................... 536.4.2 Submit the data ........................................................................................................ 53
6.5 Sensor Calibration ........................................................................................................... 546.5.1 Temperature/RH sensor (Vaisala HMP45C) ............................................................... 546.5.2 Precipitation gauge (TB4) .......................................................................................... 556.5.3 Solar radiation (LI 200X) ........................................................................................... 566.5.4 Uploading calibration forms ...................................................................................... 57
7 REFERENCES CITED ............................................................................................................... 598 GLOSSARY ............................................................................................................................ 619 Appendix A.1. Main Equipment List .......................................................................................... 6510 Appendix A.2. Site Metadata Field Form ................................................................................ 6611 Appendix A.3. Climate Protocol Maintenance Log .................................................................. 6912 Appendix A.4. Sensor Installation/Calibration Form ................................................................ 7213 Appendix A.5. Sensor Calibration Metadata Form .................................................................. 7414 Appendix A.6. Manual Rainfall Form ...................................................................................... 7615 Appendix A.7. Wiring diagrams ............................................................................................. 7816 Appendix A.8. Climate data management tool help ................................................................ 81

TEAM Climate Monitoring Protocol 3.1 5
1 IINNTTRROODDUUCCTTIIOONN AANNDD SSCCOOPPEE
Climate change has been identified as one of the main threats to humanity and to the long-term persistence of the living world in general (IPCC 2007, Wright 2005, Malhi et al. 2008, Rockström et al. 2009). Only 15 out of 50,000 long-term time series of biological and bioclimatic variables come out of tropical areas (less than 0.03%) (IPCC 2007). The lack of a long-term, continuous, reliable climate data stream coming from tropical areas (Clark and Clark 1994; Root and Schneider 1995; IPCC 2007; Enquist 2002) is compounded by the fact that most surface climate measurements are collected in populated areas (e.g. airports, cities, towns), which experience local climates that may not be representative of natural forested areas (Malhi and Wright 2004). Additionally, many of these measurements although useful for meteorological services (e.g. local weather forecasts), are not adequate to estimate long-term trends in climatic variables over long periods of time, because of a lack of consistency between most surface weather stations in instrumentation, sensor calibration protocols and data quality control (among others). The expected effects of climate change on tropical forest ecosystems are still unknown. For example, Phillips et al. (1998) describe how forests could be carbon sinks, increasing forest biomass accumulation as CO2 levels increase. However, during unusually dry spells, which are more frequent due to climate change, increased temperature could cause tropical forests to become sources of CO2, thus further aggravating the problem (Clark 2002, Kenneth et al. 2007, Phillips et al. 2009). A global network collecting continuous and reliable climate data throughout tropical forests is badly needed. The foundation of this network should be the application of a single consistent climate protocol for setup, instrumentation, data collection, calibration, maintenance, and data quality control. Since changes in climate are so gradual and small (e.g. increase in temperature ~ 0.6 ºC in the last two decades), it is imperative to remove the confounding effects differences in methods produce in order to measure climate across sites and to detect these changes with an adequate level of precision. The World Meteorological Organization and the National Research Council at the National Academy of Sciences (NRC 1999, WMO 2003) propose a minimum set of guidelines for climate observing networks to ensure adequate scientific rigor and maximize the use of data and its applications (summarized):
11.. MMaannaaggeemmeenntt ooff NNeettwwoorrkk CChhaannggee:: Assess the effects of change in the observing network on current and future climatological observations, particularly with respect to climate change and variability.
22.. PPaarraall lleell TTeesstt iinngg: Simultaneous operation of old systems with new systems over a sufficiently long period that captures the full range of variation in the data.
3. MMeettaaddaattaa: Full documentation of climate observing systems and procedures. This includes, among others, instrumentation, instrument sampling time, calibration, validation, climate station location, local environmental conditions, and detailed algorithm descriptions.
4. DDaattaa QQuuaall ii ttyy aanndd CCoonntt iinnuuii ttyy: Assessment of data quality and continuity as part of the routine data collection process.
5. IInntteeggrraatteedd EEnnvvii rroonnmmeennttaall AAsssseessssmmeenntt: Anticipate the use of the data in the development of environmental assessments such as climate change and its effects on other systems.
66.. HHiissttoorr iiccaall SSiiggnnii ff iiccaannccee:: Strive to maintain climate observing systems that have been operating for long time frames (decades, century) and maintain high quality data.

6 TEAM Climate Monitoring Protocol 3.1
77.. CCoommpplleemmeennttaarryy DDaattaa:: Give higher priority to the deployment of climate observing systems in data-poor, unrepresented areas.
8. CCll iimmaattee RReeqquuiirreemmeennttss: Provide adequate monitoring technical requirements at the outset of network implementation. This includes stated high accuracy of instrumentation requirements and small bias to detect trends and other phenomena depending on the nature of the network.
9. CCoonntt iinnuuii ttyy ooff PPuurrppoossee:: Maintain stable and long-term commitment to these observing systems to maximize data utility.
10. DDaattaa aanndd MMeettaaddaattaa AAcccceessss:: Develop data management systems that facilitate access, use, and interpretation of data and data products by users. Freedom of access, low cost mechanisms that facilitate use and quality control should be an integral part of data management.
Consistent with these guiding principles, The Tropical Ecology Assessment and Monitoring (TEAM) Network has compiled a Climate Monitoring Protocol to address the lack of high-quality, long-term climatological data coming from tropical forests. TEAM’s mission is to understand the effects of global drivers of change (climate, land use change) on biodiversity and ecosystem services by collecting standardized data throughout a network of tropical forest sites at several spatial and temporal scales (Andelman & Willig 2004, Andelman 2011). Thus, the implementation of a high quality climate monitoring protocol across a large number of tropical sites is necessary to answer the global questions underlying the design of the network. By standardizing the equipment used, siting requirements for the climate station, and sensor calibration and maintenance schedules across sites, it is possible not only to detect climate trends within a site, but also between sites, and make the data a truly global resource for the scientific and conservation communities. Some of the questions that could be answered with a long-term multi-site tropical forest climate station network are:
1. Are dry seasons getting longer or more intense in tropical forests? Is this due to lower rainfall, higher incoming solar radiation, or a combination of both?
2. How is the temporal pattern of rainfall changing with climate change? Is rainfall becoming more variable and at what scale (e.g. day, month, year)?
3. How is temperature changing in tropical forests? Are these changes more evident in periods of low rainfall and higher solar radiation?
This protocol has gone through the highest standards of scientific review to produce a standardized, detailed, and affordable protocol that can be implemented by anyone throughout the tropics. This document describes in detail all the necessary steps to setup and implement the TEAM Climate Monitoring Protocol. It has been written with non-experts in mind, so that anyone with basic technical skills can understand the process of assembling a climate station and collecting consistent and reliable climate measurements in tropical forests. A series of training videos that illustrate many of these steps can be found at http://www.teamnetwork.org/en/protocols/climate.

TEAM Climate Monitoring Protocol 3.1 7
2 GGOOAALLSS AANNDD IIMMPPLLEEMMEENNTTAATTIIOONN
The goal of the TEAM Climate Monitoring Protocol is to provide a standardized methodology to generate high-quality reliable measurements of climatic variables in tropical forests. This document describes a ggrroouunndd--bbaasseedd protocol where all the instrumentation is installed in a 3 m tower located in an adequate-size clearing. Although the basic methods can be applied to a climate station located on the top of a canopy tower, the protocol assumes this infrastructure will not be available at most sites. This ground-based version of the TEAM Climate Monitoring Protocol implements measurements for four climatic variables: air temperature, relative humidity, precipitation and global solar radiation. The sensors used, are mid-price ranged, but sensitive and reliable enough to handle the rough conditions encountered in tropical environments. The climate station operates automatically; the sensor data feeds into a data logger, powered by a solar panel and a rechargeable battery (for night operation). The data- logger collects information from the sensors every 5 seconds and produces summaries every 5 minutes (see Box 1 for a quick description of the protocol).
3 BBAASSIICC EEQQUUIIPPMMEENNTT DDEESSCCRRIIPPTTIIOONN
In order to be an adequate tool for monitoring climate, the sensors and equipment used in the Climate Protocol must comply with minimum standards of quality and accuracy required by other standard climate monitoring efforts (e.g. United States Climate Reference Network at the National Oceanic Atmospheric Administration). The following section describes briefly each of the components required to implement the TEAM Climate Protocol. A list of the equipment with providers and model numbers can be found in Appendix A.1. The range, resolution, required uncertainty, and other technical specifications for the variables measured in the TEAM Climate Protocol are summarized in Section 3.3 on page 8.
BOX 1. TEAM Climate protocol in a nutshell
Climate station is ground-based (most equipment mounted on a 3 m tower) Climate station is autonomous and self powered (solar panel, battery) Four variables measured: Air Temperature, Relative Humidity, Global Solar Radiation, and Precipitation Sensors for temperature/relative humidity and solar radiation are run in duplicate Temperature/RH sensors housed inside an aspirated radiation shield Measurements are logged every 5 seconds and reported every 5 minutes in a data logger Automated standardized computer program for data collection Detailed maintenance and sensor calibration schedules that are incorporated into the metadata
8 TEAM Climate Monitoring Protocol 3.1
3.1 Base – Campbell Scientific UT10 Tower
The base of the climate station where the data logger, power sources and sensors (except rainfall), are located, consists of a 3 m aluminum tower. We recommend the use of Campbell Scientific UT10 tower, which is light (18 kg), requires a small footprint for installation (61 x 61 x 61 cm) and has a high wind load (177 km/h). The tower comes with a grounding kit to protect the integrity of the equipment and data during lighting storms.
3.2 Data logger – Campbell Scientific CR1000
The data logger receives all the information from the sensors and organizes the data that can be exported later to a computer, memory card or broadcasted through a radio signal or network. The protocol requires a data logger that can accommodate a wide array of sensors, is expandable, is fully programmable, has network communication capabilities, and is rugged for the conditions encountered at tropical forest sites. An adequate data logger that fits these specifications is the Campbell Scientific CR1000. More detailed information on how to setup, program, maintain and retrieve data from the CR1000 is found in later sections of this document. Videos on how to setup, program, maintain and retrieve data from a data logger are also provided on the TEAM website at http://www.teamnetwork.org/en/protocols/climate.
3.3 Sensors
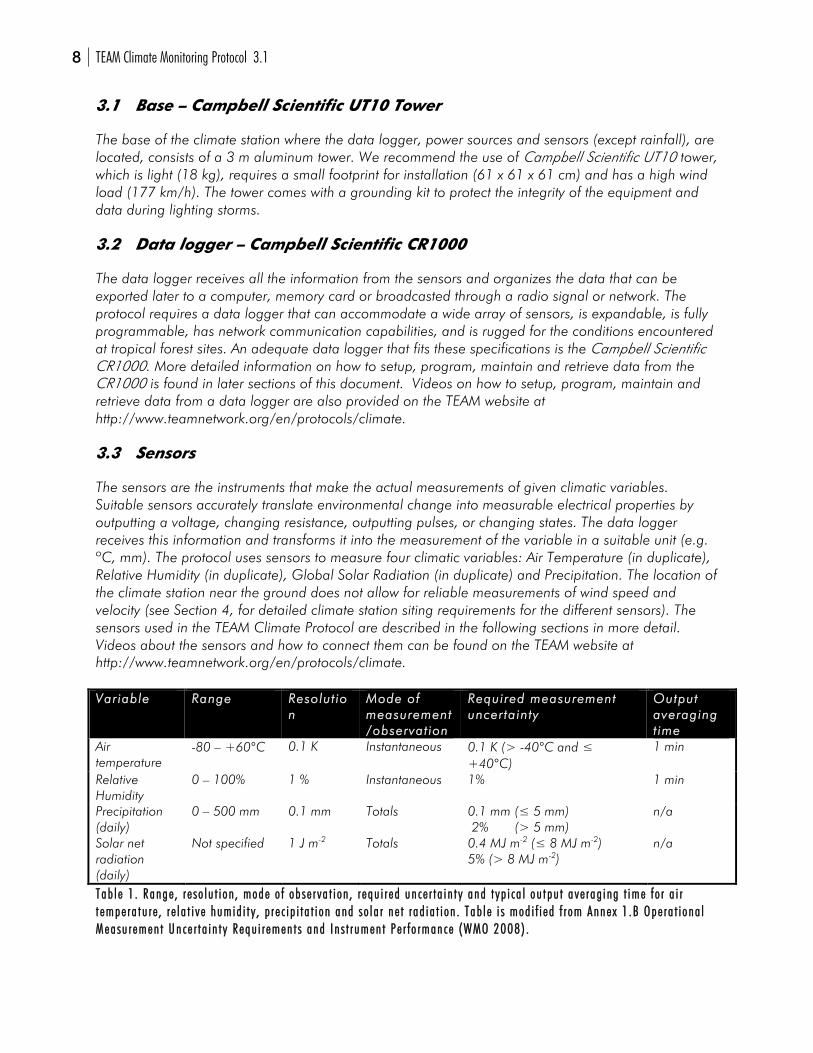
The sensors are the instruments that make the actual measurements of given climatic variables. Suitable sensors accurately translate environmental change into measurable electrical properties by outputting a voltage, changing resistance, outputting pulses, or changing states. The data logger receives this information and transforms it into the measurement of the variable in a suitable unit (e.g. ºC, mm). The protocol uses sensors to measure four climatic variables: Air Temperature (in duplicate), Relative Humidity (in duplicate), Global Solar Radiation (in duplicate) and Precipitation. The location of the climate station near the ground does not allow for reliable measurements of wind speed and velocity (see Section 4, for detailed climate station siting requirements for the different sensors). The sensors used in the TEAM Climate Protocol are described in the following sections in more detail. Videos about the sensors and how to connect them can be found on the TEAM website at http://www.teamnetwork.org/en/protocols/climate. VVaarr iiaabbllee RRaannggee RReessoolluutt iioo
nn MMooddee ooff mmeeaassuurreemmeenntt //oobbsseerrvvaatt iioonn
RReeqquuiirreedd mmeeaassuurreemmeenntt uunncceerr ttaaiinnttyy
OOuuttppuutt aavveerraaggiinngg tt iimmee
Air temperature
-80 – +60°C 0.1 K Instantaneous 0.1 K (> -40°C and +40°C)
1 min
Relative Humidity
0 – 100% 1 % Instantaneous 1% 1 min
Precipitation (daily)
0 – 500 mm 0.1 mm Totals 0.1 mm ( 5 mm) 2% (> 5 mm)
n/a
Solar net radiation (daily)
Not specified 1 J m-2 Totals 0.4 MJ m-2 ( 8 MJ m-2) 5% (> 8 MJ m-2)
n/a
TTaabb ll ee 11 .. RRaannggee ,, rr ee ssoo ll uu tt ii oonn ,, mmooddee oo ff oobb ssee rr vvaa tt ii oonn ,, rr eeqquu ii rr eedd uunn ccee rr tt aa ii nn tt yy aanndd tt yypp ii ccaa ll oouu tt ppuu tt aavvee rr aagg ii nngg tt iimmee ff oo rr aa ii rr tt eemmppee rr aa tt uu rr ee ,, rr ee ll aa tt ii vv ee hhuummiidd ii tt yy ,, pp rr ee cc ii pp ii tt aa tt ii oonn aanndd ss oo ll aa rr nnee tt rr aadd ii aa tt ii oonn .. TTaabb ll ee ii ss mmoodd ii ff ii eedd ff rr oomm AAnnnnee xx 11 ..BB OOppee rr aa tt ii oonnaa ll MMeeaassuu rr eemmeenn tt UUnnccee rr tt aa ii nn tt yy RReeqquu ii rr eemmeenn tt ss aanndd II nn ss tt rr uummeenn tt PPee rr ff oo rrmmaannccee ((WWMMOO 22000088)) ..
TEAM Climate Monitoring Protocol 3.1 9
3.3.1 Temperature/Relative Humidity Sensor – Vaisala HMP45C
The TEAM Climate Protocol uses two Vaisala HMP45C sensors, which measures both relative humidity (%) and air temperature (ºC). These sensors are housed in an aspirated radiation shield to avoid the influence of solar radiation on the measurements. The shield type used for this sensor is the MetOne 076B-5, which stabilizes readings by allowing air to move past the sensor. Two temperature/RH sensors are housed in the aspirated radiation shield.
3.3.2 Precipitation Gauge – Hydrological Services TB4
The use of an automatic but sensitive precipitation gauge with low error in recording intense rainfall events (very common in tropical areas) is essential. The Hydrological Services TB4 rain gauge funnels rain into a tipping bucket mechanism that tips when 0.25 mm of rain has been collected. Each tip is marked by a dual reed switch closure that is recorded by the data logger. After measurement, the water drains through two orifices in the base, allowing the measured water to be collected in a separate container if desired. The rain gauge includes a siphoning mechanism that allows the rain to flow at a steady rate to the tipping bucket mechanism regardless of rainfall intensity which reduces typical rain bucket errors, enabling the gauge to record intense rainfall events. As a backup, we recommend installing a regular, manual precipitation gauge to double check heavy precipitation measurements (>50 mm/hour). Both precipitation gauges should be mounted at least 6 m from the main climate station tower and at least 30 cm above the ground (see Section 5.6.3). There is also a windscreen manufactured by Novalynx that will need to be installed around the precipitation gauge to prevent inaccuracies in measurements caused by strong winds (see Section 5.6.3).
3.3.3 Solar Radiation – Licor LI200X
This is a silicon-photovoltaic pyranometer that measures global solar radiation (both direct and diffuse radiation). Although less sensitive than the most sophisticated thermopile pyranometers, the Licor LI200X has medium stability (± 2% per year) and acceptable accuracy (3%-5%) for baseline measurements. The LI200X should be mounted in an area with near complete view of the sky (no obstacles 5 degrees above the horizon), which in many cases might require it to be installed in a separate location from the rest of the sensors (see Section 4 for siting information). Sensors are mounted in duplicate (one facing north and one facing south) to account for seasonal movements in the solar path and to serve as a backup (see Section 5.6.2 for more installation details).
3.4 Power supply
3.4.1 Solar Panel – Yingli YL-85
A solar panel provides the energy needed to keep the station running and charging the battery for night operation. The solar panel will still provide some power on cloudy days, but not as much as on sunny days. Still, one should not be concerned about losing data due to power failure unless there is an exceptionally long period of cloudiness. The recommended solar panel is the Yingli YL-85 because of its ability to produce 85 Watts of power (enough to run the station during the day) and because it can be mounted either on the side of the UT10 tower (see Section 5.5 for installation instructions) or, if there is not enough light, on a pole near the station.
10 TEAM Climate Monitoring Protocol 3.1
3.4.2 Battery – Universal Power Group UB121000
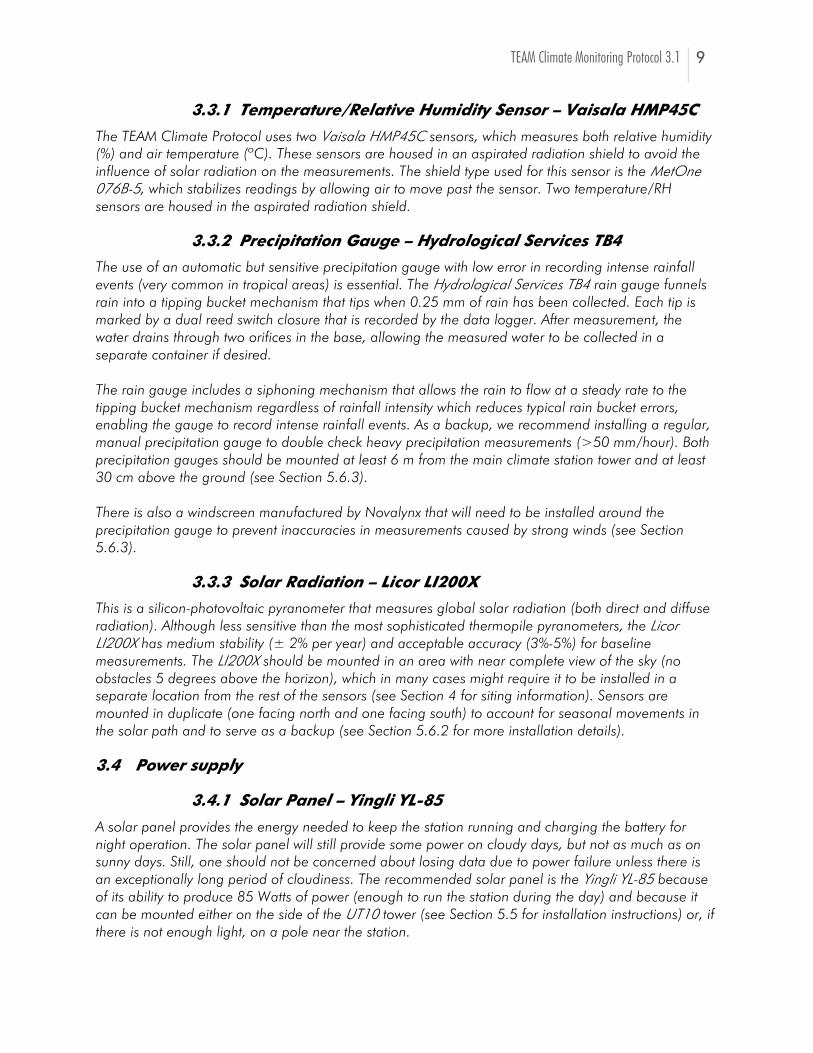
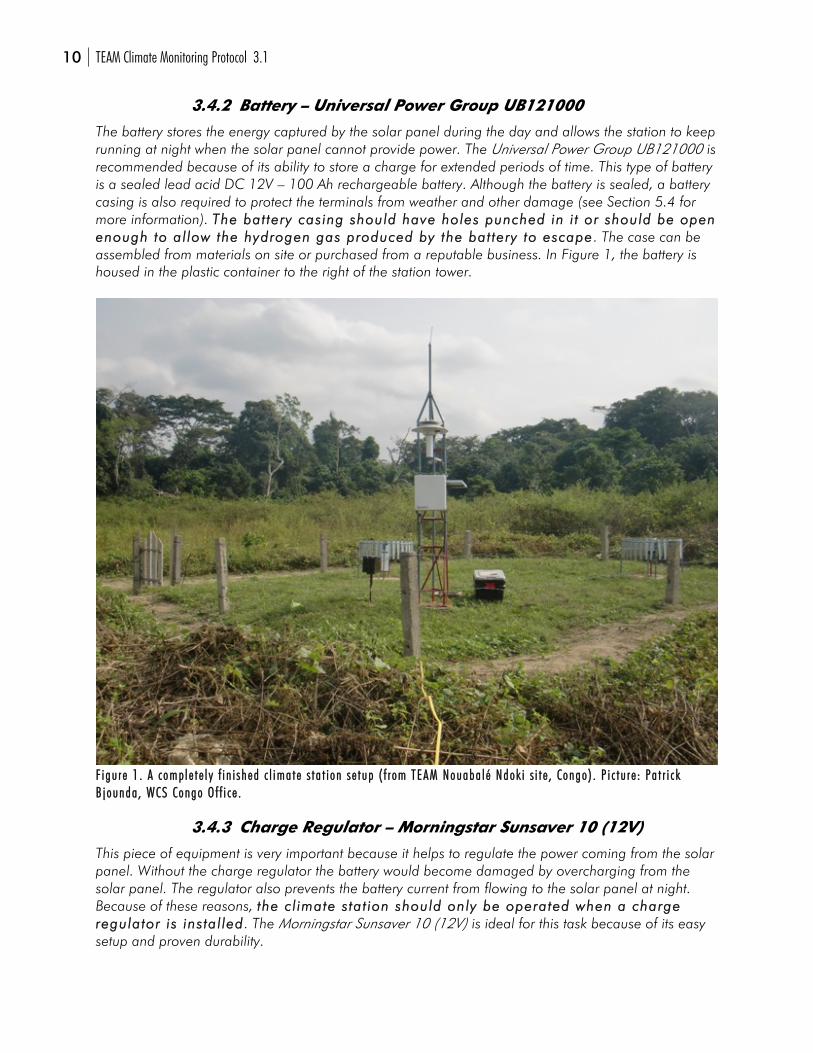
The battery stores the energy captured by the solar panel during the day and allows the station to keep running at night when the solar panel cannot provide power. The Universal Power Group UB121000 is recommended because of its ability to store a charge for extended periods of time. This type of battery is a sealed lead acid DC 12V – 100 Ah rechargeable battery. Although the battery is sealed, a battery casing is also required to protect the terminals from weather and other damage (see Section 5.4 for more information). TThhee bbaatt tteerryy ccaassiinngg sshhoouulldd hhaavvee hhoolleess ppuunncchheedd iinn ii tt oorr sshhoouulldd bbee ooppeenn eennoouugghh ttoo aall llooww tthhee hhyyddrrooggeenn ggaass pprroodduucceedd bbyy tthhee bbaatt tteerryy ttoo eessccaappee. The case can be assembled from materials on site or purchased from a reputable business. In Figure 1, the battery is housed in the plastic container to the right of the station tower.
FF ii gguu rr ee 11 .. AA cc oommpp ll ee tt ee ll yy ff ii nn ii sshheedd cc ll iimmaa tt ee ss tt aa tt ii oonn ss ee tt uupp (( ff rr oomm TTEEAAMM NNoouuaabbaa ll éé NNddookk ii ss ii tt ee ,, CCoonnggoo )) .. PP ii cc tt uu rr ee :: PPaa tt rr ii cc kk BB jj oouunnddaa ,, WWCCSS CCoonnggoo OO ff ff ii cc ee ..
3.4.3 Charge Regulator – Morningstar Sunsaver 10 (12V)
This piece of equipment is very important because it helps to regulate the power coming from the solar panel. Without the charge regulator the battery would become damaged by overcharging from the solar panel. The regulator also prevents the battery current from flowing to the solar panel at night. Because of these reasons, tthhee ccll iimmaattee ssttaatt iioonn sshhoouulldd oonnllyy bbee ooppeerraatteedd wwhheenn aa cchhaarrggee rreegguullaattoorr iiss iinnssttaall lleedd. The Morningstar Sunsaver 10 (12V) is ideal for this task because of its easy setup and proven durability.
TEAM Climate Monitoring Protocol 3.1 11
4 CCLLIIMMAATTEE SSTTAATTIIOONN SSIITTIINNGG PPRROOTTOOCCOOLL
4.1 Basic Siting Requirements
It is crucial to carefully choose the location where the climate station will be installed to ensure the highest reliability and quality of the data. Listed below are the basic minimum siting requirements for a ground-based climate station. We follow here the general guidelines from the World Meteorological Organization (WMO 2008) and the Environmental Protection Agency (EPA 1995):
The climate station (3 m base tower with the instrumentation and the precipitation gauge) should be located within a cleared and level piece of ground, no smaller than 65-70 m2.
The station should NOT be located in the following areas: o Sloping ground o Hollows or valleys o Rooftops o Permanently shaded areas o Swamps o Low places that hold water after rain
A fence to exclude unauthorized personnel should enclose this area. The ground should be covered with short grass or a surface representative of the site (not
asphalt or cement). Ideally, the climate station should be located in a clearing with an unobstructed view of the sky
(no obstacles above 5 degrees from the horizon) to fulfill the siting requirements of the solar radiation sensor (see Table 2). If it is impossible to find a location that fulfills both the requirements outlined above, then the station should be located based on the siting requirements for temperature and precipitation (see Section 4.2 for siting guidelines). If no suitable locations can be found that fulfill these requirements, then find the site that most closely approximates the siting requirements for precipitation and temperature measurements and document the site conditions carefully (see Section 4.4).
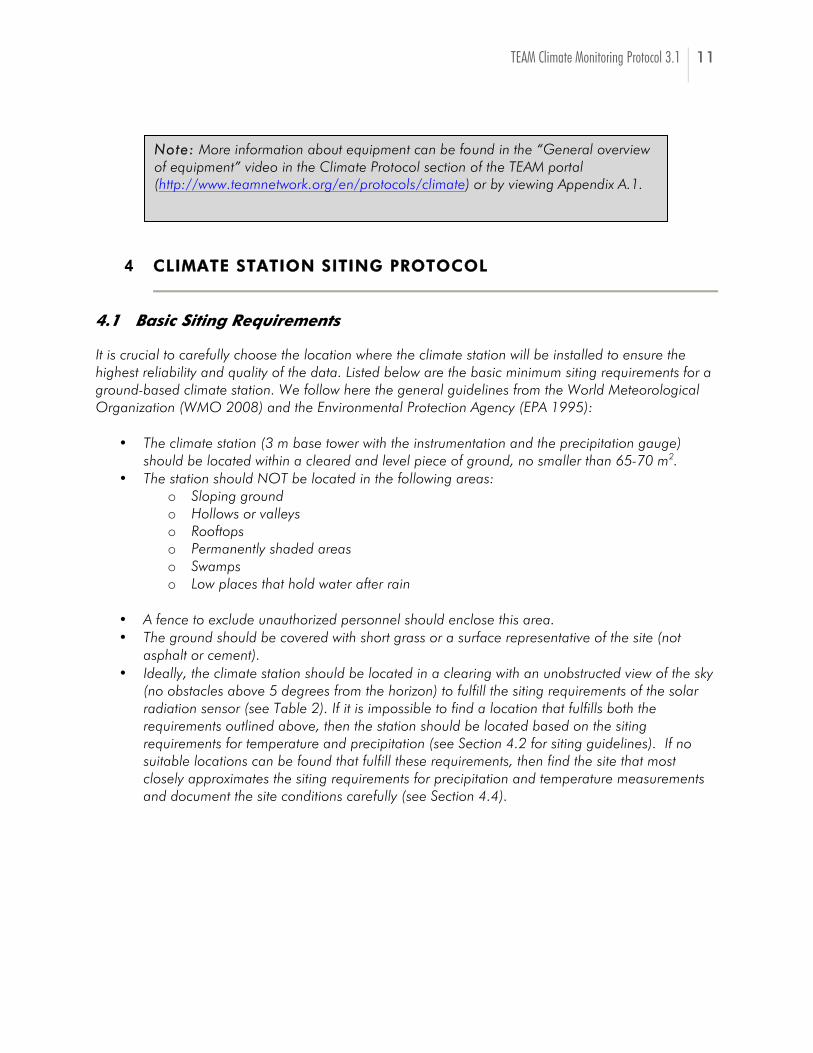
NNoottee:: More information about equipment can be found in the “General overview of equipment” video in the Climate Protocol section of the TEAM portal (http://www.teamnetwork.org/en/protocols/climate) or by viewing Appendix A.1.
12 TEAM Climate Monitoring Protocol 3.1
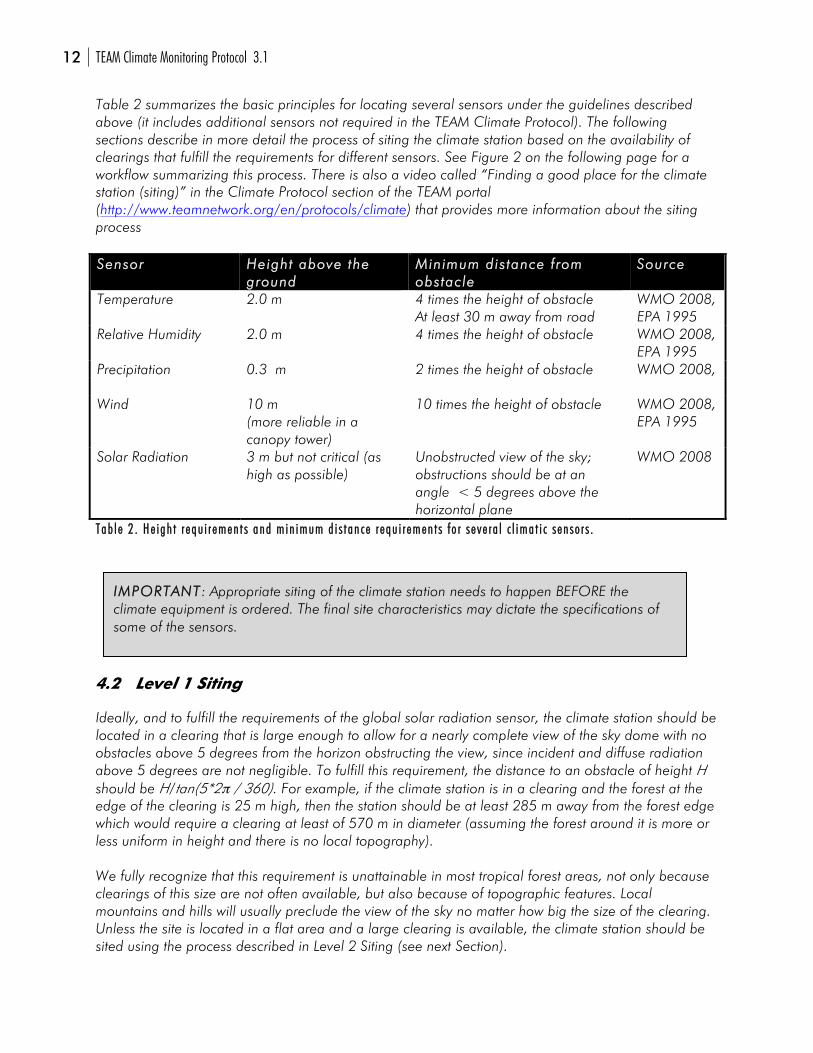
Table 2 summarizes the basic principles for locating several sensors under the guidelines described above (it includes additional sensors not required in the TEAM Climate Protocol). The following sections describe in more detail the process of siting the climate station based on the availability of clearings that fulfill the requirements for different sensors. See Figure 2 on the following page for a workflow summarizing this process. There is also a video called “Finding a good place for the climate station (siting)” in the Climate Protocol section of the TEAM portal (http://www.teamnetwork.org/en/protocols/climate) that provides more information about the siting process SSeennssoorr HHeeiigghhtt aabboovvee tthhee
ggrroouunndd MMiinniimmuumm ddiiss ttaannccee ff rroomm oobbssttaaccllee
SSoouurrccee
Temperature 2.0 m 4 times the height of obstacle At least 30 m away from road
WMO 2008, EPA 1995
Relative Humidity 2.0 m 4 times the height of obstacle WMO 2008, EPA 1995
Precipitation 0.3 m 2 times the height of obstacle WMO 2008, Wind 10 m
(more reliable in a canopy tower)
10 times the height of obstacle WMO 2008, EPA 1995
Solar Radiation 3 m but not critical (as high as possible)
Unobstructed view of the sky; obstructions should be at an angle < 5 degrees above the horizontal plane
WMO 2008
TTaabb ll ee 22 .. HHee ii gghh tt rr eeqquu ii rr eemmeenn tt ss aanndd mmiinn iimmuumm dd ii ss tt aannccee rr eeqquu ii rr eemmeenn tt ss ff oo rr ss ee vvee rr aa ll cc ll iimmaa tt ii cc ss eenn ssoo rr ss ..
4.2 Level 1 Siting
Ideally, and to fulfill the requirements of the global solar radiation sensor, the climate station should be located in a clearing that is large enough to allow for a nearly complete view of the sky dome with no obstacles above 5 degrees from the horizon obstructing the view, since incident and diffuse radiation above 5 degrees are not negligible. To fulfill this requirement, the distance to an obstacle of height H should be H/tan(5*2 / 360). For example, if the climate station is in a clearing and the forest at the edge of the clearing is 25 m high, then the station should be at least 285 m away from the forest edge which would require a clearing at least of 570 m in diameter (assuming the forest around it is more or less uniform in height and there is no local topography). We fully recognize that this requirement is unattainable in most tropical forest areas, not only because clearings of this size are not often available, but also because of topographic features. Local mountains and hills will usually preclude the view of the sky no matter how big the size of the clearing. Unless the site is located in a flat area and a large clearing is available, the climate station should be sited using the process described in Level 2 Siting (see next Section).
IIMMPPOORRTTAANNTT: Appropriate siting of the climate station needs to happen BEFORE the climate equipment is ordered. The final site characteristics may dictate the specifications of some of the sensors.
TEAM Climate Monitoring Protocol 3.1 13
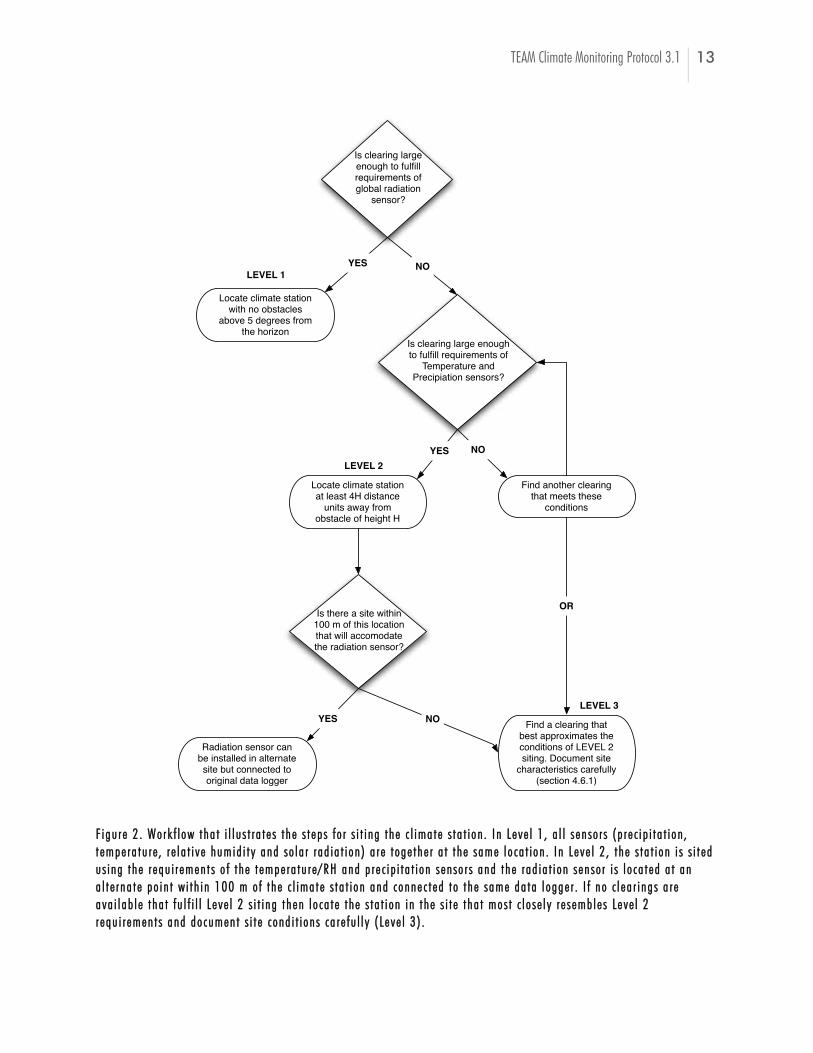
FF ii gguu rr ee 22 .. WWoo rr kk ff ll ooww tt hhaa tt ii ll ll uu ss tt rr aa tt ee ss tt hhee ss tt eepp ss ff oo rr ss ii tt ii nngg tt hhee cc ll iimmaa tt ee ss tt aa tt ii oonn .. II nn LL eevvee ll 11 ,, aa ll ll ss eenn ssoo rr ss (( pp rr ee cc ii pp ii tt aa tt ii oonn ,, tt eemmppee rr aa tt uu rr ee ,, rr ee ll aa tt ii vv ee hhuummiidd ii tt yy aanndd ss oo llaa rr rr aadd ii aa tt ii oonn )) aa rr ee tt ooggee tt hhee rr aa tt tt hhee ssaammee ll oo ccaa tt ii oonn .. II nn LL eevvee ll 22 ,, tt hhee ss tt aa tt ii oonn ii ss ss ii tt eedd uu ss ii nngg tt hhee rr eeqquu ii rr eemmeenn tt ss oo ff tt hhee tt eemmppee rraa tt uu rr ee //RRHH aanndd pp rr ee cc ii pp ii tt aa tt ii oonn ss eenn ssoo rr ss aanndd tt hhee rr aadd ii aa tt ii oonn ss eenn ssoo rr ii ss ll oo ccaa tt eedd aa tt aann aa ll tt ee rr nnaa tt ee ppoo ii nn tt ww ii tt hh ii nn 110000 mm oo ff tt hhee cc ll iimmaa tt ee ss tt aa tt ii oonn aanndd cc oonnnnee cc tt eedd tt oo tt hhee ssaammee ddaa tt aa ll ooggggee rr .. II ff nnoo cc ll eeaa rr ii nngg ss aa rr ee aavvaa ii ll aabb ll ee tt hhaa tt ff uu ll ff ii ll ll LL eevvee ll 22 ss ii tt ii nngg tt hheenn ll oo ccaa tt ee tt hhee ss tt aa tt ii oonn ii nn tt hhee ss ii tt ee tt hhaa tt mmooss tt cc ll oo ss ee ll yy rr ee ss eemmbb ll ee ss LL eevvee ll 22 rr eeqquu ii rr eemmeenn tt ss aanndd ddoo ccuummeenn tt ss ii tt ee cc oonndd ii tt ii oonn ss ccaa rr ee ff uu ll ll yy (( LL eevvee ll 33 )) ..
Locate climate station with no obstacles
above 5 degrees from the horizon
Is clearing large ll
requirements of global radiation
sensor?
LEVEL 1YES
Locate climate station at least 4H distance
units away from obstacle of height H
NO
Is clearing large enough ll requirements of
Temperature and Precipiation sensors?
LEVEL 2YES
Is there a site within 100 m of this location that will accomodate the radiation sensor?
Find a clearing that best approximates the conditions of LEVEL 2 siting. Document site
characteristics carefully (section 4.6.1)
NO
Radiation sensor can be installed in alternate site but connected to original data logger
YES NOLEVEL 3
Find another clearing that meets these
conditions
OR
14 TEAM Climate Monitoring Protocol 3.1
4.3 Level 2 Siting
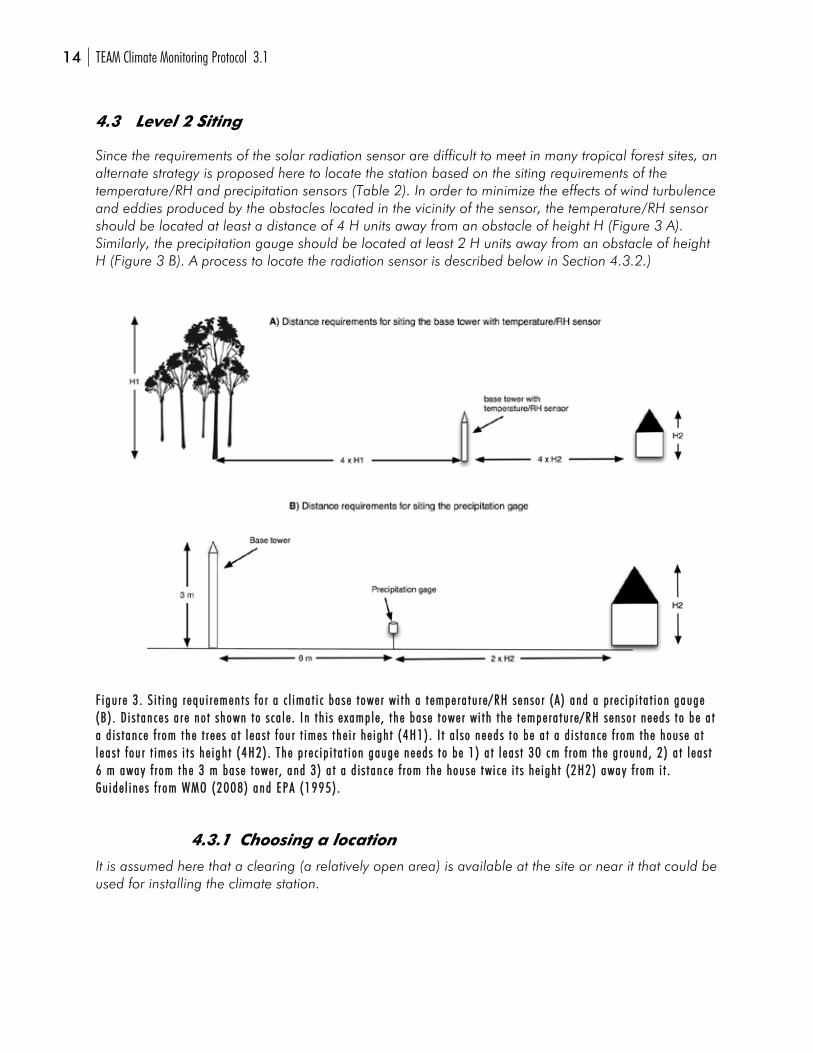
Since the requirements of the solar radiation sensor are difficult to meet in many tropical forest sites, an alternate strategy is proposed here to locate the station based on the siting requirements of the temperature/RH and precipitation sensors (Table 2). In order to minimize the effects of wind turbulence and eddies produced by the obstacles located in the vicinity of the sensor, the temperature/RH sensor should be located at least a distance of 4 H units away from an obstacle of height H (Figure 3 A). Similarly, the precipitation gauge should be located at least 2 H units away from an obstacle of height H (Figure 3 B). A process to locate the radiation sensor is described below in Section 4.3.2.)
FF ii gguu rr ee 33 .. SS ii tt ii nngg rr eeqquu ii rr eemmeenn tt ss ff oo rr aa cc ll iimmaa tt ii cc bbaa ssee tt oowwee rr ww ii tt hh aa tt eemmppee rraa tt uu rr ee //RRHH ss eenn ssoo rr ((AA )) aanndd aa pp rr ee cc ii pp ii tt aa tt ii oonn ggaauuggee ((BB )) .. DD ii ss tt aann ccee ss aa rr ee nnoo tt sshhoowwnn tt oo ss ccaa ll ee .. II nn tt hh ii ss ee xxaammpp ll ee ,, tt hhee bbaa ssee tt oowwee rr ww ii tt hh tt hhee tt eemmppee rr aa tt uu rr ee //RRHH ss eenn ssoo rr nneeeedd ss tt oo bbee aa tt aa dd ii ss tt aann ccee ff rr oomm tt hhee tt rr eeee ss aa tt ll eeaa ss tt ff oouu rr tt iimmeess tt hhee ii rr hhee ii gghh tt ((44HH11)) .. II tt aa ll ss oo nneeeedd ss tt oo bbee aa tt aa dd ii ss tt aann ccee ff rr oomm tt hhee hhoouussee aa tt ll eeaa ss tt ff oouu rr tt iimmeess ii tt ss hhee ii gghh tt ((44HH22)) .. TThhee pp rr ee cc ii pp ii tt aa tt ii oonn ggaauuggee nneeeedd ss tt oo bbee 11 )) aa tt ll eeaa ss tt 3300 ccmm ff rr oomm tt hhee gg rr oouunndd ,, 22 )) aa tt ll eeaa ss tt 66 mm aawwaayy ff rr oomm tt hhee 33 mm bbaassee tt oowwee rr ,, aanndd 33 )) aa tt aa dd ii ss tt aannccee ff rr oomm tt hhee hhoouussee ttww ii cc ee ii tt ss hhee ii gghh tt ((22HH22)) aawwaayy ff rr oomm ii tt .. GGuu ii ddee ll ii nnee ss ff rr oomm WWMMOO ((22000088)) aanndd EEPPAA ((11999955)) ..
4.3.1 Choosing a location
It is assumed here that a clearing (a relatively open area) is available at the site or near it that could be used for installing the climate station.
TEAM Climate Monitoring Protocol 3.1 15
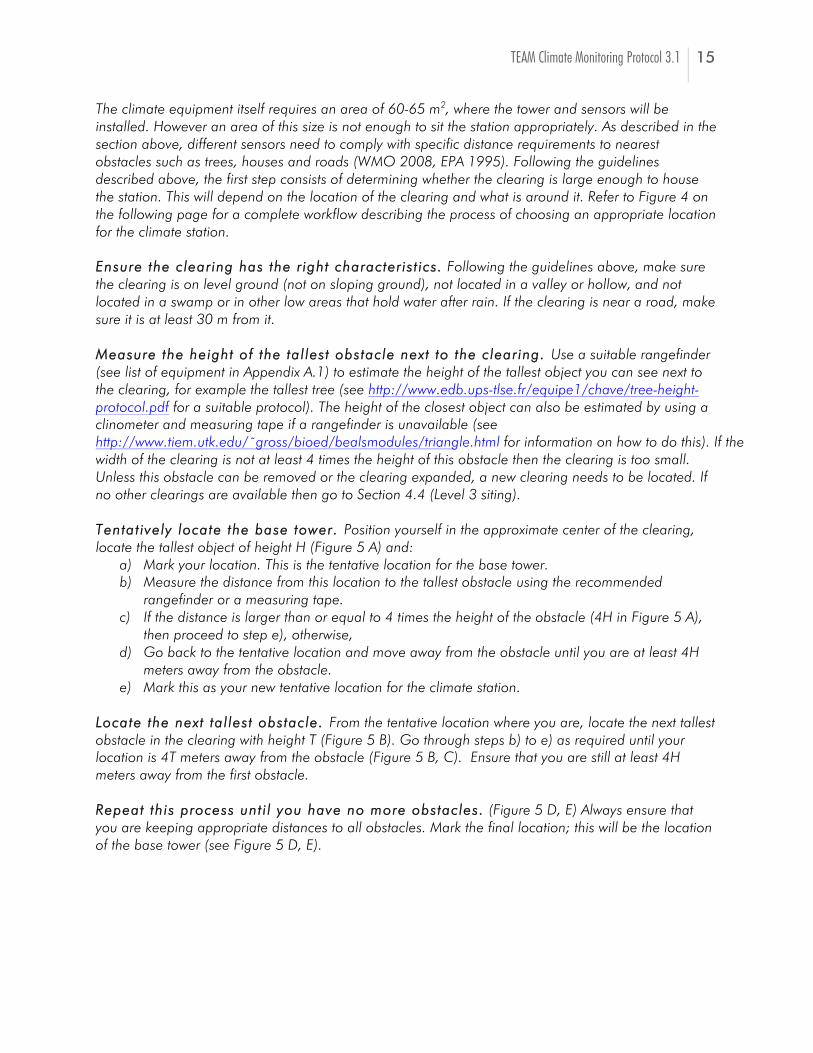
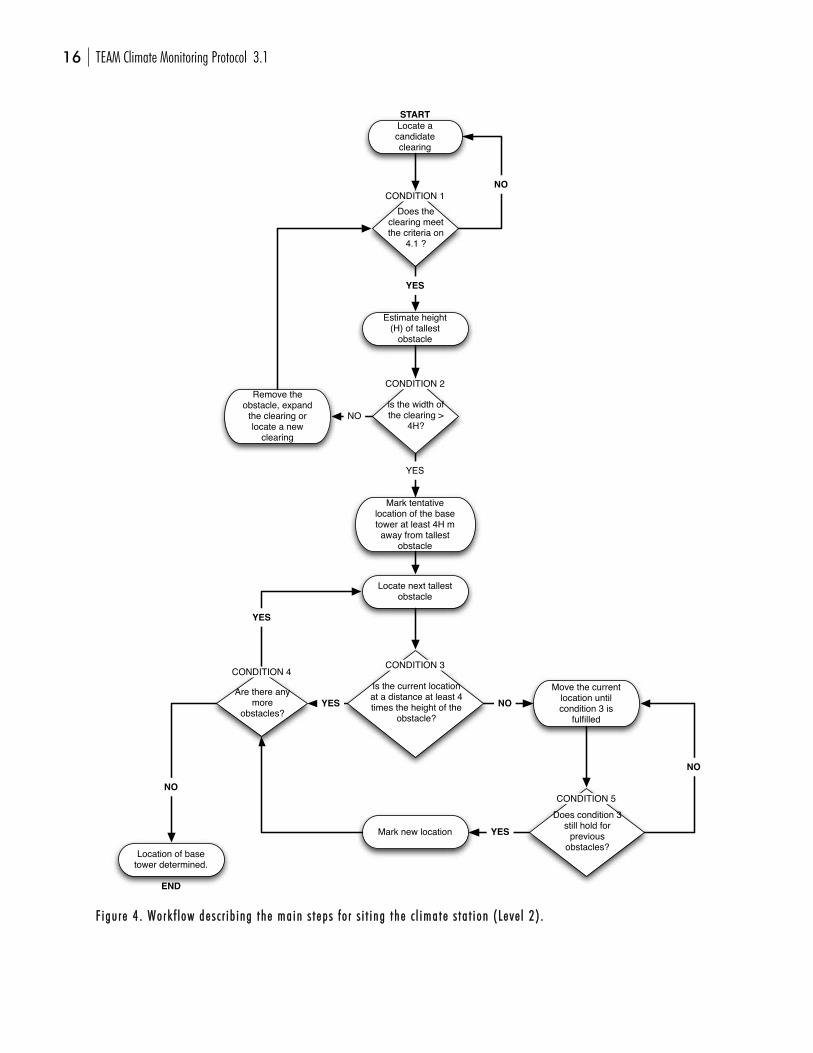
The climate equipment itself requires an area of 60-65 m2, where the tower and sensors will be installed. However an area of this size is not enough to sit the station appropriately. As described in the section above, different sensors need to comply with specific distance requirements to nearest obstacles such as trees, houses and roads (WMO 2008, EPA 1995). Following the guidelines described above, the first step consists of determining whether the clearing is large enough to house the station. This will depend on the location of the clearing and what is around it. Refer to Figure 4 on the following page for a complete workflow describing the process of choosing an appropriate location for the climate station. EEnnssuurree tthhee cclleeaarr iinngg hhaass tthhee rr iigghhtt cchhaarraacctteerr iiss tt iiccss.. Following the guidelines above, make sure the clearing is on level ground (not on sloping ground), not located in a valley or hollow, and not located in a swamp or in other low areas that hold water after rain. If the clearing is near a road, make sure it is at least 30 m from it. MMeeaassuurree tthhee hheeiigghhtt ooff tthhee ttaall lleesstt oobbssttaaccllee nneexxtt ttoo tthhee cclleeaarr iinngg.. Use a suitable rangefinder (see list of equipment in Appendix A.1) to estimate the height of the tallest object you can see next to the clearing, for example the tallest tree (see http://www.edb.ups-tlse.fr/equipe1/chave/tree-height-protocol.pdf for a suitable protocol). The height of the closest object can also be estimated by using a c and measuring tape if a rangefinder is unavailable (see http://www.tiem.utk.edu/ bioed/bealsmodules/triangle.html for information on how to do this). If the width of the clearing is not at least 4 times the height of this obstacle then the clearing is too small. Unless this obstacle can be removed or the clearing expanded, a new clearing needs to be located. If no other clearings are available then go to Section 4.4 (Level 3 siting). TTeennttaatt iivveellyy llooccaattee tthhee bbaassee ttoowweerr.. Position yourself in the approximate center of the clearing, locate the tallest object of height H (Figure 5 A) and:
a) Mark your location. This is the tentative location for the base tower. b) Measure the distance from this location to the tallest obstacle using the recommended
rangefinder or a measuring tape. c) If the distance is larger than or equal to 4 times the height of the obstacle (4H in Figure 5 A),
then proceed to step e), otherwise, d) Go back to the tentative location and move away from the obstacle until you are at least 4H
meters away from the obstacle. e) Mark this as your new tentative location for the climate station.
LLooccaattee tthhee nneexxtt ttaall lleesstt oobbssttaaccllee.. From the tentative location where you are, locate the next tallest obstacle in the clearing with height T (Figure 5 B). Go through steps b) to e) as required until your location is 4T meters away from the obstacle (Figure 5 B, C). Ensure that you are still at least 4H meters away from the first obstacle. RReeppeeaatt tthhiiss pprroocceessss uunntt ii ll yyoouu hhaavvee nnoo mmoorree oobbssttaacclleess.. (Figure 5 D, E) Always ensure that you are keeping appropriate distances to all obstacles. Mark the final location; this will be the location of the base tower (see Figure 5 D, E).
16 TEAM Climate Monitoring Protocol 3.1
FF ii gguu rr ee 44 .. WWoo rr kk ff ll ooww ddee ss cc rr ii bb ii nngg tt hhee mmaa ii nn ss tt eepp ss ff oo rr ss ii tt ii nngg tt hhee cc ll iimmaa tt ee ss tt aa tt ii oonn (( LL eevvee ll 22 )) ..
Estimate height (H) of tallest
obstacle
Does the clearing meet the criteria on
4.1 ?
Locate a candidate clearing
YES
NO
Remove the obstacle, expand
the clearing or locate a new
clearing
is the width of the clearing >
4H?NO
Mark tentative location of the base tower at least 4H m
away from tallest obstacle
Locate next tallest obstacle
YES
Is the current location at a distance at least 4 times the height of the
obstacle?
Are there any more
obstacles?YES
YES
Move the current location until condition 3 is
lled
Does condition 3 still hold for
previous obstacles?
NO
CONDITION 3
Mark new location YES
Location of base tower determined.
NO
NO
CONDITION 4
CONDITION 5
CONDITION 2
CONDITION 1
END
START
TEAM Climate Monitoring Protocol 3.1 17
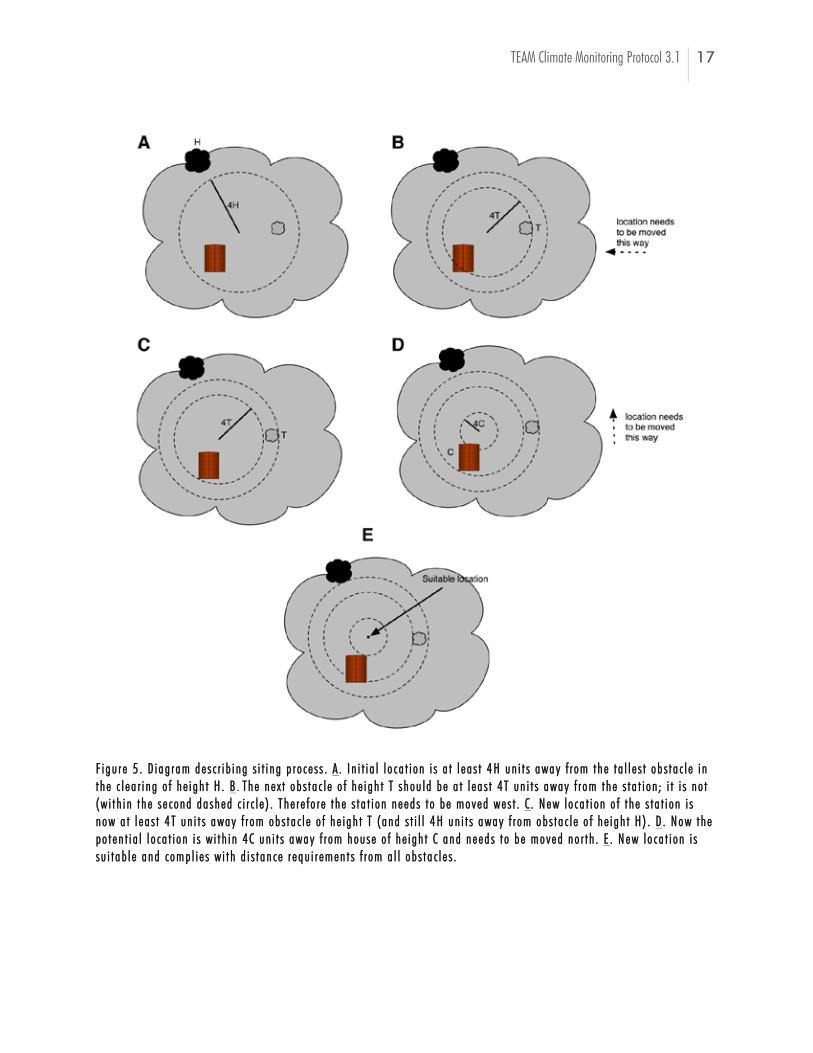
FF ii gguu rr ee 55 .. DD ii aagg rraamm ddee ss cc rr ii bb ii nngg ss ii tt ii nngg pp rr oo cc ee ss ss .. AA .. II nn ii tt ii aa ll ll oo ccaa tt ii oonn ii ss aa tt ll eeaa ss tt 44HH uunn ii tt ss aawwaayy ff rr oomm tt hhee tt aa ll ll ee ss tt oobb ss tt aa cc ll ee ii nn tt hhee cc ll eeaa rr ii nngg oo ff hhee ii gghh tt HH .. BB . TThhee nnee xx tt oobb ss tt aa cc ll ee oo ff hhee ii gghh tt TT sshhoouu ll dd bbee aa tt ll eeaa ss tt 44TT uunn ii tt ss aawwaayy ff rr oomm tt hhee ss tt aa tt ii oonn ;; ii tt ii ss nnoo tt ((ww ii tt hh ii nn tt hhee ss ee ccoonndd ddaa sshheedd cc ii rr cc ll ee )) .. TThhee rr ee ff oo rr ee tt hhee ss tt aa tt ii oonn nneeeedd ss tt oo bbee mmoovveedd wwee ss tt .. CC .. NNeeww ll oo ccaa tt ii oonn oo ff tt hhee ss tt aa tt ii oonn ii ss nnooww aa tt ll eeaa ss tt 44TT uunn ii tt ss aawwaayy ff rr oomm oobb ss tt aa cc ll ee oo ff hhee ii gghh tt TT (( aanndd ss tt ii ll ll 44HH uunn ii tt ss aawwaayy ff rr oomm oobb ss tt aa cc ll ee oo ff hhee ii gghh tt HH)) .. DD .. NNooww tt hhee ppoo tt eenn tt ii aa ll ll oo ccaa tt ii oonn ii ss ww ii tt hh ii nn 44CC uunn ii tt ss aawwaayy ff rr oomm hhoouussee oo ff hhee ii gghh tt CC aanndd nneeeedd ss tt oo bbee mmoovveedd nnoo rr tt hh .. EE .. NNeeww ll oo ccaa tt ii oonn ii ss ssuu ii tt aabb ll ee aanndd cc oommpp ll ii ee ss ww ii tt hh dd ii ss tt aann ccee rr eeqquu ii rr eemmeenn tt ss ff rr oomm aa ll ll oobb ss tt aa cc ll ee ss ..
18 TEAM Climate Monitoring Protocol 3.1
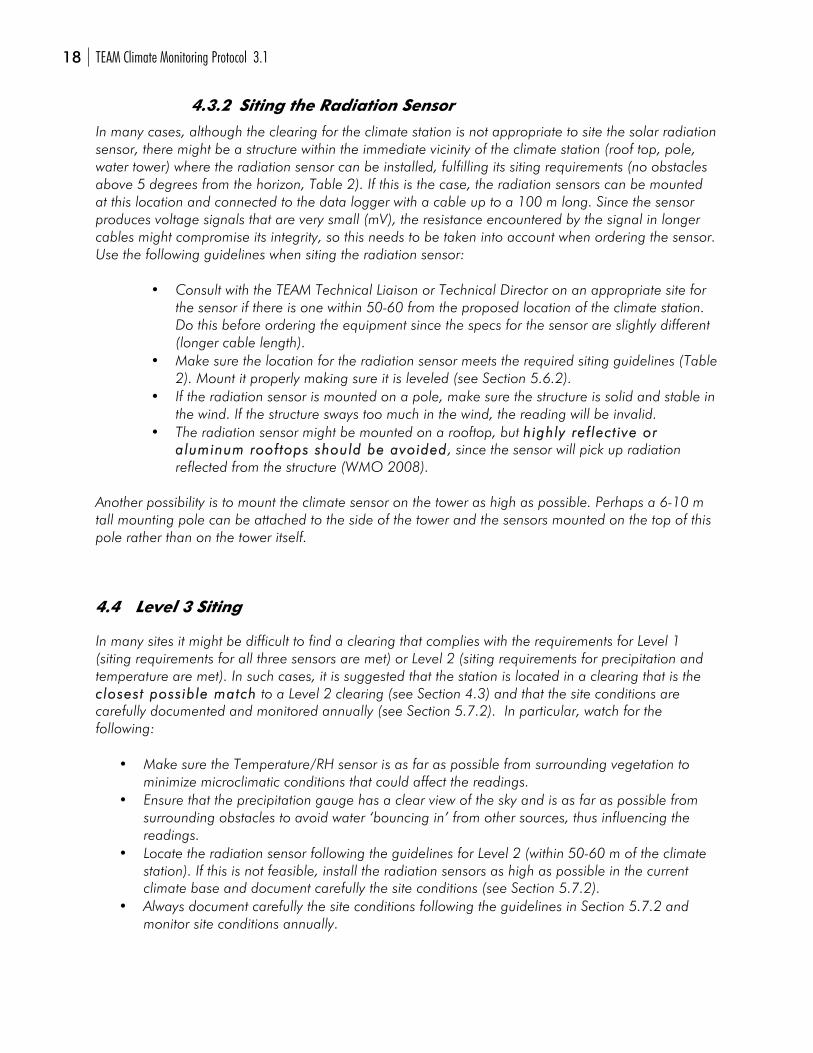
4.3.2 Siting the Radiation Sensor
In many cases, although the clearing for the climate station is not appropriate to site the solar radiation sensor, there might be a structure within the immediate vicinity of the climate station (roof top, pole, water tower) where the radiation sensor can be installed, fulfilling its siting requirements (no obstacles above 5 degrees from the horizon, Table 2). If this is the case, the radiation sensors can be mounted at this location and connected to the data logger with a cable up to a 100 m long. Since the sensor produces voltage signals that are very small (mV), the resistance encountered by the signal in longer cables might compromise its integrity, so this needs to be taken into account when ordering the sensor. Use the following guidelines when siting the radiation sensor:
Consult with the TEAM Technical Liaison or Technical Director on an appropriate site for the sensor if there is one within 50-60 from the proposed location of the climate station. Do this before ordering the equipment since the specs for the sensor are slightly different (longer cable length).
Make sure the location for the radiation sensor meets the required siting guidelines (Table 2). Mount it properly making sure it is leveled (see Section 5.6.2).
If the radiation sensor is mounted on a pole, make sure the structure is solid and stable in the wind. If the structure sways too much in the wind, the reading will be invalid.
The radiation sensor might be mounted on a rooftop, but hhiigghhllyy rreeff lleecctt iivvee oorr aalluummiinnuumm rrooooff ttooppss sshhoouulldd bbee aavvooiiddeedd, since the sensor will pick up radiation reflected from the structure (WMO 2008).
Another possibility is to mount the climate sensor on the tower as high as possible. Perhaps a 6-10 m tall mounting pole can be attached to the side of the tower and the sensors mounted on the top of this pole rather than on the tower itself.
4.4 Level 3 Siting
In many sites it might be difficult to find a clearing that complies with the requirements for Level 1 (siting requirements for all three sensors are met) or Level 2 (siting requirements for precipitation and temperature are met). In such cases, it is suggested that the station is located in a clearing that is the cclloosseesstt ppoossssiibbllee mmaattcchh to a Level 2 clearing (see Section 4.3) and that the site conditions are carefully documented and monitored annually (see Section 5.7.2). In particular, watch for the following:
Make sure the Temperature/RH sensor is as far as possible from surrounding vegetation to minimize microclimatic conditions that could affect the readings.
Ensure that the precipitation gauge has a clear view of the sky and is as far as possible from surrounding obstacles to avoid water ‘bouncing in’ from other sources, thus influencing the readings.
Locate the radiation sensor following the guidelines for Level 2 (within 50-60 m of the climate station). If this is not feasible, install the radiation sensors as high as possible in the current climate base and document carefully the site conditions (see Section 5.7.2).
Always document carefully the site conditions following the guidelines in Section 5.7.2 and monitor site conditions annually.
TEAM Climate Monitoring Protocol 3.1 19
4.5 Ordering the Equipment
Once an adequate siting strategy has been reached, the appropriate equipment can be ordered. A standardized list of equipment is shown in Appendix A.1. Once all the equipment has been received, all sensors and the datalogger should be registered by the Site Manager in the TEAM portal using the Site Management Tool (in the “myTEAM” area): http://www.teamnetwork.org/en/network_members. See SStteepp 22 of Appendix A.8 for detailed instructions about how to register equipment using the Site Management Tool.
5 AASSSSEEMMBBLLYY OOFF TTHHEE CCLLIIMMAATTEE SSTTAATTIIOONN
This section describes the whole process of setting up the climate station from the moment the equipment is received to a full test run of the climate station with all its sensors. The process is outlined in general with the main steps; for details refer to the instruction manuals accompanying the base tower, data logger and sensors.
5.1 Testing all the instrumentation upon receipt
EEqquuiippmmeenntt//ssuuppppll iieess nneeeeddeedd:: Data logger (CR1000) PC200W software (included with data logger) Blank memory card 12 V DC Battery (UB121000) Two Temperature/RH sensors (HMP45C) Two Solar Radiation sensors (LI200X) Precipitation sensor (TB4) Computer
As soon as the equipment is received, the data logger and sensors should be first tested. This testing can happen indoors and the data logger will need to be connected to a computer to examine the data. This section describes the process to ensure everything is working correctly. Figure 12 on page 30 shows a simplified wiring diagram of the climate station to illustrate the main components and connections between them.
5.1.1 Connect and setup the data logger
Figure 6 below shows the main components of the data logger. The left side of the panel contains all the sensor connections and the power OUT connectors (for some sensors), while the right side houses the power IN connector, the communications bus (RS-232) and an expansion slot for the memory card adaptor. You will need a 12 Volt DC battery (e.g. a car battery) to power the data logger (see Equipment List, Appendix A.1). Follow the steps below to setup the data logger. You should also watch a video of the process, called “Setting up and Programming the data logger,” on the TEAM portal in the Climate Protocol section (http://www.teamnetwork.org/en/protocols/climate) to better familiarize yourself with this procedure.

20 TEAM Climate Monitoring Protocol 3.1
FF ii gguu rr ee 66 .. MMaa ii nn cc oommppoonneenn tt ss oo ff tt hhee CCRR11000000 ddaa tt aa ll ooggggee rr ..
1. CCoonnnneecctt tthhee ddaattaa llooggggeerr ttoo tthhee ccoommppuutteerr:: Using the RS-232-to-USB cable, connect the
data logger to a USB port in the computer (make sure the cable is connected to the RS-232 port in the data logger – not the CS I/O port). If this is the first time using the RS-232-to-USB cable, drivers may need to be installed on the computer. Drivers are usually located either on the CD shipped with the cable or on the cable manufacturer’s website.
2. IInnssttaall ll tthhee mmeemmoorryy ccaarrdd aaddaappttoorr ttoo tthhee ddaattaa llooggggeerr:: The memory card module is a
flattened box labeled CCFFMM110000. Plug it into the peripheral port of the data logger and fasten the outside screw to secure it.
3. IInnsseerr tt aa mmeemmoorryy ccaarrdd iinnttoo tthhee CCFFMM110000:: Unfasten the screw on the right hand side of
the CFM100 to open the door to the memory card compartment. Insert the special memory card provided ((rreegguullaarr mmeemmoorryy ccaarrddss wwii ll ll NNOOTT wwoorrkk) in the slot. Close the door to the compartment and tighten the screw.
4. CCoonnnneecctt tthhee DDaattaa LLooggggeerr ttoo aa BBaatt tteerryy:: Any battery that is 12 V DC can be used for the
test (e.g. a car battery). Run two cables coming from the positive and negative poles of the battery and connect them to the POWER IN12V and G notches in the data logger. IIMMPPOORRTTAANNTT:: Connect the positive pole of the battery to the 12V notch in the data logger and the negative pole to the G notch. If there is power to the datalogger you will see flashing lights on the memory card adaptor.
5. IInnssttaall ll tthhee PPCC220000WW CCaammppbbeell ll SSooff ttwwaarree iinn yyoouurr ccoommppuutteerr:: This software is included
in a CD that came with the data logger and allows you to set the clock of the data logger and upload the standard TEAM data collection program. Alternatively, if the CD is lost, PC200W is also available on the Campbell Scientific website at: http://www.campbellsci.com/pc200w.
TEAM Climate Monitoring Protocol 3.1 21
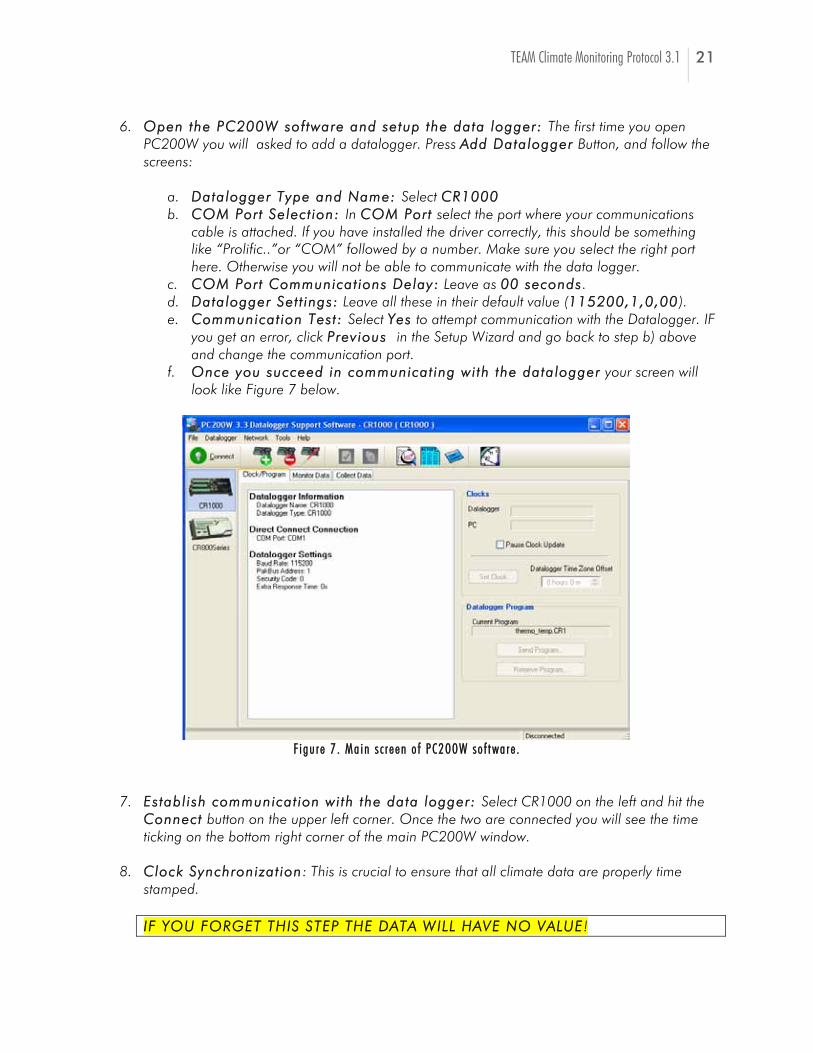
6. OOppeenn tthhee PPCC220000WW ssooff ttwwaarree aanndd sseettuupp tthhee ddaattaa llooggggeerr:: The first time you open
PC200W you will asked to add a datalogger. Press AAdddd DDaattaallooggggeerr Button, and follow the screens:
a. DDaattaallooggggeerr TTyyppee aanndd NNaammee:: Select CCRR11000000 b. CCOOMM PPoorrtt SSeelleecctt iioonn:: In CCOOMM PPoorrtt select the port where your communications
cable is attached. If you have installed the driver correctly, this should be something like “Prolific..”or “COM” followed by a number. Make sure you select the right port here. Otherwise you will not be able to communicate with the data logger.
c. CCOOMM PPoorrtt CCoommmmuunniiccaatt iioonnss DDeellaayy:: Leave as 0000 sseeccoonnddss. d. DDaattaallooggggeerr SSeett tt iinnggss:: Leave all these in their default value (111155220000,,11,,00,,0000). e. CCoommmmuunniiccaatt iioonn TTeesstt :: Select YYeess to attempt communication with the Datalogger. IF
you get an error, click PPrreevviioouuss in the Setup Wizard and go back to step b) above and change the communication port.
f. OOnnccee yyoouu ssuucccceeeedd iinn ccoommmmuunniiccaatt iinngg wwii tthh tthhee ddaattaallooggggeerr your screen will look like Figure 7 below.
FF ii gguu rr ee 77 .. MMaa ii nn ss cc rr eeeenn oo ff PPCC220000WW ssoo ff ttwwaa rr ee ..
7. EEssttaabbll iisshh ccoommmmuunniiccaatt iioonn wwii tthh tthhee ddaattaa llooggggeerr:: Select CR1000 on the left and hit the
CCoonnnneecctt button on the upper left corner. Once the two are connected you will see the time ticking on the bottom right corner of the main PC200W window.
8. CClloocckk SSyynncchhrroonniizzaatt iioonn: This is crucial to ensure that all climate data are properly time
stamped.
IIFF YYOOUU FFOORRGGEETT TTHHIISS SSTTEEPP TTHHEE DDAATTAA WWIILLLL HHAAVVEE NNOO VVAALLUUEE!
22 TEAM Climate Monitoring Protocol 3.1
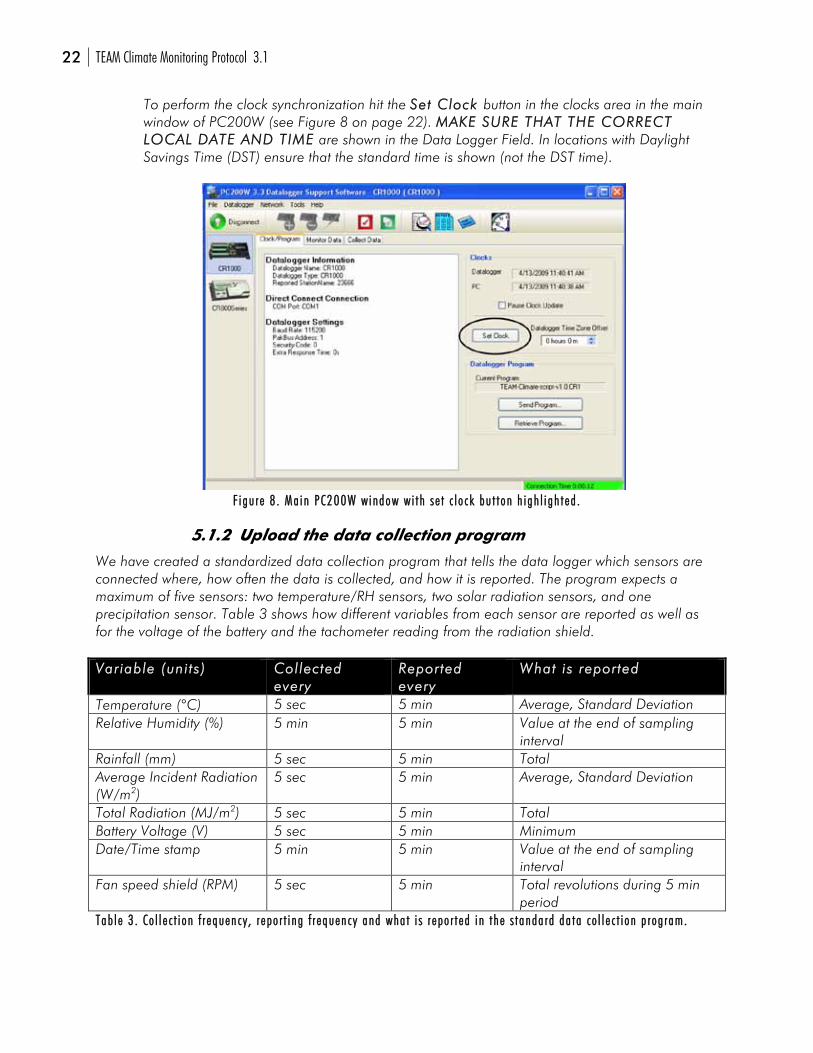
To perform the clock synchronization hit the SSeett CClloocckk button in the clocks area in the main window of PC200W (see Figure 8 on page 22). MMAAKKEE SSUURREE TTHHAATT TTHHEE CCOORRRREECCTT LLOOCCAALL DDAATTEE AANNDD TTIIMMEE are shown in the Data Logger Field. In locations with Daylight Savings Time (DST) ensure that the standard time is shown (not the DST time).
FF ii gguu rr ee 88 .. MMaa ii nn PPCC220000WW ww ii nnddooww ww ii tt hh ss ee tt cc ll oo cc kk bbuu tt tt oonn hh ii gghh ll ii gghh tt eedd ..
5.1.2 Upload the data collection program
We have created a standardized data collection program that tells the data logger which sensors are connected where, how often the data is collected, and how it is reported. The program expects a maximum of five sensors: two temperature/RH sensors, two solar radiation sensors, and one precipitation sensor. Table 3 shows how different variables from each sensor are reported as well as for the voltage of the battery and the tachometer reading from the radiation shield. VVaarr iiaabbllee ((uunnii ttss)) CCooll lleecctteedd
eevveerryy RReeppoorrtteedd eevveerryy
WWhhaatt iiss rreeppoorrtteedd
Temperature (°C) 5 sec 5 min Average, Standard Deviation Relative Humidity (%) 5 min 5 min Value at the end of sampling
interval Rainfall (mm) 5 sec 5 min Total Average Incident Radiation (W/m2)
5 sec 5 min Average, Standard Deviation
Total Radiation (MJ/m2) 5 sec 5 min Total Battery Voltage (V) 5 sec 5 min Minimum Date/Time stamp 5 min 5 min Value at the end of sampling
interval Fan speed shield (RPM) 5 sec 5 min Total revolutions during 5 min
period TTaabb ll ee 33 .. CCoo ll ll ee cc tt ii oonn ff rr eeqquueenncc yy ,, rr eeppoo rr tt ii nngg ff rr eeqquueenncc yy aanndd wwhhaa tt ii ss rr eeppoo rr tt eedd ii nn tt hhee ss tt aannddaa rrdd ddaa tt aa cc oo ll ll ee cc tt ii oonn pp rr oogg rraamm..
TEAM Climate Monitoring Protocol 3.1 23
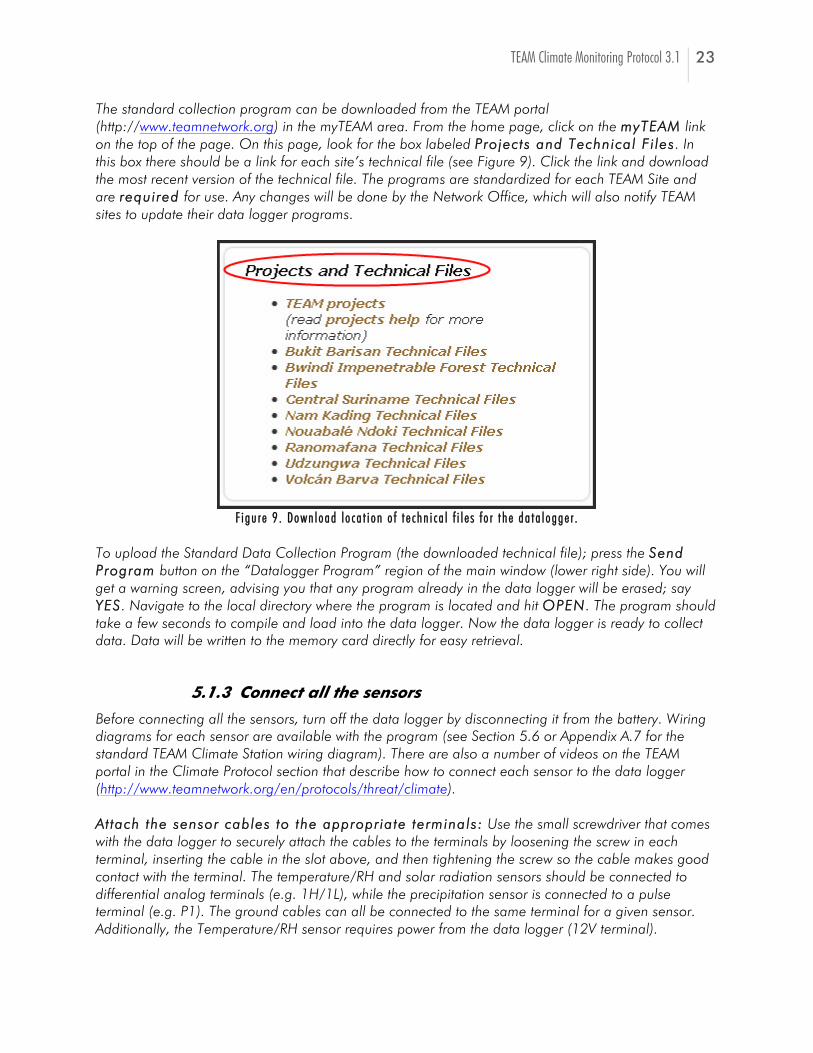
The standard collection program can be downloaded from the TEAM portal (http://www.teamnetwork.org) in the myTEAM area. From the home page, click on the mmyyTTEEAAMM link on the top of the page. On this page, look for the box labeled PPrroojjeeccttss aanndd TTeecchhnniiccaall FFii lleess. In this box there should be a link for each site’s technical file (see Figure 9). Click the link and download the most recent version of the technical file. The programs are standardized for each TEAM Site and are rreeqquuiirreedd for use. Any changes will be done by the Network Office, which will also notify TEAM sites to update their data logger programs.
FF ii gguu rr ee 99 .. DDoowwnn ll ooaadd ll oo ccaa tt ii oonn oo ff tt ee cchhnn ii ccaa ll ff ii ll ee ss ff oo rr tt hhee ddaa tt aa ll ooggggee rr ..
To upload the Standard Data Collection Program (the downloaded technical file); press the SSeenndd PPrrooggrraamm button on the “Datalogger Program” region of the main window (lower right side). You will get a warning screen, advising you that any program already in the data logger will be erased; say YYEESS. Navigate to the local directory where the program is located and hit OOPPEENN. The program should take a few seconds to compile and load into the data logger. Now the data logger is ready to collect data. Data will be written to the memory card directly for easy retrieval.
5.1.3 Connect all the sensors
Before connecting all the sensors, turn off the data logger by disconnecting it from the battery. Wiring diagrams for each sensor are available with the program (see Section 5.6 or Appendix A.7 for the standard TEAM Climate Station wiring diagram). There are also a number of videos on the TEAM portal in the Climate Protocol section that describe how to connect each sensor to the data logger (http://www.teamnetwork.org/en/protocols/threat/climate). AAtt ttaacchh tthhee sseennssoorr ccaabblleess ttoo tthhee aapppprroopprr iiaattee tteerrmmiinnaallss:: Use the small screwdriver that comes with the data logger to securely attach the cables to the terminals by loosening the screw in each terminal, inserting the cable in the slot above, and then tightening the screw so the cable makes good contact with the terminal. The temperature/RH and solar radiation sensors should be connected to differential analog terminals (e.g. 1H/1L), while the precipitation sensor is connected to a pulse terminal (e.g. P1). The ground cables can all be connected to the same terminal for a given sensor. Additionally, the Temperature/RH sensor requires power from the data logger (12V terminal).
24 TEAM Climate Monitoring Protocol 3.1
SSeennssoorr llooccaatt iioonn:: The sensors can remain indoors for the test, but if possible, locate the radiation sensor outside to get a natural reading. RRaaiinn GGaauuggee:: Take the cover off the tipping rain gauge (TB4) and make sure the tipping mechanism is loose (it is usually secured with a rubber band for shipping). You will be adding some water to the rain gauge so replace the cover and put the gauge inside another bucket or above a collection tray to avoid water spillage. CCooll lleecctt iioonn ooff tteesstt ddaattaa:: Once the sensors are all connected, turn the data logger back on and wait for about 1-2 hours for data collection. Slowly add 1/3 of a liter of water (about 10 mm) to the rain gauge over a 5-10 minute period.
5.1.4 Extract the data from the data logger
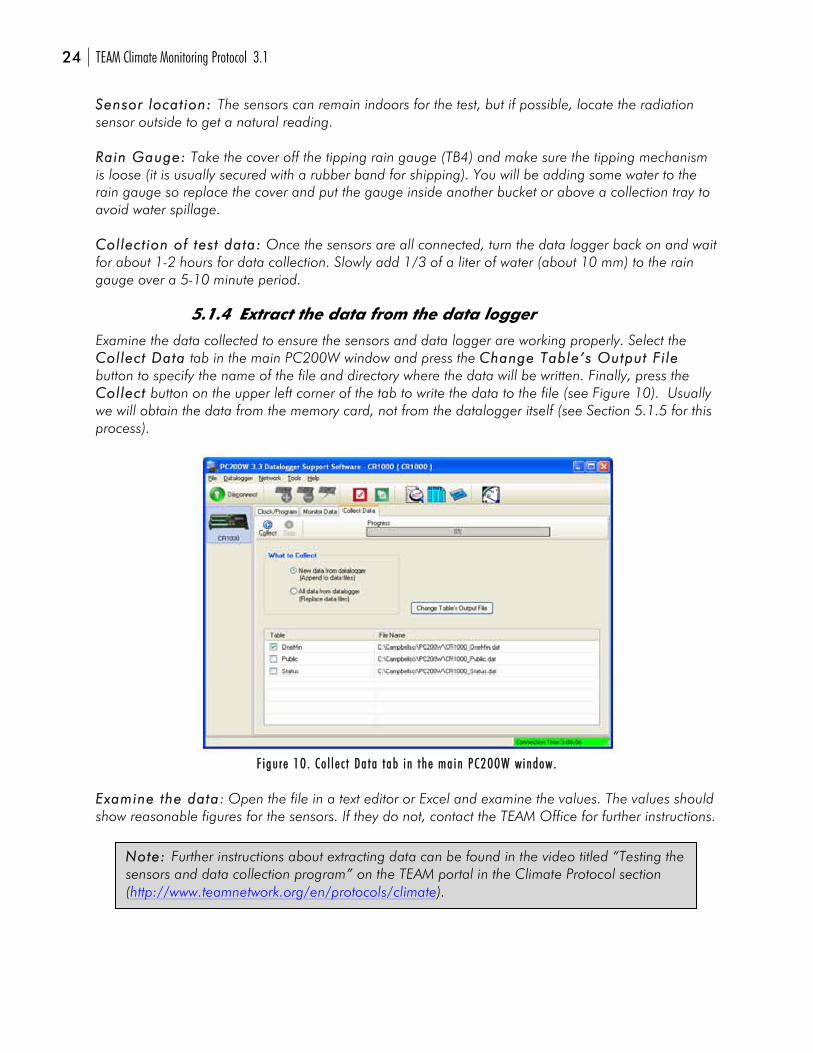
Examine the data collected to ensure the sensors and data logger are working properly. Select the CCooll lleecctt DDaattaa tab in the main PC200W window and press the CChhaannggee TTaabbllee’’ss OOuuttppuutt FFii llee button to specify the name of the file and directory where the data will be written. Finally, press the CCooll lleecctt button on the upper left corner of the tab to write the data to the file (see Figure 10). Usually we will obtain the data from the memory card, not from the datalogger itself (see Section 5.1.5 for this process).
FF ii gguu rr ee 1100 .. CCoo ll ll ee cc tt DDaa ttaa tt aabb ii nn tt hhee mmaa ii nn PPCC220000WW ww ii nnddooww ..
EExxaammiinnee tthhee ddaattaa: Open the file in a text editor or Excel and examine the values. The values should show reasonable figures for the sensors. If they do not, contact the TEAM Office for further instructions.
NNoottee:: Further instructions about extracting data can be found in the video titled “Testing the sensors and data collection program” on the TEAM portal in the Climate Protocol section (http://www.teamnetwork.org/en/protocols/climate).
TEAM Climate Monitoring Protocol 3.1 25
5.1.5 Extracting the Data from a Memory Card
The normal procedure for this protocol requires a person to retrieve a memory card from the data logger out in the field in order to extract data from it. Since this is the case, it is a good idea to perform a test run of the process below before deploying equipment in the field, so that you are prepared.
1. GGeett tt iinngg tthhee ddaattaa oouutt:: Before extracting the memory card, press the white button in front of the memory card adapter. As soon as it turns green, open the door of the adapter and push the button to eject the memory card. Do not be concerned about losing any data when removing the card; the data logger will keep collecting data, which will be stored in its internal memory. Put in a new, empty memory card as soon as possible.
2. OOppeenn tthhee PPCC220000 pprrooggrraamm:: You will need Campbell’s PC200W software to extract the
binary data from the memory card and convert it to a text file. Insert the card in a memory card reader and open the PC200W software.
3. CCrreeaattee llooccaall ss ttoorraaggee ddii rreeccttoorryy:: Establish a local directory to store Climate Measurement
Files in your computer.
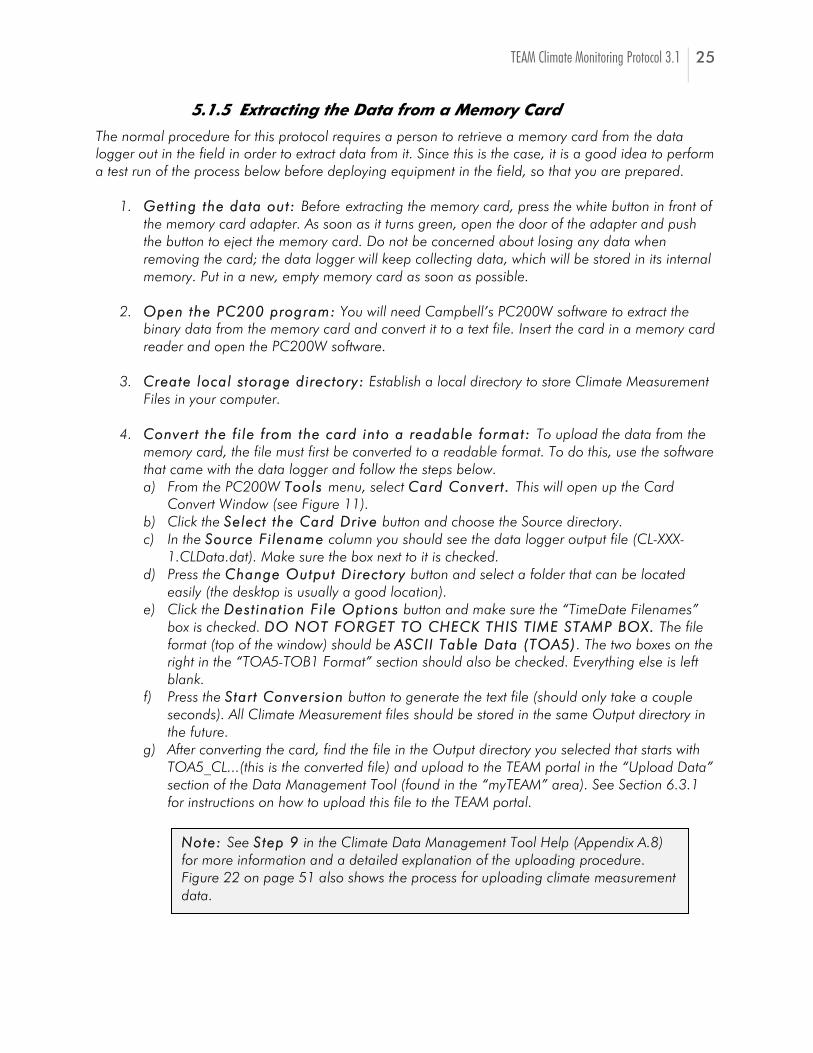
4. CCoonnvveerr tt tthhee ff ii llee ff rroomm tthhee ccaarrdd iinnttoo aa rreeaaddaabbllee ffoorrmmaatt:: To upload the data from the memory card, the file must first be converted to a readable format. To do this, use the software that came with the data logger and follow the steps below. a) From the PC200W TToooollss menu, select CCaarrdd CCoonnvveerr tt .. This will open up the Card
Convert Window (see Figure 11). b) Click the SSeelleecctt tthhee CCaarrdd DDrr iivvee button and choose the Source directory. c) In the SSoouurrccee FFii lleennaammee column you should see the data logger output file (CL-XXX-
1.CLData.dat). Make sure the box next to it is checked. d) Press the CChhaannggee OOuuttppuutt DDiirreeccttoorryy button and select a folder that can be located
easily (the desktop is usually a good location). e) Click the DDeesstt iinnaatt iioonn FFii llee OOpptt iioonnss button and make sure the “TimeDate Filenames”
box is checked. DDOO NNOOTT FFOORRGGEETT TTOO CCHHEECCKK TTHHIISS TTIIMMEE SSTTAAMMPP BBOOXX.. The file format (top of the window) should be AASSCCII II TTaabbllee DDaattaa ((TTOOAA55)). The two boxes on the right in the “TOA5-TOB1 Format” section should also be checked. Everything else is left blank.
f) Press the SSttaarr tt CCoonnvveerrss iioonn button to generate the text file (should only take a couple seconds). All Climate Measurement files should be stored in the same Output directory in the future.
g) After converting the card, find the file in the Output directory you selected that starts with TOA5_CL...(this is the converted file) and upload to the TEAM portal in the “Upload Data” section of the Data Management Tool (found in the “myTEAM” area). See Section 6.3.1 for instructions on how to upload this file to the TEAM portal.
NNoottee:: See SStteepp 99 in the Climate Data Management Tool Help (Appendix A.8) for more information and a detailed explanation of the uploading procedure. Figure 22 on page 51 also shows the process for uploading climate measurement data.
26 TEAM Climate Monitoring Protocol 3.1
FF ii gguu rr ee 1111 .. CCaa rr dd CCoonnvvee rr tt ww ii nnddooww uu sseedd ff oo rr cc oonnvvee rr tt ii nngg ddaa tt aa ll ooggggee rr mmeemmoo rr yy ccaa rr dd ii nn tt oo aa uu ssaabb ll ee ff ii ll ee ..
VViissuuaall iizz iinngg tthhee ddaattaa:: The data can be examined with any graphing program (including Excel) using comma-separated values. DDOO NNOOTT SSAAVVEE TTHHEE FFIILLEE after examining it in a graphing program because this may change the format of the file (should be .dat). The TEAM portal will only accept files in the .dat format. Make sure that the values coming from the different sensors are reasonable and within the bounds expected for the location of the climate station. Send the file to the TEAM Technical Director for evaluation only if the recorded values appear to be wrong. Otherwise, proceed by uploading the data to the Data Management Tool as indicated above. The process for uploading the converted data file (TOA5 CL…) is also described in SStteepp 66 of the Climate Data Management Tool Help (Appendix A.8). NNoottee:: More instructions about testing the station can be found by watching the video called “Testing the sensors and data collection program” on the TEAM portal in the Climate Protocol section (http://www.teamnetwork.org/en/protocols/threat/climate).
5.2 Climate Station Pre-installation Preparations
Once a suitable location for the climate station has been found, preparations need to be made to the terrain before the infrastructure and the sensors are installed. These guidelines apply to the main climate station. CClleeaarr tthhee tteerrrraaiinn:: Clear a small core area (60-65 m2) where the climate station with all its instrumentation will be installed. This area could be circular or rectangular, but most importantly, it needs to be devoid of all vegetation, with a very short layer of grass or whichever the natural substrate is in the area; no rock, asphalt or cement.
TEAM Climate Monitoring Protocol 3.1 27
5.3 Installing the base tower
EEqquuiippmmeenntt//ssuuppppll iieess nneeeeddeedd:: Shovel Wrench for tightening/loosening tower bolts Hammer Stakes Four 5x10x61 cm pieces of lumber Four wooden stakes Concrete Sand/rocks UT10 tower kit
This section describes briefly the installation and proper grounding of the base tower (UT10) that will house all the equipment for the climate station. More detailed instructions can be found in the manual for the base tower (http://www.campbellsci.com/documents/manuals/ut10.pdf).
5.3.1 Base Installation
The tower is based on top of a concrete foundation that must be installed at the site. It is very important to install the base of the tower correctly since all of the equipment will be attached to the tower. Because of this, any errors in the installation of the base can potentially cause errors in the collection of data. Although most of the equipment can be calibrated to account for small errors in the orientation of the tower, it is best to install the base according to the procedure below. More details can be found on page 2-1 of the UT10 manual.
1. DDiigg aa hhoollee.. A square hole of 61 cm on each side and 61 cm deep must be dug out.
2. CCrreeaattee aa ffoouunnddaatt iioonn ff rraammee.. Assemble four 5 x 10 x 61 cm pieces of lumber in a square and place the square on the ground above the hole so each side is resting on top of the hole’s edge. The middle of the square should be centered over the hole in the ground and any space between the wooden frame and ground should be filled so concrete does not leak out of the sides.
3. SSttaakkee ddoowwnn tthhee ffoouunnddaatt iioonn.. Put four stakes around the wooden foundation frame in order
to secure it. The wooden square and stakes will provide the base of the concrete foundation.
4. AAtt ttaacchh tthhee aanncchhoorr bbooll ttss.. Remove the wood strips attached to the tower base and attach the anchor bolts according to the instructions that came with the tower.
5. FFii ll ll tthhee hhoollee wwii tthh ccoonnccrreettee.. Mix the concrete together with rocks and sand. Fill the hole
with the resulting mixture until it reaches the top of the wooden frame.
6. IInnssttaall ll tthhee ttoowweerr bbaassee.. Let the concrete settle for about two hours and then drive the anchor bolts most of the way into the hole, leaving room so the base does not sit directly on top of the wet concrete. Adjust the orientation of the base so one of the corners of the base is pointing to the north. Using a level, ensure that the base is not tilted. Once the concrete hardens (wait for at least 24 hours), the base can be further leveled and tightened using the attached nuts.
28 TEAM Climate Monitoring Protocol 3.1
5.3.2 Tower Installation
After the tilt base is installed, the rest of the tower can be assembled and positioned. First install the mast on the top most section. Then slide the three tower legs into the sleeves of the base. Level the tower by adjusting the leveling bolts (see more details in page 2-2 of the UT10 manual).
5.3.3 Grounding
PPRROOPPEERR GGRROOUUNNDDIINNGG IISS CCRRIITTIICCAALL TTOO PPRROOTTEECCTT TTHHEE IINNTTEEGGRRIITTYY OOFF AALLLL TTHHEE EEQQUUIIPPMMEENNTT against lighting strikes. First drive the grounding rod into the ground as far as it will go next to the base of the tower (about half a meter away) using a sledgehammer. At most, tthheerree sshhoouulldd oonnllyy bbee 33 oorr 44 cceenntt iimmeetteerrss ooff tthhee rroodd vviiss iibbllee aabboovvee ggrroouunndd. Attach one end of the ground cable (4 AWG wire) to the rod and then route the cable and attach to the tower leg using the clamp. Route the green (12 AWG) wire upwards to where the instrument enclosure will be installed (see more details in page 2-3 of the UT10 manual). See Sections 5.7 for details on grounding the enclosure and the data logger.
5.4 Installing the Data Logger and Battery
EEqquuiippmmeenntt//ssuuppppll iieess nneeeeddeedd:: Wrench Screwdriver Data Logger (CR1000) Enclosure (ENC 14/16) Battery (UB121000) Plastic/metal container
DDaattaa llooggggeerr:: The data logger (CR1000) should be installed in a weather resistant enclosure that is attached to the side of the tower (ENC 14/16). First install the data logger into the enclosure and then attach the enclosure to the tower. The data logger should be mounted about 15 cm from the bottom of the enclosure and secured to the backplate with 4 screws. This should leave plenty of space below the data logger for the incoming cables from the sensors and power source as well as the ground cable. The enclosure can be mounted to the side of the tower by using the attached mounting brackets. Mount the enclosure at about eye level to facilitate access to it (see more detailed instructions in page 3-1 of the UT10 manual).
NNoottee:: Before installing the base, you will need to remove the top part of the tower by loosening the bolts on the base. DDoo nnoott tt rryy ttoo iinnssttaall ll tthhee bbaassee wwhhii llee tthhee ttoopp ppaarr tt ooff tthhee ttoowweerr ii ss ss tt ii ll ll aatt ttaacchheedd because it will be very difficult and the weight may cause the tower base to sink too far into the concrete.
TEAM Climate Monitoring Protocol 3.1 29
BBaatt tteerryy:: To protect the battery from the elements, it should be placed in a separate plastic/metal container with slits/holes to allow airflow (a plastic car battery enclosure can be purchased locally). Since most batteries leak small amounts of hydrogen gas when charged, creating a potential fire hazard, ii tt iiss vveerryy iimmppoorrttaanntt ttoo pprroovviiddee aapppprroopprr iiaattee vveenntt ii llaatt iioonn. The battery and its enclosure can be mounted on the side of the tower or sitting on the ground and appropriately secured (e.g. chained). TThhee bbaatt tteerryy sshhoouulldd NNOOTT bbee iinnssttaall lleedd iinnssiiddee tthhee ssaammee eenncclloossuurree aass tthhee ddaattaa llooggggeerr. There is a short section at the end of the video called “Installing the solar panel and the battery” on the TEAM portal in the Climate Protocol section that describes battery installation procedures (http://www.teamnetwork.org/en/protocols/climate). This video also has information about installing the solar panel.
5.5 Installing the Solar Panel
EEqquuiippmmeenntt//ssuuppppll iieess nneeeeddeedd:: Wrench Solar panel (YL-85) Solar panel mount Compass Clinometer
The solar panel should be installed in a way to maximize exposure to sunlight and ensure the station can run on solar power during the day. Please see the video mentioned above (“Installing the solar panel and the battery”) for more information about installing the solar panel. The following sections detail how to connect the solar panel to the charge regulator and angle the solar panel to receive the most light.
5.5.1 Connecting the Solar Panel to the Charge Regulator
EEqquuiippmmeenntt//ssuuppppll iieess nneeeeddeedd:: Screwdriver Charge regulator (SunSaver-10) Wires to connect battery/solar panel (normal wires used for house appliances) Wire cutter/stripper Plastic cable ties Electrical tape
In order to ssaaffeellyy connect the battery and solar panel to the charge regulator it is very important to follow the steps below in the order they are written. Instructions can also be found on page 5 of the charge regulator’s operating manual. Also, see Figure 12 on the next page for a detailed wiring diagram.
1. IInnssttaall ll tthhee cchhaarrggee rreegguullaattoorr.. Before mounting the solar panel to the tower, install the power regulator (Morningstar SunSaver 10) in the enclosure above the data logger. This ensures that the current coming from the solar panel is regulated and the current from the battery does not drain to the panel. WWHHEENN IINNSSTTAALLLLIINNGG TTHHEE RREEGGUULLAATTOORR MMAAKKEE SSUURREE TTHHEE PPAANNEELL IISS CCOOVVEERREEDD OORR FFAACCIINNGG DDOOWWNN TTOO AAVVOOIIDD EEXXPPEERRIIEENNCCIINNGG EELLEECCTTRRIICC SSHHOOCCKK..
30 TEAM Climate Monitoring Protocol 3.1
2. CCoonnnneecctt tthhee bbaatt tteerryy.. Connect the battery to the charge regulator in the middle section labeled “BATTERY” by running cables from the positive and negative terminals of the battery (be careful with the polarity: + with +, with ). The operating manual suggests connecting the nneeggaatt iivvee terminal ff ii rrss tt , followed by the positive one. Take care not to cross the wires to avoid electrical shock. Once positive and negative wires are attached to the battery they become live and full of electricity.
3. RRoouuttee ssoollaarr ppaanneell ccaabblleess ttoo tthhee eenncclloossuurree.. Route the cables coming from the solar
panel along the tower and secure them with plastic ties. Continue routing the cables up the tower and into the enclosure.
4. CCuutt tthhee wwiirreess.. In order to connect the solar panel to the charge regulator, the cables from
the panel must be cut, so the wires are exposed, leaving a small portion at the end of the wire bare.
5. CCoonnnneecctt tthhee ssoollaarr ppaanneell .. Attach the cables that were cut in the previous step to the left
hand side of the power regulator in the section labeled “SOLAR.” The nneeggaatt iivvee lead should be attached ff ii rrss tt and then the positive one (remember to check the polarity: + goes with +, with ).
6. CCoonnnneecctt tthhee ddaattaa llooggggeerr.. Attach two cables to the “LOAD” section of the charge regulator
and connect them to the data logger. As with the other two connections, start with the nneeggaatt iivvee terminal ff ii rrss tt (attach to the “G” slot on the data logger) and then connect the positive terminals (“+12V” on the data logger).
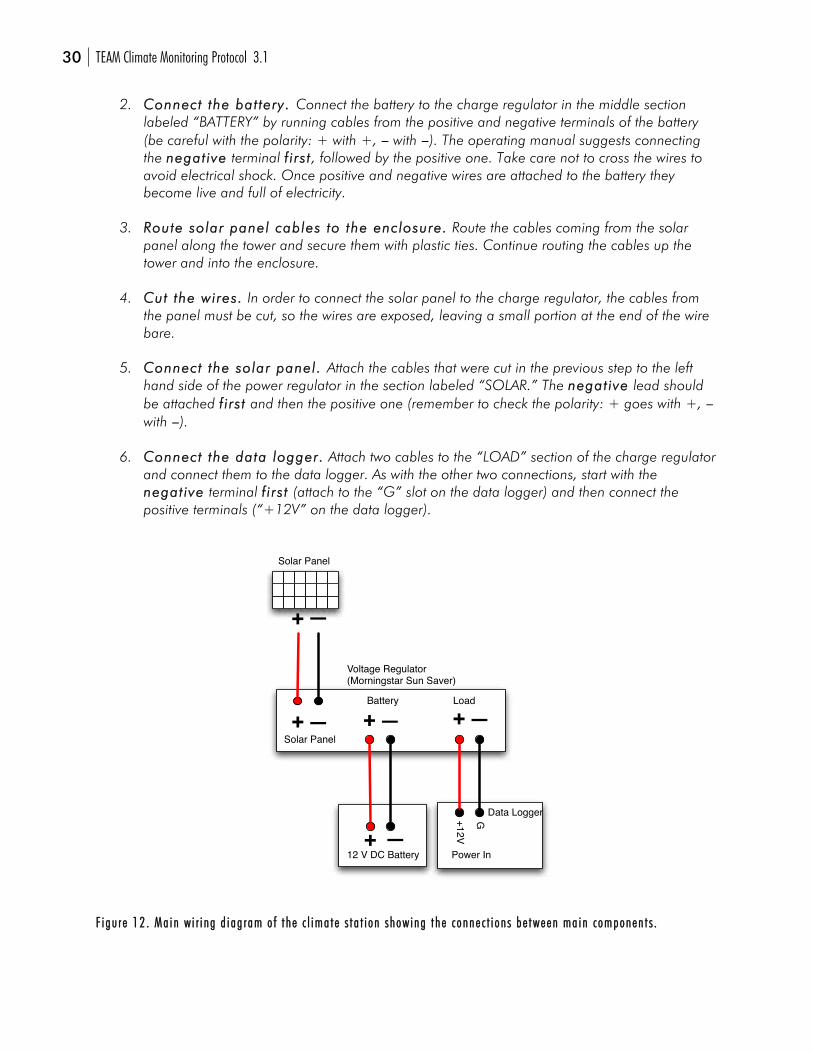
FF ii gguu rr ee 1122 .. MMaa ii nn ww ii rr ii nngg dd ii aagg rraamm oo ff tt hhee cc ll iimmaa tt ee ss tt aa tt ii oonn sshhooww iinngg tt hhee cc oonnnnee cc tt ii oonn ss bbee ttwweeeenn mmaa ii nn cc oommppoonneenn tt ss ..
+12V
G
Power In
Solar Panel
Data Logger
+—
Voltage Regulator(Morningstar Sun Saver)
+—Solar Panel
+— +—Battery Load
+ —12 V DC Battery
TEAM Climate Monitoring Protocol 3.1 31
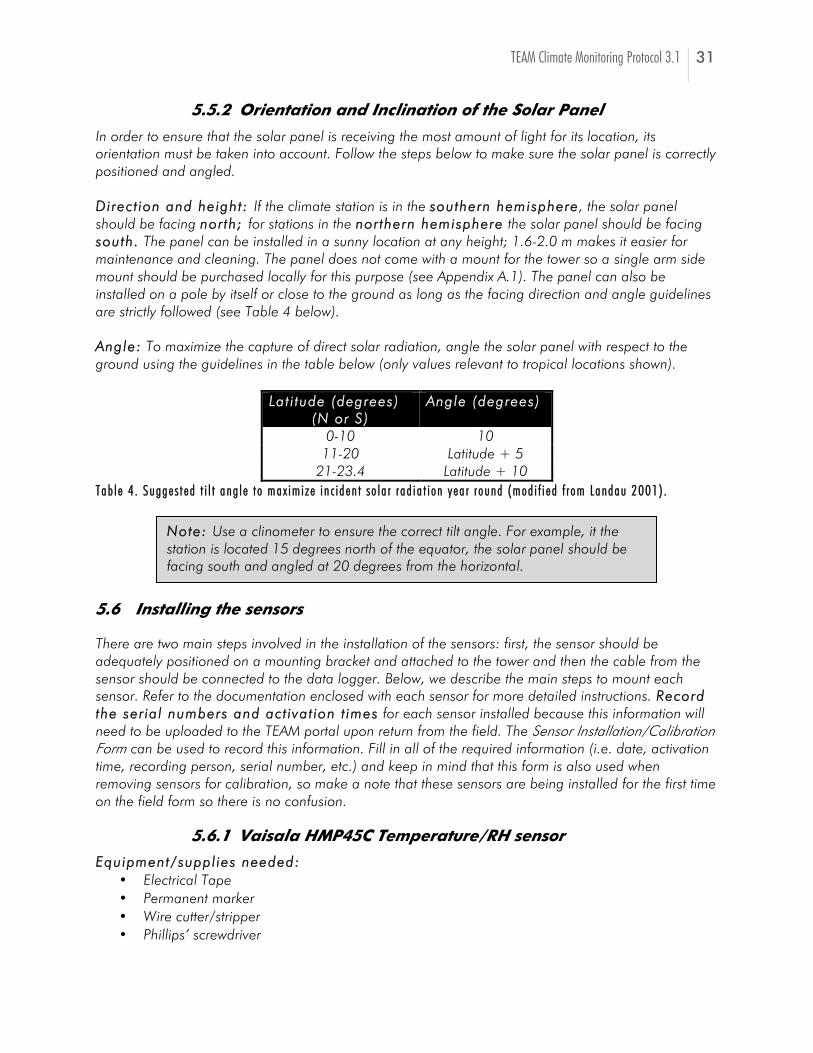
5.5.2 Orientation and Inclination of the Solar Panel
In order to ensure that the solar panel is receiving the most amount of light for its location, its orientation must be taken into account. Follow the steps below to make sure the solar panel is correctly positioned and angled. DDiirreecctt iioonn aanndd hheeiigghhtt:: If the climate station is in the ssoouutthheerrnn hheemmiisspphheerree, the solar panel should be facing nnoorrtthh;; for stations in the nnoorrtthheerrnn hheemmiisspphheerree the solar panel should be facing ssoouutthh.. The panel can be installed in a sunny location at any height; 1.6-2.0 m makes it easier for maintenance and cleaning. The panel does not come with a mount for the tower so a single arm side mount should be purchased locally for this purpose (see Appendix A.1). The panel can also be installed on a pole by itself or close to the ground as long as the facing direction and angle guidelines are strictly followed (see Table 4 below). AAnnggllee:: To maximize the capture of direct solar radiation, angle the solar panel with respect to the ground using the guidelines in the table below (only values relevant to tropical locations shown).
TTaabb ll ee 44 .. SSuuggggee ss tt eedd tt ii ll tt aanngg ll ee tt oo mmaaxx iimmii zz ee ii nn cc ii ddeenn tt ss oo ll aa rr rr aadd ii aa tt ii oonn yyeeaa rr rr oouunndd ((mmoodd ii ff ii eedd ff rr oomm LLaannddaauu 22000011)) ..
5.6 Installing the sensors
There are two main steps involved in the installation of the sensors: first, the sensor should be adequately positioned on a mounting bracket and attached to the tower and then the cable from the sensor should be connected to the data logger. Below, we describe the main steps to mount each sensor. Refer to the documentation enclosed with each sensor for more detailed instructions. RReeccoorrdd tthhee sseerr iiaall nnuummbbeerrss aanndd aacctt iivvaatt iioonn tt iimmeess for each sensor installed because this information will need to be uploaded to the TEAM portal upon return from the field. The Sensor Installation/Calibration Form can be used to record this information. Fill in all of the required information (i.e. date, activation time, recording person, serial number, etc.) and keep in mind that this form is also used when removing sensors for calibration, so make a note that these sensors are being installed for the first time on the field form so there is no confusion.
5.6.1 Vaisala HMP45C Temperature/RH sensor
EEqquuiippmmeenntt//ssuuppppll iieess nneeeeddeedd:: Electrical Tape Permanent marker Wire cutter/stripper Phillips’ screwdriver
LLaatt ii ttuuddee ((ddeeggrreeeess)) ((NN oorr SS))
AAnnggllee ((ddeeggrreeeess))
0-10 10 11-20 Latitude + 5
21-23.4 Latitude + 10
NNoottee:: Use a clinometer to ensure the correct tilt angle. For example, it the station is located 15 degrees north of the equator, the solar panel should be facing south and angled at 20 degrees from the horizontal.
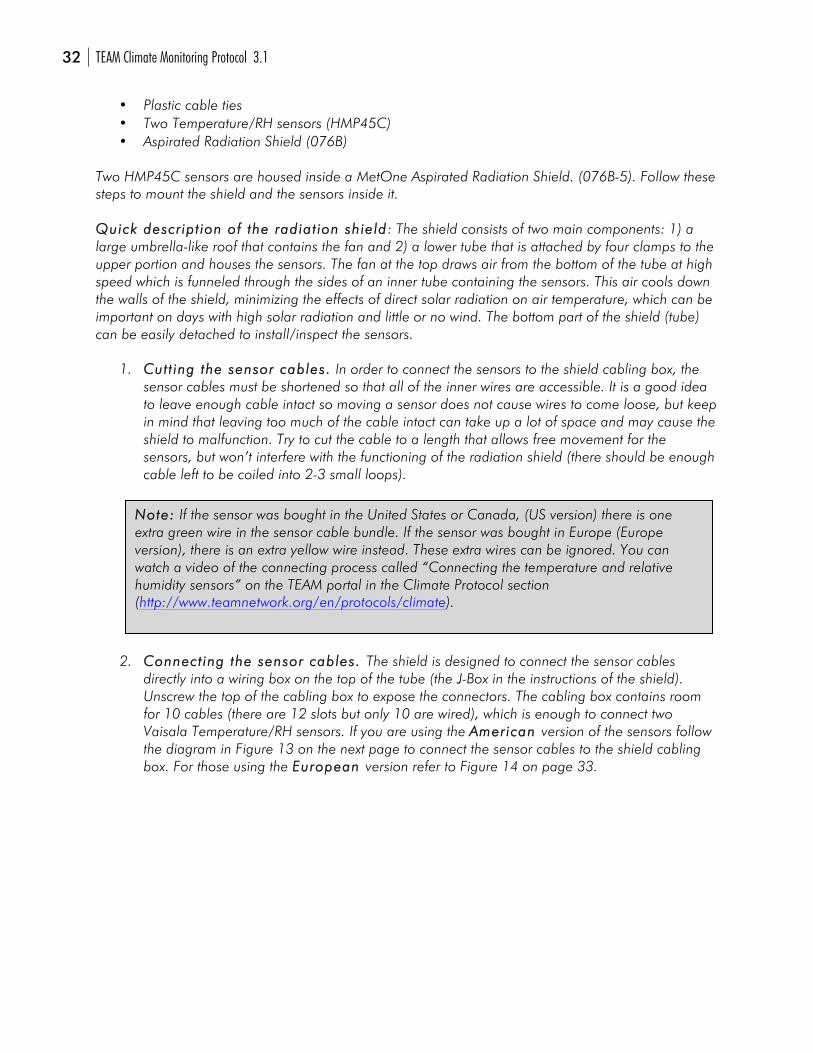
32 TEAM Climate Monitoring Protocol 3.1
Plastic cable ties Two Temperature/RH sensors (HMP45C) Aspirated Radiation Shield (076B)
Two HMP45C sensors are housed inside a MetOne Aspirated Radiation Shield. (076B-5). Follow these steps to mount the shield and the sensors inside it. QQuuiicckk ddeessccrr iipptt iioonn ooff tthhee rraaddiiaatt iioonn sshhiieelldd: The shield consists of two main components: 1) a large umbrella-like roof that contains the fan and 2) a lower tube that is attached by four clamps to the upper portion and houses the sensors. The fan at the top draws air from the bottom of the tube at high speed which is funneled through the sides of an inner tube containing the sensors. This air cools down the walls of the shield, minimizing the effects of direct solar radiation on air temperature, which can be important on days with high solar radiation and little or no wind. The bottom part of the shield (tube) can be easily detached to install/inspect the sensors.
1. CCuutt tt iinngg tthhee sseennssoorr ccaabblleess.. In order to connect the sensors to the shield cabling box, the sensor cables must be shortened so that all of the inner wires are accessible. It is a good idea to leave enough cable intact so moving a sensor does not cause wires to come loose, but keep in mind that leaving too much of the cable intact can take up a lot of space and may cause the shield to malfunction. Try to cut the cable to a length that allows free movement for the sensors, but won’t interfere with the functioning of the radiation shield (there should be enough cable left to be coiled into 2-3 small loops).
2. CCoonnnneecctt iinngg tthhee sseennssoorr ccaabblleess.. The shield is designed to connect the sensor cables directly into a wiring box on the top of the tube (the J-Box in the instructions of the shield). Unscrew the top of the cabling box to expose the connectors. The cabling box contains room for 10 cables (there are 12 slots but only 10 are wired), which is enough to connect two Vaisala Temperature/RH sensors. If you are using the AAmmeerr iiccaann version of the sensors follow the diagram in Figure 13 on the next page to connect the sensor cables to the shield cabling box. For those using the EEuurrooppeeaann version refer to Figure 14 on page 33.
NNoottee:: If the sensor was bought in the United States or Canada, (US version) there is one extra green wire in the sensor cable bundle. If the sensor was bought in Europe (Europe version), there is an extra yellow wire instead. These extra wires can be ignored. You can watch a video of the connecting process called “Connecting the temperature and relative humidity sensors” on the TEAM portal in the Climate Protocol section (http://www.teamnetwork.org/en/protocols/climate).
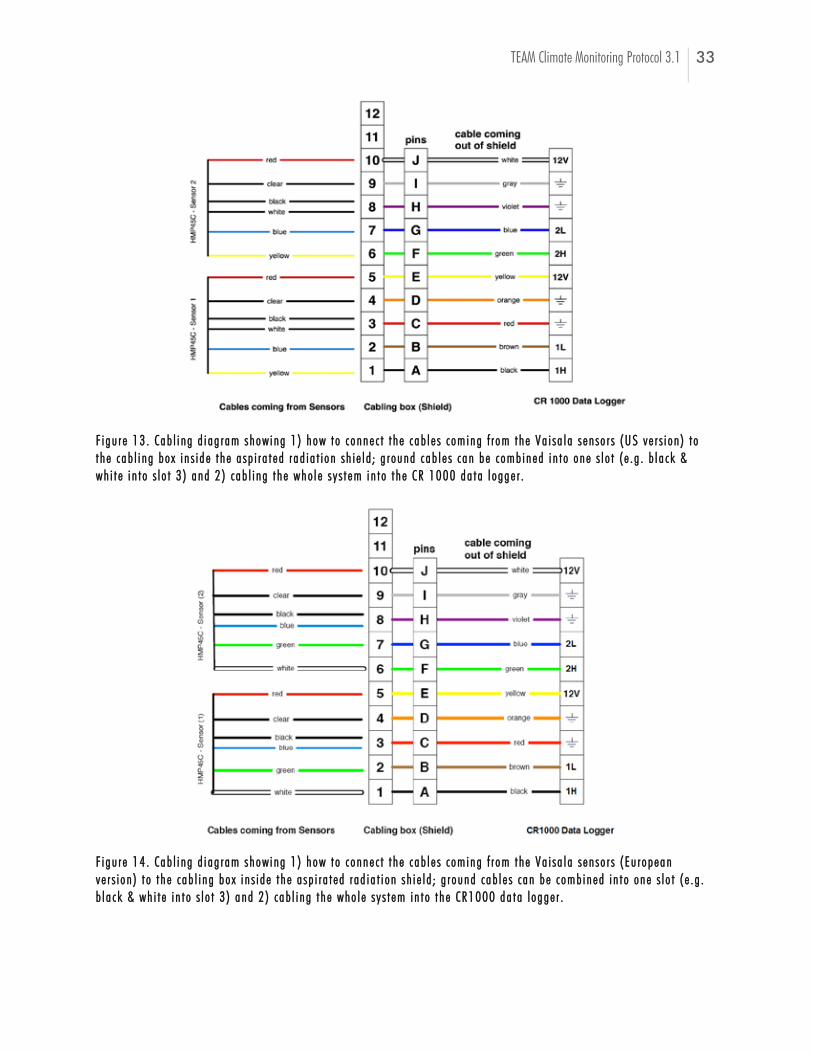
TEAM Climate Monitoring Protocol 3.1 33
FF ii gguu rr ee 1133 .. CCaabb ll ii nngg dd ii aagg rraamm sshhooww iinngg 11 )) hhooww tt oo cc oonnnnee cc tt tt hhee ccaabb ll ee ss cc oommiinngg ff rr oomm tt hhee VVaa ii ssaa ll aa ss eenn ssoo rr ss ((UUSS vvee rr ss ii oonn )) tt oo tt hhee ccaabb ll ii nngg bbooxx ii nn ss ii ddee tt hhee aa sspp ii rr aa tt eedd rr aadd ii aa tt ii oonn sshh ii ee ll dd ;; gg rr oouunndd ccaabb ll ee ss ccaann bbee cc oommbb ii nneedd ii nn tt oo oonnee ss ll oo tt (( ee .. gg .. bb ll aa cckk && wwhh ii tt ee ii nn tt oo ss ll oo tt 33 )) aanndd 22 )) cc aabb ll ii nngg tt hhee wwhhoo ll ee ss yy ss tt eemm ii nn tt oo tt hhee CCRR 11000000 ddaa tt aa ll ooggggee rr ..
FF ii gguu rr ee 1144 .. CCaabb ll ii nngg dd ii aagg rr aamm sshhooww iinngg 11 )) hhooww tt oo cc oonnnnee cc tt tt hhee ccaabb ll ee ss cc oommiinngg ff rr oomm tt hhee VVaa ii ssaa ll aa ss eenn ssoo rr ss (( EEuu rr ooppeeaann vvee rr ss ii oonn )) tt oo tt hhee ccaabb ll ii nngg bbooxx ii nn ss ii ddee tt hhee aa sspp ii rr aa tt eedd rr aadd ii aa tt ii oonn sshh ii ee ll dd ;; gg rr oouunndd ccaabb ll ee ss ccaann bbee cc oommbb ii nneedd ii nn tt oo oonnee ss ll oo tt (( ee .. gg .. bb ll aa cckk && wwhh ii tt ee ii nn tt oo ss ll oo tt 33 )) aanndd 22 )) ccaabb ll ii nngg tt hhee wwhhoo ll ee ss yy ss tt eemm ii nn tt oo tt hhee CCRR11000000 ddaa tt aa ll ooggggee rr ..
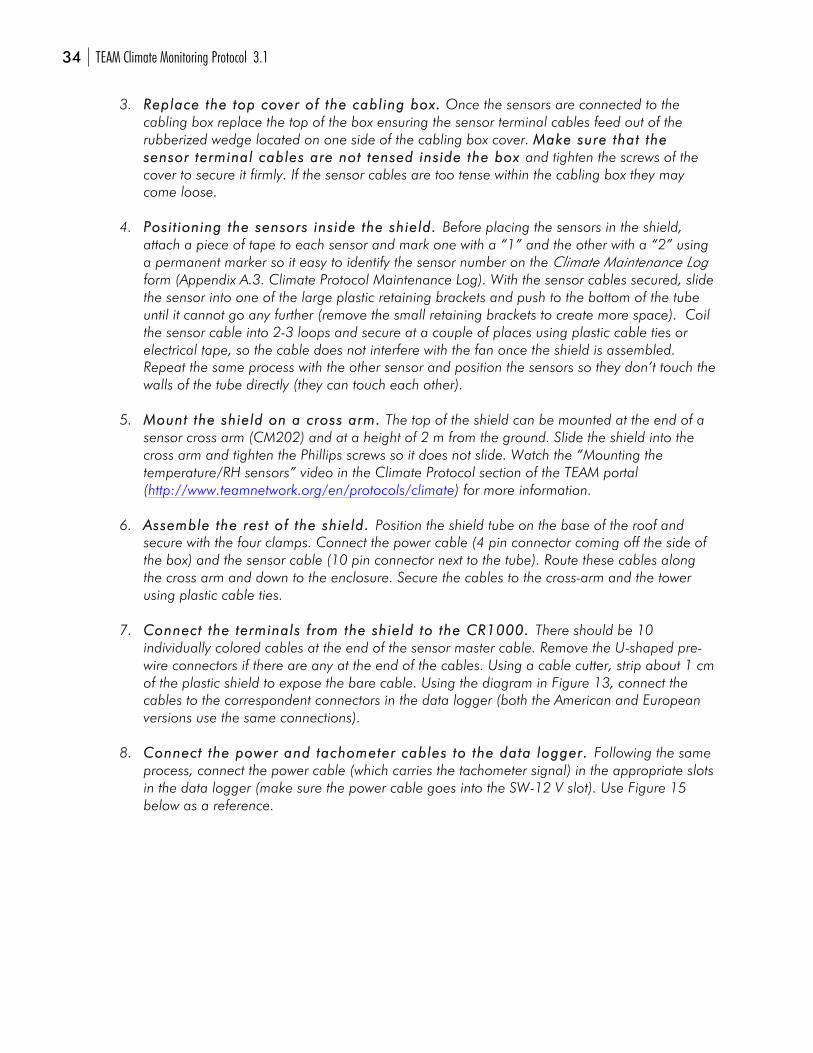
34 TEAM Climate Monitoring Protocol 3.1
3. RReeppllaaccee tthhee ttoopp ccoovveerr ooff tthhee ccaabbll iinngg bbooxx.. Once the sensors are connected to the cabling box replace the top of the box ensuring the sensor terminal cables feed out of the rubberized wedge located on one side of the cabling box cover. MMaakkee ssuurree tthhaatt tthhee sseennssoorr tteerrmmiinnaall ccaabblleess aarree nnoott tteennsseedd iinnssiiddee tthhee bbooxx and tighten the screws of the cover to secure it firmly. If the sensor cables are too tense within the cabling box they may come loose.
4. PPoossii tt iioonniinngg tthhee sseennssoorrss iinnssiiddee tthhee sshhiieelldd.. Before placing the sensors in the shield,
attach a piece of tape to each sensor and mark one with a “1” and the other with a “2” using a permanent marker so it easy to identify the sensor number on the Climate Maintenance Log form (Appendix A.3. Climate Protocol Maintenance Log). With the sensor cables secured, slide the sensor into one of the large plastic retaining brackets and push to the bottom of the tube until it cannot go any further (remove the small retaining brackets to create more space). Coil the sensor cable into 2-3 loops and secure at a couple of places using plastic cable ties or electrical tape, so the cable does not interfere with the fan once the shield is assembled. Repeat the same process with the other sensor and position the sensors so they don’t touch the walls of the tube directly (they can touch each other).
5. MMoouunntt tthhee sshhiieelldd oonn aa ccrroossss aarrmm.. The top of the shield can be mounted at the end of a
sensor cross arm (CM202) and at a height of 2 m from the ground. Slide the shield into the cross arm and tighten the Phillips screws so it does not slide. Watch the “Mounting the temperature/RH sensors” video in the Climate Protocol section of the TEAM portal (http://www.teamnetwork.org/en/protocols/climate) for more information.
6. AAsssseemmbbllee tthhee rreesstt ooff tthhee sshhiieelldd.. Position the shield tube on the base of the roof and
secure with the four clamps. Connect the power cable (4 pin connector coming off the side of the box) and the sensor cable (10 pin connector next to the tube). Route these cables along the cross arm and down to the enclosure. Secure the cables to the cross-arm and the tower using plastic cable ties.
7. CCoonnnneecctt tthhee tteerrmmiinnaallss ff rroomm tthhee sshhiieelldd ttoo tthhee CCRR11000000.. There should be 10
individually colored cables at the end of the sensor master cable. Remove the U-shaped pre-wire connectors if there are any at the end of the cables. Using a cable cutter, strip about 1 cm of the plastic shield to expose the bare cable. Using the diagram in Figure 13, connect the cables to the correspondent connectors in the data logger (both the American and European versions use the same connections).
8. CCoonnnneecctt tthhee ppoowweerr aanndd ttaacchhoommeetteerr ccaabblleess ttoo tthhee ddaattaa llooggggeerr.. Following the same
process, connect the power cable (which carries the tachometer signal) in the appropriate slots in the data logger (make sure the power cable goes into the SW-12 V slot). Use Figure 15 below as a reference.
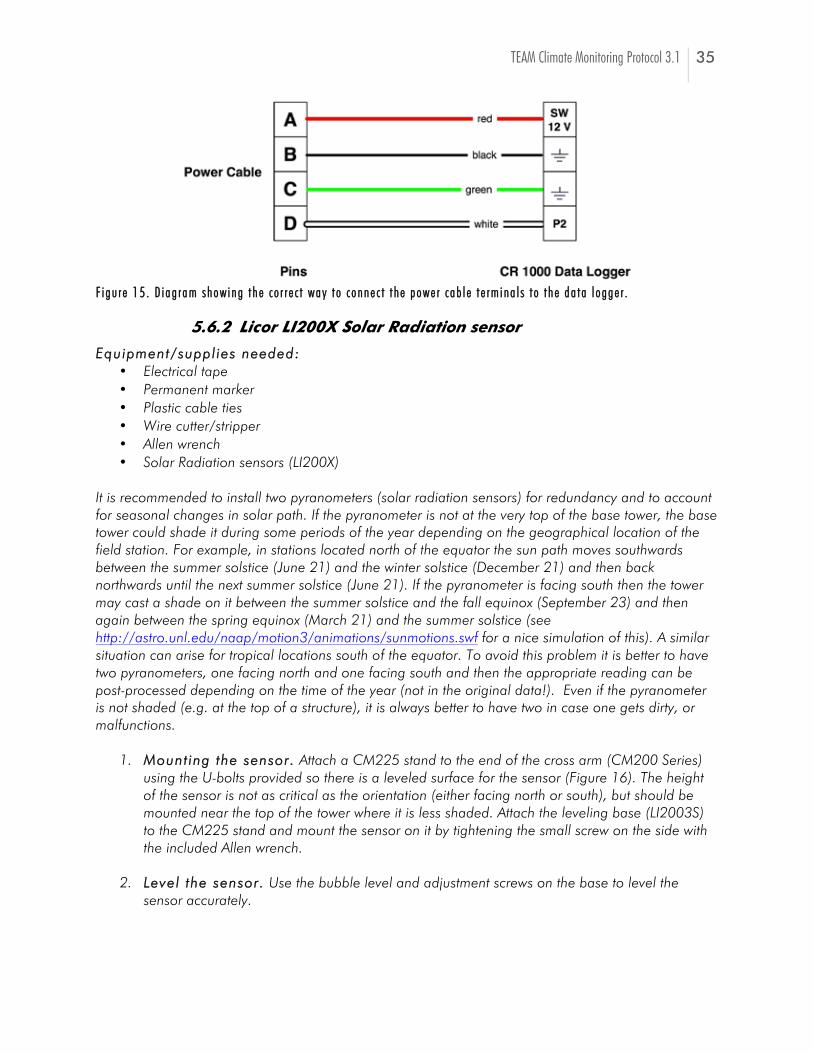
TEAM Climate Monitoring Protocol 3.1 35
FF ii gguu rr ee 1155 .. DD ii aagg rraamm sshhooww iinngg tt hhee cc oo rr rr ee cc tt wwaayy tt oo cc oonnnnee cc tt tt hhee ppoowwee rr cc aabb ll ee tt ee rrmmiinnaa ll ss tt oo tt hhee ddaa tt aa ll ooggggee rr ..
5.6.2 Licor LI200X Solar Radiation sensor
EEqquuiippmmeenntt//ssuuppppll iieess nneeeeddeedd:: Electrical tape Permanent marker Plastic cable ties Wire cutter/stripper Allen wrench Solar Radiation sensors (LI200X)
It is recommended to install two pyranometers (solar radiation sensors) for redundancy and to account for seasonal changes in solar path. If the pyranometer is not at the very top of the base tower, the base tower could shade it during some periods of the year depending on the geographical location of the field station. For example, in stations located north of the equator the sun path moves southwards between the summer solstice (June 21) and the winter solstice (December 21) and then back northwards until the next summer solstice (June 21). If the pyranometer is facing south then the tower may cast a shade on it between the summer solstice and the fall equinox (September 23) and then again between the spring equinox (March 21) and the summer solstice (see http://astro.unl.edu/naap/motion3/animations/sunmotions.swf for a nice simulation of this). A similar situation can arise for tropical locations south of the equator. To avoid this problem it is better to have two pyranometers, one facing north and one facing south and then the appropriate reading can be post-processed depending on the time of the year (not in the original data!). Even if the pyranometer is not shaded (e.g. at the top of a structure), it is always better to have two in case one gets dirty, or malfunctions.
1. MMoouunntt iinngg tthhee sseennssoorr.. Attach a CM225 stand to the end of the cross arm (CM200 Series) using the U-bolts provided so there is a leveled surface for the sensor (Figure 16). The height of the sensor is not as critical as the orientation (either facing north or south), but should be mounted near the top of the tower where it is less shaded. Attach the leveling base (LI2003S) to the CM225 stand and mount the sensor on it by tightening the small screw on the side with the included Allen wrench.
2. LLeevveell tthhee sseennssoorr.. Use the bubble level and adjustment screws on the base to level the
sensor accurately.
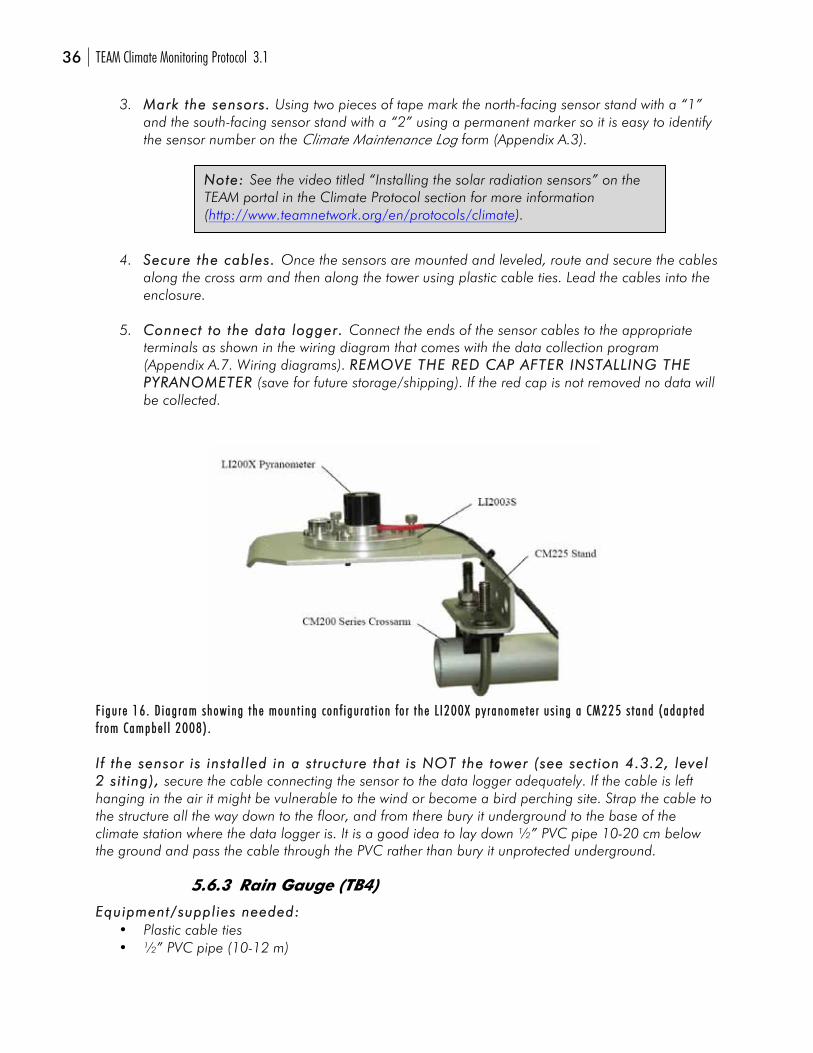
36 TEAM Climate Monitoring Protocol 3.1
3. MMaarrkk tthhee sseennssoorrss.. Using two pieces of tape mark the north-facing sensor stand with a “1” and the south-facing sensor stand with a “2” using a permanent marker so it is easy to identify the sensor number on the Climate Maintenance Log form (Appendix A.3).
4. SSeeccuurree tthhee ccaabblleess.. Once the sensors are mounted and leveled, route and secure the cables along the cross arm and then along the tower using plastic cable ties. Lead the cables into the enclosure.
5. CCoonnnneecctt ttoo tthhee ddaattaa llooggggeerr.. Connect the ends of the sensor cables to the appropriate
terminals as shown in the wiring diagram that comes with the data collection program (Appendix A.7. Wiring diagrams). RREEMMOOVVEE TTHHEE RREEDD CCAAPP AAFFTTEERR IINNSSTTAALLLLIINNGG TTHHEE PPYYRRAANNOOMMEETTEERR (save for future storage/shipping). If the red cap is not removed no data will be collected.
FF ii gguu rr ee 1166 .. DD ii aagg rraamm sshhooww iinngg tt hhee mmoouunn tt ii nngg cc oonn ff ii gguu rraa tt ii oonn ff oo rr tt hhee LL II220000XX ppyy rr aannoommee tt ee rr uu ss ii nngg aa CCMM222255 ss tt aanndd (( aaddaapp tt eedd ff rr oomm CCaammppbbee ll ll 22000088)) .. II ff tthhee sseennssoorr iiss iinnssttaall lleedd iinn aa sstt rruuccttuurree tthhaatt iiss NNOOTT tthhee ttoowweerr ((sseeee sseecctt iioonn 44..33..22,, lleevveell 22 ss ii tt iinngg)),, secure the cable connecting the sensor to the data logger adequately. If the cable is left hanging in the air it might be vulnerable to the wind or become a bird perching site. Strap the cable to the structure all the way down to the floor, and from there bury it underground to the base of the climate station where the data logger is. It is a good idea to lay down ” PVC pipe 10-20 cm below the ground and pass the cable through the PVC rather than bury it unprotected underground.
5.6.3 Rain Gauge (TB4)
EEqquuiippmmeenntt//ssuuppppll iieess nneeeeddeedd:: Plastic cable ties ” PVC pipe (10-12 m)
NNoottee:: See the video titled “Installing the solar radiation sensors” on the TEAM portal in the Climate Protocol section for more information (http://www.teamnetwork.org/en/protocols/climate).
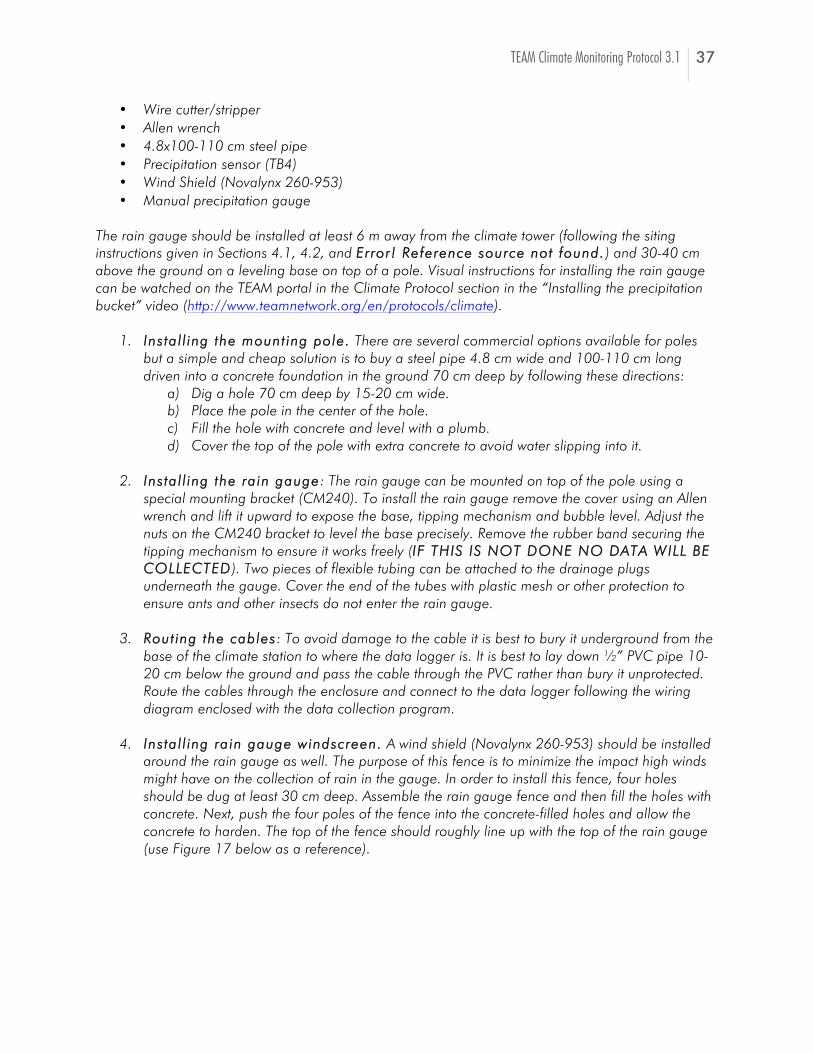
TEAM Climate Monitoring Protocol 3.1 37
Wire cutter/stripper Allen wrench 4.8x100-110 cm steel pipe Precipitation sensor (TB4) Wind Shield (Novalynx 260-953) Manual precipitation gauge
The rain gauge should be installed at least 6 m away from the climate tower (following the siting instructions given in Sections 4.1, 4.2, and EErrrroorr!! RReeffeerreennccee ssoouurrccee nnoott ffoouunndd..) and 30-40 cm above the ground on a leveling base on top of a pole. Visual instructions for installing the rain gauge can be watched on the TEAM portal in the Climate Protocol section in the “Installing the precipitation bucket” video (http://www.teamnetwork.org/en/protocols/climate).
1. IInnssttaall ll iinngg tthhee mmoouunntt iinngg ppoollee.. There are several commercial options available for poles but a simple and cheap solution is to buy a steel pipe 4.8 cm wide and 100-110 cm long driven into a concrete foundation in the ground 70 cm deep by following these directions:
a) Dig a hole 70 cm deep by 15-20 cm wide. b) Place the pole in the center of the hole. c) Fill the hole with concrete and level with a plumb. d) Cover the top of the pole with extra concrete to avoid water slipping into it.
2. IInnssttaall ll iinngg tthhee rraaiinn ggaauuggee: The rain gauge can be mounted on top of the pole using a
special mounting bracket (CM240). To install the rain gauge remove the cover using an Allen wrench and lift it upward to expose the base, tipping mechanism and bubble level. Adjust the nuts on the CM240 bracket to level the base precisely. Remove the rubber band securing the tipping mechanism to ensure it works freely (IIFF TTHHIISS IISS NNOOTT DDOONNEE NNOO DDAATTAA WWIILLLL BBEE CCOOLLLLEECCTTEEDD). Two pieces of flexible tubing can be attached to the drainage plugs underneath the gauge. Cover the end of the tubes with plastic mesh or other protection to ensure ants and other insects do not enter the rain gauge.
3. RRoouutt iinngg tthhee ccaabblleess: To avoid damage to the cable it is best to bury it underground from the
base of the climate station to where the data logger is. It is best to lay down ” PVC pipe 10-20 cm below the ground and pass the cable through the PVC rather than bury it unprotected. Route the cables through the enclosure and connect to the data logger following the wiring diagram enclosed with the data collection program.
4. IInnssttaall ll iinngg rraaiinn ggaauuggee wwiinnddssccrreeeenn.. A wind shield (Novalynx 260-953) should be installed
around the rain gauge as well. The purpose of this fence is to minimize the impact high winds might have on the collection of rain in the gauge. In order to install this fence, four holes should be dug at least 30 cm deep. Assemble the rain gauge fence and then fill the holes with concrete. Next, push the four poles of the fence into the concrete-filled holes and allow the concrete to harden. The top of the fence should roughly line up with the top of the rain gauge (use Figure 17 below as a reference).
38 TEAM Climate Monitoring Protocol 3.1
FF ii gguu rr ee 1177 .. IImmaaggee oo ff aa cc oommpp ll ee tt eedd pp rr ee cc ii pp ii tt aa tt ii oonn mmeeaassuu rr eemmeenn tt ss tt aa tt ii oonn (( ff rr oomm tt hhee NNoovvaa ll yynnxx wweebbss ii tt ee )) ..
5. MMaannuuaall rraaiinn ggaauuggee:: Install the extra manual rain gauge within the vicinity of the climate
station (at least 6 m away from it). This rain gauge can be used as a backup and to check for the accuracy of extreme rainfall events (> 50 mm/hour) (see Section 6.4 below).
5.7 Finishing steps
5.7.1 Secure the weather resistant enclosure
EEqquuiippmmeenntt//ssuuppppll iieess nneeeeddeedd Ground cable Plastic cable ties Enclosure putty sealant Humidity indicator Electrical tape Two large Zorbit packs Padlock Fencing
Once all the sensors and power sources are connected together, it is important to seal and secure the enclosure so the data logger, battery and connectors are in a stable environment and protected against the elements, insects and other threats that can compromise the integrity of the equipment.
1. GGrroouunndd tthhee ddaattaa llooggggeerr.. Connect the green cable (12 AWG) coming from the bottom of the enclosure to the ground lug terminal in the data logger (below the Power In terminals). See the “Grounding the data logger and climate station” video on the TEAM portal (http://www.teamnetwork.org/en/protocols/climate).
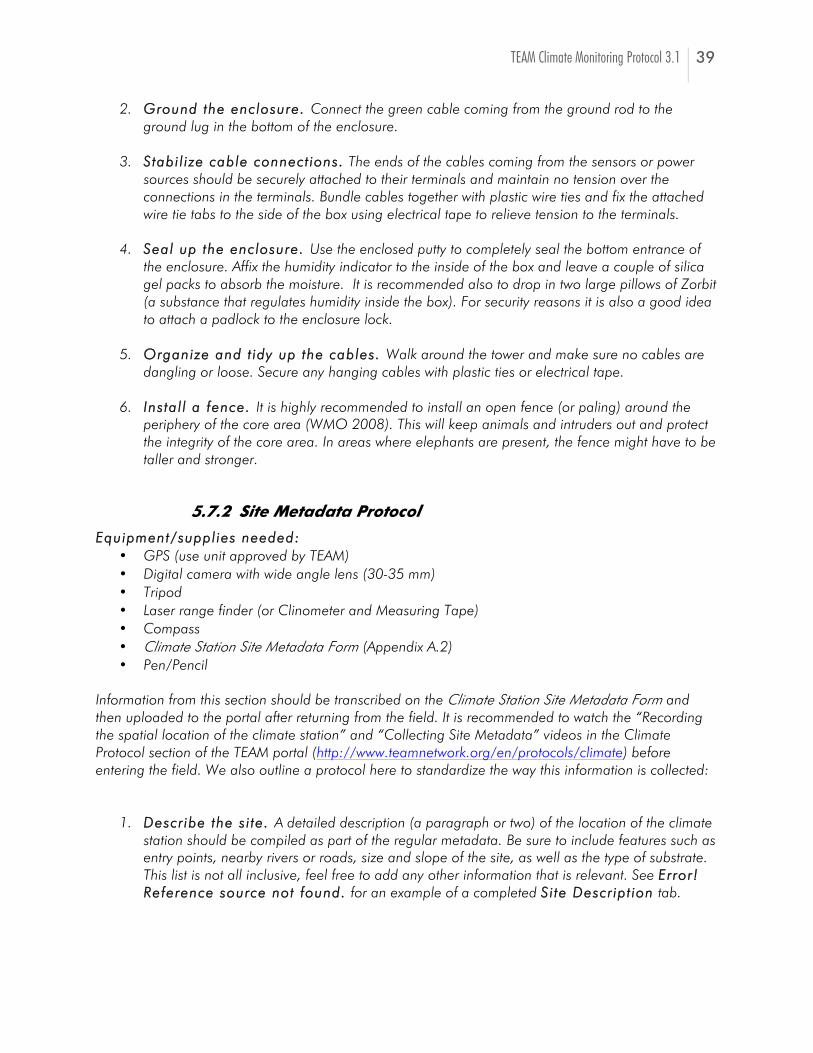
TEAM Climate Monitoring Protocol 3.1 39
2. GGrroouunndd tthhee eenncclloossuurree.. Connect the green cable coming from the ground rod to the ground lug in the bottom of the enclosure.
3. SSttaabbii ll iizzee ccaabbllee ccoonnnneecctt iioonnss.. The ends of the cables coming from the sensors or power
sources should be securely attached to their terminals and maintain no tension over the connections in the terminals. Bundle cables together with plastic wire ties and fix the attached wire tie tabs to the side of the box using electrical tape to relieve tension to the terminals.
4. SSeeaall uupp tthhee eenncclloossuurree.. Use the enclosed putty to completely seal the bottom entrance of
the enclosure. Affix the humidity indicator to the inside of the box and leave a couple of silica gel packs to absorb the moisture. It is recommended also to drop in two large pillows of Zorbit (a substance that regulates humidity inside the box). For security reasons it is also a good idea to attach a padlock to the enclosure lock.
5. OOrrggaanniizzee aanndd tt iiddyy uupp tthhee ccaabblleess.. Walk around the tower and make sure no cables are
dangling or loose. Secure any hanging cables with plastic ties or electrical tape.
6. IInnssttaall ll aa ffeennccee.. It is highly recommended to install an open fence (or paling) around the periphery of the core area (WMO 2008). This will keep animals and intruders out and protect the integrity of the core area. In areas where elephants are present, the fence might have to be taller and stronger.
5.7.2 Site Metadata Protocol
EEqquuiippmmeenntt//ssuuppppll iieess nneeeeddeedd:: GPS (use unit approved by TEAM) Digital camera with wide angle lens (30-35 mm) Tripod Laser range finder (or Clinometer and Measuring Tape) Compass Climate Station Site Metadata Form (Appendix A.2) Pen/Pencil
Information from this section should be transcribed on the Climate Station Site Metadata Form and then uploaded to the portal after returning from the field. It is recommended to watch the “Recording the spatial location of the climate station” and “Collecting Site Metadata” videos in the Climate Protocol section of the TEAM portal (http://www.teamnetwork.org/en/protocols/climate) before entering the field. We also outline a protocol here to standardize the way this information is collected:
1. DDeessccrr iibbee tthhee ss ii ttee.. A detailed description (a paragraph or two) of the location of the climate station should be compiled as part of the regular metadata. Be sure to include features such as entry points, nearby rivers or roads, size and slope of the site, as well as the type of substrate. This list is not all inclusive, feel free to add any other information that is relevant. See EErrrroorr!! RReeffeerreennccee ssoouurrccee nnoott ffoouunndd.. for an example of a completed SSii ttee DDeessccrr iipptt iioonn tab.
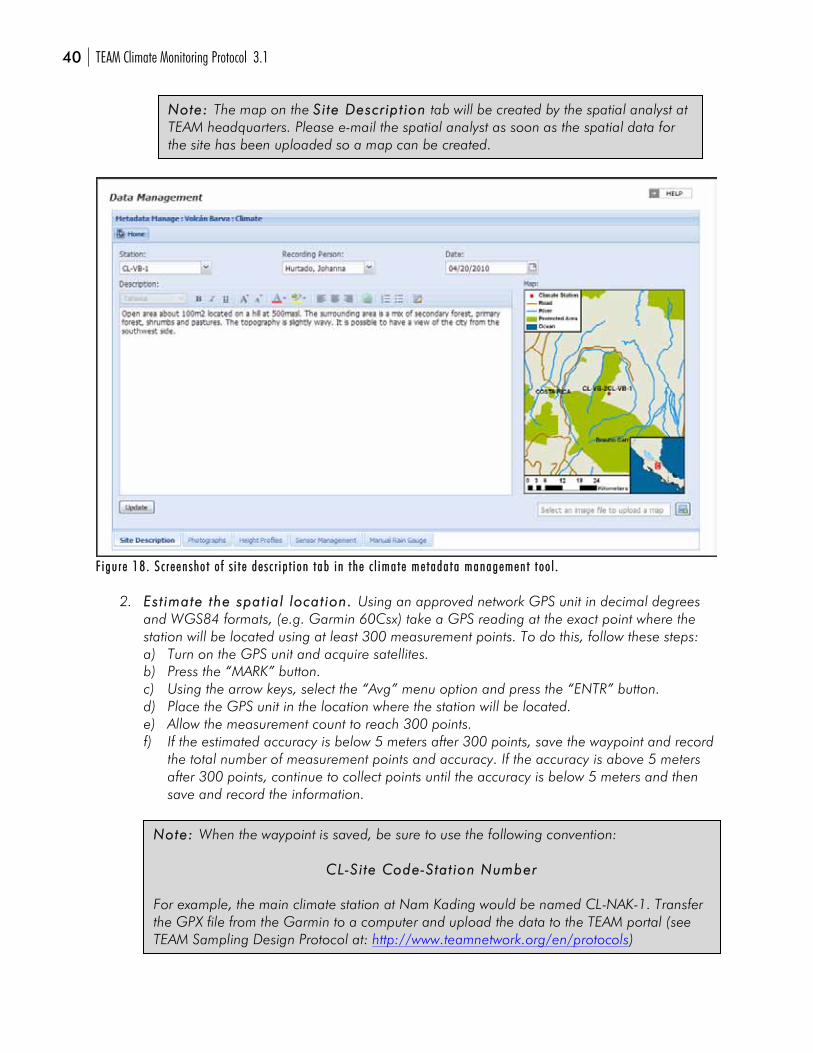
40 TEAM Climate Monitoring Protocol 3.1
FF ii gguu rr ee 1188 .. SS cc rr eeeenn sshhoo tt oo ff ss ii tt ee ddee ss cc rr ii pp tt ii oonn tt aabb ii nn tt hhee cc ll iimmaa tt ee mmee ttaaddaa ttaa mmaannaaggeemmeenn tt tt oooo ll ..
2. EEsstt iimmaattee tthhee ssppaatt iiaall llooccaatt iioonn.. Using an approved network GPS unit in decimal degrees
and WGS84 formats, (e.g. Garmin 60Csx) take a GPS reading at the exact point where the station will be located using at least 300 measurement points. To do this, follow these steps: a) Turn on the GPS unit and acquire satellites. b) Press the “MARK” button. c) Using the arrow keys, select the “Avg” menu option and press the “ENTR” button. d) Place the GPS unit in the location where the station will be located. e) Allow the measurement count to reach 300 points. f) If the estimated accuracy is below 5 meters after 300 points, save the waypoint and record
the total number of measurement points and accuracy. If the accuracy is above 5 meters after 300 points, continue to collect points until the accuracy is below 5 meters and then save and record the information.
NNoottee:: The map on the SSii ttee DDeessccrr iipp tt iioonn tab will be created by the spatial analyst at TEAM headquarters. Please e-mail the spatial analyst as soon as the spatial data for the site has been uploaded so a map can be created.
NNoottee:: When the waypoint is saved, be sure to use the following convention:
CCLL--SSii ttee CCooddee--SSttaatt iioonn NNuummbbeerr For example, the main climate station at Nam Kading would be named CL-NAK-1. Transfer the GPX file from the Garmin to a computer and upload the data to the TEAM portal (see TEAM Sampling Design Protocol at: http://www.teamnetwork.org/en/protocols)
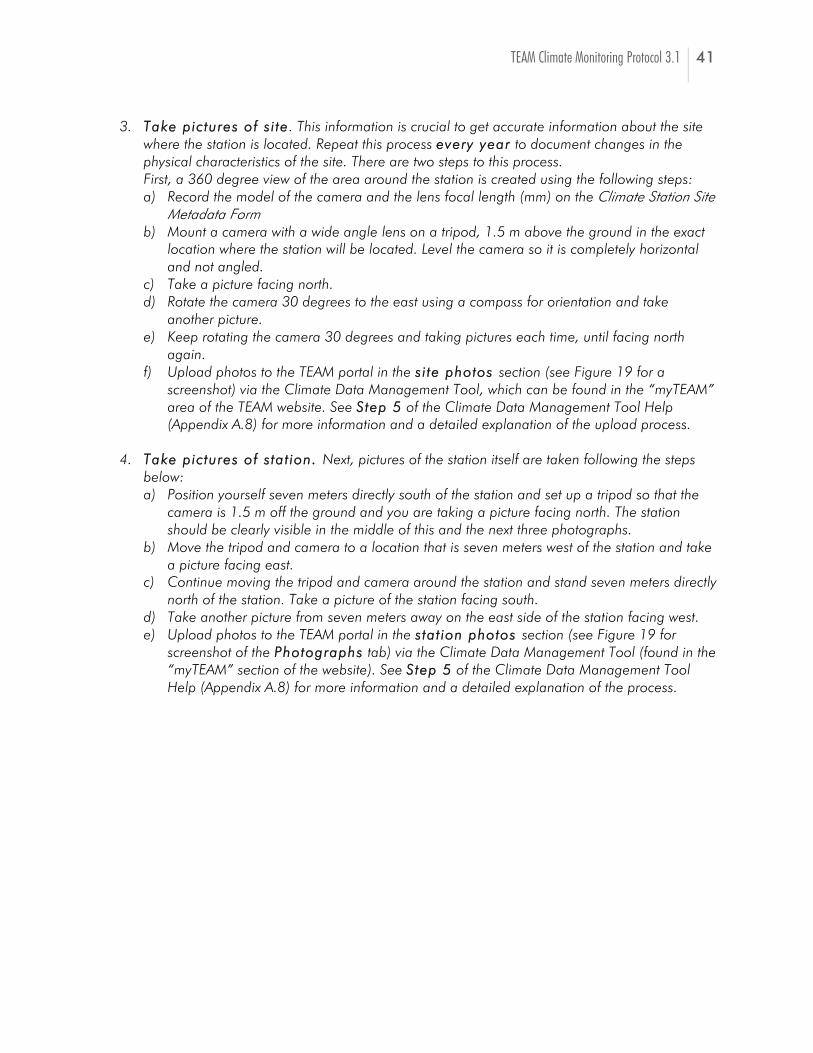
TEAM Climate Monitoring Protocol 3.1 41
3. TTaakkee ppiiccttuurreess ooff ss ii ttee. This information is crucial to get accurate information about the site
where the station is located. Repeat this process eevveerryy yyeeaarr to document changes in the physical characteristics of the site. There are two steps to this process. First, a 360 degree view of the area around the station is created using the following steps: a) Record the model of the camera and the lens focal length (mm) on the Climate Station Site
Metadata Form b) Mount a camera with a wide angle lens on a tripod, 1.5 m above the ground in the exact
location where the station will be located. Level the camera so it is completely horizontal and not angled.
c) Take a picture facing north. d) Rotate the camera 30 degrees to the east using a compass for orientation and take
another picture. e) Keep rotating the camera 30 degrees and taking pictures each time, until facing north
again. f) Upload photos to the TEAM portal in the ss ii ttee pphhoottooss section (see Figure 19 for a
screenshot) via the Climate Data Management Tool, which can be found in the “myTEAM” area of the TEAM website. See SStteepp 55 of the Climate Data Management Tool Help (Appendix A.8) for more information and a detailed explanation of the upload process.
4. TTaakkee ppiiccttuurreess ooff ss ttaatt iioonn.. Next, pictures of the station itself are taken following the steps
below: a) Position yourself seven meters directly south of the station and set up a tripod so that the
camera is 1.5 m off the ground and you are taking a picture facing north. The station should be clearly visible in the middle of this and the next three photographs.
b) Move the tripod and camera to a location that is seven meters west of the station and take a picture facing east.
c) Continue moving the tripod and camera around the station and stand seven meters directly north of the station. Take a picture of the station facing south.
d) Take another picture from seven meters away on the east side of the station facing west. e) Upload photos to the TEAM portal in the ssttaatt iioonn pphhoottooss section (see Figure 19 for
screenshot of the PPhhoottooggrraapphhss tab) via the Climate Data Management Tool (found in the “myTEAM” section of the website). See SStteepp 55 of the Climate Data Management Tool Help (Appendix A.8) for more information and a detailed explanation of the process.
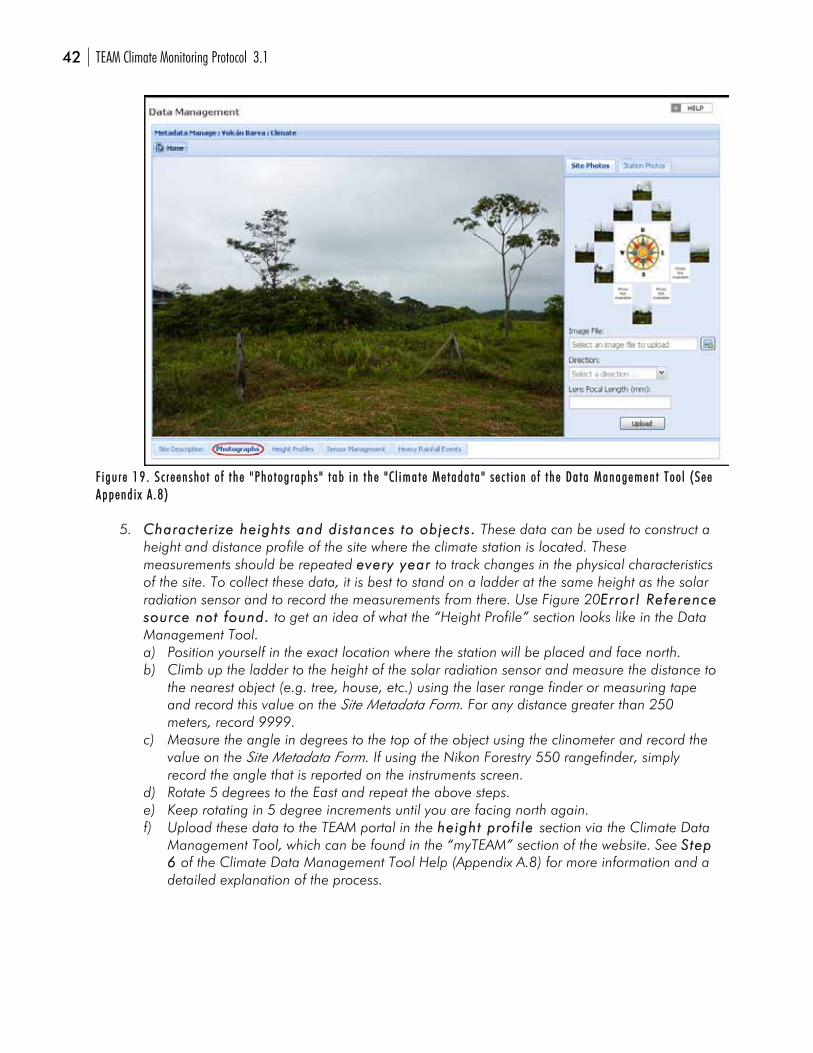
42 TEAM Climate Monitoring Protocol 3.1
FF ii gguu rr ee 1199 .. SS cc rr eeeenn sshhoo tt oo ff tt hhee ""PPhhoo tt oogg rraapphhss "" tt aabb ii nn tt hhee "" CC ll iimmaa tt ee MMee ttaaddaa ttaa "" ss ee cc tt ii oonn oo ff tt hhee DDaa ttaa MMaannaaggeemmeenn tt TToooo ll ((SSeeee AAppppeenndd ii xx AA ..88 ))
5. CChhaarraacctteerr iizzee hheeiigghhttss aanndd ddiiss ttaanncceess ttoo oobbjjeeccttss.. These data can be used to construct a
height and distance profile of the site where the climate station is located. These measurements should be repeated eevveerryy yyeeaarr to track changes in the physical characteristics of the site. To collect these data, it is best to stand on a ladder at the same height as the solar radiation sensor and to record the measurements from there. Use Figure 20EErrrroorr!! RReeffeerreennccee ssoouurrccee nnoott ffoouunndd.. to get an idea of what the “Height Profile” section looks like in the Data Management Tool. a) Position yourself in the exact location where the station will be placed and face north. b) Climb up the ladder to the height of the solar radiation sensor and measure the distance to
the nearest object (e.g. tree, house, etc.) using the laser range finder or measuring tape and record this value on the Site Metadata Form. For any distance greater than 250 meters, record 9999.
c) Measure the angle in degrees to the top of the object using the clinometer and record the value on the Site Metadata Form. If using the Nikon Forestry 550 rangefinder, simply record the angle that is reported on the instruments screen.
d) Rotate 5 degrees to the East and repeat the above steps. e) Keep rotating in 5 degree increments until you are facing north again. f) Upload these data to the TEAM portal in the hheeiigghhtt pprrooff ii llee section via the Climate Data
Management Tool, which can be found in the “myTEAM” section of the website. See SStteepp 66 of the Climate Data Management Tool Help (Appendix A.8) for more information and a detailed explanation of the process.
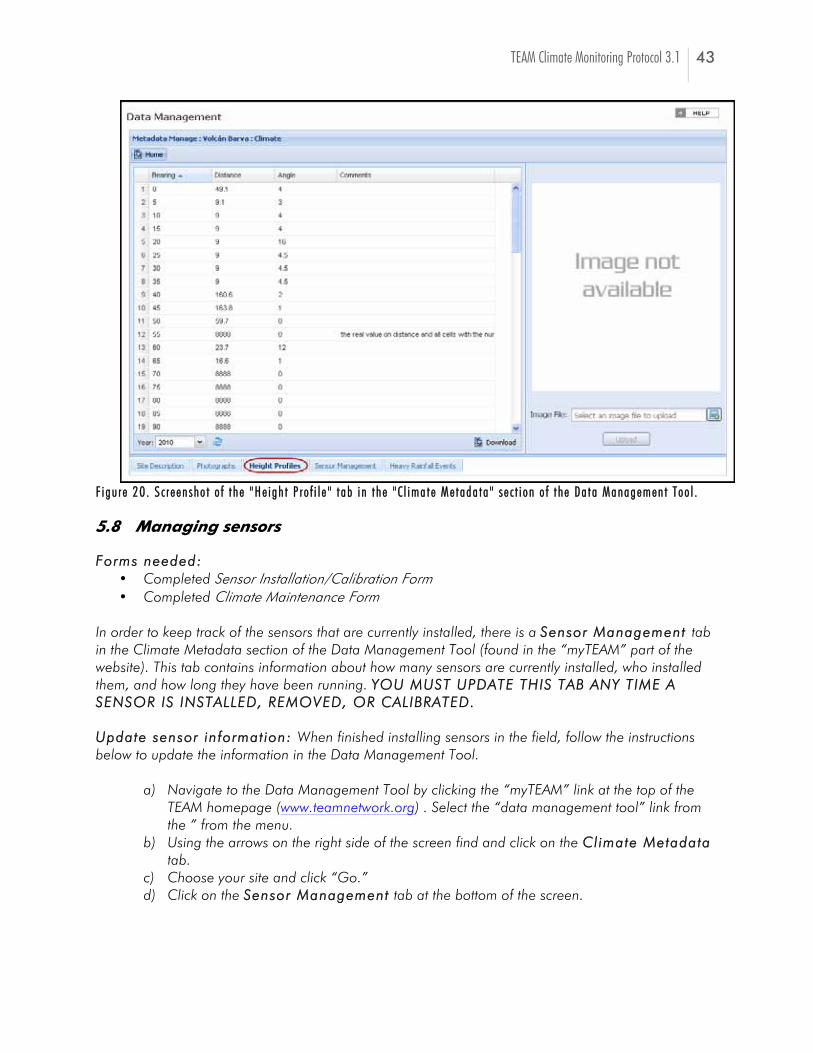
TEAM Climate Monitoring Protocol 3.1 43
FF ii gguu rr ee 2200 .. SS cc rr eeeenn sshhoo tt oo ff tt hhee ""HHee ii gghh tt PP rr oo ff ii ll ee "" tt aabb ii nn tt hhee "" CC ll iimmaa tt ee MMee ttaaddaa ttaa "" ss ee cc tt ii oonn oo ff tt hhee DDaa ttaa MMaannaaggeemmeenn tt TToooo ll ..
5.8 Managing sensors
FFoorrmmss nneeeeddeedd:: Completed Sensor Installation/Calibration Form Completed Climate Maintenance Form
In order to keep track of the sensors that are currently installed, there is a SSeennssoorr MMaannaaggeemmeenntt tab in the Climate Metadata section of the Data Management Tool (found in the “myTEAM” part of the website). This tab contains information about how many sensors are currently installed, who installed them, and how long they have been running. YYOOUU MMUUSSTT UUPPDDAATTEE TTHHIISS TTAABB AANNYY TTIIMMEE AA SSEENNSSOORR IISS IINNSSTTAALLLLEEDD,, RREEMMOOVVEEDD,, OORR CCAALLIIBBRRAATTEEDD.. UUppddaattee sseennssoorr iinnffoorrmmaatt iioonn:: When finished installing sensors in the field, follow the instructions below to update the information in the Data Management Tool.
a) Navigate to the Data Management Tool by clicking the “myTEAM” link at the top of the TEAM homepage (www.teamnetwork.org) . Select the “data management tool” link from the ” from the menu.
b) Using the arrows on the right side of the screen find and click on the CCll iimmaattee MMeettaaddaattaa tab.
c) Choose your site and click “Go.” d) Click on the SSeennssoorr MMaannaaggeemmeenntt tab at the bottom of the screen.
44 TEAM Climate Monitoring Protocol 3.1
e) Since all the equipment should already be registered through the Site Management Tool, all climate sensors owned by the site should appear on this tab and have a “Ready to Use” status. If no sensors appear in the “Sensor Management” tab, see SStteepp 22 of the Climate Data Management Tool Help (Appendix A.8) and register the equipment now.
f) Update each sensor’s status by ddoouubbllee--ccll iicckkiinngg in the “Status” column area next to the desired sensor.
g) In the drop down menu, choose “Installed” for the sensors that are currently recording data and enter the required information in the window that appears. Click “Submit”
h) Repeat steps f) and g) until all active sensors are identified as “Installed.”
5.9 Test run the station
EEqquuiippmmeenntt//ssuuppppll iieess nneeeeddeedd:: PC200W software (included with data logger) Memory card from the field Plastic zip-top bags (in case of rain) Blank memory card Computer
It is a good idea to run the station for a week to make sure everything is working as expected. Data from the first two weeks should be uploaded to the TEAM portal as soon as possible, to make sure the station is running without any problems. Turn on/connect the battery to the data logger, close the door and lock it.
1. GGeett tt iinngg tthhee ddaattaa oouutt:: After a few days, go back to the station and extract the memory card by pressing the white button in front of the memory card adapter. As soon as it turns green, open the door of the adapter and push the button to eject the memory card. Do not be concerned about losing any data when removing the card; the data logger will keep collecting data, which will be stored in its internal memory. Put in a new specially formatted, empty memory card.
2. RReeaadd tthhee ddaattaa iinnttoo tthhee ccoommppuutteerr:: You will need Campbell’s PC200W software to extract
the binary data from the memory card and convert it to a text file. Insert the card in a memory card reader and open the PC200W software.
3. CCrreeaattee llooccaall ss ttoorraaggee ddii rreeccttoorryy:: Establish a local directory to store Climate Measurement
Files in your computer.
4. CCoonnvveerr tt tthhee ff ii llee ff rroomm tthhee ccaarrdd iinnttoo aa rreeaaddaabbllee ffoorrmmaatt:: To upload the data from the memory card, the file must first be converted to a readable format. To do this, use the software that came with the data logger and follow the steps below. a) From the PC200W TToooollss menu, select CCaarrdd CCoonnvveerr tt .. This will open up the Card
Convert Window (see Figure 21 on the next page). b) Click the SSeelleecctt tthhee CCaarrdd DDrr iivvee button and choose the Source directory.
NNoottee:: A more detailed explanation of how to update sensor information can be found in SStteepp 77 the Climate Data Management Tool Help (Appendix A.7).
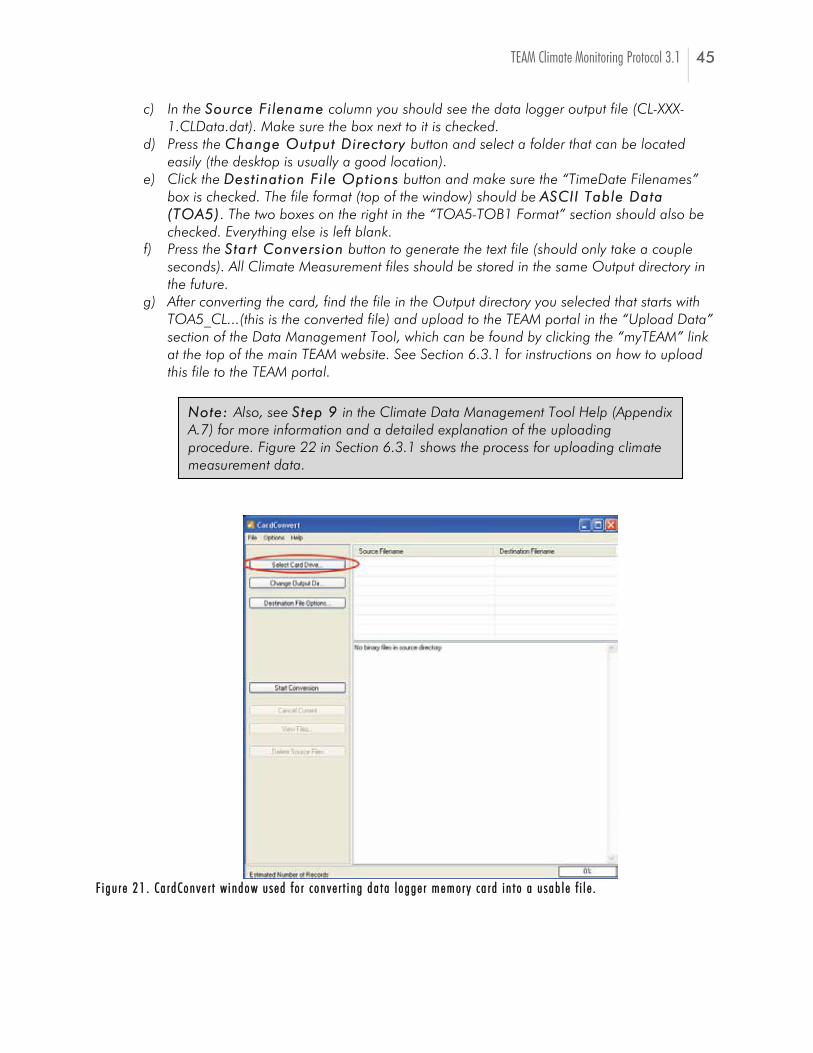
TEAM Climate Monitoring Protocol 3.1 45
c) In the SSoouurrccee FFii lleennaammee column you should see the data logger output file (CL-XXX-1.CLData.dat). Make sure the box next to it is checked.
d) Press the CChhaannggee OOuuttppuutt DDiirreeccttoorryy button and select a folder that can be located easily (the desktop is usually a good location).
e) Click the DDeesstt iinnaatt iioonn FFii llee OOpptt iioonnss button and make sure the “TimeDate Filenames” box is checked. The file format (top of the window) should be AASSCCII II TTaabbllee DDaattaa ((TTOOAA55)). The two boxes on the right in the “TOA5-TOB1 Format” section should also be checked. Everything else is left blank.
f) Press the SSttaarr tt CCoonnvveerrss iioonn button to generate the text file (should only take a couple seconds). All Climate Measurement files should be stored in the same Output directory in the future.
g) After converting the card, find the file in the Output directory you selected that starts with TOA5_CL...(this is the converted file) and upload to the TEAM portal in the “Upload Data” section of the Data Management Tool, which can be found by clicking the “myTEAM” link at the top of the main TEAM website. See Section 6.3.1 for instructions on how to upload this file to the TEAM portal.
FF ii gguu rr ee 2211 .. CCaa rr ddCCoonnvvee rr tt ww ii nnddooww uu sseedd ff oo rr cc oonnvvee rr tt ii nngg ddaa tt aa ll ooggggee rr mmeemmoo rr yy ccaa rr dd ii nn tt oo aa uu ssaabb ll ee ff ii ll ee ..
NNoottee:: Also, see SStteepp 99 in the Climate Data Management Tool Help (Appendix A.7) for more information and a detailed explanation of the uploading procedure. Figure 22 in Section 6.3.1 shows the process for uploading climate measurement data.
46 TEAM Climate Monitoring Protocol 3.1
5. SSeenndd tthhee ddaattaa ttoo tthhee tteeaamm ooff ff iiccee tthhrroouugghh eemmaaii ll .. As soon as the data has been retrieved from the field and converted to a readable format they should be sent to TEAM’s Technical Director for review. If any problems are identified with the data the site manager will be informed. Otherwise, data should continue to be recorded and retrieved from the field.
6 RRUUNNNNIINNGG TTHHEE CCLLIIMMAATTEE SSTTAATTIIOONN
Once all the checks have been made, the station can be left running autonomously. If the station is easily reachable also collect daily precipitation from the manual rain gauge (see below). To ensure minimum disruption in the data stream, the station should be visited at least every month (two weeks is better) to perform maintenance and collect data.
6.1 Regular maintenance
EEqquuiippmmeenntt//ssuuppppll iieess nneeeeddeedd:: Pen/Pencil Blank Climate Maintenance Log
Maintenance is key to the proper functioning of the climate station. This section describes in detail maintenance protocols for the different components of the climate station (core area, base tower, sensors, radiation shield, data logger, power sources). Table 5 EErrrroorr!! RReeffeerreennccee ssoouurrccee nnoott ffoouunndd..on page 49 contains a summary of all maintenance activities and their suggested frequency. All maintenance information will be recorded on the Climate Maintenance Log (Appendix A.3). This data will need to be uploaded to the TEAM portal after being collected via the Data Management Tool (located in the “myTEAM” area of the website). All maintenance activities need to be scheduled in advance in the TEAM online Sampling Scheduler (also located in the “myTEAM” area of the website) before the start of each data collection year.
6.1.1 Core area maintenance
The surface on the core area around the weather station should be covered with short grass or the natural substrate at the site. This area should be regularly maintained at least every month (preferably every two weeks) by keeping the grass short (or natural substrate) and free of debris. If there is a fence surrounding the climate station, it should also be regularly checked for possible breaches and general integrity. Replace any sections of the fence if they are damaged or start showing signs of deterioration.
NNoottee:: More instructions about testing the station can be found by watching the video called “Testing the sensors and data collection program” on the TEAM portal in the Climate Protocol section (http://www.teamnetwork.org/en/protocols/climate). Also, see Data Retrie
for more detailed nformation on retrieving data from the data logger.
TEAM Climate Monitoring Protocol 3.1 47
6.1.2 Tower maintenance
The tower structure should be carefully inspected every month. If a non-aluminum tower is used, look for signs of deterioration such as growing rusting spots on the poles, and in joints were two structures meet. As soon as rust is noticed, clean and sand the spot and surrounding area to remove the rust and apply antirust paint. Many animals and plants may attempt to colonize the tower. Every time the station is visited, remove any noticeable debris and structures (e.g. wasp/bee nests, bird nests, termite mounds, etc) present on the tower. Also remove any lianas or climbers that are starting to colonize from the base of the tower. Follow ant lines (or termite trails) that are climbing the tower to detect where they are going (to a sensor, a nest, the enclosure, etc) and destroy them. It is also very important to check on the tower’s grounding cable. There is a possibility it could become disconnected during an intense storm or due to someone stepping on it. Remember that IITT IISS CCRRIITTIICCAALL TTHHEE TTOOWWEERR IISS GGRROOUUNNDDEEDD to ensure proper protection against lightning strikes for the electrical circuits of the climate sensing equipment housed in the enclosure. Reattach the grounding wire to where it became loose by using a clamp (see Sections 5.3.3 and 5.7 for more information on the correct grounding procedure)
6.1.3 Enclosure maintenance
Check the integrity of the enclosure at least monthly (preferably every two weeks). First check the outside and make sure the enclosure is solid and there are no obvious breaches or rusting spots developing on the external surface. If any are detected, treat immediately by sanding the area and applying antirust paint. Look for ant or termite lines going into the enclosure and destroy them. Open the enclosure and check the humidity indicator. Replace the silica gel or Zorb-it™ packets if the middle circle (labeled 40) is pink. If there are ants or other insects inside the box, there is a breach most likely through the bottom pipe. Carefully check the pipe at the bottom of the enclosure and make sure the putty is correctly placed to seal the entrance. Remove any debris, insects, or structures found inside the enclosure. Inspect the cables and terminals in the data logger and battery to make sure the connections are not compromised. Look for rusting and salt deposits on the terminals; if any are detected, remove the cable from the terminal, clean it with sand paper and reconnect. Check the external surface of the cables to make sure there are no breaks or exposed wires. Repair any cables with exposed or damaged sections by wrapping the section of the cable with vinyl/electrical tape.
6.1.4 Sensor maintenance
All the sensors used in this protocol are designed to work unattended, but some minimum maintenance is necessary to ensure they are working correctly. TTeemmppeerraattuurree//RRHH sseennssoorr ((VVaaiissaallaa HHMMPP4455CC)):: Once a month, remove the sensors from the aspirated radiation shield and check for debris or deposits on the black screen at the end of the sensor. There is no need to disconnect any cables from the data logger or the cabling box in the aspirated radiation shield. Just remove the bottom portion of the shield and pull out the sensor from the tube to inspect it. Refer to the manual of the sensor for other maintenance guidelines; especially if the station is close to the ocean (salt deposits can form more quickly).
48 TEAM Climate Monitoring Protocol 3.1
AAssppiirraatteedd rraaddiiaatt iioonn sshhiieelldd ((MMeettOOnnee)): Every two weeks (or every time the station is visited) inspect the radiation shield to make sure no animals have colonized the structure (wasps love the shade provided by the shield). Clean the surface of the main ‘umbrella’ and the tube with a slightly damped cloth to remove dust and dirt and keep the efficiency of the shield as high as possible. Check that the fan is working by placing your hand (or an inexpensive portable flow monitor, e.g. Kestrel® 1000 Pocket Wind Meter-Forestry Suppliers) at the bottom of the shield. Slight suction should be experienced (if a flow monitor is available it should read about 5 mph or greater - 8 km per hour). The data logger is programmed to record the speed of the fan and write it to the data file, so if there is any problem with the fan it should be apparent in the data immediately. Replacement fans can be ordered from MetOne (make sure you order the fan with the tachometer cable – part # 3558) PPrreecciippii ttaatt iioonn ggaauuggee ((TTBB44)):: Inspect the precipitation gauge every time the station is visited. Remove any debris from the collection funnel or debris screen. Every two weeks, remove the cover of the gauge to make sure no insects or other animals are present inside. Carefully check that the tipping bucket mechanism is moving freely (DDOO NNOOTT tip it because a rainfall event will be recorded in the data logger). Inspect the siphoning tubes attached to the bottom of the gauge and make sure they are clear and free from debris (otherwise water will back up into the gauge). Check the bubble level to ensure the gauge is leveled. If needed, correct the level by adjusting the nuts on the mounting brackets.
SSoollaarr rraaddiiaatt iioonn ((LLII 220000XX)):: Every month, check the level of the pyranometers and adjust if necessary. Remove any debris on the sensor head by using a soft brush. If the debris is substantial (e.g. a bird dropping) note it in the maintenance log (Appendix A.3), and carefully clean the surface of the sensor with a lightly dampened cloth (do not use chemical cleaners). Inspect the drain hole next to the sensor and ensure it is open and free of debris.
6.1.5 Power systems maintenance
SSoollaarr ppaanneell:: Clean the surface of the solar panel every month by removing any debris, bird droppings, dust, etc. This will keep the panel working at the maximum efficiency possible. Using a voltmeter, measure the voltage differential coming out of the panel; not the regulator (at maximum efficiency - full sun, this should be about 17.9 V). BBaatt tteerryy: Every month check the battery to ensure it is working properly. Check that all the cable connections are tight and clean (no salt deposits or rust). When extracting data from the data logger, examine the data for the battery voltage minimum logs for any warning signs that the battery is not performing optimally. Normal minimum voltages should be between 11-13 V. If the voltage of the rechargeable battery dips below 10.5 V, this can cause irreversible damage to the battery. If the minimum battery voltage dips below 10.5 V, immediately replace the battery.
NNoottee:: As mentioned in Section 6.4.1, check the manual precipitation gauge every time the station is visited. Follow the instructions in SStteepp 88 of the Climate Data Management Tool Help (Appendix A.8) for information about uploading this data.
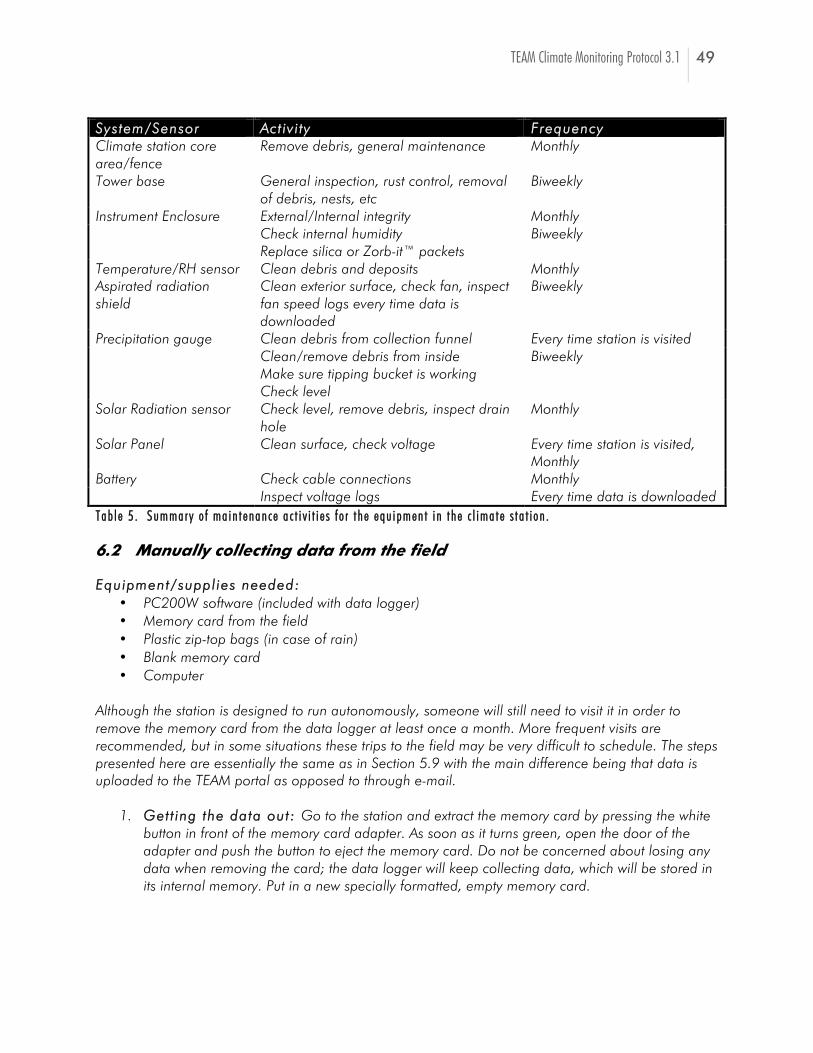
TEAM Climate Monitoring Protocol 3.1 49
SSyysstteemm//SSeennssoorr AAcctt iivv ii ttyy FFrreeqquueennccyy Climate station core area/fence
Remove debris, general maintenance Monthly
Tower base General inspection, rust control, removal of debris, nests, etc
Biweekly
Instrument Enclosure External/Internal integrity Monthly Check internal humidity
Replace silica or Zorb-it™ packets Biweekly
Temperature/RH sensor Clean debris and deposits Monthly Aspirated radiation shield
Clean exterior surface, check fan, inspect fan speed logs every time data is downloaded
Biweekly
Precipitation gauge Clean debris from collection funnel Every time station is visited Clean/remove debris from inside
Make sure tipping bucket is working Check level
Biweekly
Solar Radiation sensor Check level, remove debris, inspect drain hole
Monthly
Solar Panel Clean surface, check voltage Every time station is visited, Monthly
Battery Check cable connections Monthly Inspect voltage logs Every time data is downloaded TTaabb ll ee 55 .. SSuummmmaa rr yy oo ff mmaa ii nn tt eennaannccee aa cc tt ii vv ii tt ii ee ss ff oo rr tt hhee eeqquu ii ppmmeenn tt ii nn tt hhee cc ll iimmaa tt ee ss tt aa tt ii oonn ..
6.2 Manually collecting data from the field
EEqquuiippmmeenntt//ssuuppppll iieess nneeeeddeedd:: PC200W software (included with data logger) Memory card from the field Plastic zip-top bags (in case of rain) Blank memory card Computer
Although the station is designed to run autonomously, someone will still need to visit it in order to remove the memory card from the data logger at least once a month. More frequent visits are recommended, but in some situations these trips to the field may be very difficult to schedule. The steps presented here are essentially the same as in Section 5.9 with the main difference being that data is uploaded to the TEAM portal as opposed to through e-mail.
1. GGeett tt iinngg tthhee ddaattaa oouutt:: Go to the station and extract the memory card by pressing the white button in front of the memory card adapter. As soon as it turns green, open the door of the adapter and push the button to eject the memory card. Do not be concerned about losing any data when removing the card; the data logger will keep collecting data, which will be stored in its internal memory. Put in a new specially formatted, empty memory card.
50 TEAM Climate Monitoring Protocol 3.1
2. RReeaadd tthhee ddaattaa iinnttoo tthhee ccoommppuutteerr:: You will need Campbell’s PC200W software (found on the Campbell Scientific website: http://www.campbellsci.com/pc200w) to extract the binary data from the memory card and convert it to a text file. Insert the card in a memory card reader and open the PC200W software.
3. CCrreeaattee llooccaall ss ttoorraaggee ddii rreeccttoorryy:: Establish a local directory to store Climate Measurement
Files in your computer.
4. CCoonnvveerr tt tthhee ff ii llee ff rroomm tthhee ccaarrdd iinnttoo aa rreeaaddaabbllee ffoorrmmaatt:: To upload the data from the memory card, the file must first be converted to a readable format. Do this by using the software that came with the data logger and follow the steps below. a) From the PC200W TToooollss menu, select CCaarrdd CCoonnvveerr tt .. This will open up the Card
Convert Window (see Figure 21). b) Click the SSeelleecctt tthhee CCaarrdd DDrr iivvee button and choose the Source directory. c) In the SSoouurrccee FFii lleennaammee column you should see the data logger output file (CL-XXX-
1.CLData.dat). Make sure the box next to it is checked. d) Press the CChhaannggee OOuuttppuutt DDiirreeccttoorryy button and select a folder that can be located
easily (the desktop is usually a good location). e) Click the DDeesstt iinnaatt iioonn FFii llee OOpptt iioonnss button and make sure the “TimeDate Filenames”
box is checked. The file format (top of the window) should be AASSCCII II TTaabbllee DDaattaa ((TTOOAA55)). The two boxes on the right in the “TOA5-TOB1 Format” section should also be checked. Everything else is left blank.
f) Press the SSttaarr tt CCoonnvveerrss iioonn button to generate the text file (should only take a couple seconds). All Climate Measurement files should be stored in the same Output directory in the future.
g) After converting the card, find the file in the Output directory you selected that starts with TOA5_CL...(this is the converted file) and upload to the TEAM portal in the “Upload Data” section of the Data Management Tool, which can be found by clicking the “myTEAM” link at the top of the main TEAM website. See Section 6.3.1 for instructions on how to upload this file to the TEAM portal.
5. UUppllooaadd ddaattaa ttoo TTEEAAMM ppoorr ttaall .. As soon as the data has been retrieved from the field and converted to a readable format they should be uploaded to the TEAM portal following the directions in Section 6.3.1
6.3 Uploading data to the TEAM portal
Retrieving the data often is essential to detect any data anomalies and problems with the sensors. There are several ways to retrieve data from the station, but here we only describe one option: manually through removal of the memory card. We envision having wireless options for data retrieval in the near future, either through radio, cell phone, or satellite uplink. Until then, it is essential that data be retrieved every time the station is visited for maintenance.
NNoottee:: Also, see SStteepp 99 in the Climate Data Management Tool Help (Appendix A.7) for more information and a detailed explanation of the uploading procedure. Figure 22 shows the process for uploading climate measurement data.
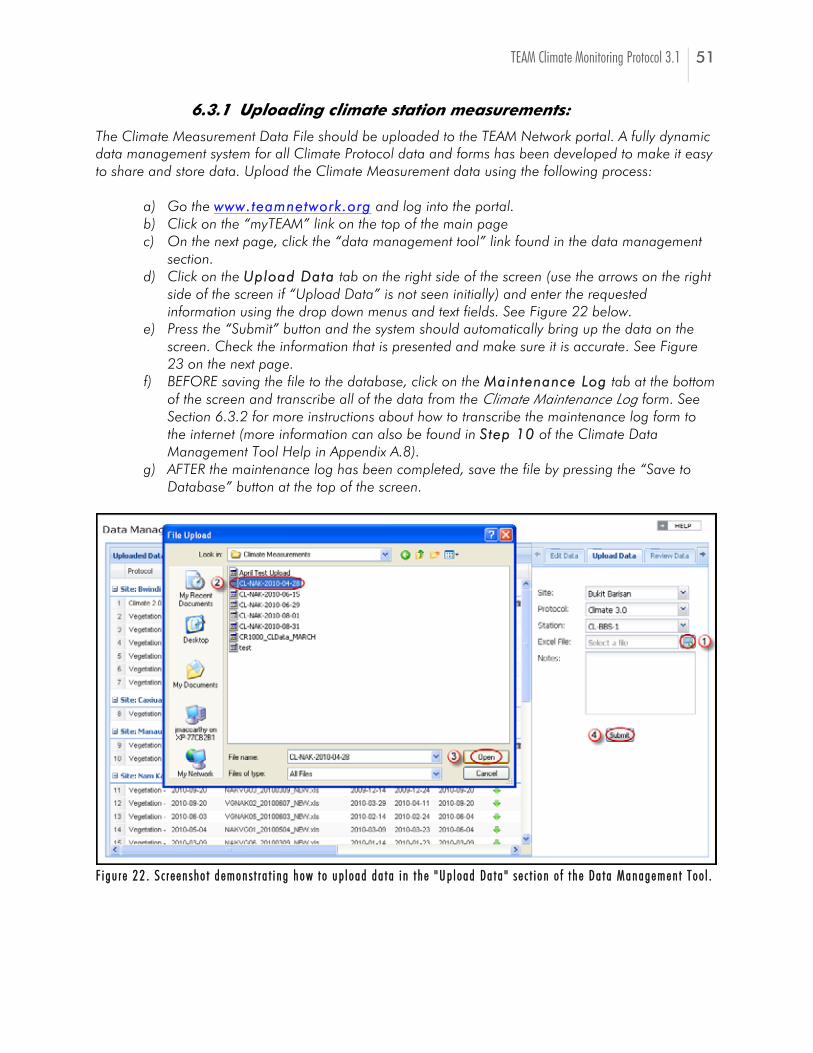
TEAM Climate Monitoring Protocol 3.1 51
6.3.1 Uploading climate station measurements:
The Climate Measurement Data File should be uploaded to the TEAM Network portal. A fully dynamic data management system for all Climate Protocol data and forms has been developed to make it easy to share and store data. Upload the Climate Measurement data using the following process:
a) Go the wwwwww..tteeaammnneettwwoorrkk..oorrgg and log into the portal. b) Click on the “myTEAM” link on the top of the main page c) On the next page, click the “data management tool” link found in the data management
section. d) Click on the UUppllooaadd DDaattaa tab on the right side of the screen (use the arrows on the right
side of the screen if “Upload Data” is not seen initially) and enter the requested information using the drop down menus and text fields. See Figure 22 below.
e) Press the “Submit” button and the system should automatically bring up the data on the screen. Check the information that is presented and make sure it is accurate. See Figure 23 on the next page.
f) BEFORE saving the file to the database, click on the MMaaiinntteennaannccee LLoogg tab at the bottom of the screen and transcribe all of the data from the Climate Maintenance Log form. See Section 6.3.2 for more instructions about how to transcribe the maintenance log form to the internet (more information can also be found in SStteepp 1100 of the Climate Data Management Tool Help in Appendix A.8).
g) AFTER the maintenance log has been completed, save the file by pressing the “Save to Database” button at the top of the screen.
FF ii gguu rr ee 2222 .. SS cc rr eeeenn sshhoo tt ddeemmoonnss tt rr aa tt ii nngg hhooww tt oo uupp ll ooaadd ddaa tt aa ii nn tt hhee ""UUpp ll ooaadd DDaa ttaa "" ss ee cc tt ii oonn oo ff tt hhee DDaa ttaa MMaannaaggeemmeenn tt TToooo ll ..
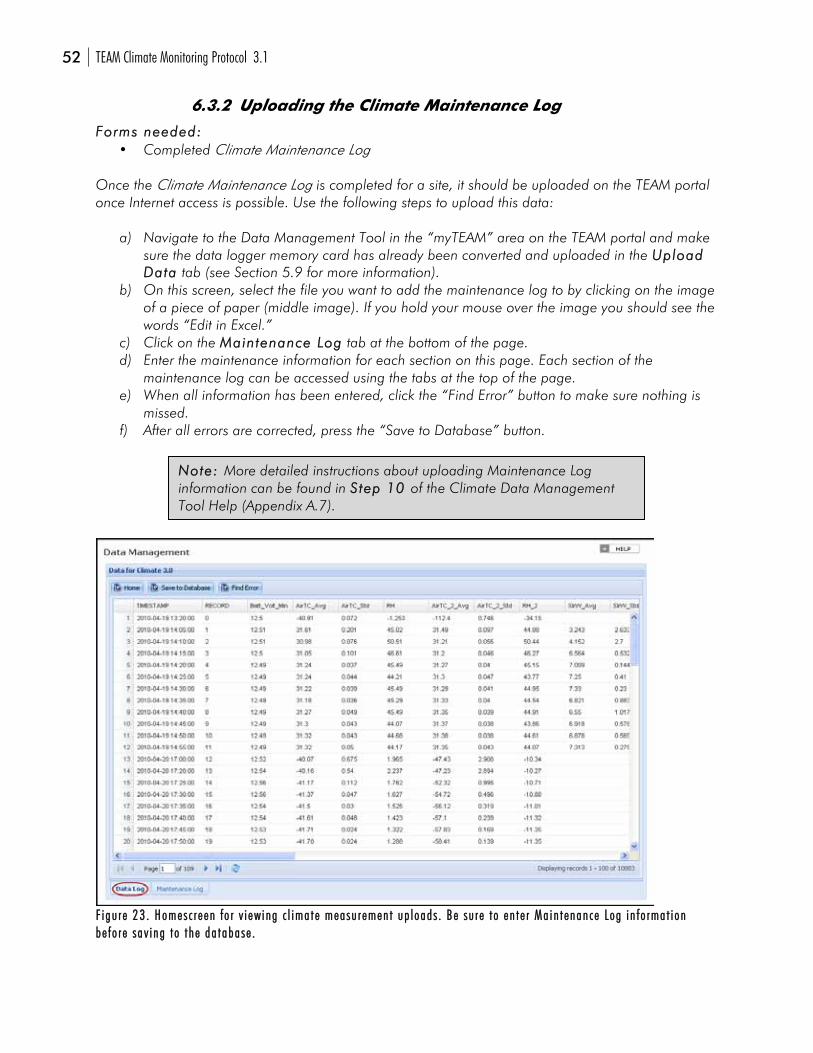
52 TEAM Climate Monitoring Protocol 3.1
6.3.2 Uploading the Climate Maintenance Log
FFoorrmmss nneeeeddeedd:: Completed Climate Maintenance Log
Once the Climate Maintenance Log is completed for a site, it should be uploaded on the TEAM portal once Internet access is possible. Use the following steps to upload this data:
a) Navigate to the Data Management Tool in the “myTEAM” area on the TEAM portal and make sure the data logger memory card has already been converted and uploaded in the UUppllooaadd DDaattaa tab (see Section 5.9 for more information).
b) On this screen, select the file you want to add the maintenance log to by clicking on the image of a piece of paper (middle image). If you hold your mouse over the image you should see the words “Edit in Excel.”
c) Click on the MMaaiinntteennaannccee LLoogg tab at the bottom of the page. d) Enter the maintenance information for each section on this page. Each section of the
maintenance log can be accessed using the tabs at the top of the page. e) When all information has been entered, click the “Find Error” button to make sure nothing is
missed. f) After all errors are corrected, press the “Save to Database” button.
FF ii gguu rr ee 2233 .. HHoommeess cc rr eeeenn ff oo rr vv ii eeww iinngg cc ll iimmaa tt ee mmeeaassuu rr eemmeenn tt uupp ll ooaaddss .. BBee ssuu rr ee tt oo eenn tt ee rr MMaa ii nn tt eennaannccee LLoogg ii nn ff oo rrmmaa tt ii oonn bbee ff oo rr ee ssaavv ii nngg tt oo tt hhee ddaa tt aabbaassee ..
NNoottee:: More detailed instructions about uploading Maintenance Log information can be found in SStteepp 1100 of the Climate Data Management Tool Help (Appendix A.7).
TEAM Climate Monitoring Protocol 3.1 53
6.4 Checking rainfall measurements against the manual rain gauge
Automatic tipping buckets, like the one used in this protocol (TB4) can misread the amount of rainfall during extreme rainfall events (> 50 mm/hour) (e.g. Nystuen 1999). Thus, it is a good idea to check rainfall measurements with a manual precipitation bucket (e.g. a US weather type). We suggest the following guidelines to ensure this information can be captured in a standardized way. The manual rain gauge should be cchheecckkeedd eevveerryy tt iimmee tthhee ssttaatt iioonn iiss vviiss ii tteedd during maintenance checks or, if the station is easily reachable, check rainfall values every day.
6.4.1 Measure and record the event
EEqquuiippmmeenntt//ssuuppppll iieess nneeeeddeedd:: Pen/Pencil Blank Sensor Installation/Calibration Form
Every time the station is visited (at least once a month), measure the rainfall using the enclosed dipstick and write it down together with the current date in the Manual Rainfall Form (Appendix A.6. Manual Rainfall Form). If there is an extremely heavy rainfall event, the inner section of the rain bucket may overflow into the outer section. When this happens measure the rainfall that accumulated in the inner bucket and then empty it. Refill the inner bucket with the water that overflowed into the outer section and measure this amount using the dipstick. If there is any more water remaining in the outer section, repeat this procedure again. When you record this event, add all of the measurements together to get the final volume of rain that fell.
6.4.2 Submit the data
FFoorrmmss nneeeeddeedd:: Completed Sensor Installation/Calibration Form
Upon returning from the field, transcribe the recorded data to the MMaannuuaall RRaaiinn GGaauuggee tab in the Climate Metadata section of the Data Management Tool, which can be found in the “myTEAM” area on the TEAM website, as part of the regular data submission process. Instructions for uploading data from the manual rain gauge can be found in SStteepp 88 of the Climate Data Management Tool Help (Appendix A.8) or follow the basic instructions below:
a) Navigate to www.teamnetwork.org. b) Open the Data Management Tool by clicking on the “myTEAM” link at the top of the page and
then, on the page that appears, clicking on the “data management tool” link. c) Using the arrows on the right side of the screen find and click on the “Climate Metadata” tab. d) Choose your site and click “Go.” e) Click on the MMaannuuaall RRaaiinn GGaauuggee tab at the bottom of the screen. f) Enter the required information from the completed Sensor Installation/Calibration Form and
click the “Save” button. If the bucket was emptied on a date other than the date of the last recorded measurement, then record the date and time for when it was emptied in the “Comments” box.
54 TEAM Climate Monitoring Protocol 3.1
6.5 Sensor Calibration
The sensors need to be calibrated periodically to ensure that the measurements are consistent through time. Having duplicate sensors facilitates this process and ensures there is always a backup in case one of the sensors fails. While a sensor is out for calibration, a replacement sensor needs to be installed in its place (just the head for the Temperature/RH sensor). A summary of the calibration schedule can be found in Table 6 below. Sensor calibrations will be recorded in the Sensor Installation/Calibration Form (Appendix A.4). For each sensor calibrated also please complete the Sensor Calibration Metadata Form (Appendix A.5). This form keeps track of vendors, costs and calibration certificates for each of the sensors used. All sensor calibration events will be scheduled automatically in the TEAM online Sampling Scheduler before the start of each data collection year. Both of these forms must be uploaded to the TEAM Network portal following the instructions included in Section 6.5.4. SSeennssoorr CCaall iibbrraatt iioonn pprroocceessss FFrreeqquueennccyy Temperature/RH Vaisala HMP45C
Sent to manufacturer for calibration. Fill in information on the Sensor Calibration Form Submit information to the TEAM portal
Yearly
Precipitation (TB4) Level and pour 314 cc of water. Gauge should tip 39 times. If not send out for calibration Fill in information on the Sensor Calibration Form Submit information to the TEAM portal
Yearly
Solar Radiation (LI 200X) Sent to manufacturer for calibration. Fill in information on the Sensor Calibration Form Submit information to the TEAM portal
Every two years1
TTaabb ll ee 66 .. SSuummmmaa rr yy oo ff cc aa ll ii bb rr aa tt ii oonn pp rr oo cc ee ss ss aanndd ss cchheedduu ll ee ff oo rr tt hhee ss eenn ssoo rr ss uu ss eedd ii nn tt hhee TTEEAAMM CC ll iimmaa tt ee PP rr oo tt oo ccoo ll .. 11SS cchheedduu ll ee ff oo rr tt hhee ff ii rr ss tt yy eeaa rr oo ff ooppee rr aa tt ii oonn ii ss ss ll ii gghh tt ll yy dd ii ff ff ee rr eenn tt ;; ss eeee SSee cc tt ii oonn 66 ..55 ..11 ff oo rr ddee tt aa ii ll ss ..
6.5.1 Temperature/RH sensor (Vaisala HMP45C)
EEqquuiippmmeenntt//ssuuppppll iieess nneeeeddeedd:: Pen/Pencil Replacement Temperature/RH sensor Blank Sensor Installation/Calibration Form Blank Sensor Calibration Metadata Form
The sensor head should be recalibrated every year. Figure 24 on the following page illustrates how the replacement and recalibration schedule should work. Note that there is a lag the first year the sensors are installed. Sensor 1 is removed after a year of operation, but since two sensors need to be running at a time, Sensor 2 is not removed until aaff tteerr Sensor 1 is recalibrated and returned to the field. Follow the steps below for removing and replacing sensors. Use a Sensor Installation/Calibration Form (Appendix A.4. Sensor Installation/Calibration Form) to record the event.
1. DDeettaacchh tthhee sseennssoorr hhoouussiinngg ooff tthhee rraaddiiaatt iioonn sshhiieelldd.. Unhook the bottom portion of the radiation shield from the top by loosening the four clamps that retain the housing to the rest of the shield. Do not disconnect the sensor cable or power cable coming from the shield.
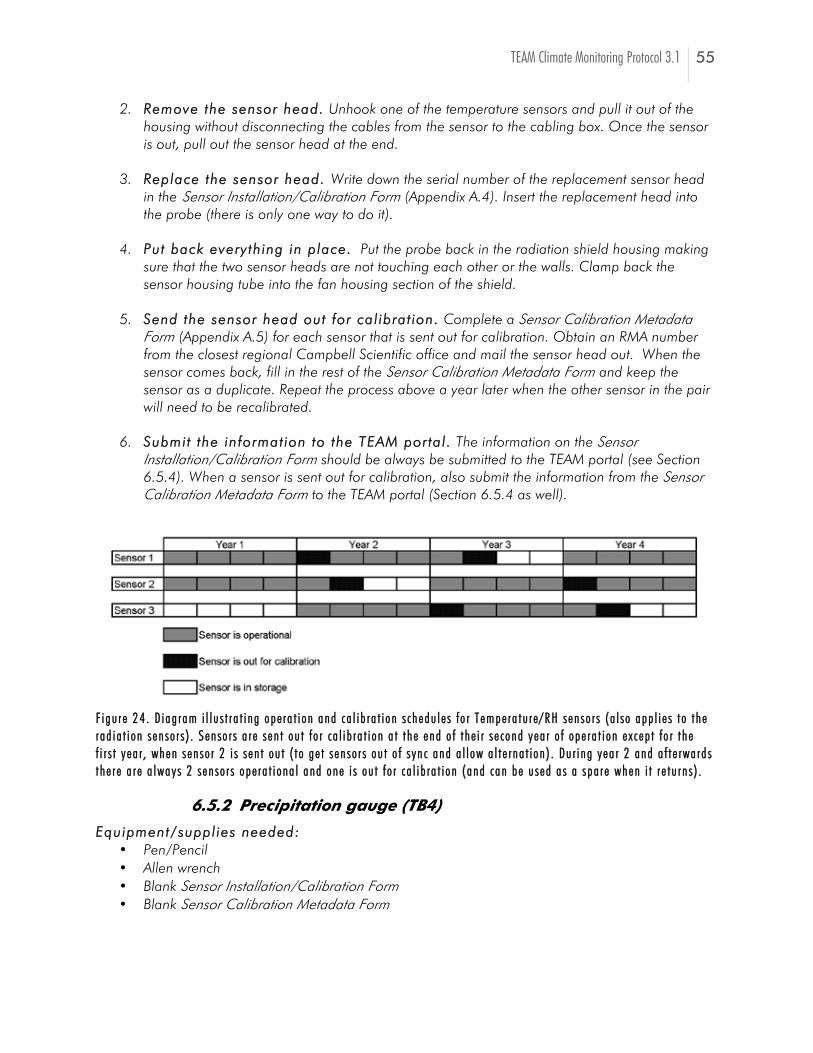
TEAM Climate Monitoring Protocol 3.1 55
2. RReemmoovvee tthhee sseennssoorr hheeaadd.. Unhook one of the temperature sensors and pull it out of the housing without disconnecting the cables from the sensor to the cabling box. Once the sensor is out, pull out the sensor head at the end.
3. RReeppllaaccee tthhee sseennssoorr hheeaadd.. Write down the serial number of the replacement sensor head
in the Sensor Installation/Calibration Form (Appendix A.4). Insert the replacement head into the probe (there is only one way to do it).
4. PPuutt bbaacckk eevveerryytthhiinngg iinn ppllaaccee.. Put the probe back in the radiation shield housing making
sure that the two sensor heads are not touching each other or the walls. Clamp back the sensor housing tube into the fan housing section of the shield.
5. SSeenndd tthhee sseennssoorr hheeaadd oouutt ffoorr ccaall iibbrraatt iioonn.. Complete a Sensor Calibration Metadata
Form (Appendix A.5) for each sensor that is sent out for calibration. Obtain an RMA number from the closest regional Campbell Scientific office and mail the sensor head out. When the sensor comes back, fill in the rest of the Sensor Calibration Metadata Form and keep the sensor as a duplicate. Repeat the process above a year later when the other sensor in the pair will need to be recalibrated.
6. SSuubbmmii tt tthhee iinnffoorrmmaatt iioonn ttoo tthhee TTEEAAMM ppoorr ttaall .. The information on the Sensor
Installation/Calibration Form should be always be submitted to the TEAM portal (see Section 6.5.4). When a sensor is sent out for calibration, also submit the information from the Sensor Calibration Metadata Form to the TEAM portal (Section 6.5.4 as well).
FF ii gguu rr ee 2244 .. DD ii aagg rr aamm ii ll ll uu ss tt rr aa tt ii nngg ooppee rr aa tt ii oonn aanndd ccaa ll ii bb rr aa tt ii oonn ss cchheedduu ll ee ss ff oo rr TT eemmppee rr aa tt uu rr ee //RRHH ss eenn ssoo rr ss (( aa ll ss oo aapppp ll ii ee ss tt oo tt hhee rr aadd ii aa tt ii oonn ss eenn ssoo rr ss )) .. SSeenn ssoo rr ss aa rr ee ss eenn tt oouu tt ff oo rr ccaa ll ii bb rr aa tt ii oonn aa tt tt hhee eenndd oo ff tt hhee ii rr ss ee ccoonndd yyeeaa rr oo ff ooppee rr aa tt ii oonn ee xx cc eepp tt ff oo rr tt hhee ff ii rr ss tt yy eeaa rr ,, wwhheenn ss eenn ssoo rr 22 ii ss ss eenn tt oouu tt (( tt oo ggee tt ss eenn ssoo rr ss oouu tt oo ff ss yynn cc aanndd aa ll ll ooww aa ll tt ee rr nnaa tt ii oonn )) .. DDuu rr ii nngg yyeeaa rr 22 aanndd aa ff tt ee rrwwaa rrdd ss tt hhee rr ee aa rr ee aa llwwaayy ss 22 ss eenn ssoo rr ss ooppee rr aa tt ii oonnaa ll aanndd oonnee ii ss oouu tt ff oo rr ccaa ll ii bb rr aa tt ii oonn (( aanndd ccaann bbee uu sseedd aa ss aa ssppaa rr ee wwhheenn ii tt rr ee tt uu rr nn ss )) ..
6.5.2 Precipitation gauge (TB4)
EEqquuiippmmeenntt//ssuuppppll iieess nneeeeddeedd:: Pen/Pencil Allen wrench Blank Sensor Installation/Calibration Form Blank Sensor Calibration Metadata Form
56 TEAM Climate Monitoring Protocol 3.1
The TB4 requires very little maintenance and should work well as long as the tipping mechanism is not disturbed. However, the precipitation gauge should be calibrated annually to ensure accurate rainfall measurements. Record the results in the Sensor Installation/Calibration Form. The manufacturer recommends the following process:
1. DDiissccoonnnneecctt SSeennssoorr CCaabbllee.. Disconnect the pulse cable coming from the sensor into the datalogger (into the P1 slot).
2. RReemmoovvee tthhee ccoovveerr.. Remove the cover from the gauge by loosening the screws on the sides. 3. LLeevveell tthhee ggaauuggee.. Check the bubble level to ensure the gauge is perfectly leveled. If not,
adjust the nuts on the mounting bracket to level the unit.
4. PPoouurr wwaatteerr.. VERY Slowly pour through 314 cc of water through the inner funnel over a 15-minute period (this is equivalent to 10 mm of rain). Have a second person count the number of tips as the water is poured. The gauge should have tipped 39 times.
55.. RReeccoonnnneecctt tthhee ccaabbllee.. Reconnect the cable coming from the tupping bucket into the P1 slot
in the datalogger (DON’T FORGET THIS STEP, OTHERWISE YOUR BUCKET WILL NOT WORK).
6. RReeccoorrdd tthhee ccaall iibbrraatt iioonn eevveenntt .. Fill in the time, date and number of tips in the Sensor
Calibration form. If the gauge did not tip 39 times, there is a problem with the tipping mechanism. If necessary, send it back to the manufacturer for a recalibration and complete the Sensor Calibration Metadata Form (Appendix A.5. Sensor Calibration Metadata Form). Use readings from the manual precipitation gauge until the tipping bucket is recalibrated.
7. SSuubbmmii tt tthhee iinnffoorrmmaatt iioonn ttoo tthhee TTEEAAMM ppoorr ttaall .. Every time the tipping gauge is calibrated
submit the information on the Sensor Installation/Calibration Form to the TEAM portal. See Section 6.5.4 for instructions on transcribing the information from the Sensor Installation/Calibration form. If the tipping bucket needed to be sent out for calibration, the Sensor Calibration Metadata Form can also be submitted using the instructions in Section 6.5.4.
6.5.3 Solar radiation (LI 200X)
EEqquuiippmmeenntt//ssuuppppll iieess nneeeeddeedd:: Pen/Pencil Small Allen wrench Replacement Solar Radiation sensor Blank Sensor Installation/Calibration Form Blank Sensor Calibration Metadata Form
The Licor LI 200X should be sent out for calibration every 2 years. Send out one of the duplicates for calibration at the end of the second year of operation to keep two sensors always operating in alternate schedules. Follow the instructions in the beginning of Section 6.5.1 for how to set up the alternating calibration schedule (also see Figure 24 to get an idea of how the calibration schedule should work). After the first year of operation, only remove sensors for calibration every two years or if they become damaged. Follow the steps below to replace the solar radiation sensor.
TEAM Climate Monitoring Protocol 3.1 57
1. DDiissccoonnnneecctt tthhee ppyyrraannoommeetteerr ff rroomm tthhee ddaattaa llooggggeerr.. Open the enclosure to get access
to the data logger and disconnect the four cables coming from the pyranometer into the data logger (usually one into 3H (or 4H), one into 3L (or 3H) and two grounds).
2. RReemmoovvee tthhee ppyyrraannoommeetteerr ff rroomm tthhee lleevveell iinngg bbaassee.. Using the thin Allen wrench (that
comes with the pyranometer), free the pyranometer from the leveling base. Write down the Serial Number (below the Model label on one side) and the date on the Sensor Installation/Calibration Form.
3. IInnssttaall ll tthhee rreeppllaacceemmeenntt .. Locate the replacement pyranometer in its housing making sure
that the cable is routed through the slot on one side. Secure the pyranometer by tightening the screw on the side of the base (using the thin Allen wrench). RREEMMOOVVEE TTHHEE RREEDD PPLLAASSTTIICC CCOOVVEERR PPRROOTTEECCTTIINNGG TTHHEE SSEENNSSOORR (otherwise the data will be useless!).
4. CCoonnnneecctt tthhee ppyyrraannoommeetteerr ttoo tthhee ddaattaa llooggggeerr.. Route and secure the cable through the
leveling arm and base until it reaches the enclosure. Route through the enclosure making sure there is enough slack to connect to the data logger. Connect the cables to the terminals where the replaced-to-be pyranometer used to be (use the cabling diagram for your site to match the color cables and terminals). Secure the cables inside the enclosure using a grommet and leaving enough slack so they are not tense.
5. CChheecckk tthhee LLeevveell iinngg BBaassee.. Make sure the new pyranometer is leveled by checking the
bubble in the leveling base. Adjust if necessary using the protruding screws on the leveling base.
6. RReeccoorrdd tthhee sseerr iiaall nnuummbbeerr.. Write down the serial number of the new sensor and the date
and time it was installed on the Sensor Installation/Calibration Form.
7. SSeenndd tthhee sseennssoorr hheeaadd oouutt ffoorr ccaall iibbrraatt iioonn.. Complete a Sensor Calibration Metadata Form (Appendix A.5) for each sensor that is sent out for calibration. Mail the sensor head back to the manufacturer for recalibration. When the sensor comes back, fill in the rest of the Sensor Calibration Metadata Form and keep the sensor as a duplicate.
8. SSuubbmmii tt ccaall iibbrraatt iioonn iinnffoorrmmaatt iioonn ttoo tthhee TTEEAAMM ppoorrttaall .. Submit forms to the TEAM portal
as soon as technically feasible. See Section 6.5.4 for instructions on uploading the Sensor Installation/Calibration and Sensor Calibration Metadata Forms.
6.5.4 Uploading calibration forms
FFoorrmmss nneeeeddeedd:: Completed Sensor Installation/Calibration Form Completed Sensor Calibration Metadata Form
Since the sensors have been removed from the field and sent out for calibration at this point, the Sensor Installation/Calibration Form and Sensor Calibration Metadata Form should have been completed. To upload this information to the TEAM portal, follow the steps below:
a) Open an internet browser and navigate to the TEAM portal (www.teamnetwork.org).
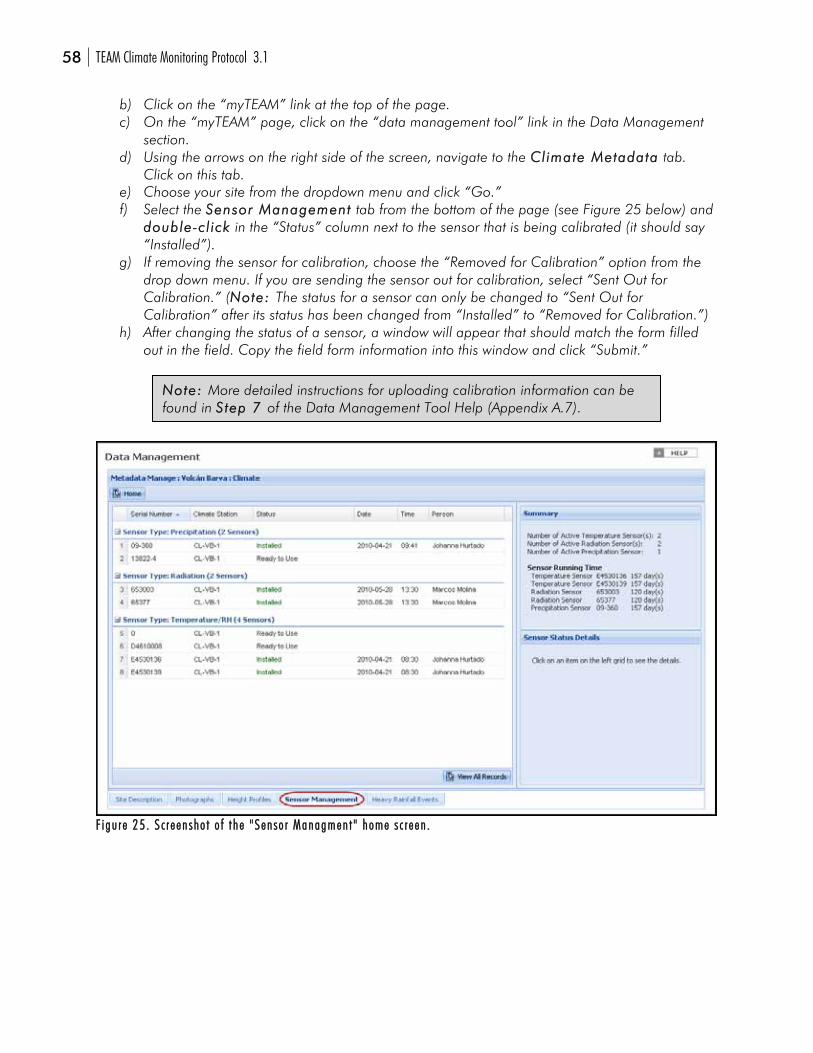
58 TEAM Climate Monitoring Protocol 3.1
b) Click on the “myTEAM” link at the top of the page. c) On the “myTEAM” page, click on the “data management tool” link in the Data Management
section. d) Using the arrows on the right side of the screen, navigate to the CCll iimmaattee MMeettaaddaattaa tab.
Click on this tab. e) Choose your site from the dropdown menu and click “Go.” f) Select the SSeennssoorr MMaannaaggeemmeenntt tab from the bottom of the page (see Figure 25 below) and
ddoouubbllee--ccll iicckk in the “Status” column next to the sensor that is being calibrated (it should say “Installed”).
g) If removing the sensor for calibration, choose the “Removed for Calibration” option from the drop down menu. If you are sending the sensor out for calibration, select “Sent Out for Calibration.” (NNoottee:: The status for a sensor can only be changed to “Sent Out for Calibration” after its status has been changed from “Installed” to “Removed for Calibration.”)
h) After changing the status of a sensor, a window will appear that should match the form filled out in the field. Copy the field form information into this window and click “Submit.”
FF ii gguu rr ee 2255 .. SS cc rr eeeenn sshhoo tt oo ff tt hhee ""SSeennssoo rr MMaannaaggmmeenn tt "" hhoommee ss cc rr eeeenn ..
NNoottee:: More detailed instructions for uploading calibration information can be found in SStteepp 77 of the Data Management Tool Help (Appendix A.7).
TEAM Climate Monitoring Protocol 3.1 59
7 RREEFFEERREENNCCEESS CCIITTEEDD
Andelman, S. J., & Willig, M. R. 2004. Networks by design: a revolution in ecology. Science, 330055(5690): 1565. Andelman, S. J. 2011. Conservation science outside the comfort zone. Nature, 447755:290-291. Campbell Scientific. 2008. LI200X Pyranometer. Instruction Manual. http://www.campbellsci.com/documents/manuals/li200x.pdf Clark, D. A. 2002. Are Tropical Forests an Important Carbon Sink? Reanalysis of the Long-Term Plot Data. Ecological Applications 1122(1): 3-7. Clark, D. A. and D. B. Clark. 1994. Climate-induced annual variation in canopy tree growth in a Costa Rican tropical rain forest. Journal of Ecology 8822: 865-872. Enquist, C. A. F. 2002. Predicted regional impacts of climate change on the geographical distribution and diversity of tropical forests in Costa Rica. Journal of Biogeography 2299: 519-534. EPA. 1995. Quality Assurance Handbook for Air Polution Measurement Systems. Metereological Measurements. Vol. 4. US Environmental Protection Agency. IPCC. 2007. Intergovernmental Panel on Climate Change, Fourth Assessment Report (AR4). Kenneth J. F., Wright, J.S., Supardi, N., Rahman Kassim, A. R., Davies, S.J. 2007. Decelerating growth in tropical forest trees. Ecology Letters 10(1): 1-9. Landau, C. R., 2001. Optimum orientation of solar panels. http://www.macslab.com/optsolar.html.) Malhi, Y. and Wright, J. 2004. Spatial patterns and recent trends in the climate of tropical forest regions. Phil. Trans. R. Soc. (B), 359: 311-329. Malhi, Y., Timmons Roberts, J., Betts, R. A., Killeen, T.J., Lee, W. and Nobre, C.A. 2008. Climate change, deforestation and the fate of the Amazon. Science, 319: 169-172. NRC. 1999. Adequacy of Climate Observing Systems. Panel on climate observing systems status. Climate Research Committee, National Research Council, National Academies Press. Nystuen, J.A. 1999. Relative performance of automatic rain gauges under differental rainfall conditions. Journal of Atmospheric and Oceanic Technology, 16(8):1025-1043, Phillips, O., Y. Malhi, et al. 1998. Changes in the Carbon Balance of Tropical Forests: Evidence from Long-Term Plots. Science 228822: 439-442. Phillips, O. et al. 2009. Drought sensitivity of the Amazon rainforest. Science 332233((55991199)):1344-1347.
60 TEAM Climate Monitoring Protocol 3.1
Röckstrom, J. et al. 2009. A safe operating space for humanity. Nature 461:472-475. Root, T. L. and S. H. Schneider.1995. Ecology and Climate: Research Strategies and Implications. Science 226699. WMO. 2003. Guidelines on climate observation networks and systems. WMO/TD 1185.
http://www.wmo.int/pages/prog/wcp/wcdmp/documents/WCDMP-52_000.pdf WMO. 2008. Guide to Meteorological Instruments and Methods of Observation. 8. World Metereological Organization. Wright, J. 2005. Tropical Forests in a changing environment. Trends in Ecology and Evolution, 20(10): 553-560.
TEAM Climate Monitoring Protocol 3.1 61
8 GGLLOOSSSSAARRYY
AAiirr TTeemmppeerraattuurree. Refers to the surface air temperature without the influence of direct solar radiation. Also defined as the temperature reading by a thermometer placed in a shaded shelter 1-2 m above the ground. AAssppiirraatteedd RRaaddiiaatt iioonn SShhiieelldd.. (see Radiation Shield) AAWWGG.. American Wire Gauge, which is a standardized way to measure wire diameter for round, electrical, solid, conducting wire. The lower the AWG, the thicker the wire. For more information and a table of physical and electrical properties of wires of different gauges see http://en.wikipedia.org/wiki/American_wire_gauge . BBaatt tteerryy.. A rechargeable battery is an essential component of the climate station that allows it to work during cloudy conditions and at night. We recommend using a 12 V DC 100 Amp-h sealed battery to provide enough charge for the system, in particular the aspirated radiation shield (consumes 450 mA or 6 Amp-h in a 24 h period). The battery should be enclosed in a enclosure that allows some flow of air (and avoid hydrogen gas buildup) but sturdy enough to protect it from the elements (rain, heat). CCaall iibbrraatt iioonn.. A process to adjust measurements from a sensor to a universally defined standard of measurement. For example, a thermometer can be calibrated by measuring the boiling point of distilled water at 0 m above sea level and re-setting this value to 100 °C. Each sensor follows specific calibration procedures at defined intervals of time to minimize measurement bias. CChhaarrggee rreegguullaattoorr.. A device that maintains a load voltage nearly constant over a range of variations of input voltage and current. A charge regulator is installed between the solar panel and the battery to charge it in full without overcharge in varying conditions while preventing reverse current during the night (from the battery to the solar panel).
CCll iimmaattee PPrroottooccooll MMaaiinntteennaannccee LLooggss.. Field forms to verify and collect information about the physical status of a climate station. This includes condition of the climate base and its surrounding area, the data logger and enclosure, the sensors and the power sources of the climate station. Climate logs should be filled every 2-4 weeks. CCll iimmaattee SSttaatt iioonn. The climate station is defined here as the set of sensors, data logger, power supplies and physical base (tower/tripod) that is assembled to monitor climatological variables continuously at a fixed point in space. DDaattaa LLooggggeerr. Computer that receives signals (electrical, pulse, etc) from the sensors and transforms them into measurements with units (°C, mm, etc) over an integrated period of time. The datalogger can also regulate the function of some sensors or instruments by providing or cutting power to them as applicable.
62 TEAM Climate Monitoring Protocol 3.1
DDaattaa LLooggggeerr PPrrooggrraamm//SSccrr iipptt .. Compiled script or computer program that instructs the data logger where each sensor is connected, the frequency of data collection (e.g. every 5 sec), the interval of measurement report (e.g. 5 min), and what to do with the different variables for each interval (e.g. calculate an average, total, minimum, standard deviation, etc). TEAM uses a standardized script to ensure data collection is uniform across climate stations in the network. DDaattaa MMaannaaggeemmeenntt TTooooll .. An internet portal that is used for uploading data. The system stores all of the information that is required by this protocol in an easy to access system. In addition to storing site maintenance and spatial information, there are also separate tabs for describing the site, uploading images, managing sensors, and recording height profiles as well as manual rainfall measurements. DDaattaa UUppllooaadd.. Process of transferring information (from a data logger, Excel sheet, a maintenance log, etc) to the TEAM portal through a predefined process (e.g. DeskTEAM). The data received is checked for basic consistency before being incorporated into the TEAM database. EEnncclloossuurree.. Special box that houses the data logger and other sensitive components of the climate station. GGrroouunnddiinngg.. Process to protect the climate tower from lightning and/or the accumulation of static electricity. The base tower is protected with a rod that routes potential lightning strikes to the ground through a 4 AWG cable (copper cable 5.19 mm diameter). The data logger and enclosure are also grounded to this same cable to discharge them from static electricity through a 12 AWG cable (copper cable 2.05 mm diameter). MMeemmoorryy CCaarrdd.. Device to store climate data collected by the data logger (usually a 32-64 MB Compact Flash card). The data logger partitions the memory card in a special way to maximize the amount of data stored. MMeettaaddaattaa.. Data about other data. In general, metadata is structured or standardized using a scheme to capture it and make it interchangeable and easily readable. Climate metadata includes details about the sensors (e.g. type, make, model, calibration, etc.), the data logger (model, firmware version, etc.), the climate station (latitude, longitude, start date, maintenance information records). TEAM uses the Ecological Metadata Language (EML) standards. PPCC220000WW SSooff ttwwaarree.. Software provided by Campbell Scientific to program a data logger, extract data from it and visualize it. TEAM uses PC200W to initially setup the time in the data logger, load the TEAM climate data collection script and extract data from the data logger or a memory card. PPrreecciippii ttaatt iioonn.. Quantitative measurement of rainfall during a specified time interval. Rainfall is usually measured in linear units (e.g. mm/time) to standardize for capture area; volume of water (cm3) / area of capture (cm2) per unit time 10. TEAM uses a tipping bucket that sends a pulse signal to the data logger for every 0.25 mm of rain captured. PPyyrraannoommeetteerr. Instrument to measure the heating power of radiation, in particular of radiation coming from the sun (300-2800 nm). The pyranometer measures solar radiation flux density (watts/m2) from a field of view of 180 degrees. Solar radiation measurements usually vary as a function of sun position, season, cloud cover, atmospheric composition and any other physical/chemical variables that filter irradiance.
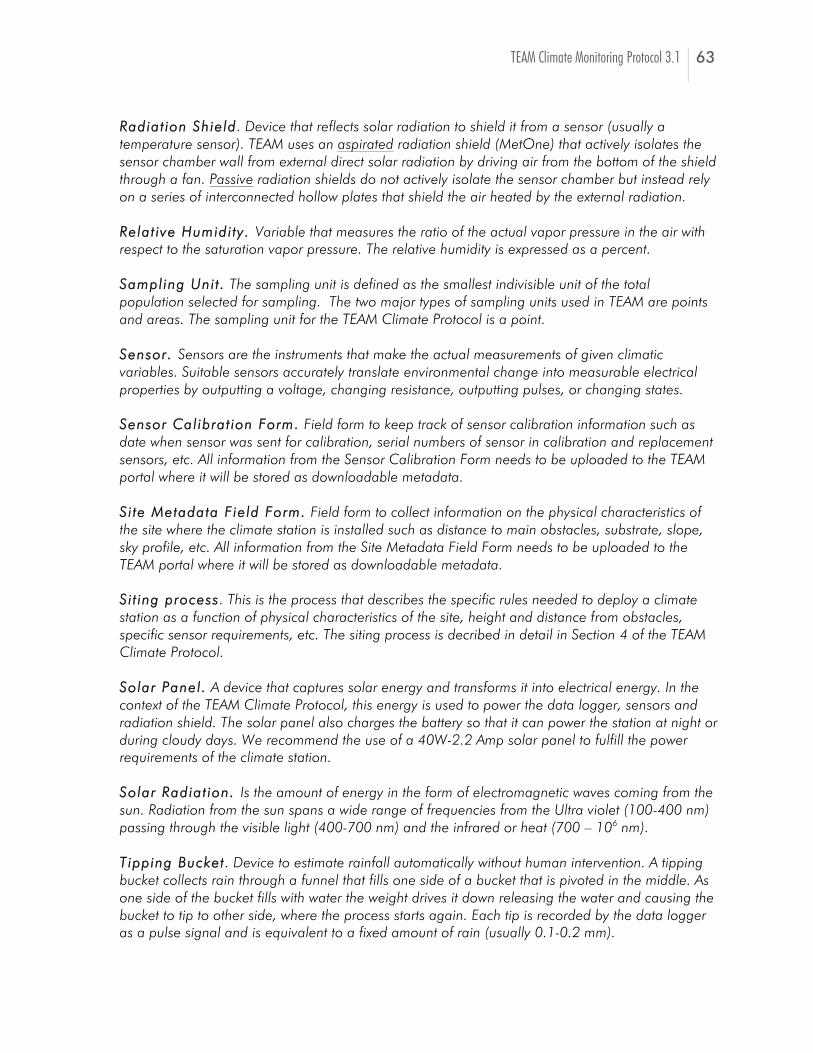
TEAM Climate Monitoring Protocol 3.1 63
RRaaddiiaatt iioonn SShhiieelldd. Device that reflects solar radiation to shield it from a sensor (usually a temperature sensor). TEAM uses an aspirated radiation shield (MetOne) that actively isolates the sensor chamber wall from external direct solar radiation by driving air from the bottom of the shield through a fan. Passive radiation shields do not actively isolate the sensor chamber but instead rely on a series of interconnected hollow plates that shield the air heated by the external radiation. RReellaatt iivvee HHuummiiddii ttyy.. Variable that measures the ratio of the actual vapor pressure in the air with respect to the saturation vapor pressure. The relative humidity is expressed as a percent. SSaammppll iinngg UUnnii tt .. The sampling unit is defined as the smallest indivisible unit of the total population selected for sampling. The two major types of sampling units used in TEAM are points and areas. The sampling unit for the TEAM Climate Protocol is a point. SSeennssoorr.. Sensors are the instruments that make the actual measurements of given climatic variables. Suitable sensors accurately translate environmental change into measurable electrical properties by outputting a voltage, changing resistance, outputting pulses, or changing states. SSeennssoorr CCaall iibbrraatt iioonn FFoorrmm.. Field form to keep track of sensor calibration information such as date when sensor was sent for calibration, serial numbers of sensor in calibration and replacement sensors, etc. All information from the Sensor Calibration Form needs to be uploaded to the TEAM portal where it will be stored as downloadable metadata. SSii ttee MMeettaaddaattaa FFiieelldd FFoorrmm.. Field form to collect information on the physical characteristics of the site where the climate station is installed such as distance to main obstacles, substrate, slope, sky profile, etc. All information from the Site Metadata Field Form needs to be uploaded to the TEAM portal where it will be stored as downloadable metadata. SSii tt iinngg pprroocceessss. This is the process that describes the specific rules needed to deploy a climate station as a function of physical characteristics of the site, height and distance from obstacles, specific sensor requirements, etc. The siting process is decribed in detail in Section 4 of the TEAM Climate Protocol. SSoollaarr PPaanneell .. A device that captures solar energy and transforms it into electrical energy. In the context of the TEAM Climate Protocol, this energy is used to power the data logger, sensors and radiation shield. The solar panel also charges the battery so that it can power the station at night or during cloudy days. We recommend the use of a 40W-2.2 Amp solar panel to fulfill the power requirements of the climate station. SSoollaarr RRaaddiiaatt iioonn.. Is the amount of energy in the form of electromagnetic waves coming from the sun. Radiation from the sun spans a wide range of frequencies from the Ultra violet (100-400 nm) passing through the visible light (400-700 nm) and the infrared or heat (700 – 106 nm). TTiippppiinngg BBuucckkeett . Device to estimate rainfall automatically without human intervention. A tipping bucket collects rain through a funnel that fills one side of a bucket that is pivoted in the middle. As one side of the bucket fills with water the weight drives it down releasing the water and causing the bucket to tip to other side, where the process starts again. Each tip is recorded by the data logger as a pulse signal and is equivalent to a fixed amount of rain (usually 0.1-0.2 mm).

64 TEAM Climate Monitoring Protocol 3.1
TToowweerr ((BBaassee ttoowweerr)) . Refers to a structure that houses the sensors, the enclosure, the solar panel and the battery. TEAM uses a 3 m aluminum tower (UT-10, Campbell Scientific) with a lightning rod and ground cable. CCoorree AArreeaa.. Defined as the area (25-30 m2) where the climate station (tower, sensors and tipping buckets) is contained. The core area should be regularly maintained and fenced for security and to avoid intrusion of animals.
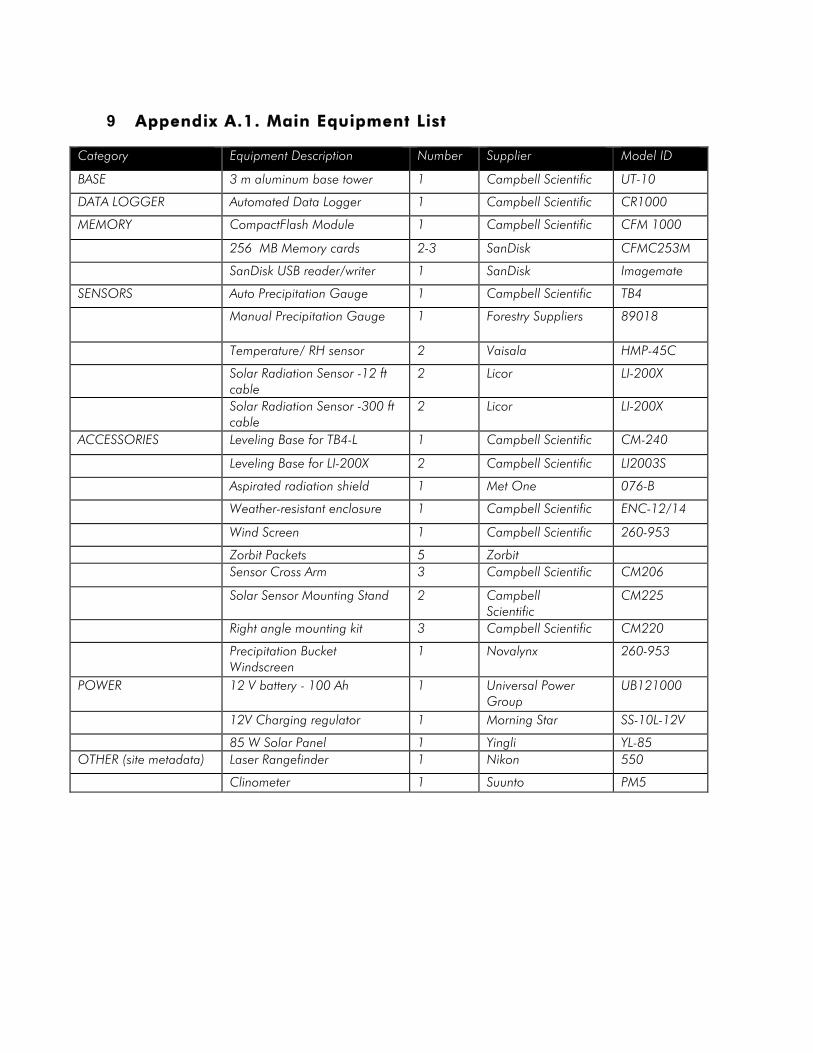
9 AAppppeennddiixx AA..11.. MMaaiinn EEqquuiippmmeenntt LLiisstt
Category Equipment Description Number Supplier Model ID
BASE 3 m aluminum base tower 1 Campbell Scientific UT-10
DATA LOGGER Automated Data Logger 1 Campbell Scientific CR1000
MEMORY CompactFlash Module 1 Campbell Scientific CFM 1000
256 MB Memory cards 2-3 SanDisk CFMC253M
SanDisk USB reader/writer 1 SanDisk Imagemate
SENSORS Auto Precipitation Gauge 1 Campbell Scientific TB4
Manual Precipitation Gauge 1 Forestry Suppliers 89018
Temperature/ RH sensor 2 Vaisala HMP-45C
Solar Radiation Sensor -12 ft cable
2 Licor LI-200X
Solar Radiation Sensor -300 ft cable
2 Licor LI-200X
ACCESSORIES Leveling Base for TB4-L 1 Campbell Scientific CM-240
Leveling Base for LI-200X 2 Campbell Scientific LI2003S
Aspirated radiation shield 1 Met One 076-B
Weather-resistant enclosure 1 Campbell Scientific ENC-12/14
Wind Screen 1 Campbell Scientific 260-953
Zorbit Packets 5 Zorbit Sensor Cross Arm 3 Campbell Scientific CM206
Solar Sensor Mounting Stand 2 Campbell Scientific
CM225
Right angle mounting kit 3 Campbell Scientific CM220
Precipitation Bucket Windscreen
1 Novalynx 260-953
POWER 12 V battery - 100 Ah 1 Universal Power Group
UB121000
12V Charging regulator 1 Morning Star SS-10L-12V
85 W Solar Panel 1 Yingli YL-85 OTHER (site metadata) Laser Rangefinder 1 Nikon 550
Clinometer 1 Suunto PM5

10 AAppppeennddiixx AA..22.. SSiittee MMeettaaddaattaa FFiieelldd FFoorrmm
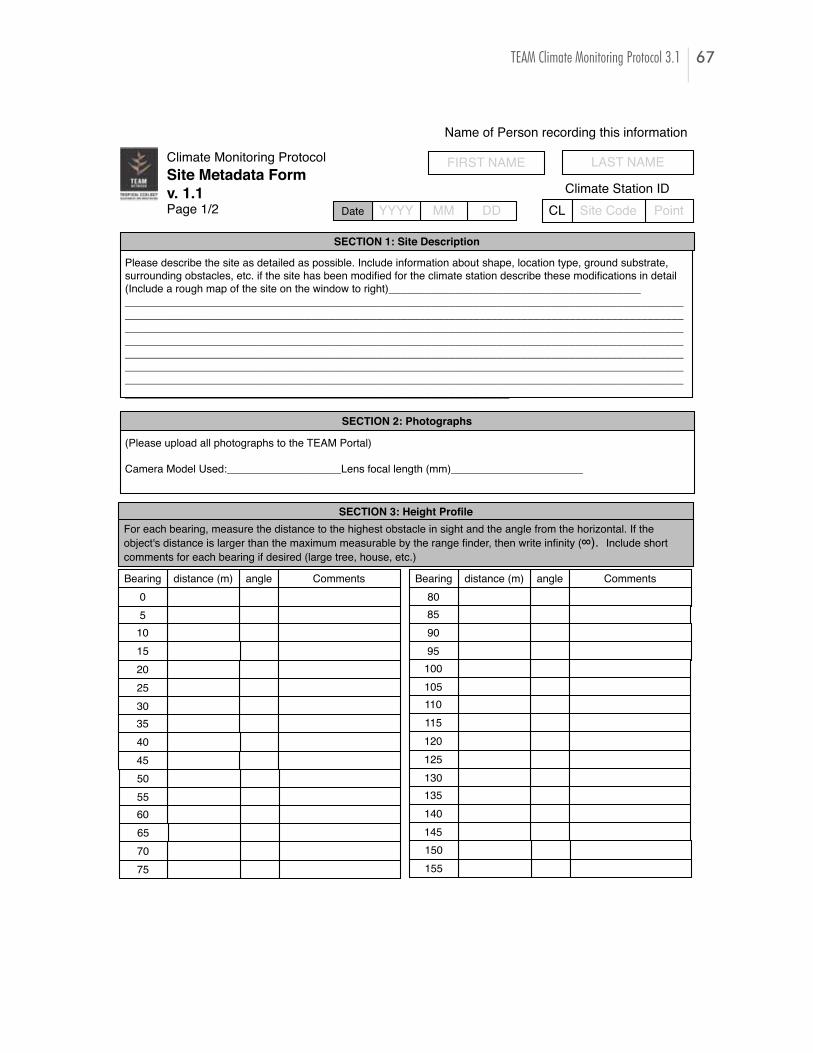
TEAM Climate Monitoring Protocol 3.1 67
(Please upload all photographs to the TEAM Portal) Camera Model Used:___________________Lens focal length (mm)______________________
Climate Monitoring ProtocolSite Metadata Form
v. 1.1
Page 1/2Climate Station ID
FIRST NAME LAST NAME
Name of Person recording this information
SECTION 1: Site Description
Please describe the site as detailed as possible. Include information about shape, location type, ground substrate, cations in detail
(Include a rough map of the site on the window to right)_____________________________________________________________________________________________________________________________________________________________________________________________________________________________________________________________________________________________________________________________________________________________________________________________________________________________________________________________________________________________________________________________________________________________________________________________________________________________________________________________________________________________________________________________________________________________________________________
angledistance (m)Bearing
CL PointSite CodeDDMMYYYYDate
SECTION 2: Photographs
le
For each bearing, measure the distance to the highest obstacle in sight and the angle from the horizontal. If the nder nity ( ). Include short
comments for each bearing if desired (large tree, house, etc.)
Comments05
1015202530354045
angledistance (m)Bearing Comments
505560657075
80859095
100105110115120125130135140145150155
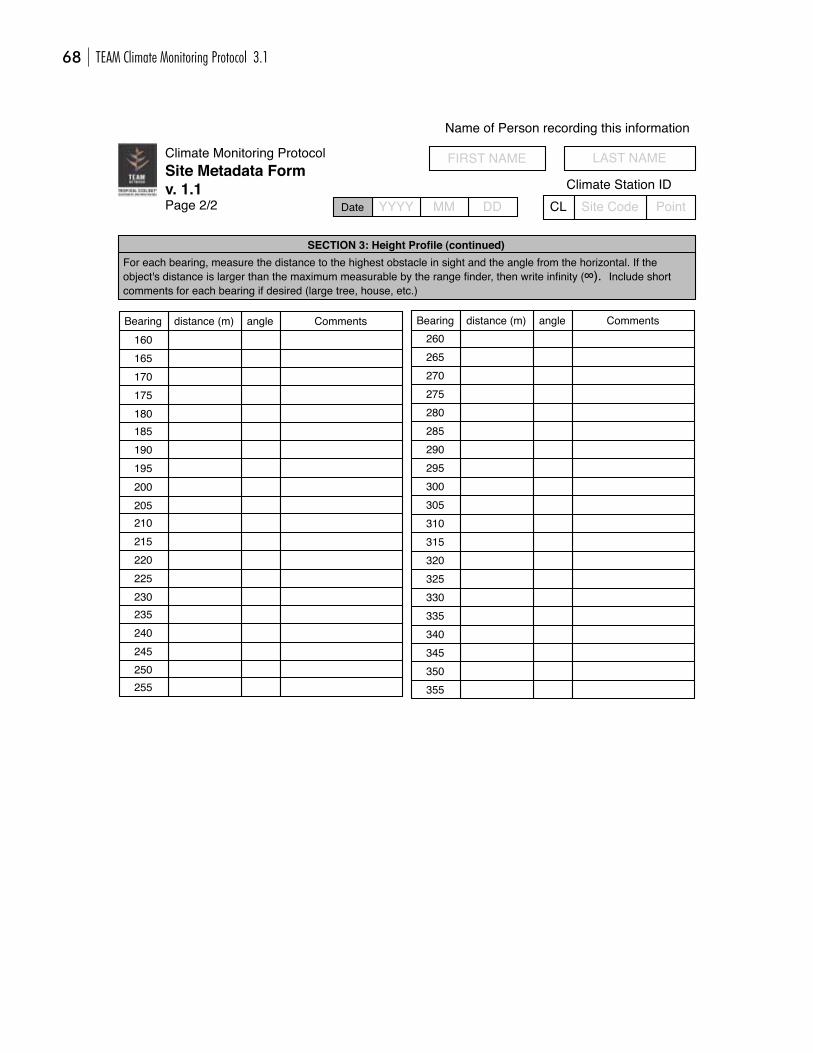
68 TEAM Climate Monitoring Protocol 3.1
Climate Monitoring ProtocolSite Metadata Formv. 1.1Page 2/2
Climate Station ID
FIRST NAME LAST NAME
Name of Person recording this information
CL PointSite CodeDDMMYYYYDate
250255 355
350345340335330325320315310305300295290285280275270265260160
165170175180185190195200205210215220225230235240245
le (continued)For each bearing, measure the distance to the highest obstacle in sight and the angle from the horizontal. If the
nder nity ( ). Include short comments for each bearing if desired (large tree, house, etc.)
angledistance (m)Bearing Comments Bearing angle Commentsdistance (m)

TEAM Climate Monitoring Protocol 3.1 69
11 AAppppeennddiixx AA..33.. CClliimmaattee PPrroottooccooll MMaaiinntteennaannccee LLoogg
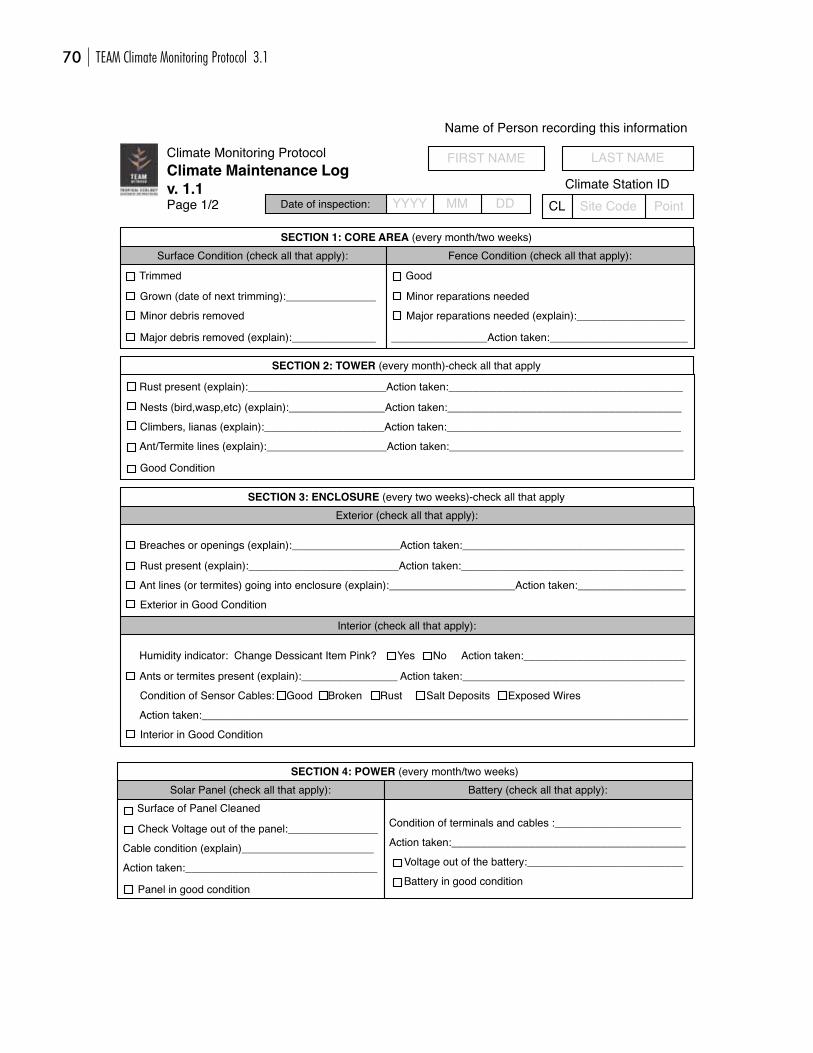
70 TEAM Climate Monitoring Protocol 3.1
Climate Monitoring ProtocolClimate Maintenance Logv. 1.1Page 1/2
Climate Station ID
FIRST NAME LAST NAME
Name of Person recording this information
SECTION 1: CORE AREA (every month/two weeks)
DDMMYYYYDate of inspection:
Surface Condition (check all that apply):
Trimmed
Grown (date of next trimming):_______________
Minor debris removed
Major debris removed (explain):______________
Fence Condition (check all that apply):
Good
Minor reparations needed
Major reparations needed (explain):__________________
________________Action taken:_______________________
SECTION 2: TOWER (every month)-check all that apply
CL PointSite Code
SECTION 3: ENCLOSURE (every two weeks)-check all that applyExterior (check all that apply):
Rust present (explain):_______________________Action taken:_______________________________________
Nests (bird,wasp,etc) (explain):________________Action taken:_______________________________________
Climbers, lianas (explain):____________________Action taken:_______________________________________
Ant/Termite lines (explain):____________________Action taken:_______________________________________
Good Condition
Breaches or openings (explain):__________________Action taken:_____________________________________
Rust present (explain):_________________________Action taken:_____________________________________
Ant lines (or termites) going into enclosure (explain):_____________________Action taken:__________________
Exterior in Good Condition
Interior (check all that apply):
Humidity indicator: Change Dessicant Item Pink? Yes No Action taken:___________________________
Ants or termites present (explain):________________ Action taken:_____________________________________
Condition of Sensor Cables: Good Broken Rust Salt Deposits Exposed Wires
Action taken:_________________________________________________________________________________
Interior in Good Condition
SECTION 4: POWER (every month/two weeks)Solar Panel (check all that apply):
Surface of Panel Cleaned
Check Voltage out of the panel:_______________
Cable condition (explain)______________________
Action taken:________________________________
Panel in good condition
Battery (check all that apply):
Condition of terminals and cables :_____________________
Action taken:_______________________________________
Voltage out of the battery:__________________________
Battery in good condition
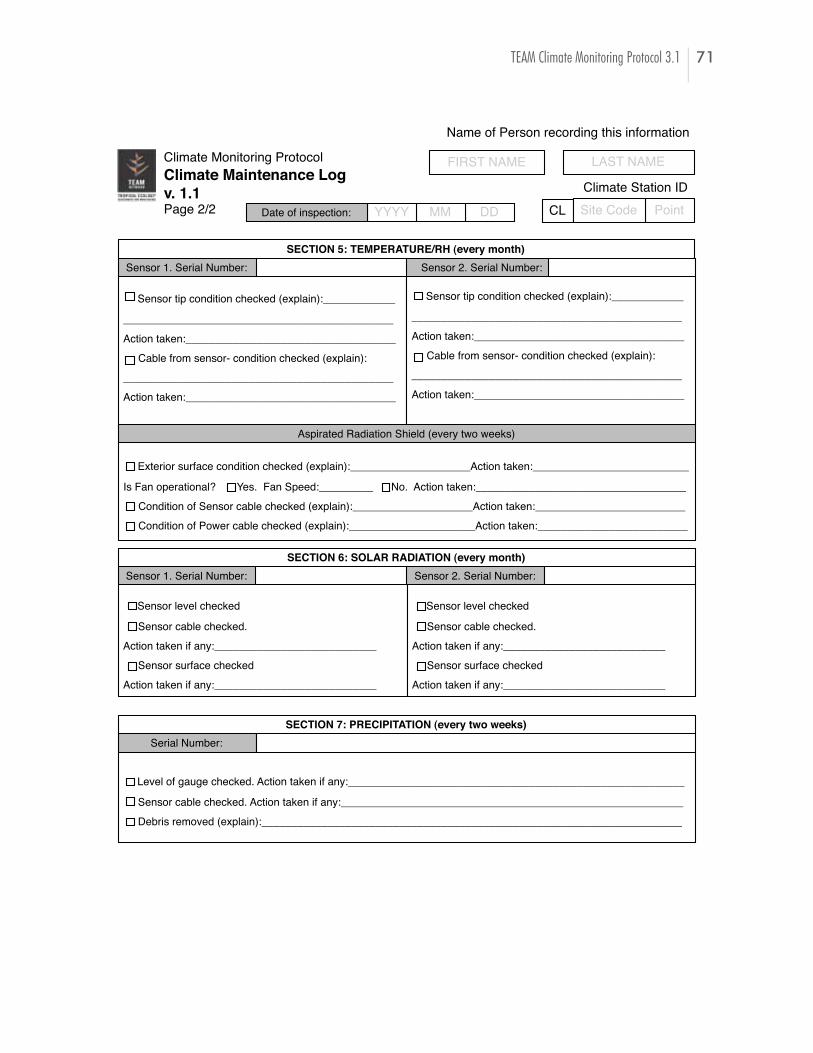
TEAM Climate Monitoring Protocol 3.1 71
Level of gauge checked. Action taken if any:________________________________________________________
Sensor cable checked. Action taken if any:_________________________________________________________
Debris removed (explain):______________________________________________________________________
Exterior surface condition checked (explain):____________________Action taken:__________________________
Is Fan operational? Yes. Fan Speed:_________ No. Action taken:___________________________________
Condition of Sensor cable checked (explain):____________________Action taken:_________________________
Condition of Power cable checked (explain):_____________________Action taken:_________________________
Climate Monitoring ProtocolClimate Maintenance Logv. 1.1Page 2/2
Sensor tip condition checked (explain):____________
_____________________________________________
Action taken:___________________________________
Cable from sensor- condition checked (explain):
_____________________________________________
Action taken:___________________________________
Climate Station ID
FIRST NAME LAST NAME
Name of Person recording this information
CL PointSite Code
SECTION 5: TEMPERATURE/RH (every month)
DDMMYYYYDate of inspection:
Sensor 1. Serial Number:
Sensor tip condition checked (explain):____________
_____________________________________________
Action taken:___________________________________
Cable from sensor- condition checked (explain):
_____________________________________________
Action taken:___________________________________
Sensor 2. Serial Number:
Aspirated Radiation Shield (every two weeks)
SECTION 6: SOLAR RADIATION (every month)Sensor 1. Serial Number: Sensor 2. Serial Number:
Sensor level checked
Sensor cable checked.
Action taken if any:___________________________
Sensor surface checked
Action taken if any:___________________________
Sensor level checked
Sensor cable checked.
Action taken if any:___________________________
Sensor surface checked
Action taken if any:___________________________
SECTION 7: PRECIPITATION (every two weeks)Serial Number:

72 TEAM Climate Monitoring Protocol 3.1
12 AAppppeennddiixx AA..44.. SSeennssoorr IInnssttaallllaattiioonn//CCaalliibbrraattiioonn FFoorrmm
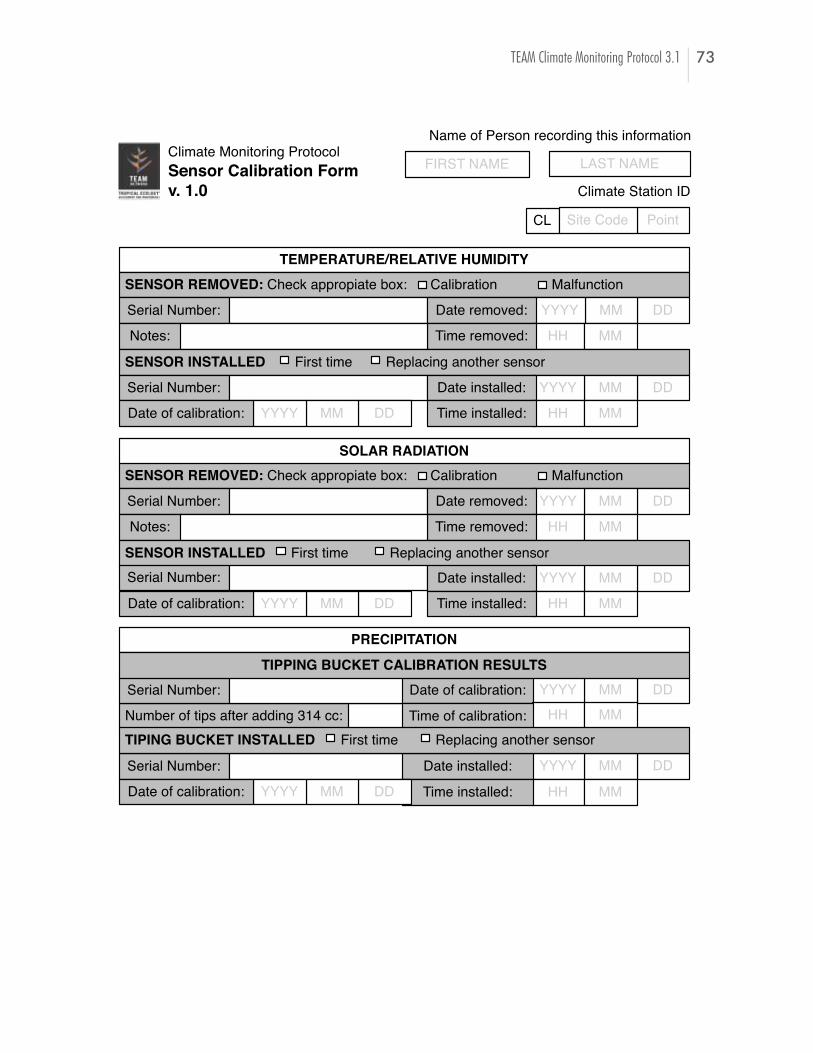
TEAM Climate Monitoring Protocol 3.1 73
Climate Monitoring ProtocolSensor Calibration Formv. 1.0
TEMPERATURE/RELATIVE HUMIDITYSENSOR REMOVED: Check appropiate box: Calibration Malfunction
Serial Number: DDMMYYYYDate removed:
HH MMTime removed:Notes:
SENSOR INSTALLED First time Replacing another sensor
Serial Number: DDMMYYYYDate installed:
HH MMTime installed:DDMMYYYYDate of calibration:
CL PointSite Code
Climate Station ID
FIRST NAME LAST NAME
Name of Person recording this information
SOLAR RADIATIONSENSOR REMOVED: Check appropiate box: Calibration Malfunction
Serial Number: DDMMYYYYDate removed:
HH MMTime removed:Notes:
SENSOR INSTALLED First time Replacing another sensorSerial Number: DDMMYYYYDate installed:
HH MMTime installed:DDMMYYYYDate of calibration:
PRECIPITATION
Number of tips after adding 314 cc:
Serial Number: DDMMYYYYDate of calibration:HH MMTime of calibration:
TIPPING BUCKET CALIBRATION RESULTS
Serial Number: DDMMYYYYDate installed:
HH MMTime installed:
TIPING BUCKET INSTALLED First time Replacing another sensor
DDMMYYYYDate of calibration:

74 TEAM Climate Monitoring Protocol 3.1
13 AAppppeennddiixx AA..55.. SSeennssoorr CCaalliibbrraattiioonn MMeettaaddaattaa FFoorrmm

TEAM Climate Monitoring Protocol 3.1 75
Climate Monitoring ProtocolSensor Calibration Metadata Formv. 1.0
SENSOR SENT OUT FOR CALIBRATIONSensor Type: Serial Number: DDMMYYYYDate sent:
Country:Address:
Phone Number: Estimated cost:
CL PointSite Code
Climate Station ID
FIRST NAME LAST NAME
Name of Person recording this information
Sensor Model:
CALIBRATED SENSOR RECEIVEDSensor Type: Serial Number: DDMMYYYYDate received:
Sensor Replaced?
cate #: Real cost:
Sensor Model:
Yes No
Notes:
Notes:
Please complete one of these forms for EACH sensor being calibrated. Completerst half of the form when sending the sensor out for calibration and then
complete the bottom half when the sensor has been received. Attach the calibrationcate provided by the vendor performing the calibration. Store this information
in the TEAM portal and keep a copy for the site's records.
Vendor performing calibration:

76 TEAM Climate Monitoring Protocol 3.1
14 AAppppeennddiixx AA..66.. MMaannuuaall RRaaiinnffaallll FFoorrmm

TEAM Climate Monitoring Protocol 3.1 77
Climate Monitoring ProtocolManual Rainfall collectionformv. 1.0 CL PointSite Code
Climate Station ID
FIRST NAME LAST NAME
Name of Person recording this information
Please measure rainfall in the manual bucket everytime you visit the station. Record the date the measurement was made (it could be accumulated for several days). If the rainfall bucket is full (both interior and exterior cylinders) please measure and add a "+" to the measurement. Store this information in the TEAM portal and keep a copy for the site's records.
CommentsYYYY DD Rainfall (mm)MM
31302928272625242322212019181716151413121110090807060504030201

78 TEAM Climate Monitoring Protocol 3.1
15 AAppppeennddiixx AA..77.. WWiirriinngg ddiiaaggrraammss
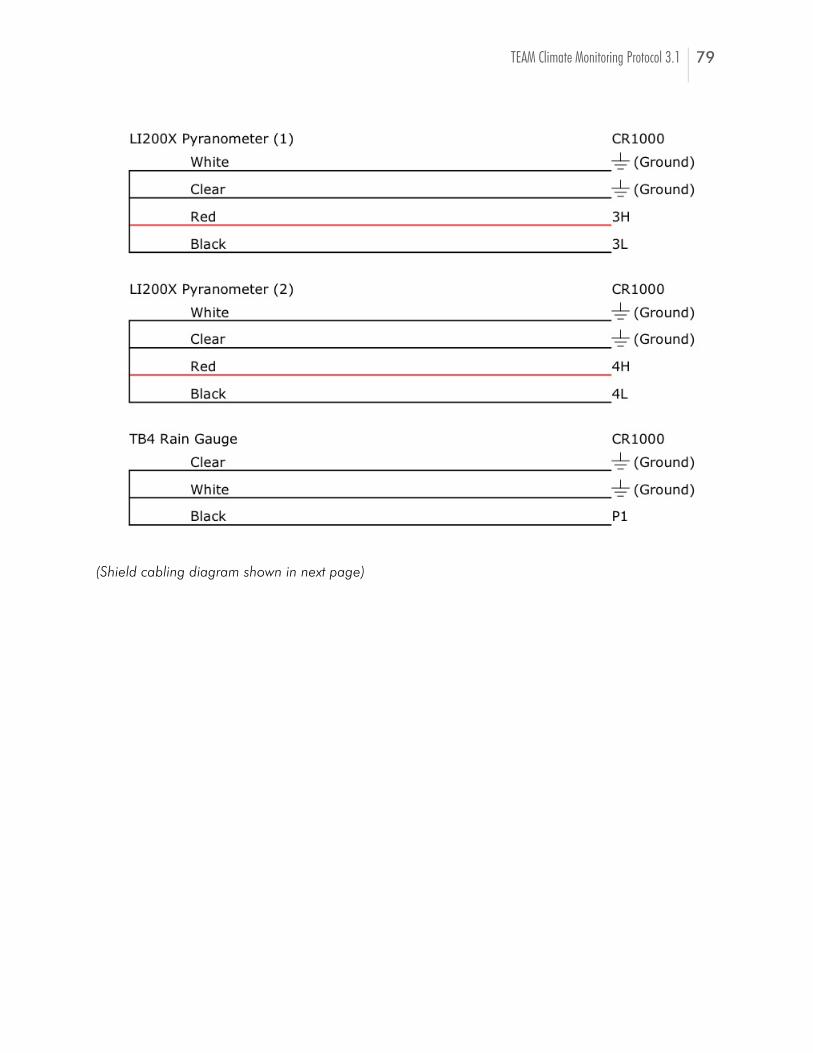
TEAM Climate Monitoring Protocol 3.1 79
(Shield cabling diagram shown in next page)
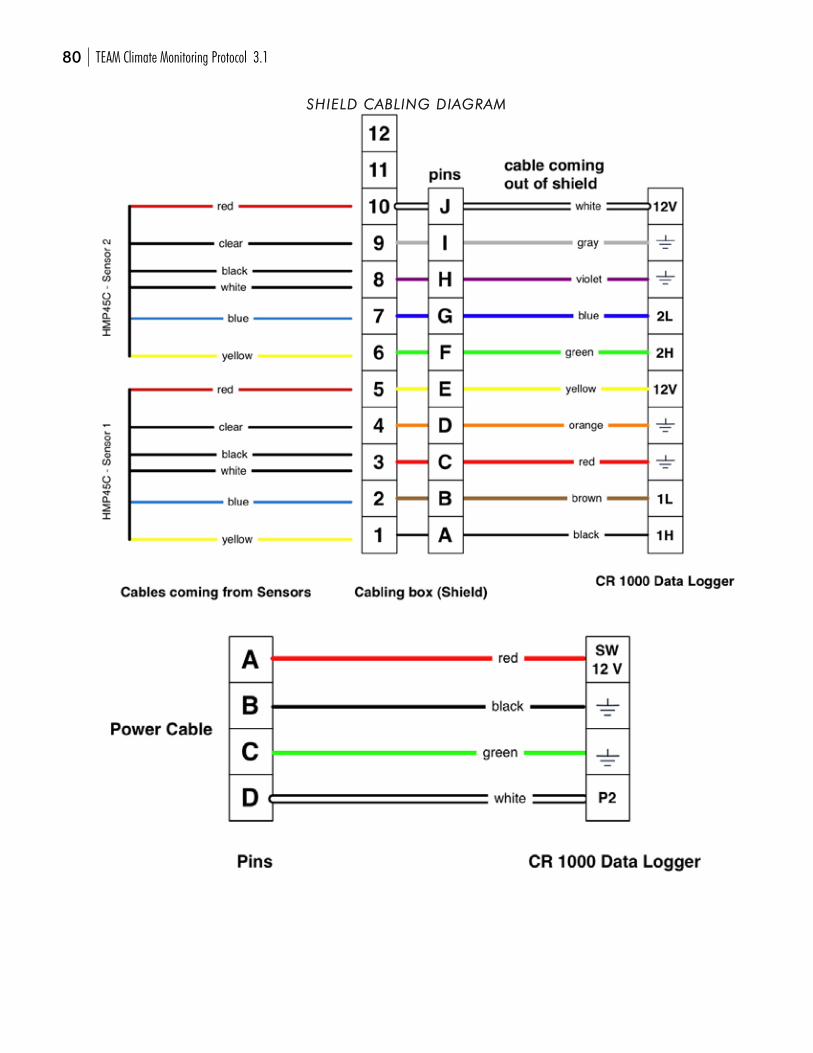
80 TEAM Climate Monitoring Protocol 3.1
SSHHIIEELLDD CCAABBLLIINNGG DDIIAAGGRRAAMM
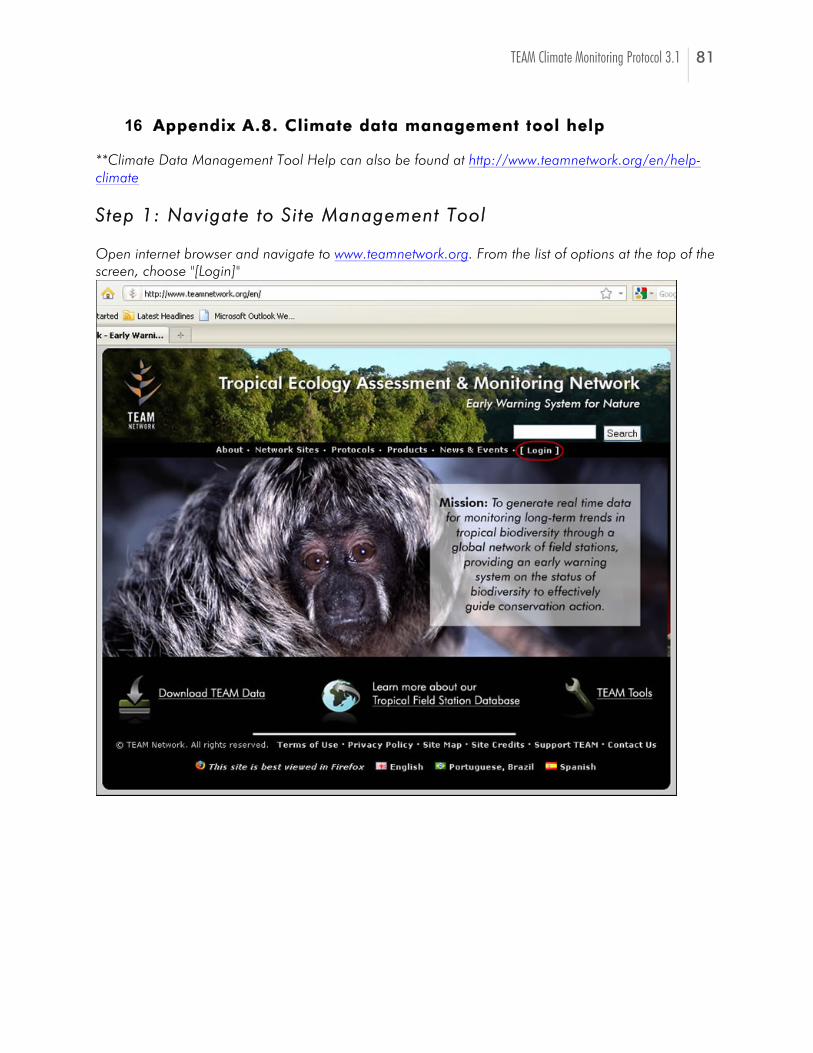
TEAM Climate Monitoring Protocol 3.1 81
16 AAppppeennddiixx AA..88.. CClliimmaattee ddaattaa mmaannaaggeemmeenntt ttooooll hheellpp
**Climate Data Management Tool Help can also be found at http://www.teamnetwork.org/en/help-climate SStteepp 11:: NNaavviiggaattee ttoo SSii ttee MMaannaaggeemmeenntt TTooooll
Open internet browser and navigate to www.teamnetwork.org. From the list of options at the top of the screen, choose "[Login]"
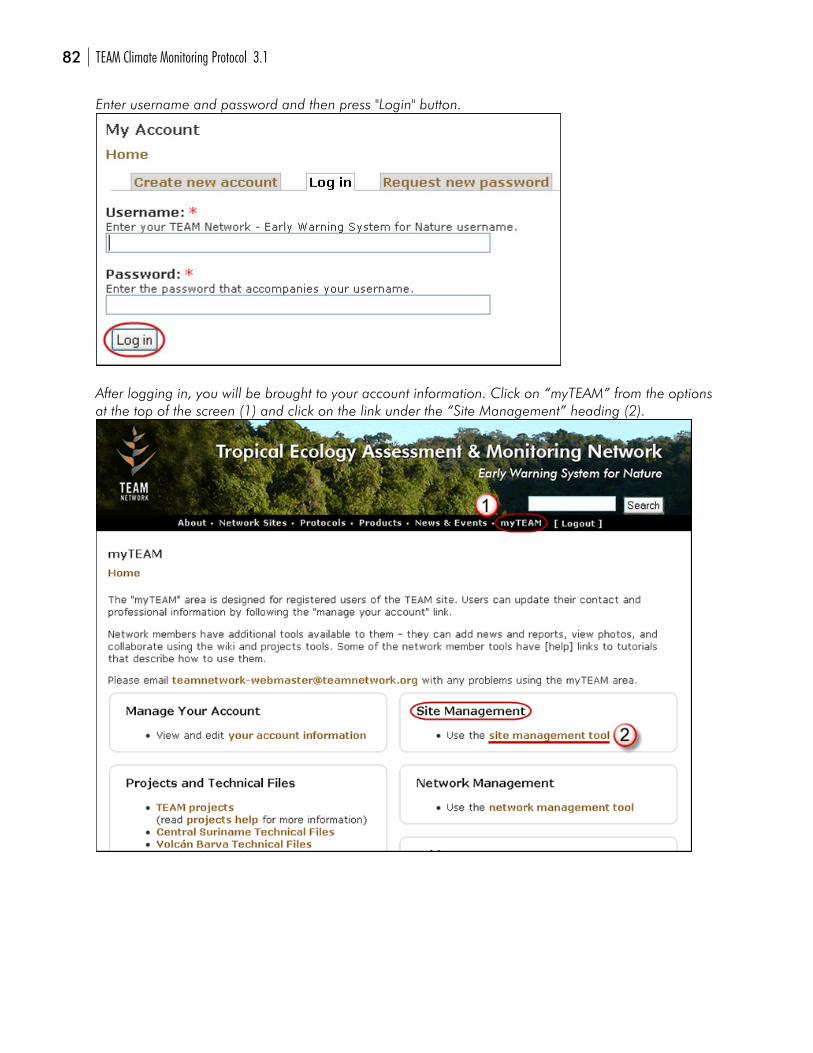
82 TEAM Climate Monitoring Protocol 3.1
Enter username and password and then press "Login" button.
After logging in, you will be brought to your account information. Click on “myTEAM” from the options at the top of the screen (1) and click on the link under the “Site Management” heading (2).
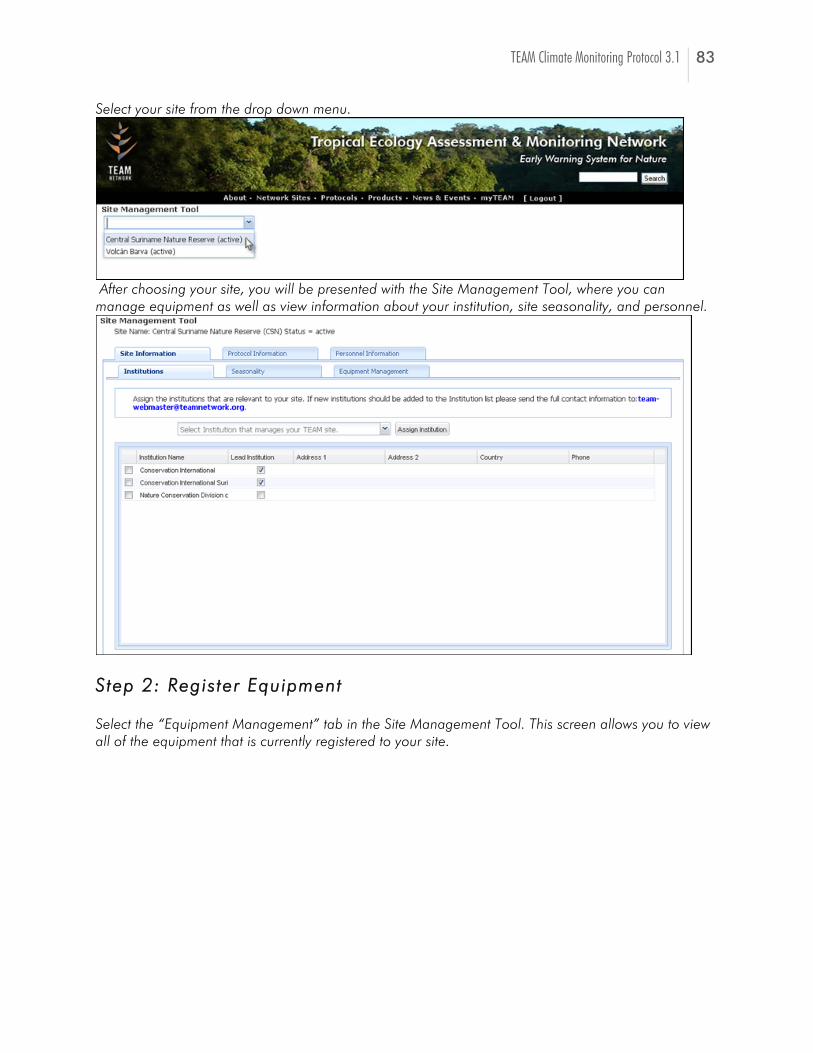
TEAM Climate Monitoring Protocol 3.1 83
Select your site from the drop down menu.
After choosing your site, you will be presented with the Site Management Tool, where you can manage equipment as well as view information about your institution, site seasonality, and personnel.
SStteepp 22:: RReeggiisstteerr EEqquuiippmmeenntt
Select the “Equipment Management” tab in the Site Management Tool. This screen allows you to view all of the equipment that is currently registered to your site.
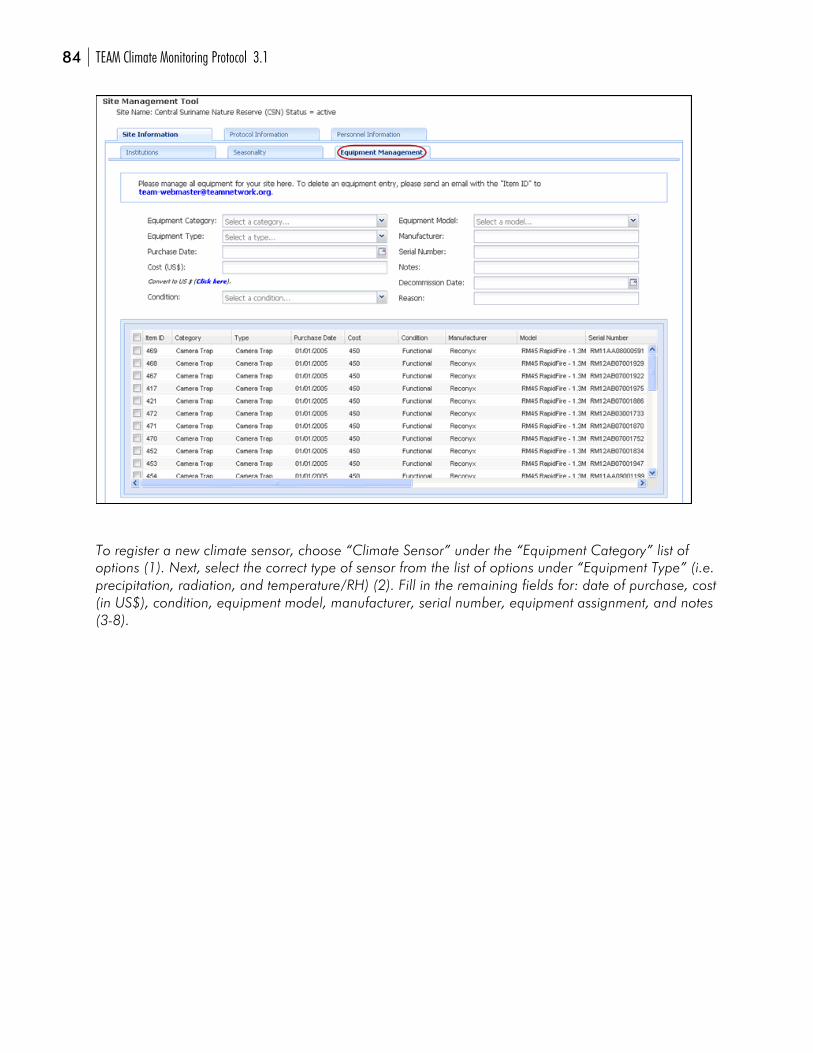
84 TEAM Climate Monitoring Protocol 3.1
To register a new climate sensor, choose “Climate Sensor” under the “Equipment Category” list of options (1). Next, select the correct type of sensor from the list of options under “Equipment Type” (i.e. precipitation, radiation, and temperature/RH) (2). Fill in the remaining fields for: date of purchase, cost (in US$), condition, equipment model, manufacturer, serial number, equipment assignment, and notes (3-8).
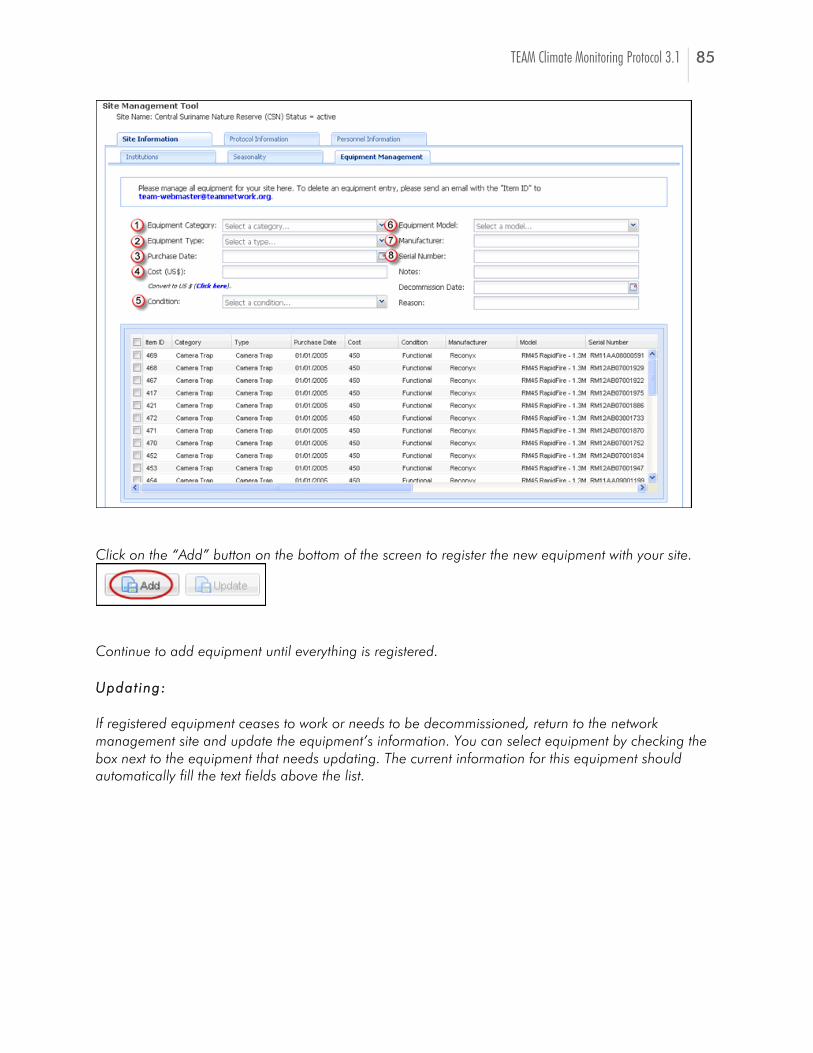
TEAM Climate Monitoring Protocol 3.1 85
Click on the “Add” button on the bottom of the screen to register the new equipment with your site.
Continue to add equipment until everything is registered.
UUppddaatt iinngg::
If registered equipment ceases to work or needs to be decommissioned, return to the network management site and update the equipment’s information. You can select equipment by checking the box next to the equipment that needs updating. The current information for this equipment should automatically fill the text fields above the list.
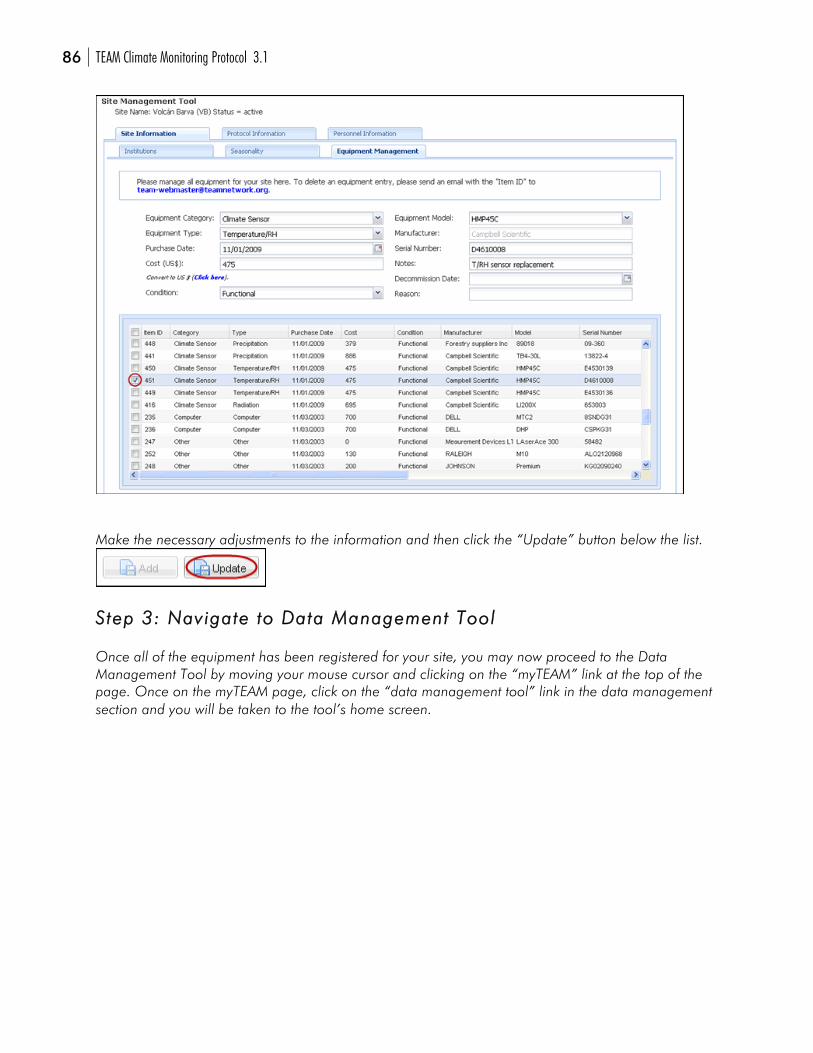
86 TEAM Climate Monitoring Protocol 3.1
Make the necessary adjustments to the information and then click the “Update” button below the list.
SStteepp 33:: NNaavviiggaattee ttoo DDaattaa MMaannaaggeemmeenntt TTooooll
Once all of the equipment has been registered for your site, you may now proceed to the Data Management Tool by moving your mouse cursor and clicking on the “myTEAM” link at the top of the page. Once on the myTEAM page, click on the “data management tool” link in the data management section and you will be taken to the tool’s home screen.
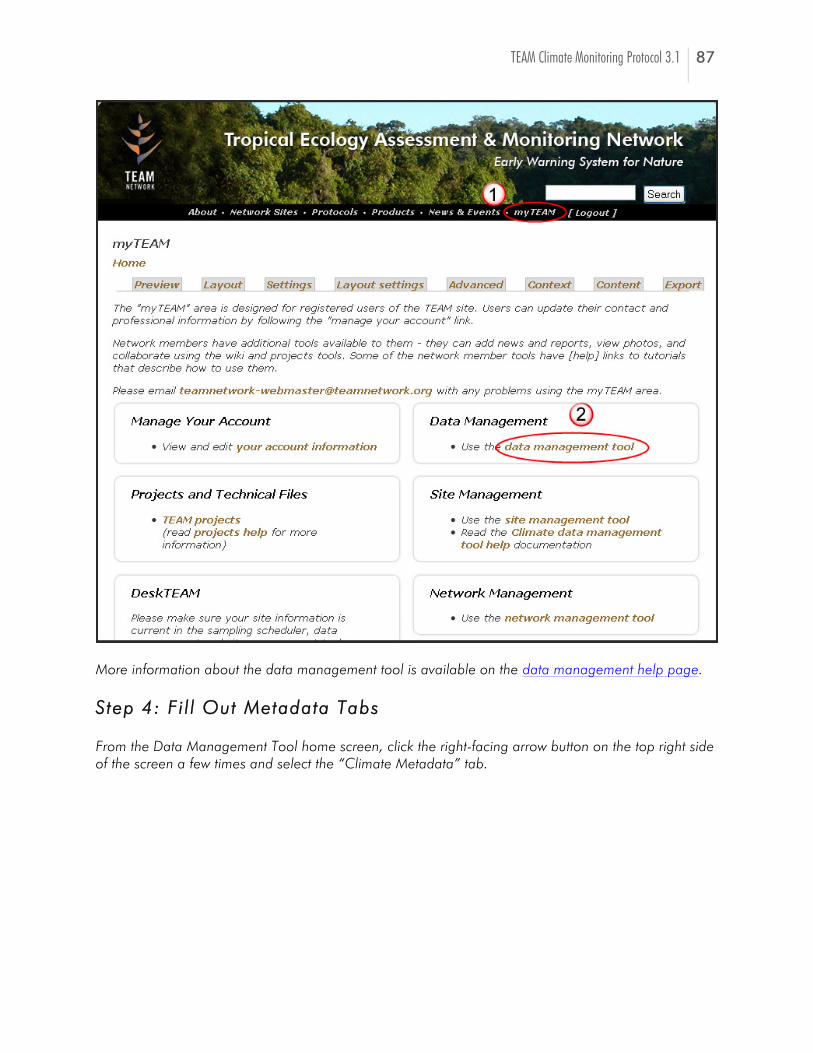
TEAM Climate Monitoring Protocol 3.1 87
More information about the data management tool is available on the data management help page.
SStteepp 44:: FFii ll ll OOuutt MMeettaaddaattaa TTaabbss
From the Data Management Tool home screen, click the right-facing arrow button on the top right side of the screen a few times and select the “Climate Metadata” tab.
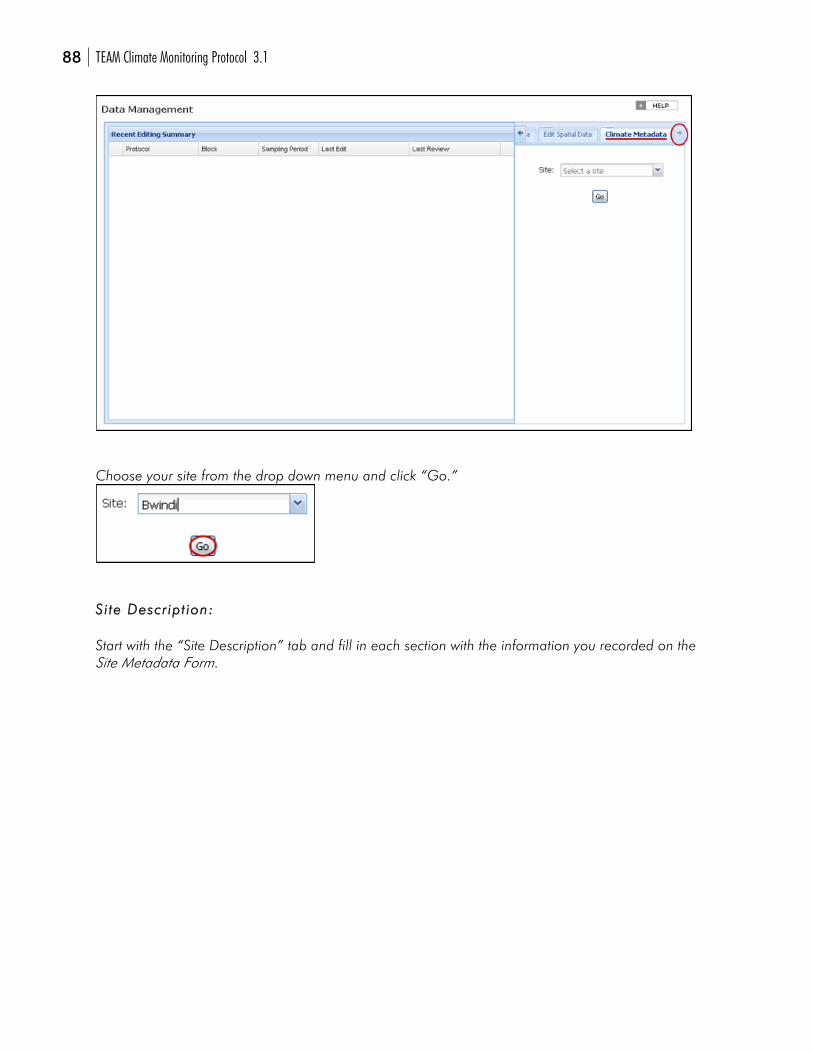
88 TEAM Climate Monitoring Protocol 3.1
Choose your site from the drop down menu and click “Go.”
SSii ttee DDeessccrr iipptt iioonn::
Start with the “Site Description” tab and fill in each section with the information you recorded on the Site Metadata Form.
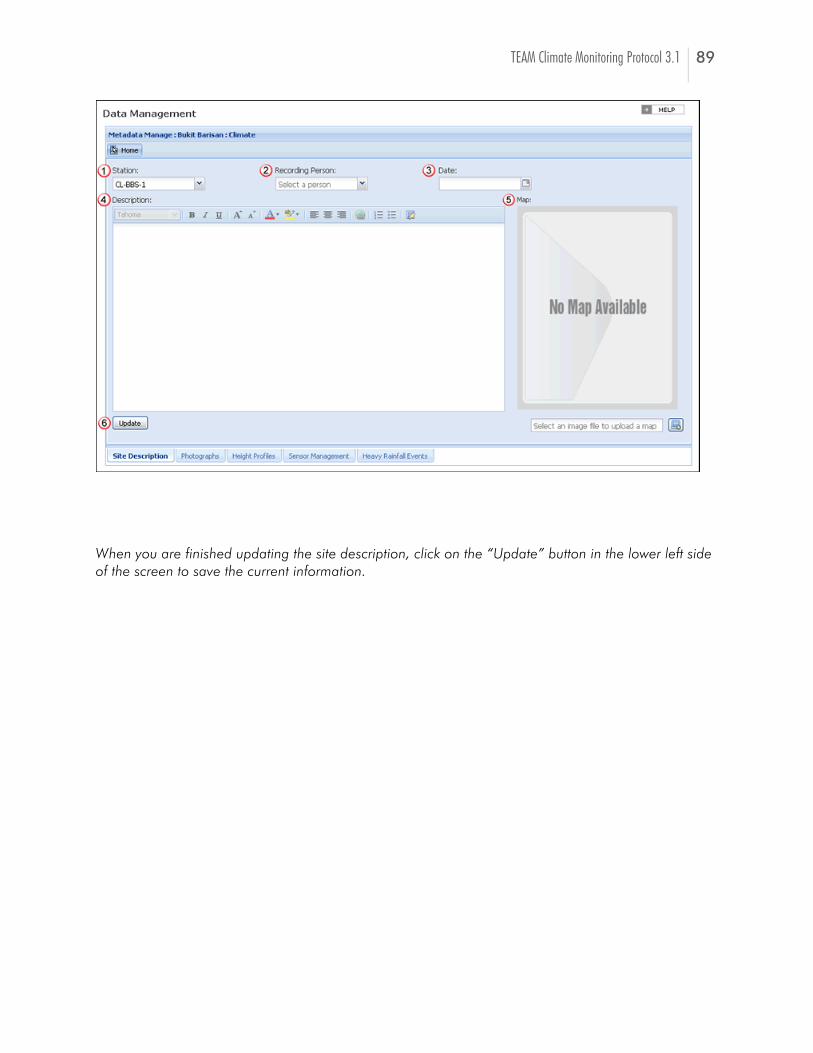
TEAM Climate Monitoring Protocol 3.1 89
When you are finished updating the site description, click on the “Update” button in the lower left side of the screen to save the current information.
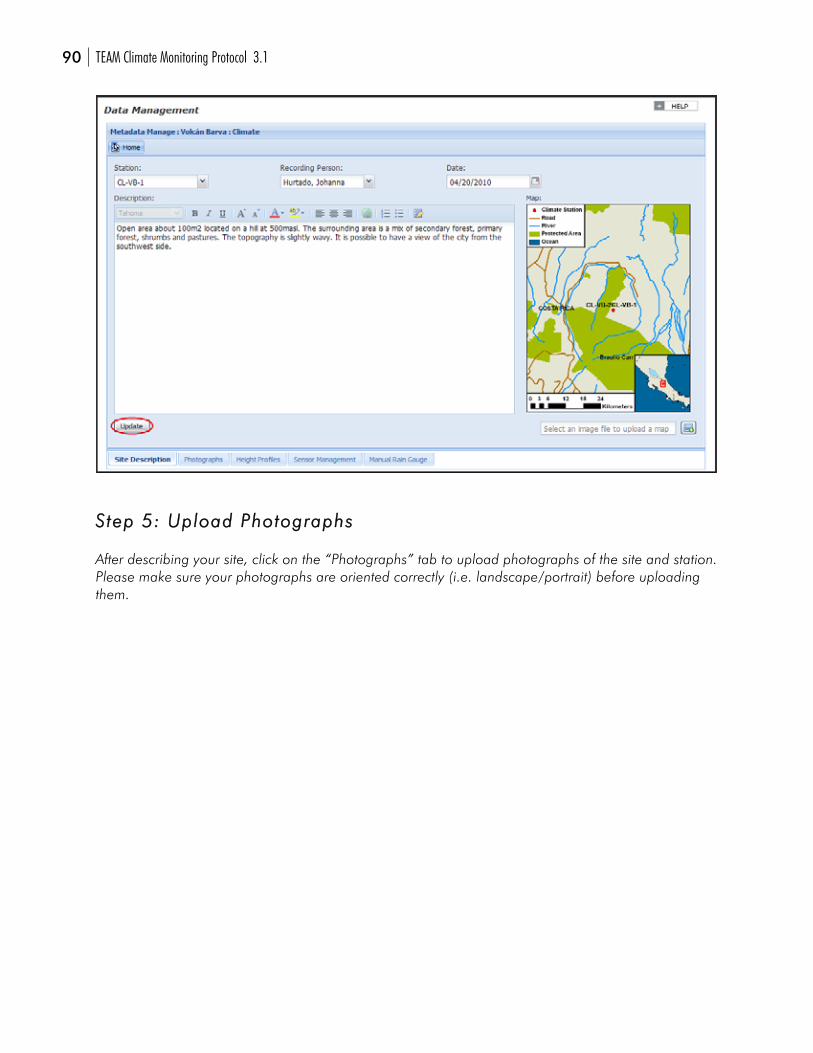
90 TEAM Climate Monitoring Protocol 3.1
SStteepp 55:: UUppllooaadd PPhhoottooggrraapphhss
After describing your site, click on the “Photographs” tab to upload photographs of the site and station. Please make sure your photographs are oriented correctly (i.e. landscape/portrait) before uploading them.
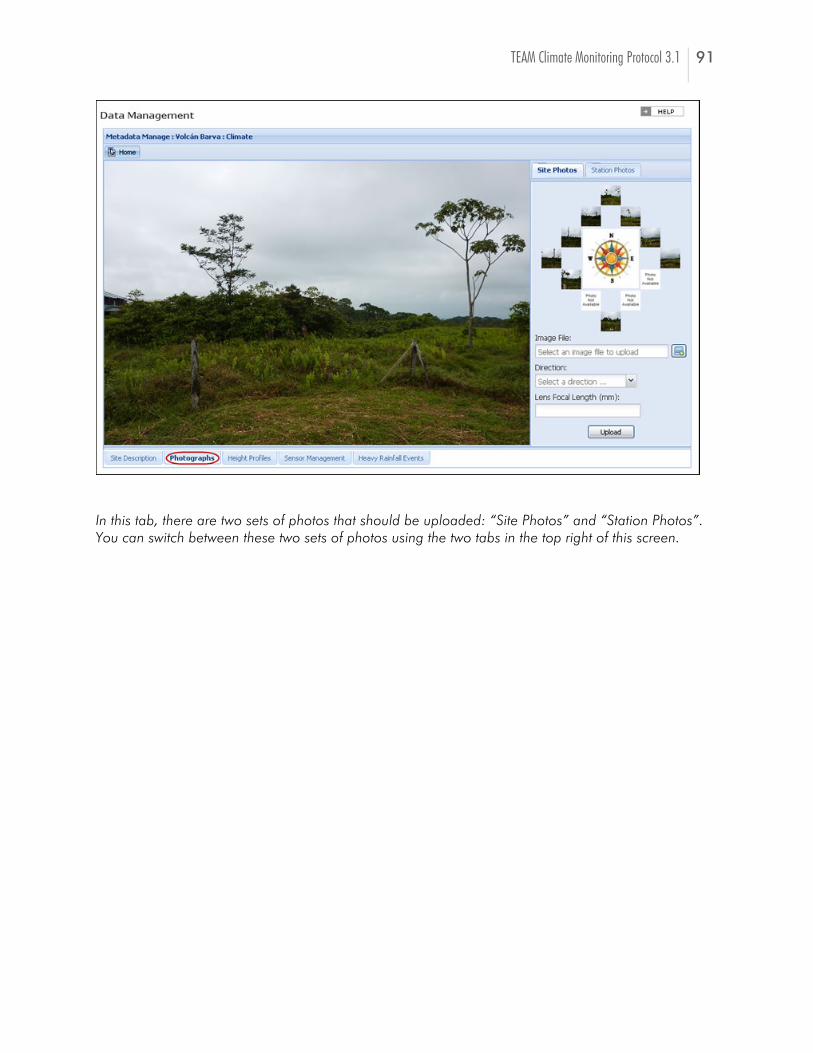
TEAM Climate Monitoring Protocol 3.1 91
In this tab, there are two sets of photos that should be uploaded: “Site Photos” and “Station Photos”. You can switch between these two sets of photos using the two tabs in the top right of this screen.
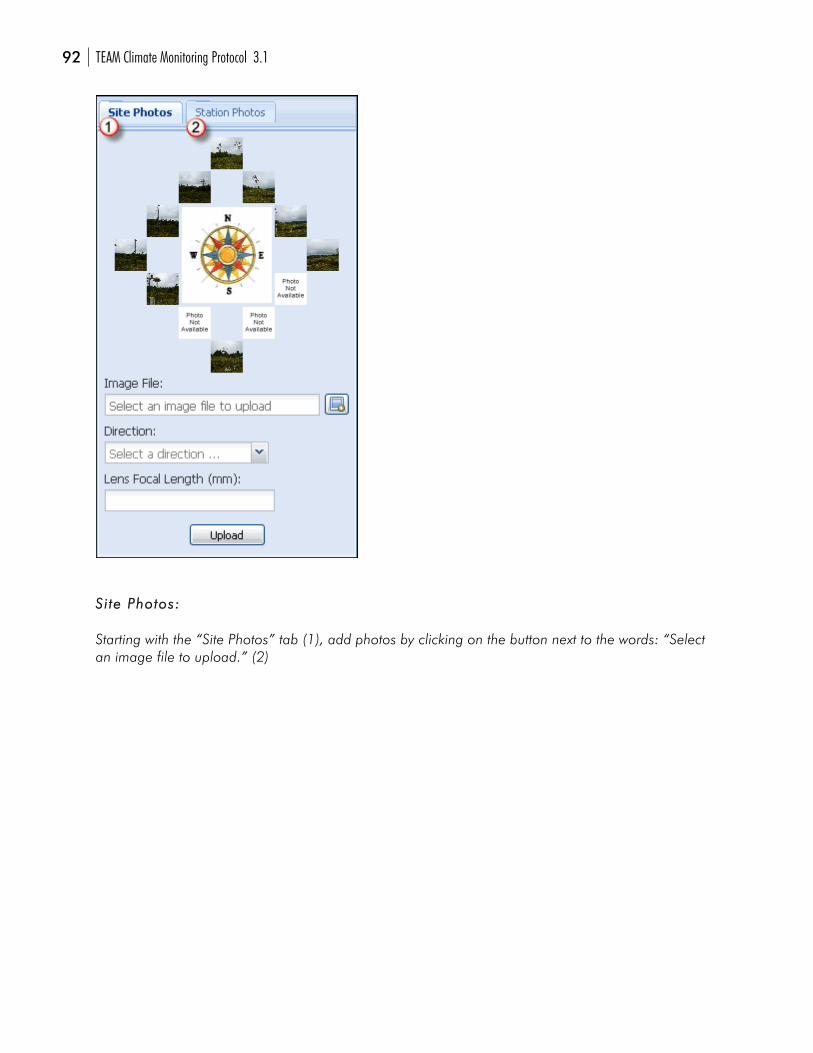
92 TEAM Climate Monitoring Protocol 3.1
SSii ttee PPhhoottooss::
Starting with the “Site Photos” tab (1), add photos by clicking on the button next to the words: “Select an image file to upload.” (2)
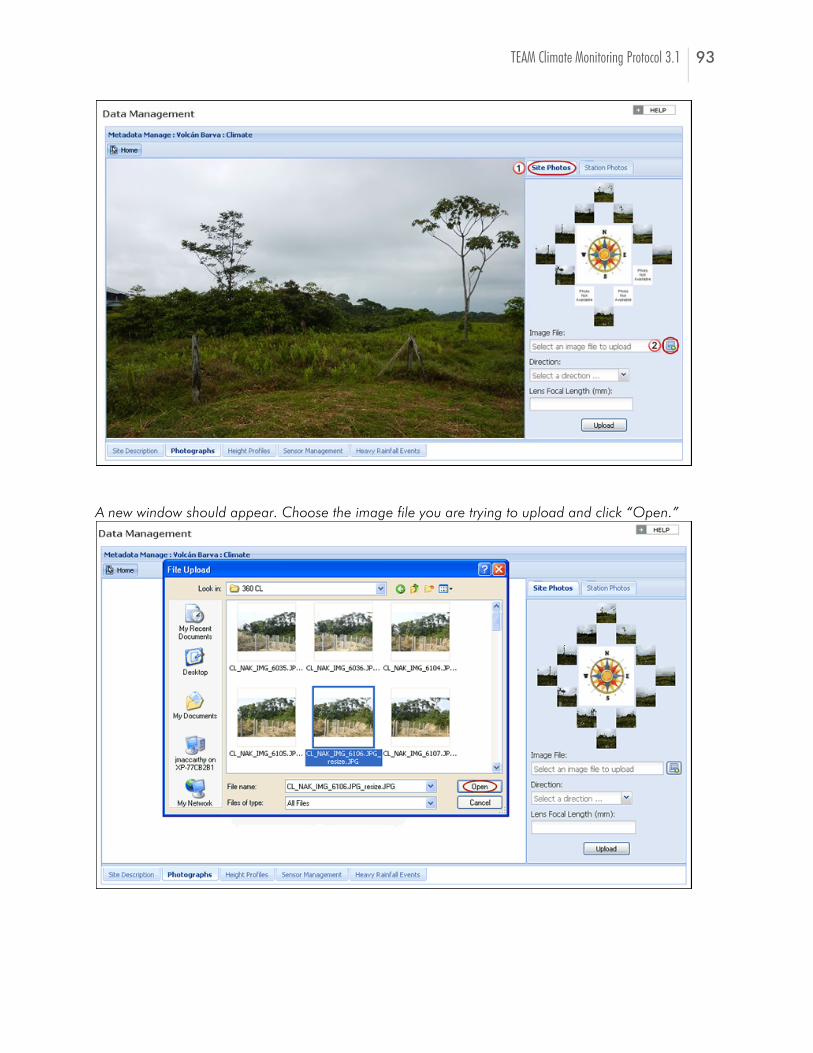
TEAM Climate Monitoring Protocol 3.1 93
A new window should appear. Choose the image file you are trying to upload and click “Open.”
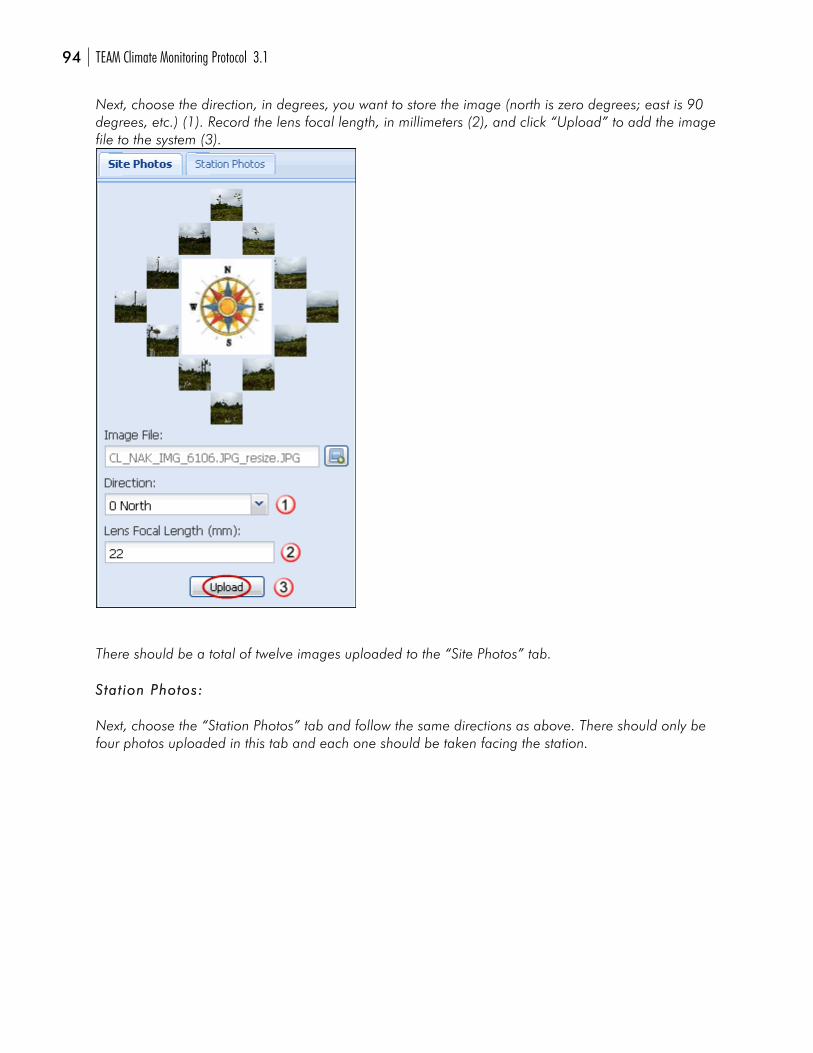
94 TEAM Climate Monitoring Protocol 3.1
Next, choose the direction, in degrees, you want to store the image (north is zero degrees; east is 90 degrees, etc.) (1). Record the lens focal length, in millimeters (2), and click “Upload” to add the image file to the system (3).
There should be a total of twelve images uploaded to the “Site Photos” tab.
SSttaatt iioonn PPhhoottooss::
Next, choose the “Station Photos” tab and follow the same directions as above. There should only be four photos uploaded in this tab and each one should be taken facing the station.
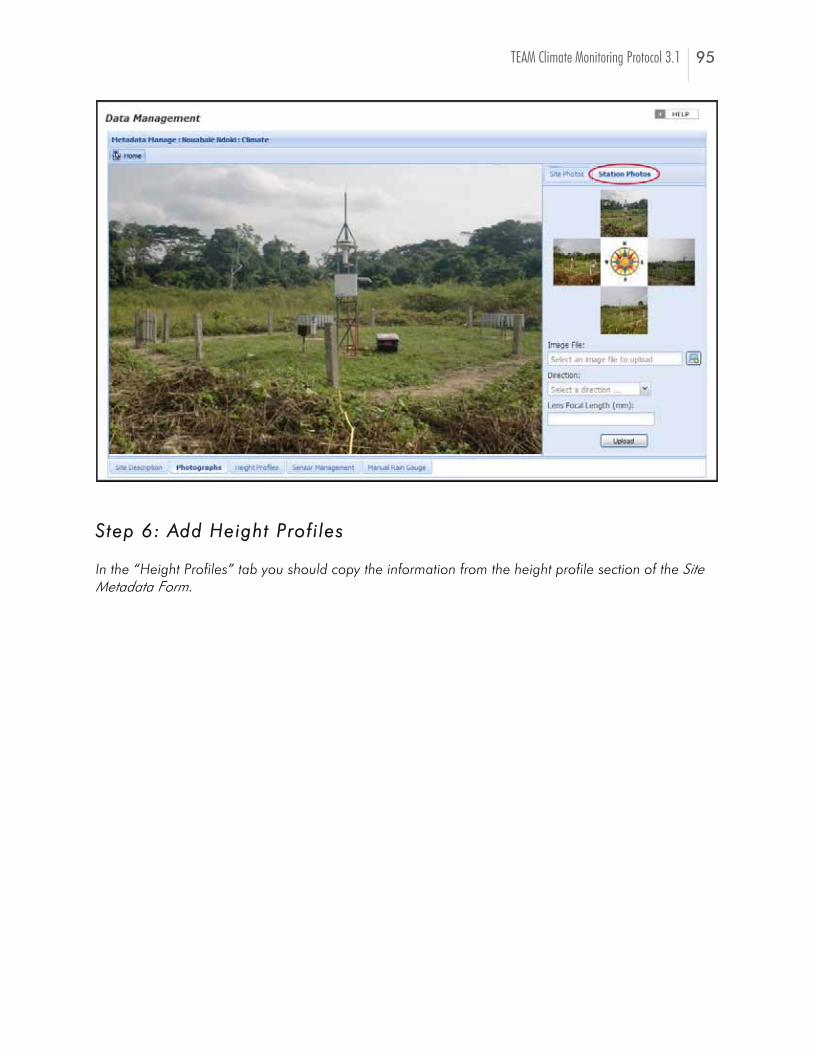
TEAM Climate Monitoring Protocol 3.1 95
SStteepp 66:: AAdddd HHeeiigghhtt PPrrooff ii lleess
In the “Height Profiles” tab you should copy the information from the height profile section of the Site Metadata Form.
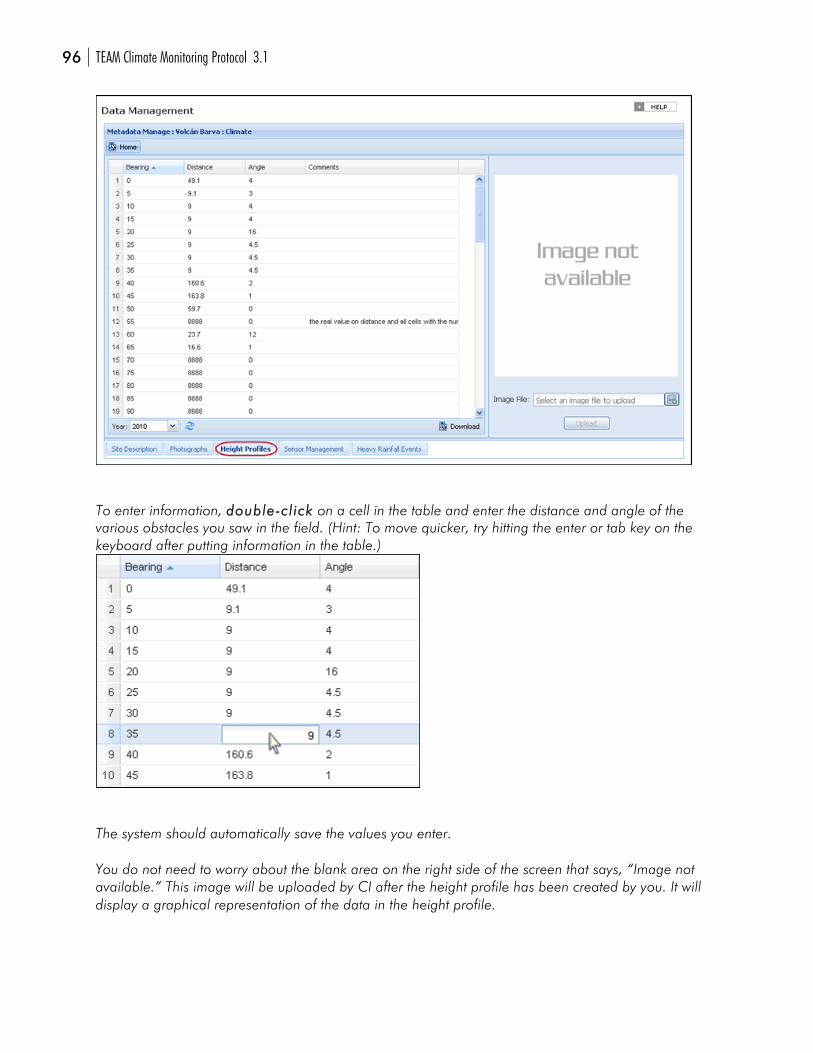
96 TEAM Climate Monitoring Protocol 3.1
To enter information, ddoouubbllee--ccll iicckk on a cell in the table and enter the distance and angle of the various obstacles you saw in the field. (Hint: To move quicker, try hitting the enter or tab key on the keyboard after putting information in the table.)
The system should automatically save the values you enter.
You do not need to worry about the blank area on the right side of the screen that says, “Image not available.” This image will be uploaded by CI after the height profile has been created by you. It will display a graphical representation of the data in the height profile.
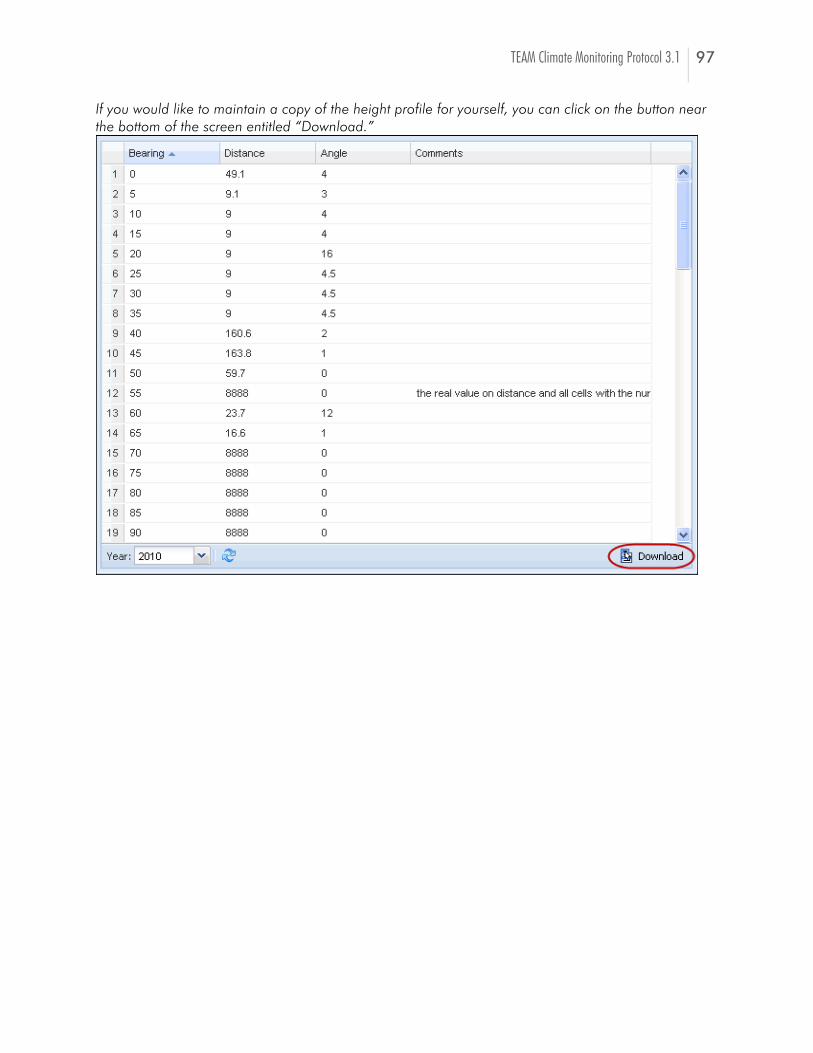
TEAM Climate Monitoring Protocol 3.1 97
If you would like to maintain a copy of the height profile for yourself, you can click on the button near the bottom of the screen entitled “Download.”
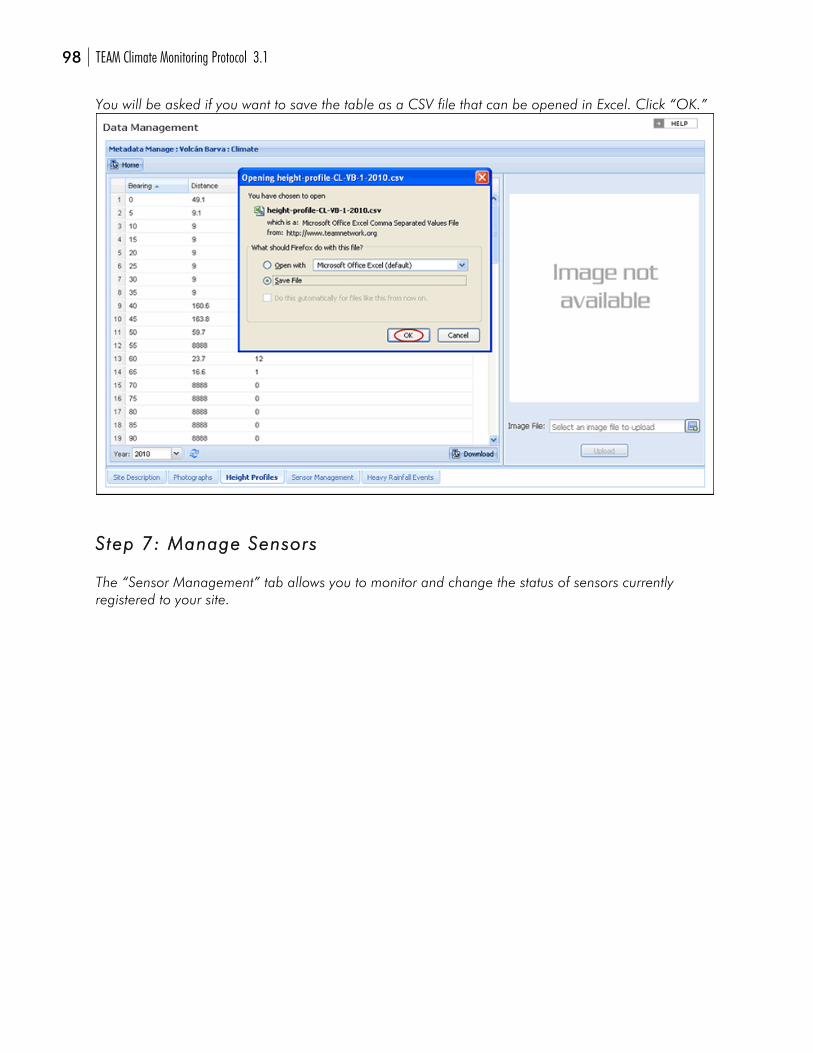
98 TEAM Climate Monitoring Protocol 3.1
You will be asked if you want to save the table as a CSV file that can be opened in Excel. Click “OK.”
SStteepp 77:: MMaannaaggee SSeennssoorrss
The “Sensor Management” tab allows you to monitor and change the status of sensors currently registered to your site.
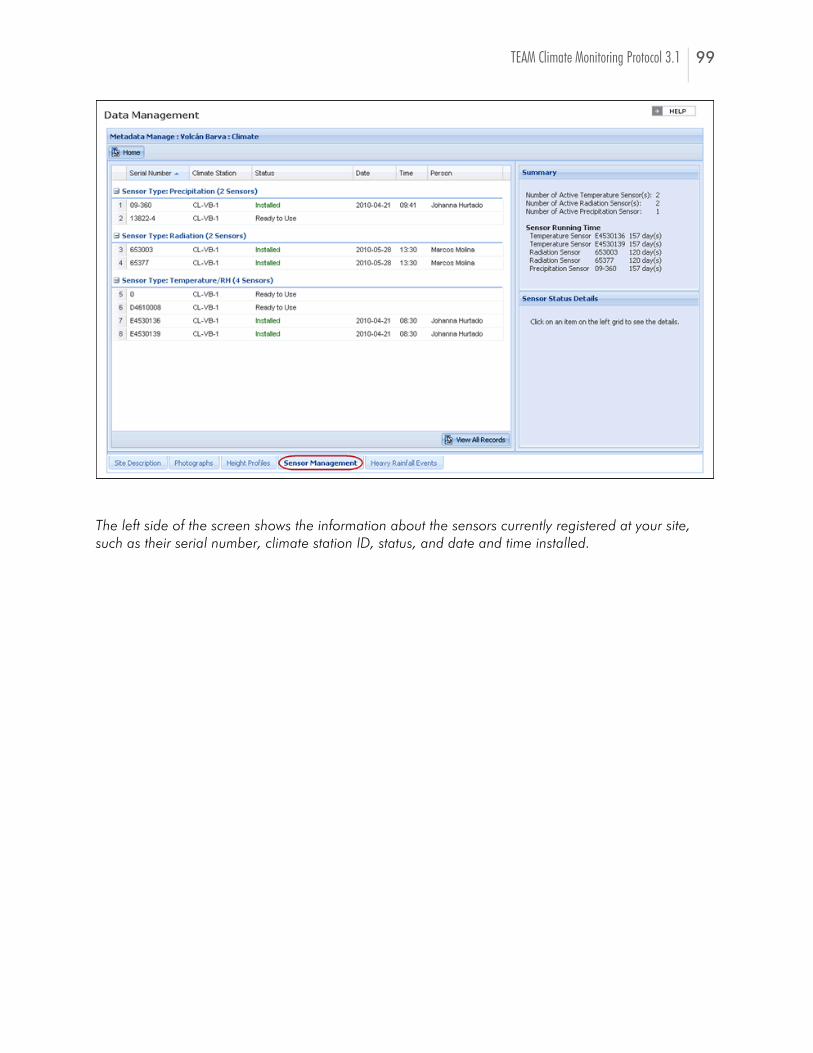
TEAM Climate Monitoring Protocol 3.1 99
The left side of the screen shows the information about the sensors currently registered at your site, such as their serial number, climate station ID, status, and date and time installed.
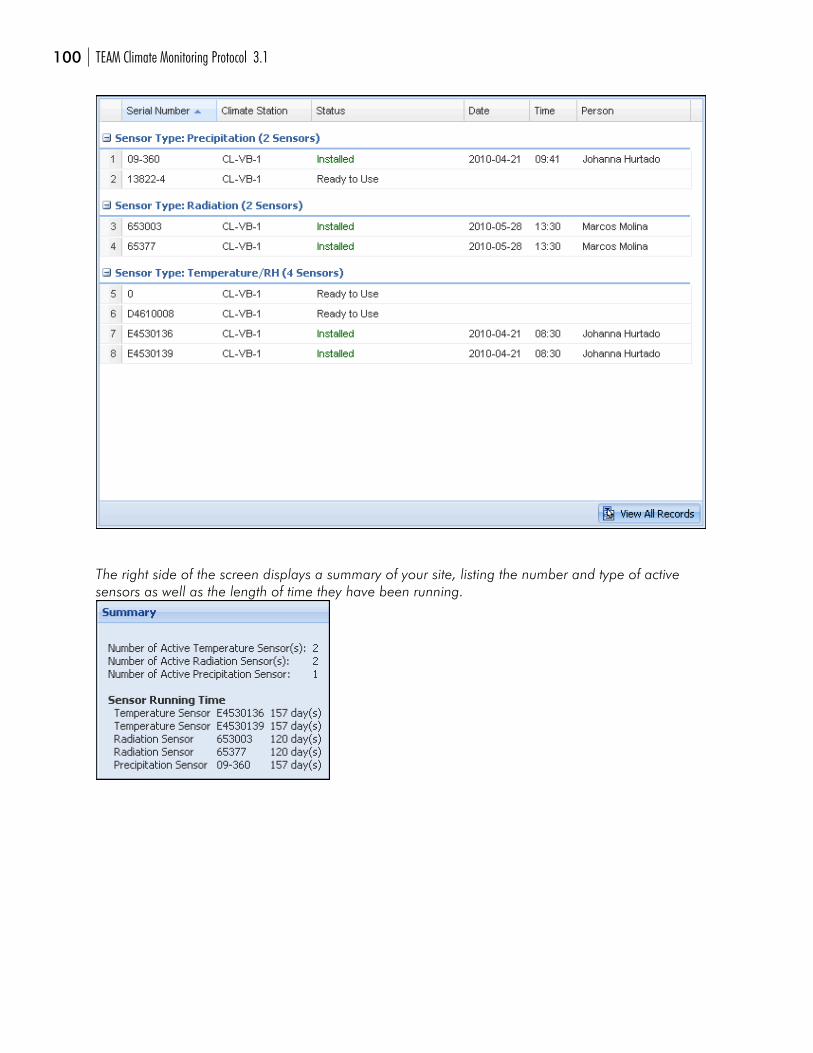
100 TEAM Climate Monitoring Protocol 3.1
The right side of the screen displays a summary of your site, listing the number and type of active sensors as well as the length of time they have been running.
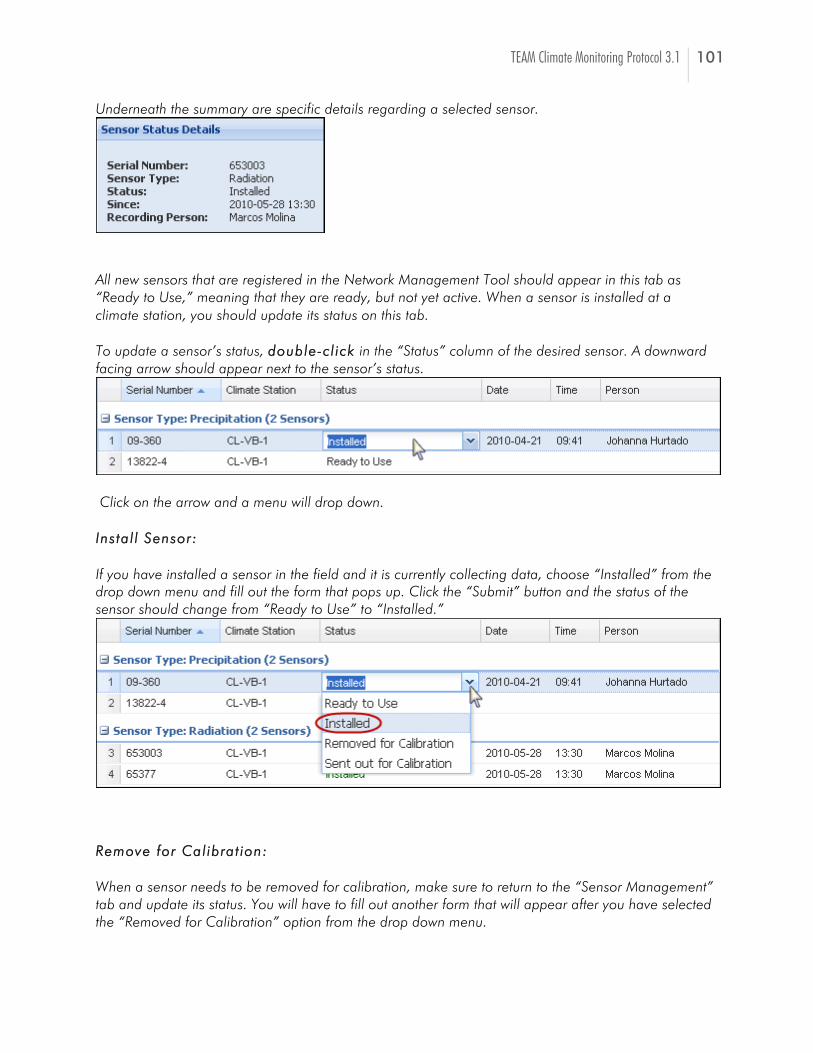
TEAM Climate Monitoring Protocol 3.1 101
Underneath the summary are specific details regarding a selected sensor.
All new sensors that are registered in the Network Management Tool should appear in this tab as “Ready to Use,” meaning that they are ready, but not yet active. When a sensor is installed at a climate station, you should update its status on this tab.
To update a sensor’s status, ddoouubbllee--ccll iicckk in the “Status” column of the desired sensor. A downward facing arrow should appear next to the sensor’s status.
Click on the arrow and a menu will drop down.
IInnssttaall ll SSeennssoorr::
If you have installed a sensor in the field and it is currently collecting data, choose “Installed” from the drop down menu and fill out the form that pops up. Click the “Submit” button and the status of the sensor should change from “Ready to Use” to “Installed.”
RReemmoovvee ffoorr CCaall iibbrraatt iioonn::
When a sensor needs to be removed for calibration, make sure to return to the “Sensor Management” tab and update its status. You will have to fill out another form that will appear after you have selected the “Removed for Calibration” option from the drop down menu.
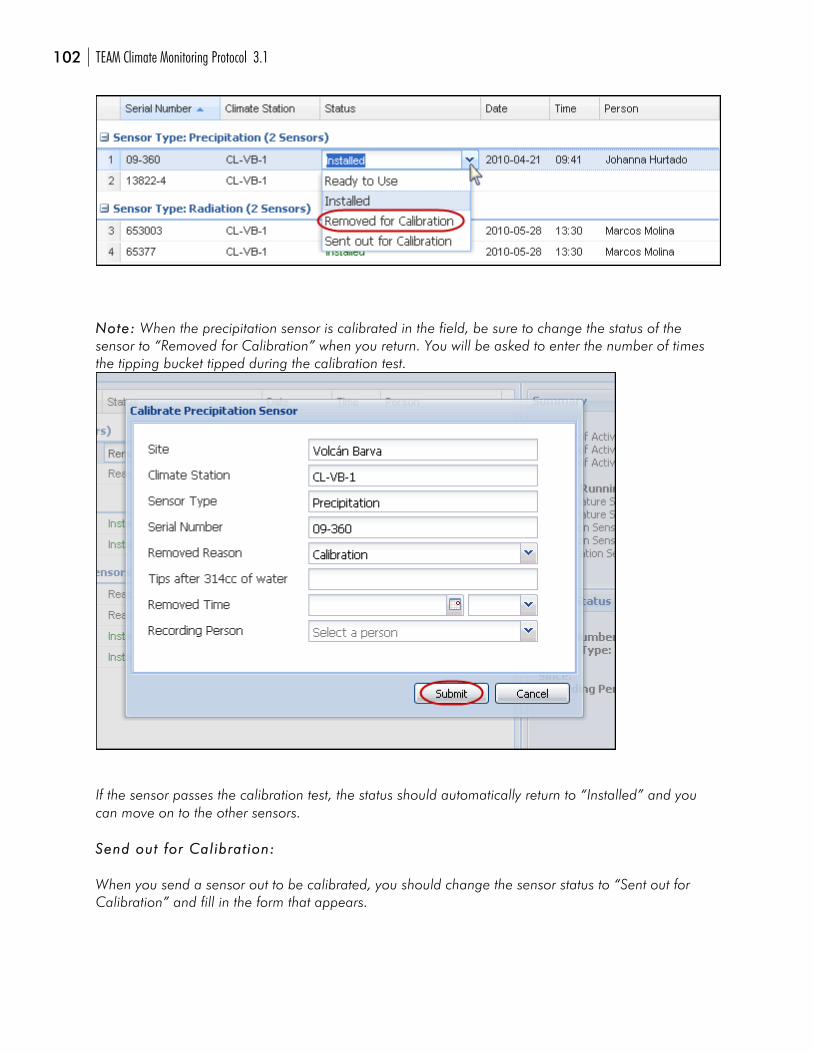
102 TEAM Climate Monitoring Protocol 3.1
NNoottee:: When the precipitation sensor is calibrated in the field, be sure to change the status of the sensor to “Removed for Calibration” when you return. You will be asked to enter the number of times the tipping bucket tipped during the calibration test.
If the sensor passes the calibration test, the status should automatically return to “Installed” and you can move on to the other sensors.
SSeenndd oouutt ffoorr CCaall iibbrraatt iioonn::
When you send a sensor out to be calibrated, you should change the sensor status to “Sent out for Calibration” and fill in the form that appears.
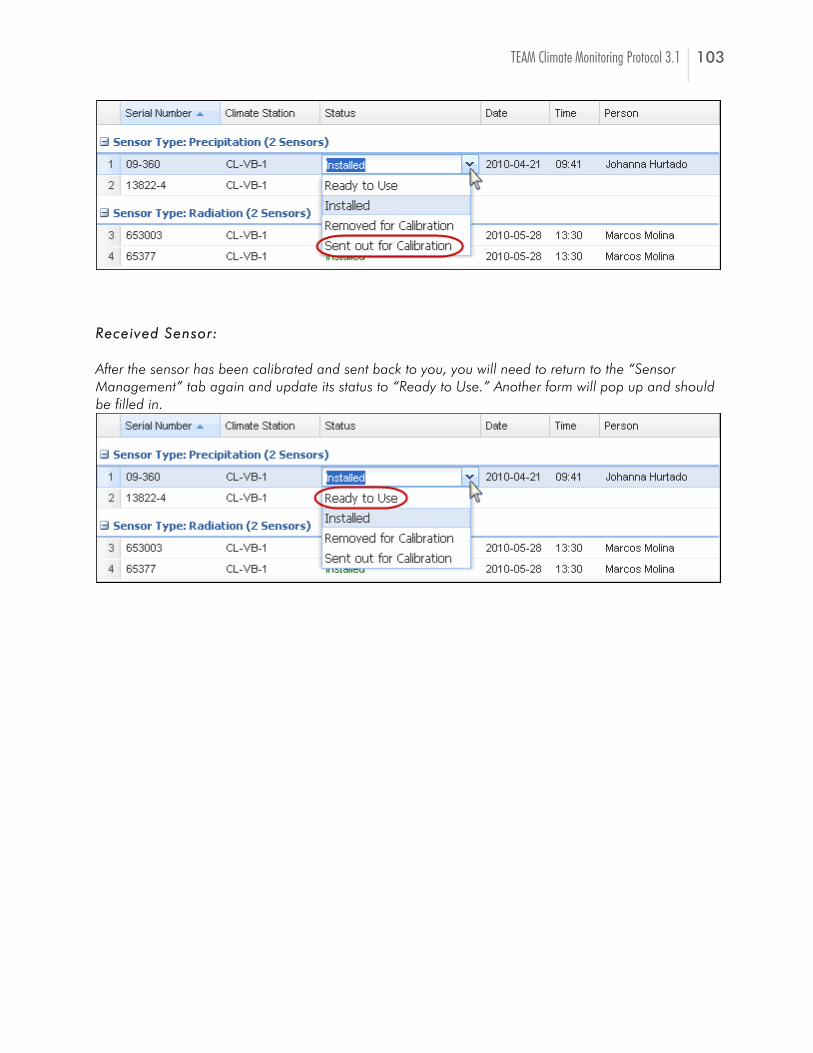
TEAM Climate Monitoring Protocol 3.1 103
RReecceeiivveedd SSeennssoorr::
After the sensor has been calibrated and sent back to you, you will need to return to the “Sensor Management” tab again and update its status to “Ready to Use.” Another form will pop up and should be filled in.
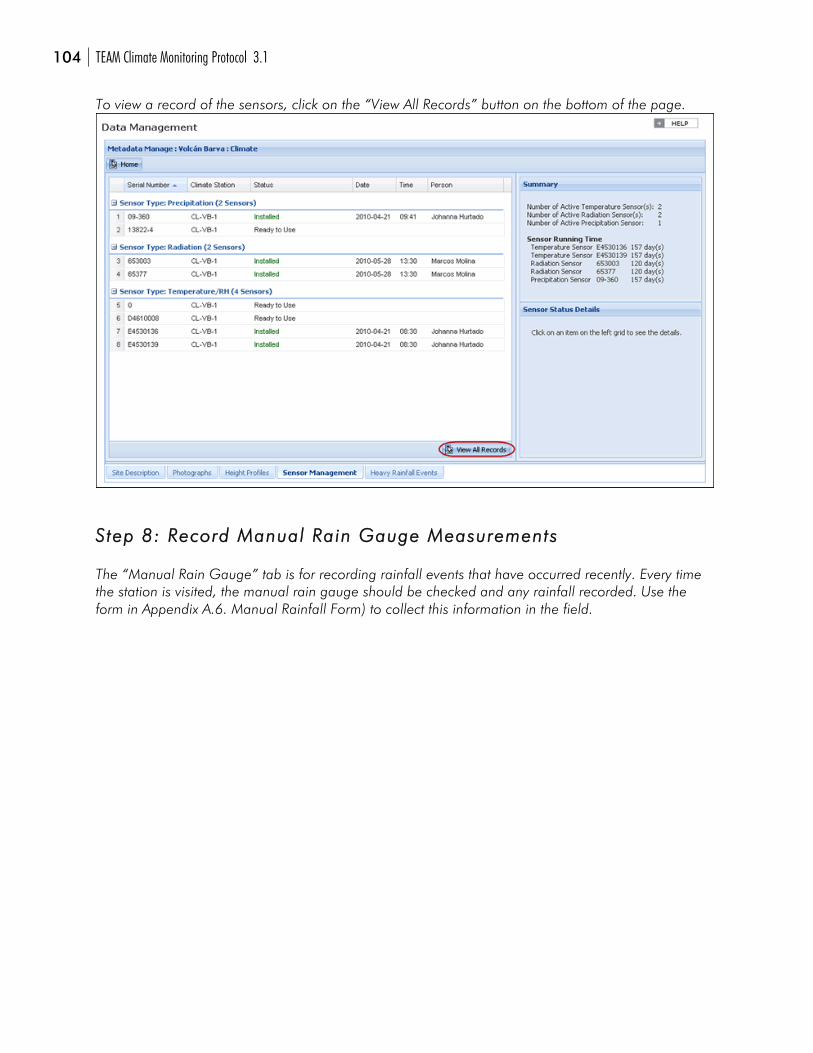
104 TEAM Climate Monitoring Protocol 3.1
To view a record of the sensors, click on the “View All Records” button on the bottom of the page.
SStteepp 88:: RReeccoorrdd MMaannuuaall RRaaiinn GGaauuggee MMeeaassuurreemmeennttss
The “Manual Rain Gauge” tab is for recording rainfall events that have occurred recently. Every time the station is visited, the manual rain gauge should be checked and any rainfall recorded. Use the form in Appendix A.6. Manual Rainfall Form) to collect this information in the field.
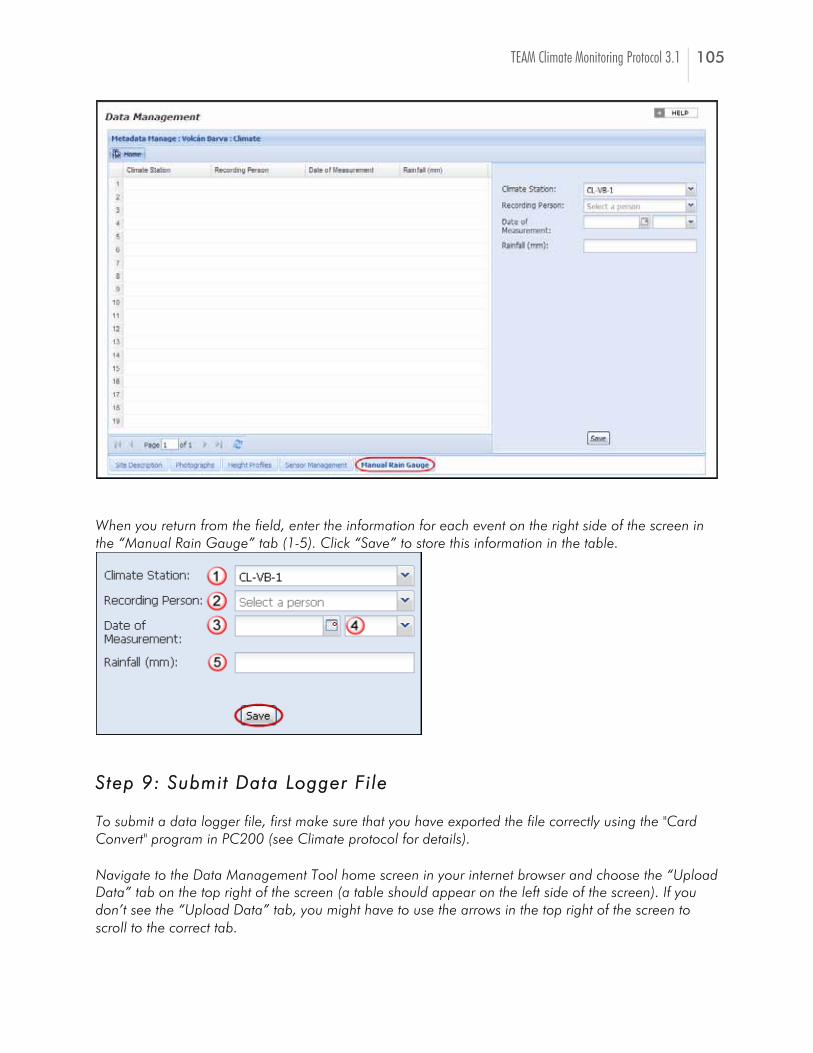
TEAM Climate Monitoring Protocol 3.1 105
When you return from the field, enter the information for each event on the right side of the screen in the “Manual Rain Gauge” tab (1-5). Click “Save” to store this information in the table.
SStteepp 99:: SSuubbmmiitt DDaattaa LLooggggeerr FFii llee
To submit a data logger file, first make sure that you have exported the file correctly using the "Card Convert" program in PC200 (see Climate protocol for details).
Navigate to the Data Management Tool home screen in your internet browser and choose the “Upload Data” tab on the top right of the screen (a table should appear on the left side of the screen). If you don’t see the “Upload Data” tab, you might have to use the arrows in the top right of the screen to scroll to the correct tab.
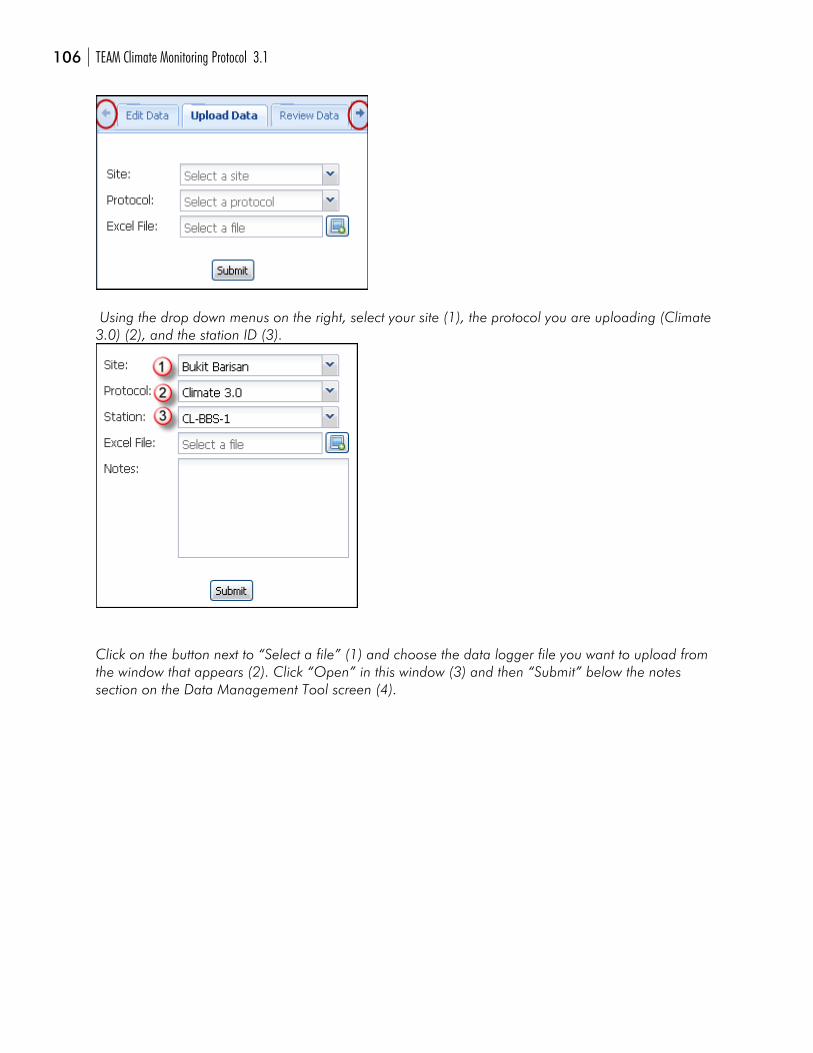
106 TEAM Climate Monitoring Protocol 3.1
Using the drop down menus on the right, select your site (1), the protocol you are uploading (Climate 3.0) (2), and the station ID (3).
Click on the button next to “Select a file” (1) and choose the data logger file you want to upload from the window that appears (2). Click “Open” in this window (3) and then “Submit” below the notes section on the Data Management Tool screen (4).
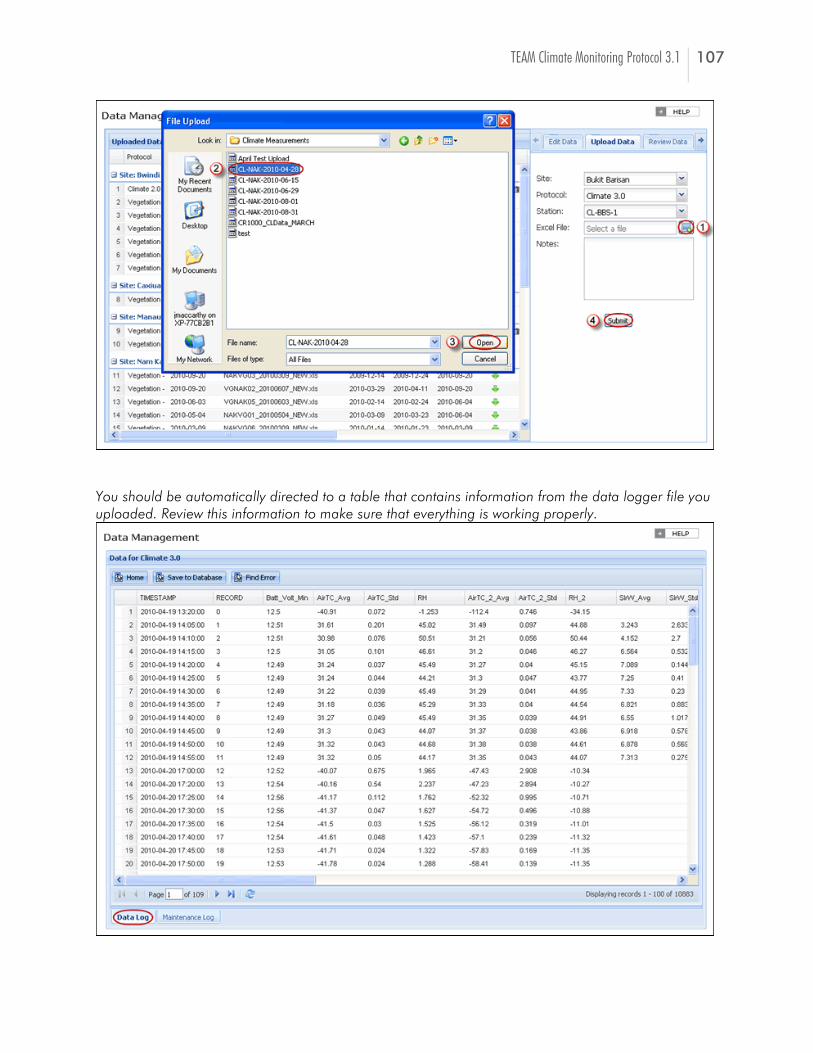
TEAM Climate Monitoring Protocol 3.1 107
You should be automatically directed to a table that contains information from the data logger file you uploaded. Review this information to make sure that everything is working properly.
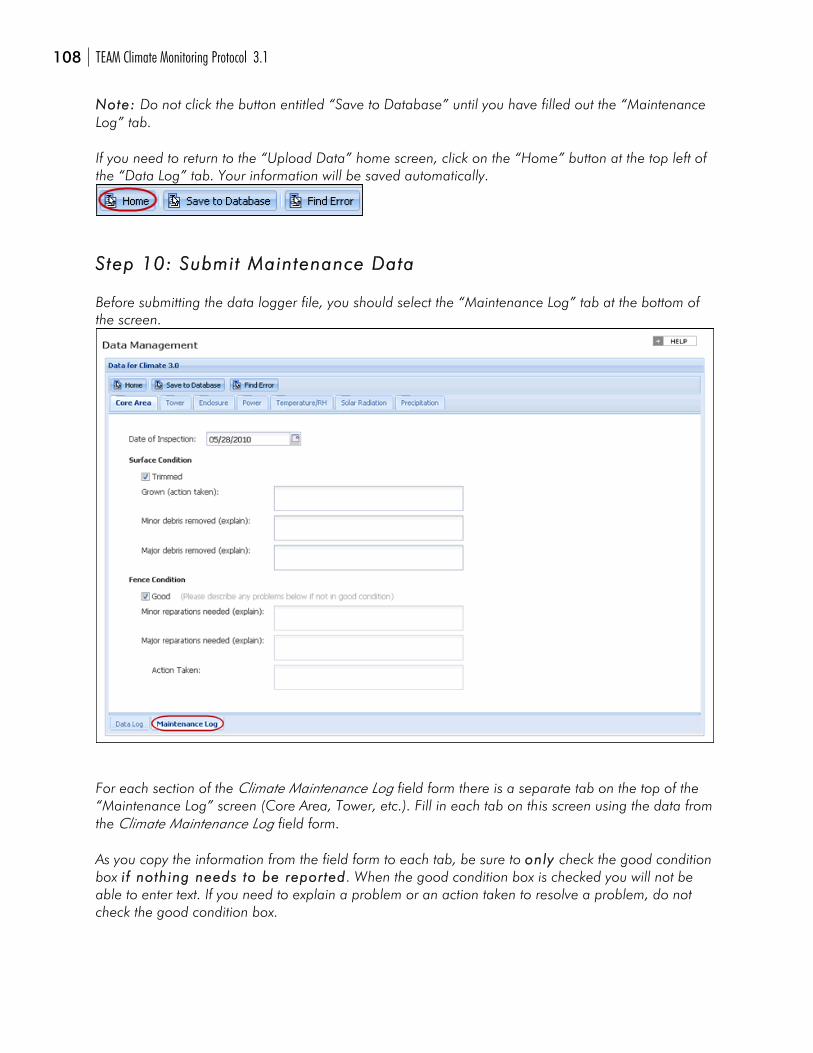
108 TEAM Climate Monitoring Protocol 3.1
NNoottee:: Do not click the button entitled “Save to Database” until you have filled out the “Maintenance Log” tab.
If you need to return to the “Upload Data” home screen, click on the “Home” button at the top left of the “Data Log” tab. Your information will be saved automatically.
SStteepp 1100:: SSuubbmmiitt MMaaiinntteennaannccee DDaattaa
Before submitting the data logger file, you should select the “Maintenance Log” tab at the bottom of the screen.
For each section of the Climate Maintenance Log field form there is a separate tab on the top of the “Maintenance Log” screen (Core Area, Tower, etc.). Fill in each tab on this screen using the data from the Climate Maintenance Log field form.
As you copy the information from the field form to each tab, be sure to oonnllyy check the good condition box ii ff nnootthhiinngg nneeeeddss ttoo bbee rreeppoorr tteedd. When the good condition box is checked you will not be able to enter text. If you need to explain a problem or an action taken to resolve a problem, do not check the good condition box.
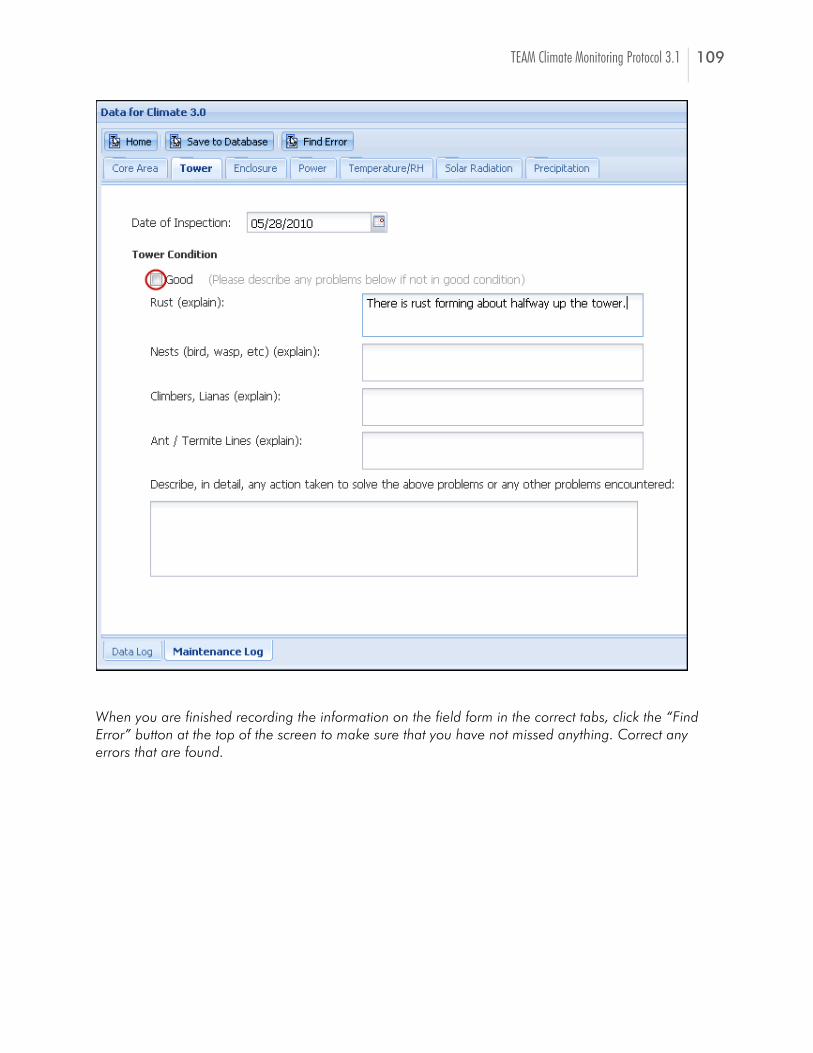
TEAM Climate Monitoring Protocol 3.1 109
When you are finished recording the information on the field form in the correct tabs, click the “Find Error” button at the top of the screen to make sure that you have not missed anything. Correct any errors that are found.
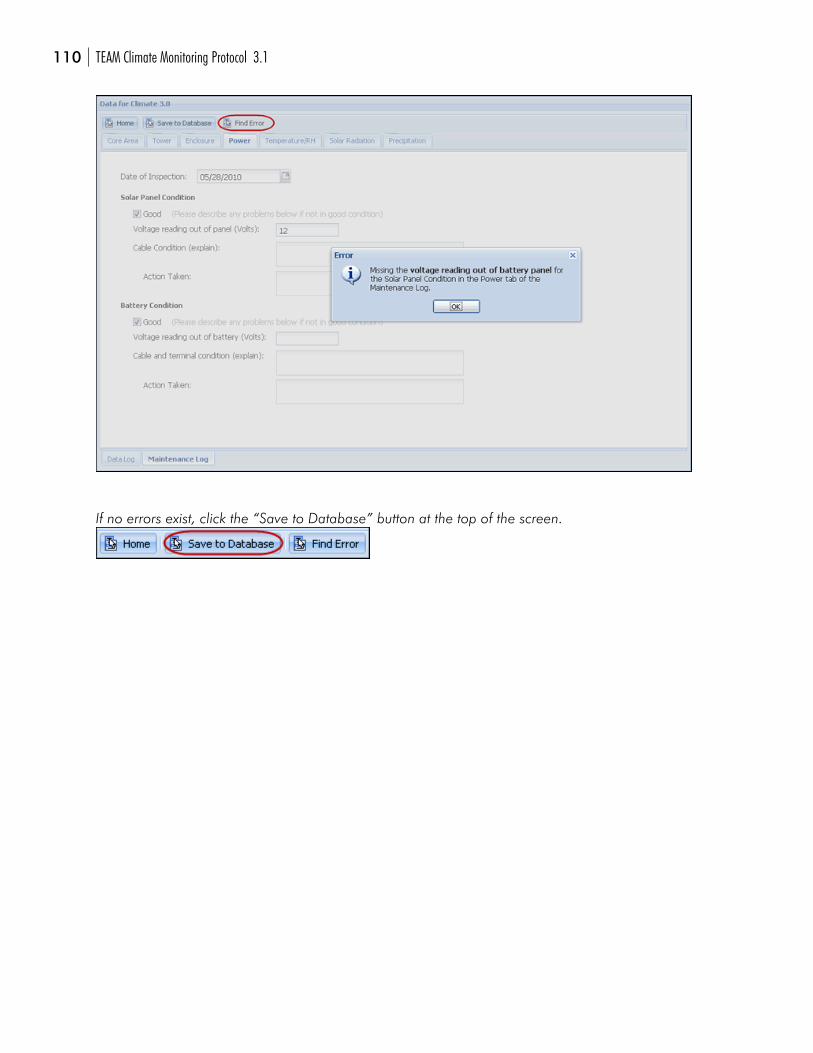
110 TEAM Climate Monitoring Protocol 3.1
If no errors exist, click the “Save to Database” button at the top of the screen.