Embed Size (px)
DESCRIPTION
Monitoring and Assessment
Citation preview
Page 1 of 12
Monitoring and Assessment Program on the
Sustainable Utilization of Spanner Crab
Resources under Policy Change
DANANG ADITYA NIZAR
42105277

Page 2 of 12
Context situation
In the age of climate change and highly consumptive societies, people are becoming more aware on the
needs of sustainable attitudes towards fishing and seafood consumption. According to the report
published by The United Nations Food and Agriculture Organization (FAO) in 2002, 18% of major
marine stocks are over-exploited globally and 10% of stocks have become depleted as the result of
constant overfishing. This fact is alarming because the fall of fishing industry will not just harm the
biodiversity and marine ecosystem around the world, but also affecting the livelihood of many
communities since there are approximately 35 million people who is highly dependent on fishing
industries for their employment and main food resources (Cummins 2004; FAO 2002).
In conjunction with this tendency and consideration, Queensland Government has implemented a new
policy to support the sustainable fishery of the Australian Spanner Crab (Ranina ranina). This new
regulation will reduce the total allowable catch (TAC) by 15% annually, without changing the fishery
season. TAC is a very important concept in improving the sustainability of fishing industry, because it
sets the acceptable sustainable yield; a harvest rate today that will not adversely impact the future
fisheries stock (Charles 2001).
Background
R. ranina or Spanner Crab can be found throughout the Indo-Pacific region from the western Indian
Ocean until the north-central Indian Ocean; including Seychelles, Philippines, Japan, Hawai’i and the
east coast of Australia (Barnard 1950, de Moussac and de San 1987, Brown et al. 1999). This species
have been exploited commercially in those regions, although the market is relatively small as opposed
to Mud and Blue Crab industry (Dichmont and Brown 2010; Hill and Garland 2009). In Australia,
Spanner Crabs inhabit the southern Queensland and northern New South Wales water, with no
evidence of significant existence in the other States (Kennelly 1992; The State of Queensland,
Department of Employment, Economic Development and Innovation 2011). The Spanner Crab industry
in Queensland expanded rapidly during 1990s after the development of export markets in Asia, during
that period the fishing effort expanded from 2,200 boat-days in 1990 to 14,900 boat-days in 1994—a
massive 500% increase in less than 5 years (Dichmont and Brown 2010). This trend peaked in 1994,
when the landing records1 reach 3,000 metric tons and became the largest total catch of an individual
species in Queensland (Williams 1997). Currently, live export market to Asia is still becoming the main
engine for Spanner Crab industry in Queensland with the value of around $8 million and the total catch
of 2000 tons—with 80% of the catch located in Queensland (Commonwealth of Australia 2001; Brown
et al. 2010).
The implementation of new regulation that reduces the TAC by 15% is part of the long policy history in
Queensland Spanner Crab industry. In 1997, Queensland Government reduced the number of daily
catch limit and extended the weekend closure period to 24 hours in order to restrain further expansion
1 Landing records derived from the sale of caught fish and provide information on the landed catch (Cooper 2006).
Page 3 of 12
of Spanner Crab exploitation (Dichmont and Brown 2010). The continuous effort shown by the
government by releasing the Spanner Crab Management Plan in 1999, which regulates every single
aspect of Spanner Crab fishery; such as closing season, managed area, apparatus requirement and the
annual quota (State of Queensland 1999). Under adaptive environmental management (AEM) approach,
these policies are considered as experimental probes and people should learn from them in order to
help develop the best possible natural resource management (Lee 1993). According to Walters (1986),
AEM is important in designing policies that provide continuous resource productivity and enhance the
learning opportunity. This is where monitoring and assessment program is essential to support AEM,
since it enables the practitioners to measure key indicators and assist them through comparison which
will transform into a learning process (Hilborn and Sibert 1986). Therefore, formulation of monitoring
and assessment program is essential to review the effectiveness of the new implemented regulation, in
improving the sustainability of Spanner Crab fishery. This report is then structured based on the two
different aspects of sustainability that is intended to be enhanced by the new regulation: (1) the
ecological sustainability and (2) the socio-economic sustainability.
Ecological sustainability
Environmental impacts
One of the distinct characteristic of AEM is that it focuses on the adaptation of possible impacts in the
future. Understanding the potential impacts of TAC reduction by 15% is an integral part of the
monitoring system, since it will form a basis in deciding which key indicators to measure along the
process. In order to do this, review of environmental factors (REF) should be conducted to assess the
likely impacts of the new regulation and determine the interventions—if required (Johnstone 2012).
Although it is clear that the main purpose of the new regulation is to reduce the rate of commercial
harvest and thus maintain a more stable stock abundance, it is also important to understand other
environmental factors that might influence those elements, such as water temperature and seabed
characters (Cooper 2006; Brown et al. 2008). This will help the managers to determine which factors
have the most significant impacts on the fishing industry (e.g. catchability, stock abundance, population
distribution) which then can be formulated into robust management outcomes.

Page 4 of 12
For example, government has modified the TAC from 1,727 tons to 1,923 tons in order to better utilize
the resource (State of Queensland, DPIF 2008). Nonetheless the effect of this policy was not as expected,
since the rate of commercial harvest was decreasing as the TAC increased by the government as shown
in Figure 1. Therefore, it requires more than just the modification of TAC to influence the harvest rate
of Spanner Crab fishery. The result of REF should be integrated with stock assessment, which includes
the past, current and future trends of species stock (Cooper 2005). The stock status will then provide
necessary information for the managers to decide on the future actions. Queensland Government has
done several stock assessments conducted by different government bodies, and most of the
assessments show the similar result: Spanner Crab has been ‘Sustainably Fished’ and ‘Not Fully Utilized’
(Commonwealth of Australia 2001; State of Queensland, DEEDI 2011a; State of Queensland, DEEDI
2011b; State of Queensland, DEEDI 2009). However, this fact doesn’t diminish the relevance of
monitoring program in regards to the new regulation. Given there are limited biological data regarding
the species, result derived from the monitoring program might fill the knowledge gap which is
increasingly important as there is a need for high quality data to continue develop a more advanced and
sound stock assessment model (Commonwealth of Australia 2001; Kaus et al. 2008).
Stock assessment
There are a lot of references on how to measure the sustainability of fishing industry and what relevant
indicators should be used, and most of them are referring to the importance of assessment against the
stock assessment data (Commonwealth of Australia 2012; Oakley et al. 2003). Stock assessment is
important within the AEM framework, because it predicts the most likely outcomes based on the
different management alternatives and uncertainty factors behind it, such as age structure, natural
mortality and multi-species interactions (Charles 2001). Both fishery-independent and fishery-
dependent data are needed in conducting stock assessment, in order to obtain the whole perspective
from commercial and recreational harvester and marine scientist (South East Fisheries Science Center
n.d.). Research surveys conducted by government are usually become the main source for fishery-
Figure 1. Correlation between TAC rate and the commercial harvest (adapted from Annual Status Report of Queensland Spanner Crab Fishery 2006 – 2011)
Page 5 of 12
independent data, while fishery-dependent data are derived by the harvesters through landing records,
portside sampling, log books and vessel trip reports (Cooper 2006). These methods are regulated under
Spanner Crab Management Plan for the purpose of maintaining the reliability and quality of the fishery-
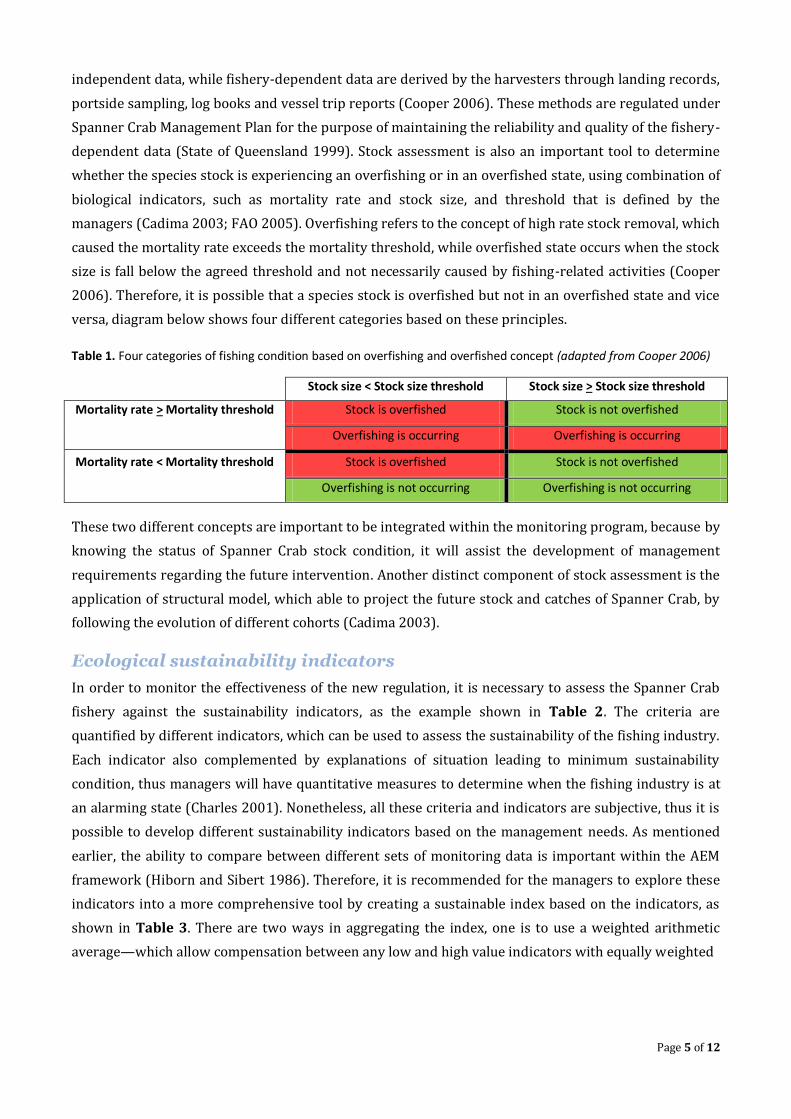
dependent data (State of Queensland 1999). Stock assessment is also an important tool to determine
whether the species stock is experiencing an overfishing or in an overfished state, using combination of
biological indicators, such as mortality rate and stock size, and threshold that is defined by the
managers (Cadima 2003; FAO 2005). Overfishing refers to the concept of high rate stock removal, which
caused the mortality rate exceeds the mortality threshold, while overfished state occurs when the stock
size is fall below the agreed threshold and not necessarily caused by fishing-related activities (Cooper
2006). Therefore, it is possible that a species stock is overfished but not in an overfished state and vice
versa, diagram below shows four different categories based on these principles.
Table 1. Four categories of fishing condition based on overfishing and overfished concept (adapted from Cooper 2006)
Stock size < Stock size threshold Stock size > Stock size threshold
Mortality rate > Mortality threshold Stock is overfished Stock is not overfished
Overfishing is occurring Overfishing is occurring
Mortality rate < Mortality threshold Stock is overfished Stock is not overfished
Overfishing is not occurring Overfishing is not occurring
These two different concepts are important to be integrated within the monitoring program, because by
knowing the status of Spanner Crab stock condition, it will assist the development of management
requirements regarding the future intervention. Another distinct component of stock assessment is the
application of structural model, which able to project the future stock and catches of Spanner Crab, by
following the evolution of different cohorts (Cadima 2003).
Ecological sustainability indicators
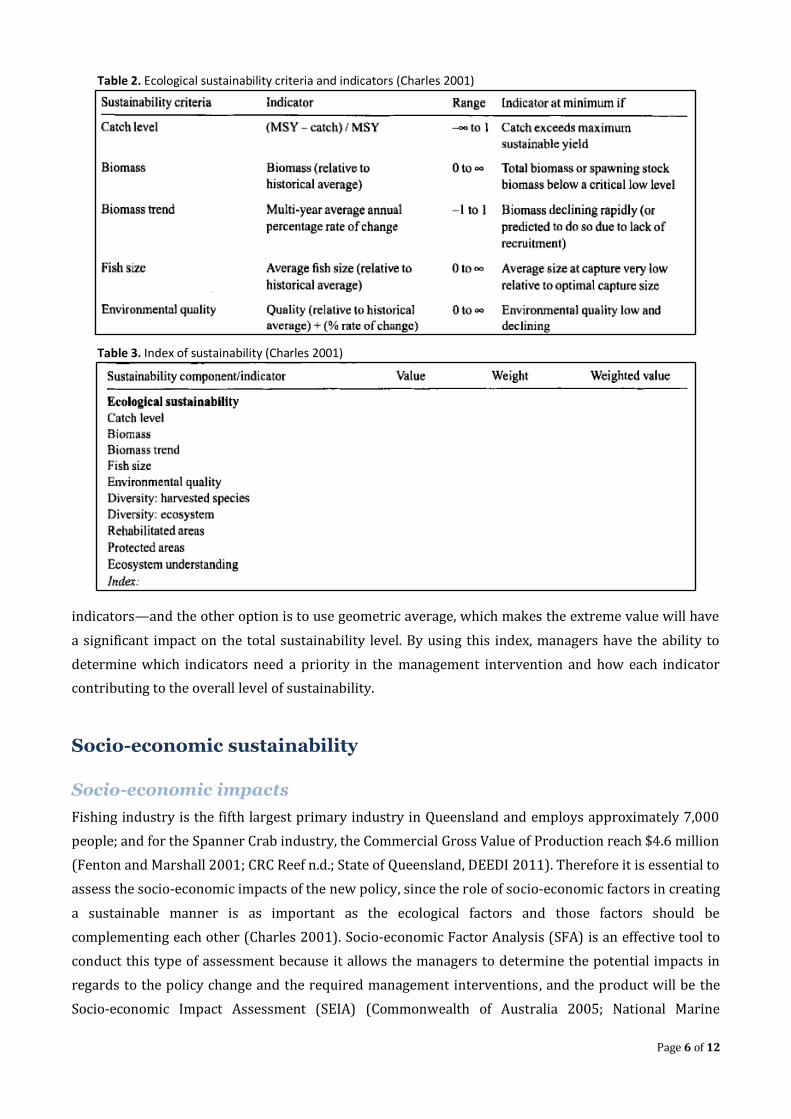
In order to monitor the effectiveness of the new regulation, it is necessary to assess the Spanner Crab
fishery against the sustainability indicators, as the example shown in Table 2. The criteria are
quantified by different indicators, which can be used to assess the sustainability of the fishing industry.
Each indicator also complemented by explanations of situation leading to minimum sustainability
condition, thus managers will have quantitative measures to determine when the fishing industry is at
an alarming state (Charles 2001). Nonetheless, all these criteria and indicators are subjective, thus it is
possible to develop different sustainability indicators based on the management needs. As mentioned
earlier, the ability to compare between different sets of monitoring data is important within the AEM
framework (Hiborn and Sibert 1986). Therefore, it is recommended for the managers to explore these
indicators into a more comprehensive tool by creating a sustainable index based on the indicators, as
shown in Table 3. There are two ways in aggregating the index, one is to use a weighted arithmetic
average—which allow compensation between any low and high value indicators with equally weighted
Page 6 of 12
indicators—and the other option is to use geometric average, which makes the extreme value will have
a significant impact on the total sustainability level. By using this index, managers have the ability to
determine which indicators need a priority in the management intervention and how each indicator
contributing to the overall level of sustainability.
Socio-economic sustainability
Socio-economic impacts
Fishing industry is the fifth largest primary industry in Queensland and employs approximately 7,000
people; and for the Spanner Crab industry, the Commercial Gross Value of Production reach $4.6 million
(Fenton and Marshall 2001; CRC Reef n.d.; State of Queensland, DEEDI 2011). Therefore it is essential to
assess the socio-economic impacts of the new policy, since the role of socio-economic factors in creating
a sustainable manner is as important as the ecological factors and those factors should be
complementing each other (Charles 2001). Socio-economic Factor Analysis (SFA) is an effective tool to
conduct this type of assessment because it allows the managers to determine the potential impacts in
regards to the policy change and the required management interventions, and the product will be the
Socio-economic Impact Assessment (SEIA) (Commonwealth of Australia 2005; National Marine
Table 2. Ecological sustainability criteria and indicators (Charles 2001)
Table 3. Index of sustainability (Charles 2001)

Page 7 of 12
Fisheries Service 2007). Impacts can be divided into two categories; direct and indirect (or usually
called as flow-on impacts). In this particular case, direct impact refers to changes experienced by
stakeholders who are directly engaged in the Spanner Crab fishing industry, such as changes to
production output, household income and business expenses (i.e. changes to cost of conducting the
fishing operation) (Commonwealth of Australia 2005). The basic concept of indirect impact is changes
generated at broader level (i.e. regional) as influenced by the direct impact, such as the changes in
employment structure in a region and changes to service provision in a region, in regards to the
decrease of TAC (Commonwealth of Australia 2005). SFA provides a qualitative and quantitative
measure of socio-economic change which can be used to assist the development of future baseline
projections and allows a comparison of data overtime, which is an integral part AEM framework (NMFS
2007; Hilborn and Sibert 1986). Referring to National Marine Fisheries Service (1979) and Flynn
(1983) there are five socio-economic variables that are important to be integrated within the fishery
monitoring program and a focal point to understand the impacts of a fishing management action.
Following are the variables adjusted to the TAC reduction case:
1. Size and demographic characteristics of the Spanner Crab industry workforce, which will help to
develop a linkage between the impact of demographic, income and employment and the fishery
workforce.
2. Beliefs and attitudes of the stakeholders, which is important to understand the behavior in
regards to the industry.
3. Effects of the proposed actions (i.e. new implemented regulation) on the social structure and
how this change affect the ability of Spanner Crab industry to support the fishing communities
4. Non-economic social aspects of the new implemented regulation, such as health and safety
issues.
5. Historical dependence on and participation in the fishing activities by the communities, income
distribution and rights.
Socio-economic sustainability indicators
Similar to the ecological factors, the development of sustainability indicators is integral in assessing the
socio-economic sustainability. According to Charles (2001), ecological and socio-economic
sustainability—along with institutional and community sustainability—are part of the ‘sustainability
triangle’ (Figure 2) and thus cannot be separated one another. The example of sustainability indicators
Figure 2. Sustainability triangle with its four elements (Charles 2001)

Page 8 of 12
is shown in Table 4. All the methods used to develop this tool are identical with the ecological
sustainability discussed in previous section. The sustainability index also needs to be created based on
these indicators, as it allows the managers to compare between ecological and socio-economic
sustainability and determine the presence or absence of the sustainability in each factor (Charles 2001).
This is important in order to assess the effectiveness of policy in supporting the overall sustainability
framework, not just partially in terms of ecological or socio-economic factors. Given that the Spanner
Crab fishing activities are not concentrated in particular region, managers should develop a social
profile of different fishing communities. This aspect is important, because different communities will
have different responses towards the new implemented regulation thus the result will assist managers
to identify and predict certain needs of particular communities (Schirmer and Casey 2005). Therefore,
the required management interventions will be specific to certain communities, since there is no one
size fits all in terms of policy implementation. Examples for the social indicators that might be used to
develop the social profiling are as follows:
1. Fishing methods/licenses held; this will help to measure the levels of dependence of
communities towards the Spanner Crab fishery and thus assist the prediction of the
communities’ adaptability to the new regulation
2. Number of years participating in fishing sector; this will give another perspective on the level
of dependence on Spanner Crab fishing as a livelihoods and also as an indicator to determine the
level of attachment towards Spanner Crab as a fishing commodity
3. Household spending profile; this measures the spending on common household items and help
to identify the contribution of Spanner Crab fishery to the local economies and the dependence
of particular area towards this commodity.
(Schirmer and Casey 2005)
Outcomes and recommendations
As mentioned in the earlier section, this monitoring and assessment program is intended to assess the
effectiveness of the new implemented policy, in terms of improving the ecological and socio-economic
Table 4. Socio-economic sustainability criteria and indicators (Charles 2001)

Page 9 of 12
sustainability. The outcomes of this program will assist the managers to determine the changes in the
sustainability level caused by the new regulation and whether those changes are heading to the
expected direction or not. As for the sustainability index, it gives the ability to compare between the
sustainability level in terms of ecological and socio-economic factors, thus managers are able to
determine which factors have the weakest sustainability and caused by which indicators (Charles
2001). The final product of this program also might be used to develop scenarios of potential impacts
which consist of different predictions on how the ecological factors (e.g. abundance and distribution of
Spanner Crab) and the Spanner Crab fishing industry affected by the new implemented regulation.
These scenarios also enable the managers to prepare mitigation strategies to address the possible
adverse impacts predicted in the different scenarios (Schirmer and Casey 2005). This ability is essential
for the program to support the AEM framework, as strategies in response the potential impacts are an
integral part of AEM (Lee 1993; Hilborn and Sibert 1986). One of the main challenges in conducting this
program is the data collection, especially for the ecological sustainability. According to Brown (2010),
there are limited sets of data regarding the biological factors of the Spanner Crab and consequently this
will increase the uncertainty within the process. Stock assessment, for example, is dependent heavily on
the biological data to produce a highly quality assessment (Cooper 2006). Due to this high rate of
uncertainty in fishing assessment, it is recommended for the managers to adapt a Precautionary
Approach Framework to compensate the absence of adequate scientific information (Bauffard 2010).
Conclusion
Monitoring and assessment program is an indispensable part of AEM approach. Therefore, it is
important to develop such program in order to assess the whether the new regulation has achieved its
original intention, which is to improve the overall sustainability—both in terms of ecological and socio-
economic—of Spanner Crab fishing industry. One of the most important tools to examine the ecological
sustainability is stock assessment, since it has the ability to forecast the potential impacts caused by the
policy change and determine the status of the species stock. The list of ecological sustainability criteria
along with its quantified indicators is required to become the baseline for the assessment. Based on this
data, index of sustainability might be developed which allows the managers to compare the
sustainability between ecological and socio-economic factors. This is very important in order to obtain
more comprehensive result of assessment regarding the overall level of sustainability—not partially.
The social profile of fishing communities is also essential in conducting the assessment on socio-
economic sustainability, given the fact that the Spanner Crab fishing activities are spread out without
any concentration in particular region. This will help the managers to develop a required management
intervention that will fits the different communities with its own distinct characteristics.
Page 10 of 12
References
Barnard, KH 1950, ‘Descriptive catalogue of South African decapods crustacea’, South African Journal of Science, vol. 38, pp. 396-399.
Bouffard, N 2010, Sustainable Fisheries Framework, Fisheries Resource Conservation Council, Fisheries and Oceans Canada.
Brown, IW 2010, Crab Scientific Advisory Group Report 2010/01: Queensland Spanner Crab Annual Status Report and TAC review for TAC period June 2010-May 2010, State of Queensland, Department of Employment, Economic Development and Innovation.
Brown, IW et al. 1999, Population dynamics and management of spanner crabs (Ranina ranina) in southern Queensland, Department of Primary Industries.
Brown, IW et al. 2008, Reducing uncertainty in the assessment of the Australian spanner crab fishery, Fisheries Research and Development Corporation and the Queensland Department of Primary Industries and Fisheries.
Cadima, EL 2003, Fish Stock Assessment Manual, FAO Fisheries Technical Paper.
Charles, AT 2001, Sustainable Fishery System, Blackwell Publishing, Oxford.
Commonwealth of Australia 2001, Assessment of the Queensland Spanner Crab Fishery against the Guidelines for the ecologically sustainable management of fisheries for the purposes of Part 13 and Part 13A of the Environment Protection and Biodiversity Conservation Act 1999, Marine and Water Division.
Commonwealth of Australia 2005, Socio-economic Impact Assessment Toolkit: A guide to assessing the socio-economic impacts of Marine Protected Areas in Australia, Department of the Environment and Heritage and Natural Heritage Trust.
Commonwealth of Australia 2012, Assessment of the Queensland Spanner Crab Fishery, Department of Sustainability, Environment, Water, Population and Communities.
CRC Reef n.d., Queensland Fishing Industry and Employees Profiles, CRC Reef Research Centre.
Cummins, A 2004, ‘The Marine Stewardship Council: A multi-stakeholder approach to sustainable fishing’, Corporate Social Responsibility and Environmental Management, vol. 11, pp. 85-94.
de Moussac, G and de san, M 1987, ‘The kona crab fishery: the Seychelles experience’, SWIO Fisheries Bulletin, no. 20.
Dichmont, CM and Brown, IW 2010, ‘A Case Study in Successful Management of a Data-Poor Fishery Using Simple Decision Rules: The Queensland Spanner Crab Fishery’, Marine and Coastal Fisheries: Dynamics, Management, and Ecosystem Science, vol. 2, no. 1, pp. 1-13
Flynn, C 1983, Interface and complementarity between economic analysis and social impact analysis, USDA Forest Service, Office of Environmental Coordination.
Page 11 of 12
Food and Agriculture Origanization 2002, General situation of world fish stocks, FAO Fisheries and Aquaculture Department.
Food and Agriculture Origanization 2005, Fisheries and Aquaculture topics. Stock assessment, FAO Fisheries and Aquaculture Department.
Hilborn, R and Sibert, J 1988, ‘Adaptive management of developing fisheries’, Marine Policy, vol. 12, no. 2, pp. 112-121.
Hill, F and Garland, A 2009, Ecological risk assessment of Queensland’s Blue Swimmer, Spanner and Mud Crab Fisheries, State of Queensland, Department of Employment, Economic Development and Innovation.
Johnstone, R 2012, Impacts and Assessment, lecture slide ENVM3203: Tools for Environmental Assessment and Analysis, week 3, University of Queensland.
Kaus, A et al. 2008, Fisheries Long Term Monitoring Program: Summary of the Gulf of Carpentaria Developmental Finfish Trawl Fishery survey results: 2004-2006, State of Queensland, Department of Primary Industries and Fisheries.
Kennelly, SJ 1992, ‘Distributions, abundances and current status of exploited populations of spanner crabs Ranina ranina off the east coast of Australia’, Marine Ecology Progress Series, vol. 85, pp. 227-235.
Lee, KN 1993, Compass and Gyroscope, Integrating science and politics for the environment, Island Press, Washington, D.C.
National Marine Fisheries Service 1979, Phase 1 report on social and economic information for management of marine recreational fishing – identification of data needs and priorities for data collection, Resource Statistics Divison.
National Marine Fisheries Service 2007, Guidance for Social Impact Assessment, Department of Commerce and National Oceanic & Atmospheric Administration.
Oakley, KL et al. 2003, ‘Guidelines for long-term monitoring protocols’, Wildlife Society Bulletin, vol. 31, no. 4, pp. 1000-1003.
Schirmer, J and Casey, AM 2005, Social Assessment Handbook: A guide to methods and approaches for assessing the social sustainability of fisheries in Australia, Bureau of Rural Sciences, Fisheries Research and Development Corporation.
State of Queensland 1999, Fisheries (Spanner Crab) Management Plan 1999, Subordinate Legislation 1999 No. 56.
State of Queensland, Department of Employment, Economic Development and Innovation 2011b, Stock status of Queensland’s fisheries resources 2011, Fisheries Queensland.
State of Queensland, Department of Employment, Economic Development and Innovation 2011, Annual status report 2011: Queensland Spanner Crab Fishery.
Walters, C 1986, Adaptive Management of Renewable Resources, Macmillan, University of California.
Page 12 of 12
Williams, LE 1997, Queensland’s fisheries resources: current condition and recent trends1988-1995, Queensland Department of Primary Industries.