Embed Size (px)
Citation preview
Introgression of genetic material from primary synthetic
hexaploids into an Australian bread wheat
(Triticum aestivum L.)
A thesis submitted in fulfilment of the requirements for the degree of
Master of Agricultural Science at the University of Adelaide
By
Stephen John Talbot, BBiotech (Hons) (Flinders University)
School of Agriculture, Food and Wine
Faculty of Sciences
The University of Adelaide
March 2011
ii
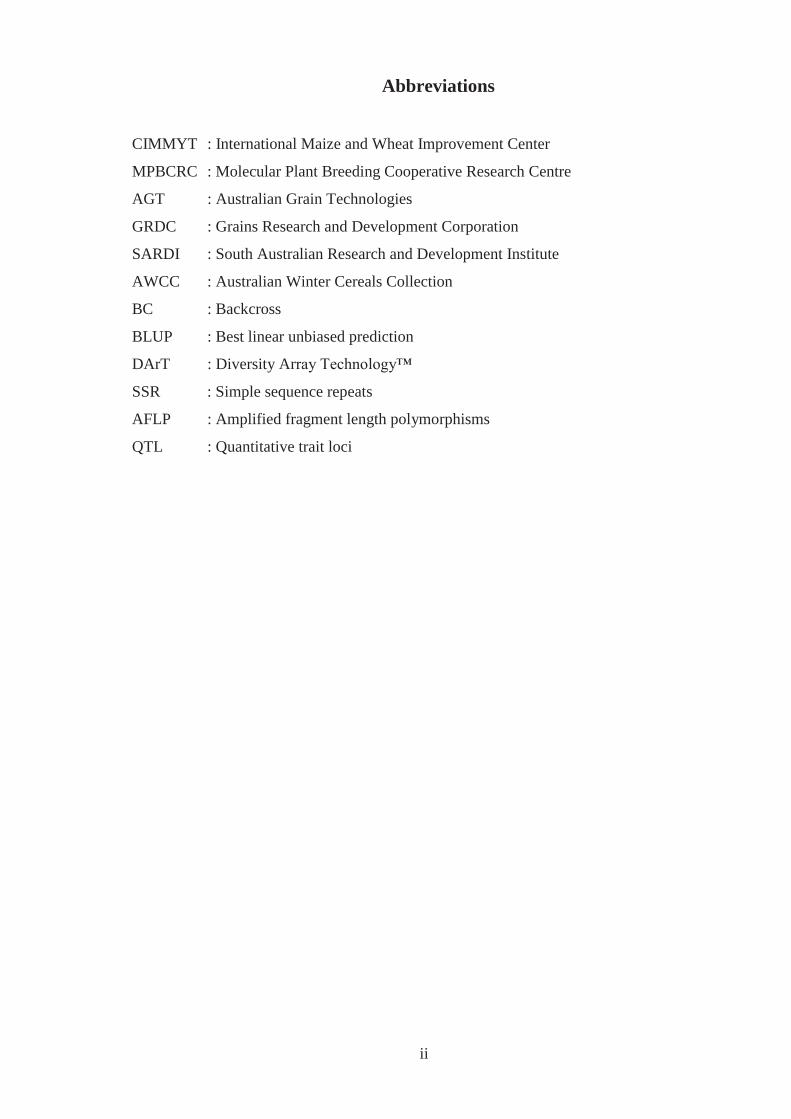
Abbreviations
CIMMYT : International Maize and Wheat Improvement Center
MPBCRC : Molecular Plant Breeding Cooperative Research Centre
AGT : Australian Grain Technologies
GRDC : Grains Research and Development Corporation
SARDI : South Australian Research and Development Institute
AWCC : Australian Winter Cereals Collection
BC : Backcross
BLUP : Best linear unbiased prediction
DArT : Diversity Array Technology™
SSR : Simple sequence repeats
AFLP : Amplified fragment length polymorphisms
QTL : Quantitative trait loci
iii
Table of Contents
Abbreviations ....................................................................................................................... ii
Table of Contents ................................................................................................................ iii
List of Tables ...................................................................................................................... vii
List of Figures ...................................................................................................................... ix
List of Appendices .............................................................................................................. xii
Abstract .............................................................................................................................. xiii
Declaration ........................................................................................................................ xiv
Acknowledgements ............................................................................................................ xv
Chapter 1 General Introduction ......................................................................................... 1
Chapter 2 Review of literature: Synthetic wheat .............................................................. 5
2.1 Introduction ............................................................................................................. 5
2.2 Bread wheat, an allohexaploid ................................................................................. 5
2.2.1 Evolution ............................................................................................................ 5
2.2.2 Domestication .................................................................................................... 8
2.2.3 Genetic diversity in bread wheat ........................................................................ 9
2.2.3.2.1 Global trends .......................................................................................... 9
2.2.3.2.2 Influence of CIMMYT ......................................................................... 10
2.3 Exploiting the progenitors of bread wheat ............................................................ 12
2.3.1 Direct hybridisations with T. turgidum ............................................................ 12
2.3.2 Direct hybridisations with Ae. tauschii ............................................................ 12
2.3.3 Synthetic hexaploid wheat ............................................................................... 14
2.4 Increasing grain yield of bread wheat using primary synthetic wheat .................. 17
2.4.1 Grain yield components ................................................................................... 17
2.4.2 Breeding strategies to increase grain weight and grain yield........................... 18
2.4.3 Synthetic backcross lines with Australian bread wheat parentage .................. 19
2.5 Introgressing novel genetic material into bread wheat .......................................... 20
2.2.3.1 Implications of evolution and domestication ..................................................... 9
2.2.3.2 Implications of modern breeding ....................................................................... 9
2.2.3.3 Genetic diversity in Australian bread wheat .................................................... 11
2.2.3.4 Germplasm resources for bread wheat breeders .............................................. 11
2.3.3.1 Creation, advantages and history ..................................................................... 14
2.3.3.3 Production and use of synthetics by CIMMYT and the world ........................ 16
2.3.3.4 Production and use in Australia ....................................................................... 17
iv
2.5.1 History and issues ............................................................................................ 20
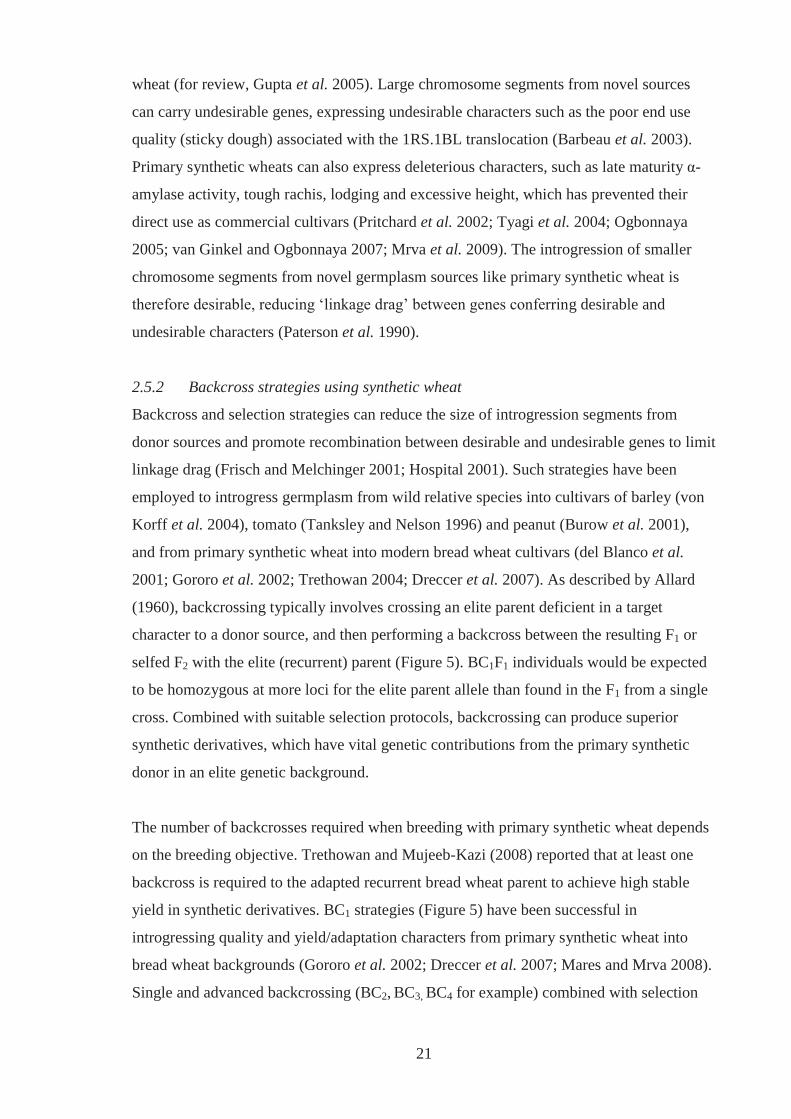
2.5.2 Backcross strategies using synthetic wheat ..................................................... 21
2.5.2 Primary synthetic wheat alleles at quantitative trait loci ................................. 23
2.6 Research questions ................................................................................................ 24
Chapter 3 Plant Materials ................................................................................................. 25
3.1 Summary of plant material .................................................................................... 25
3.2 Primary synthetic wheat and parental durum wheat .............................................. 25
3.3 Bulk synthetic seed ................................................................................................ 28
3.4 Bread and durum wheat cultivars .......................................................................... 28
3.5 Families of synthetic derived lines ........................................................................ 32
Chapter 4 Molecular characterisation of primary synthetic wheat .............................. 33
4.1 Introduction ........................................................................................................... 33
4.2 Materials and methods ........................................................................................... 34
4.2.1 Plant material ................................................................................................... 34
4.2.2 DNA extraction ................................................................................................ 37
4.2.3 DArT marker application and output ............................................................... 37
4.2.4 DArT marker data analysis .............................................................................. 38
4.3 Results ................................................................................................................... 39
4.3.1 Detection of polymorphism ............................................................................. 39
4.3.3 Cluster and principle coordinate analyses ........................................................ 42
4.3.4 Correlation between genetic distance matrices ................................................ 45
4.4 Discussion .............................................................................................................. 45
4.5 Conclusion ............................................................................................................. 50
Chapter 5 Grain yield and its component traits in synthetic backcross wheat lines
grown under drought stress .............................................................................................. 51
5.1 Introduction ........................................................................................................... 51
5.2 Materials and methods ........................................................................................... 53
5.2.1 Plant material ................................................................................................... 53
5.2.2 Field experimentation ...................................................................................... 53
5.2.3 Phenotypic evaluation ...................................................................................... 57
5.2.4 Statistical analysis ............................................................................................ 57
5.3 Results ................................................................................................................... 58
5.3.1 Climatic and growing conditions ..................................................................... 58
5.3.2 Heritability, genetic variance and genetic correlations between environments58
4.3.2 Genetic similarities .......................................................................................... 39
v
5.3.3 BLUP analysis of grain yield and its components ........................................... 58
5.3.6 Relationships between grain weight, grains per m2 and grain yield ................ 66
5.4 Discussion .............................................................................................................. 66
5.5 Conclusion ............................................................................................................. 70
Chapter 6 Introgression of genetic material from primary synthetic wheat into an
elite bread wheat background .......................................................................................... 71
6.1 Introduction ........................................................................................................... 71
6.2 Materials and methods ........................................................................................... 72
6.2.1 Plant material ................................................................................................... 72
6.2.2 Marker application and detection of polymorphism ........................................ 72
6.2.3 Estimation of marker loci positioning and linkage .......................................... 73
6.2.4 Marker data analysis ........................................................................................ 74
6.3 Results ................................................................................................................... 75
6.3.1 Marker polymorphism ..................................................................................... 75
6.3.2 Genetic linkage of markers .............................................................................. 75
6.3.3 Introgressed primary synthetic alleles at loci associated with grain weight and
grains per m2 ................................................................................................................. 92
6.3.4 Recovered bread wheat alleles at loci associated with grain weight and grains
per m2 96
6.3.5 Effect of selection for high grain weight and grain yield performance on
synthetic allele retention ............................................................................................... 96
6.4 Discussion .............................................................................................................. 99
6.4.1 DArT marker screening of synthetic-derivatives ............................................. 99
6.4.2 Patterns of excess parental allele introgression and recovery ........................ 100
6.4.3 Beneficial parental alleles for increasing grain yield components ................ 100
6.5 Conclusion ........................................................................................................... 102
Chapter 7 General Discussion ........................................................................................ 103
7.1 Genetic diversity .................................................................................................. 103
7.2 Grain weight and grain yield under drought stressed environments ................... 104
7.3 Introgression of synthetic alleles ......................................................................... 106
7.4 Conclusions ......................................................................................................... 107
5.3.3.1 Grain yield performance .................................................................................. 58
5.3.3.2 Grain weight and grain per m2 performance .................................................... 63
6.2.4.1 Assumptions and expectations of synthetic introgression ............................... 74
6.2.4.2 Association of parental alleles with grain weight and grains per m2 data ....... 74
vi
Chapter 8 Conclusions ..................................................................................................... 108
Appendices ........................................................................................................................ 110
References ......................................................................................................................... 119
vii
List of Tables
Table 1. Thesis structure. ...................................................................................................... 4
Table 2. Primary synthetic wheats used in this study, their pedigrees, Australian Winter
Cereals Collection accession numbers and abbreviations used. .............................. 26
Table 3. Families of BC1F4-derived lines developed using Yitpi as the recurrent parent and
27 primary synthetics as the donor parent. .............................................................. 29
Table 4. Australian-grown bread and durum wheat cultivars used in this research, their
cultivation environments within the Australian wheat belt and breeding entities
from which they were bred. ..................................................................................... 31
Table 5. Recorded parentage of 32 primary synthetic wheats from the set of 44 used here
that had pedigree relationships. ............................................................................... 35
Table 6. Range and mean genetic similarity coefficients between and within 44 primary
synthetic wheat and nine Australian bread wheat cultivars using A, B and D
genome DArT data. .................................................................................................. 41
Table 7. Primary synthetic wheats, their associated derived families and the number of
synthetic-derived lines evaluated per family in field experiments at Minnipa,
Pinnaroo and Roseworthy in 2006 and 2007. .......................................................... 54
Table 8. Date of sowing for each field experiment, replication of synthetic derivatives per
experiment and number of reference check cultivar replicates sown per experiment.
................................................................................................................................. 55
Table 9. Rainfall data from Minnipa, Pinnaroo and Roseworthy during the years 2006 and
2007. ........................................................................................................................ 59
Table 10. Estimation of heritability and genetic variance for grain yield and grain weight
in experiments conducted under environments at Minnipa, Pinnaroo and
Roseworthy in 2006 and 2007. ................................................................................ 60
Table 11. Estimated genetic correlation matrices between environments for grain yield and
grain weight. ............................................................................................................ 61
Table 12. Simple linear correlation coefficients (r) for associations between grains per m2,
grain weight and grain yield across all synthetic backcross lines from 27 families
and across lines within the family Y31, at Minnipa in 2006 and 2007, Pinnaroo in
2007 and Roseworthy in 2006 and 2007. ................................................................ 67
viii
Table 13. Number of DArT marker loci positioned per chromosome in the genetic maps of
synthetic-derived families of lines Y14 and Y18. ................................................... 77
Table 14. Mapped DArT marker loci of Y14 and Y18, which explain the highest percent
of phenotypic variance for grain weight (mg/grain) and grains per m2 at
chromosome regions where loci that significant (p<0.05) association for these
traits. Parental allele detected at these loci that were significantly associated with
these higher values of grain yield components is displayed. Amount of trait
variance explained by a QTL at each of these loci was the difference between total
trait variance and the residual variance, expressed as a percent of the total variance.
................................................................................................................................. 93
Table 15. Number of DArT maker loci of families Y14 and Y18 that would identify a
primary synthetic allele in lines selected for high grain weight (significantly
(p<0.05) heavier grains than Yitpi), high grain yield (not significantly different
(p>0.05) grain yields of that of Yitpi) or both. ........................................................ 98
ix
List of Figures
Figure 1. Evolutionary events that formed bread wheat (Kihara 1944; McFadden and Sears
1946; Zohary and Hopf 1988; Araus et al. 2001; Salamini et al. 2002; Dvorak and
Akhunov 2005). ......................................................................................................... 6
Figure 2. The putative birthplace of bread wheat relative to the Fertile Crescent (the
domestication region of T. turgidum), and the distribution of collected Ae. tauschii
accessions (Harlan and Zohary 1966; Dvorak et al. 1998). ....................................... 7
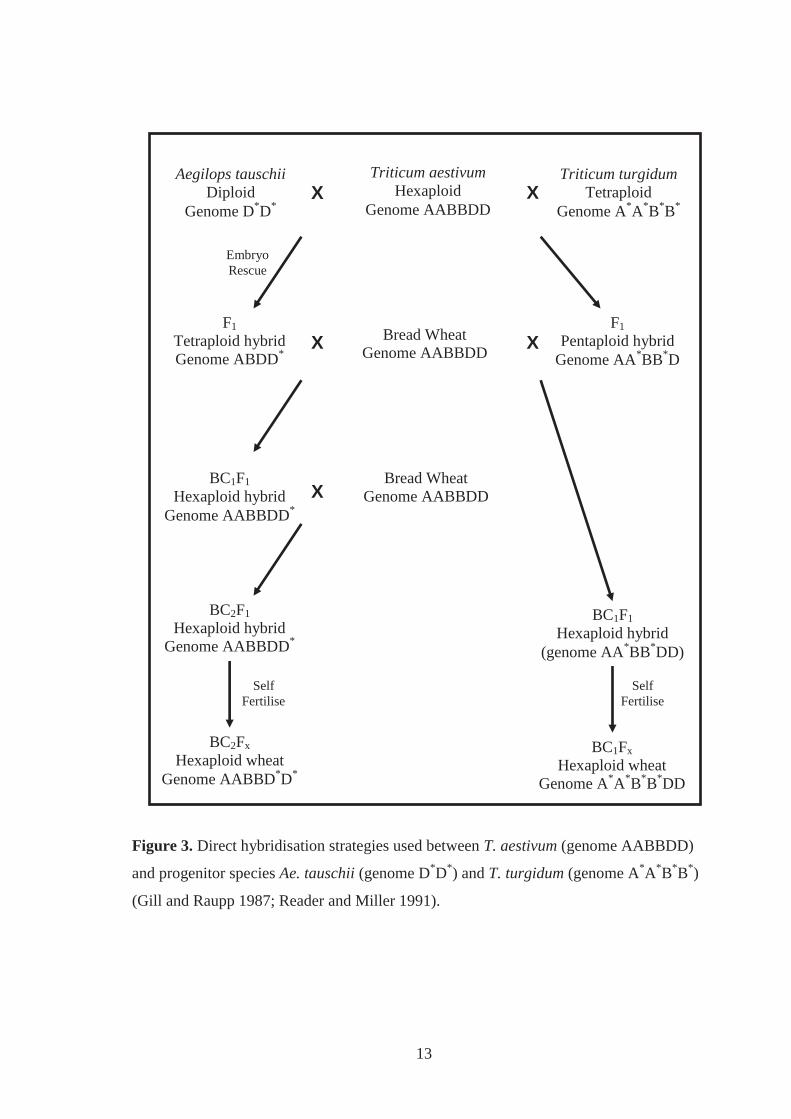
Figure 3. Direct hybridisation strategies used between T. aestivum (genome AABBDD)
and progenitor species Ae. tauschii (genome D*D*) and T. turgidum (genome
A*A*B*B*) (Gill and Raupp 1987; Reader and Miller 1991). ................................. 13
Figure 4. Creation of primary synthetic hexaploid wheat. Primary synthetic wheats are
crossed with bread wheat cultivars forming synthetic derivatives, which are
typically used in backcrossing strategies within breeding programs and research
studies (Reynolds et al. 1999; Reynolds et al. 2005; van Ginkel and Ogbonnaya
2007; Mujeeb-Kazi et al. 2008; Trethowan 2008). ................................................. 15
Figure 5. Backcross breeding strategies for the introgression of genetic material from
primary synthetic wheats into a bread wheat background (van Ginkel and
Ogbonnaya 2007; Trethowan 2008). ....................................................................... 22
Figure 6. Districts of the Australian wheat belt where bread wheat cultivar Yitpi is
adapted. Field experimenters for this study were conducted near Minnipa,
Roseworthy and Pinnaroo. Isohyets represent zones receiving an annual rainfall of
300mm and 600mm (AWB Limited 2003; Bureau of Meteorology 2008c; Bureau
of Rural Sciences 2008). .......................................................................................... 30
Figure 7. Distribution of polymorphic information content values of 1808 DArT marker
loci displaying polymorphism between 44 primary synthetic wheat and nine
Australian bread wheat cultivars. ............................................................................. 40
Figure 8. UPGMA dendrograms for 44 primary synthetic wheats, nine Australian bread
wheats and seven reference durum wheats, based on (A) 179 D-genome DArT
markers, and (B) 287 A-genome and 451 B-genome DArT marker loci.
Abbreviation of Ae. tauschii and durum wheat parentage of the primary synthetic
wheats is denoted within parentheses. ..................................................................... 43
x
Figure 9. Principal coordinate analysis (2-dimensional) of 44 primary synthetic wheat
genotypes and nine Australian bread wheat, five CIMMYT durum wheat and two
Australian grown durum wheat cultivars using data from (A) 179 D-genome DArT
markers, and (B) 287 A-genome and 451 B-genome DArT markers. ..................... 44
Figure 10. UPGMA dendrograms for 44 primary synthetic wheats and nine Australian
bread wheat cultivars, based on 1808 polymorphic DArT markers with and without
chromosomal assignment to A, B and D-genome chromosomes. Abbreviation of
Ae. tauschii and durum wheat parentage of the primary synthetics is denoted within
parentheses. .............................................................................................................. 46
Figure 11. Principal coordinate analysis (2-dimensional) of 44 primary synthetic wheat
genotypes and nine Australian bread wheats, created using data from all
polymorphic DArT markers with and without chromosomal assignment to the A, B
and D-genomes. ....................................................................................................... 47
Figure 12. Location of field experiments (Minnipa, Pinnaroo and Roseworthy) within the
in South Australian wheat belt. Isohyets represent zones receiving an annual
rainfall of 300mm and 600mm (Bureau of Meteorology 2008c). ........................... 56
Figure 13. BLUPs for grain yield of 27 families of synthetic-derived lines ( ), for
individual lines within those families ( and , where designates lines with
significantly (p<0.05) higher grain yield than their recurrent parent Yitpi) and for
five bread wheat cultivars ( ), grown at (A) Roseworthy in 2006 and 2007, (B)
Minnipa in 2006 and 2007 and (C) Pinnaroo in 2007. ............................................ 62
Figure 14. BLUPs for grain weight of 27 families of synthetic-derived lines ( ), for
individual lines within those families ( and , where designates lines with
significantly (p<0.05) heavier grain weight than their recurrent parent Yitpi) and for
five bread wheat cultivars ( ), grown at (A) Roseworthy in 2006 and 2007, (B)
Minnipa in 2006 and 2007 and (C) Pinnaroo in 2007. ............................................ 64
Figure 15. BLUPs for grains per m2 of 27 families of synthetic-derived lines ( ), for
individual lines within those families ( and , where designates lines with
significantly (p<0.05) more grains per m2 than their recurrent parent Yitpi) and for
five bread wheat cultivars ( ), grown at (A) Roseworthy in 2006 and 2007, (B)
Minnipa in 2006 and 2007 and (C) Pinnaroo in 2007. ............................................ 65
xi
Figure 16. Distribution of polymorphic information content values of A. 1048
polymorphic DArT marker loci of synthetic-derived family of lines Y14, and B.
993 polymorphic DArT marker loci of synthetic-derived family of lines Y18. ...... 76
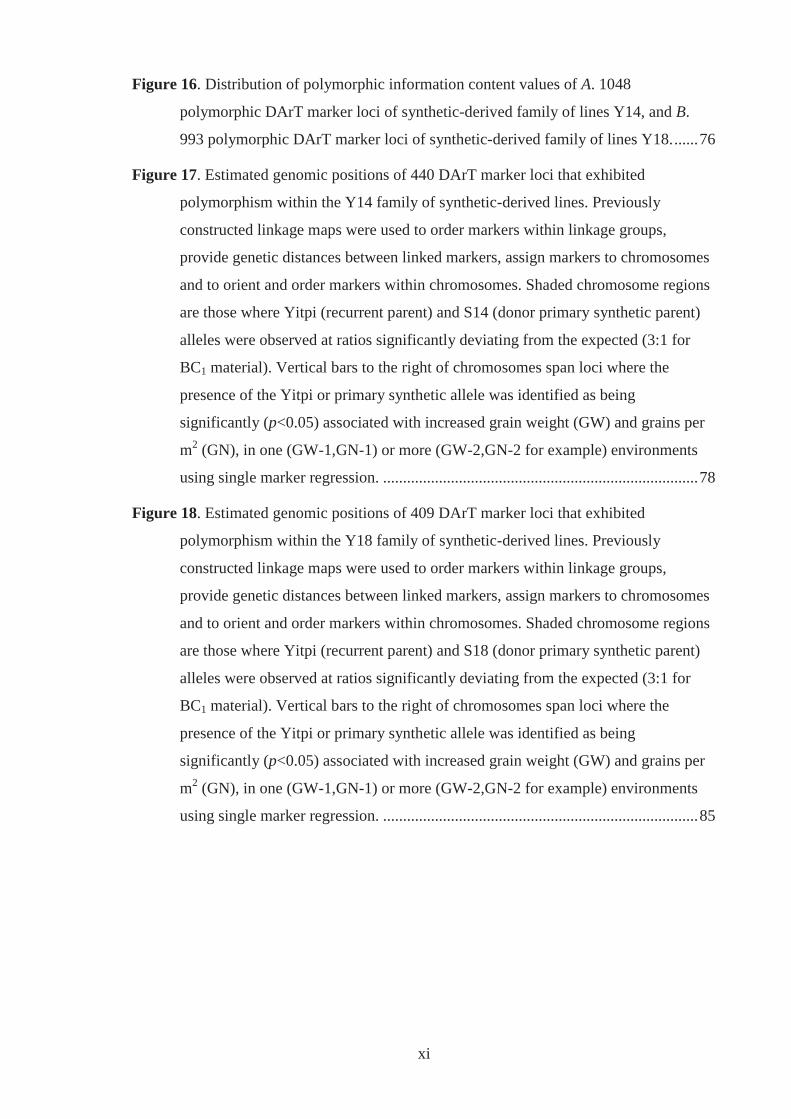
Figure 17. Estimated genomic positions of 440 DArT marker loci that exhibited
polymorphism within the Y14 family of synthetic-derived lines. Previously
constructed linkage maps were used to order markers within linkage groups,
provide genetic distances between linked markers, assign markers to chromosomes
and to orient and order markers within chromosomes. Shaded chromosome regions
are those where Yitpi (recurrent parent) and S14 (donor primary synthetic parent)
alleles were observed at ratios significantly deviating from the expected (3:1 for
BC1 material). Vertical bars to the right of chromosomes span loci where the
presence of the Yitpi or primary synthetic allele was identified as being
significantly (p<0.05) associated with increased grain weight (GW) and grains per
m2 (GN), in one (GW-1,GN-1) or more (GW-2,GN-2 for example) environments
using single marker regression. ............................................................................... 78
Figure 18. Estimated genomic positions of 409 DArT marker loci that exhibited
polymorphism within the Y18 family of synthetic-derived lines. Previously
constructed linkage maps were used to order markers within linkage groups,
provide genetic distances between linked markers, assign markers to chromosomes
and to orient and order markers within chromosomes. Shaded chromosome regions
are those where Yitpi (recurrent parent) and S18 (donor primary synthetic parent)
alleles were observed at ratios significantly deviating from the expected (3:1 for
BC1 material). Vertical bars to the right of chromosomes span loci where the
presence of the Yitpi or primary synthetic allele was identified as being
significantly (p<0.05) associated with increased grain weight (GW) and grains per
m2 (GN), in one (GW-1,GN-1) or more (GW-2,GN-2 for example) environments
using single marker regression. ............................................................................... 85
xii
List of Appendices
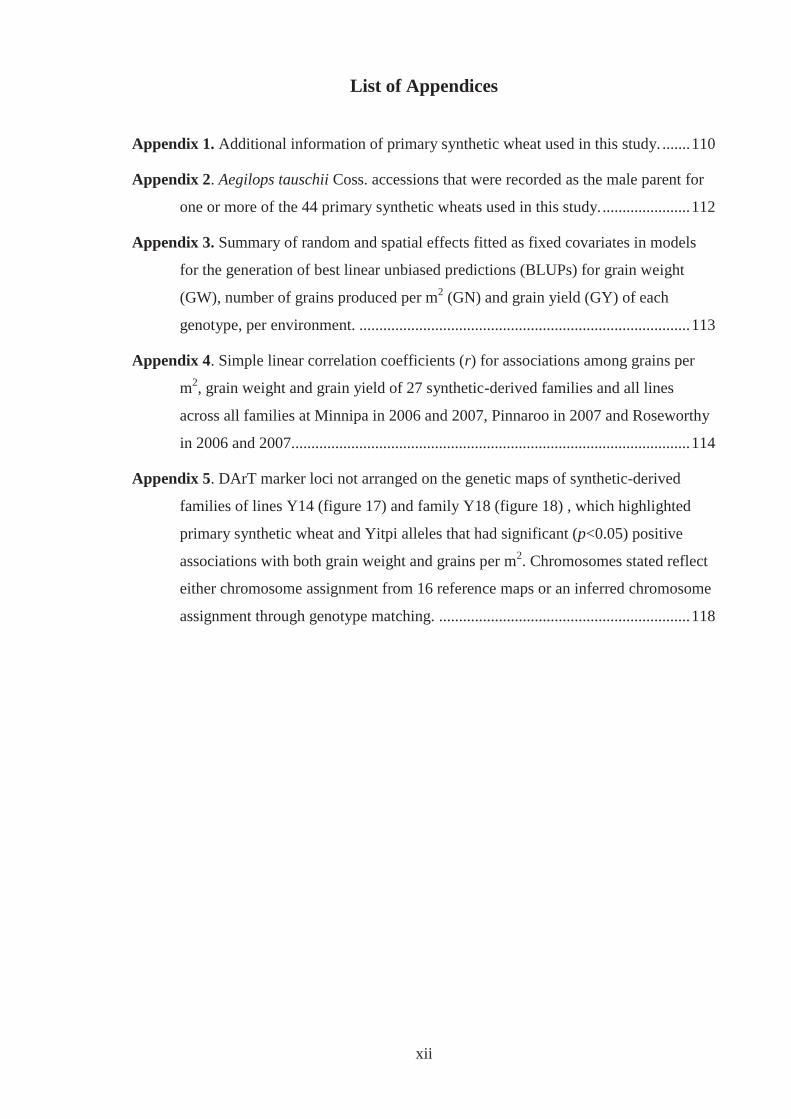
Appendix 1. Additional information of primary synthetic wheat used in this study. ....... 110
Appendix 2. Aegilops tauschii Coss. accessions that were recorded as the male parent for
one or more of the 44 primary synthetic wheats used in this study. ...................... 112
Appendix 3. Summary of random and spatial effects fitted as fixed covariates in models
for the generation of best linear unbiased predictions (BLUPs) for grain weight
(GW), number of grains produced per m2 (GN) and grain yield (GY) of each
genotype, per environment. ................................................................................... 113
Appendix 4. Simple linear correlation coefficients (r) for associations among grains per
m2, grain weight and grain yield of 27 synthetic-derived families and all lines
across all families at Minnipa in 2006 and 2007, Pinnaroo in 2007 and Roseworthy
in 2006 and 2007. ................................................................................................... 114
Appendix 5. DArT marker loci not arranged on the genetic maps of synthetic-derived
families of lines Y14 (figure 17) and family Y18 (figure 18) , which highlighted
primary synthetic wheat and Yitpi alleles that had significant (p<0.05) positive
associations with both grain weight and grains per m2. Chromosomes stated reflect
either chromosome assignment from 16 reference maps or an inferred chromosome
assignment through genotype matching. ............................................................... 118
xiii
Abstract Primary synthetic wheats, created by hybridising Triticum turgidum L. with Aegilops
tauschii Coss., the evolutionary progenitors of bread wheat (Triticum aestivum L.), have
shown potential value for use in Australian bread wheat breeding. This study investigated
primary and derived synthetic wheats in three ways to further evaluate this value. To
determine whether primary synthetic wheats could broaden genetic diversity in Australian
bread wheats, genetic similarity between and among 44 primary synthetics and nine
modern Australian bread wheats was investigated using Diversity Array Technology™
(DArT). Greater dissimilarity was observed between these germplasm groups than within
these groups. The A and B genomes of the primary synthetics were most divergent from
the genomes of the bread wheats. These primary synthetics therefore could broaden the
genetic diversity in Australian bread wheats. To identify primary synthetic wheats that
could improve grain yield of an Australian bread wheat in drought, grain yield and its
major components (grain weight and grains per m2) were measured in 27 BC1 synthetic-
derived families of lines in five drought stressed environments in southern Australia.
Fourteen families included lines with significantly (p<0.05) higher grain yield than Yitpi
(recurrent bread wheat parent). These lines produced grain yields up to 12.0 % higher than
Yitpi in the highest yielding environments, where improved grain weights were
responsible. In the lowest yielding environments, superior synthetic derivatives achieved
grain yields up to 43.8 % higher than Yitpi, with more grains per m2 commonly
responsible. Therefore, many but not all of the primary synthetics assessed could improve
grain yield of an Australian bread wheat in drought. To gain an understanding of synthetic
allele introgression into the genetic background of an Australian bread wheat, DArT loci
were assayed in two families of synthetic backcross lines. Approximately half of the same
loci assayed in each family showed synthetic allele introgression. At regions on
chromosome 2A in both families, synthetic alleles were positively associated with grain
weight and grain per m2. It was concluded that primary and derived synthetic wheats can
have broad value to bread wheat breeding in Australia.
xiv
Declaration
This work contains no material which has been accepted for the award of any other degree
or diploma in any university or other tertiary institution and, to the best of my knowledge
and belief, contains no material previously published or written by another person, except
where due reference has been made in the text.
I give consent to this copy of my thesis, when deposited in the University Library, being
made available for loan and photocopying, subject to the provisions of the Copyright Act
1968.
I also give permission for the digital version of my thesis to be made available on the web,
via the University’s digital research repository, the Library catalogue, the Australasian
Digital Theses Program (ADTP) and also through web search engines, unless permission
has been granted by the University to restrict access for a period of time.
Stephen John Talbot
March 2011
xv
Acknowledgements
I would like to thank my supervisors, Professor Diane Mather, Associate Professor
Kenneth Chalmers and Dr Francis Ogbonnaya for their academic supervision. I greatly
appreciated the teachings from Professor Andrew (Andy) Barr, who was my initial primary
supervisor before a change in his work commitments.
I thank the trustees of the South Australian Grains Industry Trust (SAGIT) for providing
the funding for my project through the Molecular Plant Breeding Cooperative Research
Centre (MPBCRC). MPBCRC provided professional development during my candidature,
which was in-part led by Dr Heather Bray, a friend and supporter during my studies.
I am indebted to the staff of Australian Grain Technologies (AGT), in particular Dr Haydn
Kuchel, Dr Jason Reinheimer and Simeon Hemer, who provided much guidance, logistical
help and expert knowledge during my studies. AGT provide in-kind field support that
made my field endeavours possible.
The following people and organisations have been important contributors to my project:
� Paul Eckermann and Dr Bev Gogel (GRDC National Statistics Program) for their
advice and support on trial design and analysis,
� Dr Harbans Bariana (Plant Breeding Institute, University of Sydney) for disease
nursery and glasshouse screening support,
� Jim Lewis (SARDI) for encouragement and the use of equipment,
� Barley Program (University of Adelaide) for the use of equipment,
� Members of the Molecular Marker Lab (University of Adelaide), in particular
Elysia Vassos and Dr Genet Mekuria for their friendship and encouragement.
I would like to thank my parents, Graham and Helen Talbot for encouraging me to always
do my best, and my siblings, extended family and friends for their ongoing support.
Professional editorial advice was sought from Mrs Margaret Cargill (Adjunct Senior
Lecturer, University of Adelaide) on spelling, grammar, sentence and paragraph structure
and language clarity. This advice was restricted to standards D and E of the Australian
Standards for Editing Practice (ASEP). Mrs Margaret Cargill’s current or former area of
academic specialisation is not similar to that presented in this thesis.
1
Chapter 1
General Introduction
Since the initial investigations by McFadden and Sears (1944) into the origins of bread
wheat (Triticum aestivum L.), it has been known that the genetic diversity of this important
food crop plant has the potential to extend beyond its own genetic base to also include
Triticum turgidum L. and Aegilops tauschii Coss. Bread wheat is an allohexaploid and has
evolved from multiple but limited hybridisation events between T. turgidum and Ae.
tauschii (McFadden and Sears 1946; Dvorak et al. 1998; Talbert et al. 1998). These
progenitor species are more genetically diverse than bread wheat (Lubbers et al. 1991; Reif
et al. 2005; Chabane et al. 2007), and possess genetic variation for traits that would be
desirable in modern bread wheat cultivars (van Ginkel and Ogbonnaya 2007). The
progenitor species of bread wheat are not readily used by breeders to develop new bread
wheat cultivars. Modern breeding programs exploit adapted bread wheats as primary
sources of germplasm. This is done to maintain characters within breeding pools that
confer adaptation and high end use quality. Genetic introgressions from unadapted
cultivars (secondary germplasm source) and T. turgidum and Ae. tauschii selections
(tertiary germplasm sources) may express deleterious traits in target environments.
However, limited trait variation in adapted germplasm and limited access to unadapted
sources with known agronomic performance is increasingly inhibiting breeders from
developing improved cultivars, for changing environments and for the requirements of
growers and consumers (Gollin et al. 2000; van Ginkel and Ogbonnaya 2007). The
introgression of genetic material from T. turgidum and Ae. tauschii into the background of
adapted bread wheats may therefore be an option to introduce valuable variation for
breeding new cultivars.
Several strategies exist to develop bridging lines that facilitate the introgression of generic
material from T. turgidum and Ae. tauschii into bread wheat. Such bridging lines can be
produced from ‘direct crossing’ strategies between bread wheat and T. turgidum or Ae.
tauschii, however these strategies commonly require embryo rescue and several
generations of backcrossing and self pollination to produce genetically stable lines
(Reinhold et al. 1983; Gill and Raupp 1987; Cox et al. 1991; Reader and Miller 1991; Cox
et al. 1995; Knott et al. 2005). These activities can be time and resource consuming. An
alternative strategy is to hybridise T. turgidum with Ae. tauschii, producing bridging lines
called ‘primary synthetic wheat’. This strategy does not require multiple generations of
2
backcrossing or self pollination to make primary synthetic wheat genetically stable, but
only the possible use of embryo rescue and/or a simple colchicine treatment for
chromosome doubling (Liu et al. 2002; Matsuoka and Nasuda 2004; Mujeeb-Kazi et al.
2008). As primary synthetic wheats can be readily crossed with bread wheat (Lange and
Jochemsen 1992), they can act as practical breeding tools for simultaneously exploiting the
genomes of selected T. turgidum and Ae. tauschii cultivars and wild accessions.
In Australia primary synthetic wheats have the potential to improve the adaptation of local
bread wheat cultivars. Primary synthetics have been reported to express genetic variation
for traits that would be desirable in Australian bread wheat cultivars, which include
drought tolerance (Reynolds et al. 2007), heat stress tolerance (Yang et al. 2002) and
enhanced grain yield components (Villareal et al. 1994a; Villareal et al. 1994b). However
some primary synthetics exhibit deleterious traits, such as poor threshability and excessive
height (Pritchard et al. 2002; Tyagi et al. 2004; van Ginkel and Ogbonnaya 2007).
Backcrossing and selection strategies can be used to introgress genetic material from
primary synthetic wheat into deficient bread wheat cultivars. Using primary synthetic
wheat as the donor parent and an Australian bread wheat cultivar as the recipient and
recurrent parent can produce enhanced synthetic backcross lines. Genetically these lines
would mainly constitute the recurrent bread wheat parent with introgression segments from
the primary synthetic parent (Allard 1960; Tanksley and Nelson 1996).
In light of the breeding potential of primary synthetic wheats to develop improved
Australian bread wheat cultivars there are three key research areas that need investigating,
which include 1. genetic diversity, 2. grain weight and grain yield under drought stressed
environments, and 3. introgression of synthetic alleles. To elaborate, Australian bread
wheats are more genetic diverse than those from western Europe, the United Kingdom and
the United States of America (Akbari et al. 2006; White et al. 2008), however
investigations into whether primary synthetic wheats can be a useful resource to broaden
the genetic diversity of modern Australian bread wheats have yet to be performed. Under a
range of Australian environments, synthetic derived material, namely synthetic backcross
lines, have achieved superior grain yields compared to their recurrent Australian bread
wheat parent (Gororo et al. 2002; Dreccer et al. 2007; Ogbonnaya et al. 2007). The studies
by Dreccer et al. (2007) and Ogbonnaya et al. (2007), which investigated a large number
of synthetic backcross lines, did not report the major grain yield component(s) responsible
for these superior grain yields, nor the influence of different primary synthetic parents on
3
these components. The potential of primary synthetic wheats to increase yield of an
Australian bread wheat in drought stressed environments in southern Australia has also not
been assessed before. Molecular marker analysis of synthetic backcross lines evaluated in
environments outside of Australia has identified introgressed primary synthetic alleles
responsible for improving the major grain yield components (Narasimhamoorthy et al.
2006; Röder et al. 2008), and grain quality parameters (Kunert et al. 2007). This type of
molecular analysis has not been performed on synthetic backcross lines evaluated in
Australian environments, which could identify primary synthetic alleles with positive
effects on grain weight and grain yield. Further, the comparison of genetic introgression
patterns from crossing more than one primary synthetic wheat separately to a common
bread wheat has also not been investigated.
The main aim of this study was to investigate the value and potential use of primary and
derived synthetic wheat in Australian bread wheat breeding programs. The evaluation of
many primary synthetic wheats and associated families of synthetic backcross lines was
performed in an Australian context, using Australian bread wheat cultivars and other
reference germplasm. As outlined in Table 1, this study will review relevant literature
(Chapter 2), and report on and discuss experimental methods and results. This study
evaluated families of synthetic backcross lines in field experiments in Australian
environments, to assess their grain yield performance and its major components (grain
weight and grains per m2) (Chapter 5). Molecular marker assays formed the basis of
genetic similarity investigations between primary synthetic wheat and modern Australian
bread wheat cultivars (Chapter 4), and also examinations of synthetic allele introgression
within families of synthetic backcross lines (Chapter 6). Two final chapters will provide a
general discussion (Chapter 7) and state the conclusions of the research (Chapter 8).
4
Table 1. Thesis structure.
Chapter Content
1 General introduction
2 Review of literature on the creation and breeding advantages of primary
synthetic wheat, their global use and achievements made with them in
Australia
3 Plant material used in the investigations
4 Comparison of genetic similarity between primary synthetic wheat and
modern Australian bread wheat cultivars
5 Assessment of grain yield and grain yield-components of synthetic backcross
lines in diverse drought stressed environments of southern Australia
6 Identification of introgressed synthetic wheat alleles and their linkage to
improved grain yield components
7 General discussion
8 Conclusions
5
Chapter 2
Review of literature: Synthetic wheat 2.1 Introduction
Primary synthetic wheats are bridging lines used to simultaneously introgress genetic
material from the progenitor species of bread wheat into modern bread wheat cultivars.
These bridging lines are evaluated for their potential to develop synthetic derivatives
suitable for practical breeding and cultivar development. This review will cover the
evolution and domestication of bread wheat, genetic diversity within bread wheat, the
rationale for using primary synthetic wheat as a genetic bridge, grain yield and component
performance of synthetic backcross lines, and the introgression of diverse genetic material
into modern bread wheat cultivars. An Australian perspective will be covered in these
subject areas.
2.2 Bread wheat, an allohexaploid
2.2.1 Evolution
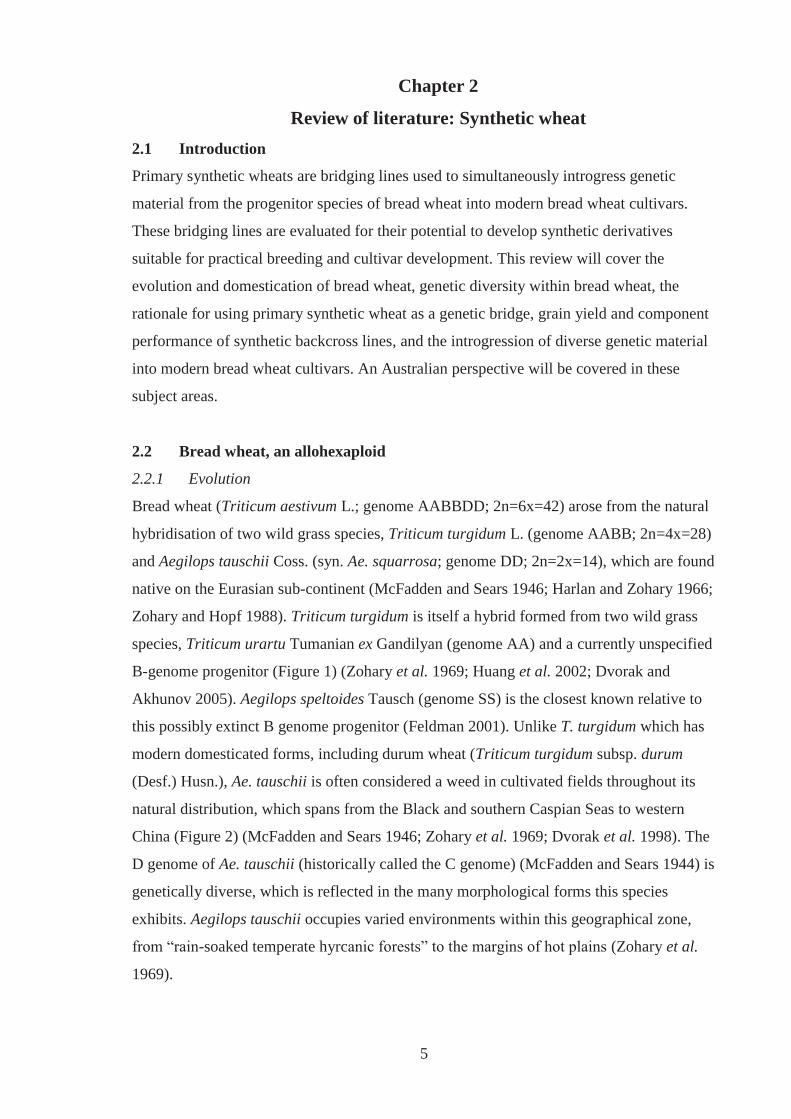
Bread wheat (Triticum aestivum L.; genome AABBDD; 2n=6x=42) arose from the natural
hybridisation of two wild grass species, Triticum turgidum L. (genome AABB; 2n=4x=28)
and Aegilops tauschii Coss. (syn. Ae. squarrosa; genome DD; 2n=2x=14), which are found
native on the Eurasian sub-continent (McFadden and Sears 1946; Harlan and Zohary 1966;
Zohary and Hopf 1988). Triticum turgidum is itself a hybrid formed from two wild grass
species, Triticum urartu Tumanian ex Gandilyan (genome AA) and a currently unspecified
B-genome progenitor (Figure 1) (Zohary et al. 1969; Huang et al. 2002; Dvorak and
Akhunov 2005). Aegilops speltoides Tausch (genome SS) is the closest known relative to
this possibly extinct B genome progenitor (Feldman 2001). Unlike T. turgidum which has
modern domesticated forms, including durum wheat (Triticum turgidum subsp. durum
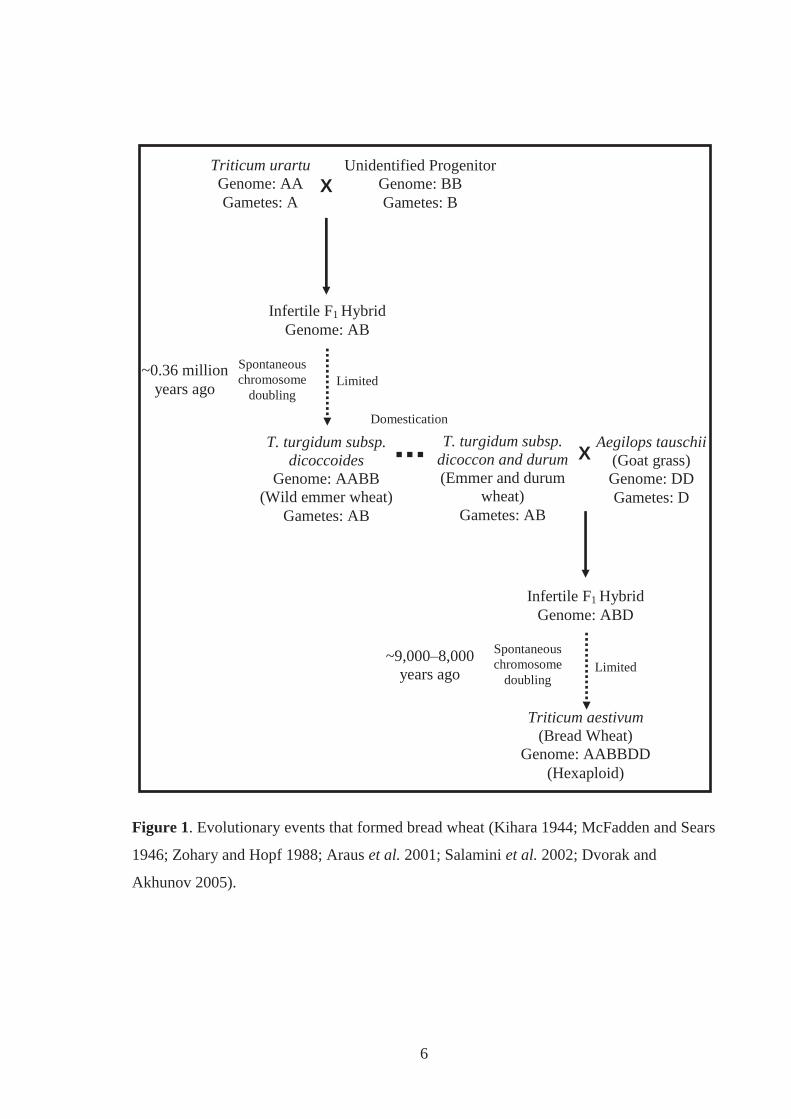
(Desf.) Husn.), Ae. tauschii is often considered a weed in cultivated fields throughout its
natural distribution, which spans from the Black and southern Caspian Seas to western
China (Figure 2) (McFadden and Sears 1946; Zohary et al. 1969; Dvorak et al. 1998). The
D genome of Ae. tauschii (historically called the C genome) (McFadden and Sears 1944) is
genetically diverse, which is reflected in the many morphological forms this species
exhibits. Aegilops tauschii occupies varied environments within this geographical zone,
from “rain-soaked temperate hyrcanic forests” to the margins of hot plains (Zohary et al.
1969).
6
Figure 1. Evolutionary events that formed bread wheat (Kihara 1944; McFadden and Sears
1946; Zohary and Hopf 1988; Araus et al. 2001; Salamini et al. 2002; Dvorak and
Akhunov 2005).
Domestication
Triticum urartu Genome: AA Gametes: A
Unidentified Progenitor Genome: BB Gametes: B
X
T. turgidum subsp. dicoccon and durum (Emmer and durum
wheat) Gametes: AB
Aegilops tauschii (Goat grass) Genome: DD Gametes: D
Triticum aestivum (Bread Wheat)
Genome: AABBDD (Hexaploid)
Infertile F1 Hybrid Genome: ABD
X
Spontaneous chromosome
doubling Limited ~9,000–8,000 years ago
T. turgidum subsp. dicoccoides
Genome: AABB (Wild emmer wheat)
Gametes: AB
Spontaneous chromosome
doubling
Infertile F1 Hybrid Genome: AB
Limited ~0.36 million years ago
7
Figure 2. The putative birthplace of bread wheat relative to the Fertile Crescent (the
domestication region of T. turgidum), and the distribution of collected Ae. tauschii
accessions (Harlan and Zohary 1966; Dvorak et al. 1998).
Saudi Arabi
Iran
Afghanistan
China
Kazakhstan
India
Russia
Legend: Putative birthplace of bread wheat
8
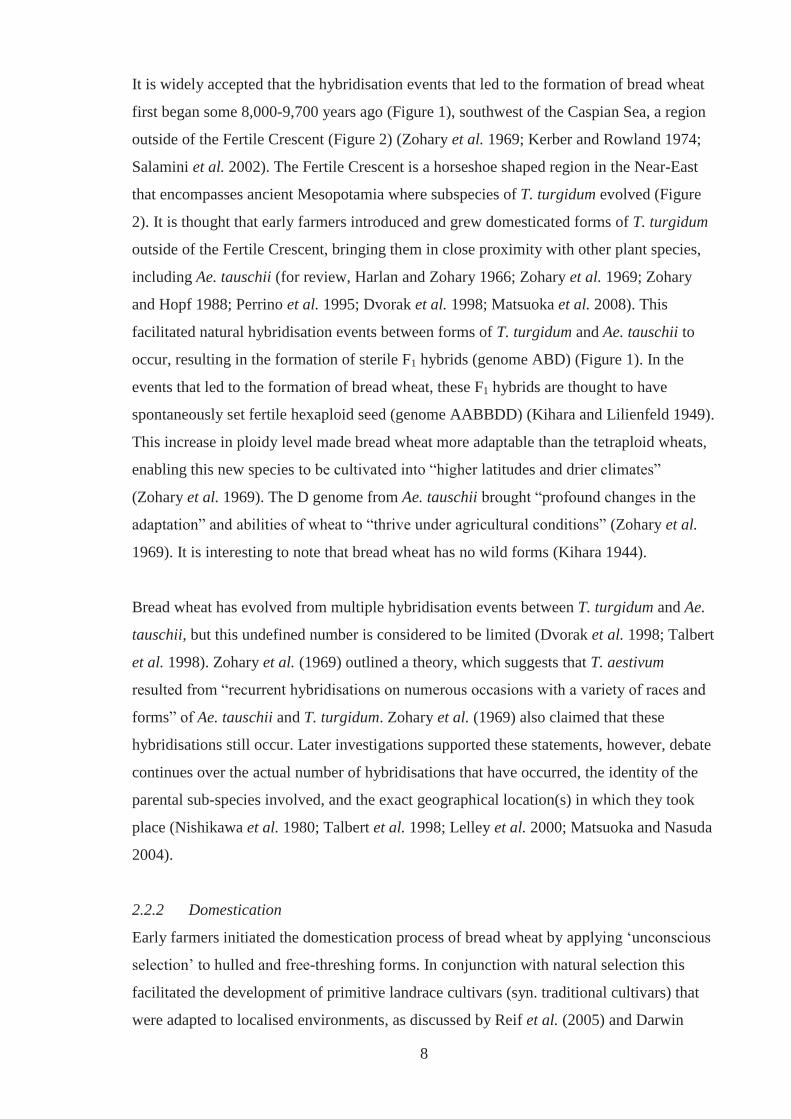
It is widely accepted that the hybridisation events that led to the formation of bread wheat
first began some 8,000-9,700 years ago (Figure 1), southwest of the Caspian Sea, a region
outside of the Fertile Crescent (Figure 2) (Zohary et al. 1969; Kerber and Rowland 1974;
Salamini et al. 2002). The Fertile Crescent is a horseshoe shaped region in the Near-East
that encompasses ancient Mesopotamia where subspecies of T. turgidum evolved (Figure
2). It is thought that early farmers introduced and grew domesticated forms of T. turgidum
outside of the Fertile Crescent, bringing them in close proximity with other plant species,
including Ae. tauschii (for review, Harlan and Zohary 1966; Zohary et al. 1969; Zohary
and Hopf 1988; Perrino et al. 1995; Dvorak et al. 1998; Matsuoka et al. 2008). This
facilitated natural hybridisation events between forms of T. turgidum and Ae. tauschii to
occur, resulting in the formation of sterile F1 hybrids (genome ABD) (Figure 1). In the
events that led to the formation of bread wheat, these F1 hybrids are thought to have
spontaneously set fertile hexaploid seed (genome AABBDD) (Kihara and Lilienfeld 1949).
This increase in ploidy level made bread wheat more adaptable than the tetraploid wheats,
enabling this new species to be cultivated into “higher latitudes and drier climates”
(Zohary et al. 1969). The D genome from Ae. tauschii brought “profound changes in the
adaptation” and abilities of wheat to “thrive under agricultural conditions” (Zohary et al.
1969). It is interesting to note that bread wheat has no wild forms (Kihara 1944).
Bread wheat has evolved from multiple hybridisation events between T. turgidum and Ae.
tauschii, but this undefined number is considered to be limited (Dvorak et al. 1998; Talbert
et al. 1998). Zohary et al. (1969) outlined a theory, which suggests that T. aestivum
resulted from “recurrent hybridisations on numerous occasions with a variety of races and
forms” of Ae. tauschii and T. turgidum. Zohary et al. (1969) also claimed that these
hybridisations still occur. Later investigations supported these statements, however, debate
continues over the actual number of hybridisations that have occurred, the identity of the
parental sub-species involved, and the exact geographical location(s) in which they took
place (Nishikawa et al. 1980; Talbert et al. 1998; Lelley et al. 2000; Matsuoka and Nasuda
2004).
2.2.2 Domestication
Early farmers initiated the domestication process of bread wheat by applying ‘unconscious
selection’ to hulled and free-threshing forms. In conjunction with natural selection this
facilitated the development of primitive landrace cultivars (syn. traditional cultivars) that
were adapted to localised environments, as discussed by Reif et al. (2005) and Darwin
9
(1868). Over time farmers applied a level of ‘active selection’, most likely based on
germination vigour, simultaneous ripening, general aesthetics, threshability, grain yield
and taste (Heiser 1988).
2.2.3 Genetic diversity in bread wheat
2.2.3.1 Implications of evolution and domestication
Genetic diversity within the bread wheat gene pool has arguably been restricted by the
limited number of hybridisation events that form this species, and from early domestication
activities (Dvorak et al. 1998; Talbert et al. 1998). Zohary et al. (1969) reported that
“crossing between Ae. squarrosa (syn. Ae. tauschii) and both tetraploid and hexaploid
cultivated wheat can be detected in Iran at the present time”. However, Lubbers et al.
(1991) reported Ae. tauschii to contain “more genetic variability for disease and insect
resistance, isozymes, and seed storage proteins than the D genome of T. aestivum.” Lelley
et al. (2000) later reported that average gene diversity is greater in Ae. tauschii than in
modern bread wheat cultivars. A study by Reif et al. (2005), which used DNA
fingerprinting to analyse the D genome of landrace bread wheat and Ae. tauschii
accessions also showed a loss of genetic diversity from the Ae. tauschii accessions to the
landrace selections.
2.2.3.2 Implications of modern breeding
2.2.3.2.1 Global trends
The genetic effects of modern breeding practices on the global gene pool of bread wheat
and other crop species have been well documented (Frankel 1970; Ullstrup 1972; Tanksley
and McCouch 1997; Manifesto et al. 2001; Khlestkina et al. 2004; Roussel et al. 2005;
Tian et al. 2005; White et al. 2008). These studies indicate that changes to genetic diversity
in bread wheat vary among wheat growing regions. The genetic base and the incorporation
of diverse germplasm over time within these regions (North and South America, Europe,
Asia and Australia for example) have influenced this. However, key events and the
activities of international breeding programs have had global impacts.
An important worldwide breeding phenomenon, the ‘green revolution’ took place in the
mid to late 1900’s. It led to the replacement of standard-height cultivars, including
landrace forms, by semi-dwarf cultivars (Frankel 1970; Smale et al. 2002). The term
‘genetic erosion’ was used at the time to capture the concept of this transition (as reviewed
by Frankel 1970; Harlan 1972). Stemming from Norin 10, a Japanese variety that
10
contained the Rht1 (Rht-B1b) and Rht2 (Rht-D1b) dwarfing genes, semi-dwarf bread
wheats are now the standard form developed by modern breeding programs. Under
changing agricultural regimes that included the use of artificial fertilisers, semi-dwarf
cultivars outperformed their landrace counterparts. Semi-dwarf wheat had improved
spikelet fertility and efficiency of accumulating assimilates for grain development rather
than for straw (as reviewed by Worland and Snape 2001; Smale et al. 2002). Smale et al.
(2002) estimated that in 1997, only 3% of the area sown to spring bread wheat in the
developing world, including China, was to landrace cultivars.
2.2.3.2.2 Influence of CIMMYT
The International Maize and Wheat Improvement Center (CIMMYT), based in Mexico, is
a key organisation in world wheat breeding efforts. CIMMYT develops wheat germplasm
for developing countries to provide yield stability, genetic enrichment and environmental
protection (CIMMYT 2004). Changes in the genetic diversity of the germplasm output
from such an organisation can have global implications. In 1997, CIMMYT germplasm
was present in the pedigree of 86% of all spring wheat sown by the developing world,
excluding China (Smale et al. 2002). Such wheat germplasm has been referred to as
‘CIMMYT-related’. Studies carried out by Reif et al. (2005) into the genetic diversity of
spring wheat and its relation to the international breeding efforts of the past 50 years, found
that there was a “narrowing of genetic diversity among major CIMMYT modern wheat
cultivars” between 1950 and 1981. This occurred despite CIMMYT obtaining genetic
material during this period from locations in Turkey, Russia, the Middle East, Africa,
Spain, the United States of America (USA), eastern Europe and South America (Villareal
1994). The influence of individual breeders must also be considered. Breeding practices of
an individual at the Plant Breeding Institute in the United Kingdom (UK) involved the use
of limited germplasm that contained the Rht dwarfing genes. This led to a reduction of
genetic diversity within the respective breeding pool (Warburton et al. 2006). As
CIMMYT has a pivotal role in the maintenance of global genetic diversity, in the 1970’s
and 1980’s changes were made in CIMMYT breeding programs, which led to an increase
in the genetic diversity of cultivars released between 1982 and 1997 (Villareal 1994).
These changes involved exploitation of both winter and spring wheat gene pools by
intercrossing, incorporating new plant material from Brazilian breeders and access to new
Chinese gene pools via the Chinese Academy of Agricultural Science (Villareal 1994).
Since then genetic diversity within CIMMYT breeding material has stabilised, which has
11
had flow-on effects to countries using CIMMYT-related germplasm in their own breeding
programs (Smale et al. 2002; Warburton et al. 2006).
Despite CIMMYT actively broadening the genetic base of its bread wheat breeding pools,
a gap still exists between the genetic diversity of its modern bread wheat cultivars and their
landrace counter-parts. Molecular marker analyses of the A and B genomes of landrace
bread wheat and CIMMYT bread wheat cultivars released after 1950 has shown slightly
less gene diversity in the latter, with more unique alleles per locus present in the landrace
forms (Reif et al. 2005). Dreisigacker et al. (2005) reported similar findings, stating that
landrace bread wheat had “considerable genetic diversity.” Other analyses reported by Reif
et al. (2005), which focused on the D genomes of landrace and modern bread wheat
showed that there were no significant differences in gene diversity between these two D
genome pools.
2.2.3.3 Genetic diversity in Australian bread wheat
Australian bread wheat cultivars and breeding material have been found to be genetically
more diverse than those from western Europe, the UK and the USA (Akbari et al. 2006;
White et al. 2008). This has been attributed to Australian breeders using varieties and
breeding material from many sources, which includes programs in the UK, USA, Canada,
South Africa, India and Italy (O’Brien et al. 2001). The exploitation of germplasm from
CIMMYT has also provided improvement to Australian bread wheats at a national level
(Brennan and Fox 1998). Molecular marker analysis of the A, B and D genomes of
Australian bread wheat cultivars released since 1901 and historically important breeding
material, found the genetic similarity among older cultivars to be higher than among
modern cultivars (Paull et al. 1998; Parker et al. 2002). On the other hand investigations
reported by White et al. (2008), showed that the genetic similarity (converse of genetic
distance) of Australian bread wheats has fluctuated since the early 1900’s. The use of
different molecular marker systems and genotypes to represent Australian bread wheat
germplasm by these studies may have influenced the reported results, however none of
these reports stated that modern breeding activities in Australia have significantly reduced
genetic diversity in local bread wheat pools.
2.2.3.4 Germplasm resources for bread wheat breeders
Germplasm resources that can maintain or increase the genetic diversity of bread wheat
gene pools in countries such as Australia need not only be genetically diverse but also
12
express agronomically desirable traits. Landrace bread wheats are known to be a
germplasm resource for important traits (as reviewed by Moghaddam et al. 1997),
however, there are few reports of their deliberate use within modern breeding programs.
Theoretical modelling for the exploitation of traits possessed by landrace accessions, which
are stored in seed banks provides some explanation for this (Gollin et al. 2000). Gollin et
al. (2000) reported that for many accessions of landrace bread wheats held by seed banks
there is a lack of detailed information about their origin, ancestry and performance. This
situation has to some extent inhibited breeders from using these materials to develop
improved cultivars for changing environments, and for the requirements of growers and
consumers (van Ginkel and Ogbonnaya 2007). Triticum turgidum and Ae. tauschii are
alternative sources of diverse germplasm, which can be used in ‘pre-breeding’. These
progenitor species of bread wheat are well known sources of important traits for modern
cultivars. For example, resistance to Fusarium head blight and cereal rusts are expressed by
T. turgidum subsp. dicoccoides (Nevo 2001; Oliver et al. 2007), with resistance to stem
rust, powdery mildew and tan spot being identified in Ae. tauschii (Cox et al. 1992; Yang
et al. 2003a).
2.3 Exploiting the progenitors of bread wheat
2.3.1 Direct hybridisations with T. turgidum
Bread wheat can be directly hybridised with T. turgidum (Figure 3). This strategy can
transfer desirable alleles from the A and B genomes of T. turgidum into the complementary
A and B genomes of modern bread wheat cultivars. These direct hybridisations typically
use T. turgidum as the female parent, with bread wheat as the male parent. Genes
conferring resistance to stem, leaf and stripe rust, and powdery mildew have been
introgressed into the A and B genomes of bread wheat in this way (Reinhold et al. 1983;
Reader and Miller 1991; Knott et al. 2005). However, direct hybridisations between T.
turgidum and bread wheat can lead to genetically unstable hybrids. Non-hexaploid hybrids
are initially produced from this strategy, with backcrossing to the recurrent bread wheat
parent and self fertilisation required to return to a stable hexaploid state (Figure 3). During
this crossing strategy hybrids can revert back to being tetraploid (Knott et al. 2005).
2.3.2 Direct hybridisations with Ae. tauschii
Direct hybridisations between Ae. tauschii and bread wheat can be achieved as the D
genome of this species readily recombines with the D genome of bread wheat (Figure 3).
13
Figure 3. Direct hybridisation strategies used between T. aestivum (genome AABBDD)
and progenitor species Ae. tauschii (genome D*D*) and T. turgidum (genome A*A*B*B*)
(Gill and Raupp 1987; Reader and Miller 1991).
Triticum aestivum Hexaploid
Genome AABBDD
Triticum turgidum Tetraploid
Genome A*A*B*B* Aegilops tauschii
Diploid Genome D*D* X
BC1F1 Hexaploid hybrid
Genome AABBDD*
X
F1 Pentaploid hybrid
Genome AA*BB*D F1
Tetraploid hybrid Genome ABDD*
Bread Wheat Genome AABBDD X X
BC1F1 Hexaploid hybrid
(genome AA*BB*DD)
BC2Fx Hexaploid wheat
Genome AABBD*D* BC1Fx
Hexaploid wheat Genome A*A*B*B*DD
Bread Wheat Genome AABBDD X
BC2F1 Hexaploid hybrid
Genome AABBDD*
Embryo Rescue
Self Fertilise Self
Fertilise
14
This direct crossing strategy has successfully introgressed quality characters and resistance
to wheat spindle-streak mosaic virus, leaf rust and soil borne mosaic virus into bread wheat
cultivars (Gill and Raupp 1987; Cox et al. 1994; Murphy et al. 1997; Yan et al. 2003).
However, direct hybridisation between bread wheat and Ae. tauschii requires human
intervention, commonly involving embryo rescue and up to four cycles of crossing to
regain a stable hexaploid (Figure 3) (Gill and Raupp 1987; Cox et al. 1991). Cox et al.
(1995) reported that 35% of BC2F1 individuals produced from this strategy were aneuploid.
Seed abortion, lethality and sterility can occur in the F1 hybrids (Gill and Raupp 1987).
Suppression of traits donated from Ae. tauschii in bread wheat is also not uncommon.
Investigations reported by Yang et al. (2003b) showed suppression of stripe rust resistance
upon the direct hybridisation between resistant Ae. tauschii accessions and susceptible
bread wheat. Gill and Raupp (1987) also reported a reduced level of leaf rust resistance in
susceptible bread wheat derivatives compared to the Ae. tauschii donor.
2.3.3 Synthetic hexaploid wheat
2.3.3.1 Creation, advantages and history
Primary synthetic wheat (genome AABBDD; 2n=6x=42) is the hybrid from crossing
between the evolutionary progenitors of bread wheat, T. turgidum and Ae. tauschii
(McFadden and Sears 1944; McFadden and Sears 1946). Creating primary synthetic wheat
involves screening subspecies and accessions of T. turgidum and Ae. tauschii for characters
desired in the resulting hybrid (Figure 4) (Reynolds et al. 1999). Spikes of the T. turgidum
parent are usually emasculated (removal of anthers) and pollinated using anthers from a
selected Ae. tauschii accession. Developing embryos are rescued by excision from the
developing seeds and further developed on culture media. Root and shoot growth is
initiated from differentiated embryos forming plantlets, which are examined for
chromosomal composition (genome ABD). Colchicine treatment is used to induce
chromosome doubling in the crown of plantlets so that hexaploid seeds set upon self
fertilisation (McFadden and Sears 1946; Lange and Jochemsen 1992; Mujeeb-Kazi et al.
1996; Fernandes et al. 2000; Mujeeb-Kazi et al. 2008). Before a primary synthetic wheat is
crossed to bread wheat cultivar it is screened for the characters initially observed in the
parental T. turgidum and Ae. tauschii accessions (Figure 4) (Reynolds et al. 2005).
The development and use of primary synthetic wheat for use as a genetic bridge provide
several advantages over direct crossing between bread wheat and T. turgidum or Ae.
tauschii. Embryo rescue and colchicine treatment are not always required for the

15
Figure 4. Creation of primary synthetic hexaploid wheat. Primary synthetic wheats are
crossed with bread wheat cultivars forming synthetic derivatives, which are typically used
in backcrossing strategies within breeding programs and research studies (Reynolds et al.
1999; Reynolds et al. 2005; van Ginkel and Ogbonnaya 2007; Mujeeb-Kazi et al. 2008;
Trethowan 2008).
X
X
F1 Synthetic derivative
Triticum turgidum subsp.
Genome: AABB Gamete: AB
Aegilops tauschii accession
Genome: DD Gamete: D
Primary synthetic hexaploid wheat
Genome: AABBDD
F1 Hybrid Genome: ABD
Colchicine treatment or spontaneous chromosome
doubling
Embryo rescue or set seed
Screen Select
Hybridise
Bread Wheat Primary synthetic wheat Expressing target
character
Seed increase and
screen
16
production of primary synthetic wheat. Some combinations of T. turgidum and Ae. tauschii
can produce F1 hybrids without human assistance, and some hybrids can spontaneously set
hexaploid seed at relatively high frequencies (Liu et al. 2002; Matsuoka and Nasuda 2004).
Once made, primary synthetic wheat can be readily crossed to bread wheat cultivars,
leading to genetically stable F1 synthetic derivatives without the need of backcrossing
(Lange and Jochemsen 1992; Mujeeb-Kazi et al. 2008). The genomes of both T. turgidum
and Ae. tauschii can be simultaneously exploited using primary synthetic wheat, which can
provide a platform to observe trait expression from these progenitor genomes at the
hexaploid level before crossing to a bread wheat cultivar.
The first attempts to make primary synthetic wheat were performed in the early 1900’s,
with ‘synthetic spelta’ being created during an investigation to determine the progenitors of
Triticum aestivum subsp. spelta (L.) Thell., a primitive form of bread wheat (McFadden
and Sears 1946). The term ‘synthetic hexaploid wheat’ was used by McFadden and Sears
(1946) to describe the synthesis of this allopolyploid hybrid. Successful re-synthesis
attempts by McFadden and Sears (1946) were only achieved using T. turgidum subsp.
dicoccoides with Ae. tauschii, and not with other subspecies of T. turgidum. More recent
efforts to create primary synthetic wheat have successfully hybridised different accessions
of Ae. tauschii with T. turgidum subspecies durum (Desf.) Husn. (durum wheat) (Dreccer
et al. 2007; Ogbonnaya et al. 2007), dicoccoides (Korn. Ex Ash. & Graebn.) Thell. (‘wild
emmer’ wheat) (Lange and Jochemsen 1992), dicoccon (Schrank) Thell. (‘emmer’ wheat)
(Lage et al. 2003) and carthlicum (Nevski) A. Love & D. Love (Persian black wheat) (Liu
et al. 2006). In most primary synthetic wheats Ae. tauschii is the source of novel genetic
material, as a durum wheat cultivar or breeding line is commonly used as the tetraploid
parent (Trethowan and Mujeeb-Kazi 2008).
2.3.3.3 Production and use of synthetics by CIMMYT and the world
CIMMYT began investigating the use of synthetic wheat in the late 1980’s, as a breeding
resource to obtain genetic diversity and specific traits, such as karnal bunt resistance
(Mujeeb-Kazi and Hettel 1995). CIMMYT had produced approximately 650 primary
synthetic wheats from its wide crossing program by 1999, using its large bank of Ae.
tauschii accessions and elite durum cultivars. Accessions of T. turgidum subsp.
dicoccoides and dicoccon were used less frequently (Reeves et al. 1999; van Ginkel and
Ogbonnaya 2007). Some of these synthetic wheats expressed desirable high molecular
weight glutenins and many biotic and abiotic stress resistances and tolerances (Villareal
17
1994; Diaz-de-Leon and Mujeeb-Kazi 1997; Reeves et al. 1999). CIMMYT has used
primary synthetic wheat to introgress resistance to Septoria tritici blotch into its breeding
lines, with some CIMMYT breeding programs using primary synthetic wheat to improve
drought tolerance and yield responsiveness (Reeves et al. 1999). Over 1014 spring habit
and 186 winter habit primary synthetic wheat have been created by CIMMYT since 1991,
with an estimated one third of the advanced lines distributed by CIMMYT to global
breeding programs being synthetic derivatives (van Ginkel and Ogbonnaya 2007). A
synthetic derivative, ‘Chuanmai 42’, has been released in China as a commercial variety
due to its high yielding ability, high grain weight and stripe rust resistance (Yang et al.
2009). A second synthetic derivative evaluated in Spain, named ‘Carmona’, has been
identified as having high commercial potential (Li et al. 2006; van Ginkel and Ogbonnaya
2007).
2.3.3.4 Production and use in Australia
Australian wheat breeding programs began to import CIMMYT developed primary
synthetic wheat and derived lines in small quantities in the 1990’s, with larger germplasm
sets being imported annually from 2001 (Trethowan 2004; Moody and Emebiri 2008b).
Derived synthetics in the earlier shipments had CIMMYT bread wheat as the recurrent
and/or top cross parents, with more recent shipments of derived synthetics having
Australian bread wheats as their recurrent parents (Dreccer et al. 2007). The Synthetic
Enriched Resources for Genetic Enhancement (SynERGE) program in Australia produced
many primary and derived synthetics for phenotypic and genotypic evaluation in local
conditions. This program used tetraploid, diploid and hexaploid wheats from both
CIMMYT and the Australian Winter Cereals Collection (AWCC). The program identified
new sources of biotic stress resistance (cereal cyst nematode and yellow leaf spot
resistance) and abiotic stress tolerances (drought, salinity and pre-harvest tolerance), which
are desirable for Australian bread wheat cultivars. Breeding entities were encouraged to
adopt and use this material for the genetic enrichment of bread wheat breeding programs
(van Ginkel and Ogbonnaya 2007).
2.4 Increasing grain yield of bread wheat using primary synthetic wheat
2.4.1 Grain yield components
Grain yield in bread wheat can be broken down into two major numerical components,
mean individual grain weight and grains per m2 (as reviewed by Slafer et al. 1996).
Increases in grain yield over the past 40 years, due to breeding practices, have come from
18
the production of more grains per m2 and not heavier grains. The Rht dwarfing genes have
played a significant role in this phenomenon, with modern semi-dwarf bread wheats setting
more grains in distal floret positions compared to standard height wheats (Miralles et al.
1998; Calderini and Reynolds 2000). As the number of grains per m2 has increased over
time, mean individual grain weight has remained unchanged or has decreased. This
negative relationship has been identified in many germplasm pools (Slafer et al. 1996). As
grain weight is also a quality component of bread wheat, affecting milling yield, there is a
commercial incentive to increase the grain weight of bread wheat whilst improving grain
yield (Marshall et al. 1986).
Primary synthetic wheats have been reported to show genetic variation for the major grain
yield components, especially grain weight (Villareal et al. 1994a; Villareal et al. 1994b;
Mujeeb-Kazi 1995; Calderini and Reynolds 2000; Calderini and Ortiz-Monasterio 2003).
Mean individual grain weights of up to 67 mg have been reported for CIMMYT primary
synthetic wheat grown under field conditions in Mexico (Calderini and Reynolds 2000).
Under hydroponic conditions, primary synthetic wheat has produced grains up to 58%
heavier compared to bread wheat cultivars (Dreccer et al. 2004).
2.4.2 Breeding strategies to increase grain weight and grain yield
Primary synthetic wheat could be used in ‘pre-breeding’ strategies to increase the grain
weight of bread wheat whilst maintaining or increasing grain yield. Calderini and Ortiz-
Monasterio (2003) suggested a strategy based on selecting ‘for grain yield by increasing
average grain weight’ when using primary synthetic wheat as a donor genetic source. A
similar strategy has already been performed in bread wheat. Ten cultivars and breeding
lines were intercrossed, with progeny recurrently selected for high grain weight over eight
cycles (Wiersma et al. 2001). Grain weight was found to increase (4.5% per cycle),
however no significant increase in grain yield was identified. A compensation effect was
observed where grains per spikelet, spikelets per spike and spikes (tillers) per m2 all
decreased as a consequence of improved grain weight (Wiersma et al. 2001).
Backcross (BC) strategies using primary synthetic wheat have produced derivatives with
higher grain weights and grain yields, compared to recurrent bread wheat parents. Del
Blanco et al. (2001) reported on six populations of BC2 synthetic-derived lines, developed
from four CIMMYT primary synthetic wheats and four CIMMYT recurrent bread wheat
cultivars. When grown in environments in Mexico, more than 80% of the synthetic
19
backcross lines across these populations had superior grain weights. Across the six
populations, the grain yield component grains per m2 was more strongly associated with
grain yield than mean individual grain weight, however, eight derivatives showed
improved grain yields (up to 111% of the recurrent bread wheat parent) that were due to an
increase in grain weight (up to 142.2% of the recurrent bread wheat parent) (del Blanco et
al. 2001). As such lines were not identified in every population, the use of different
primary synthetic and bread wheat combinations may have influenced the production of
these desirable lines.
2.4.3 Synthetic backcross lines with Australian bread wheat parentage
CIMMYT created some of the first synthetic backcross lines with Australian bread wheats
as recurrent parents. These lines were evaluated in drought nurseries at Ciudad Obregόn,
north-western Mexico, together with other lines that had CIMMYT bread wheat parentage.
Under terminal moisture stress conditions (drying soil profile) grain yields up to 79.2%
higher than Australian recurrent or top cross parents were identified (Trethowan 2004).
The lack of adaptation of the Australian bread wheats under Mexican environments may
have contributed to the comparatively high grain yield performance by the synthetic
derivatives (Dreccer et al. 2007). Nevertheless, based on this success, lines that produced
grain yields at least 10% greater than their bread wheat parents were sent to Australia for
further evaluation, and since 2001 Australia has received shipments (~100 lines p.a.) of
synthetic backcross lines (Trethowan 2004; Dreccer et al. 2007).
The grain yield performance of synthetic backcross lines from CIMMYT has been
evaluated in northern and southern regions of the Australian wheat belt (Dreccer et al.
2007; Ogbonnaya et al. 2007; Rattey and Shorter 2010). These studies have found grain
yield performance to be commonly greater in northern Australia than in the south, with
synthetic backcross lines achieving up to 30% higher grain yields compared to the best
local check cultivar. Reasons why synthetic derivatives and other material from CIMMYT
perform better under northern Australian environments compared to southern Australian
environments have been well documented (Cooper et al. 1993; Brennan and Quade 2004;
Dreccer et al. 2007; Ogbonnaya et al. 2007; Dreccer et al. 2008). The use of Australian
bread wheats as recurrent and/or top cross parents, rather than CIMMYT bread wheats was
suggested to provide a grain yield advantage in both northern and southern Australia.
Synthetic backcross lines with Croc 1 (CIMMYT durum wheat) or Ae. tauschii accessions
WX205 or WX224 in their primary synthetic wheat parents’ pedigree were also found to
20
perform well across both northern and southern sites. Although the evaluations of synthetic
backcross lines reported by Ogbonnaya et al. (2007) and Dreccer et al. (2007) did show
that certain primary synthetic wheat and Australian bread wheat combinations were
particularly beneficial for improving grain yield, they did not identify which grain yield
component(s) (grains per m2 or mean individual grain weight) were responsible for the
improvements.
Primary synthetic wheats may have the potential to increase yield in the breeding of bread
wheat for moisture-limited environments in Australia. In northern Australia, Rattey and
Shorter (2010) assessed a similar set of synthetic-derived material to Dreccer et al. (2007)
and found that the best grain yield advantage (up to 8%) over Australian bread wheats was
achieved in the lowest yielding environments. In southern Australia Gororo et al. (2002)
assessed BC1 synthetic derivatives created from one CIMMYT primary synthetic wheat
and one recurrent southern Australian bread wheat parent. In a low yielding environment,
up to 49% higher grain yields were identified compared to the Australian recurrent bread
wheat parent (Gororo et al. 2002). The production of more grains per m2 was commonly
found to be responsible for grain yield improvements in such conditions. Improved grain
yields observed in relatively high grain yielding environments were achieved by small non-
significant increases in both grain weight and grains per m2 or by significant increases in
grain weight (Gororo et al. 2002).
2.5 Introgressing novel genetic material into bread wheat
2.5.1 History and issues
The introgression of genetic material into bread wheat from related species began in the
late 19th century. These activities were chiefly performed to acquire levels of biotic stress
resistance not readily observed in bread wheat gene pools (Appels and Lagudah 1990). The
successful development of triticale, a hybrid of bread wheat and rye (Secale cereale L.)
(for review, Briggle 1969), was the starting point for the introgression of exotic
chromosome segments into bread wheat. The 1RS.1BL translocation event, involving the
short arm of rye chromosome 1R and the long arm of bread wheat chromosome 1B, has
been important in global bread wheat breeding for disease resistance and grain yield
improvement in some genetic backgrounds (Zeller 1973; Berzonsky and Francki 1999).
The introgression of other large chromosomal segments into bread wheat have involved
species from the Aegilops, Agropyron, Elymus, Haynaldia, Hordeum, Secale and Triticum
genera, which have chromosomes with varying levels of homology with those of bread
21
wheat (for review, Gupta et al. 2005). Large chromosome segments from novel sources
can carry undesirable genes, expressing undesirable characters such as the poor end use
quality (sticky dough) associated with the 1RS.1BL translocation (Barbeau et al. 2003).
Primary synthetic wheats can also express deleterious characters, such as late maturity α-
amylase activity, tough rachis, lodging and excessive height, which has prevented their
direct use as commercial cultivars (Pritchard et al. 2002; Tyagi et al. 2004; Ogbonnaya
2005; van Ginkel and Ogbonnaya 2007; Mrva et al. 2009). The introgression of smaller
chromosome segments from novel germplasm sources like primary synthetic wheat is
therefore desirable, reducing ‘linkage drag’ between genes conferring desirable and
undesirable characters (Paterson et al. 1990).
2.5.2 Backcross strategies using synthetic wheat
Backcross and selection strategies can reduce the size of introgression segments from
donor sources and promote recombination between desirable and undesirable genes to limit
linkage drag (Frisch and Melchinger 2001; Hospital 2001). Such strategies have been
employed to introgress germplasm from wild relative species into cultivars of barley (von
Korff et al. 2004), tomato (Tanksley and Nelson 1996) and peanut (Burow et al. 2001),
and from primary synthetic wheat into modern bread wheat cultivars (del Blanco et al.
2001; Gororo et al. 2002; Trethowan 2004; Dreccer et al. 2007). As described by Allard
(1960), backcrossing typically involves crossing an elite parent deficient in a target
character to a donor source, and then performing a backcross between the resulting F1 or
selfed F2 with the elite (recurrent) parent (Figure 5). BC1F1 individuals would be expected
to be homozygous at more loci for the elite parent allele than found in the F1 from a single
cross. Combined with suitable selection protocols, backcrossing can produce superior
synthetic derivatives, which have vital genetic contributions from the primary synthetic
donor in an elite genetic background.
The number of backcrosses required when breeding with primary synthetic wheat depends
on the breeding objective. Trethowan and Mujeeb-Kazi (2008) reported that at least one
backcross is required to the adapted recurrent bread wheat parent to achieve high stable
yield in synthetic derivatives. BC1 strategies (Figure 5) have been successful in
introgressing quality and yield/adaptation characters from primary synthetic wheat into
bread wheat backgrounds (Gororo et al. 2002; Dreccer et al. 2007; Mares and Mrva 2008).
Single and advanced backcrossing (BC2, BC3, BC4 for example) combined with selection
22
Figure 5. Backcross breeding strategies for the introgression of genetic material from
primary synthetic wheats into a bread wheat background (van Ginkel and Ogbonnaya
2007; Trethowan 2008).
BC1F1
BC2F1
BC2F2
BC1F2
BC1F3
BC1F4
BC1F6
Screen and bulk
Select
Select
2000-3000
Synthetic derivatives
Screen and bulk
X Bread wheat Deficient in target
character F1 X
Recurrent or top cross
bread wheat
Primary synthetic wheat Expressing target
character
X
BC2F4,6
X
Further backcrossing (up to BC4)
Screen, bulk and
select as per BC1 path
Recurrent or top cross
bread wheat
Recurrent or top cross
bread wheat
23
can minimise the drag of undesirable genes whilst maximising the chances of introgressing
genes associated with a target character (Tanksley and Nelson 1996). However, for single
backcrossing strategies the development of large populations (>2000 BC1F2 lines) has been
recommended to increase the opportunity to select high performing lines without
deleterious characters (van Ginkel and Ogbonnaya 2007). Advanced backcrossing with
molecular marker selection can be used to develop introgression lines, each with a single
small defined chromosome segment from the donor source, however this strategy may
require over six generations of backcrossing and selection (for review, Zamir 2001).
Backcrossing strategies, such as BC2 (del Blanco et al. 2001; Narasimhamoorthy et al.
2006; Kunert et al. 2007), BC3 (Röder et al. 2008) and BC4 (Liu et al. 2006) have been
successful in identifying and introgressing quality characters and superior yield
components from primary synthetic wheat into bread wheat. After the desired number of
backcrosses has been made, F2 and F3 populations are typically established and allowed to
self to reach a homozygous state (Figure 5). Further selection of families/individuals may
take place, after which character evaluations can be performed more thoroughly.
2.5.2 Primary synthetic wheat alleles at quantitative trait loci
Quantitative trait loci (QTL) are chromosome regions that contain one or more genes that
affect a quantitative trait, like grain yield in bread wheat (for review, Liu 1998). Statistical
analysis of molecular marker and phenotypic data, typically from a population of lines, is
used to map the chromosomal location of QTL. Backcross populations are suitable for
QTL mapping, with this structure also being used to simultaneous identify QTL and
introgress genetic material from wild relatives into modern cultivars, a technique
established in tomato (Eshed and Zamir 1994; Tanksley et al. 1996). Similar strategies
have been applied to simultaneously introgress genetic material from primary synthetic
wheat into modern bread wheat cultivars, and to identify QTL alleles from T. turgidum and
Ae. tauschii that have positive effects on preharvest sprouting tolerance (Imtiaz et al.
2008), baking volume (Kunert et al. 2007) and length of grain filling period (Börner et al.
2002).
QTL for grain yield and its major components (grain weight and grains per m2) have been
identified on many of the 21 chromosomes of bread wheat. Grain yield is a complex
quantitative trait, subject to genotype by environment interactions and is readily associated
with QTL for flowering time, maturity, plant height, grain weight and grain per m2 for
example (Cuthbert et al. 2008). Across populations and environments several regions on
24
chromosomes 1B, 2A, 2B, 3B 6A 7B and 7D have been recurrently associated with grain
weight (Campbell et al. 1999; Börner et al. 2002; Groos et al. 2003; Kumar et al. 2006; Li
et al. 2007; Hai et al. 2008; Sun et al. 2009; Wang et al. 2009). Beneficial alleles from
primary synthetic wheat have been identified at QTL for grain weight on chromosomes
3A, 3B, 5A, 6A, 7A and 7D (Börner et al. 2002; Huang et al. 2004; Röder et al. 2008).
2.6 Research questions
Primary synthetic wheats have shown potential value for use in Australian bread wheat
breeding. This study aimed to investigate primary and derived synthetic wheats in three
research areas to further evaluate this value, which included genetic diversity, grain weight
and grain yield in drought stressed environments, and synthetic allele introgression.
The genetic diversity of Australian bread wheat has not significantly reduced over time due
to breeding activities; however, primary synthetic wheats may offer additional genetic
diversity for Australian bread wheat breeders. Genetic diversity between primary synthetic
wheats and modern Australian bread wheat cultivars has not been investigated before. This
study aimed to identify the genetic similarity within and among 44 primary synthetic
wheats and nine modern Australian bread wheat cultivars using Diversity Array
Technology™ (DArT) markers.
Maintaining a viable level of grain yield production from bread wheat in drought stressed
environments is a high priority in Australia. Past studies have indicated that primary
synthetics can improve the grain yield of Australian bread wheat through the development
of synthetic backcross lines. However, grain yield and its major components (grain weight
and grains per m2) of synthetic backcross lines have not been measured before in moisture-
limited environments in southern Australia. This study aimed to evaluate grain yield and its
major components in 27 families of synthetic backcross lines, created from 27 primary
synthetic wheats and a common recurrent Australian bread wheat parent, in drought
stressed environments of southern Australia.
Primary synthetic alleles with positive effects on grain weight and grains per m2, under
Australian environments, have not been identified before within an Australian bread wheat
genetic background. This study aimed to identify the presence of such alleles introgressed
at QTL in two families of synthetic backcross lines. The retention of these beneficial
alleles in high yielding and high grain weight lines was also investigated.
25
Chapter 3
Plant Materials
This chapter provides detailed information on the plant materials used for the research that
will be reported in subsequent chapters of this thesis.
3.1 Summary of plant material
� 44 Primary synthetic hexaploid wheats
� 5 Durum wheat that are the recorded parents of one or more of the 44 primary
synthetic wheat
� 27 Families of BC1F4-derived synthetic lines, derived from backcrosses between 27
primary synthetic wheat (a sub-set of the 44 referred to above) and recurrent parent
Yitpi, an Australian semi-dwarf bread wheat cultivar
� Yitpi and 19 other Australian bread wheat cultivars
� 2 Durum wheat cultivars that are grown in Australian
3.2 Primary synthetic wheat and parental durum wheat
The forty-four primary synthetic wheat used in this study were created by the Wide
Crossing Unit of the International Maize and Wheat Improvement Center (CIMMYT).
These primary synthetic wheats were formed by hybridising 23 CIMMYT durum wheats
(Triticum turgidum L. subsp. durum (Desf.) Husn.) with one or more of 37 Aegilops
tauschii Coss. accessions from CIMMYT’s working germplasm bank (Table 2). Further
information regarding the primary synthetic wheat used and their Ae. tauschii accessions is
detailed in Appendix 1 and Appendix 2. Of the 44 primary synthetic wheats, 17
corresponded in pedigree with synthetics that were short listed by CIMMYT as having
desirable agronomic characteristics (including “morphological, growth, biotic, and abiotic
attributes” (Mujeeb-Kazi et al. 2000)) in environments across Mexico out of approximately
800 created between 1995 and 2001 (Mujeeb-Kazi and Delgado 2001). In 2001, Dr
Richard Trethowan (formerly at CIMMYT, now at the University of Sydney) sent seed of
a set of primary synthetic wheat to Australia (Quarantine importation number: ZSE01)
(Moody and Emebiri 2008b). In 2005, Dr Francis Ogbonnaya (then at the Department of
Primary Industries, Victoria, now at the International Centre for Agricultural Research in
the Dry Areas) provided seed of 44 of these synthetics to this project.
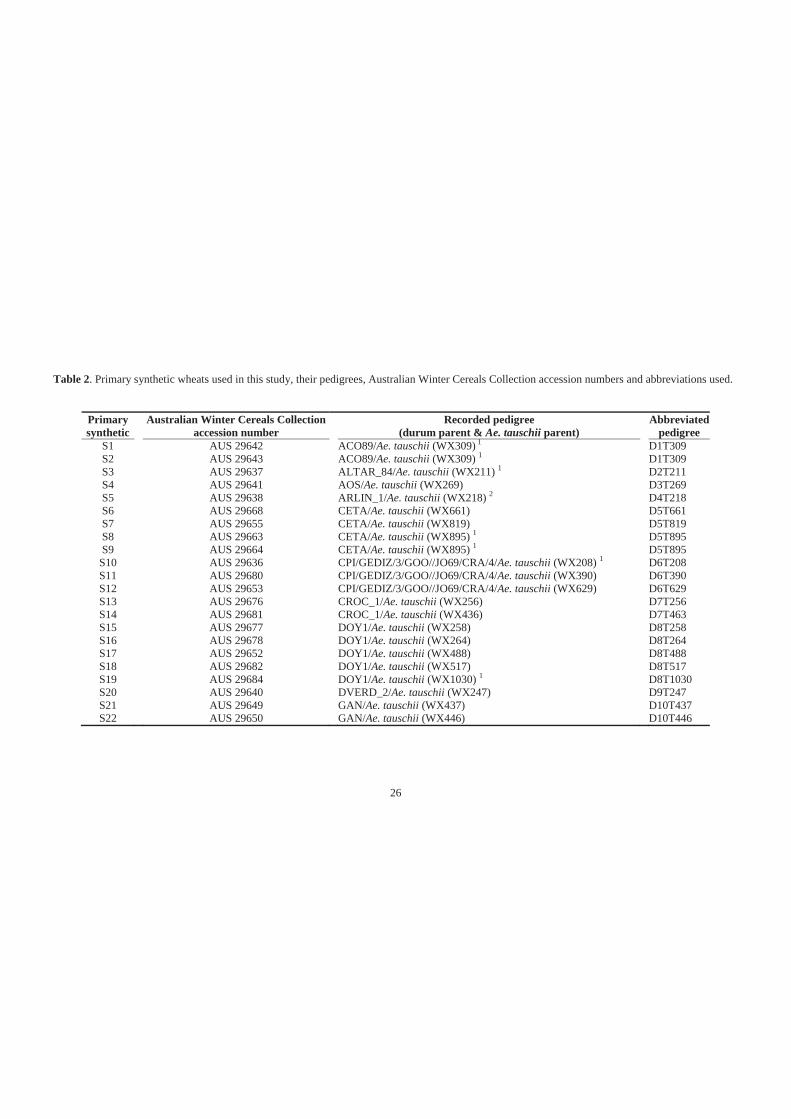
26
Table 2. Primary synthetic wheats used in this study, their pedigrees, Australian Winter Cereals Collection accession numbers and abbreviations used.
Primary synthetic
Australian Winter Cereals Collection accession number Recorded pedigree
(durum parent & Ae. tauschii parent) Abbreviated pedigree
S1 AUS 29642 ACO89/Ae. tauschii (WX309) 1 D1T309 S2 AUS 29643 ACO89/Ae. tauschii (WX309) 1 D1T309 S3 AUS 29637 ALTAR_84/Ae. tauschii (WX211) 1 D2T211 S4 AUS 29641 AOS/Ae. tauschii (WX269) D3T269 S5 AUS 29638 ARLIN_1/Ae. tauschii (WX218) 2 D4T218 S6 AUS 29668 CETA/Ae. tauschii (WX661) D5T661 S7 AUS 29655 CETA/Ae. tauschii (WX819) D5T819 S8 AUS 29663 CETA/Ae. tauschii (WX895) 1 D5T895 S9 AUS 29664 CETA/Ae. tauschii (WX895) 1 D5T895
S10 AUS 29636 CPI/GEDIZ/3/GOO//JO69/CRA/4/Ae. tauschii (WX208) 1 D6T208 S11 AUS 29680 CPI/GEDIZ/3/GOO//JO69/CRA/4/Ae. tauschii (WX390) D6T390 S12 AUS 29653 CPI/GEDIZ/3/GOO//JO69/CRA/4/Ae. tauschii (WX629) D6T629 S13 AUS 29676 CROC_1/Ae. tauschii (WX256) D7T256 S14 AUS 29681 CROC_1/Ae. tauschii (WX436) D7T463 S15 AUS 29677 DOY1/Ae. tauschii (WX258) D8T258 S16 AUS 29678 DOY1/Ae. tauschii (WX264) D8T264 S17 AUS 29652 DOY1/Ae. tauschii (WX488) D8T488 S18 AUS 29682 DOY1/Ae. tauschii (WX517) D8T517 S19 AUS 29684 DOY1/Ae. tauschii (WX1030) 1 D8T1030 S20 AUS 29640 DVERD_2/Ae. tauschii (WX247) D9T247 S21 AUS 29649 GAN/Ae. tauschii (WX437) D10T437 S22 AUS 29650 GAN/Ae. tauschii (WX446) D10T446
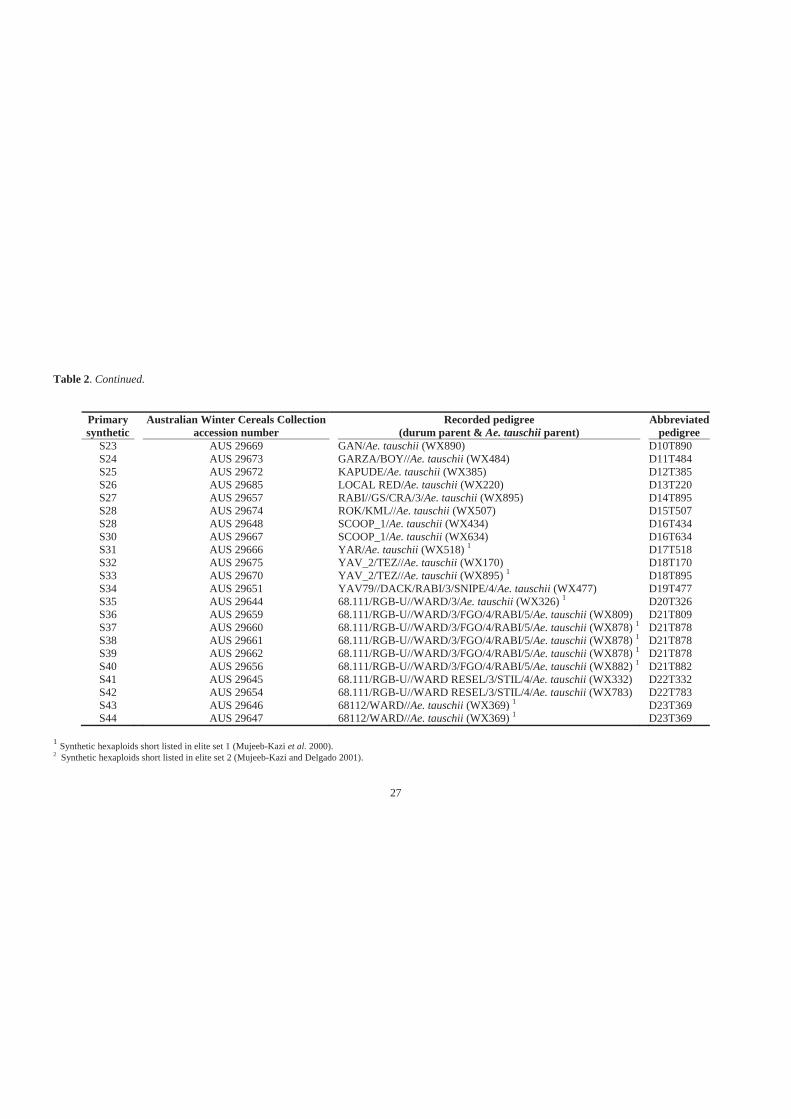
27
Table 2. Continued.
Primary synthetic
Australian Winter Cereals Collection accession number Recorded pedigree
(durum parent & Ae. tauschii parent) Abbreviated pedigree
S23 AUS 29669 GAN/Ae. tauschii (WX890) D10T890 S24 AUS 29673 GARZA/BOY//Ae. tauschii (WX484) D11T484 S25 AUS 29672 KAPUDE/Ae. tauschii (WX385) D12T385 S26 AUS 29685 LOCAL RED/Ae. tauschii (WX220) D13T220 S27 AUS 29657 RABI//GS/CRA/3/Ae. tauschii (WX895) D14T895 S28 AUS 29674 ROK/KML//Ae. tauschii (WX507) D15T507 S28 AUS 29648 SCOOP_1/Ae. tauschii (WX434) D16T434 S30 AUS 29667 SCOOP_1/Ae. tauschii (WX634) D16T634 S31 AUS 29666 YAR/Ae. tauschii (WX518) 1 D17T518 S32 AUS 29675 YAV_2/TEZ//Ae. tauschii (WX170) D18T170 S33 AUS 29670 YAV_2/TEZ//Ae. tauschii (WX895) 1 D18T895 S34 AUS 29651 YAV79//DACK/RABI/3/SNIPE/4/Ae. tauschii (WX477) D19T477 S35 AUS 29644 68.111/RGB-U//WARD/3/Ae. tauschii (WX326) 1 D20T326 S36 AUS 29659 68.111/RGB-U//WARD/3/FGO/4/RABI/5/Ae. tauschii (WX809) D21T809 S37 AUS 29660 68.111/RGB-U//WARD/3/FGO/4/RABI/5/Ae. tauschii (WX878) 1 D21T878 S38 AUS 29661 68.111/RGB-U//WARD/3/FGO/4/RABI/5/Ae. tauschii (WX878) 1 D21T878 S39 AUS 29662 68.111/RGB-U//WARD/3/FGO/4/RABI/5/Ae. tauschii (WX878) 1 D21T878 S40 AUS 29656 68.111/RGB-U//WARD/3/FGO/4/RABI/5/Ae. tauschii (WX882) 1 D21T882 S41 AUS 29645 68.111/RGB-U//WARD RESEL/3/STIL/4/Ae. tauschii (WX332) D22T332 S42 AUS 29654 68.111/RGB-U//WARD RESEL/3/STIL/4/Ae. tauschii (WX783) D22T783 S43 AUS 29646 68112/WARD//Ae. tauschii (WX369) 1 D23T369 S44 AUS 29647 68112/WARD//Ae. tauschii (WX369) 1 D23T369
1 Synthetic hexaploids short listed in elite set 1 (Mujeeb-Kazi et al. 2000). 2 Synthetic hexaploids short listed in elite set 2 (Mujeeb-Kazi and Delgado 2001).
52
CIMMYT durum wheats Altar 84 (D2), Croc 1 (D7), Gan (D10), Kapude (D12) and Scoop
1 (D16), which were the recorded tetraploid parents of one, three, one and two primary
synthetic wheat respectively (Table 2), were also used in the current study. Seed of these
cultivars was made available by Dr Francis Ogbonnaya.
(Contact details for Dr Francis Ogbonnaya: International Center for Agricultural Research
in the Dry Areas (ICARDA), PO Box 5466, Aleppo, Syria).
3.3 Bulk synthetic seed
An Australian bread wheat cultivar Yitpi (AUS 30462) and 27 primary synthetic wheats
(Table 3), were used by Dr Francis Ogbonnaya to generate 27 BC1F4 bulk seed sets.
Undertaken at the Department of Primary Industries (Horsham, Victoria, Australia), the
development of these bulk seed sets involved Yitpi being individually crossed with each of
the 27 primary synthetic wheat as the female parent, and five F1 progeny from each cross
were backcrossed to Yitpi. Two hundred BC1F1 seeds from each backcross were used to
develop BC1F3 synthetic derivatives via single seed decent. A single spike was taken from
each derivative. These spikes were bulked together with other derivatives from the same
cross, forming 27 BC1F4 bulk seed sets. Dr Francis Ogbonnaya kindly provided 10 g of
seed from each BC1F4 bulk set for use in this investigation.
3.4 Bread and durum wheat cultivars
Yitpi is the recurrent parent of the synthetic-derived families of lines under investigation
here. It is a hard white bread wheat, semi-dwarf in stature with an intermediate growth
habit, early to mid-season spike emergence, medium glaucoused flag leaf, non-pubesent
glumes and has a high yield potential when grown in the medium to low rainfall districts of
South Australia, north-western Victoria and south-western New South Wales (Figure 6)
(AWB Limited 2003; Hollamby 2003). Yitpi was bred at the University of Adelaide in
South Australia. Yitpi was used in every experiment undertaken in this study. Nineteen
other Australian bread wheats were also used in this study. In winter field experiments
bread wheat cultivars Annuello, Carinya, Stylet (not commercially released, Australian
Grain Technologies (AGT) Pty Ltd), and Wyalkatchem were used as high yielding checks.
These cultivars are all well adapted to the same south-eastern Australian environments as
Yitpi (Figure 6). Genetic diversity investigations used bread wheat from different
Australian breeding organisations and gene pools, including the cultivars AGT Scythe,
Annuello, Carinya, GBA Ruby, Janz, Kukri, Stylet and Wyalkatchem (Table 4).
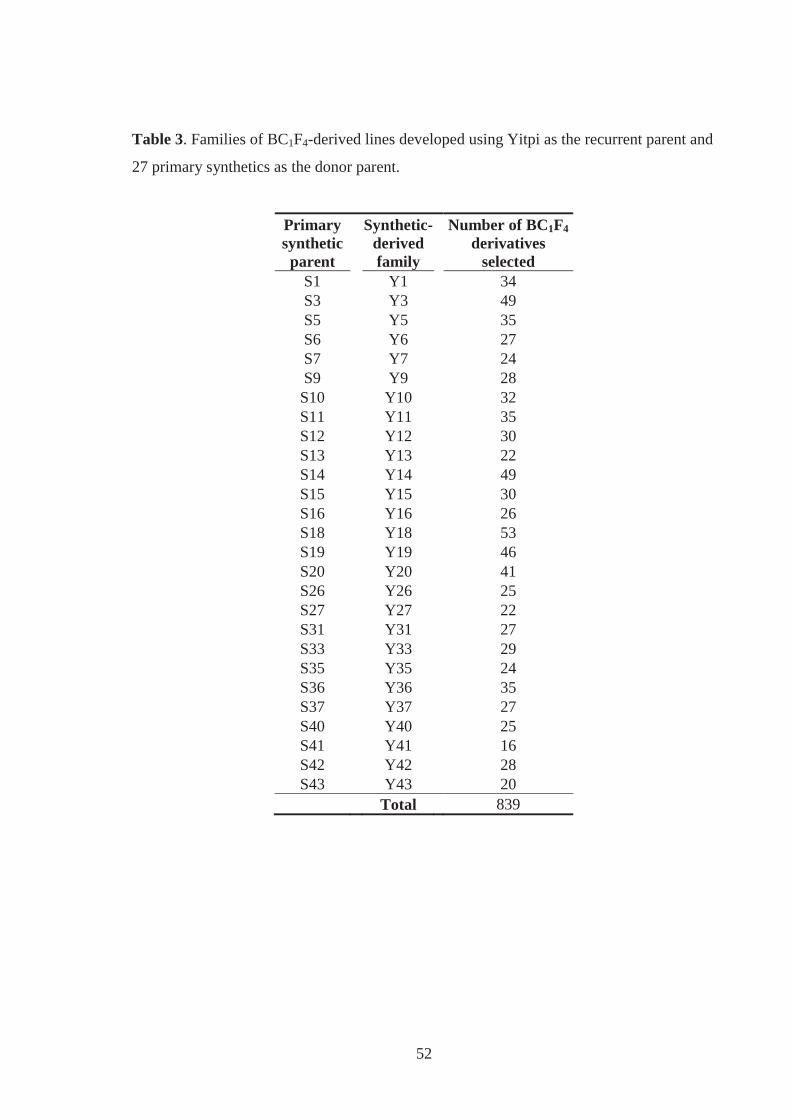
52
Table 3. Families of BC1F4-derived lines developed using Yitpi as the recurrent parent and
27 primary synthetics as the donor parent.
Primary synthetic parent
Synthetic-derived family
Number of BC1F4 derivatives
selected S1 Y1 34 S3 Y3 49 S5 Y5 35 S6 Y6 27 S7 Y7 24 S9 Y9 28
S10 Y10 32 S11 Y11 35 S12 Y12 30 S13 Y13 22 S14 Y14 49 S15 Y15 30 S16 Y16 26 S18 Y18 53 S19 Y19 46 S20 Y20 41 S26 Y26 25 S27 Y27 22 S31 Y31 27 S33 Y33 29 S35 Y35 24 S36 Y36 35 S37 Y37 27 S40 Y40 25 S41 Y41 16 S42 Y42 28 S43 Y43 20
Total 839
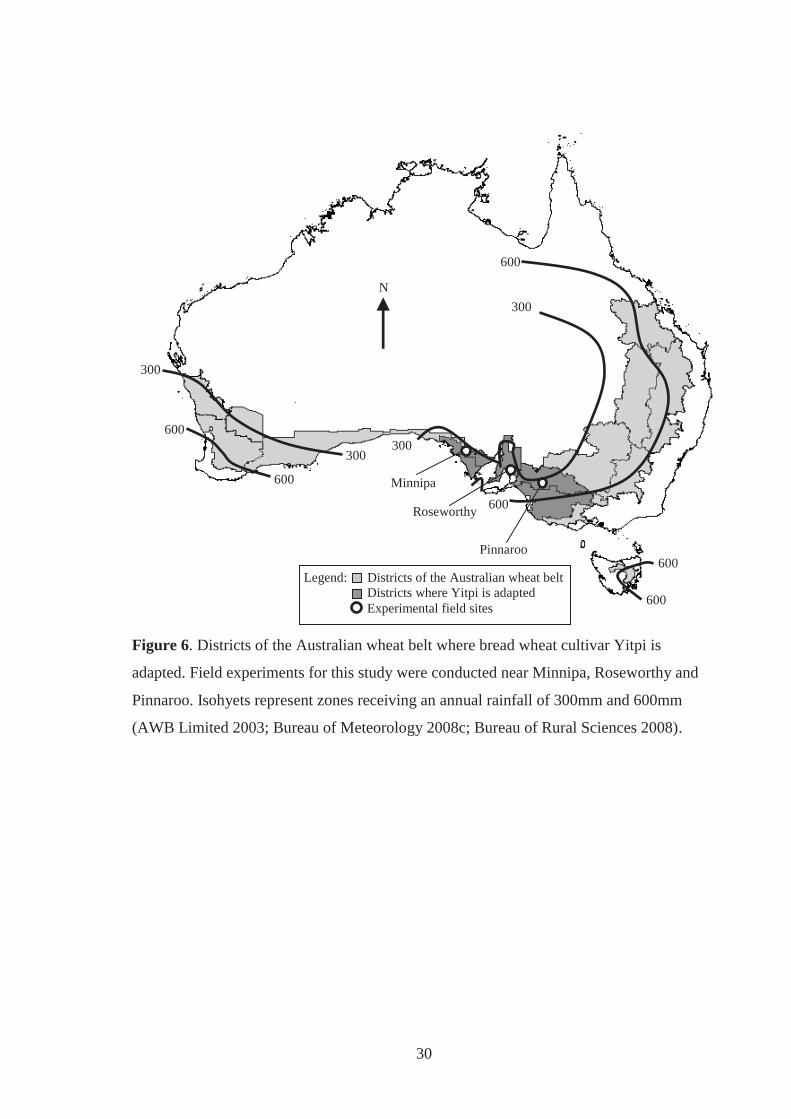
30
Figure 6. Districts of the Australian wheat belt where bread wheat cultivar Yitpi is
adapted. Field experiments for this study were conducted near Minnipa, Roseworthy and
Pinnaroo. Isohyets represent zones receiving an annual rainfall of 300mm and 600mm
(AWB Limited 2003; Bureau of Meteorology 2008c; Bureau of Rural Sciences 2008).
N
600
300
300
300
300
600
600
600
Roseworthy
Minnipa
Pinnaroo 600
600
Legend: Districts of the Australian wheat belt Districts where Yitpi is adapted Experimental field sites
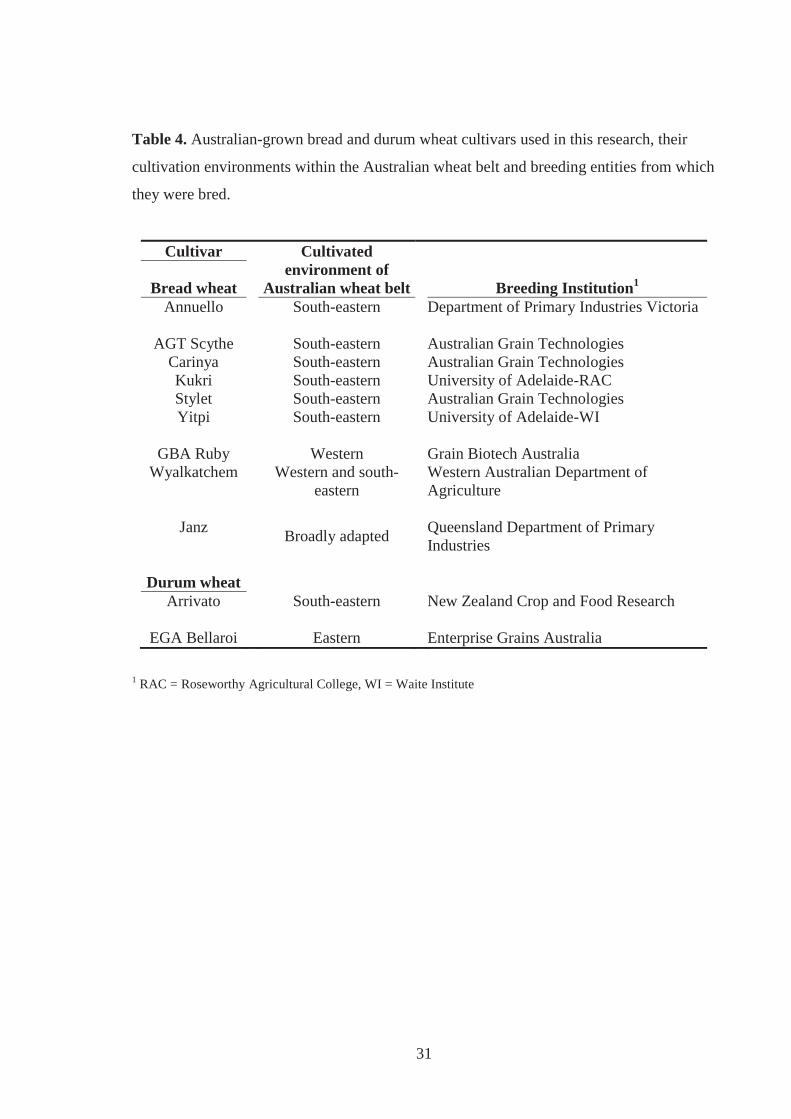
31
Table 4. Australian-grown bread and durum wheat cultivars used in this research, their
cultivation environments within the Australian wheat belt and breeding entities from which
they were bred.
Cultivar Cultivated environment of
Australian wheat belt
Breeding Institution1 Bread wheat
Annuello South-eastern Department of Primary Industries Victoria
AGT Scythe South-eastern Australian Grain Technologies Carinya South-eastern Australian Grain Technologies Kukri South-eastern University of Adelaide-RAC Stylet South-eastern Australian Grain Technologies Yitpi South-eastern University of Adelaide-WI
GBA Ruby Western Grain Biotech Australia
Wyalkatchem Western and south-eastern
Western Australian Department of Agriculture
Janz Broadly adapted Queensland Department of Primary
Industries
Durum wheat Arrivato South-eastern New Zealand Crop and Food Research
EGA Bellaroi Eastern Enterprise Grains Australia
1 RAC = Roseworthy Agricultural College, WI = Waite Institute
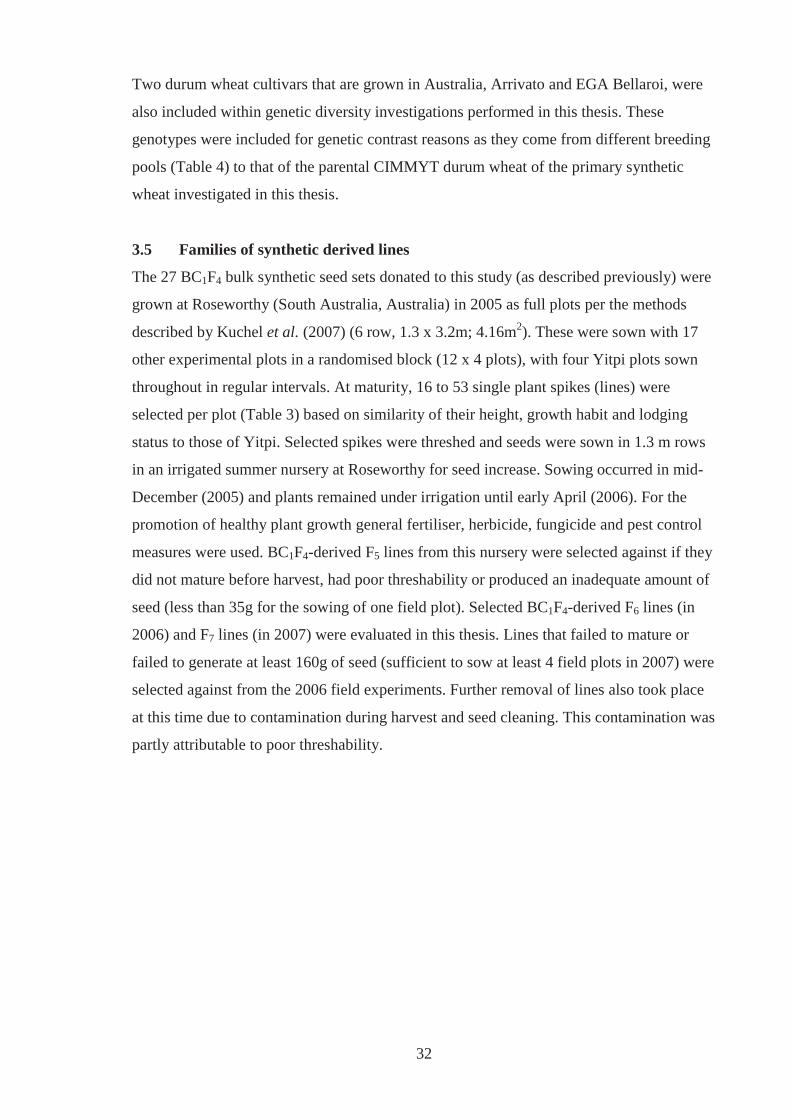
32
Two durum wheat cultivars that are grown in Australia, Arrivato and EGA Bellaroi, were
also included within genetic diversity investigations performed in this thesis. These
genotypes were included for genetic contrast reasons as they come from different breeding
pools (Table 4) to that of the parental CIMMYT durum wheat of the primary synthetic
wheat investigated in this thesis.
3.5 Families of synthetic derived lines
The 27 BC1F4 bulk synthetic seed sets donated to this study (as described previously) were
grown at Roseworthy (South Australia, Australia) in 2005 as full plots per the methods
described by Kuchel et al. (2007) (6 row, 1.3 x 3.2m; 4.16m2). These were sown with 17
other experimental plots in a randomised block (12 x 4 plots), with four Yitpi plots sown
throughout in regular intervals. At maturity, 16 to 53 single plant spikes (lines) were
selected per plot (Table 3) based on similarity of their height, growth habit and lodging
status to those of Yitpi. Selected spikes were threshed and seeds were sown in 1.3 m rows
in an irrigated summer nursery at Roseworthy for seed increase. Sowing occurred in mid-
December (2005) and plants remained under irrigation until early April (2006). For the
promotion of healthy plant growth general fertiliser, herbicide, fungicide and pest control
measures were used. BC1F4-derived F5 lines from this nursery were selected against if they
did not mature before harvest, had poor threshability or produced an inadequate amount of
seed (less than 35g for the sowing of one field plot). Selected BC1F4-derived F6 lines (in
2006) and F7 lines (in 2007) were evaluated in this thesis. Lines that failed to mature or
failed to generate at least 160g of seed (sufficient to sow at least 4 field plots in 2007) were
selected against from the 2006 field experiments. Further removal of lines also took place
at this time due to contamination during harvest and seed cleaning. This contamination was
partly attributable to poor threshability.
33
Chapter 4
Molecular characterisation of primary synthetic wheat
4.1 Introduction
The genomes of Triticum turgidum L. (genome AABB) and Aegilops tauschii Coss.
(genome DD) are sources of genetic variation for bread wheat (Triticum aestivum L.,
genome AABBDD) breeding, as bread wheat has evolved from multiple but limited
hybridisations between these progenitor species (McFadden and Sears 1946; Lubbers et al.
1991; Dvorak et al. 1998; Talbert et al. 1998; Reif et al. 2005; Chabane et al. 2007).
Genetic variation from T. turgidum and Ae. tauschii can be introgressed into modern bread
wheat cultivars using primary synthetic wheat as a genetic bridge (Lange and Jochemsen
1992). Primary synthetic wheats (genome AABBDD) are created by hybridising cultivars
and landraces of T. turgidum with accessions of Ae. tauschii (Mujeeb-Kazi et al. 1996;
Mujeeb-Kazi et al. 2008). Identifying genetic diversity among modern bread wheat
cultivars and primary synthetic wheats may aid bread wheat breeders in choosing
combinations suitable for developing populations for selection (Franco et al. 2001; Saffdar
et al. 2009).
Molecular markers are powerful tools for identifying genetic similarity and variation
between genotypes of bread wheat and germplasm sources for breeding. These tasks have
employed some of the major marker systems, such as amplified fragment length
polymorphisms (AFLP) (Hirano et al. 2008), simple sequence repeats (SSR) (Naghavi et
al. 2009) and Diversity Arrays Technology (DArT™) (Akbari et al. 2006). Each marker
system varies for implementation time, cost and ability to detect polymorphism across
diverse germplasm. AFLP and DArT markers can be developed without prior sequence
information, unlike SSR based markers (Mueller and Wolfenbarger 1999; Jaccoud et al.
2001). AFLP and DArT markers are therefore desirable for assessing the genomes of
primary synthetic wheats, as these markers can be easily developed for non-model species
like Ae. tauschii. The microarray platform of DArT permits a large number of loci to be
assayed efficiently and simultaneously, unlike AFLP markers (Jaccoud et al. 2001; Akbari
et al. 2006). DArT markers also provide the chromosome coverage to assess the large
genome and allohexaploid nature of bread and primary synthetic wheats (Francki et al.
2009). As DArT markers have been successfully used to evaluate the genetic similarity
among bread wheats (Stodart et al. 2007; White et al. 2008), this marker system could be
34
an effective tool to identify genetic diversity within and between modern bread wheat
cultivars and primary synthetic wheats.
Molecular markers have shown Australian bread wheat cultivars to be more genetically
diverse than those from western Europe, the UK and the USA (Akbari et al. 2006; White et
al. 2008). Despite this diversity, T. turgidum and Ae. tauschii still have the potential to
genetically improve Australian bread wheat pools. Primary synthetic wheats have been
imported into Australia from CIMMYT for agronomic assessment and use in pre-breeding
activities (Moody and Emebiri 2008a). Most of these primary synthetic wheats had A and
B genomes derived from durum wheat cultivars or lines (T. turgidum subsp. durum (Desf.)
Husn.) from CIMMYT’s own breeding programs, with their D genomes being the novel
source of genetic variation (Reeves et al. 1999; van Ginkel and Ogbonnaya 2007; Moody
and Emebiri 2008a). The comparison of genetic diversity within and among a group of
primary synthetic wheats imported into Australia and modern Australian bread wheat
cultivars has not been performed before.
The aim of this study was to assess the genetic diversity within and among a group of
primary synthetic wheats and modern Australian bread wheat cultivars using DArT
markers. Genetic similarity matrices, dendrograms and principal co-ordinate analyses will
form the basis of these investigations.
4.2 Materials and methods
4.2.1 Plant material
The plant materials used in this investigation have all been described in Chapter 3. They
consisted of:
� 44 primary synthetic wheat genotypes (S1 through S44),
� nine Australian bread wheat cultivars (AGT Scythe, Annuello, Carinya, GBA
Ruby, Janz, Kukri, Stylet (not commercially released), Wyalkatchem and Yitpi),
� five CIMMYT durum wheat cultivars (Altar84, Croc1, Gan, Kapude and Scoop1),
parents of one, two, three, one and two primary synthetic wheats respectively, and
� two durum wheat cultivars that are grown in Australia (Arrivato and EGA Bellaroi)
According to the recorded pedigree information for the primary synthetic wheats, some of
them had common durum and/or Ae. tauschii parents, as shown in Table 5.
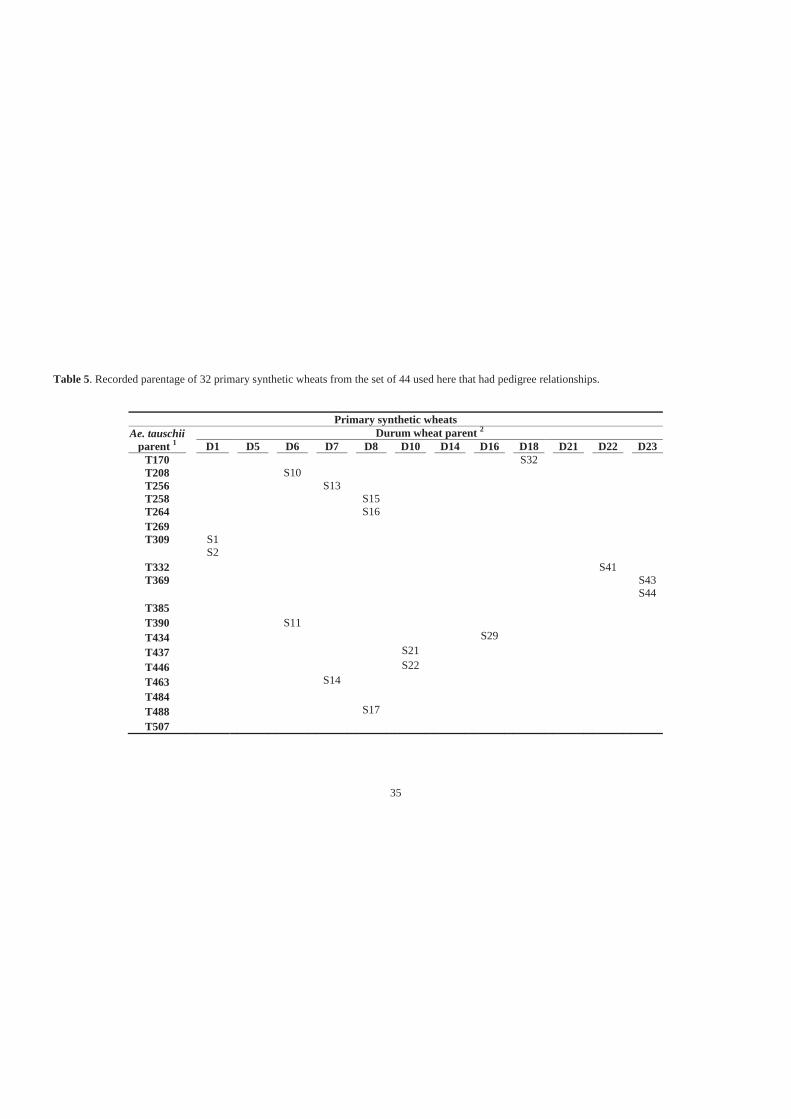
35
Table 5. Recorded parentage of 32 primary synthetic wheats from the set of 44 used here that had pedigree relationships.
Primary synthetic wheats Ae. tauschii
parent 1 Durum wheat parent 2 D1 D5 D6 D7 D8 D10 D14 D16 D18 D21 D22 D23
T170 S32 T208 S10 T256 S13 T258 S15 T264 S16 T269 T309 S1
S2
T332 S41 T369
S43
S44 T385 T390 S11 T434 S29 T437 S21 T446 S22 T463 S14 T484 T488 S17 T507
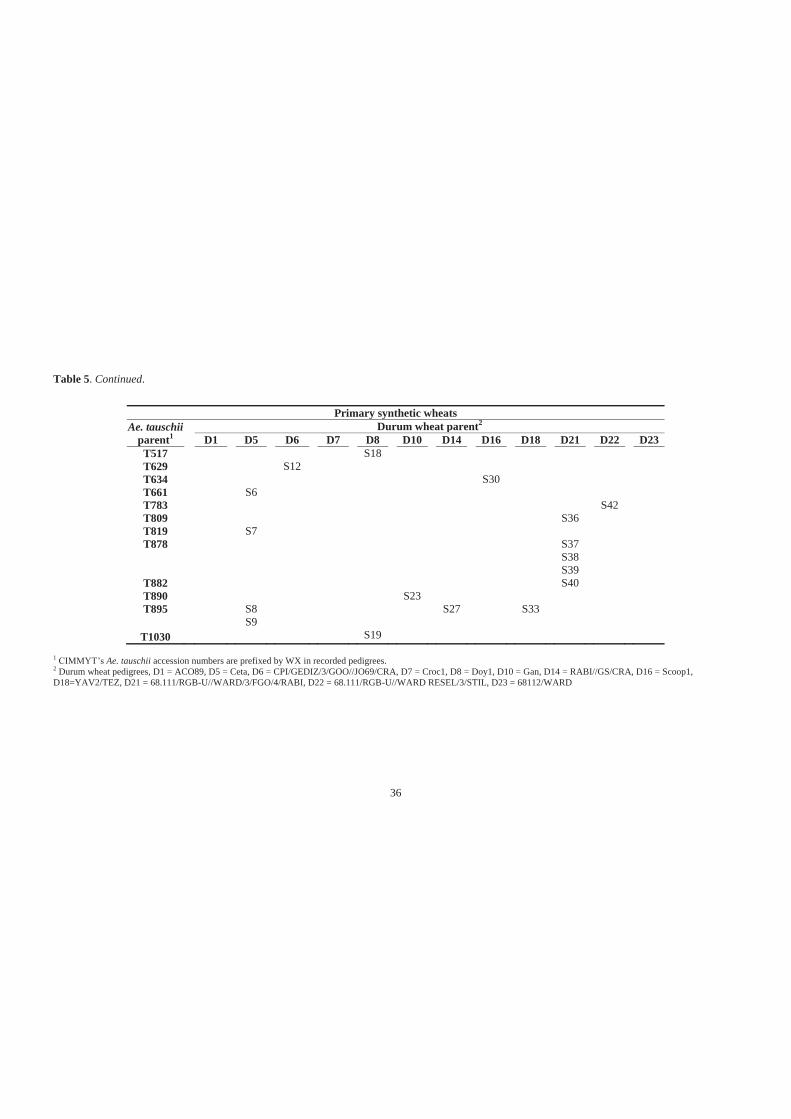
36
Table 5. Continued.
Primary synthetic wheats Ae. tauschii
parent1 Durum wheat parent2 D1 D5 D6 D7 D8 D10 D14 D16 D18 D21 D22 D23
T517 S18 T629 S12 T634 S30 T661 S6 T783 S42 T809 S36 T819 S7 T878
S37 S38 S39
T882 S40 T890 S23 T895 S8
S9 S27 S33
T1030 S19 1 CIMMYT’s Ae. tauschii accession numbers are prefixed by WX in recorded pedigrees. 2 Durum wheat pedigrees, D1 = ACO89, D5 = Ceta, D6 = CPI/GEDIZ/3/GOO//JO69/CRA, D7 = Croc1, D8 = Doy1, D10 = Gan, D14 = RABI//GS/CRA, D16 = Scoop1, D18=YAV2/TEZ, D21 = 68.111/RGB-U//WARD/3/FGO/4/RABI, D22 = 68.111/RGB-U//WARD RESEL/3/STIL, D23 = 68112/WARD
37
4.2.2 DNA extraction
The extraction of DNA was based on a phenol-chlorophorm protocol described by
Rogowsky et al. (1991). Leaf tissue (2g) was collected from a single plant per genotype
into polypropylene screw cap culture tubes. Stainless steel ball bearings were then placed
into each tube. Tubes were immersed in liquid nitrogen for 5 minutes, then placed on a
vortex mixer (VOR-MIX, S.E.M. (SA) Pty Ltd, AUS) until frozen leaf tissue was ground
to a fine powder. After removing the ball bearings using a magnet, 4.5mL of DNA
extraction buffer (1% sarkosyl, 100mM Tris-HCl, 100mM NaCl, 10mM EDTA, 2%
polyvinyl-polypyrrolidone (insoluble), pH 8.5 adjusted using concentrated HCl) was added
and slowly mixed with the leaf tissue powder using a suspension mixer (Ratek Instruments
Pty. Ltd., AUS) for 1 minute. Next, 4.5mL of phenol:chloroform:isoamyl alcohol (25:24:1)
was added, mixed vigorously for 1 minute using a vortex mixer and mixed for a further 5
minutes using a suspension mixer. Separated aqueous phase was decanted into a silica
matrix tube and re-extracted as above using 4mL phenol:chloroform:isoamyl alcohol then
centrifuged for 10 minutes. In a fresh tube, DNA was precipitated by adding 400μL 3M
sodium acetate (pH 4.8) and 4mL isopropanol and mixed for 5 minutes on an orbital mixer
(Ratek Instruments Pty. Ltd., AUS). DNA was spooled using a Pasteur pipette, transferred
to a 2mL tube, washed with 1mL 70% ethanol, pelleted and dried. DNA was resuspended
in 350μL of sterile water and stored overnight at 4˚C. Long term storage was at -20˚C.
DNA quality and quantity was checked using a ND-1000 spectrophotometer (NanoDrop
Technologies, USA).
4.2.3 DArT marker application and output
DNA from each test sample was diluted and prepared for DArT analysis as per instructions
provided by Triticarte Pty Ltd (Australian Capital Territory, Australia)
(http://www.triticarte.com.au/content/services-quality.html). DArT marker application was
performed by Triticarte Pty Ltd, using a prototype of the version 2.5 high-density DArT
array that had about 75% more clones than the standard array version 2.3. The
hybridisation of each marker to a test sample was scored as either present (1), absent (0) or
missing (X, for unreliable scores). Markers that obtained a Q-value (estimate of marker
quality) below 77 were not used as errors in scoring become significant below this value
(E. Huttner, personal communication, 2008).
38
4.2.4 DArT marker data analysis
DArT markers were considered to be polymorphic amongst the genotypes assessed here
when both the ‘1’ and ‘0’ alleles were observed at a frequency where the rarer allele was at
least 0.05. Polymorphic information content values (Botstein et al. 1980) were calculated
for each marker as per the method of De Riek et al. (2001) for dominant markers.
Polymorphic markers were assigned to chromosomes of the A, B and D genomes using 17
reference genetic maps by comparison. The reference genetic maps referred to here were as
follows:
� Triticarte version 1.2 set of nine integrated genetic maps (Triticarte Pty Ltd 2008),
� Gladius x Drysdale and Kukri x Excalibur genetic map (provided by Dr Ken
Chalmers, University of Adelaide).
� Ajana x WAWHT2074, P92201D5-2 x P91193D1-10, Cadoux x Reeves and EGA
Blanco x Millewa genetic maps (Francki et al. 2009),
� Colosseo x Lloyd genetic map (tetraploid wheat) (Mantovani et al. 2008), and
� Langdon x Wild emmer wheat (G18-16) (tetraploid wheat) (Peleg et al. 2008).
Unmapped DArT markers assigned to chromosome regions by Francki et al. (2009),
through the use of nullisomic-tetrasomic and deletion lines, were also used.
The software package NTSYSpc (version 2.20N) (Rohlf 2005) was used to perform the
following computations. Genetic similarity matrices between pairs of genotypes were
estimated using the Nei and Li coefficient (Nei and Li 1979) in subprogram SIMQUAL.
Correlation between similarity matrices were estimated using a 2-way Mantel test in
subprogram MXCOMP (Mantel 1967). Unweighted pair group method of arithmetic
averaging (UPGMA) dendrograms, which demonstrate genetic similarity through
hierarchical clustering were generated using subprogram SAHN (Sokal and Michener
1958; Sneath and Sokal 1973). Durum wheat and Ae. tauschii parentage of primary
synthetics were shown in the dendrograms by the use of pedigree abbreviations in
parentheses. (For corresponding pedigree abbreviation and explanation refer to Chapter 3).
Principal coordinate analysis, which displays spatial genetic structure between genotypes
was performed using subprograms DCENTER and EIGEN (Gower 1966). The first two
axes were extracted to represent the total diversity detected. These operations were applied
to analyse the A, B and D genomes of the primary synthetic wheats and bread wheat
cultivars in four ways: (1) using data from D genome assigned polymorphic markers, (2)
using data from A and B genome assigned polymorphic markers, (3) using data from A, B
39
and D genome assigned markers together, and (4) using data from all polymorphic
markers, with and without chromosome assignment.
4.3 Results
4.3.1 Detection of polymorphism
A total of 1808 DArT markers detected polymorphism across the 44 primary synthetic
wheats and nine bread wheat cultivars. These markers had a mean call rate of 95.5% and
polymorphic information content values distributed from 0.1 to 0.5 (Figure 7). The mean
polymorphic information content value was 0.39. Of the marker loci that were given
chromosomal assignment from 17 reference genetic maps by comparison, most represented
the B genome (472), followed by the A genome (317) and the D genome (179). Although
DArT markers wPt-2592, wPt-2689, wPt-2910, wPt-5765, wPt-6292, wPt-6661, wPt-6736,
wPt-8321 and wPt-9488 were assigned to the D genome, using the reference genetic maps,
they were found to hybridise to at least one reference durum wheat cultivar, and hence
these markers were removed from further analyses. Of the polymorphic markers that were
not given chromosomal assignment, 168 markers were found to hybridise to all primary
synthetic wheats but not to any of the bread wheat cultivars. Six unassigned markers
hybridised in the opposite type of polymorphism (‘0’ in all synthetics, ‘1’ in all bread
wheats).
4.3.2 Genetic similarities
The mean similarity coefficient between primary synthetic wheat pairs based on A and B
genome and D genome DArT marker data sets was 0.67. The ranges of similarity
coefficients between primary synthetic wheat pairs using A and B genome and D genome
DArT marker sets were 0.51 to 1.00 and 0.38 to 1.00 respectively (Table 6). Primary
synthetic wheats S43 and S44, both of which had the same recorded durum parent (D23)
had a similarity coefficient of 1.00 between their A and B genomes. A similarity
coefficient of 1.00 was identified between the D genomes of thirteen primary synthetic
wheat pairs, which included genotypes S3(T221), S5(T218), S8(T895), S12(T629),
S42(T783), S43(T369) and S44(T369). The mean pair-wise similarity coefficient for the
bread wheat cultivars was 0.68 for their A and B genomes, with this value being 0.83
between their D genomes (Table 6). Similarity coefficients between primary synthetic and
bread wheat pairs ranged from 0.40 to 0.72, with a mean of 0.54 for their A and B
genomes. The D genomes of primary synthetic and bread wheat pairs had similarity
coefficients ranging from 0.41 to 0.86, with a mean of 0.66 (Table 6).
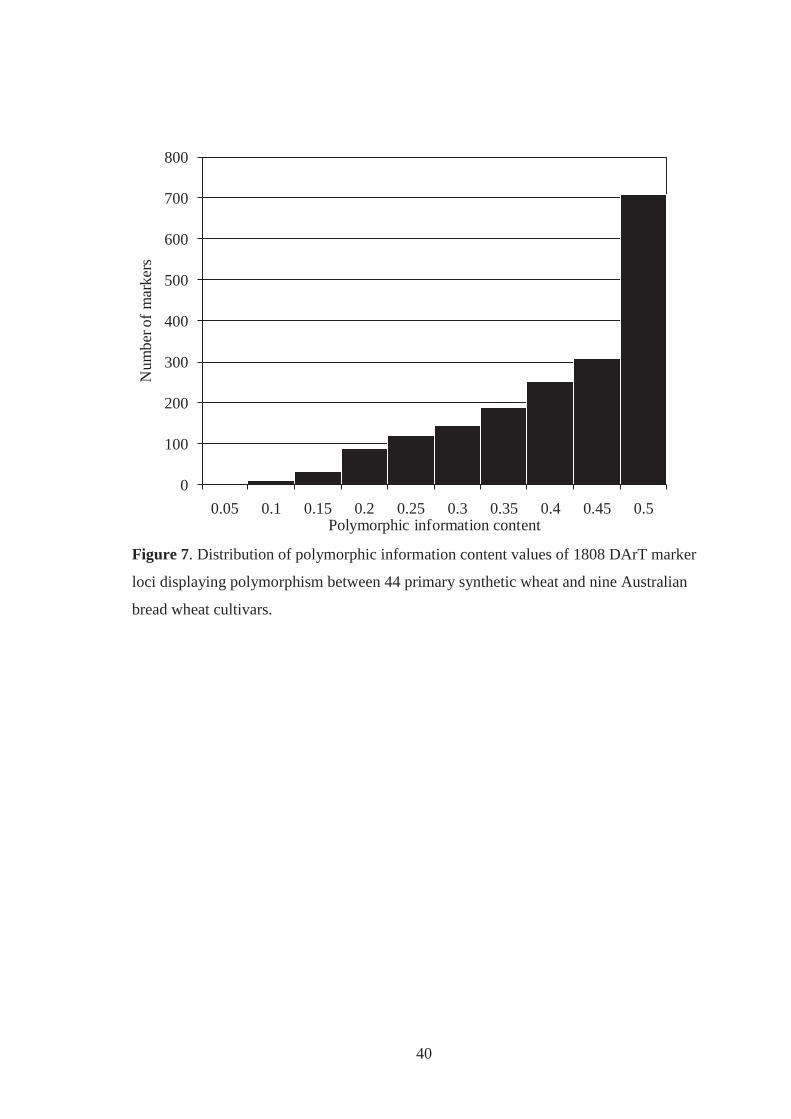
40
0
100
200
300
400
500
600
700
800
0.05 0.1 0.15 0.2 0.25 0.3 0.35 0.4 0.45 0.5
Num
ber o
f mar
kers
Polymorphic information content Figure 7. Distribution of polymorphic information content values of 1808 DArT marker
loci displaying polymorphism between 44 primary synthetic wheat and nine Australian
bread wheat cultivars.
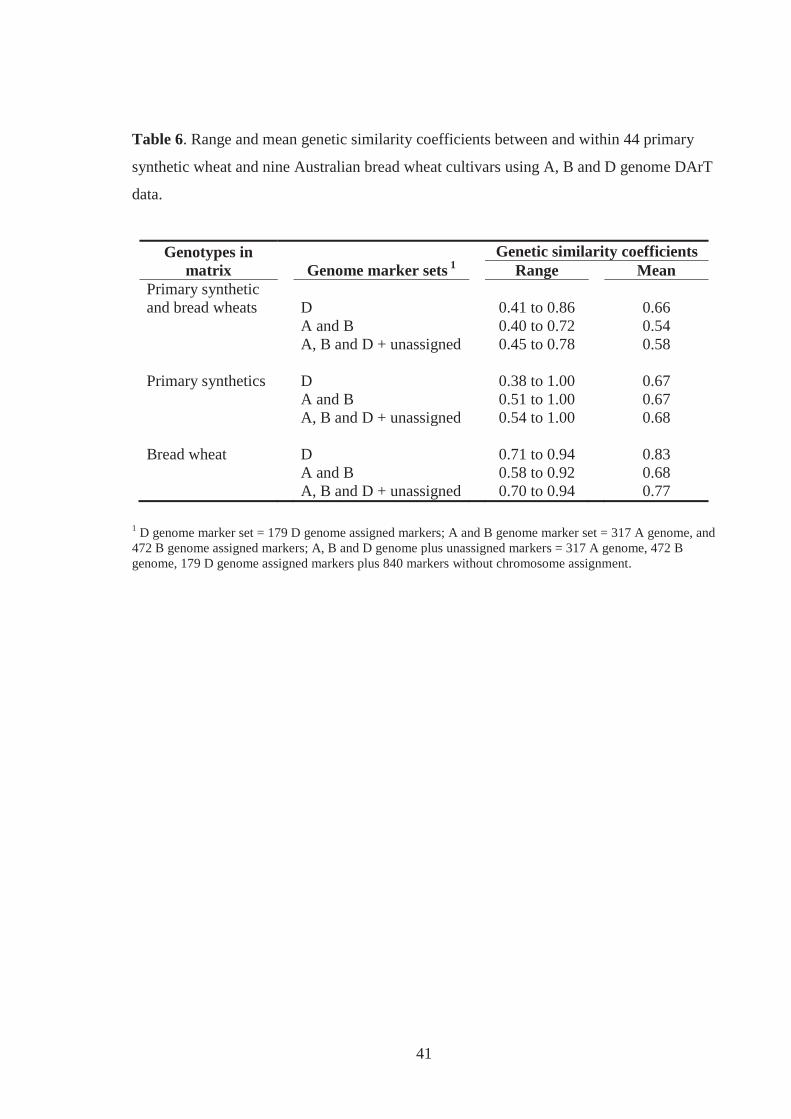
41
Table 6. Range and mean genetic similarity coefficients between and within 44 primary
synthetic wheat and nine Australian bread wheat cultivars using A, B and D genome DArT
data.
Genotypes in matrix
Genome marker sets 1
Genetic similarity coefficients Range Mean
Primary synthetic and bread wheats
D 0.41 to 0.86 0.66
A and B 0.40 to 0.72 0.54 A, B and D + unassigned 0.45 to 0.78 0.58 Primary synthetics D 0.38 to 1.00 0.67 A and B 0.51 to 1.00 0.67 A, B and D + unassigned 0.54 to 1.00 0.68 Bread wheat D 0.71 to 0.94 0.83 A and B 0.58 to 0.92 0.68 A, B and D + unassigned 0.70 to 0.94 0.77
1 D genome marker set = 179 D genome assigned markers; A and B genome marker set = 317 A genome, and 472 B genome assigned markers; A, B and D genome plus unassigned markers = 317 A genome, 472 B genome, 179 D genome assigned markers plus 840 markers without chromosome assignment.
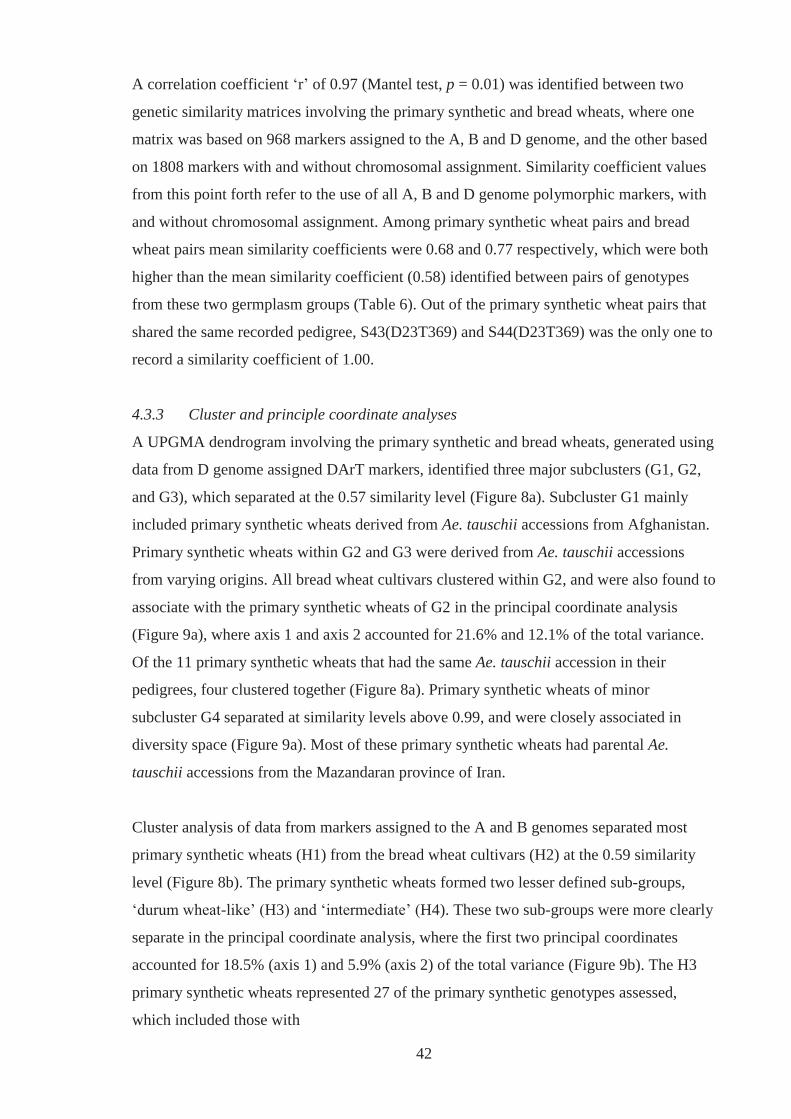
42
A correlation coefficient ‘r’ of 0.97 (Mantel test, p = 0.01) was identified between two
genetic similarity matrices involving the primary synthetic and bread wheats, where one
matrix was based on 968 markers assigned to the A, B and D genome, and the other based
on 1808 markers with and without chromosomal assignment. Similarity coefficient values
from this point forth refer to the use of all A, B and D genome polymorphic markers, with
and without chromosomal assignment. Among primary synthetic wheat pairs and bread
wheat pairs mean similarity coefficients were 0.68 and 0.77 respectively, which were both
higher than the mean similarity coefficient (0.58) identified between pairs of genotypes
from these two germplasm groups (Table 6). Out of the primary synthetic wheat pairs that
shared the same recorded pedigree, S43(D23T369) and S44(D23T369) was the only one to
record a similarity coefficient of 1.00.
4.3.3 Cluster and principle coordinate analyses
A UPGMA dendrogram involving the primary synthetic and bread wheats, generated using
data from D genome assigned DArT markers, identified three major subclusters (G1, G2,
and G3), which separated at the 0.57 similarity level (Figure 8a). Subcluster G1 mainly
included primary synthetic wheats derived from Ae. tauschii accessions from Afghanistan.
Primary synthetic wheats within G2 and G3 were derived from Ae. tauschii accessions
from varying origins. All bread wheat cultivars clustered within G2, and were also found to
associate with the primary synthetic wheats of G2 in the principal coordinate analysis
(Figure 9a), where axis 1 and axis 2 accounted for 21.6% and 12.1% of the total variance.
Of the 11 primary synthetic wheats that had the same Ae. tauschii accession in their
pedigrees, four clustered together (Figure 8a). Primary synthetic wheats of minor
subcluster G4 separated at similarity levels above 0.99, and were closely associated in
diversity space (Figure 9a). Most of these primary synthetic wheats had parental Ae.
tauschii accessions from the Mazandaran province of Iran.
Cluster analysis of data from markers assigned to the A and B genomes separated most
primary synthetic wheats (H1) from the bread wheat cultivars (H2) at the 0.59 similarity
level (Figure 8b). The primary synthetic wheats formed two lesser defined sub-groups,
‘durum wheat-like’ (H3) and ‘intermediate’ (H4). These two sub-groups were more clearly
separate in the principal coordinate analysis, where the first two principal coordinates
accounted for 18.5% (axis 1) and 5.9% (axis 2) of the total variance (Figure 9b). The H3
primary synthetic wheats represented 27 of the primary synthetic genotypes assessed,
which included those with
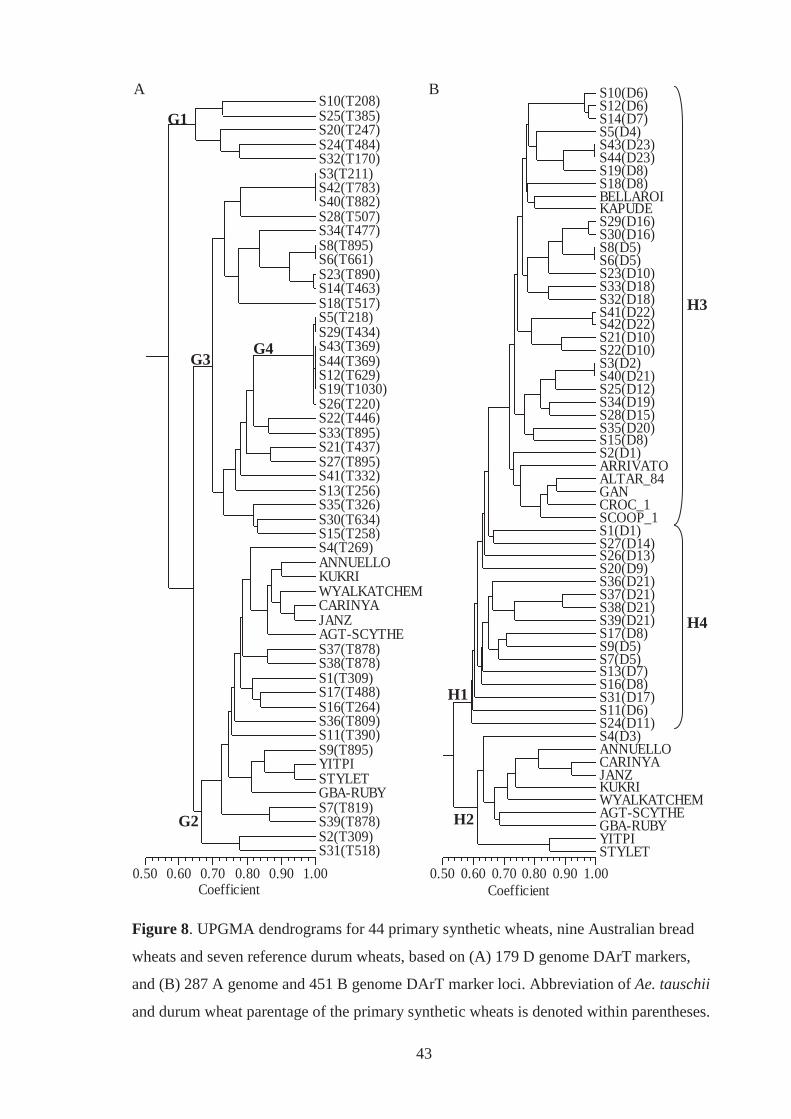
43
Coefficient0.50 0.60 0.70 0.80 0.90 1.00
S10(T208) S25(T385) S20(T247) S24(T484) S32(T170) S3(T211) S42(T783) S40(T882) S28(T507) S34(T477) S8(T895) S6(T661) S23(T890) S14(T463) S18(T517) S5(T218) S29(T434) S43(T369) S44(T369) S12(T629) S19(T1030) S26(T220) S22(T446) S33(T895) S21(T437) S27(T895) S41(T332) S13(T256) S35(T326) S30(T634) S15(T258) S4(T269) ANNUELLO KUKRI WYALKATCHEM CARINYA JANZ AGT-SCYTHE S37(T878) S38(T878) S1(T309) S17(T488) S16(T264) S36(T809) S11(T390) S9(T895) YITPI STYLET GBA-RUBY S7(T819) S39(T878) S2(T309) S31(T518)
Coefficient0.50 0.60 0.70 0.80 0.90 1.00
S10(D6) S12(D6) S14(D7) S5(D4) S43(D23) S44(D23) S19(D8) S18(D8) BELLAROI KAPUDE S29(D16) S30(D16) S8(D5) S6(D5) S23(D10) S33(D18) S32(D18) S41(D22) S42(D22) S21(D10) S22(D10) S3(D2) S40(D21) S25(D12) S34(D19) S28(D15) S35(D20) S15(D8) S2(D1) ARRIVATO ALTAR_84 GAN CROC_1 SCOOP_1 S1(D1) S27(D14) S26(D13) S20(D9) S36(D21) S37(D21) S38(D21) S39(D21) S17(D8) S9(D5) S7(D5) S13(D7) S16(D8) S31(D17) S11(D6) S24(D11) S4(D3) ANNUELLO CARINYA JANZ KUKRI WYALKATCHEM AGT-SCYTHE GBA-RUBY YITPI STYLET
Figure 8. UPGMA dendrograms for 44 primary synthetic wheats, nine Australian bread
wheats and seven reference durum wheats, based on (A) 179 D genome DArT markers,
and (B) 287 A genome and 451 B genome DArT marker loci. Abbreviation of Ae. tauschii
and durum wheat parentage of the primary synthetic wheats is denoted within parentheses.
A B
G2
G1
G3G4
H1
H2
H3
H4
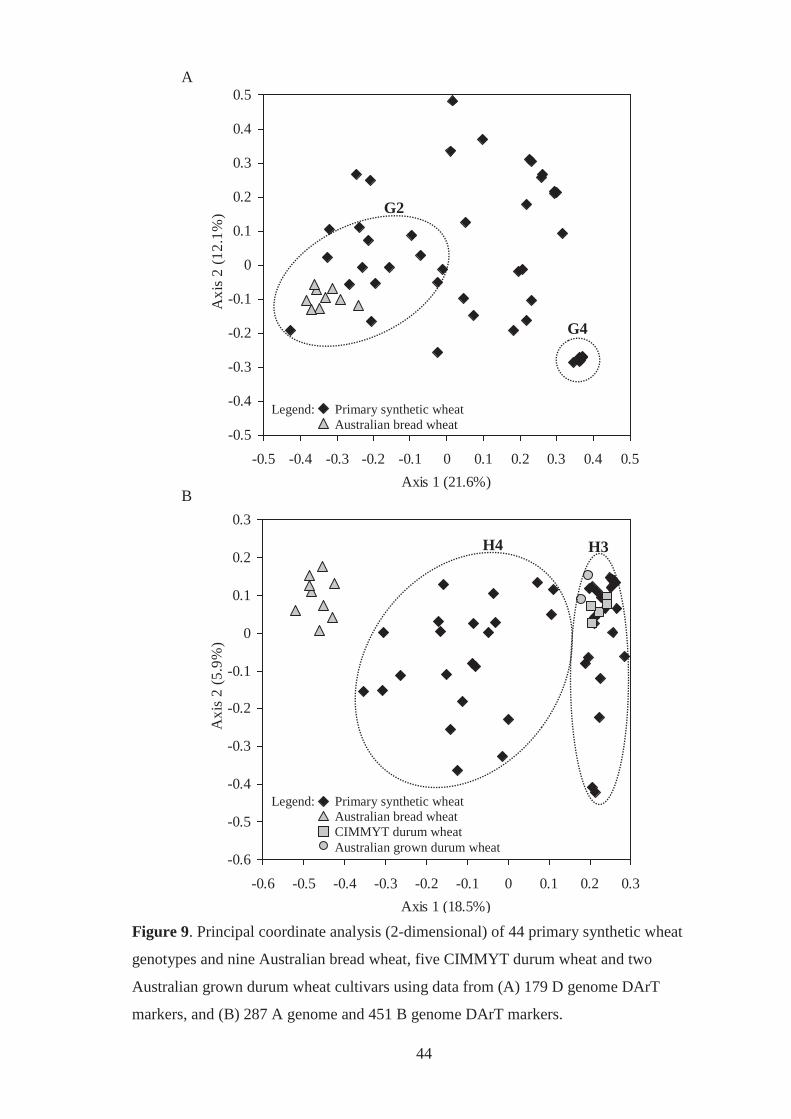
44
-0.5
-0.4
-0.3
-0.2
-0.1
0
0.1
0.2
0.3
0.4
0.5
-0.5 -0.4 -0.3 -0.2 -0.1 0 0.1 0.2 0.3 0.4 0.5Axis 1 (21.6%)
Axi
s 2
(12.
1%)
-0.6
-0.5
-0.4
-0.3
-0.2
-0.1
0
0.1
0.2
0.3
-0.6 -0.5 -0.4 -0.3 -0.2 -0.1 0 0.1 0.2 0.3Axis 1 (18.5%)
Axi
s 2
(5.9
%)
Figure 9. Principal coordinate analysis (2-dimensional) of 44 primary synthetic wheat
genotypes and nine Australian bread wheat, five CIMMYT durum wheat and two
Australian grown durum wheat cultivars using data from (A) 179 D genome DArT
markers, and (B) 287 A genome and 451 B genome DArT markers.
Legend: Primary synthetic wheat Australian bread wheat CIMMYT durum wheat Australian grown durum wheat
H4 H3
A
B
G2
G4
Legend: Primary synthetic wheat Australian bread wheat
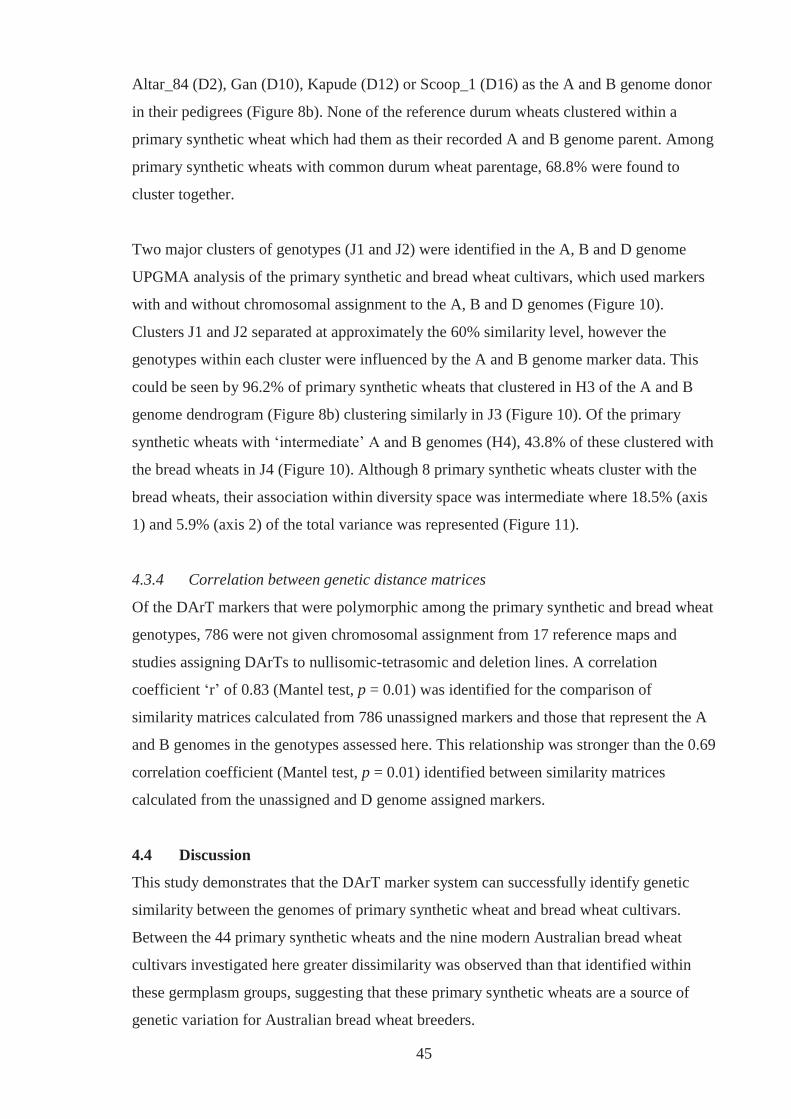
45
Altar_84 (D2), Gan (D10), Kapude (D12) or Scoop_1 (D16) as the A and B genome donor
in their pedigrees (Figure 8b). None of the reference durum wheats clustered within a
primary synthetic wheat which had them as their recorded A and B genome parent. Among
primary synthetic wheats with common durum wheat parentage, 68.8% were found to
cluster together.
Two major clusters of genotypes (J1 and J2) were identified in the A, B and D genome
UPGMA analysis of the primary synthetic and bread wheat cultivars, which used markers
with and without chromosomal assignment to the A, B and D genomes (Figure 10).
Clusters J1 and J2 separated at approximately the 60% similarity level, however the
genotypes within each cluster were influenced by the A and B genome marker data. This
could be seen by 96.2% of primary synthetic wheats that clustered in H3 of the A and B
genome dendrogram (Figure 8b) clustering similarly in J3 (Figure 10). Of the primary
synthetic wheats with ‘intermediate’ A and B genomes (H4), 43.8% of these clustered with
the bread wheats in J4 (Figure 10). Although 8 primary synthetic wheats cluster with the
bread wheats, their association within diversity space was intermediate where 18.5% (axis
1) and 5.9% (axis 2) of the total variance was represented (Figure 11).
4.3.4 Correlation between genetic distance matrices
Of the DArT markers that were polymorphic among the primary synthetic and bread wheat
genotypes, 786 were not given chromosomal assignment from 17 reference maps and
studies assigning DArTs to nullisomic-tetrasomic and deletion lines. A correlation
coefficient ‘r’ of 0.83 (Mantel test, p = 0.01) was identified for the comparison of
similarity matrices calculated from 786 unassigned markers and those that represent the A
and B genomes in the genotypes assessed here. This relationship was stronger than the 0.69
correlation coefficient (Mantel test, p = 0.01) identified between similarity matrices
calculated from the unassigned and D genome assigned markers.
4.4 Discussion
This study demonstrates that the DArT marker system can successfully identify genetic
similarity between the genomes of primary synthetic wheat and bread wheat cultivars.
Between the 44 primary synthetic wheats and the nine modern Australian bread wheat
cultivars investigated here greater dissimilarity was observed than that identified within
these germplasm groups, suggesting that these primary synthetic wheats are a source of
genetic variation for Australian bread wheat breeders.
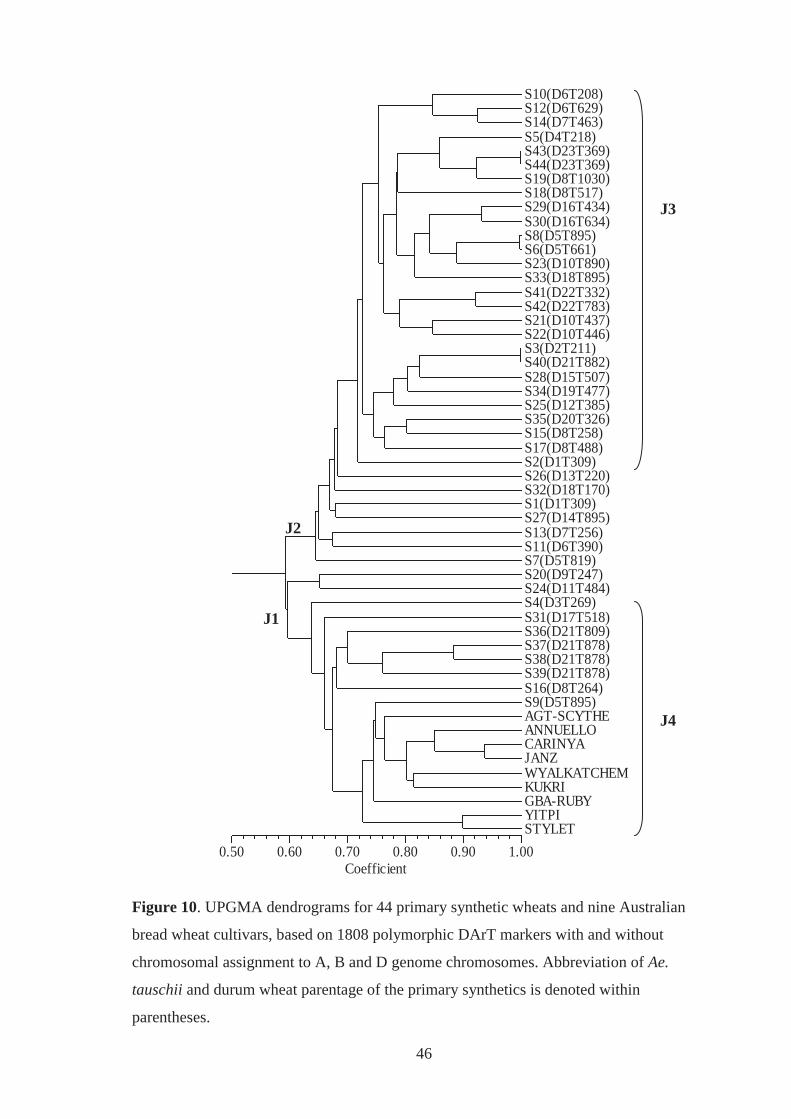
46
Coefficient0.50 0.60 0.70 0.80 0.90 1.00
S10(D6T208) S12(D6T629) S14(D7T463) S5(D4T218) S43(D23T369) S44(D23T369) S19(D8T1030) S18(D8T517) S29(D16T434) S30(D16T634) S8(D5T895) S6(D5T661) S23(D10T890) S33(D18T895) S41(D22T332) S42(D22T783) S21(D10T437) S22(D10T446) S3(D2T211) S40(D21T882) S28(D15T507) S34(D19T477) S25(D12T385) S35(D20T326) S15(D8T258) S17(D8T488) S2(D1T309) S26(D13T220) S32(D18T170) S1(D1T309) S27(D14T895) S13(D7T256) S11(D6T390) S7(D5T819) S20(D9T247) S24(D11T484) S4(D3T269) S31(D17T518) S36(D21T809) S37(D21T878) S38(D21T878) S39(D21T878) S16(D8T264) S9(D5T895) AGT-SCYTHE ANNUELLO CARINYA JANZ WYALKATCHEM KUKRI GBA-RUBY YITPI STYLET
Figure 10. UPGMA dendrograms for 44 primary synthetic wheats and nine Australian
bread wheat cultivars, based on 1808 polymorphic DArT markers with and without
chromosomal assignment to A, B and D genome chromosomes. Abbreviation of Ae.
tauschii and durum wheat parentage of the primary synthetics is denoted within
parentheses.
J1
J2
J3
J4
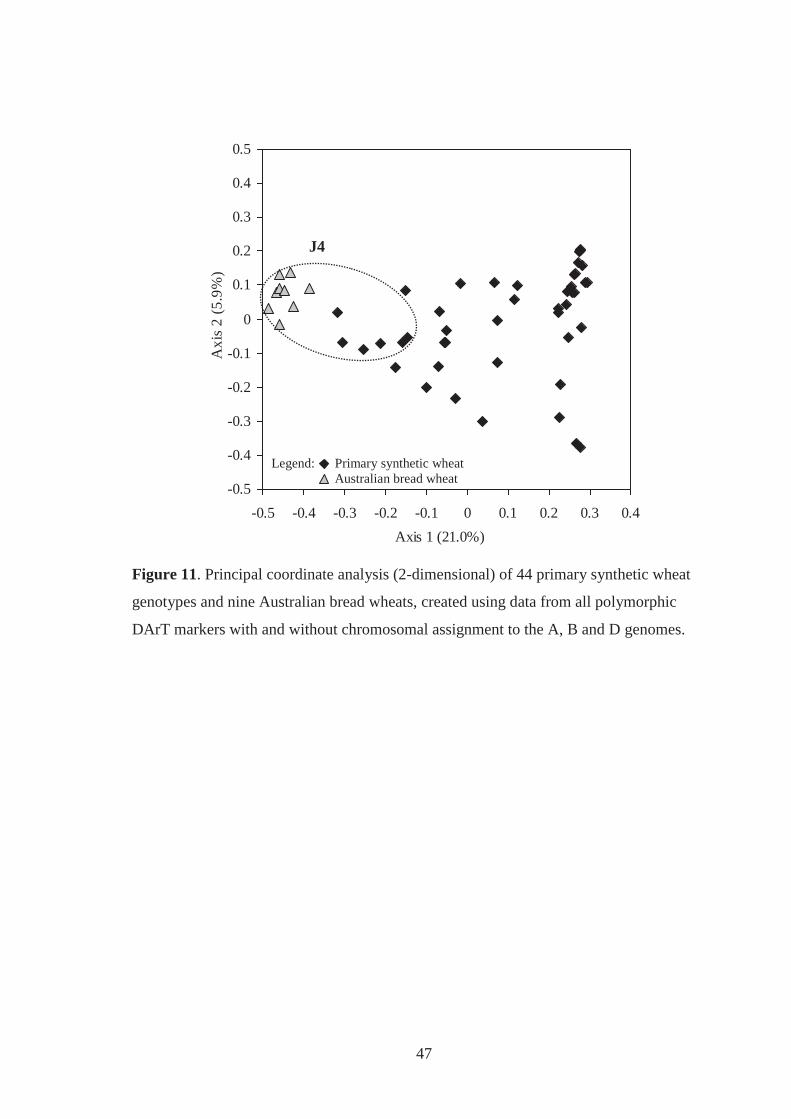
47
-0.5
-0.4
-0.3
-0.2
-0.1
0
0.1
0.2
0.3
0.4
0.5
-0.5 -0.4 -0.3 -0.2 -0.1 0 0.1 0.2 0.3 0.4Axis 1 (21.0%)
Axi
s 2
(5.9
%)
Figure 11. Principal coordinate analysis (2-dimensional) of 44 primary synthetic wheat
genotypes and nine Australian bread wheats, created using data from all polymorphic
DArT markers with and without chromosomal assignment to the A, B and D genomes.
J4
Legend: Primary synthetic wheat Australian bread wheat
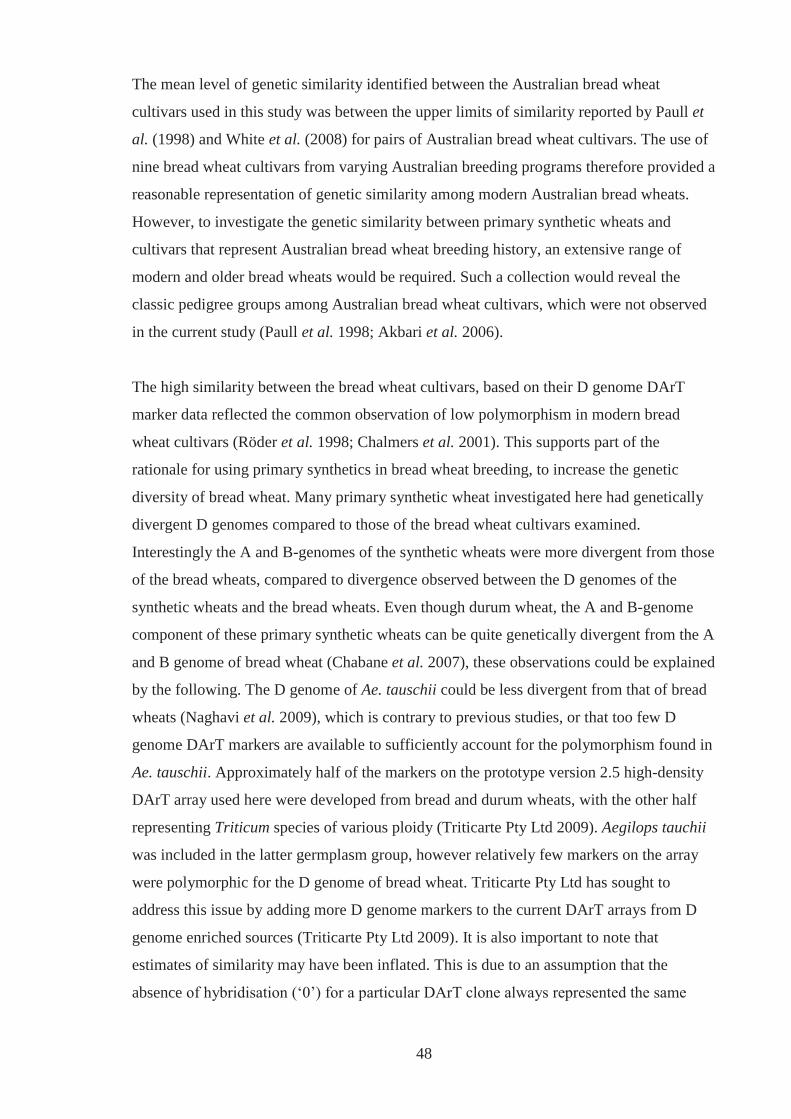
48
The mean level of genetic similarity identified between the Australian bread wheat
cultivars used in this study was between the upper limits of similarity reported by Paull et
al. (1998) and White et al. (2008) for pairs of Australian bread wheat cultivars. The use of
nine bread wheat cultivars from varying Australian breeding programs therefore provided a
reasonable representation of genetic similarity among modern Australian bread wheats.
However, to investigate the genetic similarity between primary synthetic wheats and
cultivars that represent Australian bread wheat breeding history, an extensive range of
modern and older bread wheats would be required. Such a collection would reveal the
classic pedigree groups among Australian bread wheat cultivars, which were not observed
in the current study (Paull et al. 1998; Akbari et al. 2006).
The high similarity between the bread wheat cultivars, based on their D genome DArT
marker data reflected the common observation of low polymorphism in modern bread
wheat cultivars (Röder et al. 1998; Chalmers et al. 2001). This supports part of the
rationale for using primary synthetics in bread wheat breeding, to increase the genetic
diversity of bread wheat. Many primary synthetic wheat investigated here had genetically
divergent D genomes compared to those of the bread wheat cultivars examined.
Interestingly the A and B-genomes of the synthetic wheats were more divergent from those
of the bread wheats, compared to divergence observed between the D genomes of the
synthetic wheats and the bread wheats. Even though durum wheat, the A and B-genome
component of these primary synthetic wheats can be quite genetically divergent from the A
and B genome of bread wheat (Chabane et al. 2007), these observations could be explained
by the following. The D genome of Ae. tauschii could be less divergent from that of bread
wheats (Naghavi et al. 2009), which is contrary to previous studies, or that too few D
genome DArT markers are available to sufficiently account for the polymorphism found in
Ae. tauschii. Approximately half of the markers on the prototype version 2.5 high-density
DArT array used here were developed from bread and durum wheats, with the other half
representing Triticum species of various ploidy (Triticarte Pty Ltd 2009). Aegilops tauchii
was included in the latter germplasm group, however relatively few markers on the array
were polymorphic for the D genome of bread wheat. Triticarte Pty Ltd has sought to
address this issue by adding more D genome markers to the current DArT arrays from D
genome enriched sources (Triticarte Pty Ltd 2009). It is also important to note that
estimates of similarity may have been inflated. This is due to an assumption that the
absence of hybridisation (‘0’) for a particular DArT clone always represented the same
49
allele, whereas in some cases there may have been multiple mutations or deletions leading
to absence of hybridisation.
The high correlation of the A and B genome DArT marker data with the unassigned DArT
marker data suggests that many of the markers without chromosomal assignment could be
A and B genome derived. The significant and moderate correlation between the unassigned
markers and the D genome assigned markers however suggested that some new D genome
markers are present, which require mapping. Nearly five times more DArT markers were
found to hybridise to the primary synthetic wheats and not the bread wheat cultivars, than
in the opposite type of polymorphism. Due to the germplasm used to develop the DArT
array used here it is surprising to have a high level of hybridisation with the synthetics. The
use of primary synthetic wheats as parents of mapping populations could aid in assigning
additional DArT markers to chromosomes.
The low genetic similarity coefficients and low incidence of clustering between primary
synthetic wheat with the same recorded pedigree components (durum and/or Ae. tauschii
accession) raises concerns about the accuracy of their recorded pedigrees. Discrepancies in
the pedigrees of some primary synthetics created by CIMMYT in the late 1980’s and
1990’s have been discovered through research investigations. As reported by Singh et al.
(2000), the primary synthetic wheat used to develop the recombinant inbred population
‘Opata 85 x Synthetic’ for the International Triticeae Mapping Initiative (ITMI) (Van
Deynze et al. 1995) repeatedly failed to exhibit expected rust-resistance infection types
along with progeny from the population . Some of the synthetics imported into Australia
have been found to differ in their glutenin composition from what would be expected based
on pedigree information (Cornish 2008). A high degree of out-crossing has been observed
in primary synthetic wheat imported into Australia, and has been thought to be the cause of
approximately 6% of these primary synthetic wheats not being true to type (F. Ogbonnaya,
personal communication, 2008). Therefore the use of CIMMYT durum wheat as accurate
parental references in the current study had its limitations. The methods used to analyse the
synthetic wheats had limitations. With only a single plant sampled from each accession, it
was not possible to detect heterogeneity within accessions. Therefore the results observed
may have not been fully representative of each accession.
50
4.5 Conclusion
The present DArT marker analysis, characterising the genetic diversity of primary
synthetic wheat and Australian bread wheat shows that primary synthetic wheat is a source
of genetic diversity that could be suitable for breeding. The primary synthetic and bread
wheat groups used here showed a lack of genetic divergence between their D genomes,
emphasising the need to develop more polymorphic D genome markers, possibly from Ae.
tauschii accessions. This action is likely to occur in the near future. Based on the current
study it seems that the pedigree information for some CIMMYT developed primary
synthetic wheats must be viewed with caution. The practice of thorough pedigree record
keeping and the collecting and retention of seed from the exact parental plants used for
developing primary synthetic wheats is encouraged for later molecular studies.
51
Chapter 5
Grain yield and its component traits in synthetic backcross wheat
lines grown under drought stress 5.1 Introduction
Increases in global grain yields of bread wheat (Triticum aestivum L.) over the last 40
years partly come from the use of gibberellic acid-sensitive dwarfing genes (Rht1 and
Rht2), which were globally distributed during the ‘green revolution’ (Smale et al. 2002). In
addition to reducing plant height to a semi-dwarf form, the expression of these genes
increased grain yield through the production of more grains per m2, compared to normal
stature wheats. Grains per m2 is one of two major grain yield components of bread wheat,
and increases in this component have commonly been accompanied by reductions in the
other component, grain weight (Miralles and Slafer 1995; Miralles et al. 1998; Araus et al.
2008). Mean individual grain weight is a major grain yield component and a quality
character of bread wheat. High grain weight has a favourable effect on milling yield due to
higher endosperm volume to surface area ratios, reducing the percent of by-products (bran
and pollard) from the milling process (Marshall et al. 1986; Wiersma et al. 2001).
Although semi-dwarf cultivars have shown a negative relationship between grain weight
and grains per m2, further increases of grain yield may be possible through exploring
genetic variation to simultaneously increase grain weight and grains per m2 (Gaju et al.
2009).
Primary synthetic wheats are a potential genetic resource for increasing grain weight and
grains per m2 in semi-dwarf bread wheats. Genetic variation for both grain yield
components has been reported in primary synthetic wheats (Villareal et al. 1994a; Villareal
et al. 1994b; Mujeeb-Kazi 1995; Calderini and Reynolds 2000; Calderini and Ortiz-
Monasterio 2003). As primary synthetic and bread wheats have the same genomic
constitution (genome AABBDD) and can be readily hybridised, genetic material from
_________________________________________________________________ In October 2010, a modified version of this chapter was submitted as a manuscript to the journal Crop and Pasture Science for consideration for publication. The title and authors of this manuscript are as follows: Grain yield and its component traits in synthetic backcross wheat lines grown under drought stress S. J. TalbotA, F. C. OgbonnayaB,C, P. J. EckermannA, and D. E. MatherA,D AMolecular Plant Breeding Cooperative Research Centre and School of Agriculture, Food and Wine, The University of Adelaide, PMB 1, Glen Osmond, SA 5064, Australia BDepartment of Primary Industries, Primary Industries Research Victoria, Private Bag 9 260, Horsham, VIC 3401, Australia. CPresent affiliation: International Center for 10 Agricultural Research in the Dry Areas, PO Box 5466, Aleppo, Syria
52
primary synthetic wheats can be exploited for the breeding of improved bread wheat
cultivars (Reynolds et al. 2005).
In northern and southern Australian environments, synthetic derivatives with improved
grain yield performance have been identified (Dreccer et al. 2007; Ogbonnaya et al. 2007;
Rattey and Shorter 2010). In these studies, synthetic backcross lines achieved grain yields
up to 30% higher than the best check bread wheat in the north, while in the south, grain
yields up to 11% higher than the best check bread wheat were reported. Gororo et al.
(2002) investigated a set of synthetic backcross lines at low and high yielding
environments in southern Australia. In the high yielding environments, grain yield of
synthetic backcross lines were similar to that of their Australian recurrent bread wheat
parent. In the lower yielding environments, synthetic derivatives produced significantly
higher grain yields, up to 149% of their Australian recurrent bread wheat parent (Gororo et
al. 2002). However, the ability of synthetic backcross lines to achieve such superior grain
yields, in diverse drought stressed environments in southern Australia, is unknown.
There is high priority to develop bread wheat cultivars in Australia that maintain a viable
level of grain yield in drought stressed environments. The occurrence of drought can
severely reduce the grain yield of bread wheat in Australia, where it is grown in rainfed
environments (275mm to 700mm p.a.) (Fischer 1999). In the growing seasons of 2006 and
2007, drought in the southern Australian wheat belt resulted in severe yield losses (Bureau
of Meteorology 2008a; Bureau of Meteorology 2008b). Reductions in the Australian
national production of wheat were in the order of 49.7% in 2006/07 and 39.4% in 2007/08,
compared with 2001/02-2005/06 average production (ABARE 2003; ABARE 2007;
ABARE 2008). The conditions of 2006 and 2007 provided an opportunity to investigate
the grain yield, grain weight and grains produced per m2 of synthetic backcross lines
grown in southern Australian environments under natural drought conditions.
The potential of primary synthetic wheats to increase grain weight and grains per m2 of a
bread wheat cultivar, in drought stressed environments, may be different because primary
synthetic wheat can be created from different Triticum turgidum L. and Aegilops tauschii
Coss. accessions (Mujeeb-Kazi et al. 1996). Variation in the grain yield components of
synthetic derivatives assessed in Australia has not been extensively reported, and hence the
effect that different primary synthetic wheat parents may have on mean individual grain
weight and grains per m2 is unknown (Dreccer et al. 2007; Ogbonnaya et al. 2007). Gororo
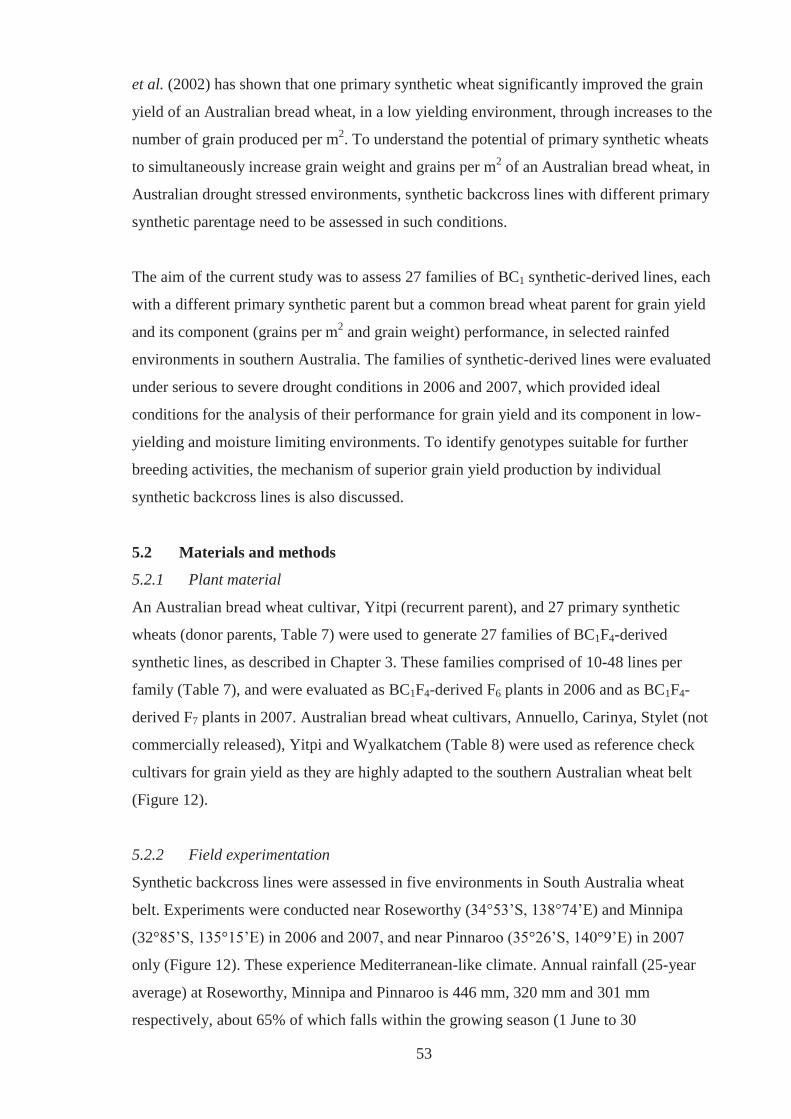
53
et al. (2002) has shown that one primary synthetic wheat significantly improved the grain
yield of an Australian bread wheat, in a low yielding environment, through increases to the
number of grain produced per m2. To understand the potential of primary synthetic wheats
to simultaneously increase grain weight and grains per m2 of an Australian bread wheat, in
Australian drought stressed environments, synthetic backcross lines with different primary
synthetic parentage need to be assessed in such conditions.
The aim of the current study was to assess 27 families of BC1 synthetic-derived lines, each
with a different primary synthetic parent but a common bread wheat parent for grain yield
and its component (grains per m2 and grain weight) performance, in selected rainfed
environments in southern Australia. The families of synthetic-derived lines were evaluated
under serious to severe drought conditions in 2006 and 2007, which provided ideal
conditions for the analysis of their performance for grain yield and its component in low-
yielding and moisture limiting environments. To identify genotypes suitable for further
breeding activities, the mechanism of superior grain yield production by individual
synthetic backcross lines is also discussed.
5.2 Materials and methods
5.2.1 Plant material
An Australian bread wheat cultivar, Yitpi (recurrent parent), and 27 primary synthetic
wheats (donor parents, Table 7) were used to generate 27 families of BC1F4-derived
synthetic lines, as described in Chapter 3. These families comprised of 10-48 lines per
family (Table 7), and were evaluated as BC1F4-derived F6 plants in 2006 and as BC1F4-
derived F7 plants in 2007. Australian bread wheat cultivars, Annuello, Carinya, Stylet (not
commercially released), Yitpi and Wyalkatchem (Table 8) were used as reference check
cultivars for grain yield as they are highly adapted to the southern Australian wheat belt
(Figure 12).
5.2.2 Field experimentation
Synthetic backcross lines were assessed in five environments in South Australia wheat
belt. Experiments were conducted near Roseworthy (34°53’S, 138°74’E) and Minnipa
(32°85’S, 135°15’E) in 2006 and 2007, and near Pinnaroo (35°26’S, 140°9’E) in 2007
only (Figure 12). These experience Mediterranean-like climate. Annual rainfall (25-year
average) at Roseworthy, Minnipa and Pinnaroo is 446 mm, 320 mm and 301 mm
respectively, about 65% of which falls within the growing season (1 June to 30
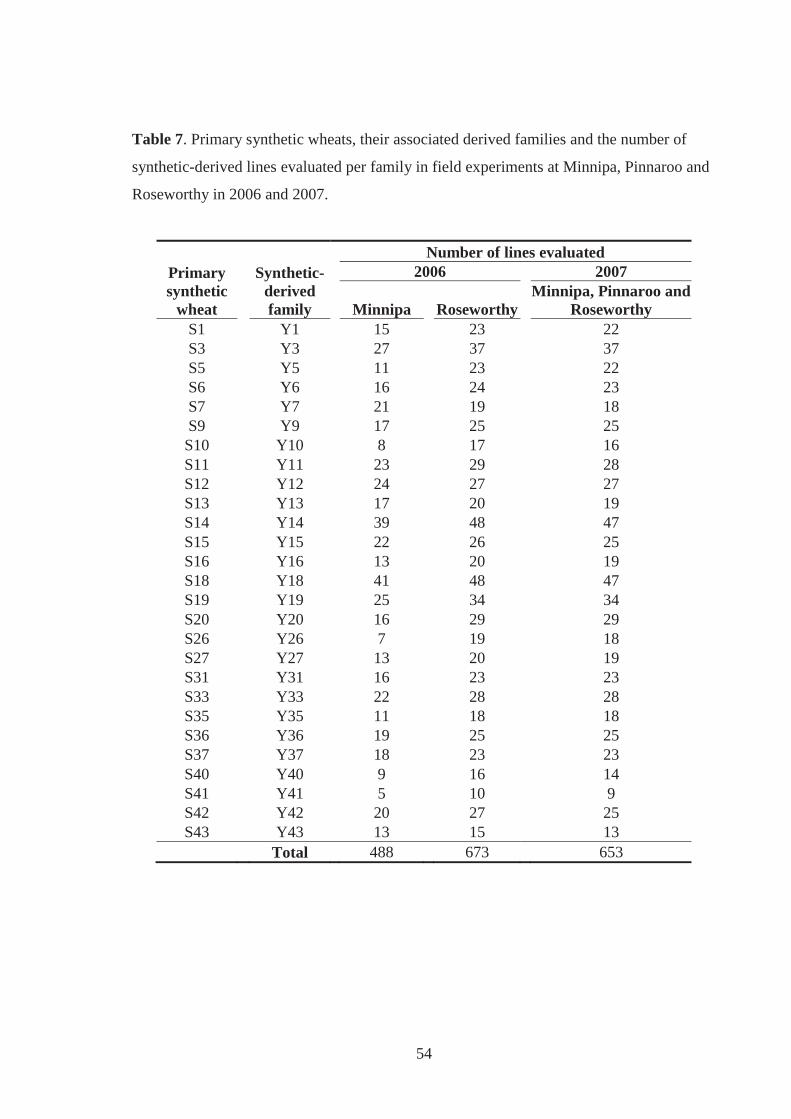
54
Table 7. Primary synthetic wheats, their associated derived families and the number of
synthetic-derived lines evaluated per family in field experiments at Minnipa, Pinnaroo and
Roseworthy in 2006 and 2007.
Primary synthetic
wheat
Synthetic-
derived family
Number of lines evaluated 2006 2007
Minnipa Roseworthy Minnipa, Pinnaroo and
Roseworthy S1 Y1 15 23 22 S3 Y3 27 37 37 S5 Y5 11 23 22 S6 Y6 16 24 23 S7 Y7 21 19 18 S9 Y9 17 25 25 S10 Y10 8 17 16 S11 Y11 23 29 28 S12 Y12 24 27 27 S13 Y13 17 20 19 S14 Y14 39 48 47 S15 Y15 22 26 25 S16 Y16 13 20 19 S18 Y18 41 48 47 S19 Y19 25 34 34 S20 Y20 16 29 29 S26 Y26 7 19 18 S27 Y27 13 20 19 S31 Y31 16 23 23 S33 Y33 22 28 28 S35 Y35 11 18 18 S36 Y36 19 25 25 S37 Y37 18 23 23 S40 Y40 9 16 14 S41 Y41 5 10 9 S42 Y42 20 27 25 S43 Y43 13 15 13
Total 488 673 653
55
Table 8. Date of sowing for each field experiment, replication of synthetic derivatives per
experiment and number of reference check cultivar replicates sown per experiment.
Field experiments 2006 2007 Minnipa Roseworthy Minnipa Pinnaroo Roseworthy
Sowing date 9 June 7 June 2 June 6 June 22 May
Replication of synthetic
derivatives
38% 25% 20% 20% 20%
Replicates of check cultivars
Annuello 8 6 12 12 10 Carinya 5 5 8 11 10 Stylet 5 5 10 10 10 Yitpi 8 6 15 14 14
Wyalkatchem 6 5 12 10 10
56
Figure 12. Location of field experiments (Minnipa, Pinnaroo and Roseworthy) within the
in South Australian wheat belt. Isohyets represent zones receiving an annual rainfall of
300mm and 600mm (Bureau of Meteorology 2008c).
57
November). DiGGer design search software (Coombes 2002) was used to design the field
experiments, using random, partially replicated designs (Cullis et al. 2006). In each
experiment there was at least 20% replication of the synthetic backcross lines, with up to
15 replicates of each reference check cultivar (Table 8). Plots within experiments used 34 g
of seed, sown as full plots (6 row, 1.3 x 3.2m; 4.16m2), and were mechanically harvested
using methods similar to those described by Kuchel (2007). Chemical pest control
management and fertiliser application followed local practice at each experimental
location.
5.2.3 Phenotypic evaluation
Mean individual grain weight (mg) was derived from counting a random sample of 500
threshed grains from each field plot and dividing by 500. As the area harvested from each
plot was 4.16 m2, grain yield in kg/ha was calculated by dividing the number of kg of grain
harvested by 4.16 x 10⁻⁴. The number of grains produced per m2 per plot was determined
by dividing plot grain yield (g) by grain weight (g), then by plot area (m2).
5.2.4 Statistical analysis
Multi-environment trial (MET) analysis was performed on field and postharvest
measurements. Mixed linear models were fitted using residual maximum likelihood
(REML) (Patterson and Thompson 1971; Gilmour et al. 1995) to manage genotype by
environment interactions. This was performed in the ‘R’ statistical environment (R
Development Core Team 2008) (version 2.5.0) using the ASReml package (Butler et al.
2007). Best linear unbiased predictions (BLUPs) (Henderson 1975; Piepho et al. 2008)
were generated for each measurement, for each genotype, at each environment,
incorporating adjustments for spatial fixed and random effects. A summary of these effects
is found in Appendix 3. BLUPs for each family of synthetic backcross lines were
calculated as the mean of BLUPs of lines within each family at each environment. Across-
year MET BLUPs (Minnipa 2006 and 2007 BLUPs, and Roseworthy 2006 and 2007
BLUPs) for reference bread wheat checks, families and synthetic backcross lines within
were calculated as the mean of corresponding BLUPs from experiments conducted in 2006
and 2007 at a trial location. Estimates of heritability for grain yield and grain weight at
individual environments were calculated using methods described by Cullis (2006).
Associations among grain weight, grains per m2 and grain yield were investigated across
all synthetic backcross lines and within families by applying simple linear correlation
58
analysis to the MET BLUP means for Roseworthy (2006 and 2007), Minnipa (2006 and
2007), and Pinnaroo (2007).
5.3 Results
5.3.1 Climatic and growing conditions
Drought was experienced in southern Australia during the growing seasons of this study (1
June to 30 November in 2006 and 2007). At Minnipa and Roseworthy in 2006, growing
season rainfall was 41.6% and 40.5% of their respective 25-year means (Table 9). In 2007,
Minnipa, Pinnaroo and Roseworthy received 36.6%, 62.4% and 63.4% of their respective
25-year mean rainfall for the same five month period. Unseasonal rainfall occurred at these
localities in several summer and autumn months prior to the growing seasons of 2006 and
2007, resulting in near mean annual rainfall (Table 9).
Experiments at Roseworthy exhibited symptoms of crown rot. The severity of crown rot
symptoms was fitted as a fixed covariate in the MET analysis (Appendix 3).
5.3.2 Heritability, genetic variance and genetic correlations between environments
Estimates of heritability of grain yield and grain weight ranged from 0.37 to 0.89 across
environments (Table 10). Genetic variance for grain yield was higher for the environments
with higher grain yields. Estimates of genetic correlation for grain yield ranged from 0.51
to 0.85 between environments, and from 0.59 to 0.82 for grain weight (Table 11).
5.3.3 BLUP analysis of grain yield and its components
Grain yield and its components reported here for genotypes grown under the Roseworthy
and Minnipa environments are for 2006 and 2007 across year MET BLUPs. Data from the
Pinnaroo environment are for 2007 MET BLUPs.
5.3.3.1 Grain yield performance
Grain yields were highest at Roseworthy, followed by Pinnaroo and Minnipa, with Yitpi
yielding 2547.9 kg/ha, 1212.1 kg/ha and 405.9 kg/ha, respectively (Figure 13). Across
environments, estimated grain yield of synthetic backcross families ranged from 73.8% to
103.3% of that of Yitpi. Y18 produced the highest estimated family grain yield in every
environment, and was superior (p<0.05) to 18 other families at Roseworthy, 14 at Minnipa
and three at Pinnaroo. Synthetic backcross lines within families produced grain yields up to
12.0% higher at Roseworthy, 4.7% higher at Pinnaroo and 43.8% higher at Minnipa
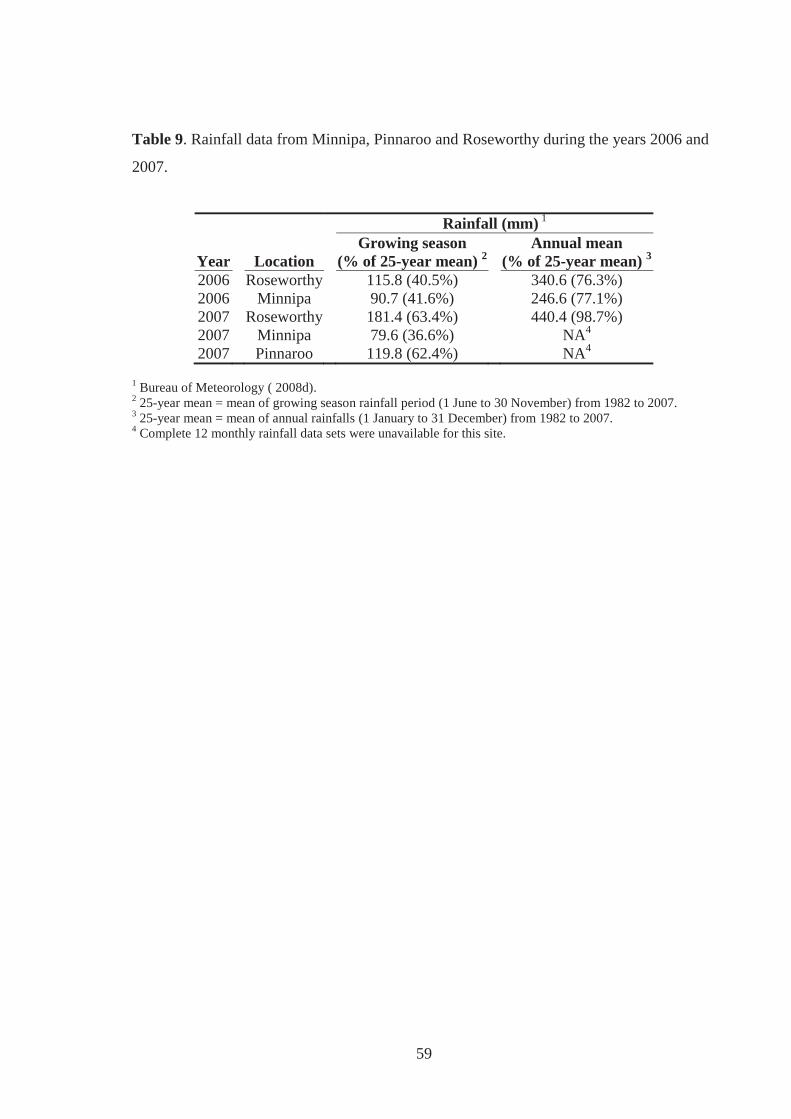
59
Table 9. Rainfall data from Minnipa, Pinnaroo and Roseworthy during the years 2006 and
2007.
Rainfall (mm) 1
Year Location Growing season
(% of 25-year mean) 2 Annual mean
(% of 25-year mean) 3
2006 Roseworthy 115.8 (40.5%) 340.6 (76.3%) 2006 Minnipa 90.7 (41.6%) 246.6 (77.1%) 2007 Roseworthy 181.4 (63.4%) 440.4 (98.7%) 2007 Minnipa 79.6 (36.6%) NA4
2007 Pinnaroo 119.8 (62.4%) NA4
1 Bureau of Meteorology ( 2008d). 2 25-year mean = mean of growing season rainfall period (1 June to 30 November) from 1982 to 2007. 3 25-year mean = mean of annual rainfalls (1 January to 31 December) from 1982 to 2007. 4 Complete 12 monthly rainfall data sets were unavailable for this site.
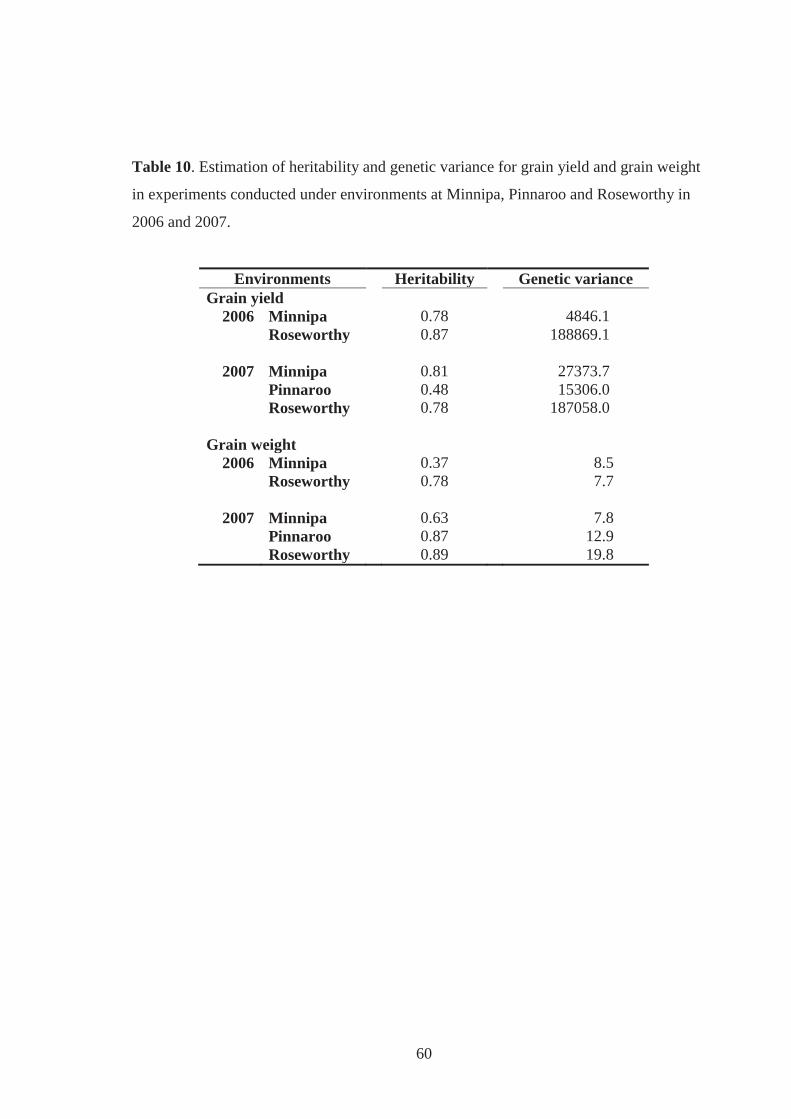
60
Table 10. Estimation of heritability and genetic variance for grain yield and grain weight
in experiments conducted under environments at Minnipa, Pinnaroo and Roseworthy in
2006 and 2007.
Environments Heritability Genetic variance Grain yield 2006 Minnipa 0.78 4846.1 Roseworthy 0.87 188869.1 2007 Minnipa 0.81 27373.7 Pinnaroo 0.48 15306.0 Roseworthy 0.78 187058.0 Grain weight 2006 Minnipa 0.37 8.5 Roseworthy 0.78 7.7 2007 Minnipa 0.63 7.8 Pinnaroo 0.87 12.9 Roseworthy 0.89 19.8
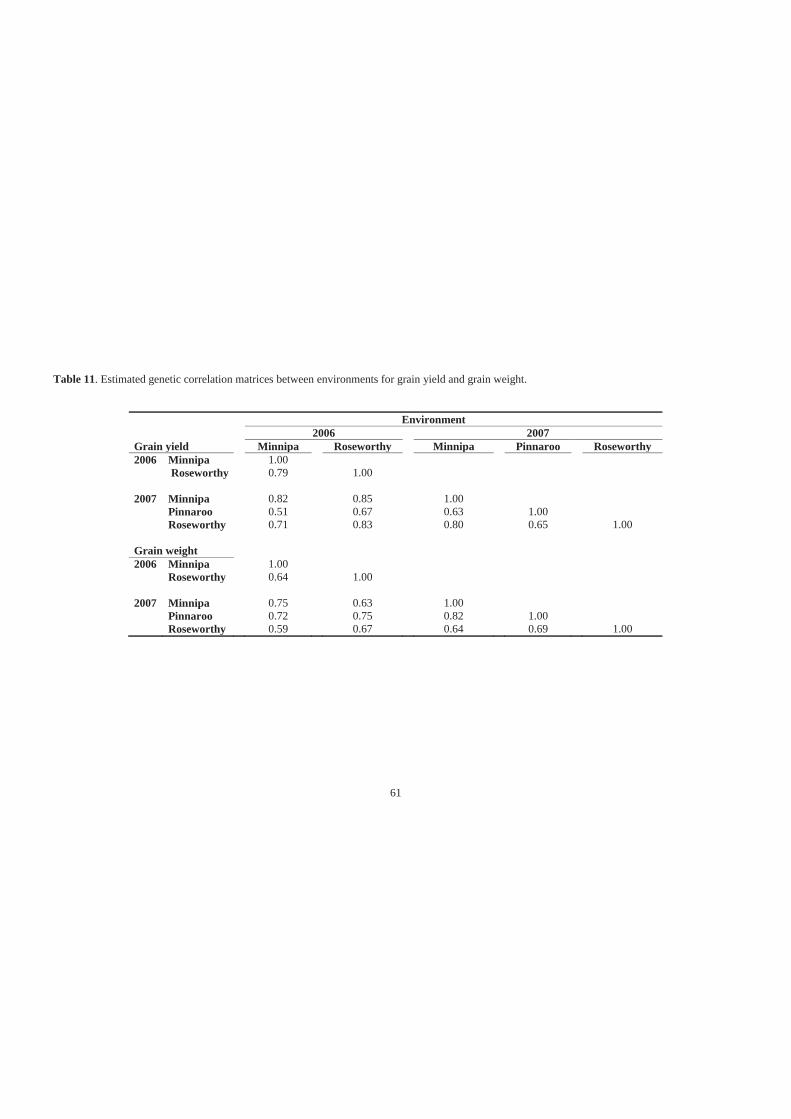
61
Table 11. Estimated genetic correlation matrices between environments for grain yield and grain weight.
Environment 2006 2007
Grain yield Minnipa Roseworthy Minnipa Pinnaroo Roseworthy 2006 Minnipa 1.00 Roseworthy 0.79 1.00 2007 Minnipa 0.82 0.85 1.00 Pinnaroo 0.51 0.67 0.63 1.00 Roseworthy 0.71 0.83 0.80 0.65 1.00 Grain weight 2006 Minnipa 1.00 Roseworthy 0.64 1.00 2007 Minnipa 0.75 0.63 1.00 Pinnaroo 0.72 0.75 0.82 1.00 Roseworthy 0.59 0.67 0.64 0.69 1.00
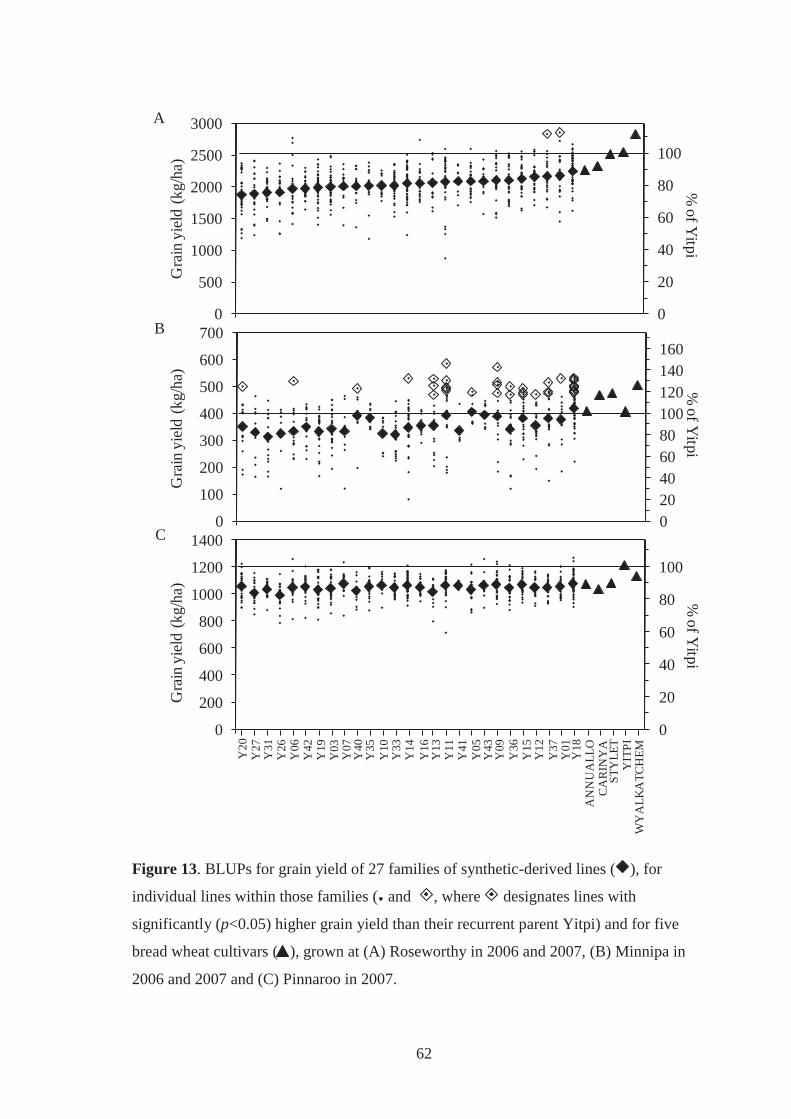
62
0
20
40
60
80
100
0
200
400
600
800
1000
1200
1400
% of Y
itpi
Gra
in y
ield
(kg/
ha)
020406080100120140160
0
100
200
300
400
500
600
700
% of Y
itpi
Gra
in y
ield
(kg/
ha)
0
20
40
60
80
100
0
500
1000
1500
2000
2500
3000%
of Yitpi
Gra
in y
ield
(kg/
ha)
Y20
Y27
Y31
Y26
Y06
Y42
Y19
Y03
Y07
Y40
Y10
Y33
Y14
Y16
Y13
Y11
Y41
Y35
Y05
Y43
Y09
Y36
Y15
Y12
Y37
Y01
Y18
AN
NU
ALL
OC
AR
INY
AST
YLE
TY
ITPI
WY
ALK
ATC
HEM
A
B
C
Figure 13. BLUPs for grain yield of 27 families of synthetic-derived lines ( ), for
individual lines within those families ( and , where designates lines with
significantly (p<0.05) higher grain yield than their recurrent parent Yitpi) and for five
bread wheat cultivars ( ), grown at (A) Roseworthy in 2006 and 2007, (B) Minnipa in
2006 and 2007 and (C) Pinnaroo in 2007.
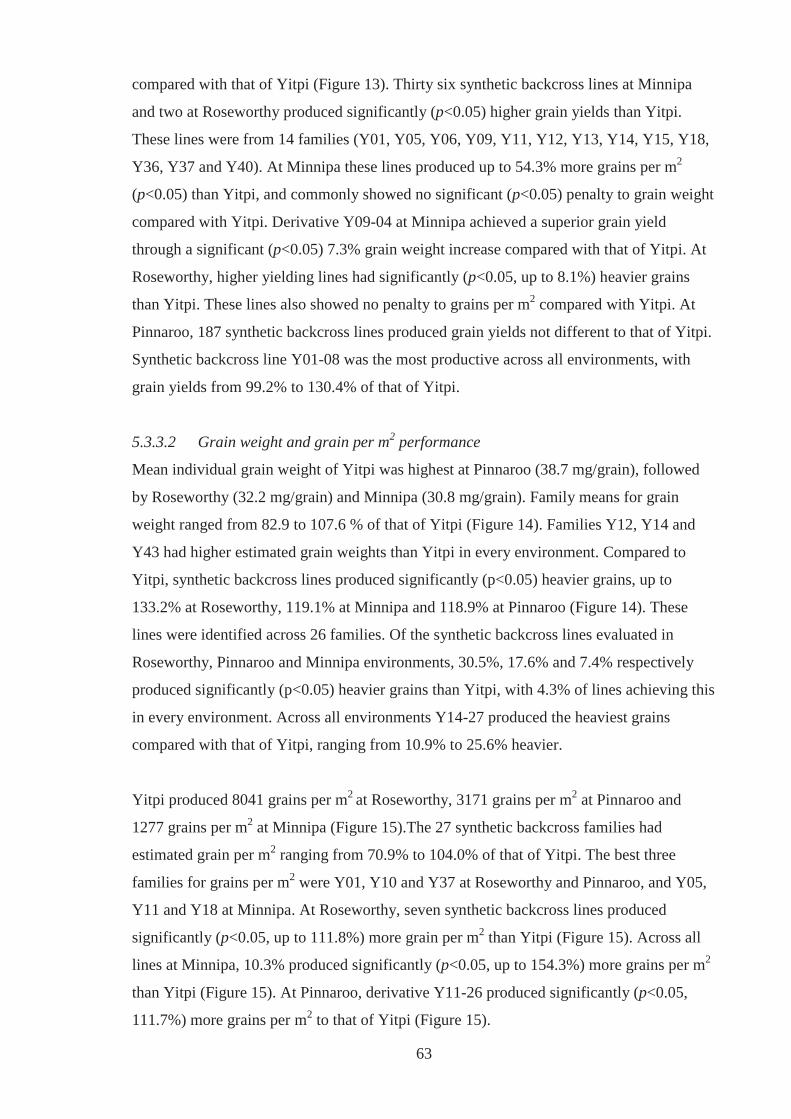
63
compared with that of Yitpi (Figure 13). Thirty six synthetic backcross lines at Minnipa
and two at Roseworthy produced significantly (p<0.05) higher grain yields than Yitpi.
These lines were from 14 families (Y01, Y05, Y06, Y09, Y11, Y12, Y13, Y14, Y15, Y18,
Y36, Y37 and Y40). At Minnipa these lines produced up to 54.3% more grains per m2
(p<0.05) than Yitpi, and commonly showed no significant (p<0.05) penalty to grain weight
compared with Yitpi. Derivative Y09-04 at Minnipa achieved a superior grain yield
through a significant (p<0.05) 7.3% grain weight increase compared with that of Yitpi. At
Roseworthy, higher yielding lines had significantly (p<0.05, up to 8.1%) heavier grains
than Yitpi. These lines also showed no penalty to grains per m2 compared with Yitpi. At
Pinnaroo, 187 synthetic backcross lines produced grain yields not different to that of Yitpi.
Synthetic backcross line Y01-08 was the most productive across all environments, with
grain yields from 99.2% to 130.4% of that of Yitpi.
5.3.3.2 Grain weight and grain per m2 performance
Mean individual grain weight of Yitpi was highest at Pinnaroo (38.7 mg/grain), followed
by Roseworthy (32.2 mg/grain) and Minnipa (30.8 mg/grain). Family means for grain
weight ranged from 82.9 to 107.6 % of that of Yitpi (Figure 14). Families Y12, Y14 and
Y43 had higher estimated grain weights than Yitpi in every environment. Compared to
Yitpi, synthetic backcross lines produced significantly (p<0.05) heavier grains, up to
133.2% at Roseworthy, 119.1% at Minnipa and 118.9% at Pinnaroo (Figure 14). These
lines were identified across 26 families. Of the synthetic backcross lines evaluated in
Roseworthy, Pinnaroo and Minnipa environments, 30.5%, 17.6% and 7.4% respectively
produced significantly (p<0.05) heavier grains than Yitpi, with 4.3% of lines achieving this
in every environment. Across all environments Y14-27 produced the heaviest grains
compared with that of Yitpi, ranging from 10.9% to 25.6% heavier.
Yitpi produced 8041 grains per m2 at Roseworthy, 3171 grains per m2 at Pinnaroo and
1277 grains per m2 at Minnipa (Figure 15).The 27 synthetic backcross families had
estimated grain per m2 ranging from 70.9% to 104.0% of that of Yitpi. The best three
families for grains per m2 were Y01, Y10 and Y37 at Roseworthy and Pinnaroo, and Y05,
Y11 and Y18 at Minnipa. At Roseworthy, seven synthetic backcross lines produced
significantly (p<0.05, up to 111.8%) more grain per m2 than Yitpi (Figure 15). Across all
lines at Minnipa, 10.3% produced significantly (p<0.05, up to 154.3%) more grains per m2
than Yitpi (Figure 15). At Pinnaroo, derivative Y11-26 produced significantly (p<0.05,
111.7%) more grains per m2 to that of Yitpi (Figure 15).
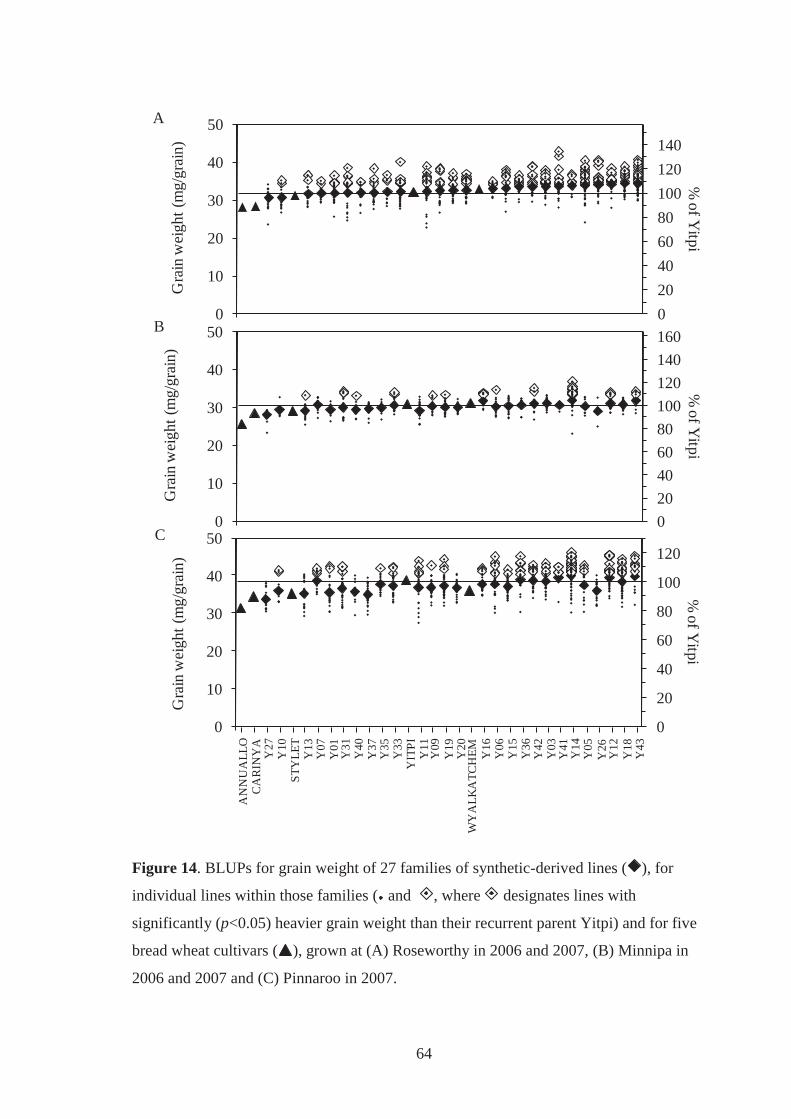
64
0
20
40
60
80
100
120
0
10
20
30
40
50
% of Y
itpi
Gra
in w
eigh
t (m
g/gr
ain)
020406080100120140160
0
10
20
30
40
50
% of Y
itpi
Gra
in w
eigh
t (m
g/gr
ain)
020406080100120140
0
10
20
30
40
50
% of Y
itpi
Gra
in w
eigh
t (m
g/gr
ain)
AN
NU
ALL
OC
AR
INY
AY
27Y
10ST
YLE
TY
13Y
07Y
01Y
31Y
40
Y35
Y33
YIT
PIY
11Y
09Y
19
Y37
Y20
WY
ALK
ATC
HEM Y
16Y
06Y
15Y
36Y
42Y
03
Y14
Y05
Y26
Y12
Y18
Y43
Y41
A
B
C
Figure 14. BLUPs for grain weight of 27 families of synthetic-derived lines ( ), for
individual lines within those families ( and , where designates lines with
significantly (p<0.05) heavier grain weight than their recurrent parent Yitpi) and for five
bread wheat cultivars ( ), grown at (A) Roseworthy in 2006 and 2007, (B) Minnipa in
2006 and 2007 and (C) Pinnaroo in 2007.
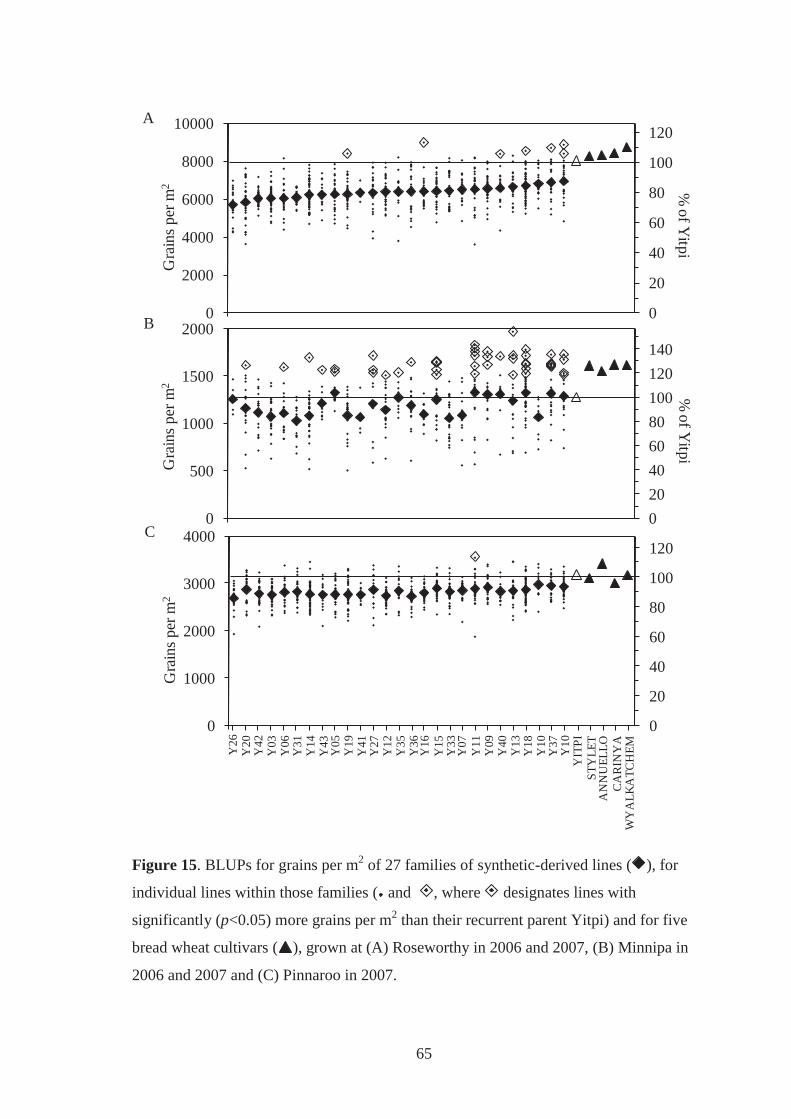
65
0
20
40
60
80
100
120
0
2000
4000
6000
8000
10000%
of Yitpi
Gra
ins p
er m
2
020406080100120140
0
500
1000
1500
2000
% of Y
itpi
Gra
ins p
er m
2
0
20
40
60
80
100
120
0
1000
2000
3000
4000
Gra
ins p
er m
2
Y26
Y20
Y42
Y03
Y06
Y31
Y14
Y43
Y05
Y19
Y27
Y12
Y35
Y36
Y16
Y15
Y41
Y33
Y07
Y11
Y09
Y40
Y13
Y18
Y10
Y10
YIT
PIST
YLE
TA
NN
UEL
LOC
AR
INY
AW
YA
LKA
TCH
EMY37
A
B
C
Figure 15. BLUPs for grains per m2 of 27 families of synthetic-derived lines ( ), for
individual lines within those families ( and , where designates lines with
significantly (p<0.05) more grains per m2 than their recurrent parent Yitpi) and for five
bread wheat cultivars ( ), grown at (A) Roseworthy in 2006 and 2007, (B) Minnipa in
2006 and 2007 and (C) Pinnaroo in 2007.
66
5.3.6 Relationships between grain weight, grains per m2 and grain yield
Across all synthetic backcross lines, grain weight exhibited statistically significant but very
weak negative associations with grains per m2 (Table 12). Negative associations between
these traits were also observed within most families (Appendix 4), but within one family
(Y31), a strong positive association was observed (r = 0.775) at Minnipa (Table 12).
Grains per m2 and grain yield were positively associated in all families in all environments,
which was commonly significant (p<0.01). Across environments, 82.7% of families had a
positive association between grain weight and grain yield (Appendix 4). The strongest
association was observed within family Y31 at Roseworthy (r = 0.901, p<0.01).
5.4 Discussion
This study investigated the potential of 27 primary synthetic wheats to increase grain yield
and its components (grain weight and grain per m2) of a southern Australian bread wheat
cultivar. The BC1 synthetic-derived families of lines were evaluated in five environments
in South Australia, all of which experienced serious to severe drought. Although grain
yields were low, heritability was generally high and primary synthetic wheat and synthetic
backcross lines suitable for use as a germplasm resource in further breeding programs for
southern Australia were identified.
Of the 27 primary synthetic wheats evaluated, 14 (S01, S05, S06, S09, S11, S12, S13, S14,
S15, S18, S36, S37 and S40) were donor parents to families with significantly (p<0.05)
higher grain yielding lines compared to Yitpi (recurrent bread wheat parent) in at least one
environment. This suggests that many, but not all primary synthetic wheats can improve
the grain yield of a bread wheat cultivar in selected environments. However, the
identification of superior grain yielding synthetic backcross lines here does support
previous findings in that high grain yielding synthetic derivatives can be created from only
one backcross to an elite bread wheat (Gororo et al. 2002; Dreccer et al. 2007; Ogbonnaya
et al. 2007). Hence minimal backcrossing, as opposed to advanced backcrossing (BC2 or
more) may be sufficient to improve the grain yield of bread wheat when using primary
synthetic wheat as a donor genetic source.
Synthetic backcross lines were commonly adapted to a particular environment rather than
showing broad adaptation. Derivative Y01-08 showed the highest grain yields across the
five environments (99.2% to 130.4% compared with Yitpi) and therefore could be suitable
as a parent to develop bread wheat cultivars with improved grain yield in southern
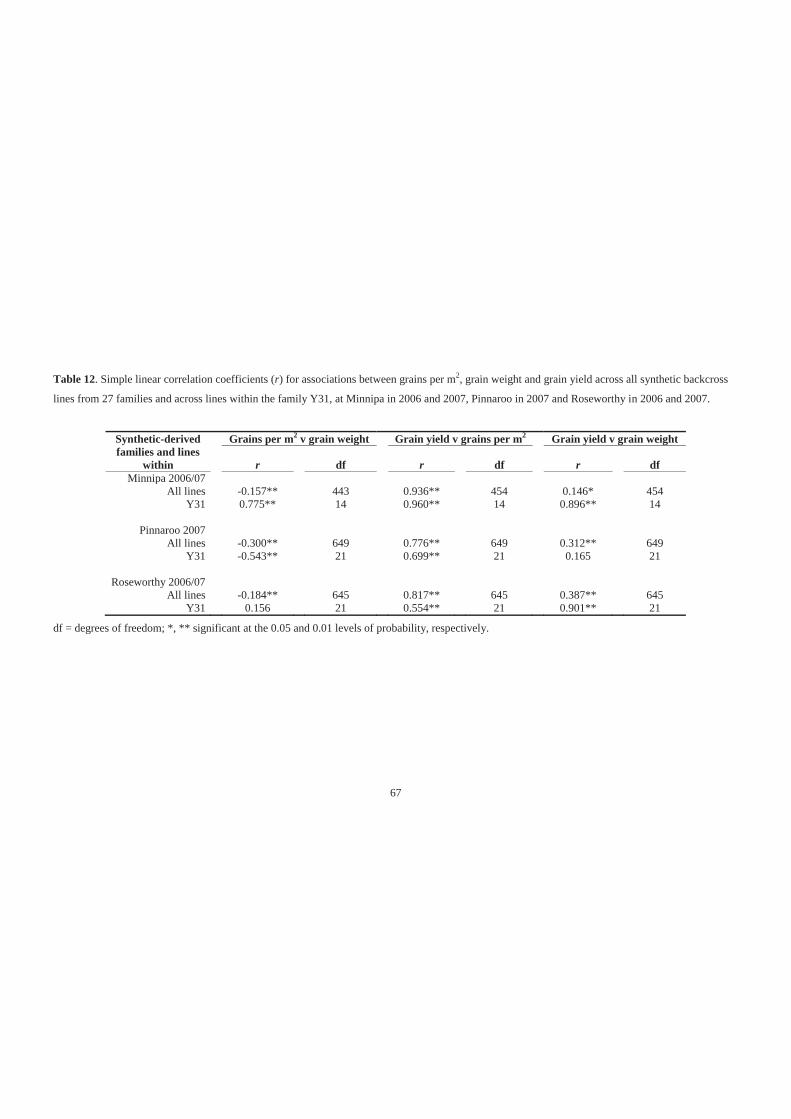
67
Table 12. Simple linear correlation coefficients (r) for associations between grains per m2, grain weight and grain yield across all synthetic backcross
lines from 27 families and across lines within the family Y31, at Minnipa in 2006 and 2007, Pinnaroo in 2007 and Roseworthy in 2006 and 2007.
Synthetic-derived families and lines
within
Grains per m2 v grain weight Grain yield v grains per m2 Grain yield v grain weight
r df r df r df Minnipa 2006/07
All lines -0.157** 443 0.936** 454 0.146* 454 Y31 0.775** 14 0.960** 14 0.896** 14
Pinnaroo 2007
All lines -0.300** 649 0.776** 649 0.312** 649 Y31 -0.543** 21 0.699** 21 0.165 21
Roseworthy 2006/07
All lines -0.184** 645 0.817** 645 0.387** 645 Y31 0.156 21 0.554** 21 0.901** 21
df = degrees of freedom; *, ** significant at the 0.05 and 0.01 levels of probability, respectively.
68
Australian environments. S18 seemed to be the most suitable primary synthetic wheat for
further crosses to other bread wheats as its associated family Y18 had the highest estimated
family grain yield in every environment. However, some of the highest grain yielding lines
in each environment were identified in lower grain yielding families. For example, family
Y06 had the 20th highest estimated family grain yield at Minnipa, 18th at Pinnaroo and 23rd
at Roseworthy, though one of its derivatives achieved a superior grain yield (127.8%) of
Yitpi at Minnipa, with grain yields of other Y06 derivatives approaching significance
(p<0.05) at both Pinnaroo (104.0%) and Roseworthy (108.6%). Therefore to identify
genotypes that improve grain yield across a broad range of environments still remains a
challenge.
Most synthetic backcross lines that displayed significantly (p<0.05) higher grain yields
than Yitpi (up to 43.8% higher) were identified in the lowest yielding environments
(Minnipa). At the highest yield environments (Roseworthy) few derivatives produced
superior (p<0.05) grain yields, up to 12.0% higher than Yitpi. The magnitude of these
increases in grain yield with respect to the recurrent bread wheat parent were similar to the
49% (Gororo et al. 2002) and 11% (Ogbonnaya et al. 2007) high grain yields achieved by
synthetic backcross lines at similar rain-fed environments in southern Australia. Further
evaluations of superior synthetic backcross lines from the current study, conducted by
Australian Grain Technologies Pty Ltd at Roseworthy in 2008 also showed grain yields up
to 111% compared with Yitpi (H. Kuchel, personal communication, 2008). These results
suggest that genetic gain for grain yield can be readily and consistently achieved by
synthetic backcross lines in southern Australian environments. However one negative trait,
poor threshability, was observed in each environment. In several instances during the
development and evaluation of the material, synthetic derivatives were removed because of
poor threshability. Poor threshability can be ‘bred out’ of a germplasm pool (H. Kuchel,
personal communication, 2008), but this trait would inhibit the rapid development of
commercial cultivars from this set of synthetic material.
Evaluation in the future of larger families of lines and the use of different bread wheat
parents may produce further increases to grain yield. As discussed by Gororo et al. (2002),
performing advanced selection within segregating lines, such as the superior BC1F4-
derived lines of the current study, may also identify additional improvement to grain yield.
These lines would have been a mixture of near homozygous genotypes at the time of
evaluation (F7), with their performance representing a mean of these genotypes (Allard
69
1960). Therefore, evaluating synthetic backcross lines selected from large bulks at more
advanced generations could be a suitable strategy to identify the highest grain yielding
synthetic backcross lines.
Primary synthetic wheats S12, S14, S42 and S43 were found to be the most valuable
genetic resources for improving grain weight, with S01, S10 and S37 commonly improving
grains per m2. Interestingly, the grain yield component responsible for significant (p<0.05)
grain yield improvements were similar between synthetic backcross lines from different
families. Under the lowest yielding environments (Minnipa), improvements to grain per m2
(up to 154.3% of that of Yitpi) were commonly responsible for superior grain yields,
whereas under the highest yielding environments (Roseworthy), improvements to grain
weight (up to 108.1% of that of Yitpi) were responsible. Gororo et al. (2002) also reported
synthetic backcross lines that achieved superior grain yields in low yield conditions in
southern Australia through significant (p<0.05) improvements to grain per m2. Crop-
simulation models for improving grain yield of bread wheat cultivars in Australian have
suggested that in low yield environments selecting for enhanced grain number per unit area
may achieve such improvements (Asseng et al. 2002). However, the magnitude of these
improvements were predicted to be small due to limiting environmental factors.
Finally, this study assessed the potential of 27 primary synthetic wheats to improve the
relationship between grain weight and grains per m2 in bread wheat. This relationship was
commonly found to be negative and very weak within the 27 synthetic-derived families of
lines; hence there was little influence of the different primary synthetic parents on this
relationship. As reviewed by Araus et al. (2008), the relationship between grain weight and
grains per m2 in bread wheat is commonly found to be negative. The results from within
families in the present study were consistent with this. In contrast family Y31 did show a
moderate positive association for this relationship under the lowest yielding conditions.
This family was also the only one to have a strong association between grain weight and
grain yield in the lowest and highest yielding environments. However, Y31 was one of the
lowest yielding families across the environments and did not contain any lines with
significantly (p<0.05) higher grain yields than Yitpi. Therefore, if lines within this family
do represent an uncoupling of grain weight and grains per m2, as reported by Gaju et al.
(2009) to be a means of increasing grain yield potential, this situation does not provide a
grain yield advantage under the environments evaluated. Del Blanco et al. (2001)
suggested that indirect effects can affect the correlation strength between grain yield
70
components, which may be the case with family Y31. The different primary synthetic
parents assessed here did affect the magnitude of these grain yield components in the form
of grain yield differences between families, as discussed earlier.
5.5 Conclusion
This study identified synthetic backcross lines with superior grain yield compared with
their recurrent bread wheat parent in drought conditions, particular in low yield moisture
limiting environments. Here, improved grains per m2 were commonly observed without
penalty to grain weight. Therefore primary synthetic wheat can be a useful breeding
resource to improve the grain yield of bread wheat in such conditions. In the highest yield
environments evaluated, equal and superior grain yields were identified compared to the
recurrent bread wheat parent. Improved grain weight was responsible for such
achievements without penalty to grain per m2. For high yielding environments primary
synthetic wheats could be less useful to improve grain yield, but grain quality (grain
weight) could be enhanced.
71
Chapter 6
Introgression of genetic material from primary synthetic wheat into
an elite bread wheat background
6.1 Introduction
Primary synthetic wheats (genome AABBDD) can act as a biological bridge for the
introgression of genetic material from Triticum turgidum L. (genome AABB) and Aegilops
tauschii Coss. (genome DD) into bread wheat (Triticum aestivum L., genome AABBDD)
(van Ginkel and Ogbonnaya 2007). Synthetic-derived populations, commonly created by
backcrossing primary synthetic wheat (donor parent) to a bread wheat cultivar (recurrent
parent), have been used to detect quantitative trait loci (QTL) for agronomic traits. QTL
have been mapped at which synthetic-derived alleles had positive effects on preharvest
sprouting tolerance (Imtiaz et al. 2008), baking volume (Kunert et al. 2007), length of
grain filling period (Börner et al. 2002), and grain yield and its components (Börner et al.
2002; Huang et al. 2004; Narasimhamoorthy et al. 2006; Röder et al. 2008).
In synthetic-derived populations QTL for grain weight have been detected on
chromosomes 1B, 1D, 2A, 2D, 3A, 3B, 3D, 4B, 5A, 6A, 7A and 7D, where the positive
effect was due to the primary synthetic allele (Börner et al. 2002; Huang et al. 2004). Fine
mapping on chromosome 7D has detected a locus where a primary synthetic allele has
significant positive effects on grain weight, which could be selected for using a marker
assisted selection strategy (Frisch and Melchinger 2001; Röder et al. 2008). However,
synthetic-derived alleles having positive effects on grain weight often have negative effects
on grain number (Börner et al. 2002; Huang et al. 2004). Therefore it would be beneficial
to identify primary synthetic alleles that have a positive association for the major grain
yield components, grain weight and grains per m2.
In bread wheat, alleles that are positively associated with the major grain yield components
can be enriched in selected lines with high grain yield performance (McIntyre et al. 2010).
The retention of primary synthetic alleles, with or without positive association for the
major grain yield components, has not been investigated in selected synthetic backcross
lines with high grain weight and/or high grain yield performance. Understanding this
would be important for improving the genetic diversity of bread wheat whilst performing
breeding activities.
72
The work reported here investigated two synthetic-derived families of lines developed by
independently backcrossing two primary synthetic wheats with a common bread wheat
cultivar. Using DArT marker genotypes of these lines, this study aimed to identify:
1. introgressed synthetic alleles and compare patterns of introgression between the
families,
2. genomic regions in which primary synthetic or bread wheat alleles have a positive
effect on grain weight and/or grains per m2, and
6.2 Materials and methods
6.2.1 Plant material
Two families of BC1F4-derived synthetic lines, Y14 and Y18 were used in this study,
together with their recorded donor primary synthetic parents S14 (Croc1/Ae. tauschii
WX436) and S18 (Doy1/Ae. tauschii WX517) respectively, and recurrent bread wheat
parent Yitpi. These plant materials are fully described in Chapter 3. The 43 lines of Y14,
and the 46 lines of Y18 were examined (at the F6 and F7 generations) in field experiments
across five environments for grain yield and its components, grain weight and grains per
m2 (Chapter 5). These field experiments showed lines within Y14 and Y18 varied for their
grain weight and grain yield performance, with Y14 having a high family grain weight
BLUP (best linear unbiased predictor) and Y18 having a high family grain yield BLUP
relative to 25 other synthetic-derived families of lines assessed in the same field
experiments.
6.2.2 Marker application and detection of polymorphism
DNA was extracted from all genotypes and prepared for DArT marker application
following the methods given in Chapter 4. DArT marker application was performed by
Triticarte Pty Ltd (Australian Capital Territory, Australia). The hybridisation of DArT
markers was scored as either present (1), absent (0) or unreliable (X) for each genotype.
Markers with low quality scores (Q-value <77) were excluded from analyses (E. Huttner,
personal communication, 2008). A DArT marker was considered polymorphic in a
synthetic-derived family when the dominant ‘1’ allele was observed in only one of its
parents, and when both the ‘1’ and ‘0’ alleles were observed across lines of the respective
family at a frequency where the rarer allele was at least 0.05. The informativeness of each
DArT marker locus screened was quantified using polymorphic information content values
(Botstein et al. 1980), which were calculated as per the methods of De Riek et al. (2001)
for dominant markers.
73
6.2.3 Estimation of marker loci positioning and linkage
Genomic positioning and linkage information of polymorphic DArT marker loci in the
families Y14 and Y18 were estimated using 17 reference genetic maps. The steps below
were followed.
1. The genetically diverse Gladius/Drysdale mapping population (provided by Dr
Ken Chalmers, University of Adelaide) provided linkage information for DArT
marker loci that were also found to be polymorphic in Y14 and Y18.
2. Groups of linked markers from step 1 were assigned to chromosomes using
information from the genetic maps listed below.
� Triticarte version 1.2 set of nine integrated genetic maps (Triticarte Pty Ltd
2008),
� Kukri/Excalibur genetic map (provided by Dr Ken Chalmers, University of
Adelaide),
� Ajana/WAWHT2074, P92201D5-2/P91193D1-10, Cadoux/Reeves and
EGA Blanco/Millewa genetic maps (Francki et al. 2009),
� Colosseo/Lloyd genetic map (tetraploid wheat) (Mantovani et al. 2008), and
� Langdon/Wild emmer wheat (G18-16) genetic map (tetraploid wheat)
(Peleg et al. 2008).
3. Genetic distances between markers within linkage groups were inferred from
the Gladius/Drysdale mapping population.
4. Orientation and order of linkage groups within chromosomes was determined
using the reference genetic maps listed above.
Linkage between neighbouring markers separated by an interval greater than 20cM was
broken. Additional linkage groups and single markers were incorporated into the genetic
maps of Y14 and Y18 by following steps 1 to 4, using each reference genetic map in step
1, with genetic distance inferred from the reference maps in step 3.
MapChart (version 2.1) (http://www.biometris.wur.nl/UK/Software/MapChart.html) (Plant
Research International 2002; Voorrips 2002) was used to diagrammatically display the
positioning and linkage of polymorphic markers of Y14 and Y18. Some assayed DArT
marker loci not given chromosomal assignment from the above positioning and linkage
determination process were assigned to a chromosome through genotype matching. This
involved comparing the genotypes of assigned markers to unassigned markers using the
74
‘distribute’ function in Map Manager QTX software (version 0.30) (Meer et al. 2004) and
manual checking.
6.2.4 Marker data analysis
6.2.4.1 Assumptions and expectations of synthetic introgression
The lengths of chromosomal segments of synthetic derived introgression were estimated
using the following assumptions, which were based on methods described by Hospital
(2001):
1. that each chromosomal segment flanked by two markers displaying a non-Yitpi (or
synthetic donor) genotype were of synthetic origin,
2. that recombination occurred half the distance between a marker displaying non-
Yitpi genotype and a flanking marker displaying Yitpi genotype, and
3. that the segment from a marker displaying a non-Yitpi genotype to a recombination
point is of synthetic origin.
Hence, a synthetic introgression segment is the region between two recombination events
when marker(s) of a non-Yitpi genotype are located in that intervening region.
Chi-square tests were performed for each DArT marker that was polymorphic within Y14
and/or Y18 to assess the fit of observed synthetic introgression to the expected ratios for
BC1 germplasm. The expected ratio of Yitpi (recurrent parent) alleles to the primary
synthetic (donor parent) alleles was 3:1. One degree of freedom (df) was used for each chi-
square test (df = n - 1, where n =2 is the number of genotypic classes). Deviations of less
than a 0.05 significance level from the expected were considered significant. MapChart
software was used to highlight significant deviations from the expected at marker loci
mapped in Y14 and Y18.
6.2.4.2 Association of parental alleles with grain weight and grains per m2 data
Association of parental alleles at DArT marker loci assayed in Y14 and Y18, with grain
weight and grains per m2 data from five environments, was tested by single marker
regression using Map Manager QTX software (Meer et al. 2004). Loci were identified
where the Yitpi or primary synthetic allele was significantly (p<0.05) associated with
increased grain weight and grains per m2 in one or more environments. For each of these
loci the percentage amount of trait (grain weight or grains per m2) phenotypic variance
explained was calculated using Map Manager QTX software, which was the difference
between the total trait variance and the residual variance expressed as a percent of the total
75
variance. MapChart software was used to highlight mapped marker loci of Y14 and Y18
that identified such beneficial synthetic and Yitpi alleles.
Retention of beneficial synthetic and Yitpi alleles for increased grain weight and grains per
m2 was observed in three selected groups of lines within Y14 and Y18. The selection
criteria for these groups were high grain weight (significantly (p<0.05) heavier grains than
Yitpi), high grain yield (not significantly different (p>0.05) grain yield of that of Yitpi),
and both high grain weight and high grain yield.
6.3 Results
6.3.1 Marker polymorphism
Polymorphism between parents of Y14 (S14 and Yitpi) and Y18 (S18 and Yitpi) were
identified by 1048 and 993 DArT markers respectively. Markers within these sets were of
high quality (Q-value >77), with their mean call rate being 96.6 (Y14) and 96.5 (Y18). The
polymorphism information content at these marker loci ranged from 0.1 to 0.5 (highest
possible value for a biallelic marker) in both Y14 (Figure 16a) and Y18 (Figure 16b).
Mean polymorphism information content values of the Y14 and Y18 marker sets were 0.36
and 0.37 respectively.
6.3.2 Genetic linkage of markers
The Gladius/Drysdale mapping population provided linkage information for 261 and 244
of the DArT marker loci found to be polymorphic in Y14 and Y18 respectively. Genetic
linkage information for an additional 179 (Y14) and 165 (Y18) marker loci were sourced
from the16 other reference genetic maps. A final 440 and 409 polymorphic DArT marker
loci provided the chromosome information for the A, B and D genomes of Y14 and Y18
respectively (Table 13). In each family, fewer than 10 polymorphic marker loci were
assigned to each of chromosomes 5A, 2D, 3D, 4D, 5D and 6D. A mean of 21 and 20
marker loci represented each chromosome of the Y14 (Figure 17) and Y18 (Figure 18)
genetic maps respectively.
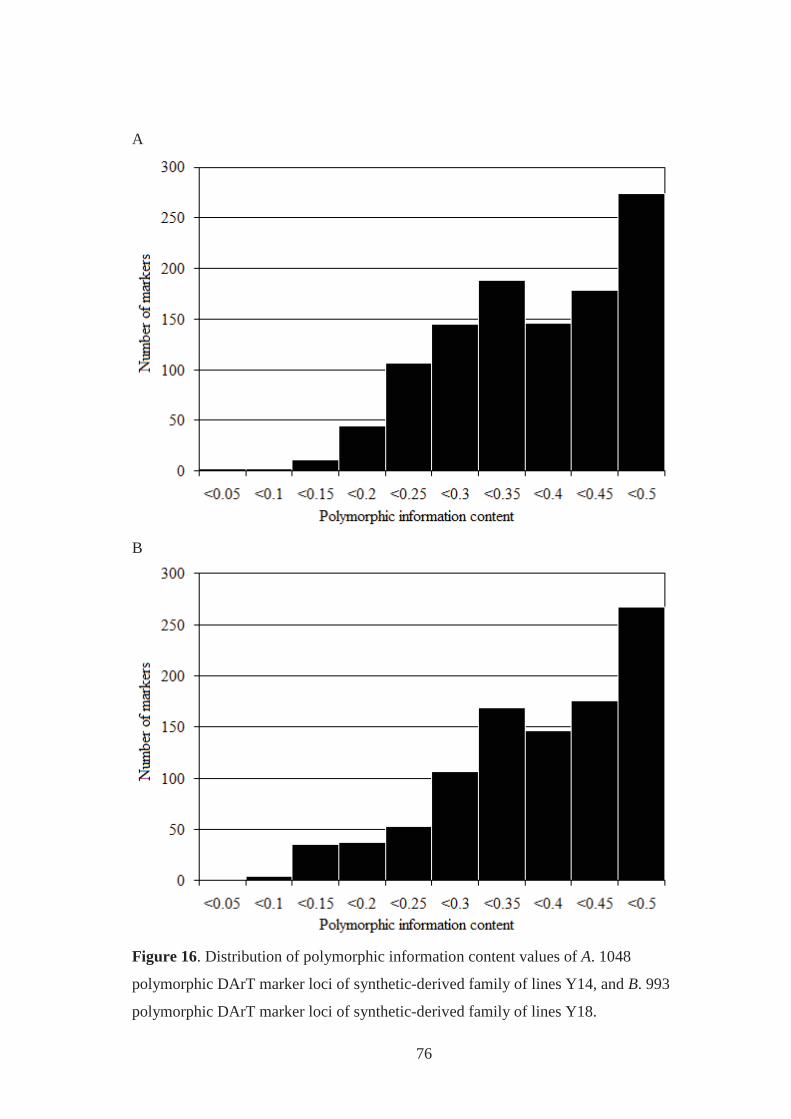
76
A
B
Figure 16. Distribution of polymorphic information content values of A. 1048
polymorphic DArT marker loci of synthetic-derived family of lines Y14, and B. 993
polymorphic DArT marker loci of synthetic-derived family of lines Y18.
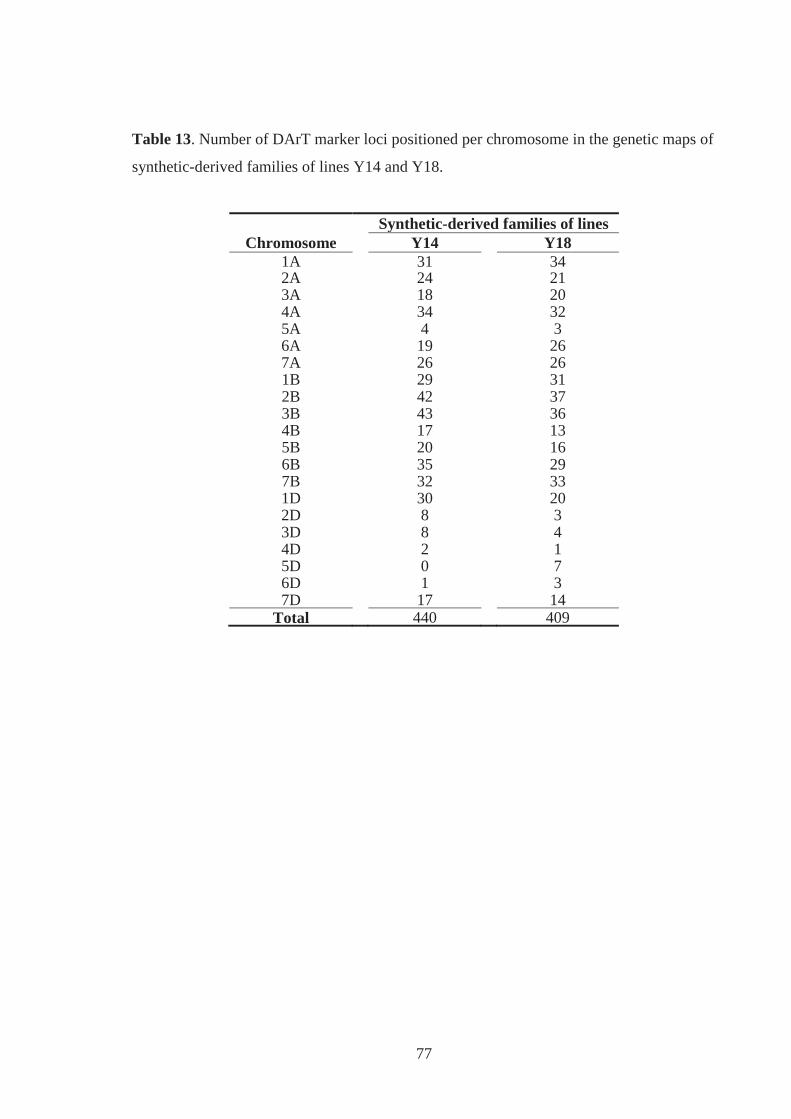
77
Table 13. Number of DArT marker loci positioned per chromosome in the genetic maps of
synthetic-derived families of lines Y14 and Y18.
Synthetic-derived families of lines Chromosome Y14 Y18
1A 31 34 2A 24 21 3A 18 20 4A 34 32 5A 4 3 6A 19 26 7A 26 26 1B 29 31 2B 42 37 3B 43 36 4B 17 13 5B 20 16 6B 35 29 7B 32 33 1D 30 20 2D 8 3 3D 8 4 4D 2 1 5D 0 7 6D 1 3 7D 17 14
Total 440 409
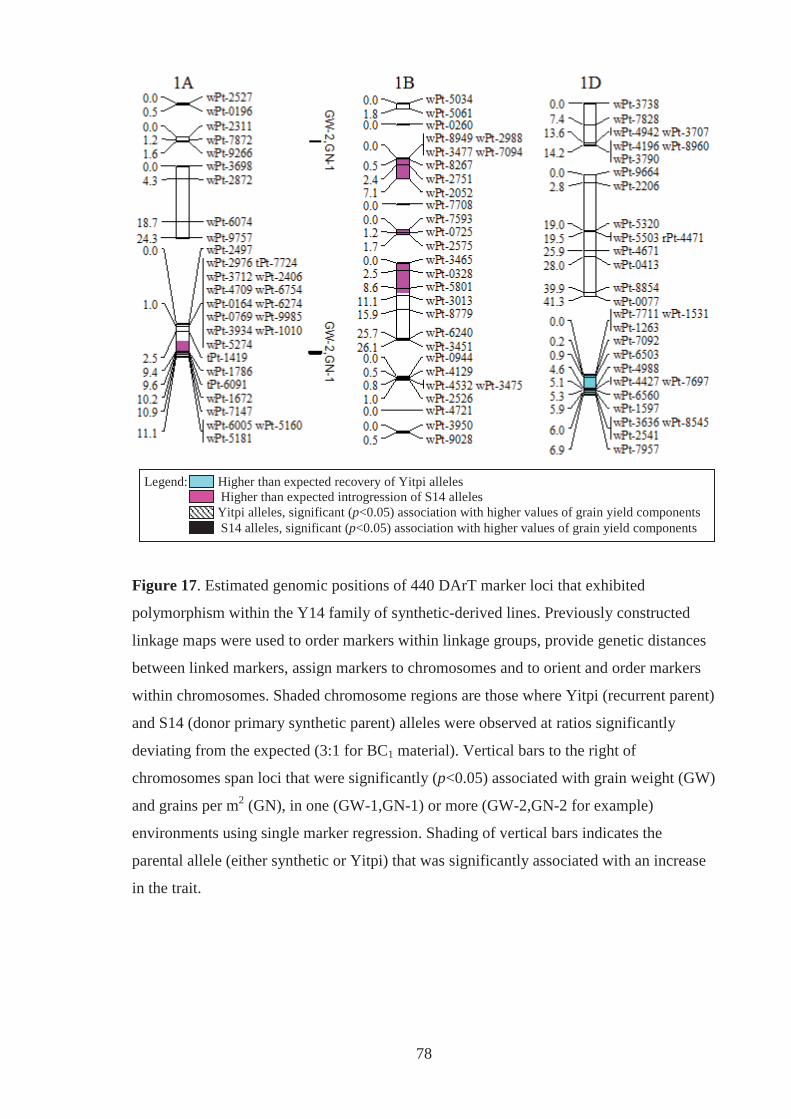
78
Figure 17. Estimated genomic positions of 440 DArT marker loci that exhibited
polymorphism within the Y14 family of synthetic-derived lines. Previously constructed
linkage maps were used to order markers within linkage groups, provide genetic distances
between linked markers, assign markers to chromosomes and to orient and order markers
within chromosomes. Shaded chromosome regions are those where Yitpi (recurrent parent)
and S14 (donor primary synthetic parent) alleles were observed at ratios significantly
deviating from the expected (3:1 for BC1 material). Vertical bars to the right of
chromosomes span loci that were significantly (p<0.05) associated with grain weight (GW)
and grains per m2 (GN), in one (GW-1,GN-1) or more (GW-2,GN-2 for example)
environments using single marker regression. Shading of vertical bars indicates the
parental allele (either synthetic or Yitpi) that was significantly associated with an increase
in the trait.
Legend: Higher than expected recovery of Yitpi alleles Higher than expected introgression of S14 alleles Yitpi alleles, significant (p<0.05) association with higher values of grain yield components S14 alleles, significant (p<0.05) association with higher values of grain yield components
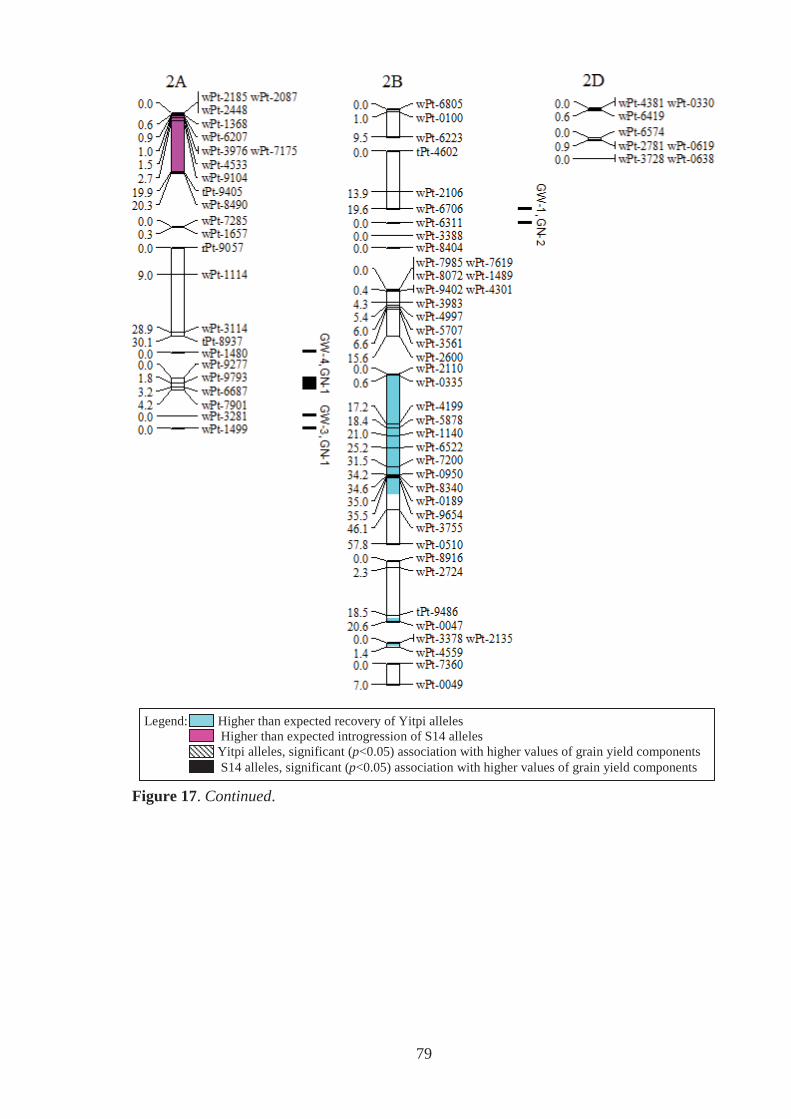
79
Figure 17. Continued.
Legend: Higher than expected recovery of Yitpi alleles Higher than expected introgression of S14 alleles Yitpi alleles, significant (p<0.05) association with higher values of grain yield components S14 alleles, significant (p<0.05) association with higher values of grain yield components
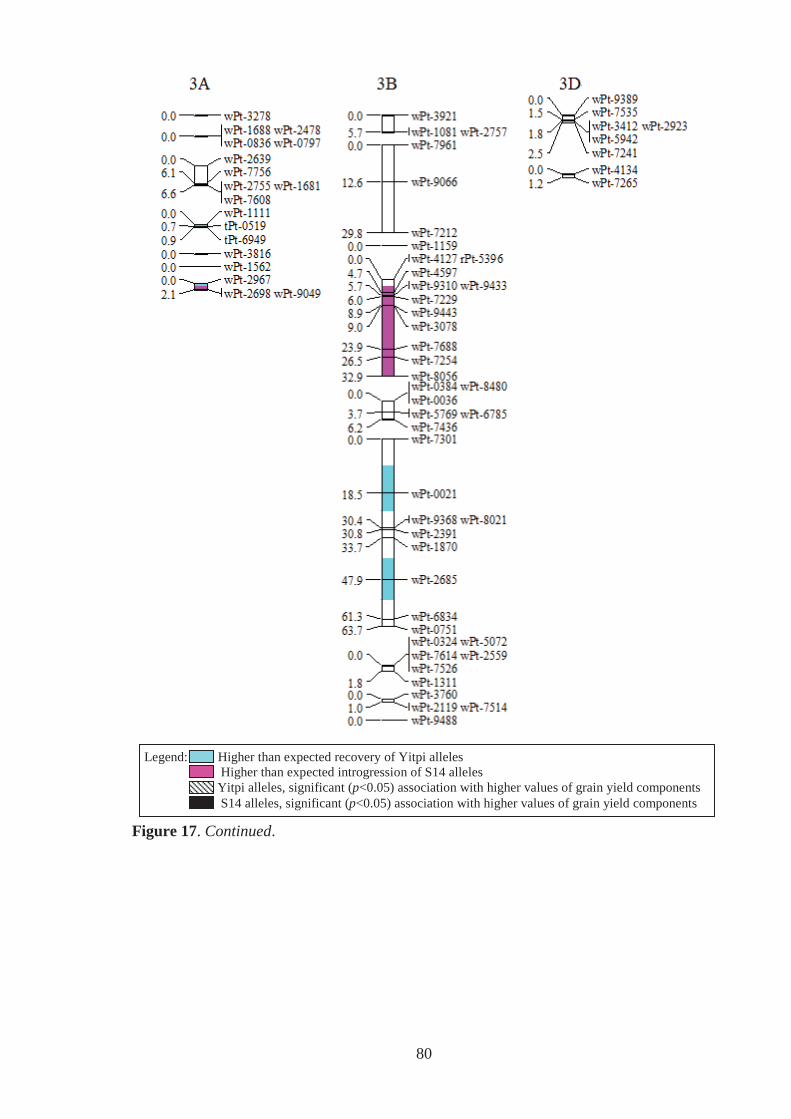
80
Figure 17. Continued.
Legend: Higher than expected recovery of Yitpi alleles Higher than expected introgression of S14 alleles Yitpi alleles, significant (p<0.05) association with higher values of grain yield components S14 alleles, significant (p<0.05) association with higher values of grain yield components
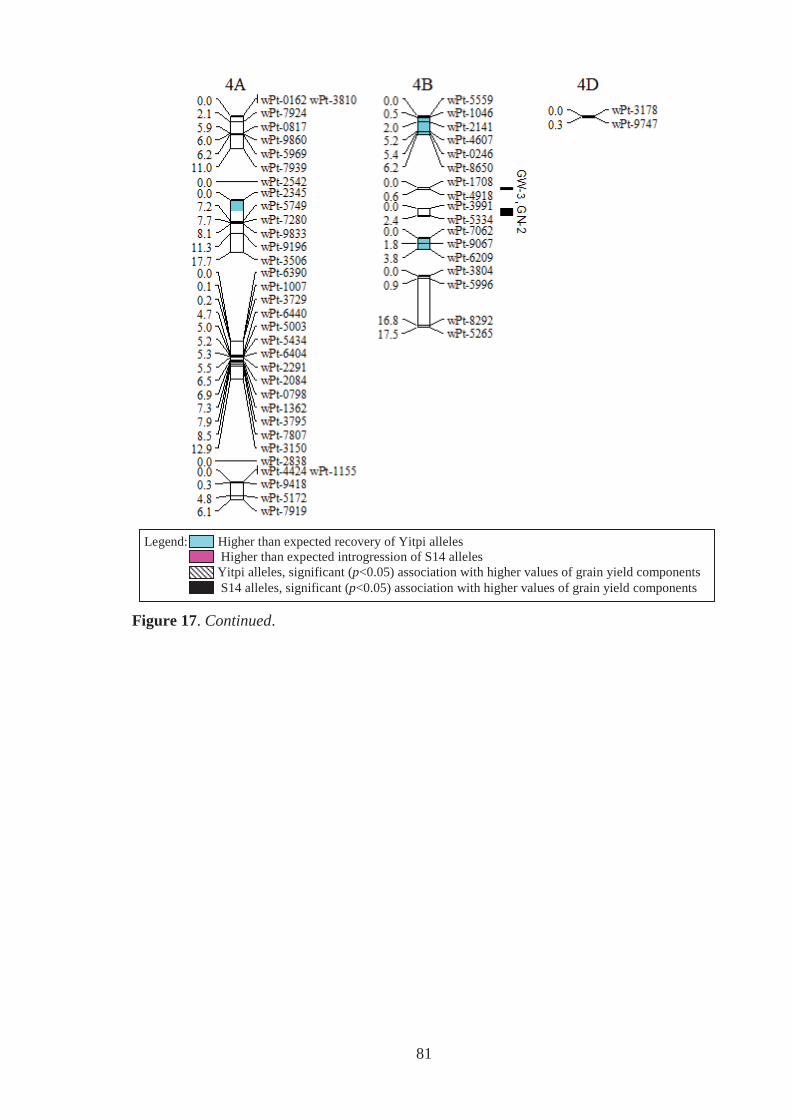
81
Figure 17. Continued.
Legend: Higher than expected recovery of Yitpi alleles Higher than expected introgression of S14 alleles Yitpi alleles, significant (p<0.05) association with higher values of grain yield components S14 alleles, significant (p<0.05) association with higher values of grain yield components
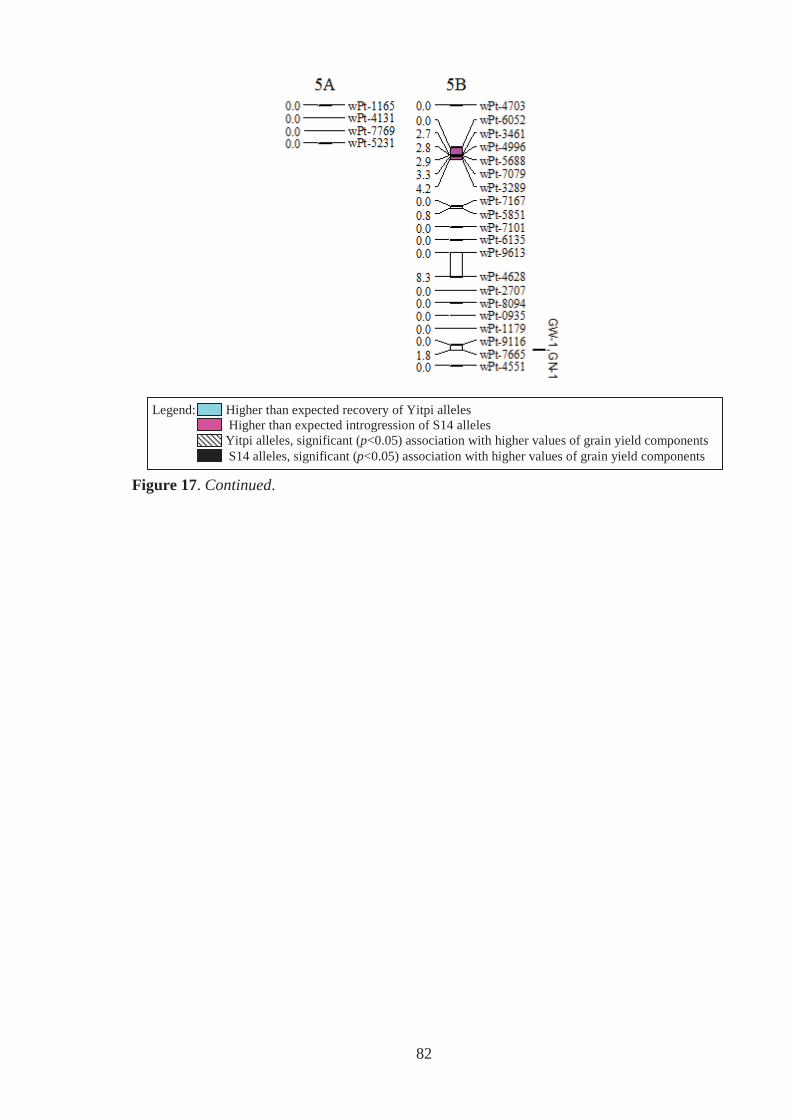
82
Figure 17. Continued.
Legend: Higher than expected recovery of Yitpi alleles Higher than expected introgression of S14 alleles Yitpi alleles, significant (p<0.05) association with higher values of grain yield components S14 alleles, significant (p<0.05) association with higher values of grain yield components
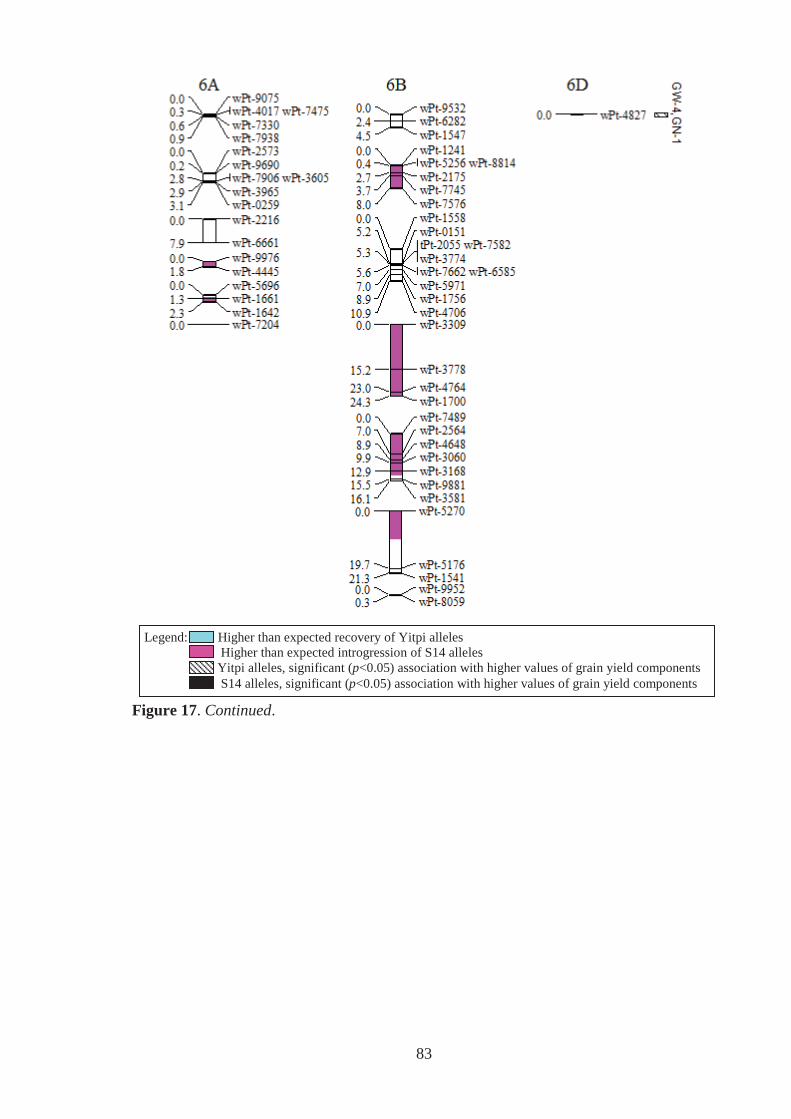
83
Figure 17. Continued.
Legend: Higher than expected recovery of Yitpi alleles Higher than expected introgression of S14 alleles Yitpi alleles, significant (p<0.05) association with higher values of grain yield components S14 alleles, significant (p<0.05) association with higher values of grain yield components
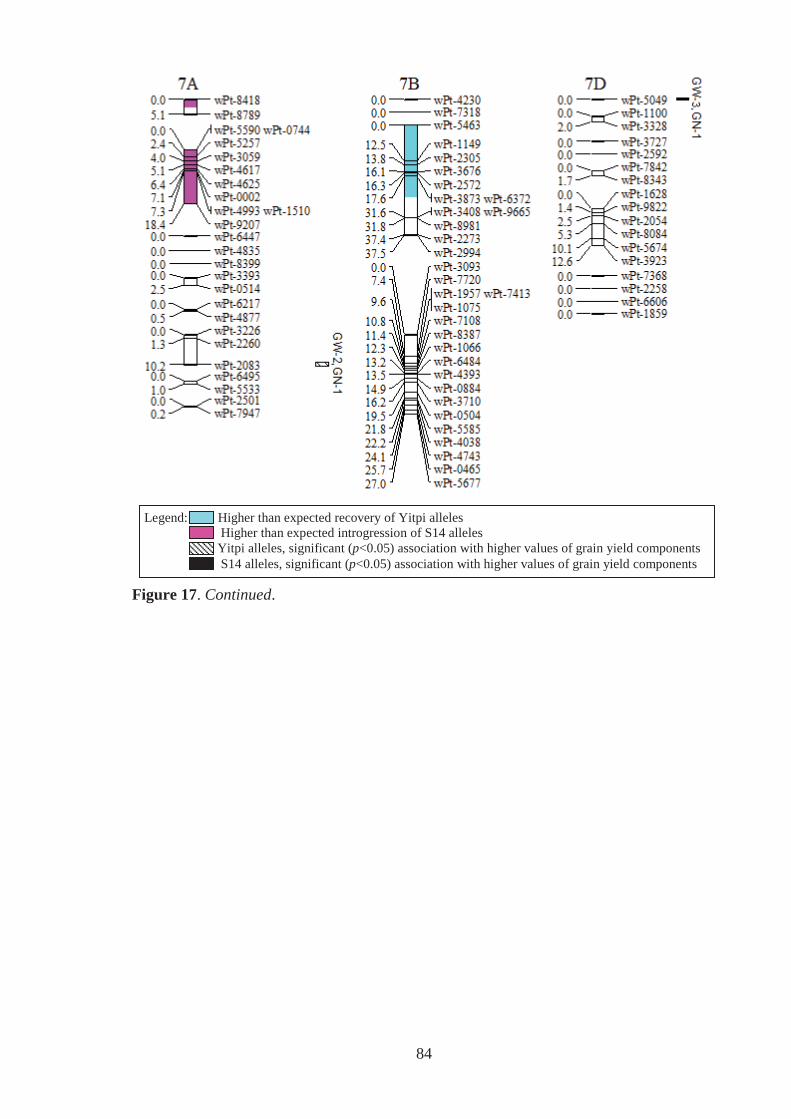
84
Figure 17. Continued.
Legend: Higher than expected recovery of Yitpi alleles Higher than expected introgression of S14 alleles Yitpi alleles, significant (p<0.05) association with higher values of grain yield components S14 alleles, significant (p<0.05) association with higher values of grain yield components
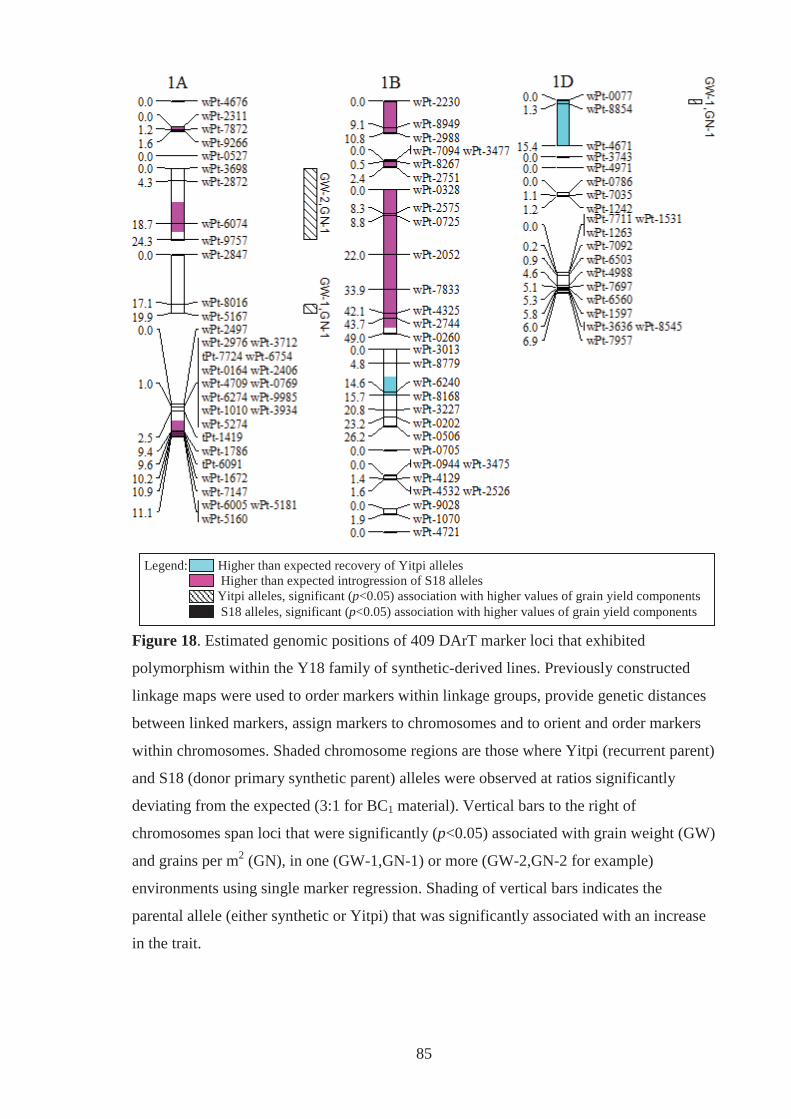
85
Figure 18. Estimated genomic positions of 409 DArT marker loci that exhibited
polymorphism within the Y18 family of synthetic-derived lines. Previously constructed
linkage maps were used to order markers within linkage groups, provide genetic distances
between linked markers, assign markers to chromosomes and to orient and order markers
within chromosomes. Shaded chromosome regions are those where Yitpi (recurrent parent)
and S18 (donor primary synthetic parent) alleles were observed at ratios significantly
deviating from the expected (3:1 for BC1 material). Vertical bars to the right of
chromosomes span loci that were significantly (p<0.05) associated with grain weight (GW)
and grains per m2 (GN), in one (GW-1,GN-1) or more (GW-2,GN-2 for example)
environments using single marker regression. Shading of vertical bars indicates the
parental allele (either synthetic or Yitpi) that was significantly associated with an increase
in the trait.
Legend: Higher than expected recovery of Yitpi alleles Higher than expected introgression of S18 alleles Yitpi alleles, significant (p<0.05) association with higher values of grain yield components S18 alleles, significant (p<0.05) association with higher values of grain yield components
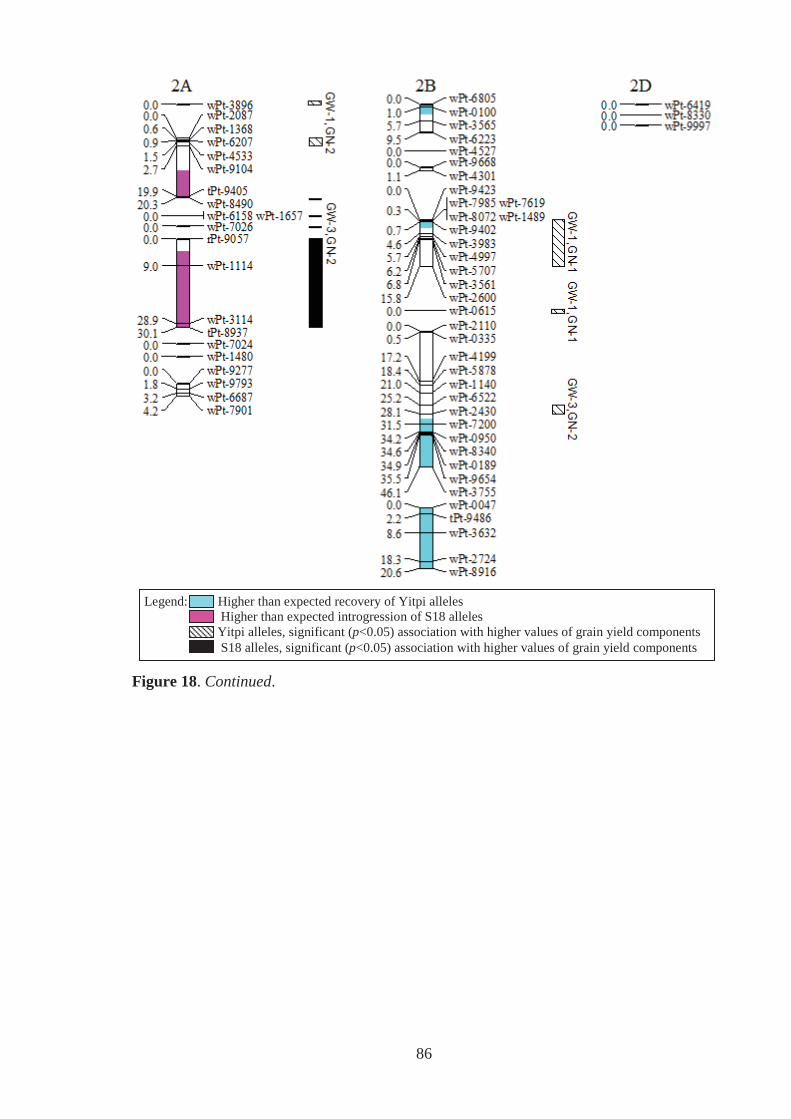
86
Figure 18. Continued.
Legend: Higher than expected recovery of Yitpi alleles Higher than expected introgression of S18 alleles Yitpi alleles, significant (p<0.05) association with higher values of grain yield components S18 alleles, significant (p<0.05) association with higher values of grain yield components
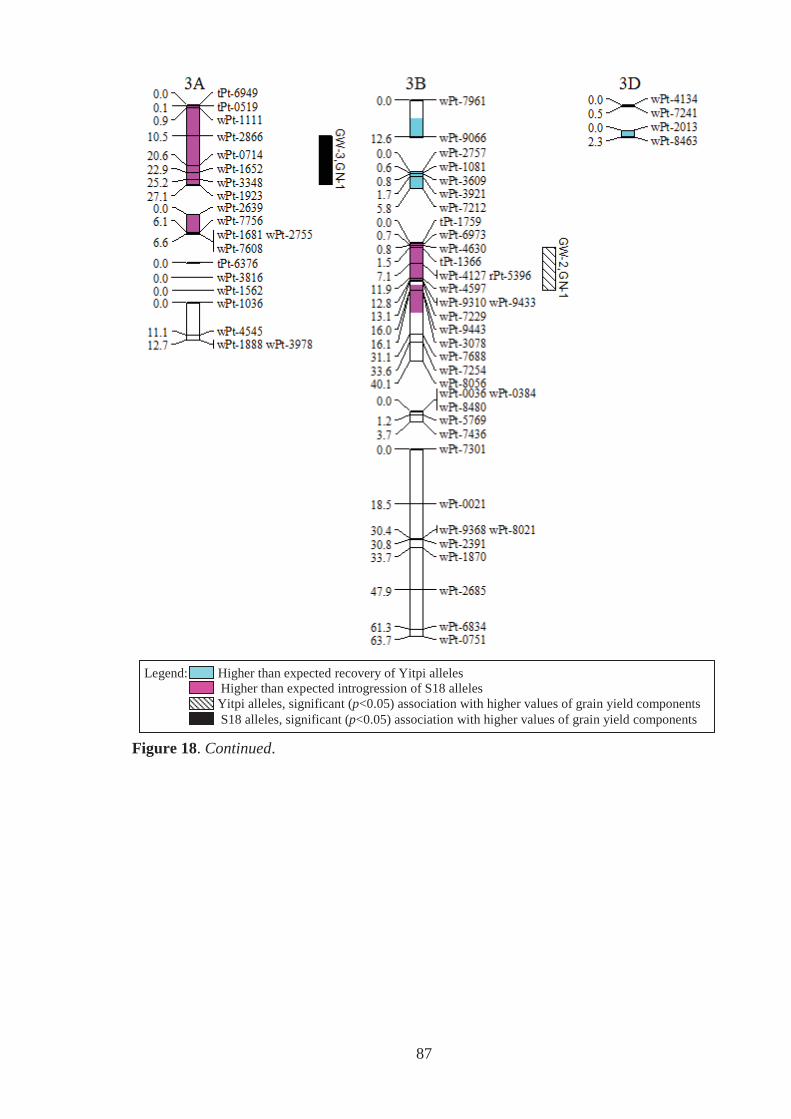
87
Figure 18. Continued.
Legend: Higher than expected recovery of Yitpi alleles Higher than expected introgression of S18 alleles Yitpi alleles, significant (p<0.05) association with higher values of grain yield components S18 alleles, significant (p<0.05) association with higher values of grain yield components
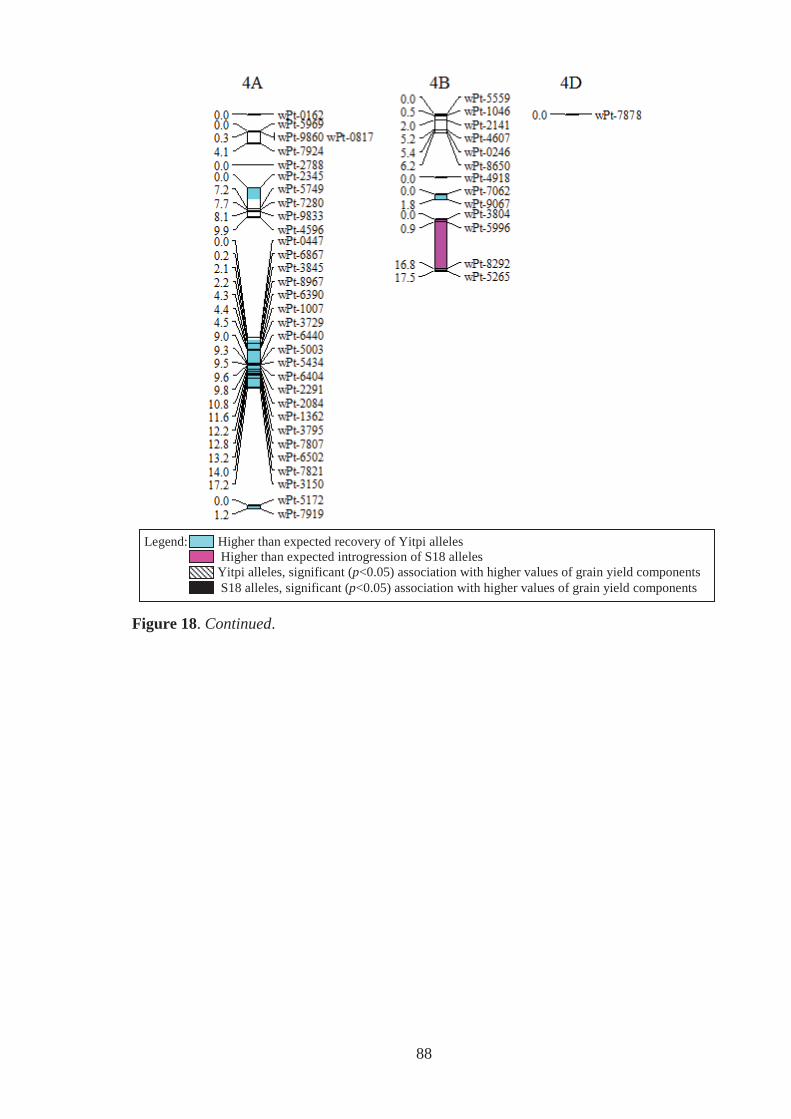
88
Figure 18. Continued.
Legend: Higher than expected recovery of Yitpi alleles Higher than expected introgression of S18 alleles Yitpi alleles, significant (p<0.05) association with higher values of grain yield components S18 alleles, significant (p<0.05) association with higher values of grain yield components
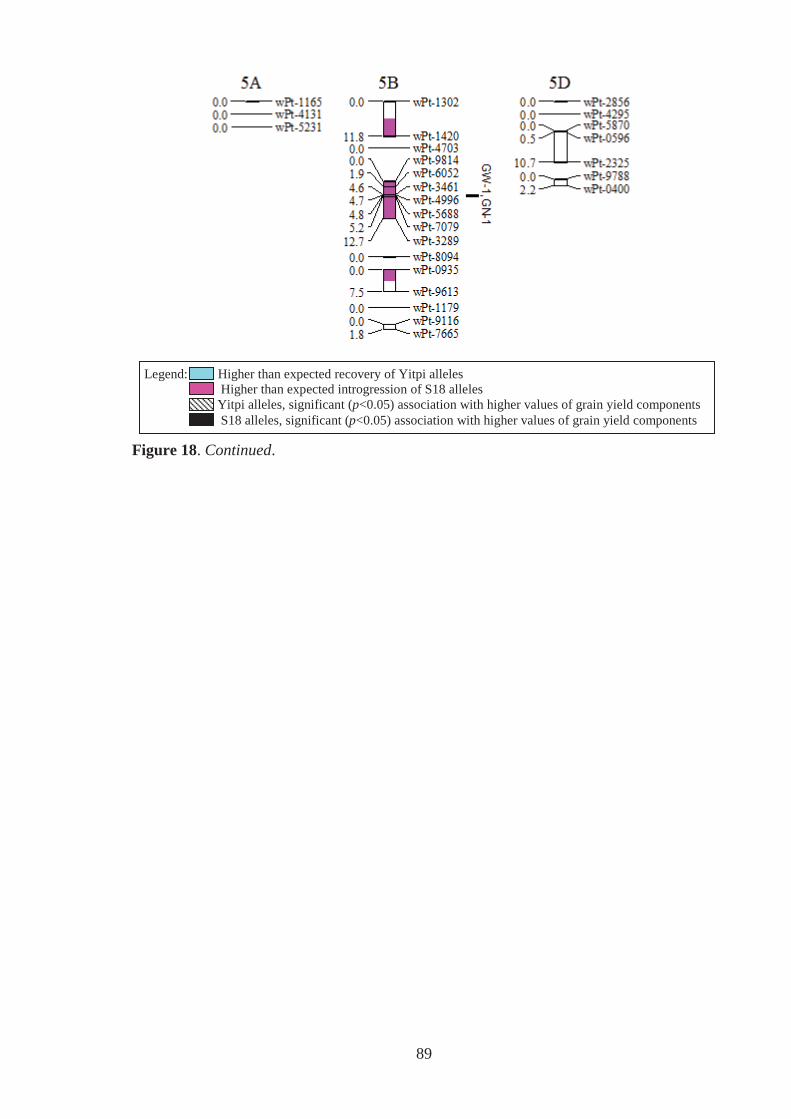
89
Figure 18. Continued.
Legend: Higher than expected recovery of Yitpi alleles Higher than expected introgression of S18 alleles Yitpi alleles, significant (p<0.05) association with higher values of grain yield components S18 alleles, significant (p<0.05) association with higher values of grain yield components
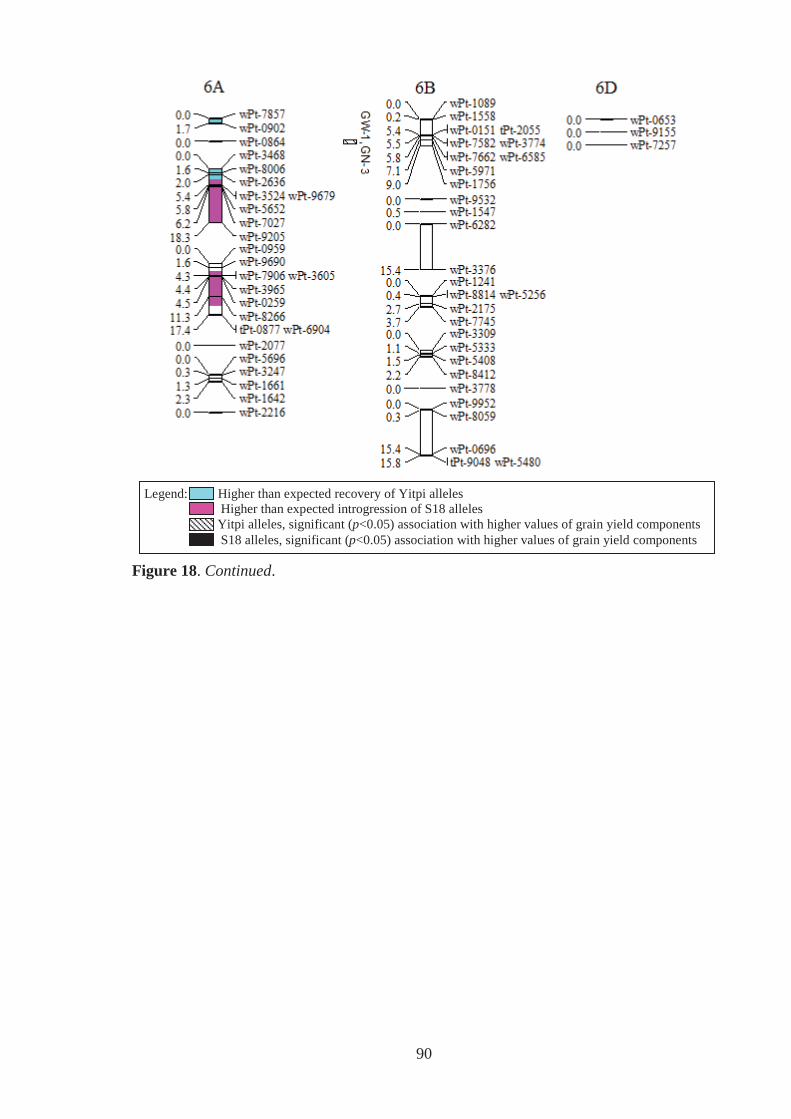
90
Figure 18. Continued.
Legend: Higher than expected recovery of Yitpi alleles Higher than expected introgression of S18 alleles Yitpi alleles, significant (p<0.05) association with higher values of grain yield components S18 alleles, significant (p<0.05) association with higher values of grain yield components
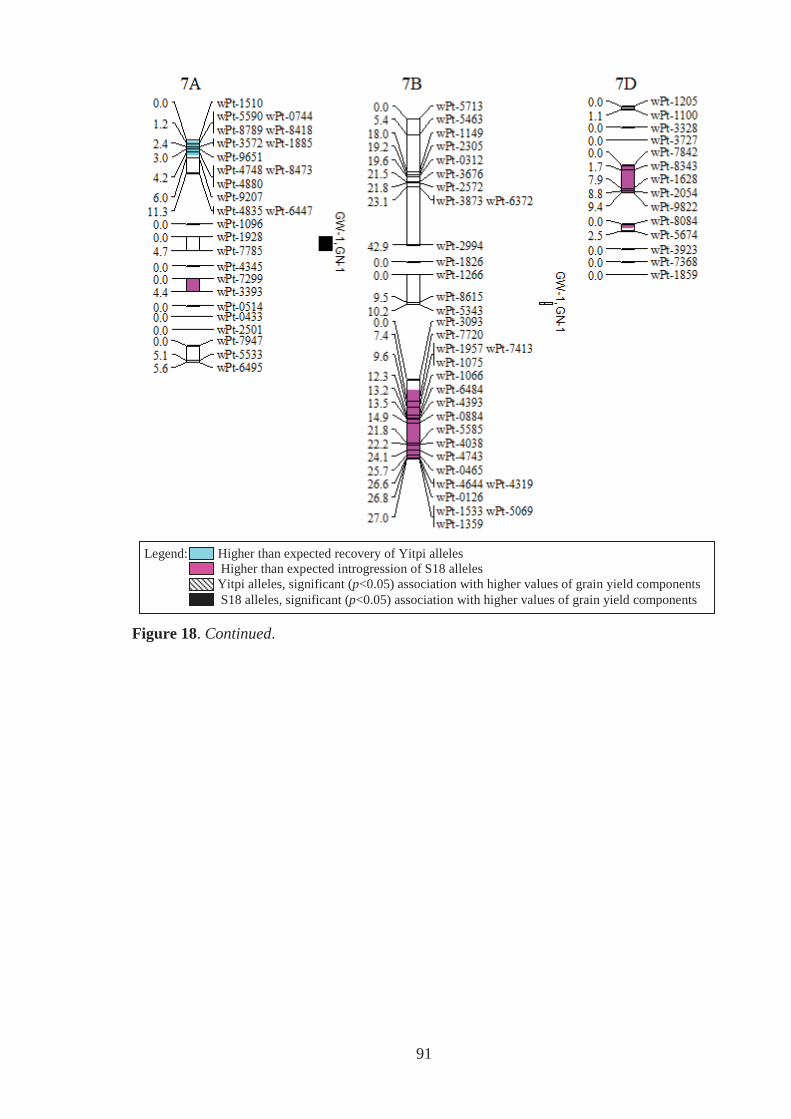
91
Figure 18. Continued.
Legend: Higher than expected recovery of Yitpi alleles Higher than expected introgression of S18 alleles Yitpi alleles, significant (p<0.05) association with higher values of grain yield components S18 alleles, significant (p<0.05) association with higher values of grain yield components
92
6.3.3 Introgressed primary synthetic alleles at loci associated with grain weight and
grains per m2
Chi-squared tests identified significant (p<0.05) excess introgression of the primary
synthetic allele at 79 (18.0%) and 103 (25.2%) mapped DArT marker loci of Y14 and Y18
respectively. These marker loci were located on chromosomes 1A, 1B, 2A, 3A, 3B, 5B, 6A
and 7A of both families, and also on 6B of Y14 (Figure 17) and 4B, 7B and 7D of Y18
(Figure 18). Common regions of excess primary synthetic allele introgression were
identified in both families at loci on chromosomes 1A, 1B, 2A, 3B and 5B.
At some loci with significant effects on grain weight and grains per m2, the alleles
introgressed from primary synthetics had positive effects on both traits. These loci were
identified at regions on chromosomes 1A, 2A, 2B, 4B, 5B and 7D of Y14 (Figure 17), and
2A, 3A, 5B and 7A of Y18 (Figure 18). The loci in each chromosome region that
explained the greatest percentage of variance for grain weight and grains per m2 are listed
in Table 14. In Y14, DArT marker loci wPt-6687 (2A) and wPt-3991 (4B) showed a
significant (p<0.05) association for the major grain yield components at four and three
environments respectively. Loci wPt-6687 (2A) and wPt-3991 (4B) explained up to 33%
and 26% of grain weight variance, and up to 16% and 11% of grains per m2 variance
respectively (Table 14). DArT marker loci tPt-6091 (1A), wPt-9266 (1A) and wPt-6687
(2A) of Y14 were the only ones assayed in this family that showed a significant (p<0.05)
association with both grain weight and grains per m2 at a single environment. In Y18,
DArT marker loci tPt-9405 (2A), wPt-1114 (2A) and wPt-1923 (3A) were all significantly
(p<0.05) associated with grain weight and grains per m2 at three test environments. Locus
tPt-9405 (2A) explained the most variance for grain weight (up to 34%) and for grains per
m2 (up to 33%) in Y18 at any one environment (Table 14).
Of the marker loci that were not incorporated in the genetic maps of Y14 and Y18, five
(Y14) and 15 (Y18) were significantly (p<0.05) associated with both grain weight and
grains per m2. These primary synthetic alleles were found to be significantly associated
with an increase in these traits. Six of these unmapped loci in each family were assigned to
a chromosome (4B and 5B in Y14, and 1B, 2B, 3A, 3D and 7A in Y18) using the reference
genetic maps and genotype matching (Appendix 5).
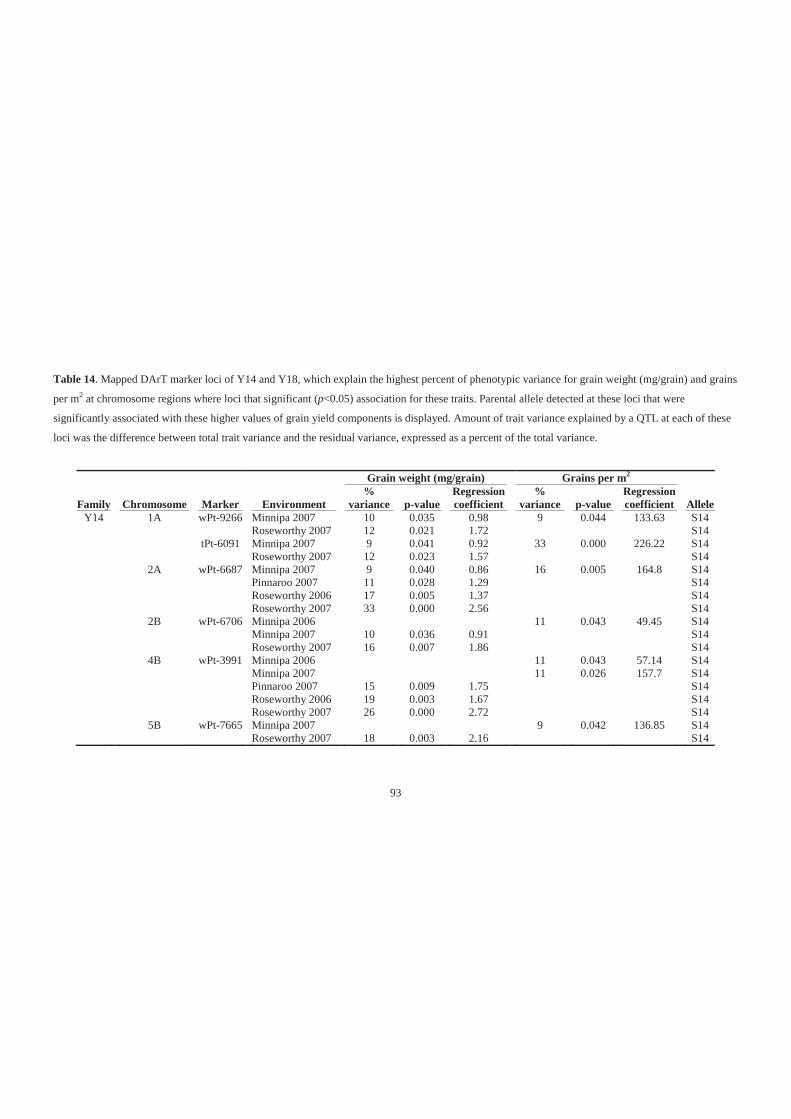
93
Table 14. Mapped DArT marker loci of Y14 and Y18, which explain the highest percent of phenotypic variance for grain weight (mg/grain) and grains
per m2 at chromosome regions where loci that significant (p<0.05) association for these traits. Parental allele detected at these loci that were
significantly associated with these higher values of grain yield components is displayed. Amount of trait variance explained by a QTL at each of these
loci was the difference between total trait variance and the residual variance, expressed as a percent of the total variance.
Grain weight (mg/grain) Grains per m2
Family Chromosome Marker Environment %
variance p-value Regression coefficient
% variance p-value
Regression coefficient Allele
Y14 1A wPt-9266 Minnipa 2007 10 0.035 0.98 9 0.044 133.63 S14 Roseworthy 2007 12 0.021 1.72 S14 tPt-6091 Minnipa 2007 9 0.041 0.92 33 0.000 226.22 S14 Roseworthy 2007 12 0.023 1.57 S14 2A wPt-6687 Minnipa 2007 9 0.040 0.86 16 0.005 164.8 S14 Pinnaroo 2007 11 0.028 1.29 S14 Roseworthy 2006 17 0.005 1.37 S14 Roseworthy 2007 33 0.000 2.56 S14 2B wPt-6706 Minnipa 2006 11 0.043 49.45 S14 Minnipa 2007 10 0.036 0.91 S14 Roseworthy 2007 16 0.007 1.86 S14 4B wPt-3991 Minnipa 2006 11 0.043 57.14 S14 Minnipa 2007 11 0.026 157.7 S14 Pinnaroo 2007 15 0.009 1.75 S14 Roseworthy 2006 19 0.003 1.67 S14 Roseworthy 2007 26 0.000 2.72 S14 5B wPt-7665 Minnipa 2007 9 0.042 136.85 S14 Roseworthy 2007 18 0.003 2.16 S14
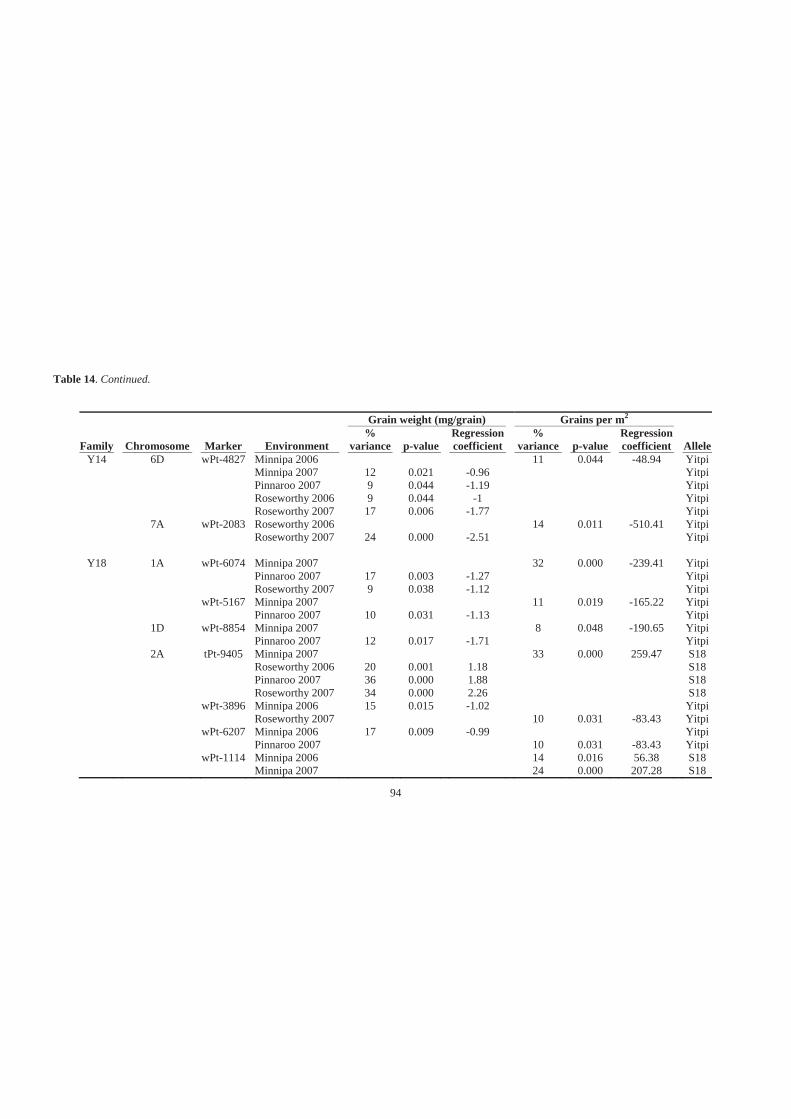
94
Table 14. Continued.
Grain weight (mg/grain) Grains per m2
Family Chromosome Marker Environment %
variance p-value Regression coefficient
% variance p-value
Regression coefficient Allele
Y14 6D wPt-4827 Minnipa 2006 11 0.044 -48.94 Yitpi Minnipa 2007 12 0.021 -0.96 Yitpi Pinnaroo 2007 9 0.044 -1.19 Yitpi Roseworthy 2006 9 0.044 -1 Yitpi Roseworthy 2007 17 0.006 -1.77 Yitpi 7A wPt-2083 Roseworthy 2006 14 0.011 -510.41 Yitpi Roseworthy 2007 24 0.000 -2.51 Yitpi
Y18 1A wPt-6074 Minnipa 2007 32 0.000 -239.41 Yitpi Pinnaroo 2007 17 0.003 -1.27 Yitpi Roseworthy 2007 9 0.038 -1.12 Yitpi wPt-5167 Minnipa 2007 11 0.019 -165.22 Yitpi Pinnaroo 2007 10 0.031 -1.13 Yitpi 1D wPt-8854 Minnipa 2007 8 0.048 -190.65 Yitpi Pinnaroo 2007 12 0.017 -1.71 Yitpi 2A tPt-9405 Minnipa 2007 33 0.000 259.47 S18 Roseworthy 2006 20 0.001 1.18 S18 Pinnaroo 2007 36 0.000 1.88 S18 Roseworthy 2007 34 0.000 2.26 S18 wPt-3896 Minnipa 2006 15 0.015 -1.02 Yitpi Roseworthy 2007 10 0.031 -83.43 Yitpi wPt-6207 Minnipa 2006 17 0.009 -0.99 Yitpi Pinnaroo 2007 10 0.031 -83.43 Yitpi wPt-1114 Minnipa 2006 14 0.016 56.38 S18 Minnipa 2007 24 0.000 207.28 S18
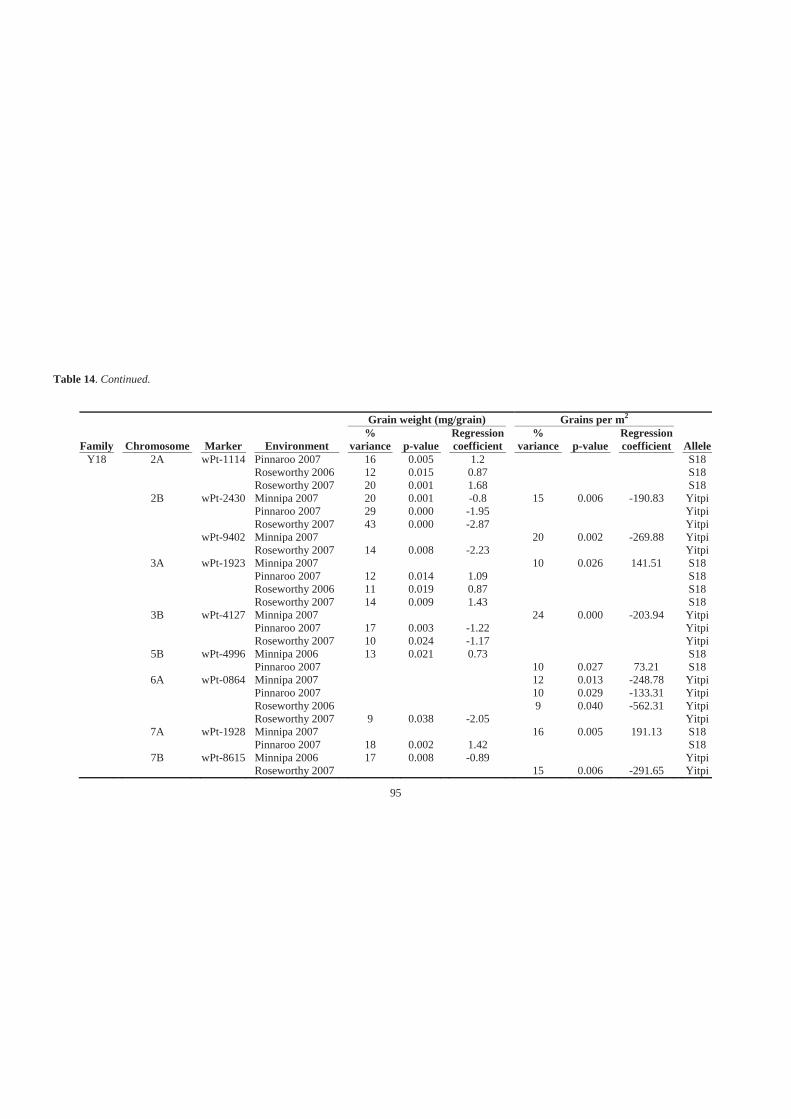
95
Table 14. Continued.
Grain weight (mg/grain) Grains per m2
Family Chromosome Marker Environment %
variance p-value Regression coefficient
% variance p-value
Regression coefficient Allele
Y18 2A wPt-1114 Pinnaroo 2007 16 0.005 1.2 S18 Roseworthy 2006 12 0.015 0.87 S18 Roseworthy 2007 20 0.001 1.68 S18 2B wPt-2430 Minnipa 2007 20 0.001 -0.8 15 0.006 -190.83 Yitpi
Pinnaroo 2007 29 0.000 -1.95 Yitpi Roseworthy 2007 43 0.000 -2.87 Yitpi wPt-9402 Minnipa 2007 20 0.002 -269.88 Yitpi Roseworthy 2007 14 0.008 -2.23 Yitpi 3A wPt-1923 Minnipa 2007 10 0.026 141.51 S18 Pinnaroo 2007 12 0.014 1.09 S18 Roseworthy 2006 11 0.019 0.87 S18 Roseworthy 2007 14 0.009 1.43 S18 3B wPt-4127 Minnipa 2007 24 0.000 -203.94 Yitpi Pinnaroo 2007 17 0.003 -1.22 Yitpi Roseworthy 2007 10 0.024 -1.17 Yitpi 5B wPt-4996 Minnipa 2006 13 0.021 0.73 S18 Pinnaroo 2007 10 0.027 73.21 S18 6A wPt-0864 Minnipa 2007 12 0.013 -248.78 Yitpi Pinnaroo 2007 10 0.029 -133.31 Yitpi Roseworthy 2006 9 0.040 -562.31 Yitpi Roseworthy 2007 9 0.038 -2.05 Yitpi 7A wPt-1928 Minnipa 2007 16 0.005 191.13 S18 Pinnaroo 2007 18 0.002 1.42 S18 7B wPt-8615 Minnipa 2006 17 0.008 -0.89 Yitpi Roseworthy 2007 15 0.006 -291.65 Yitpi
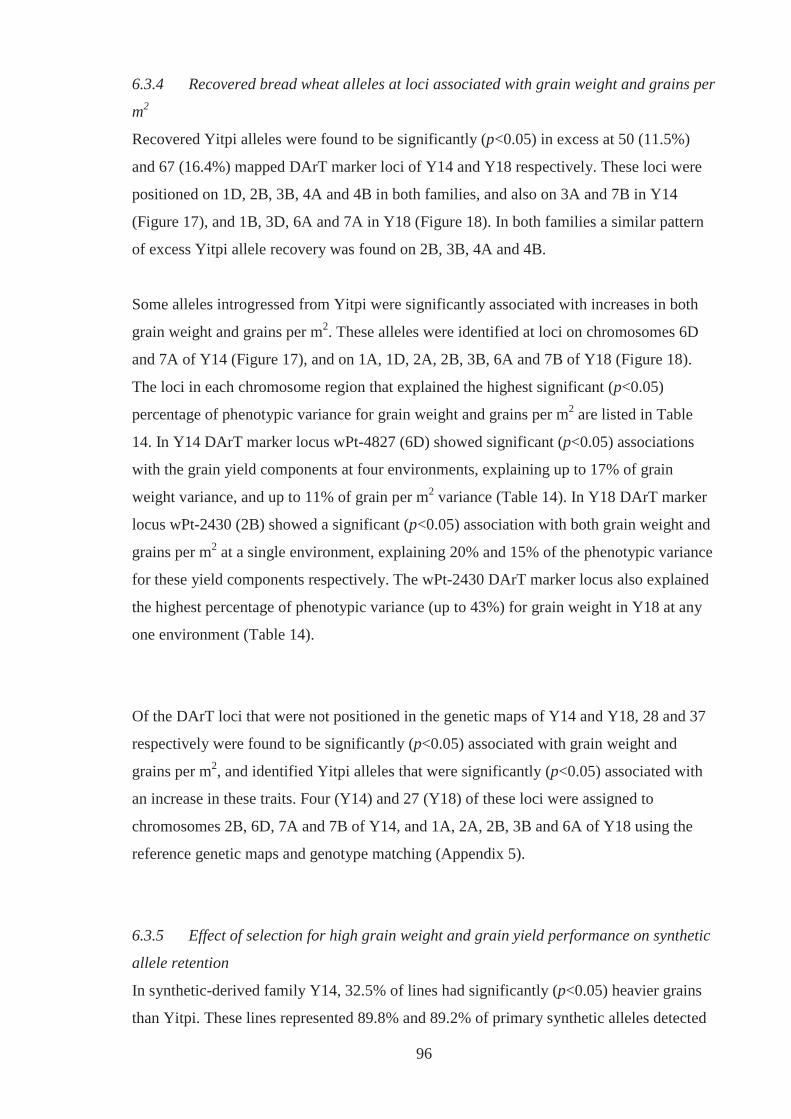
96
6.3.4 Recovered bread wheat alleles at loci associated with grain weight and grains per
m2
Recovered Yitpi alleles were found to be significantly (p<0.05) in excess at 50 (11.5%)
and 67 (16.4%) mapped DArT marker loci of Y14 and Y18 respectively. These loci were
positioned on 1D, 2B, 3B, 4A and 4B in both families, and also on 3A and 7B in Y14
(Figure 17), and 1B, 3D, 6A and 7A in Y18 (Figure 18). In both families a similar pattern
of excess Yitpi allele recovery was found on 2B, 3B, 4A and 4B.
Some alleles introgressed from Yitpi were significantly associated with increases in both
grain weight and grains per m2. These alleles were identified at loci on chromosomes 6D
and 7A of Y14 (Figure 17), and on 1A, 1D, 2A, 2B, 3B, 6A and 7B of Y18 (Figure 18).
The loci in each chromosome region that explained the highest significant (p<0.05)
percentage of phenotypic variance for grain weight and grains per m2 are listed in Table
14. In Y14 DArT marker locus wPt-4827 (6D) showed significant (p<0.05) associations
with the grain yield components at four environments, explaining up to 17% of grain
weight variance, and up to 11% of grain per m2 variance (Table 14). In Y18 DArT marker
locus wPt-2430 (2B) showed a significant (p<0.05) association with both grain weight and
grains per m2 at a single environment, explaining 20% and 15% of the phenotypic variance
for these yield components respectively. The wPt-2430 DArT marker locus also explained
the highest percentage of phenotypic variance (up to 43%) for grain weight in Y18 at any
one environment (Table 14).
Of the DArT loci that were not positioned in the genetic maps of Y14 and Y18, 28 and 37
respectively were found to be significantly (p<0.05) associated with grain weight and
grains per m2, and identified Yitpi alleles that were significantly (p<0.05) associated with
an increase in these traits. Four (Y14) and 27 (Y18) of these loci were assigned to
chromosomes 2B, 6D, 7A and 7B of Y14, and 1A, 2A, 2B, 3B and 6A of Y18 using the
reference genetic maps and genotype matching (Appendix 5).
6.3.5 Effect of selection for high grain weight and grain yield performance on synthetic
allele retention
In synthetic-derived family Y14, 32.5% of lines had significantly (p<0.05) heavier grains
than Yitpi. These lines represented 89.8% and 89.2% of primary synthetic alleles detected
97
in this family at mapped and at all loci assayed respectively (Table 15). In family Y18,
21.7% of lines had significantly (p<0.05) heavier grains than Yitpi. These lines represented
71.9% and 74.9% of primary synthetic alleles detected in this family at mapped and at all
DArT maker loci assayed respectively (Table 15). Both sets of high performing lines from
Y14 and Y18 included all introgressed primary synthetic alleles that were significantly
(p<0.05) associated with an increase in both grain weight and grains per m2.
For grain yield, 16.3% of Y14 synthetic derivatives had results not significantly different
(p>0.05) from that of Yitpi. These lines represented 66.8% and 71.2% of primary synthetic
alleles detected in this family at mapped and at all loci assayed respectively (Table 15).
The same level of grain yield performance in Y18 led to the selection of 41.3% of lines,
which represented 96.8% of primary synthetic alleles detected in this family at both
mapped (Table 15) and all loci assayed. All introgressed primary synthetic alleles of Y14
and Y18 that were significantly (p<0.05) associated with an increase in both grain weight
and grains per m2 were maintained in the selected lines for grain yield performance.
Of the lines within synthetic-derived families Y14 and Y18, 7.0% and 17.4% respectively
had grain weights significantly (p<0.05) heavier than Yitpi, and grain yields not
significantly different (p>0.05) to that of Yitpi. These lines represented 38.5% (Y14) and
61.3% (Y18) of all primary synthetic alleles detected in these families. These high
performing lines represented 39.8% (Y14) and 57.2% (Y18) of the mapped DArT loci that
displayed synthetic alleles in these families (Table 15). All introgressed synthetic alleles in
Y18 that were significantly (p<0.05) associated with an increase in both grain weight and
grains per m2 were maintained in the lines subjected to the double selection. Across lines in
Y14 double selected for their high grain weight and grain yield performance, three alleles
that had significant (p<0.05) association for grain weight and grains per m2 were not
represented at DArT loci tPt-3714 (5B), wPt-9266 (1A) and wPt-7665 (5B), which had
significant (p<0.05) association for these traits.
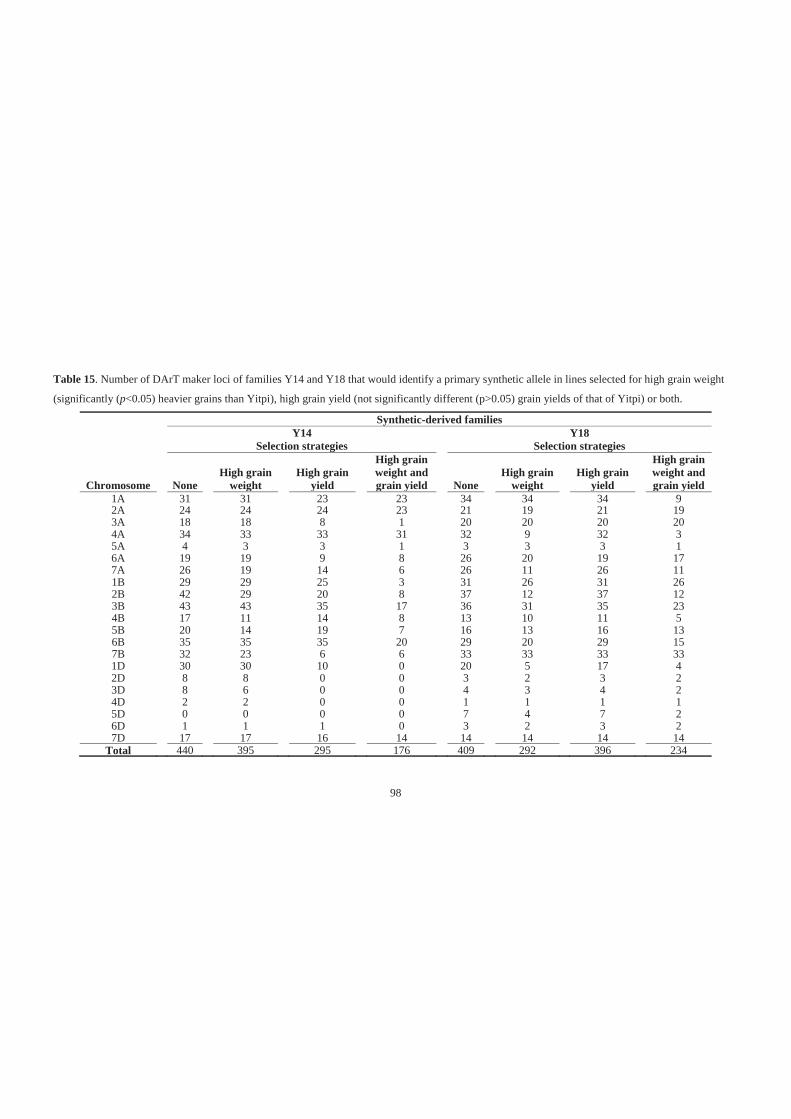
98
Table 15. Number of DArT maker loci of families Y14 and Y18 that would identify a primary synthetic allele in lines selected for high grain weight
(significantly (p<0.05) heavier grains than Yitpi), high grain yield (not significantly different (p>0.05) grain yields of that of Yitpi) or both.
Synthetic-derived families
Y14
Selection strategies Y18
Selection strategies
Chromosome None High grain
weight High grain
yield
High grain weight and grain yield None
High grain weight
High grain yield
High grain weight and grain yield
1A 31 31 23 23 34 34 34 9 2A 24 24 24 23 21 19 21 19 3A 18 18 8 1 20 20 20 20 4A 34 33 33 31 32 9 32 3 5A 4 3 3 1 3 3 3 1 6A 19 19 9 8 26 20 19 17 7A 26 19 14 6 26 11 26 11 1B 29 29 25 3 31 26 31 26 2B 42 29 20 8 37 12 37 12 3B 43 43 35 17 36 31 35 23 4B 17 11 14 8 13 10 11 5 5B 20 14 19 7 16 13 16 13 6B 35 35 35 20 29 20 29 15 7B 32 23 6 6 33 33 33 33 1D 30 30 10 0 20 5 17 4 2D 8 8 0 0 3 2 3 2 3D 8 6 0 0 4 3 4 2 4D 2 2 0 0 1 1 1 1 5D 0 0 0 0 7 4 7 2 6D 1 1 1 0 3 2 3 2 7D 17 17 16 14 14 14 14 14
Total 440 395 295 176 409 292 396 234
99
6.4 Discussion
6.4.1 DArT marker screening of synthetic-derivatives
DArT marker screening provided an efficient, high-throughput method of identifying large
numbers of introgressed primary synthetic (donor parent) alleles, and recovered bread
wheat (recurrent parent) alleles in two BC1 synthetic-derived families of lines, Y14 and
Y18. The number of polymorphic DArT marker loci identified in these families (>990)
was similar to that identified in the ITMI Opata 85/Synthetic population (Van Deynze et
al. 1995; Triticarte Pty Ltd 2008). Clustering of DArT marker loci was observed in the
Y14 and Y18 genetic maps, inflating the number of informative polymorphic loci to some
extent. This clustering has been observed in other genetic maps, particularly around the
centromere, and hence this effect has flowed onto the Y14 and Y18 maps from the
reference maps (Semagn et al. 2006b; Wenzl et al. 2006). Over 400 polymorphic DArT
marker loci identified in Y14 and Y18 had not been mapped in the 17 reference genetic
maps, suggesting that synthetic-derived populations could be generally useful to map
DArT markers. As Y14 and Y18 were represented by few lines (<50), with many marker
genotypes found not to provide discrimination (show recombination events), larger
synthetic-derived populations would be required for such mapping. Hospital (2001)
reported that to observe sufficient levels of recombination to identify introgression
segments of 20cM in length in a BC1 population, at least 330 lines need to be genotyped.
In light of this, the use of reference maps to create the genetic maps of Y14 and Y18 was
an appropriate method to provide practical information.
The D genomes of the Y14 and Y18 genetic maps were poorly represented by marker loci,
a phenomenon commonly reported in bread wheat populations (Röder et al. 1998;
Chalmers et al. 2001). Due to the reliance on reference maps for the construction of the D
genome chromosomes, this lack of polymorphism detection in the reference maps has also
flowed on to Y14 and Y18. The inclusion of D genome markers from other marker
platforms (simple sequence repeat (SSR) or amplified fragment length polymorphism
(AFLP) markers, for example) could have improved marker representation on D genome
chromosomes of Y14 and Y18. However, D genome markers developed in bread wheat
may not be applicable for synthetic derivatives. Pestsova et al. (2000) reported that some D
genome markers developed from Ae. tauschii accessions and the ITMI Opata 85/Synthetic
mapping population could be absent from the D genome of bread wheat. Further use of Ae.
tauschii populations to develop more D genome DArT markers may improve the
100
usefulness of this high-throughput technology to analyse the D genome of small synthetic-
derived families of lines.
6.4.2 Patterns of excess parental allele introgression and recovery
Similar regions of excess primary synthetic allele introgression were detected at DArT
marker loci on chromosomes 1A, 1B, 2A, 3B and 5B in both Y14 and Y18. Excess
recovery of the Yitpi allele was also detected at similar regions on 2B, 3B, 4A and 4B in
both families. These regions represented approximately half of all chromosomal regions
where deviations of allele segregation from Mendelian expectations (for BC1 material)
were observed. This phenomenon may have been caused by several processes. Gamete
survival and ‘meiotic drive’ elements have been shown to influence segregation distortion
in Drosophila melanogaster and in populations of other organisms, including bread wheat
(Lyttle 1991; Messmer et al. 1999; Semagn et al. 2006b). Competitive ability of the
synthetic backcross lines during the bulk phase of the family development may have also
caused target loci to be preferentially transmitted to future generations. Genotypes that
produced more grain, had spring growth habits and were semi-dwarf in stature were
preferentially selected during family development. Therefore, parental alleles at loci
assayed here that promoted these characters provided a selective advantage. As Yitpi was
the recurrent parent in both families, elements from Yitpi may have been the cause of
segregation distortion at chromosomal regions that were similar in both families. Regions
of excess parental allele representation that were not shared between Y14 and Y18 may
have been influenced by the primary synthetic wheat parents. Segregation distortion has
been observed in populations of both T. turgidum (Blanco et al. 1998; Kumar et al. 2007)
and Ae. tauschii (Fritz et al. 1995; Faris et al. 1998); therefore it is not unreasonable to
suggest that elements from the primary synthetic wheat parents of Y14 (S14) and Y18
(S18) were involved. Four other bread populations analysed with DArT markers have also
shown deviations of allele segregation at the same marker loci as on 1A and 6B of Y14,
and 1A, 2B, 7B and 7D of Y18 (Francki et al. 2009).
6.4.3 Beneficial parental alleles for increasing grain yield components
An aim of this investigation was to identify parental alleles within Y14 and Y18 that were
significantly (p<0.05) associated with an increase in both grain weight and grains per m2,
at loci that had significant (p<0.05) association for these traits. Such alleles were identified
in groups of these loci, possibly inferring the presence of QTLs. At the same or
neighbouring DArT marker loci (<1cM away) from these groups on 1A, 2A and 4B in
101
Y14, and 1D, 2B, 3A and 6A in Y18, were previously reported QTL for grain yield, grain
weight, grains per m2, % screenings and hectolitre weight (McIntyre et al. 2010). Other
previous reports stating the investigation of bread wheat germplasm with DArT and other
marker systems have identified QTL for grain weight at loci <5cM from the loci groups
assayed on 2A of Y14, and on 1A, 2A, 2B, and 3B of Y18 (Groos et al. 2003; Hai et al.
2008; Sun et al. 2009; Wang et al. 2009). Interestingly the beneficial primary synthetic
(S18) alleles identified at loci grouped around tPt-9405 and wPt-1114 on 2A of Y18 appear
to be situated between previously identified QTLs for grain weight (Huang et al. 2004; Sun
et al. 2009). In Y14, beneficial primary synthetic (S14) alleles identified at loci grouped
around wPt-6687 on 2A also appear to be situated between two previously reported QTL
for grain weight on 2AL (Sun et al. 2009). Therefore, this study has shown that on the long
arm of 2A of S14 and S18 primary synthetic wheat parents contributed beneficial alleles
that increase grain weight and grains per m2. This shows that the use of reference genetic
maps and single marker regression can detect previously identified QTLs and potentially
new QTLs in small families of lines. However, a p-value of < 0.05 may have not been
stringent enough to exclude all false positives. The identification of few QTL outside of
chromosome regions where QTL have been previously published was constructive, and
hence a p-value of < 0.05 was considered appropriate for this exploratory study.
Of all DArT marker loci at which beneficial parental alleles were identified in Y14 and
Y18, none were shared between both families. This was surprising for loci where
beneficial Yitpi alleles were identified, as both families shared Yitpi as a common
recurrent bread wheat parent. Interestingly most beneficial alleles at the putative QTL in
Y18 were Yitpi derived, with all beneficial alleles at the putative QTL in Y14 being from
its primary synthetic parent. This may help explain why Y18 lines were high grain yielding
and the Y14 lines produced heavy grains. Primary synthetic wheats are known to be
genetic resources for increased grain weight, but it appears here that alleles from the elite
bread wheat parent were superior for high grain yield production. However, as nearly all
primary synthetic and Yitpi alleles that had a significant (p<0.05) positive association for
grain weight and grains per m2 were retained in lines selected for high grain weight and
grain yield performance, genetic contributions from the primary synthetic wheats were still
important. This observation also supports the report by McIntyre et al. (2010), stating that
selection for high grain yield performance can enrich the frequency of QTL that promote
high grain yield in the selected lines.
102
6.5 Conclusion
Genetic material from two primary synthetic wheats was similarly introgressed in a
common bread wheat background, but their effect on the major grain yield components
was different. This study has demonstrated that DArT markers can identify large numbers
of polymorphic loci in synthetic-derived material, assisting in the identification of
introgressed parental alleles at putative QTL for grain yield components. Large synthetic-
derived populations are recommended for future molecular and phenotypic studies,
however small families were useful for assessing the genetic contributions of different
primary synthetic wheats.
103
Chapter 7
General Discussion
The progenitor species of bread wheat, T. turgidum and Ae. tauschii, and their hybrid form,
primary synthetic wheat, are sources of germplasm for bread wheat breeding. Initially
primary synthetic wheats were created to identify these progenitor species in the 1940’s,
but in recent times they have become an important pre-breeding tool for broadening
genetic diversity and improving agronomic traits in modern bread wheat germplasm. This
resurgent interest in primary synthetics has come from the identification of genetic
variation for agronomically important traits in this resource that is not readily observed in
adapted breeding pools of bread wheat. The growing human population and the rising cost
of crop maintenance have also driven the search for novel germplasm that can improve the
health and productivity of bread wheat. The identification of primary and derived
synthetics with superior performance, relative to modern bread wheat cultivars, has
validated the desire to breed with this germplasm resource despite their expressions of
deleterious traits. Investigations undertaken here focused on further determining the value
of using primary and derived synthetics in Australian bread wheat breeding. This research
was divided into three areas, 1) genetic diversity, 2) grain weight and grain yield in
drought stressed environments, and 3) introgression of synthetic alleles. This chapter
discusses the major findings of each of these areas and summarises the key conclusions.
7.1 Genetic diversity
Primary synthetic and Australian bread wheats were assayed in this study using DArT
molecular markers, to determine the genetic variation within and among these germplasm
pools. Although DArT markers had not been extensively used to assess primary synthetic
wheat in the past, their use to evaluate genetic diversity in bread wheat had been validated
(White et al. 2008). The DArT microarray platform allowed a large number of loci to be
assayed simultaneous across the A, B and D genome chromosomes of the test genotypes.
However, there were limitations to thoroughly assay the D genome of the bread wheats and
the Ae. tauschii components of the primary synthetics. Interestingly this issue has been
common to all molecular marker systems to date. The likely reason for this phenomenon is
a low level of D genome polymorphism present in the bread wheat germplasm used to
develop molecular makers. This study has strengthened the case to use Ae. tauschii
populations more extensively to develop additional D genome markers, especially for the
assessment of primary and derived synthetic wheats.
104
Genetic similarity, and conversely dissimilarity or genetic distance was observed between
and within the A, B and D genomes of the primary synthetics and Australian bread wheats.
Among the Australian cultivars this level was between what has been previously described
(Paull et al. 1998; White et al. 2008). Further representation of the Australian bread wheat
pool may have provided a different outcome, but the findings of the current study were
within expectations.
Two results defined this body of work, the high level of dissimilarity between the primary
synthetics and Australian bread wheats and their A and B genomes, and the lack of
similarity between primary synthetics with the same recorded pedigree or those that shared
common parents. The A and B genomes of the primary synthetics were derived from
CIMMYT durum wheat cultivars or breeders lines, which represented a source of ‘refined’
genomes of T. turgidum. Some durum A and B genomes were bread wheat like, where as
many others showed divergence from those of the bread wheats. Previous studies have
noted divergence between bread and durum wheat. Hence, primary synthetic wheats used
in the future to broaden the genetic diversity of the A and B genomes of Australian bread
wheat may not need to be derived from wide T. turgidum sources, such as subspecies
dicoccoides, dicoccon or carthlicum, which may express deleterious traits. The lack of
genomic similarity between primary synthetic wheats with the same recorded pedigrees
was unexpected, and raises issues of pedigree record keeping at CIMMYT, outcrossing
among CIMMYT Ae. tauschii accessions or the primary synthetics themselves. The former
seems most likely as this issue has been identified with other primary synthetics produced
by CIMMYT that have been used in molecular studies. Better record keeping is therefore
required in the future production of primary synthetic wheats. Seed from the exact parental
T. turgidum and Ae. tauschii accessions used should be retained for molecular studies, a
practise that in the past has not been commonly performed.
7.2 Grain weight and grain yield under drought stressed environments
In this study synthetic backcross lines were evaluated in drought stressed environments in
southern Australia, to identify synthetic derivatives that could achieve superior grain yields
compared to their Australian recurrent bread wheat parent. Their major grain yield
components (grain weight and grains per m2) were also investigated. The magnitude of
grain yield improvements achieved, and the major grain yield component responsible,
changed with each environment type. Grain yield BLUPs up to 12.0% higher than that of
105
Yitpi (recurrent parent) were achieved by the synthetic backcross lines in the highest
yielding environments, with grain yield BLUPs up to 43.8% higher identified under the
lowest yielding environments. These significant grain yield improvements were due to
significant increases in grain weight in the highest yielding environments, whereas
significant increases in grains per m2 were commonly responsible in the lowest yielding
environments, without significant penalty to grain weight. Computer simulation models
have predicted a similar mechanism of grain yield improvement in Australian
environments (Asseng et al. 2002). In light of this pattern Australian bread wheat breeders
may be able to apply additional selection pressure to increase grain weight in higher
yielding environments without significant negative effects on grain yield. What synthetic
backcross lines can provide is an incremental increase in grain yield without penalty to
grain quality (grain weight), particularly under drought in low yielding environments.
It is a challenge to select bread wheat genotypes that can achieve increased grain yields
and maintain and/or increase grain quality (grain weight) in the low rainfall conditions
experienced in Australia. There is a need in Australia to increase bread wheat productivity
in times of drought as such meteorological events are set to become more prevalent in the
future (Hennessy et al. 2007). As some of the highest grain yielding synthetic backcross
lines identified here performed well in a subsequent experiment conducted by Australian
Grain Technologies (AGT) Pty Ltd in 2008, which experienced less water stress, this
suggests that using synthetic derived material in bread wheat breeding in the future may
lead to more improved and stable yields in Australian bread wheat. Synthetic backcross
lines from this subsequent experiment have been incorporated into AGT’s South
Australian wheat breeding program.
A second key aim of this investigation was to investigate the potential of different primary
synthetic wheats to increase grain yield, and its major components, of an Australian bread
wheat cultivar. This was achieved by evaluating synthetic backcross lines as families, each
created from a different primary synthetic parent and a common recurrent Australian bread
wheat cultivar. Differences in genetic contributions from the primary synthetic parents
were evident as the mean grain yield of lines within families was commonly significantly
different between the worst and best performing families. Superior grain yielding synthetic
backcross lines were identified in about half of the families evaluated. This shows that
primary synthetic wheats can be used to develop superior grain yielding derivatives but the
choice of primary synthetic parent can affect the potential to identify such material.
106
However, as not all superior grain yielding synthetic backcross lines were identified in the
highest performing families it was still beneficial to assess a range of primary synthetic
wheats as donor parents. Identifying primary or derived synthetic germplasm that achieves
high performance with respect to grain yield or its major components provides a breeding
resource that may broaden the genetic diversity of a breeding pool whilst maintaining the
commercial potential of the pool.
This study has demonstrated that primary and derived synthetics would be useful to
improve grain weight and grain yield performance of Australian bread wheat under
drought stressed environments. Breeding programs in Australia are likely to continue to
favour crossing adapted genotypes to develop new cultivars, and CIMMYT is likely to
continue to develop and pre-screen synthetic germplasm that may be useful for Australia.
The current study however does encourage the development and screening of synthetic-
derived germplasm in Australia, in particular for the identification of superior genotypes
under southern Australian environments. Collaborative research between the Australian
Winter Cereals Collection (AWCC) and the wheat breeding companies in Australia have
the capacity to achieve this.
7.3 Introgression of synthetic alleles
The underlying principle for introgressing genetic material from diverse sources, such as
primary synthetic wheats, into modern bread wheat cultivars is to capture desirable genes
and alleles that have commercial worth. In the past the main focus for exploiting the
progenitor species of bread wheat was to obtain simply inherited traits, such as disease
resistance. However, the efficient implementation of large numbers of molecular markers
has facilitated investigations into the genetic control of important quantitative traits.
Identifying primary synthetic alleles that have a positive association with increasing grain
weight and grains per m2 may therefore lead to the tracking and maintenance of synthetic
alleles in breeding programs through marker assisted selection. To identify such alleles two
families of synthetic backcross lines (Y14 and Y18) were investigated here. This involved
combining phenotypic data from their field evaluation (Chapter 5) with molecular marker
data from their DArT marker analysis (Chapter 6).
With the use of reference genetic maps and the application of single marker regression to
evaluate the small synthetic-derived families of lines, it was possible to detect previously
reported QTL for grain yield and its components. In the current study these QTL were
107
observed as groups of linked loci with significant (p<0.05) associations for both grain
weight and grains per m2. These techniques differ from those traditionally used for QTL
mapping in large populations of lines. Due to introgressed primary synthetic alleles,
potentially new QTLs for increasing grain weight and grains per m2 were identified on
2AL in both Y14 and Y18. This demonstrates that primary synthetic wheats can provide
potentially novel genes and alleles to a modern bread wheat cultivar. Upon selecting for
high grain weight and/or grain yield performance, these beneficial synthetic alleles on 2AL
and most others identified were represented in the selections. Therefore it is conceivable
that genetic improvement of grain yield over time can be achieved through the enrichment
of beneficial alleles within a breeding program (McIntyre et al. 2010). Although a large
population size is preferable for QTL mapping the use of reference maps and single marker
regression could be a strategy to identify putative QTL in other small families of lines
within a breeding program. However, the use of many molecular makers would be
required. Future studies to further validate the value and effect of primary synthetic alleles
at the putative 2AL QTL’s may be performed through the phenotypic and genotypic
evaluation of near-isogenic lines (NIL) that have the 2AL synthetic introgressions.
7.4 Conclusions
Bread wheat breeding is essential for the ongoing development of improved cultivars,
which meet changing human requirements and field environments. In Australia these
environments are set to become dryer with the incidence of severe drought predicted to
increase (Hennessy et al. 2007). This study has shown that many, but not all primary
synthetic wheats can be a germplasm source to increase the grain yield and grain quality
(grain weight) of a modern Australian bread wheat under drought stressed environments in
southern Australia (Chapter 5). The identification of potentially novel synthetic alleles
from two primary synthetic wheats, on 2AL that increased grain weight and grain per m2
under drought (Chapter 6) may prompt future investigations of the use of these synthetic
alleles in Australian breeding programs. Finally, whilst maintaining or increasing the
commercial worth of Australian bread wheat breeding pools, primary synthetic wheats also
have the potential to further broaden the genetic diversity of these pools (Chapter 4). These
findings warrant the continued assessment of primary and derived synthetic wheats in
Australian bread wheat breeding programs.
108
Chapter 8
Conclusions
This research focused on evaluating primary and derived synthetics for their value and
potential use in Australian bread wheat breeding. The research involved identifying the
genetic similarity between and among primary synthetic wheat and modern Australian
bread wheat cultivars, evaluating the grain yield performance of families of synthetic
backcross lines in drought stress environments in southern Australia, and the major grain
yield components (grain weight and grains per m2) responsible for their performances, the
tracking of synthetic wheat alleles introgressed into the background of a modern Australian
bread wheat, and the identification of introgressed synthetic alleles associated with
increasing grain weight and grains per m2. This thesis presents the following conclusions:
1. Primary synthetic wheats are a source of genetic variation for Australian bread wheat
breeders as greater dissimilarity was observed between the 44 primary synthetic wheats
and the nine modern Australian bread wheat cultivars investigated here than that identified
within these germplasm groups (Chapter 4). One hundred and sixty eight synthetic alleles
were identified across the 44 primary synthetic wheats that could be novel to modern
Australian bread wheat germplasm. The CIMMYT durum wheat component (A and B
genomes) of the 44 primary synthetic wheats investigated was substantially different
compared to the A and B genomes of the nine modern Australian bread wheats evaluated.
The D genomes of the primary synthetic wheat were genetically divergent compared to
those of the bread wheats, however more D genome markers representing polymorphisms
in Ae. tauschii need to be added to the DArT array to sufficiently examine this genome.
2. Synthetic backcross (BC1) lines can achieve superior grain yields under drought stressed
environments in southern Australia, compared to their recurrent Australian bread wheat
parent (Chapter 5). Grain yields up to 12.0% higher than Yitpi (recurrent parent) were
achieved by synthetic backcross lines in the highest yielding environments, with grain
yields up to 43.8% higher identified in the lowest yielding environments. The grain yield
component responsible for these increases was grain weight (up to 108.1% of that of Yitpi)
in the highest yielding environments, whereas grain per m2 (up to 154.3% of that of Yitpi)
was commonly responsible in the lowest yielding environments. High performing synthetic
backcross lines from this study have been incorporated into the bread wheat breeding
program of Australian Grain Technologies (AGT) Pty Ltd in South Australia.
109
3. Primary synthetic wheats differ in their potential to increase the grain yield, and its
major components, of an Australian bread wheat cultivar (Chapter 5). Out of 27 primary
synthetics evaluated through 27 associated families of synthetic backcross lines, 14
primary synthetics (S01, S05, S06, S09, S11, S12, S13, S14, S15, S18, S36, S37 and S40)
were the donor parents to lines that produced superior grain yields. Genetic contributions
from primary synthetic wheat S18 was most superior for grain yield as its associated
family of lines Y18 produced the highest estimated family grain yield in every
environment. For the improvement of grain weight, genetic contributions from S12, S14
and S43 were most superior as their families of lines (Y12, Y14 and Y43 respectively) had
higher estimated grain weights than the recurrent Australian bread wheat parent in every
test environment.
4. Similar regions of excess primary synthetic and Yitpi allele introgression were detected
in synthetic derived families of lines Y14 and Y18 (Chapter 6). Regions on chromosome
2A were found to be associated with grain weight and grains per m2, in drought stressed
environments, with the favourable allele(s) from the primary synthetic parents. These
regions were near DArT marker loci wPt-6687 in Y14, and tPt-9405 and wPt-1114 in Y18.
These seem to be different locations than the QTL on 2A identified by Huang et al. (2004)
and Sun et al. (2009), however a p-value of <0.05 that was used may have not been
stringent enough to exclude this finding as a false positive. Selection of high grain weight
and grain yielding lines in families Y14 and Y18 did represent these beneficial regions on
2A, therefore primary synthetic wheats S14 and S18 may be a source of novel alleles for
improving grain weight and/or grain yield performance under drought stressed
environments in southern Australia.
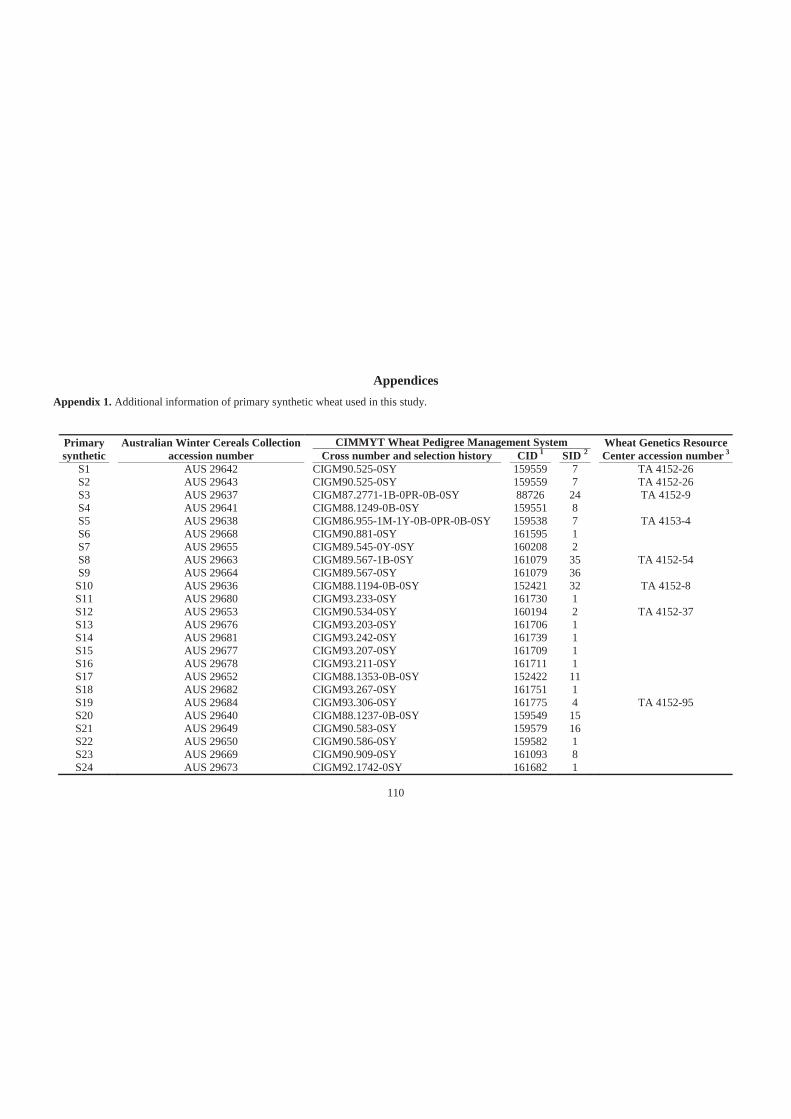
110
Appendices Appendix 1. Additional information of primary synthetic wheat used in this study.
Primary synthetic
Australian Winter Cereals Collection accession number
CIMMYT Wheat Pedigree Management System Wheat Genetics Resource Center accession number 3 Cross number and selection history CID 1 SID 2
S1 AUS 29642 CIGM90.525-0SY 159559 7 TA 4152-26 S2 AUS 29643 CIGM90.525-0SY 159559 7 TA 4152-26 S3 AUS 29637 CIGM87.2771-1B-0PR-0B-0SY 88726 24 TA 4152-9 S4 AUS 29641 CIGM88.1249-0B-0SY 159551 8 S5 AUS 29638 CIGM86.955-1M-1Y-0B-0PR-0B-0SY 159538 7 TA 4153-4 S6 AUS 29668 CIGM90.881-0SY 161595 1 S7 AUS 29655 CIGM89.545-0Y-0SY 160208 2 S8 AUS 29663 CIGM89.567-1B-0SY 161079 35 TA 4152-54 S9 AUS 29664 CIGM89.567-0SY 161079 36
S10 AUS 29636 CIGM88.1194-0B-0SY 152421 32 TA 4152-8 S11 AUS 29680 CIGM93.233-0SY 161730 1 S12 AUS 29653 CIGM90.534-0SY 160194 2 TA 4152-37 S13 AUS 29676 CIGM93.203-0SY 161706 1 S14 AUS 29681 CIGM93.242-0SY 161739 1 S15 AUS 29677 CIGM93.207-0SY 161709 1 S16 AUS 29678 CIGM93.211-0SY 161711 1 S17 AUS 29652 CIGM88.1353-0B-0SY 152422 11 S18 AUS 29682 CIGM93.267-0SY 161751 1 S19 AUS 29684 CIGM93.306-0SY 161775 4 TA 4152-95 S20 AUS 29640 CIGM88.1237-0B-0SY 159549 15 S21 AUS 29649 CIGM90.583-0SY 159579 16 S22 AUS 29650 CIGM90.586-0SY 159582 1 S23 AUS 29669 CIGM90.909-0SY 161093 8 S24 AUS 29673 CIGM92.1742-0SY 161682 1
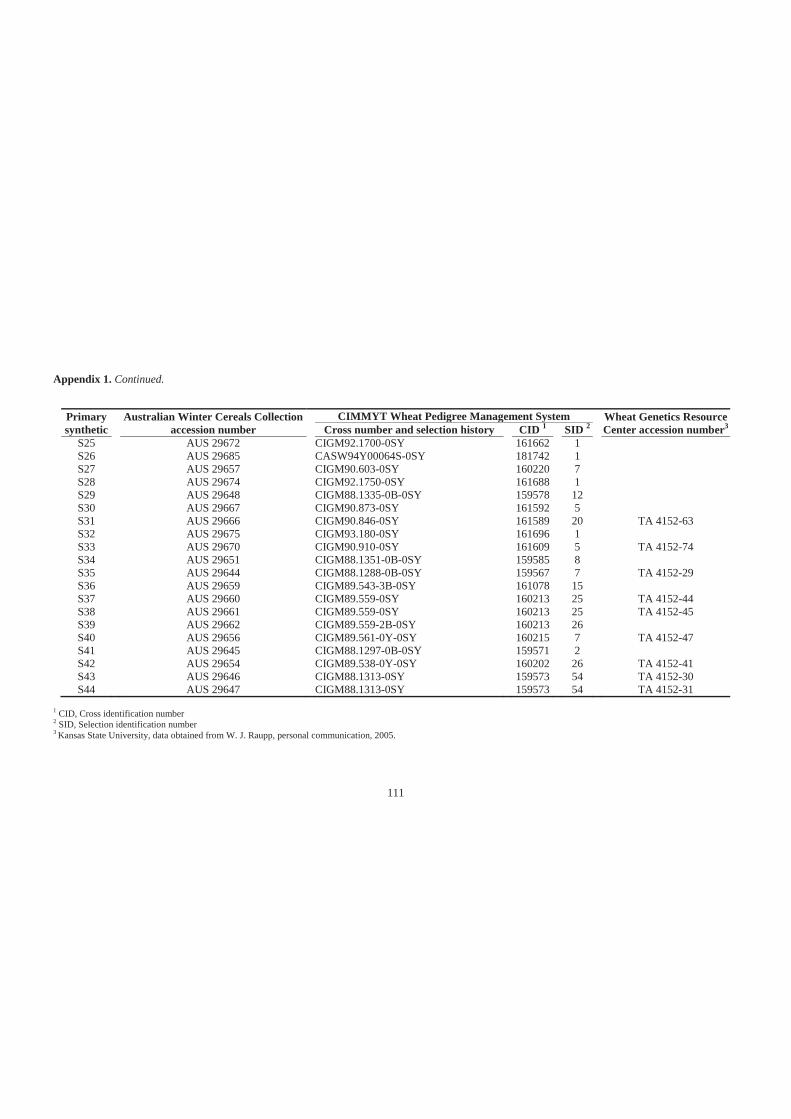
111
Appendix 1. Continued.
Primary synthetic
Australian Winter Cereals Collection accession number
CIMMYT Wheat Pedigree Management System
Wheat Genetics Resource Center accession number3 Cross number and selection history CID 1 SID 2
S25 AUS 29672 CIGM92.1700-0SY 161662 1 S26 AUS 29685 CASW94Y00064S-0SY 181742 1 S27 AUS 29657 CIGM90.603-0SY 160220 7 S28 AUS 29674 CIGM92.1750-0SY 161688 1 S29 AUS 29648 CIGM88.1335-0B-0SY 159578 12 S30 AUS 29667 CIGM90.873-0SY 161592 5 S31 AUS 29666 CIGM90.846-0SY 161589 20 TA 4152-63 S32 AUS 29675 CIGM93.180-0SY 161696 1 S33 AUS 29670 CIGM90.910-0SY 161609 5 TA 4152-74 S34 AUS 29651 CIGM88.1351-0B-0SY 159585 8 S35 AUS 29644 CIGM88.1288-0B-0SY 159567 7 TA 4152-29 S36 AUS 29659 CIGM89.543-3B-0SY 161078 15 S37 AUS 29660 CIGM89.559-0SY 160213 25 TA 4152-44 S38 AUS 29661 CIGM89.559-0SY 160213 25 TA 4152-45 S39 AUS 29662 CIGM89.559-2B-0SY 160213 26 S40 AUS 29656 CIGM89.561-0Y-0SY 160215 7 TA 4152-47 S41 AUS 29645 CIGM88.1297-0B-0SY 159571 2 S42 AUS 29654 CIGM89.538-0Y-0SY 160202 26 TA 4152-41 S43 AUS 29646 CIGM88.1313-0SY 159573 54 TA 4152-30 S44 AUS 29647 CIGM88.1313-0SY 159573 54 TA 4152-31
1 CID, Cross identification number 2 SID, Selection identification number 3 Kansas State University, data obtained from W. J. Raupp, personal communication, 2005.
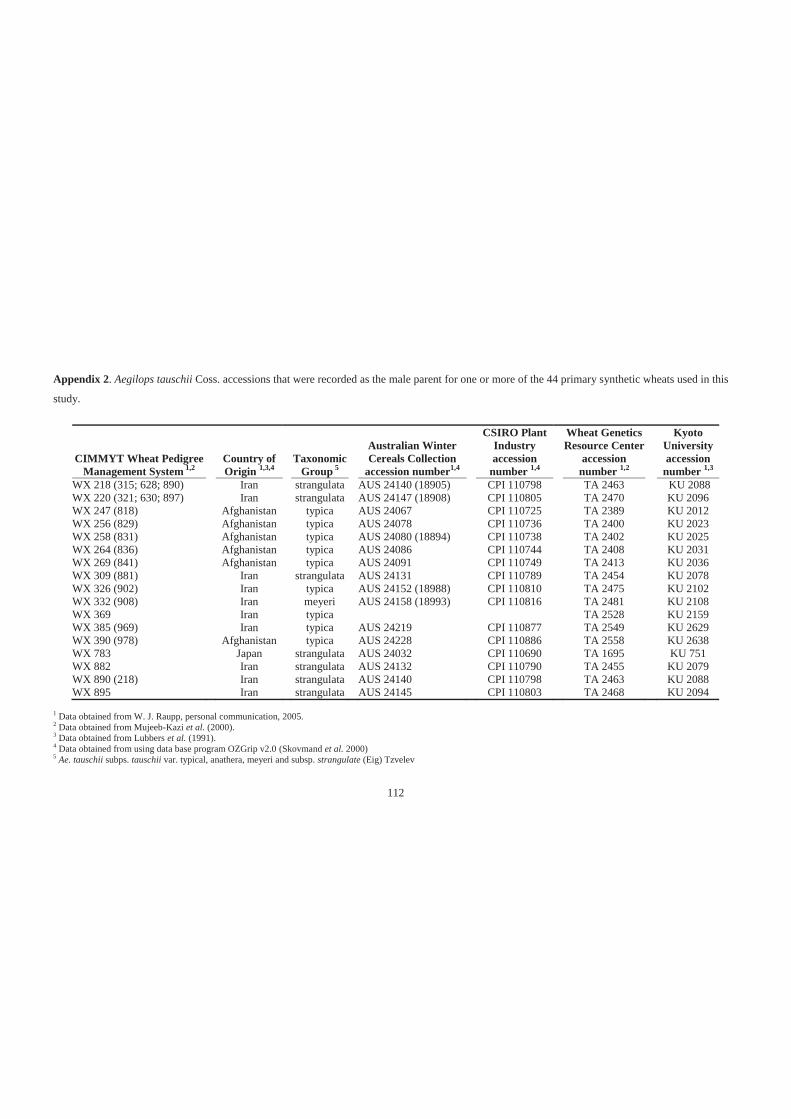
112
Appendix 2. Aegilops tauschii Coss. accessions that were recorded as the male parent for one or more of the 44 primary synthetic wheats used in this
study.
CIMMYT Wheat Pedigree Management System 1,2
Country of Origin 1,3,4
Taxonomic Group 5
Australian Winter Cereals Collection
accession number1,4
CSIRO Plant Industry accession
number 1,4
Wheat Genetics Resource Center
accession number 1,2
Kyoto University accession
number 1,3 WX 218 (315; 628; 890) Iran strangulata AUS 24140 (18905) CPI 110798 TA 2463 KU 2088 WX 220 (321; 630; 897) Iran strangulata AUS 24147 (18908) CPI 110805 TA 2470 KU 2096 WX 247 (818) Afghanistan typica AUS 24067 CPI 110725 TA 2389 KU 2012 WX 256 (829) Afghanistan typica AUS 24078 CPI 110736 TA 2400 KU 2023 WX 258 (831) Afghanistan typica AUS 24080 (18894) CPI 110738 TA 2402 KU 2025 WX 264 (836) Afghanistan typica AUS 24086 CPI 110744 TA 2408 KU 2031 WX 269 (841) Afghanistan typica AUS 24091 CPI 110749 TA 2413 KU 2036 WX 309 (881) Iran strangulata AUS 24131 CPI 110789 TA 2454 KU 2078 WX 326 (902) Iran typica AUS 24152 (18988) CPI 110810 TA 2475 KU 2102 WX 332 (908) Iran meyeri AUS 24158 (18993) CPI 110816 TA 2481 KU 2108 WX 369 Iran typica TA 2528 KU 2159 WX 385 (969) Iran typica AUS 24219 CPI 110877 TA 2549 KU 2629 WX 390 (978) Afghanistan typica AUS 24228 CPI 110886 TA 2558 KU 2638 WX 783 Japan strangulata AUS 24032 CPI 110690 TA 1695 KU 751 WX 882 Iran strangulata AUS 24132 CPI 110790 TA 2455 KU 2079 WX 890 (218) Iran strangulata AUS 24140 CPI 110798 TA 2463 KU 2088 WX 895 Iran strangulata AUS 24145 CPI 110803 TA 2468 KU 2094
1 Data obtained from W. J. Raupp, personal communication, 2005.
2 Data obtained from Mujeeb-Kazi et al. (2000). 3 Data obtained from Lubbers et al. (1991). 4 Data obtained from using data base program OZGrip v2.0 (Skovmand et al. 2000) 5 Ae. tauschii subps. tauschii var. typical, anathera, meyeri and subsp. strangulate (Eig) Tzvelev
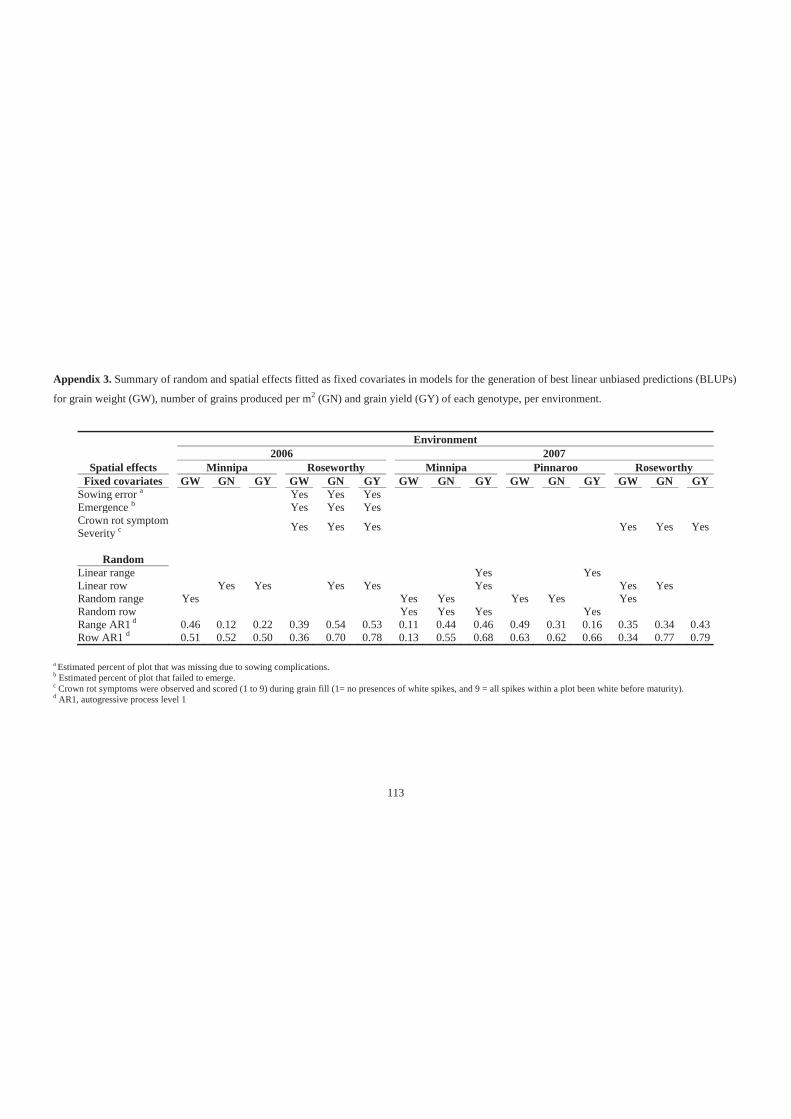
113
Appendix 3. Summary of random and spatial effects fitted as fixed covariates in models for the generation of best linear unbiased predictions (BLUPs)
for grain weight (GW), number of grains produced per m2 (GN) and grain yield (GY) of each genotype, per environment.
Environment
Spatial effects 2006 2007 Minnipa Roseworthy Minnipa Pinnaroo Roseworthy
Fixed covariates GW GN GY GW GN GY GW GN GY GW GN GY GW GN GY Sowing error a Yes Yes Yes Emergence b Yes Yes Yes Crown rot symptom Severity c
Yes Yes Yes Yes Yes Yes
Random
Linear range Yes Yes Linear row Yes Yes Yes Yes Yes Yes Yes Random range Yes Yes Yes Yes Yes Yes Random row Yes Yes Yes Yes Range AR1 d 0.46 0.12 0.22 0.39 0.54 0.53 0.11 0.44 0.46 0.49 0.31 0.16 0.35 0.34 0.43 Row AR1 d 0.51 0.52 0.50 0.36 0.70 0.78 0.13 0.55 0.68 0.63 0.62 0.66 0.34 0.77 0.79
a Estimated percent of plot that was missing due to sowing complications. b Estimated percent of plot that failed to emerge. c Crown rot symptoms were observed and scored (1 to 9) during grain fill (1= no presences of white spikes, and 9 = all spikes within a plot been white before maturity). d AR1, autogressive process level 1
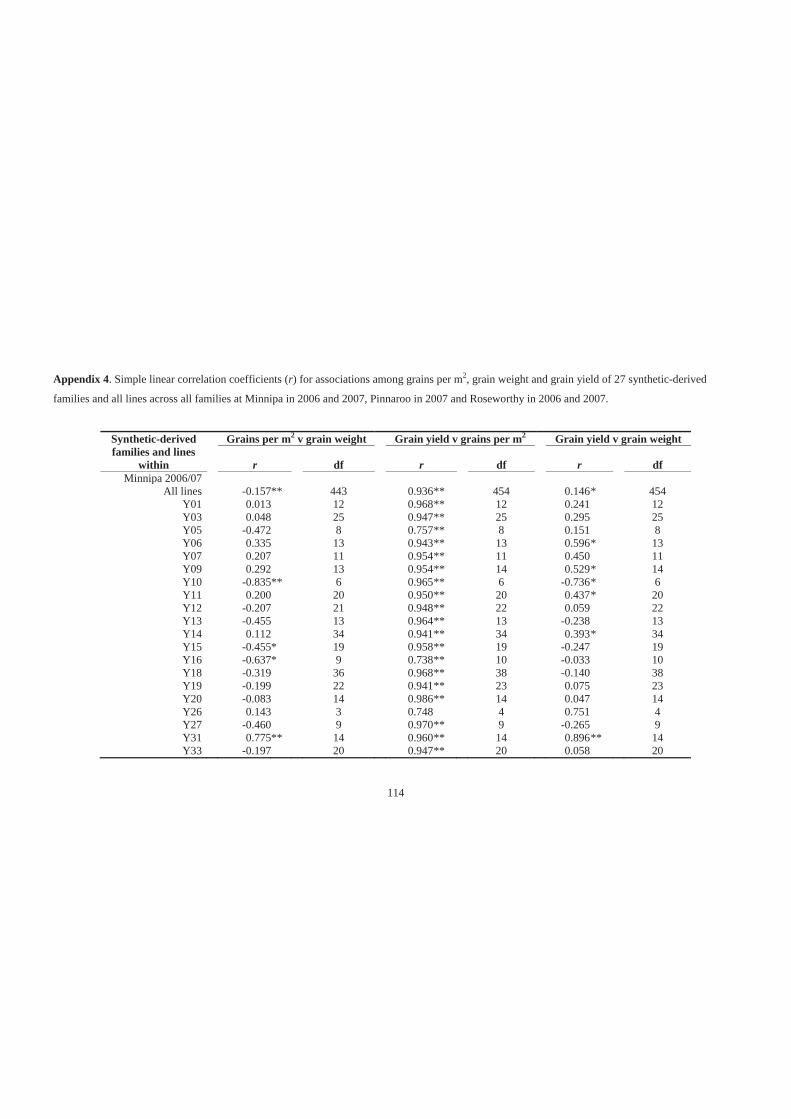
114
Appendix 4. Simple linear correlation coefficients (r) for associations among grains per m2, grain weight and grain yield of 27 synthetic-derived
families and all lines across all families at Minnipa in 2006 and 2007, Pinnaroo in 2007 and Roseworthy in 2006 and 2007.
Synthetic-derived families and lines
within
Grains per m2 v grain weight Grain yield v grains per m2 Grain yield v grain weight
r df r df r df Minnipa 2006/07
All lines -0.157** 443 0.936** 454 0.146 * 454 Y01 0.013 12 0.968** 12 0.241 12 Y03 0.048 25 0.947** 25 0.295 25 Y05 -0.472 8 0.757** 8 0.151 8 Y06 0.335 13 0.943** 13 0.596 * 13 Y07 0.207 11 0.954** 11 0.450 11 Y09 0.292 13 0.954** 14 0.529 * 14 Y10 -0.835** 6 0.965** 6 -0.736 * 6 Y11 0.200 20 0.950** 20 0.437 * 20 Y12 -0.207 21 0.948** 22 0.059 22 Y13 -0.455 13 0.964** 13 -0.238 13 Y14 0.112 34 0.941** 34 0.393 * 34 Y15 -0.455* 19 0.958** 19 -0.247 19 Y16 -0.637* 9 0.738** 10 -0.033 10 Y18 -0.319 36 0.968** 38 -0.140 38 Y19 -0.199 22 0.941** 23 0.075 23 Y20 -0.083 14 0.986** 14 0.047 14 Y26 0.143 3 0.748 4 0.751 4 Y27 -0.460 9 0.970** 9 -0.265 9 Y31 0.775** 14 0.960** 14 0.896 ** 14 Y33 -0.197 20 0.947** 20 0.058 20
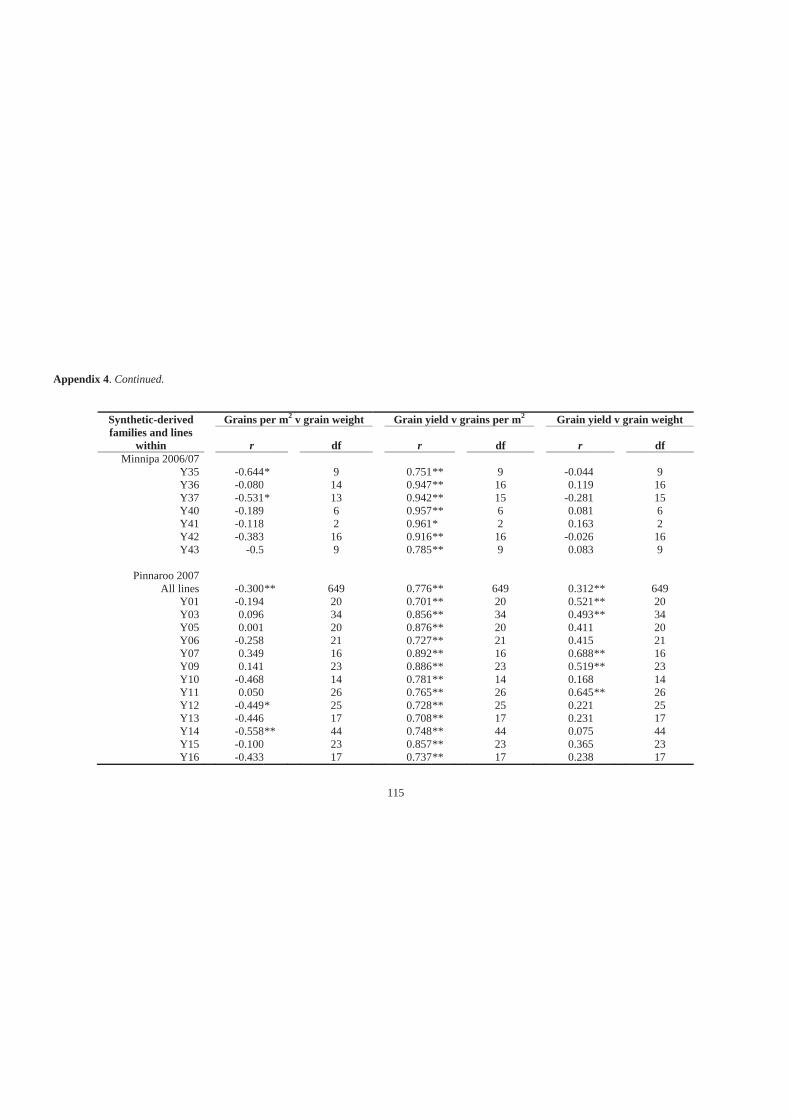
115
Appendix 4. Continued.
Synthetic-derived families and lines
within
Grains per m2 v grain weight Grain yield v grains per m2 Grain yield v grain weight
r df r df r df Minnipa 2006/07
Y35 -0.644 * 9 0.751 ** 9 -0.044 9 Y36 -0.080 14 0.947 ** 16 0.119 16 Y37 -0.531 * 13 0.942 ** 15 -0.281 15 Y40 -0.189 6 0.957 ** 6 0.081 6 Y41 -0.118 2 0.961 * 2 0.163 2 Y42 -0.383 16 0.916 ** 16 -0.026 16 Y43 -0.5 9 0.785 ** 9 0.083 9
Pinnaroo 2007
All lines -0.300 ** 649 0.776 ** 649 0.312** 649 Y01 -0.194 20 0.701 ** 20 0.521** 20 Y03 0.096 34 0.856 ** 34 0.493** 34 Y05 0.001 20 0.876 ** 20 0.411 20 Y06 -0.258 21 0.727 ** 21 0.415 21 Y07 0.349 16 0.892 ** 16 0.688** 16 Y09 0.141 23 0.886 ** 23 0.519** 23 Y10 -0.468 14 0.781 ** 14 0.168 14 Y11 0.050 26 0.765 ** 26 0.645** 26 Y12 -0.449 * 25 0.728 ** 25 0.221 25 Y13 -0.446 17 0.708 ** 17 0.231 17 Y14 -0.558 ** 44 0.748 ** 44 0.075 44 Y15 -0.100 23 0.857 ** 23 0.365 23 Y16 -0.433 17 0.737 ** 17 0.238 17
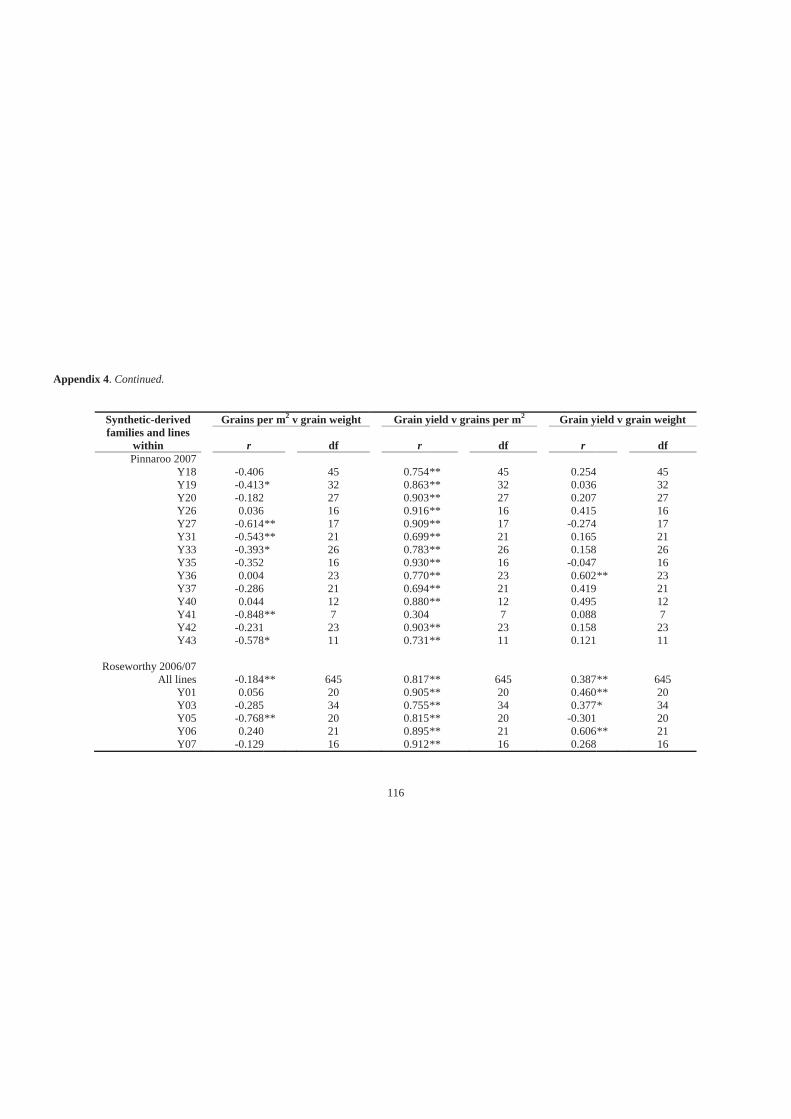
116
Appendix 4. Continued.
Synthetic-derived families and lines
within
Grains per m2 v grain weight Grain yield v grains per m2 Grain yield v grain weight
r df r df r df Pinnaroo 2007
Y18 -0.406 45 0.754 ** 45 0.254 45 Y19 -0.413 * 32 0.863 ** 32 0.036 32 Y20 -0.182 27 0.903 ** 27 0.207 27 Y26 0.036 16 0.916 ** 16 0.415 16 Y27 -0.614 ** 17 0.909 ** 17 -0.274 17 Y31 -0.543 ** 21 0.699 ** 21 0.165 21 Y33 -0.393 * 26 0.783 ** 26 0.158 26 Y35 -0.352 16 0.930 ** 16 -0.047 16 Y36 0.004 23 0.770 ** 23 0.602** 23 Y37 -0.286 21 0.694 ** 21 0.419 21 Y40 0.044 12 0.880 ** 12 0.495 12 Y41 -0.848 ** 7 0.304 7 0.088 7 Y42 -0.231 23 0.903 ** 23 0.158 23 Y43 -0.578 * 11 0.731 ** 11 0.121 11
Roseworthy 2006/07
All lines -0.184 ** 645 0.817 ** 645 0.387** 645 Y01 0.056 20 0.905 ** 20 0.460** 20 Y03 -0.285 34 0.755 ** 34 0.377* 34 Y05 -0.768 ** 20 0.815 ** 20 -0.301 20 Y06 0.240 21 0.895 ** 21 0.606** 21 Y07 -0.129 16 0.912 ** 16 0.268 16
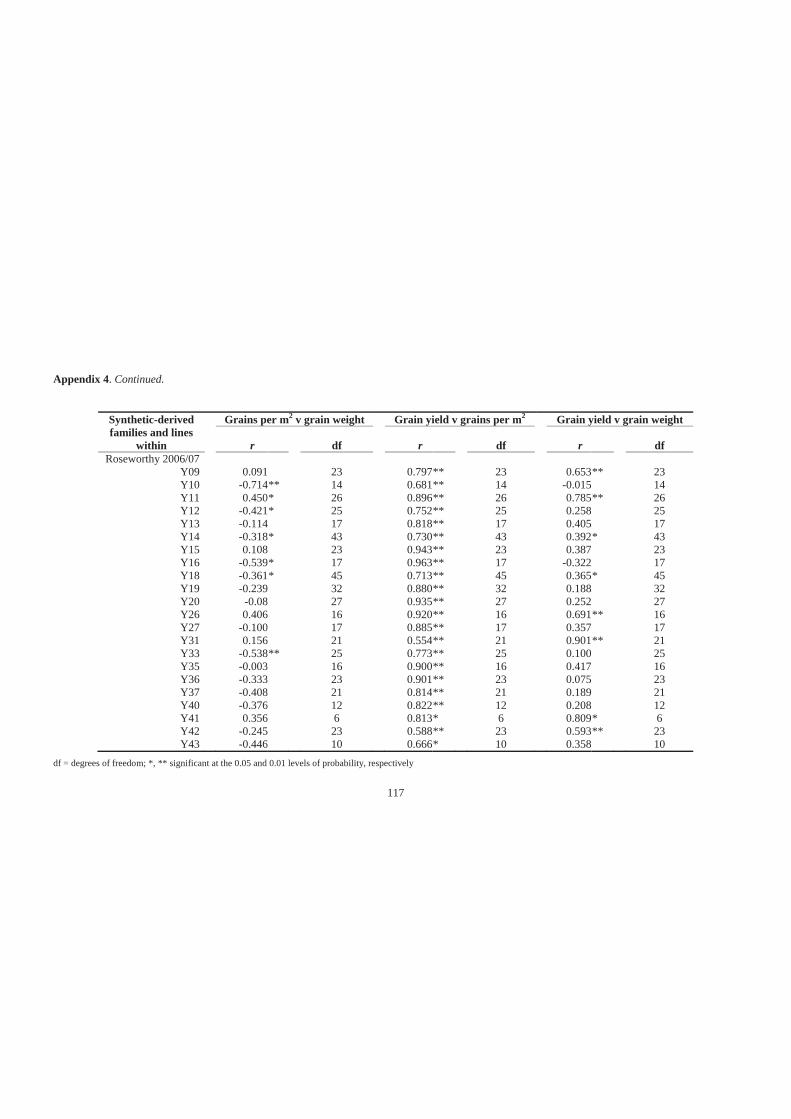
117
Appendix 4. Continued.
Synthetic-derived families and lines
within
Grains per m2 v grain weight Grain yield v grains per m2 Grain yield v grain weight
r df r df r df Roseworthy 2006/07
Y09 0.091 23 0.797 ** 23 0.653 ** 23 Y10 -0.714 ** 14 0.681 ** 14 -0.015 14 Y11 0.450 * 26 0.896 ** 26 0.785 ** 26 Y12 -0.421 * 25 0.752 ** 25 0.258 25 Y13 -0.114 17 0.818 ** 17 0.405 17 Y14 -0.318 * 43 0.730 ** 43 0.392 * 43 Y15 0.108 23 0.943 ** 23 0.387 23 Y16 -0.539 * 17 0.963 ** 17 -0.322 17 Y18 -0.361 * 45 0.713 ** 45 0.365 * 45 Y19 -0.239 32 0.880 ** 32 0.188 32 Y20 -0.08 27 0.935 ** 27 0.252 27 Y26 0.406 16 0.920 ** 16 0.691 ** 16 Y27 -0.100 17 0.885 ** 17 0.357 17 Y31 0.156 21 0.554 ** 21 0.901 ** 21 Y33 -0.538 ** 25 0.773 ** 25 0.100 25 Y35 -0.003 16 0.900 ** 16 0.417 16 Y36 -0.333 23 0.901 ** 23 0.075 23 Y37 -0.408 21 0.814 ** 21 0.189 21 Y40 -0.376 12 0.822 ** 12 0.208 12 Y41 0.356 6 0.813 * 6 0.809 * 6 Y42 -0.245 23 0.588 ** 23 0.593 ** 23 Y43 -0.446 10 0.666 * 10 0.358 10
df = degrees of freedom; *, ** significant at the 0.05 and 0.01 levels of probability, respectively
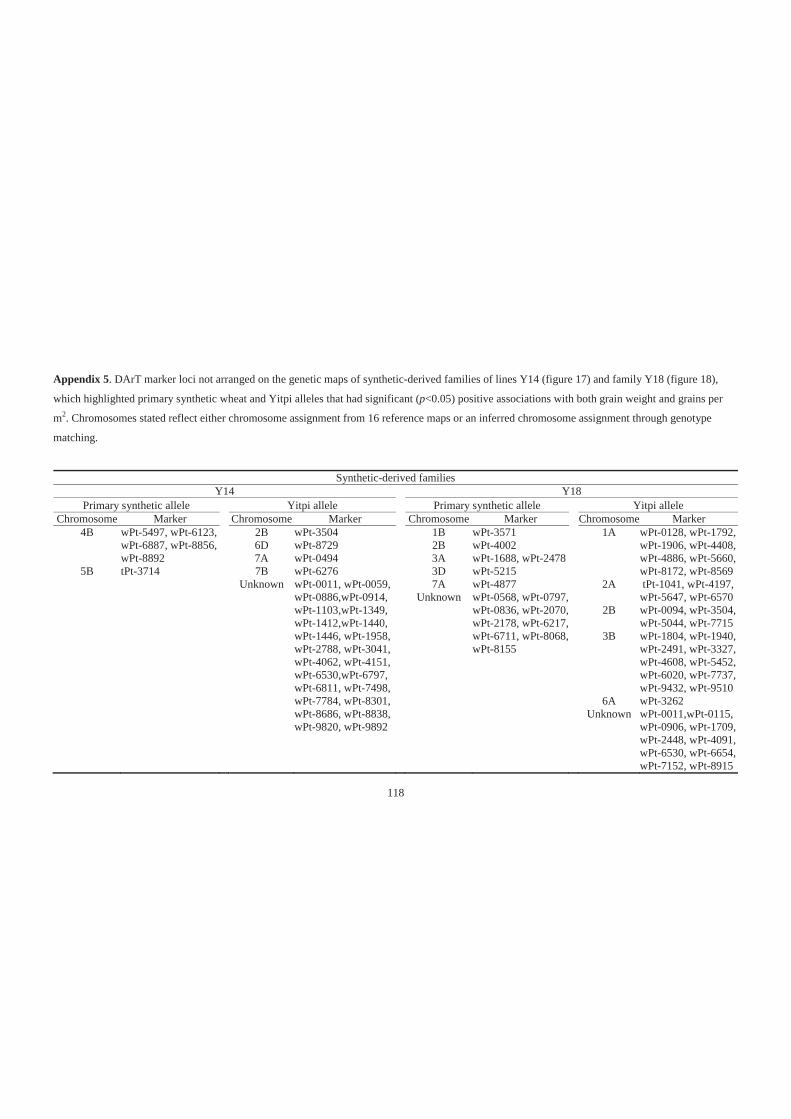
118
Appendix 5. DArT marker loci not arranged on the genetic maps of synthetic-derived families of lines Y14 (figure 17) and family Y18 (figure 18),
which highlighted primary synthetic wheat and Yitpi alleles that had significant (p<0.05) positive associations with both grain weight and grains per
m2. Chromosomes stated reflect either chromosome assignment from 16 reference maps or an inferred chromosome assignment through genotype
matching.
Synthetic-derived families Y14 Y18
Primary synthetic allele Yitpi allele Primary synthetic allele Yitpi allele Chromosome Marker Chromosome Marker Chromosome Marker Chromosome Marker
4B
5B
wPt-5497, wPt-6123, wPt-6887, wPt-8856, wPt-8892 tPt-3714
2B 6D 7A 7B
Unknown
wPt-3504 wPt-8729 wPt-0494 wPt-6276 wPt-0011, wPt-0059, wPt-0886,wPt-0914, wPt-1103,wPt-1349, wPt-1412,wPt-1440, wPt-1446, wPt-1958, wPt-2788, wPt-3041, wPt-4062, wPt-4151, wPt-6530,wPt-6797, wPt-6811, wPt-7498, wPt-7784, wPt-8301, wPt-8686, wPt-8838, wPt-9820, wPt-9892
1B 2B 3A 3D 7A
Unknown
wPt-3571 wPt-4002 wPt-1688, wPt-2478 wPt-5215 wPt-4877 wPt-0568, wPt-0797, wPt-0836, wPt-2070, wPt-2178, wPt-6217, wPt-6711, wPt-8068, wPt-8155
1A
2A
2B
3B
6A Unknown
wPt-0128, wPt-1792, wPt-1906, wPt-4408, wPt-4886, wPt-5660, wPt-8172, wPt-8569 tPt-1041, wPt-4197, wPt-5647, wPt-6570 wPt-0094, wPt-3504, wPt-5044, wPt-7715 wPt-1804, wPt-1940, wPt-2491, wPt-3327, wPt-4608, wPt-5452, wPt-6020, wPt-7737, wPt-9432, wPt-9510 wPt-3262 wPt-0011,wPt-0115, wPt-0906, wPt-1709, wPt-2448, wPt-4091, wPt-6530, wPt-6654, wPt-7152, wPt-8915
119
References
ABARE, Australian Bureau of Agricultural and Resource Economics (2003). Australian crop report no. 127. pp. 12-16
ABARE, Australian Bureau of Agricultural and Resource Economics. (2007). Australian
crop and livestock report: drought update. pp. 6-8 ABARE, Australian Bureau of Agricultural and Resource Economics. (2008). Australian
crop report no. 148. pp. 21 Akbari, M., Wenzl, P., Caig, V., Carling, J., Xia, L., Yang, S., Uszynski, G., Mohler, V.,
Lehmensiek, A., Kuchel, H., Hayden, M. J., Howes, N., Sharp, P., Vaughan, P., Rathmell, B., Huttner, E. and Kilian, A. (2006). Diversity arrays technology (DArT) for high-throughput profiling of the hexaploid wheat genome. Theoretical and Applied Genetics, vol. 113, pp. 1409-1420
Allard, R. W. (1960). Principles of Plant Breeding. John Wiley & Sons Inc., United States
of America. Appels, R. and Lagudah, E. S. (1990). Manipulation of chromosomal segments from wild
wheat for the improvement of bread wheat. Australian Journal of Plant Physiology, vol. 17, pp. 253-266
Araus, J. L., Slafer, G. A., Romagosa, I. and Molist, M. (2001). Focus: estimated wheat
yields during the emergence of agriculture based on the carbon isotope discrimination of grains: evidence from a 10th millennium BP site on the Euphrates. Journal of Archaeological Science, vol. 28, pp. 341-350
Araus, J. L., Slafer, G. A., Royo, C. and Serret, M. D. (2008). Breeding for yield potential
and stress adaptation in cereals. Critical Reviews in Plant Science, vol. 27, pp. 377-412
Asseng, S., Turner, N. C., Ray, J. D. and Keating, B. A. (2002). A simulation analysis that
predicts the influence of physiological traits on the potential yield of wheat. European Journal of Agronomy, vol. 17, pp. 123-141
AWB Limited (2003). Yitpi. [Online, accessed 3rd of April, 2006]
URL:http://www.awb.com.au/NR/rdonlyres/387ABA8E-5C62-40B5-9665-5A1D37A998FB/0/Yitpi_final.PDF
Barbeau, W. E., Schwarzlaff, S.S., Uriyo, M. G., Johnson, J. M., Harris, C. H. and Griffey,
C. A. (2003). Origin and practical significance of the sticky dough factor in 1BL/1RS wheats. Journal of the Science of Food and Agriculture, vol. 83, pp. 29-38
Berzonsky, W. A. and Francki, M. G. (1999). Biochemical, molecular, and cytogenetic
technologies for characterizing 1RS in wheat: a review. Euphytica, vol. 108, pp. 1-19
120
Blanco, A., Bellomo, M. P., Cenci, A., De Giovanni, C., D'Ovidio, R., Iacono, E., Laddomada, B., Pagnotta, M. A., Porceddu, E., Sciancalepore, A., Simeone, R. and Tanzarella, O. A. (1998). A genetic linkage map of durum wheat. Theoretical and Applied Genetics, vol. 97, pp. 721-728
Börner, A., Schumann, E., Fürste, A., Cöster, H., Leithold, B., Röder, M. S. and Weber,
W. E. (2002). Mapping of quantitative trait loci determining agronomic important characters in hexaploid wheat (Triticum aestivum L.). Theoretical and Applied Genetics, vol. 105, pp. 921-936
Botstein, D., White, R. L., Skolnick, M. and Davis, R. W. (1980). Construction of a genetic
linkage map in man using restriction fragment length polymorphisms. American Journal of Human Genetics, vol. 32, pp. 314-331
Brennan, J. P. and Fox, P. N. (1998). Impact of CIMMYT varieties on the genetic diversity
of wheat in Australia, 1973-1993. Australian Journal of Agricultural Research, vol. 49, pp. 175-178
Brennan, J. P. and Quade, K. J. (2004). Impact of CIMMYT's research on Australian wheat
yields. In C.K. Black, J.F. Panozzo and G.J. Rebetzke (eds) Proceedings of 54th Australian Cereal Chemistry Conference and 11th Wheat Breeders Assembly, Canberra, Australia, pp. 95-98
Briggle, L. W. (1969). Triticale: a review. Crop Science, vol. 9, pp. 197-202 Bureau of Meteorology (2008a). 6-monthly rainfall totals for Australia. [Online, accessed
22nd of October, 2008] URL:http://www.bom.gov.au/cgi-bin/silo/rain_maps.cgi Bureau of Meteorology (2008b). Weather Station Directory. [Online, accessed 22nd of
September, 2008] URL:http://www.bom.gov.au/climate/cdo/about/sitedata.shtml Bureau of Meteorology (2008c). Average annual and monthly rainfall. [Online, accessed
22nd of October, 2008] URL:http://www.bom.gov.au/climate/map/rainfall/IDCJCM0004_rainfall.shtml
Bureau of Meteorology ( 2008d). Weather station data. [Online, accessed 1st of September,
2008] URL:http://www.bom.gov.au/climate/data/weather-data.shtml Bureau of Rural Sciences (2008). The grains industry. [Online, accessed 22nd of October,
2008] URL:http://signposts4ag.com/signposts-grains/glossary/the-grains-industry Burow, M. D., Simpson, C. E., Starr, J. L. and Paterson, A. H. (2001). Transmission
genetics of chromatin from a synthetic amphidiploid to cultivated peanut (Arachis hypogaea L.): broadening the gene pool of a monophyletic polyploid species. Genetics, vol. 159, pp. 823-837
Butler, D., Cullis, B. R., Gilmour, A. R. and Gogel, B. (2007). Analysis of mixed models
for S language environments: ASReml-R reference manual. Queensland Department of Primary Industries and Fisheries, NSW Department of Primary Industries, Australia
121
Calderini, D. F. and Reynolds, M. P. (2000). Changes in grain weight as a consequence of de-graining treatments at pre- and post-anthesis in synthetic hexaploid lines of wheat (Triticum durum x T. tauschii). Australian Journal of Plant Physiology, vol. 27, pp. 183-191
Calderini, D. F. and Ortiz-Monasterio, I. (2003). Crop physiology & metabolism: grain
position affects grain macronutrient and micronutrient concentrations in wheat. Crop Science, vol. 43, pp. 141-151
Campbell, K. G., Bergman, C. J., Gualberto, D. G., Anderson, J. A., Giroux, M. J.,
Hareland, G., Fulcher, R. G., Sorrells, M. E. and Finney, P. L. (1999). Quantitative trait loci associated with kernel traits in a soft x hard wheat cross. Crop Science, vol. 39, pp. 1184-1195
Chabane, K., Abdalla, O., Sayed, H. and Valkoun, J. (2007). Assessment of EST-
microsatellites markers for discrimination and genetic diversity in bread and durum wheat landraces from Afghanistan. Genetic Resources and Crop Evolution, vol. 54, pp. 1073-1080
Chalmers, K. J., Campbell, A. W., Kretschmer, J., Karakousis, A., Henschke, P. H.,
Pierens, S., Harker, N., Pallotta, M., Cornish, G. B., Shariflou, M. R., Rampling, L. R., McLauchlan, A., Daggard, G., Sharp, P. J., Holton, T. A., Sutherland, M. W., Appels, R. and Langridge, P. (2001). Construction of three linkage maps in bread wheat, Triticum aestivum. Australian Journal of Agricultral Research, vol. 52, pp. 1089-1119
CIMMYT (2004). The CIMMYT wheat program. [Online, accessed 6th of January, 2005]
URL:http://www.cimmyt.org/Research/Wheat/map/about/BROCHURE97wheat/htm/BROCHURE97wheat.htm
Cooper, M., Byth, D. E., DeLacy, I. H. and Woodruff, D. R. (1993). Predicting grain yield
in Australian environments using data from CIMMYT international wheat performance trials. 1. Potential for exploiting correlated response to selection. Field Crops Research, vol. 32, pp. 305-322
Cornish, G. (2008). 2002-2004 Synthetics Data: 2001 Comments for 2001 Primary
Synthetics. [Online, accessed 23rd of February, 2009] URL:http://gwis.lafs.uq.edu.au/index.php/2002-2004-synthetics-data
Cox, T. S., Harrell, L. G., Chen, P. and Gill, B. S. (1991). Reproductive behavior of
hexaploid/diploid wheat hybrids. Plant Breeding, vol. 107, pp. 105-118 Cox, T. S., Raupp, W. J., Wilson, D. L., Gill, B. S., Leath, S., Bockus, W. W. and
Browder, L. E. (1992). Resistance to Foliar Disease in a collection of Triticum tauschii germplasm. Plant Disease, vol. 76, pp. 1061-1064
Cox, T. S., Sorrells, M. E., Bergstrom, G. C., Sears, R. G., Gill, B. S., Walsh, E. J., Leath,
S. and Murphy, J. P. (1994). Registration of KS92WGRC21 and KS92WGRC22 Hard red winter wheat germplasms resistant to wheat spindle-streak mosaic virus, wheat soilborne mosaic virus, and powdery mildew. Crop Science, vol. 34, pp. 546
122
Cox, T. S., Sears, R. G. and Bequette, R. K. (1995). Use of winter wheat x Triticum tauschii backcross populations for germplasm evaluation. Theoretical and Applied Genetics, vol. 90, pp. 571-577
Cullis, B. R., Smith, A. B. and Coombes, N. E. (2006). On the design of early generation
variety trials with correlated data. Journal of Agricultural, Biological, and Environmental Statistics, vol. 11, pp. 381-393
Cuthbert, J. L., Somers, D. J., Brule-Babel, A. L., Brown, P. D. and Crow, G. H. (2008).
Molecular mapping of quantitative trait loci for yield and yield components in spring wheat (Triticum aestivum L.). Theoretical and Applied Genetics, vol. 117, pp. 595-608
Darwin, C. R. (1868). The Variation of Animals and Plants Under Domestication. John
Murray, London. De Riek, J., Calsyn, I., Everaert, I., Van Bockstaele, E. and De Loose, M. (2001). AFLP
based alternatives for the assessment of distinctness, uniformity and stability of sugar beet varieties. Theoretical and Applied Genetics, vol. 103, pp. 1254-1265
del Blanco, I. A. , Rajaram, S. and Kronstad, W. E. (2001). Agronomic potential of
synthetic hexaploid wheat-derived populations. Crop Science, vol. 41, pp. 670-676 Diaz-de-Leon, J. L. and Mujeeb-Kazi, A. (1997). Management of an abiotic stress in wheat
- salinity - through alien Triticeae germplasm, cytogenetic manipulations, and screening methodology development. [Online, accessed 20th of March, 2006] URL:http://wheat.pw.usda.gov/ggpages/awn/43/awn43b8.html
Dreccer, F. M., Ogbonnaya, F., Borgonone, G. and Wilson, J. (2004). Variation in shoot
and root growth in primary synthetic wheats - implications for overcoming water deficits in marginal environments. In T. Fischer (eds) Proceedings for the 4th International Crop Science Congress, Brisbane, Australia, 26 September - 1 October 2004
Dreccer, F. M., Borgognone, G. M., Ogbonnaya, F. C., Trethowan, R. M. and Winter, B.
(2007). CIMMYT-selected derived synthetic bread wheats for rainfed environments: yield evaluation in Mexico and Australia. Field Crops Research, vol. 100, pp. 218-228
Dreccer, F. M., Chapman, S. C., Ogbonnaya, F. C., Borgognone, G. M. and Trethowan, R.
M. (2008). Crop and environmental attributes underpinning genotype by environment interaction in synthetic-derived bread wheat evaluated in Mexico and Australia. Australian Journal of Agricultural Research, vol. 59, pp. 447-460
Dreisigacker, S., Zhang, P., Warburton, M. L., Skovmand, B., Hoisington, D. and
Melchinger, A. E. (2005). Genetic diversity among and within CIMMYT wheat landrace accessions investigated with SSRs and implications for plant genetic resources management. Crop Science, vol. 45, pp. 653-661
Dvorak, J., Luo, M. C., L.Yang, Z. and Zhang, H. B. (1998). The structure of the Aegilops
tauschii genepool and the evolution of hexaploid wheat. Theoretical and Applied Genetics, vol. 97, pp. 657-670
123
Dvorak, J. and Akhunov, E. D. (2005). Tempos of gene locus deletions and duplications
and their relationship to recombination rate during diploid and polyploid evolution in the Aegilops-Triticum alliance. Genetics, vol. 171, pp. 323-332
Eshed, Y. and Zamir, D. (1994). Introgressions from Lycopersicon pennellii can improve
the soluble-solids yield of tomato hybrids. Theoretical and Applied Genetics, vol. 88, pp. 891-897
Faris, J. D., Laddomada, B. and Gill, B. S. (1998). Molecular mapping of segregation
distortion loci in Aegilops tauschii. Genetics, vol. 149, pp. 319-327 Feldman, M. (2001). Origin of cultivated wheat. In A.P. Bonjean and W.J. Angus (eds)
The world wheat book: A history of wheat breeding. Lavoisier Publishing, Paris, pp. 12-16
Fernandes, M. I. B. D., Zanatta, A. C. A., Prestes, A. M., Caetano, V. D. R., Barcellos, A.
L., Angra, D. C. and Pandolfi, V. (2000). Cytogenetics and immature embryo culture Embrapa Trigo breeding program: transfer of disease resistance from related species by artificial resynthesis of hexaploid wheat (Triticum aestivum L. em. Thell). Genetics and Molecular Biology, vol. 23, pp. 1051-1062
Fischer, R. A. (1999). Chapter 13: Wheat cropping in Australia. In E.H. Satorre and G.A.
Slafer (eds) Wheat: Ecology and Physiology of Yield Determination. Food Press Products, New Yorke, USA, pp. 277-294
Francki, M. G., Walker, E., Crawford, A. C., Broughton, S., Ohm, H. W., Barclay, I.,
Wilson, R. E. and McLean, R. (2009). Comparison of genetic and cytogenetic maps of hexaploid wheat (Triticum aestivum L.) using SSR and DArT markers Molecular Genetics and Genomics, vol. 281, pp. 181-191
Franco, J., Crossa, J., Ribaut, J. M., Betran, J., Warburton, M. L. and Khairallah, M.
(2001). A method for combining molecular markers and phenotypic attributes for classifying plant genotypes. Theoretical and Applied Genetics, vol. 103, pp. 944-952
Frankel, O. H. (1970). Genetic dangers in the Green Revolution. World Agriculture, vol.
19, pp. 9-14 Frisch, M. and Melchinger, A. E. (2001). The length of the intact donor chromosome
segment around a target gene in marker-assisted backcrossing. Genetics, vol. 157, pp. 1343-1356
Fritz, A., Cox, T., Gill, B. and Sears, R. (1995). Molecular marker-facilitated analysis of
introgression in winter wheat x T. tauschii populations. vol. 35, pp. 1691-1695 Gaju, O., Reynolds, M. P., Sparkes, D. L. and Foulkes, M. J. (2009). Relationships
between large-spike phenotype, grain number, and yield potential in spring wheat. Crop Science, vol. 49, pp. 961-973
Gill, B. S. and Raupp, W. J. (1987). Direct genetic transfers from Aegilops squarrosa L. to
hexaploid wheat. Crop Science, vol. 27, pp. 445-450
124
Gilmour, A. R., Thompson, R. and Cullis, B. R. (1995). Average information REML: an
efficient algorithm for variance parameter estimation in linear mixed models. Biometrics, vol. 51, pp. 1440-1450
Gollin, D., Smale, M. and Skovmand, B. (2000). Searching an ex situ collection of wheat
genetic resources. American Journal of Agricultural Economics, vol. 82, pp. 812-827
Gororo, N. N., Eagles, H. A., Eastwood, R. F., Nicolas, M. E. and Flood, R. G. (2002). Use
of Triticum tauschii to improve yield of wheat in low-yielding environments. Euphytica, vol. 123, pp. 241-254
Gower, J. C. (1966). Some distance properties of latent root and vector methods used in
multivariate analysis. Biometrika, vol. 53, pp. 325-338 Groos, C., Robert, N., Bervas, E. and Charmet, G. (2003). Genetic analysis of grain
protein-content, grain yield and thousand-kernel weight in bread wheat. Theoretical and Applied Genetics, vol. 106, pp. 1032-1040
Gupta, P. K., Kulwal, P. L. and Rustgi, S. (2005). Wheat cytogenetics in the genomics era
and its relevance to breeding. Cytogenetic and Genome Research, vol. 109, pp. 315-327
Hai, L., Guo, H., Wagner, C., Xiao, S. and Friedt, W. (2008). Genomic regions for yield
and yield parameters in Chinese winter wheat (Triticum aestivum L.) genotypes tested under varying environments correspond to QTL in widely different wheat materials. Plant Science, vol. 175, pp. 226-232
Harlan, J. R. and Zohary, D. (1966). Distribution of wild wheats and barley. Science, vol.
153, pp. 1074-1080 Harlan, J. R. (1972). Genetic disaster. Journal of Environmental Quality, vol. 1, pp. 212-
215 Heiser, C. B. (1988). Aspects of unconscious selection and the evolution of domesticated
plants. Euphytica, vol. 37, pp. 77-81 Henderson, C. R. (1975). Best linear unbiased estimation and prediction under a selection
model. Biometrics, vol. 31, pp. 423-447 Hennessy, K., Fitzharris, B., Bates, B.C., Harvey, N., Howden, S.M., Hughes, L., Salinger,
J. and Warrick, R. (2007). Australia and New Zealand. Climate Change 2007: Impacts, Adaptation and Vulnerability. Contribution of Working Group II to the Fourth Assessment Report of the Intergovernmental Panel on Climate Change. Eds. M.L. Parry, O.F. Canziani, J.P. Palutikof, P.J. van der Linden and C.E. Hanson. Cambridge University Press, Cambridge, UK, pp. 507-540
Hirano, R., Kikuchi, A., Kawase, M. and Watanabe, K. N. (2008). Evaluation of genetic
diversity of bread wheat landraces from Pakistan by AFLP and implications for a future collection strategy. Genetic Resources and Crop Evolution, vol. 55, pp. 1007-1015
125
Hollamby, G. (2003). 'Yitpi'. Plant Varieties Journal, vol. 16, pp. 56-57 Hospital, F. (2001). Size of donor chromosome segments around introgressed loci and
reduction of linkage drag in marker-assisted backcross programs. Genetics, vol. 158, pp. 1363-1379
Huang, S., Sirikhachornkit, A., Su, X., Faris, J., Gill, B., Haselkorn, R. and Gornicki, P.
(2002). Genes encoding plastid acetyl-CoA carboxylase and 3-phosphoglycerate kinase of the Triticum/Aegilops complex and the evolutionary history of polyploid wheat. Proceedings of the National Academy of Science of the United States of America, vol. 99, pp. 8133-8138
Huang, X. Q., Kempf, H., Ganal, M. W. and Röder, M. S. (2004). Advanced backcross
QTL analysis in progenies derived from a cross between a German elite winter wheat variety and a synthetic wheat (Triticum aestivum L.). Theoretical and Applied Genetics, vol. 109, pp. 933-943
Imtiaz, M., Ogbonnaya, F. C., Oman, J. and Ginkel, M. van (2008). Characterization of
quantitative trait loci controlling genetic variation for preharvest sprouting in synthetic backcross-derived wheat lines. Genetics, vol. 178, pp. 1725-1736
Jaccoud, D., Peng, K., Feinstein, D. and Kilian, A. (2001). Diversity Arrays: a solid state
technology for sequence information independent genotyping. Nucleic Acids Research, vol. 29, pp. e25 (1-7)
Kerber, E. R. and Rowland, G. G. (1974). Origin of the free-threshing character in
hexaploid wheat. Canadian Journal of Genetics and Cytology, vol. 16, pp. 145-154 Khlestkina, E. K., Huang, X. Q., Quenum, F. J.-B., Chebotar, S., Röder, M. S. and Börner,
A. (2004). Genetic diversity in cultivated plants - loss or stability? Theoretical and Applied Genetics, vol. 108, pp. 1466-1472
Kihara, H. (1944). Discovery of the DD-analyser, one of the ancestors of vulgare wheats.
Agriculture and Horticulture, vol. 19, pp. 13-14 Kihara, H. and Lilienfeld, F. (1949). A new synthesized 6x-wheat. Hereditas (Suppliment),
vol. pp. 307–319 Knott, D. R., Bai, D. and Zale, J. (2005). The transfer of leaf and stem rust resistance from
wild emmer wheats to durum and common wheat. Canadian Journal of Plant Science, vol. 85, pp. 49-57
Kuchel, H., Williams, K. J., Langridge, P., Eagles, H. A. and Jefferies, S. P. (2007).
Genetic dissection of grain yield in bread wheat. I. QTL analysis. Theoretical and Applied Genetics, vol. 115, pp. 1029-1041
Kumar, N., Kulwal, P. L., Gaur, A., Tyagi, A. K., Khurana, J. P., Khurana, P., Balyan, H.
S. and Gupta, P. K. (2006). QTL analysis for grain weight in common wheat. Euphytica, vol. 151, pp. 135-144
126
Kumar, S., Gill, B. S. and Faris, J. D. (2007). Identifcation and characterization of segregation distortion loci along chromosome 5B in tetraploid wheat. Molecular Genetics and Genomics, vol. 278, pp. 187-196
Kunert, A., Naz, A. A., Dedeck, O., Pillen, K. and Leon, J. (2007). AB-QTL analysis in
winter wheat: I. Synthetic hexaploid wheat (T. turgidum ssp. dicoccoides x T. tauschii) as a source of favourable alleles for milling and baking quality traits. Theoretical and Applied Genetics, vol. 115, pp. 683-695
Lage, J., Warburton, M. L., Crossa, J., Skovmand, B. and Andersen, S. B. (2003).
Assessment of genetic diversity in synthetic hexaploid wheats and their Triticum dicoccum and Aegilops tauschii parents using AFLPs and agronomic traits. Euphytica, vol. 134, pp. 305-317
Lange, W. and Jochemsen, G. (1992). Use of the gene pools of Triticum turgidum ssp.
dicoccoides and Aegilops squarrosa for the breeding of common wheat (T. aestivum), through chromosome-doubled hybrids I. two strategies for the production of the amphiploids. Euphytica, vol. 59, pp. 197-212
Lelley, T., Stachel, M., Grausgruber, H. and Vollmann, J. (2000). Analysis of relationships
between Aegilops tauschii and the D genome of wheat utilizing microsatellites. Genome, vol. 43, pp. 661-668
Li, G. Q., Li, Z. F., Yang, W. Y., Zhang, Y., He, Z. H., Xu, S. C., Singh, R. P., Qu, Y. Y.
and Xia, X. C. (2006). Molecular mapping of stripe rust resistance gene YrCH42 in Chinese wheat cultivar Chuanmai 42 and its allelism with Yr24 and Yr26. Theoretical and Applied Genetics, vol. 112, pp. 1434-1440
Li, S., Jia, J., Wei, X., Zhang, X., Li, L., Chen, H., Fan, Y., Sun, H., Zhao, X., Lei, T., Xu,
Y., Jiang, F., Wang, H. and Li, L. (2007). A intervarietal genetic map and QTL analysis for yield traits in wheat. Molecular Breeding, vol. 20, pp. 167-178
Liu, B. H. (1998). Statistical genomics: linkage, mapping, and QTL analysis. CRC Press,
Boca Raton, Florida. Liu, D. C., Lan, X. J., Yang, Z. J., Zheng, Y. L., Wei, Y. M. and Zhou, Y. H. (2002). A
unique Aegilops tauschii genotype needless to immature embryo culture in cross with wheat. ACTA Botanica Sinica, vol. 44, pp. 708-713
Liu, S. B, Zhou, R. G., Dong, Y. C., Li, P. and Jia, J. Z. (2006). Development, utilization
of introgression lines using a synthetic wheat as donor. Theoretical and Applied Genetics, vol. 112, pp. 1360-1373
Lubbers, E. L., Gill, K. S., Cox, T. S. and Gill, B. S. (1991). Variation of molecular
markers among geographically diverse accessions of Triticum tauschii. Genome, vol. 34, pp. 354-361
Lyttle, T. W. (1991). Segregation distortors. Annual Review of Genetics, vol. 25, pp. 511-
581
127
Manifesto, M. M., Schlatter, A. R., Hopp, H. E., Suárez, E. Y. and Dubcovsky, J. (2001). Quantitative evaluation of genetic diversity in wheat germplasm using molecular markers. Crop Science, vol. 41, pp. 682-690
Mantel, N. A. (1967). The detection of disease clustering and a generalized regression
approach. Cancer Research, vol. 27, pp. 209-220 Mantovani, P., Maccaferri, M., Sanguineti, M. C., Tuberosa, R., Catizone, I., Wenzl, P.,
Thomson, B., Carling, J., Huttner, E., DeAmbrogio, E. and Kilian, A. (2008). An integrated DArT-SSR linkage map of durum wheat. Molecular Breeding, vol. 22, pp. 629-648
Mares, D. and Mrva, K. (2008). Genetic variation for quality traits in synthetic wheat
germplasm. Australian Journal of Agricultural Research, vol. 59, pp. 406-412 Marshall, D. R., Mares, D. J., Moss, H. J. and Ellison, F. W. (1986). Effects of grain shape
and size on milling yields in wheat. II*. Experimental studies. Australian Journal of Agricultural Research, vol. 37, pp. 331-342
Matsuoka, Y. and Nasuda, S. (2004). Durum wheat as a candidate for the unknown female
progenitor of bread wheat: an empirical study with a highly fertile F1 hybrid with Aegilops tauschii Coss. Theoretical and Applied Genetics, vol. 109, pp. 1710 -1717
Matsuoka, Y., Aghaei, M. J., Abbasi, M. R., Totiaei, A., Mozafari, J. and Ohta, S. (2008).
Durum wheat cultivation associated with Aegilops tauschii in northern Iran. Genetic Resources and Crop Evolution, vol. 55, pp. 861-868
McFadden, E. S. and Sears, E. R. (1944). The artificial synthesis of Triticum spelta.
Records of the Genetics Society of America, vol. 13, pp. 26-27 McFadden, E. S. and Sears, E. R. (1946). The origin of Triticum spelta and its free-
threshing hexaploid relatives. Journal of Heredity, vol. 37, pp. 81-89 McIntyre, C. L., Mathews, K. L., Rattey, A., Chapman, S. C., Drenth, J., Ghaderi, M.,
Reynolds, M. and Shorter, R. (2010). Molecular detection of genomic regions associated with grain yield and yield-related components in an elite bread wheat cross evaluated under irrigated and rainfed conditions. Theoretical and Applied Genetics, vol. 120, pp. 527-541
Meer, J. M., Manly, K. E. and Cudmore, Jr R. H. (2004). Map Manager QTX. version 0.30 Messmer, M. M., Keller, M., Zanetti, S. and Keller, B. (1999). Genetic linkage map of a
wheat x spelt cross. Theoretical and Applied Genetics, vol. 98, pp. 1163-1170 Miralles, D. J. and Slafer, G. A. (1995). Individual grain weight responses to genetic
reduction in culm length in wheat as affected by source-sink manipulations. Field Crops Research, vol. 43, pp. 55-66
Miralles, D. J., Katz, S. D., Colloca, A. and Slafer, G. A. (1998). Floret development in
near isogenic wheat lines differing in plant height. Field Crops Research, vol. 59, pp. 21-30
128
Moghaddam, M., Ehdaie, B. and Waines, J. (1997). Genetic variation and interrelationships of agronomic characters in landraces of bread wheat from southeastern Iran. Euphytica, vol. 95, pp. 361-369
Moody, D. and Emebiri, L. (2008a). Synthetics project. [Online, accessed 23rd of
February, 2008] URL:http://gwis.lafs.uq.edu.au/index.php/cagesections/synthetics-project
Moody, D. and Emebiri, L. (2008b). Synthetics: ZSE01 synthetic wheat project [Online,
accessed 23rd of February, 2009] URL:http://gwis.lafs.uq.edu.au/index.php/synthetics-quarantine-lists
Mrva, K., Cheong, J., Yu, B., Law, H. Y. and Mares, D. (2009). Late maturity a-amylase in
synthetic hexaploid wheat. Euphytica, vol. 168, pp. 403-411 Mueller, U. G. and Wolfenbarger, L. L. (1999). AFLP genotyping and fingerprinting.
Trends in Ecology and Evolution, vol. 17, pp. 389-394 Mujeeb-Kazi, A. (1995). Interspecific crosses: hybrid production and utilization. In A.
Mujeeb-Kazi and G.P. Hettel (eds) Utilizing Wild Grass Biodiversity in Wheat Improvement. 15 Years of Wild Cross Research at CIMMYT. CIMMYT Research Report No. 2. Mexico. pp. 14-21
Mujeeb-Kazi, A. and Hettel, G. P. (1995). Utilising wild grass biodiversity in wheat
improvement: 15 years of wide cross research at CIMMYT In: Skovmand, B., Rajaram, S., Ribaut, J. M. and Hede, A. R. (2002) 'Wheat genetic resources'. Food and Agriculture Organization of the United Nations [Online, accessed 20th of March, 2006] URL:http://www.fao.org/documents/show_cdr.asp?url_file=/DOCREP/006/Y4011E/y4011e08.htm
Mujeeb-Kazi, A., Rosas, V. and Roldan, S. (1996). Conservation of the genetic variation of
Triticum tauschii (Coss.) Schmalh. (Aegilops squarrosa acut. non L.) in synthetic hexaploid wheat (T. turgidum L. s.lat. x T. tauschii; 2n=6x=42, AABBDD) and its potential utilization for wheat improvement. Genetic Resources and Crop Evolution, vol. 43, pp. 129-134
Mujeeb-Kazi, A., Fuentes-Davila, G., Delgado, R., Rosas, V., Cano, S., Cortés, A., Juarez,
L. and Sanchez, J. (2000). Current status of D-genome based, synthetic, hexaploid wheats and the characterization of an elite subset. Annual Wheat Newsletter, vol. 46, pp. 76-79
Mujeeb-Kazi, A. and Delgado, R. (2001). A second, elite set of synthetic hexaploid wheats
based upon multiple disease resistance. Annual Wheat Newsletter, vol. 47, pp. 114-116
Mujeeb-Kazi, A., Gul, A., Farooq, M., Rizwan, S. and Ahmad, I. (2008). Rebirth of
synthetic hexaploids with global implications for wheat improvement. Australian Journal of Agricultural Research, vol. 59, pp. 391-398
129
Murphy, J. P., Griffey, C. A., Finney, P. L. and Leath, S. (1997). Agronomic and grain quality evaluations of Triticum aestivum × Aegilops tauschii backcross populations. Crop Science, vol. 37, pp. 1960-1965
Naghavi, M. R., Aghaei, M. J., Taleei, A. R., Omidi, M., Mozafari, J. and Hassani, M. E.
(2009). Genetic diversity of the D-genome in T. aestivum and Aegilops species using SSR markers. Genetic Resources and Crop Evolution, vol. 56, pp. 499-506
Narasimhamoorthy, B. , Gill, B., Fritz, A., Nelson, J. and Brown-Guedira, G. (2006).
Advanced backcross QTL analysis of a hard winter wheat x synthetic wheat population. Theoretical and Applied Genetics, vol. 112, pp. 787-796
Nei, M. and Li, W.-H. (1979). Mathematical model for studying genetic variation in terms
of restriction endonucleases. Proceedings of the National Academy of Science of the United States of America, vol. 76, pp. 5269-5273
Nevo, E. (2001). Genetic resources of wild emmer, Triticum dicoccoides, for wheat
improvement in the third millennium Israel Journal of Plant Sciences, vol. 49, pp. S77-S91
Nishikawa, K., Furato, Y. and Wada, T. (1980). Genetic studies on alpha-amylase
isozymes in wheat. III. Intraspecific variation in Aegilops squarrosa and birthplace of hexaploid wheat. Japanese Journal of Genetics, vol. 55, pp. 325-336
O’Brien, L., Morell, M., Wrigley, C. and Appels, A. (2001). Genetic pool of Australian
wheats. In W.J. Angus and A.P. Bonjean (eds) The world wheat book. Lavoisier, Paris, pp. 611-645
Ogbonnaya, F. C., Ye, G., Trethowan, R., Dreccer, F., Lush, D., Shepperd, J. and Ginkel,
M. van (2007). Yield of synthetic backcross-derived lines in rainfed environments of Australia. Euphytica, vol. 157, pp. 321-336
Oliver, R. E., Stack, R. W., Miller, J. D. and Cai, X. (2007). Reaction of wild emmer wheat
accessions to Fusarium head blight. Crop Science, vol. 47, pp. 893-899 Parker, G. D., Fox, P. N., Langridge, P., Chalmers, K., Whan, B. and Ganter, P. F. (2002).
Genetic diversity within Australian wheat breeding programs based on molecular and pedigree data. Euphytica, vol. 124, pp. 293-306
Paterson, A. H., DeVerna, J. W., Lanini, B. and Tanksley, S. D. (1990). Fine mapping of
quantitative trait loci using selected overlapping recombinant chromosomes, in an interspecies cross of tomato. Genetics, vol. 124, pp. 735-742
Patterson, H. D. and Thompson, R. (1971). Recovery of interblock information when block
sizes are unequal. Biometrika, vol. 31, pp. 100-109 Paull, J. G., Chalmers, K. J., Karakousis, A., Kretschmer, J. M., Manning, S. and
Langridge, P. (1998). Genetic diversity in Australian wheat varieties and breeding material based on RFLP data. Theoretical and Applied Genetics, vol. 96, pp. 435-446
130
Peleg, Z., Saranga, Y., Suprunova, T., Ronin, Y., Röder, M. S., Kilian, A., Korol, A. B. and Fahima, T. (2008). High-density genetic map of durum wheat x wild emmer wheat based on SSR and DArT markers. Theoretical and Applied Genetics, vol. 117, pp. 103-115
Perrino, P., Laghetti, G., D’Antuono, L. F., Al Ajlouni, M., Kanbertay, M., Szabó, A. T.
and Hammer, K. (1995). Ecogeographical distrobution of hulled wheat species. In S. Padulosi, K. Hammer and J. Heller (eds) Proceedings of the First International Workshop on Hulled Wheats, Castelvecchio Pascoli, Tuscany, Italy, pp. 100-118
Pestsova, E., Ganal, M. W. and Roder, M. S. (2000). Isolation and mapping of
mircosatellite markers specific for the D genome of bread wheat. Genome, vol. 43, pp. 689-697
Piepho, H. P., Mohring, J., Melchinger, A. E. and Buchse, A. (2008). BLUP for phenotypic
selection in plant breeding and variety testing. Euphytica, vol. 161, pp. 209-228 Plant Research International (2002). MapChart version 2.1. Wageningen UR - Plant
Research International BV Pritchard, D. J., Hollington, P. A., Davies, W. P., Gorham, J., L. J. Diaz de Leon and
Mujeeb-Kazi, A. (2002). K+/Na+ discrimination in synthetic hexaploid wheat lines: transfer of the trait for K+/Na+ discrimination from Aegilops tauschii into a Triticum turgidum background. Cereal Research Communications, vol. 30, pp. 261-267
R Development Core Team (2008). R: A language and environment for statistical
computing. R Foundation for Statistical Computing, Vienna, Austria. ISBN 3-900051-07-0
Rattey A, Shorter R (2010) Evaluation of CIMMYT conventional and synthetic spring
wheat germplasm in rainfed sub-tropical environments. I. Grain yield. Field Crops Research, vol. 118, pp. 273-281
Reader, S. M. and Miller, T. E. (1991). The introduction of bread wheat a major gene for
resistance to powdery mildew from wild emmer wheat. Euphytica, vol. 53, pp. 57-60
Reeves, T. G., Rajaram, S., van Ginkel, M., Trethowan, R., Braun, H-. J. and Cassaday, K.
(1999). New wheats for a secure, sustainable future. pp. 1-35 Reif, J. C., Zhang, P., Dreisigacker, S., Warburton, M. L., Ginkel, M. van, Hoisington, D.,
Bohn, M. and Melchinger, A. E. (2005). Wheat genetic diversity trends during domestication and breeding. Theoretical and Applied Genetics, vol. 110, pp. 859-864
Reinhold, M., Sharp, E. L. and Gerechter-Amitai, Z. K. (1983). Transfer of additive
"minor-effect" genes for resistance to Puccinia striiformis from Triticum dicoccoides into Triticum durum and Triticum aestivum. Canadian Journal of Botany, vol. 61, pp. 2702-2708

131
Reynolds, M., Dreccer, F. and Trethowan, R. (2007). Drought-adaptive traits derived from wheat wild relatives and landraces. Journal of Experimental Botany, vol. 58, pp. 117-186
Reynolds, M. P., Skovmand, B., Trethowan, R. and Pfeiffer, W. (1999). Evaluating a
conceptual model for drought tolerance. In. J.M. Ribaut (eds) Using molecular markers to improve drought tolerance. CIMMYT, Mexico, D.F.
Reynolds, M. P., Mujeeb-Kazi, A. and Sawkins, M. (2005). Prospects for utilising plant-
adaptive mechanisms to improve wheat and other crops in drought- and salinity-prone environments. Annals of Applied Biology, vol. 146, pp. 239-259
Röder, M., Korzun, V., Wendehake, K., Plaschke, J., Tixier, M., Leroy, P. and Ganal, M.
(1998). A microsatellite map of wheat. Genetics, vol. 149, pp. 2007-2023 Röder, M. S., Huang, X-. Q. and Börner, A. (2008). Fine mapping of the region on wheat
chromosome 7D controlling grain weight. Functional and Integrative Genomics, vol. 8, pp. 79-86
Rogowsky, P. M., Guider, E. L. Y., Langridge, P., Shepherd, K. W. and Koebner, R. M. D.
(1991). Isolation and characterization of wheat-rye recombinants involving chromosome arm 1DS of wheat. Theoretical and Applied Genetics, vol. 82, pp. 537-544
Rohlf, F. J. (2005). NTSYS-pc, numerical taxonomy and multivariate analysis system.
Exeter software version 2.2, Setauket, New York, USA. Roussel, V., Leisova, L., Exbrayat, F., Stehno, Z. and Balfourier, F. (2005). SSR allelic
diversity changes in 480 European bread wheat varieties released from 1840 to 2000. Theoretical and Applied Genetics, vol. 111, pp. 162-170
Saffdar, H., Ashfaq, M., Hameed, S., ul Haque, I. and Mujeeb-Kazi, A. (2009). Molecular
analysis of genetic diversity in elite II synthetic hexaploid wheat screened against Barley yellow dwarf virus. African Journal of Biotechnology, vol. 8, pp. 3244-3250
Salamini, F., Özkan, H., Brandolini, A., Schäfer-Pregl, R. and Martin, M. (2002). Genetics
and geography of wild cereal domestication in the Near East. Nature Review Genetics, vol. 3, pp. 429-441
Semagn, K., Bjørnstad, Å. and Ndjiondjop, M. N. (2006a). Principles, requirements and
prospects of genetic mapping in plants. African Journal of Biotechnology, vol. 5, pp. 2569-2587
Semagn, K., Bjørnstad, Å., Skinnes, H., Marøy, A. G., Tarkegne, Y. and William, M.
(2006b). Distribution of DArT, AFLP, and SSR markers in a genetic linkage map of a doubled-haploid hexaploid wheat population. Genome, vol. 49, pp. 545-555
Singh, R. P., Nelson, J. C. and Sorrells, M. E. (2000). Mapping Yr28 and other genes for
resistance to stripe rust in wheat. Crop Science, vol. 40, pp. 1148-1155 Skovmand, B., Mackay, M. C., Sanchez, H., van Niekerk, H., He, Z., Flores, M., Herrera,
R., Clavel, A., Lopez, C. G., Alarcon, J. C., Grimes, G. and Fox, P. N. (2000).
132
GRIP II: genetic resources package for Triticum and related species. In B. Skovmand, M. C. Mackay, C. Lopez and A. McNab, eds. 2000. Tools for the new millennium. On CD. Mexico, DF, CIMMYT.
Slafer, G. A., Calderini, D. F. and Miralles, D. J. (1996). Yield components and
compensation in wheat: opportunities for further increasing yield potential. In M.P. Reynolds, S. Rajaram and A. McNab (eds) Increasing yield potential in wheat: breaking the barriers. Mexico, D.F.:CIMMYT, pp. 101-133
Smale, M., Reynolds, M. P., Warburton, M., Skovmand, B., Trethowan, R., Singh, R. P.,
Ortiz-Monasterio, I. and Crossa, J. (2002). Dimensions of diversity in modern spring bread wheat in developing countries from 1965. Crop Science, vol. 42, pp. 1766-1779
Sneath, P. H. A. and Sokal, R. R. (1973). Numerical Taxonomy. In (eds) Freeman, San
Francisco, pp. 573 Sokal, R. R. and Michener, C. D. (1958). A statistical method for evaluating statistical
relationships. University of Kansas Science Bulletin, vol. 38, pp. 1409-1438 Song, Q. J., Shi, J. R., Singh, S., Fickus, E. W., Costa, J. M., Lewis, J., Gill, B. S., Ward,
R. and Cregan, P. B. (2005). Development and mapping of microsatellite (SSR) markers in wheat. Theoretical and Applied Genetics, vol. 110, pp. 550-560
Stodart, B. J., Mackay, M. C. and Raman, H. (2007). Assessment of molecular diversity in
landraces of bread wheat (Triticum aestivum L.) held in an ex situ collection with Diversity Arrays Technology (DArT). Australian Journal of Agricultral Research, vol. 58, pp. 1174-1182
Sun, X. -Y., Wu, K., Zhao, Y., Kong, F. -M., Han, G. -Z., Jiang, H. -M., Huang, X. -J., Li,
R. -J., Wang, H. -G. and Li, S. -S. (2009). QTL analysis of kernel shape and weight using recombinant inbred lines in wheat. Euphytica, vol. 165, pp. 615-624
Talbert, L. E., Smith, L. Y. and Blake, N. K. (1998). More than one origin of hexaploid
wheat is indicated by sequence comparison of low-copy DNA. Genome, vol. 41, pp. 402-407
Tanksley, S., Grandillo, S., Fulton, T., Zamir, D., Eshed, Y., Petiard, V., Lopez, J. and
Beck-Bunn, T. (1996). Advanced backcross QTL analysis in a cross between an elite processing line of tomato and its wild relative L. pimpinellifolium. Theoretical and Applied Genetics, vol. 92, pp. 213-224
Tanksley, S. D. and Nelson, J. C. (1996). Advanced backcross QTL analysis: a method for
the simultaneous discovery and transfer of valuable QTLs from unadapted germplasm into elite breeding lines. Theoretical and Applied Genetics, vol. 92, pp. 191-203
Tanksley, S. D. and McCouch, S. R. (1997). Seed banks and molecular markers: unlock
genetic potential from the wild. Sciemce, vol. 277, pp. 1063-1066
133
Tian, Q. Z., Zhou, R. H. and Jia, J. Z. (2005). Genetic diversity trend of common wheat (Triticum aestivum L.) in China revealed with AFLP markers. Genetic Resources and Crop Evolution, vol. 52, pp. 325-331
Trethowan, R. M. (2004). Selecting wheat with improved adaptation to moisture limited
environments: CIMMYT’s approach and experience. In C.K. Black, J.F. Panozzo and G.J. Rebetzke (eds) Proceedings of 54th Australian Cereal Chemistry Conference and 11th Wheat Breeders Assembly, Canberra, Australia, pp. 191-194
Trethowan, R. M. and Mujeeb-Kazi, A. (2008). Novel germplasm resources for improving
environmental stress tolerance of hexaploid wheat. Crop Science, vol. 48, pp. 1255-1265
Triticarte Pty Ltd (2008). Triticarte wheat alignment map. Version 1.2. [Online, accessed
16th February, 2008] URL:http://www.triticarte.com.au/content/wheat_diversity_analysis.html
Triticarte Pty Ltd (2009). Wheat DArT(R). [Online, accessed 3rd of February, 2010]
URL:http://www.triticarte.com.au/content/wheat_diversity_analysis.html Tyagi, B. S., Singh, G. and Shoran, J. (2004). Exploiting diversity in wheat: synthetic
wheats as potential donors for some economic traits for the Indian subcontinent. [Online, accessed 29th December, 2005] URL:http://wheat.pw.usda.gov/ggpages/awn/50/Textfiles/INDIA.html#anchor70162
Ullstrup, A. J. (1972). The impacts of the southern corn leaf blight epidemics of 1970-
1971. Annual Review of Phytopathology, vol. 10, pp. 37-50 Van Deynze, A. E., Dubcovsky, J., Gill, K. S., Nelson, J. C., Sorrells, M. E., Dvorak, J.,
Gill, B. S., Lagudah, E. S., McCouch, S. R. and Appels, R. (1995). Molecular-genetic maps for group 1 chromosomes of Triticeae species and their relation to chromosomes in rice and oat. Genome, vol. 38, pp. 45-59
van Ginkel, M. and Ogbonnaya, F. (2007). Novel genetic diversity from synthetic wheats
in breeding cultivars for changing production conditions. Field Crops Research, vol. 104, pp. 86-94
Villareal, R. L. (1994). Chapter 3: Expanding the genetic base of CIMMYT bread wheat
germplasm. pp. 16-21 Villareal, R. L., Mujeeb-Kazi, A., Deltoro, E., Crossa, J. and Rajaram, S. (1994a).
Agronomic variability in selected Triticum turgidum x T. tauschii synthetic hexaploid wheats. Journal of Agronomy and Crop Science, vol. 173, pp. 307-317
Villareal, R. L., Mujeeb-Kazi, A., Rajaram, S. and Del Toro, E. (1994b). Morphological
variability in some synthetic hexaploid wheats derived from Triticum turgidum x T. tauschii. Journal of Genetics and Breeding, vol. 48, pp. 7-16
von Korff, M., Wang, H., Leon, J. and Pillen, K. (2004). Development of candidate
introgression lines using an exotic barley accession ( Hordeum vulgare ssp. spontaneum) as donor. Theoretical and Applied Genetics, vol. 109, pp. 1736-1745
134
Voorrips, R. E. (2002). MapChart: software for the graphical presentation of linkage maps
and QTLs. Journal of Heredity, vol. 93, pp. 77-78 Wang, R. X., Hai, L., Zhang, X. Y., You, G. X., Yan, C. S. and Xiao, S. H. (2009). QTL
mapping for grain filling rate and yield-related traits in RILs of the Chinese winter wheat population Heshangmai x Yu867. Theoretical and Applied Genetics, vol. 118, pp. 313-325
Warburton, M. L., Crossa, J., Franco, J., Kazi, M., Trethowan, R., Rajaram, S., Pfeiffer,
W., Zhang, P., Dreisigacker, S. and Ginkel, M. van (2006). Bringing wild relatives back into the family: recovering genetic diversity in CIMMYT improved wheat germplasm. Euphytica, vol. 149, pp. 289-301
Wenzl, P., Carling, J., Kudrna, D., Jaccoud, D., Huttner, E., Kleinhofs, A. and Kilian, A.
(2004). Diversity Arrays Technology (DArT) for whole-genome profiling of barley. Proceedings of the National Academy of Science of the United States of America, vol. 101, pp. 9915-9920
Wenzl, P., Li, H., Carling, J., Zhou, M., Raman, H., Paul, E., Hearnden, P., Maier, C., Xia,
L., Caig, V., Ovesna, J., Cakir, M., Poulsen, D., Wang, J., Raman, R., Smith, K. P., Muehlbauer, G. J., Chalmers, K. J., Kleinhofs, A., Huttner, E. and Kilian, A. (2006). A high-density consensus map of barley linking DArT markers to SSR, RFLP and STS loci and agricultural traits. BMC Genomics, vol. 7, pp. 206
White, J., Law, J. R., MacKay, I., Chalmers, K. J., Smith, J. S. C., Kilian, A. and Powell,
W. (2008). The genetic diversity of UK, US and Australian cultivars of Triticum aestivum meaured by DArT markers and considered by genome. Theoretical and Applied Genetics, vol. 116, pp. 439-453
Wiersma, J. J., Busch, R. H., Fulcher, G. G. and Hareland, G. A. (2001). Recurrent
selection for kernel weight in spring wheat. Crop Science, vol. 41, pp. 999-1005 Worland, T. and Snape, J. W. (2001). Genetic basis of worldwide wheat varietal
improvement. In A.P. Bonjean and W.J. Angus (eds) The world wheat book. Lavoisier Publishing, Paris, pp. 68-70
Yan, Y., Hsam, S. L. K., Yu, J., Jiang, Y. and Zeller, F. J. (2003). Allelic variation of the
HMW glutenin subunits in Aegilops tauschii accessions detected by sodium dodecyl sulphate (SDS-PAGE), acid polyacrylamide gel (A-PAGE) and capillary electrophoresis. Euphytica, vol. 130, pp. 377-385
Yang, J., Sears, R.G., Gill, B.S. and Paulsen, G.M. (2002). Growth and senescence
characteristics associated with tolerance of wheat-alien amphiploids to high temperature under controlled conditions. Euphytica, vol. 126, pp. 185-193
Yang, W-. Y., Yu, Y., Zhang, Y., Hu, X-. R., Wang, Y., Zhou, Y-. C. and Lu, B-. R.
(2003a). Inheritance and expression of stripe rust resistance in common wheat (Triticum aestivum) transferred from Aegilops tauschii and its utilization. Hereditas, vol. 139, pp. 49-55
135
Yang, W., Liu, D., Li, J., Zhang, L., Wei, H., Hu, X., Zheng, Y., He, Z. and Zou, Y. (2009). Synthetic hexaploid wheat and its utilization for wheat genetic improvement in China. Journal of Genetics and Genomics, vol. 36, pp. 539-546
Yang, W. -Y., Yu, Y., Zhang, Y., Hu, X. -R., Wang, Y., Zhou, Y. -C. and Lu, B. -U.
(2003b). Inheritance and expression of stripe rust resistance in common wheat (Triticum aestivum) transferred from Aegilops tauschii and its utilization. Hereditas, vol. 139, pp. 49-55
Zamir, D. (2001). Improving plant breeding with exotic genetic libraries. Nature Review
Genetics, vol. 2, pp. 983-989 Zeller, F. J. (1973). 1B/1R wheat-rye chromosome substitutions and translocations. In E.R.
Sears and L.M.S. Sears (eds) Proceedings of the 4th International Wheat Genetics Symposium, Columbia, Missouri, pp. 209-221
Zhang, Z., Friesen, T. L., Simons, K. J., Xu, S. S. and Faris, J. D. (2009). Development,
identification, and validation of markers for marker-assisted selection against the Stagonospora nodorum toxin sensitivity genes Tsn1 and Snn2 in wheat. Molecular Breeding, vol. 23, pp. 35-49
Zohary, D., Harlan, J. R. and Vardi, A. (1969). The wild diploid progenitors of wheat and
their breeding value. Euphytica, vol. 18, pp. 58-65 Zohary, D. and Hopf, M. (1988). Domestication of plants in the old world. Oxford
University Press, New York. pp. 16-52