Embed Size (px)
Citation preview
agronomy
Article
Do Triticum aestivum L. and Triticum spelta L.Hybrids Constitute a Promising Source Material forQuality Breeding ofNew Wheat Varieties?
Elzbieta Suchowilska 1, Marian Wiwart 1,* , Rudolf Krska 2 and Wolfgang Kandler 2
1 Department of Plant Breeding and Seed Production, Faculty of Environmental Management and Agriculture,University of Warmia and Mazury in Olsztyn, pl. Łódzki 3, 10-727 Olsztyn, Poland;[email protected]
2 Institute of Bioanalytics and Agro-Metabolomics, Department of Agrobiotechnology (IFA-Tulln), Universityof Natural Resources and Life Sciences, Vienna (BOKU), Konrad Lorenz Str. 20, 3430-Tulln, Austria;[email protected] (R.K.); [email protected] (W.K.)
* Correspondence: [email protected]
Received: 14 October 2019; Accepted: 24 December 2019; Published: 27 December 2019�����������������
Abstract: The aim of this two-year study was to determine whether the contents of macronutrientsand macro and microelements in wheat grain can be increased by crossbreeding Triticum aestivumand T. spelta. The experimental material comprised the grains of F6 and F7 hybrids and their parentalforms. The element content of grain was determined by ICP-SFMS. Hybrid grains had significantlyhigher ash contents than bread wheat grain (1.90% and 1.93% versus 1.62%). Crude protein contentwas lowest in bread wheat grain (11.75%) and highest in spelt grain (14.67%). Hybrid grains hadsignificantly higher protein contents (12.97% and13.19%) than bread wheat grain. In both years ofthe study, the concentrations of P, S, Mg and Ca were highest in spelt grain, whereas their content inhybrids was lower than in spelt grain, but higher than in bread wheat grain. The concentrations ofdesirable microelements were highest in spelt grain, and the micronutrient profile of hybrid grainswas more similar to bread wheat than spelt. Therefore, the hybrids can constitute promising sourcematerial for quality breeding in wheat.
Keywords: hybrids; wheat; spelt; macronutrients; macro and microelements
1. Introduction
In 2018/2019, the global production of wheat was estimated at 735 million tons, and allohexaploidbread wheat (Triticum aestivum L.) accounted for around 94% of total output. In 2017/2018, theproduction of allotetraploid durum wheat Triticum durum L. reached around 37.5 million tons withmore than a 5% share of the global output [1,2]. Small quantities of other wheat species, includingallohexaploid spelt (Triticum spelta L.), allotetraploid emmer (Triticum dicoccon Schrank) and diploideinkorn (Triticum monococcum L.), are grown in selected regions of the world, including the EuropeanUnion, Balkans and the Indian subcontinent [3]. Despite the growing demand for high-qualityfood products, yield continues to be the main determinant of profitability in cereal production. Themaximization of yield requires progress in breeding methods. High-yielding crop varieties are oftencharacterized by low nutritional quality due to low levels of protein, minerals (in particular Fe and Zn)and selected nutraceuticals [4,5]. However, it should be noted that high-yielding bread wheat varietieswith high contents of selected phytochemicals in grain have been described by Ward et al. [6]. Forthis reason, modern cereals are becoming less suitable for the production of functional foods. TheGreen Revolution provided only a short-term solution to global hunger. The resulting increase in foodproduction was not accompanied by an improvement in the nutritional quality of food [7]. Hidden
Agronomy 2020, 10, 43; doi:10.3390/agronomy10010043 www.mdpi.com/journal/agronomy
Agronomy 2020, 10, 43 2 of 16
hunger and malnutrition affect more than two billion people around the world [8]. According to Bouisand Welch [9], malnutrition is caused by dysfunctional food systems that cannot supply all the nutrientsand health-promoting factors required for human life in a sustainable way. In their opinion, dietsdeficient in vitamins and essential nutrients are the chief cause of malnutrition. Magnesium, zinc andiron are found mainly in the aleurone layer of cereal kernels. Cereal products are a vital source of theabove elements and trace minerals that are essential for human health [10,11]. A balanced diet shouldcontain the optimal proportions of seven macro elements (Na, K, Ca, Mg, S, P and Cl) and ten essentialtrace elements (Fe, Zn, Cu, Mn, I, F, Se, Mo, Co and B) [11]. Micro element deficiencies are noted not onlyin developing countries where cereals are staple foods, but are observed increasingly often in developedcountries [12,13]. Human diets are most deficient in iron, zinc and vitamin A [14]. According to theWHO, iron deficiency is responsible for 74% of the cases of anemia in children [15]. The availabilityof iron from ferrous sulfate, one of the most widely used iron fortifiers in cereal grain, is relativelylow [16]. Zinc deficiency poses a serious problem in many developing countries, and it is regarded asthe fifth most common risk factor for disease in children, especially diarrhea and pneumonia, thatcan contribute to high mortality rates in underdeveloped regions [17]. According to the InternationalZinc Association, 49% of the world’s population suffers from zinc deficiency [18]. Insufficient zincintake contributes to growth disorders, sexual dysfunctions (hypogonadism, hypospermia), hairloss, skin disorders, nyctalopia and loss of appetite [19,20]. Plant breeders continue to search fornew genetic sources of minerals that are essential in human nutrition. However, the mineral profileof grain can vary across geographic locations [21]. The interest in spelt wheat (T. spelta) has beenrecently revived due to the development of alternative farming techniques and efforts aiming topreserve the biodiversity of agricultural ecosystems. The area under spelt has increased in responseto the overproduction of the basic cereals, the introduction of environmentally-friendly cultivationmethods and the growing demand for new foods with health-promoting properties [22]. According toKohajdová and Karovicová [23], spelt wheat has high nutritional value on account of its compositionand high content of protein, lipids and crude fiber. Spelt grain is more abundant in iron, zinc, copper,magnesium, potassium, sodium and selenium than bread wheat [24,25]. Spelt-based foods delivergreater health benefits than those made from modern wheat varieties [26]. The genetic distance betweenspelt and bread wheat is relatively small, which contributes to the production of stable hybrids, wherebread wheat is used as a source material for breeding modern spelt varieties. Bread wheat and spelt areallohexaploid cereals with the same genome, AABBDD. Cytogenetic and phylogenetic analyses of T.spelta and T. aestivum revealed considerable similarities in their chromosomal structure and homology.It is generally believed that hexaploid wheat originated from the hybridization of hulled tetraploidemmer and Aegilops tauschii (genomes DD), and that the nascent hexaploid was spelt, which evolvedinto free-threshing wheat through mutations [27]. Hybrids between T. aestivum and T. spelta could offeran interesting alternative by eliminating the adverse qualities of spelt and improving the nutritionalvalue of bread wheat [28]. However, the resulting benefits have not been studied extensively to date.The discussed hybrids are characterized by similar threshability and resistance to lodging to breadwheat, and they could also constitute promising source materials for breeding new wheat varieties.Spelt is a valuable source of genes for breeding wheat varieties with increased Zn and Fe contents [29].Genetic biofortification (and, consequently, plant breeding) is a widely accepted strategy and the mostsustainable approach to minimizing mineral and nutrient deficiencies, especially low levels of microelements, such as Fe and Zn [30]. F1 hybrids produced by crossing bread wheat and spelt demonstratedconsiderable heterosis effects on grain yield, the number of grains per spike, and grain weight [31].
The aim of this study was to compare the content of macro elements and micro elements inthe grain of T. aestivum and T. spelta hybrids and their parental forms and to determine whether thecrossbreeding of both species could contribute to improving the nutritional quality of wheat.
Agronomy 2020, 10, 43 3 of 16
2. Materials and Methods
2.1. Field Experiment
The experimental material comprised the grain of F6 and F7 hybrids from single crosses betweenT. spelta × T. aestivum and T. aestivum × T. spelta and their parental forms: spring spelt breeding lines(S10, S11, S12, S13 and S14) selected at the Department of Plant Breeding and Seed Production ofthe University of Warmia and Mazury in Olsztyn, Poland, and three spring cultivars of bread wheat:Torka, Kontesa and Zebra. The studied breeding lines of spring spelt were selected from more than tenaccessions acquired from the National Center for Plant Genetic Resources in Radzików, Poland. Theanalyzed lines fully meet “true spelt” criteria in terms of phenotypic traits. The examined lines werebred for resistance to lodging, resistance to fungal pathogens and high yields. Torka and Zebra areelite wheat cultivars (E) with the highest flour strength and high protein content, whereas Kontesa is ahigh-yielding variety of quality class A [32]. A total of 23 hybrids were investigated (Table 1). The fieldexperiment was performed in the growing seasons of 2014 and 2015 at the Agricultural ExperimentStation in Bałcyny near Ostróda, Poland (53◦36′ N latitude; 19◦5′ E longitude). Spikelets (spelt andhybrids) or seeds (bread wheat) were sown in triplicate with 10×20 cm spacing and were fertilizedwith N/P/K 60/25/80 kg/ha in plots with an area of 6 m2. Chemical plant protection was not applied.Grain (bread wheat) and spikelets (spelt and hybrids) were harvested in the over-ripe stage (BBCH92) [33] with a Wintersteiger Classic (Austria) plot harvester. At the same time, 30 heads from eachplot were hand-harvested for biometric measurements. Spikelets were threshed with the WintersteigerLD 180 (Austria) laboratory thresher, and grain was refrigerated until analysis.
Table 1. Hybrids and their parental forms analyzed in the study.
No Parent No Hybrid No Hybrid No Hybrid
1 S10 1 Torka × S10 9 Kontesa × S14 17 S13 × Torka2 S11 2 Torka × S11 10 Zebra × S10 18 S14 × Torka3 S12 3 Torka × S12 11 Zebra × S11 19 S10 × Kontesa4 S13 4 Torka × S14 12 Zebra × S12 20 S11 × Kontesa5 S14 5 Kontesa × S10 13 Zebra × S14 21 S12 × Kontesa6 Torka 6 Kontesa × S11 14 S10 × Torka 22 S13 × Kontesa7 Kontesa 7 Kontesa × S12 15 S11 × Torka 23 S14 × Kontesa8 Zebra 8 Kontesa × S13 16 S12 × Torka
2.2. Biometric Measurements
The following biometric measurements of major yield components and morphological parametersof spikes were conducted after harvest: kernel number per spike, kernel weight per spike, one-kernelweight, spike length and spike density (number of spikelets per 10 cm of spike length). Yield per 1 hawas estimated based on yield per plot, and it was expressed as the yield of dehulled kernels in bothspelt and the hybrids.
2.3. Analysis of the Content of Macronutrients in Grain
The content of macronutrients in grain was analyzed according to the method proposed by Wiwartet al. [34] and Suchowilska et al. [35]. Grain samples were milled in the Cyclotec 1093 sample mill(FOSS, Hillerød, Denmark). Crude protein content (N × 5.7) [36] was determined in two replicates inthe Buchi system (K-424 Digestion Unit and B-324 Distillation Unit, Flawil, Switzerland). Crude fat wasextracted by the Soxhlet method (Buchi Extraction System B-811, Flawil, Switzerland) (solvent: diethylether (POCh, Gliwice, Poland); extractor size—100 mL; 2.5 g analytical samples of air-dried groundgrain). Extraction was carried out at a temperature of 60 ◦C for 4 h, in two replicates. After etherevaporation, solvent caps containing crude fat were dried for 2 h at 105 ◦C in a desiccator and weighed.Crude fiber content was determined using the Fibertec 2010 system (FOSS, Hillerød, Denmark) and
Agronomy 2020, 10, 43 4 of 16
the Weende method. Ground samples of 2 g were placed in FOSS crucibles with P2 porosity (40–100µm). The samples were placed in a hot extraction unit, immersed in 1.25% H2SO4 (POCh, Gliwice,Poland) and boiled for 40 min. Sulfuric acid was removed; the samples were rinsed three times withhot demineralized water, placed in a cold extraction unit and rinsed with acetone (POCh, Gliwice,Poland). The samples were dried at 105 ◦C for 3 h, and the amount of fiber was determined in aquantitative analysis.
2.4. Macro Element and Micro Element Analyses
Macro elements and micro elements were analyzed based on the method described by Bienkowskaet al. [37]. Samples were digested in a high pressure assure (HPA) device (Anton Paar, Graz, Austria).Macro element and micro element concentrations were determined in the Finnigan ELEMENT2double-focusing sector field inductively coupled plasma mass spectrometer (ICP-MS, Thermo ElectronCorporation, Bremen, Germany) with a CETAC ASX-520 autosampler (CETAC Technologies, Omaha,Nebraska, USA). The instrument was equipped with a cyclonic spray chamber (Jacketed CinnabarCyclonic, 20 mL) and a borosilicate glass conical nebulizer (Glass Expansion, West Melbourne, Australia)connected to a 700 µL min−1 self-aspiration capillary (0.5 µm I.D.) (AHF Analysentechnik, Tübingen,Germany).
2.4.1. Reagents and Standard Solutions
Water was purified successively by reverse osmosis in the PURELAB® Ultra water purificationsystem (ELGA LabWater/VWS, High Wycombe, United Kingdom). HNO3 (69%) TraceSELECT®, singleelement spectroscopy standard solutions (1 g L−1 of Al, As, B, Ba, Cd, Ce, Co, Cr, Cu, Fe, Hg, In, La, Mn,Mo, Na, Ni, Pb, Rb, Se, Sr, Tl, V, Y and Zn in 2% HNO3; 1 g L−1 of Sb; Sn in 10% HCl), MgSO4·6H2O,KH2PO4, CaCO3 and CaCl2·4H2O of Suprapur® quality (for trace analysis) were purchased fromFluka, Sigma-Aldrich (Steinheim, Germany), CPI International (Amsterdam, The Netherlands) andMerck (Darmstadt, Germany). An internal standard (IS) solution with 40 µg L−1 Sc, 20 µg L−1 In and20 µg L−1 Tl in 0.5% HNO3 was used to prepare calibration standards and dilute digestion solutions insuch a way that all aspirated test samples contained 20 µg L−1 of Sc and 10 µg L−1 of In and Tl. Thecalibration standards had the following concentration: 0.02–1 µg L−1 of Cd, Ce Co, Cr, Hg, La, Pb, Sb,Sn, V and Y; 0.1–5 µg L−1 of As, Se and Ni; 1–50 µg L−1 of Al, B, Ba, Cu, Mo, Rb and Sr; 4–200 µg L−1 ofFe, Mn and Zn; 0.02–1 mg L−1 of Na; 0.8–4 mg L−1 of Ca and Cl; 2–10 mg L−1 of Mg and S; 8–40 mgL−1 of K and P in 1.5% HNO3.
2.4.2. Digestion Procedure
Wheat kernel samples of 500 (±20) mg each were transferred to 30 mL quartz vessels and 2 mLHNO3 was added. The vessels were sealed with Teflon tape and quartz disks, and they were placedinside the HPA. An initial pressure of 100 bar nitrogen was applied to the vessels, and the followingtemperature program was run: 80 ◦C for 15 min, 110 ◦C for 15 min, 240 ◦C for 10 min and 240 ◦C for90 min. The vessels were cooled to obtain clear digestion solutions, and the samples appeared to becompletely mineralized. The digestion solutions were transferred to pre-weighed 50 mL polystyrene(PS) tubes and diluted with ultra-pure water to 50.0 g. Prior to ICP-MS measurements, aliquots of 3 mLwere combined with 3 mL of the IS solution. The dilution factor was 1:200 for the samples and 1:50 forHNO3 used in digestion. The sample solutions were stored at room temperature until ICP-MS analysis.
2.4.3. ICP-SFMS Measurements
Argon (Ar 4.6, 99.996%) flow rate was 16 L min−1, and the flow rates of auxiliary (plasma) andsample (nebulizer) gas were optimized daily before each measurement series to obtain maximumsignal intensity, the former typically at 0.70 L min−1, and the latter at 1.00 L min−1. RF power was1185–1195 W. The following nuclides were measured in low-resolution mode (Rs = 300, 10% valleydefinition): 11B, 45Sc, 89Y, 97Mo, 115In, 118Sn, 121Sb, 139La, 201Hg, 205Tl, 206Pb and 208Pb. 23Na, 24Mg,
Agronomy 2020, 10, 43 5 of 16
27Al, 35Cl, 44Ca, 45Sc, 51V, 52Cr, 55Mn, 56Fe, 59Co, 60Ni, 63Cu, 66Zn, 88Sr, 111Cd, 115In, 118Sn, 137Ba and140Ce were determined in medium-resolution mode (Rs = 4000), whereas 31P, 32S, 39K, 45Sc, 75As 77Seand 85Rb were measured in high-resolution mode (Rs = 10 000). Sc, In and Tl were used as internalstandards to compensate for changes in signal intensity during measurement. The samples werequantified by external calibration.
2.5. Statistical Analysis
The results of all measurements performed during the two-year study were processedstatistically by ANOVA, where the significance of differences between means was determined by theStudent–Newman–Keuls (SNK) test and principal component analysis (PCA). Statistical analyses wereperformed in Statistica 13 software [38].
3. Results
The contents of macro and micro elements in soil before the field experiment are presented inTable S1.
3.1. Yield Components
Yield components, spike length, spike density and the yield of the analyzed hybrids and theirparental forms are presented in Table 2. Average spike length did not differ significantly betweenhybrids and bread wheat, whereas spike density in hybrids occupied the mid-range of values notedin spelt and bread wheat and differed significantly from both parental forms. Similar observationswere made in one-kernel weight, the major yield component. Interestingly, despite the absence ofsignificant differences in average kernel weight between treatments, this parameter was somewhathigher in hybrids than in their parental forms. Yields were lower in hybrids than in bread wheatand spelt, but the noted difference was significantly only in hybrids originating from spelt as thematernal component.
Table 2. Mean values (±standard deviations) of spike length, spike density, kernel number per spike,kernel weight per spike, one-kernel weight and the yield of the examined hybrids and their parentalforms in two years of the experiment.
SL (cm) D KNS KWS (g) OKW (mg) Yield † (t ha−1)
Spelt (n = 5) 12.16 a± 1.46 14.41 c
± 1.09 23.41 c± 0.93 0.92 c
± 0.10 39.11 ± 3.79 4.48 a± 0.57
Wheat (n = 3) 9.40 b± 0.64 21.07 a
± 0.90 40.39 a± 0.65 1.67 a
± 0.10 41.06 ± 2.57 5.98 a± 0.44
W × S (n = 13) 9.92 b± 0.78 18.02 b
± 1.02 29.85 b± 2.00 1.24 b
± 0.06 41.74 ± 2.45 4.31 ab± 0.59
S ×W (n = 10) 10.21 b± 1.88 18.11 b
± 2.25 29.83 b± 2.60 1.25 b
± 0.14 41.81 ± 3.19 4.02 b± 0.62
SL—spike length; D—spike density (number of spikelets per 10 cm of the spike length); KNS—kernel number perspike; KWS—kernel weight per spike; OKW—one-kernel weight. †—expressed as the yield of dehulled kernels forspelt and hybrids. W × S—wheat × spelt; S ×W—spelt ×wheat; a,b—mean values followed by the same letter donot differ significantly within a column at p < 0.05.
3.2. Macronutrient Analysis
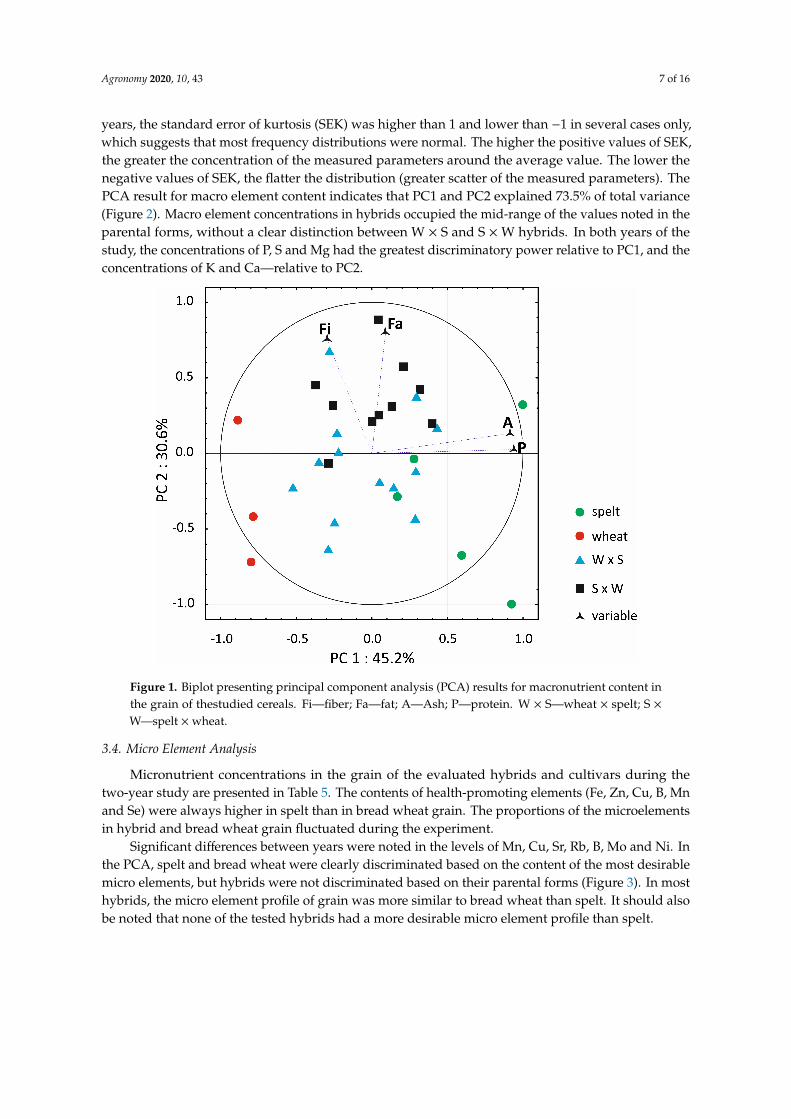
The macronutrient content of grain is presented in Table 3.Regardless of the direction of crossbreeding, the hybrids were characterized by significantly higher
contents of ash than bread wheat. These differences ranged from 5.1%–7.8% in 2014 to 23.2%–27.3% in2015. The average content of ash in the grain of all analyzed wheat forms was nearly 12% lower in2015 than in 2014. In this respect, the evaluated hybrids were more similar to spelt than bread wheat.Dietary fiber content did not differ significantly between hybrids and bread wheat. Only in 2014, wasthe content of dietary fiber significantly the lowest in spelt grain (2.23%), and it was significantly thehighest in bread wheat grain (2.85%). In both years, crude protein content was significantly the lowestin bread wheat (12.17% and 11.33%, respectively) and significantly the highest in spelt (15.60% and13.74%, respectively). The evaluated hybrids were generally more abundant in crude protein than
Agronomy 2020, 10, 43 6 of 16
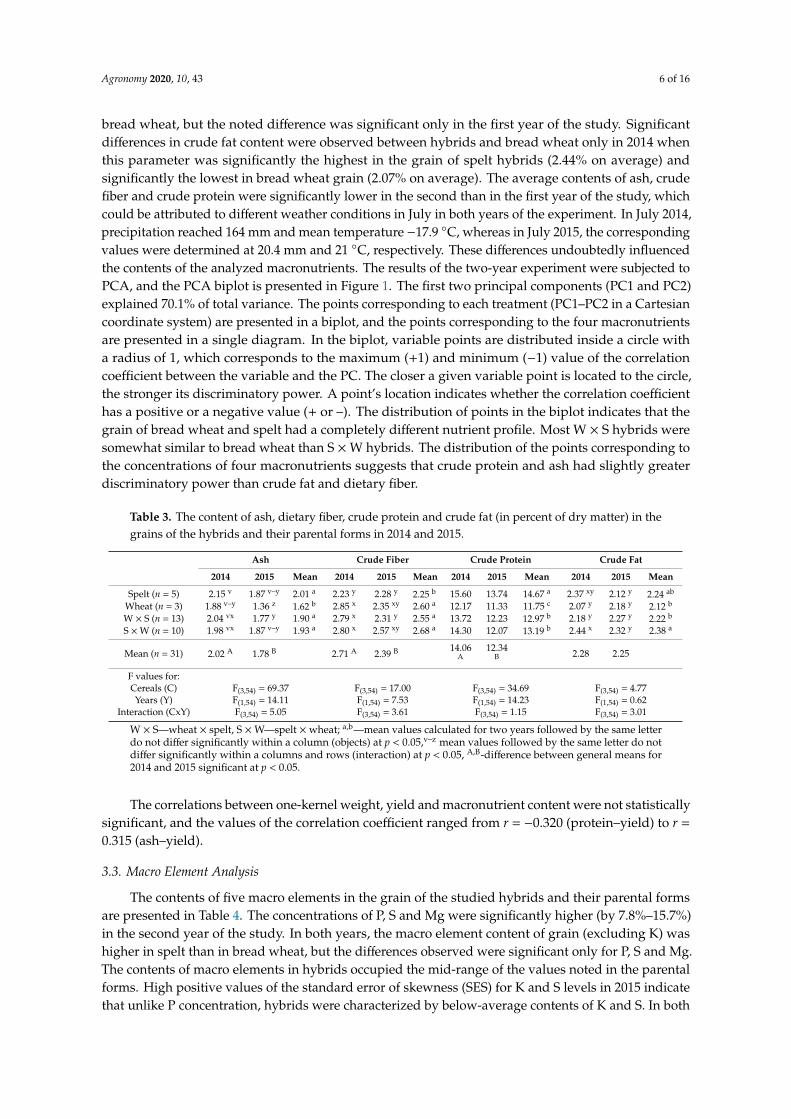
bread wheat, but the noted difference was significant only in the first year of the study. Significantdifferences in crude fat content were observed between hybrids and bread wheat only in 2014 whenthis parameter was significantly the highest in the grain of spelt hybrids (2.44% on average) andsignificantly the lowest in bread wheat grain (2.07% on average). The average contents of ash, crudefiber and crude protein were significantly lower in the second than in the first year of the study, whichcould be attributed to different weather conditions in July in both years of the experiment. In July 2014,precipitation reached 164 mm and mean temperature −17.9 ◦C, whereas in July 2015, the correspondingvalues were determined at 20.4 mm and 21 ◦C, respectively. These differences undoubtedly influencedthe contents of the analyzed macronutrients. The results of the two-year experiment were subjected toPCA, and the PCA biplot is presented in Figure 1. The first two principal components (PC1 and PC2)explained 70.1% of total variance. The points corresponding to each treatment (PC1–PC2 in a Cartesiancoordinate system) are presented in a biplot, and the points corresponding to the four macronutrientsare presented in a single diagram. In the biplot, variable points are distributed inside a circle witha radius of 1, which corresponds to the maximum (+1) and minimum (−1) value of the correlationcoefficient between the variable and the PC. The closer a given variable point is located to the circle,the stronger its discriminatory power. A point’s location indicates whether the correlation coefficienthas a positive or a negative value (+ or –). The distribution of points in the biplot indicates that thegrain of bread wheat and spelt had a completely different nutrient profile. Most W × S hybrids weresomewhat similar to bread wheat than S ×W hybrids. The distribution of the points corresponding tothe concentrations of four macronutrients suggests that crude protein and ash had slightly greaterdiscriminatory power than crude fat and dietary fiber.
Table 3. The content of ash, dietary fiber, crude protein and crude fat (in percent of dry matter) in thegrains of the hybrids and their parental forms in 2014 and 2015.
Ash Crude Fiber Crude Protein Crude Fat
2014 2015 Mean 2014 2015 Mean 2014 2015 Mean 2014 2015 Mean
Spelt (n = 5) 2.15 v 1.87 v–y 2.01 a 2.23 y 2.28 y 2.25 b 15.60 13.74 14.67 a 2.37 xy 2.12 y 2.24 ab
Wheat (n = 3) 1.88 v–y 1.36 z 1.62 b 2.85 x 2.35 xy 2.60 a 12.17 11.33 11.75 c 2.07 y 2.18 y 2.12 b
W × S (n = 13) 2.04 vx 1.77 y 1.90 a 2.79 x 2.31 y 2.55 a 13.72 12.23 12.97 b 2.18 y 2.27 y 2.22 b
S ×W (n = 10) 1.98 vx 1.87 v–y 1.93 a 2.80 x 2.57 xy 2.68 a 14.30 12.07 13.19 b 2.44 x 2.32 y 2.38 a
Mean (n = 31) 2.02 A 1.78 B 2.71 A 2.39 B 14.06A
12.34B 2.28 2.25
F values for:Cereals (C) F(3,54) = 69.37 F(3,54) = 17.00 F(3,54) = 34.69 F(3,54) = 4.77Years (Y) F(1,54) = 14.11 F(1,54) = 7.53 F(1,54) = 14.23 F(1,54) = 0.62
Interaction (CxY) F(3,54) = 5.05 F(3,54) = 3.61 F(3,54) = 1.15 F(3,54) = 3.01
W × S—wheat × spelt, S ×W—spelt × wheat; a,b—mean values calculated for two years followed by the same letterdo not differ significantly within a column (objects) at p < 0.05,v–z mean values followed by the same letter do notdiffer significantly within a columns and rows (interaction) at p < 0.05, A,B-difference between general means for2014 and 2015 significant at p < 0.05.
The correlations between one-kernel weight, yield and macronutrient content were not statisticallysignificant, and the values of the correlation coefficient ranged from r = −0.320 (protein–yield) to r =
0.315 (ash–yield).
3.3. Macro Element Analysis
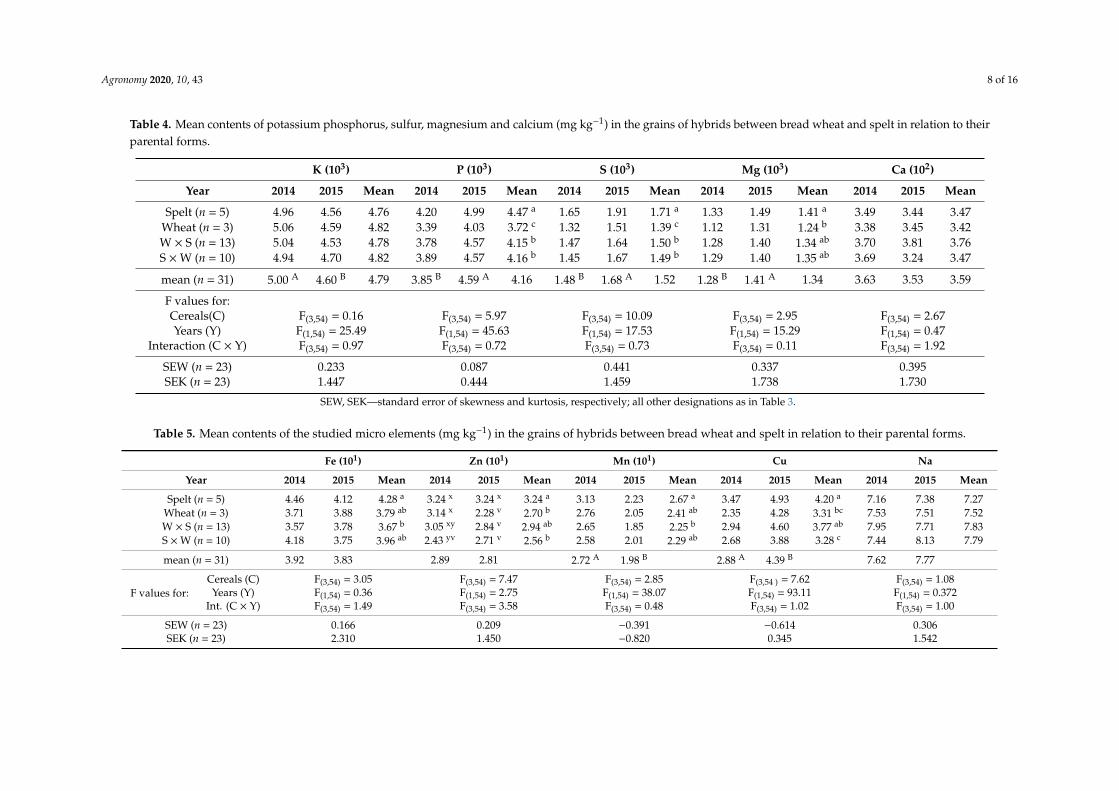
The contents of five macro elements in the grain of the studied hybrids and their parental formsare presented in Table 4. The concentrations of P, S and Mg were significantly higher (by 7.8%–15.7%)in the second year of the study. In both years, the macro element content of grain (excluding K) washigher in spelt than in bread wheat, but the differences observed were significant only for P, S and Mg.The contents of macro elements in hybrids occupied the mid-range of the values noted in the parentalforms. High positive values of the standard error of skewness (SES) for K and S levels in 2015 indicatethat unlike P concentration, hybrids were characterized by below-average contents of K and S. In both
Agronomy 2020, 10, 43 7 of 16
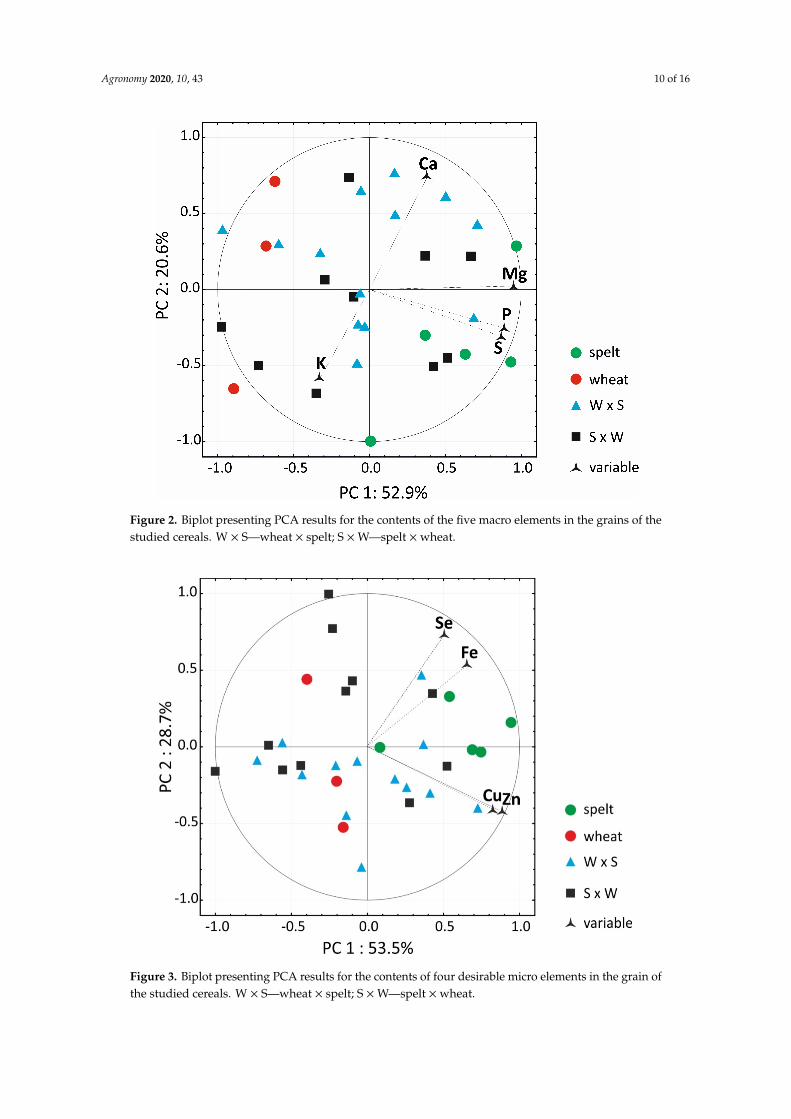
years, the standard error of kurtosis (SEK) was higher than 1 and lower than −1 in several cases only,which suggests that most frequency distributions were normal. The higher the positive values of SEK,the greater the concentration of the measured parameters around the average value. The lower thenegative values of SEK, the flatter the distribution (greater scatter of the measured parameters). ThePCA result for macro element content indicates that PC1 and PC2 explained 73.5% of total variance(Figure 2). Macro element concentrations in hybrids occupied the mid-range of the values noted in theparental forms, without a clear distinction between W × S and S ×W hybrids. In both years of thestudy, the concentrations of P, S and Mg had the greatest discriminatory power relative to PC1, and theconcentrations of K and Ca—relative to PC2.
Agronomy 2019, 9, x FOR PEER REVIEW 7 of 16
distribution (greater scatter of the measured parameters). The PCA result for macro element content indicates that PC1 and PC2 explained 73.5% of total variance (Figure 2). Macro element concentrations in hybrids occupied the mid-range of the values noted in the parental forms, without a clear distinction between W × S and S×W hybrids. In both years of the study, the concentrations of P, S and Mg had the greatest discriminatory power relative to PC1, and the concentrations of K and Ca—relative to PC2.
Figure 1. Biplot presenting principal component analysis (PCA) results for macronutrient content in the grain of thestudied cereals. Fi—fiber; Fa—fat; A—Ash; P—protein. W × S—wheat × spelt; S × W—spelt × wheat.
3.3. Micro Element Analysis
Micronutrient concentrations in the grain of the evaluated hybrids and cultivars during the two-year study are presented in Table 5. The contents of health-promoting elements (Fe, Zn, Cu, B, Mn and Se) were always higher in spelt than in bread wheat grain. The proportions of the microelements in hybrid and bread wheat grain fluctuated during the experiment.
Figure 1. Biplot presenting principal component analysis (PCA) results for macronutrient content inthe grain of thestudied cereals. Fi—fiber; Fa—fat; A—Ash; P—protein. W × S—wheat × spelt; S ×W—spelt ×wheat.
3.4. Micro Element Analysis
Micronutrient concentrations in the grain of the evaluated hybrids and cultivars during thetwo-year study are presented in Table 5. The contents of health-promoting elements (Fe, Zn, Cu, B, Mnand Se) were always higher in spelt than in bread wheat grain. The proportions of the microelementsin hybrid and bread wheat grain fluctuated during the experiment.
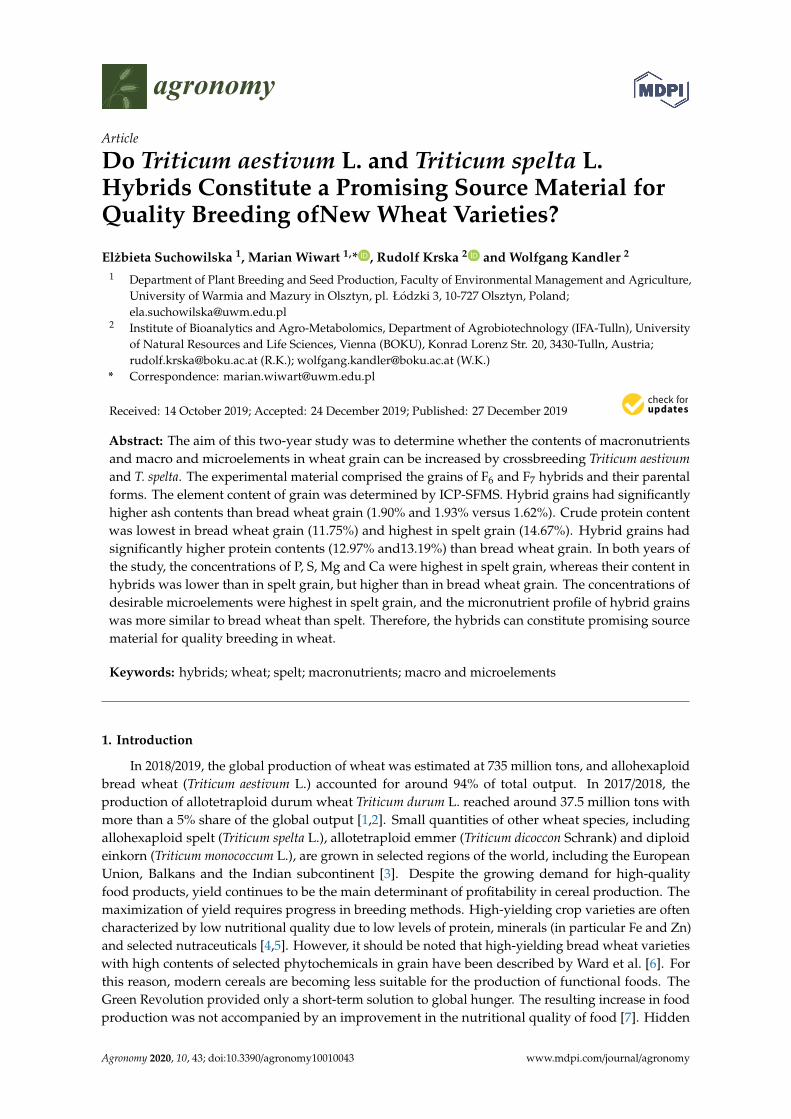
Significant differences between years were noted in the levels of Mn, Cu, Sr, Rb, B, Mo and Ni. Inthe PCA, spelt and bread wheat were clearly discriminated based on the content of the most desirablemicro elements, but hybrids were not discriminated based on their parental forms (Figure 3). In mosthybrids, the micro element profile of grain was more similar to bread wheat than spelt. It should alsobe noted that none of the tested hybrids had a more desirable micro element profile than spelt.
Agronomy 2020, 10, 43 8 of 16
Table 4. Mean contents of potassium phosphorus, sulfur, magnesium and calcium (mg kg−1) in the grains of hybrids between bread wheat and spelt in relation to theirparental forms.
K (103) P (103) S (103) Mg (103) Ca (102)
Year 2014 2015 Mean 2014 2015 Mean 2014 2015 Mean 2014 2015 Mean 2014 2015 Mean
Spelt (n = 5) 4.96 4.56 4.76 4.20 4.99 4.47 a 1.65 1.91 1.71 a 1.33 1.49 1.41 a 3.49 3.44 3.47Wheat (n = 3) 5.06 4.59 4.82 3.39 4.03 3.72 c 1.32 1.51 1.39 c 1.12 1.31 1.24 b 3.38 3.45 3.42W × S (n = 13) 5.04 4.53 4.78 3.78 4.57 4.15 b 1.47 1.64 1.50 b 1.28 1.40 1.34 ab 3.70 3.81 3.76S ×W (n = 10) 4.94 4.70 4.82 3.89 4.57 4.16 b 1.45 1.67 1.49 b 1.29 1.40 1.35 ab 3.69 3.24 3.47
mean (n = 31) 5.00 A 4.60 B 4.79 3.85 B 4.59 A 4.16 1.48 B 1.68 A 1.52 1.28 B 1.41 A 1.34 3.63 3.53 3.59
F values for:Cereals(C) F(3,54) = 0.16 F(3,54) = 5.97 F(3,54) = 10.09 F(3,54) = 2.95 F(3,54) = 2.67Years (Y) F(1,54) = 25.49 F(1,54) = 45.63 F(1,54) = 17.53 F(1,54) = 15.29 F(1,54) = 0.47
Interaction (C × Y) F(3,54) = 0.97 F(3,54) = 0.72 F(3,54) = 0.73 F(3,54) = 0.11 F(3,54) = 1.92
SEW (n = 23) 0.233 0.087 0.441 0.337 0.395SEK (n = 23) 1.447 0.444 1.459 1.738 1.730
SEW, SEK—standard error of skewness and kurtosis, respectively; all other designations as in Table 3.
Table 5. Mean contents of the studied micro elements (mg kg−1) in the grains of hybrids between bread wheat and spelt in relation to their parental forms.
Fe (101) Zn (101) Mn (101) Cu Na
Year 2014 2015 Mean 2014 2015 Mean 2014 2015 Mean 2014 2015 Mean 2014 2015 Mean
Spelt (n = 5) 4.46 4.12 4.28 a 3.24 x 3.24 x 3.24 a 3.13 2.23 2.67 a 3.47 4.93 4.20 a 7.16 7.38 7.27Wheat (n = 3) 3.71 3.88 3.79 ab 3.14 x 2.28 v 2.70 b 2.76 2.05 2.41 ab 2.35 4.28 3.31 bc 7.53 7.51 7.52W × S (n = 13) 3.57 3.78 3.67 b 3.05 xy 2.84 v 2.94 ab 2.65 1.85 2.25 b 2.94 4.60 3.77 ab 7.95 7.71 7.83S ×W (n = 10) 4.18 3.75 3.96 ab 2.43 yv 2.71 v 2.56 b 2.58 2.01 2.29 ab 2.68 3.88 3.28 c 7.44 8.13 7.79
mean (n = 31) 3.92 3.83 2.89 2.81 2.72 A 1.98 B 2.88 A 4.39 B 7.62 7.77
F values for:Cereals (C) F(3,54) = 3.05 F(3,54) = 7.47 F(3,54) = 2.85 F(3,54 ) = 7.62 F(3,54) = 1.08Years (Y) F(1,54) = 0.36 F(1,54) = 2.75 F(1,54) = 38.07 F(1,54) = 93.11 F(1,54) = 0.372
Int. (C × Y) F(3,54) = 1.49 F(3,54) = 3.58 F(3,54) = 0.48 F(3,54) = 1.02 F(3,54) = 1.00
SEW (n = 23) 0.166 0.209 −0.391 −0.614 0.306SEK (n = 23) 2.310 1.450 −0.820 0.345 1.542
Agronomy 2020, 10, 43 9 of 16
Table 5. Cont.
Al Sr Rb Ba B (10−1)
Year 2014 2015 Mean 2014 2015 Mean 2014 2015 Mean 2014 2015 Mean 2014 2015 Mean
Spelt (n = 5) 0.70 1.59 1.15 1.54 1.87 1.70 2.41 1.71 2.06 2.94 2.52 2.73 0.62 0.72 0.67 a
Wheat (n = 3) 0.89 1.38 1.14 1.21 1.56 1.39 4.34 1.25 2.79 1.51 1.83 1.67 0.53 0.65 0.59 ab
W × S (n = 13) 1.13 1.03 1.08 1.32 1.87 1.59 3.37 1.10 2.24 2.21 2.86 2.54 0.59 0.70 0.65 a
S ×W (n = 10) 1.21 1.24 1.23 1.04 1.35 1.19 3.03 1.27 2.15 1.52 1.85 1.68 0.49 0.65 0.57 b
mean (n = 31) 1.06 1.22 1.25 B 1.67 A 3.20 A 1.27 B 2.04 2.38 0.56 B 0.68 A
F values for:Cereals (C) F(3,54) = 0.52 F(3,54) = 4.97 F(3,54) = 0.57 F(3,54) = 4.55 F(3,54) = 4.74Years (Y) F(1,54) = 3.49 F(1,54) = 0.94 F(1,54) = 31.13 F(1,54) = 0.61 F(1,54) = 26.44Int. (CxY) F(3,54) = 2.53 F(3,54) = 0.40 F(3,54) = 1.59 F(3,54) = 0.75 F(3,54) = 0.42
SEW (n = 23) 0.155 −0.349 −0.184 −0.102 0.270SEK (n = 23) 1.449 0.167 1.521 0.642 1.642
Mo (·10−1) Ni (·10−1) Cd (·10−2) Se (·10−2) Pb (·10−3)
Year 2014 2015 Mean 2014 2015 Mean 2014 2015 Mean 2014 2015 Mean 2014 2015 Mean
Spelt (n = 5) 2.98 x–z 4.08 x–z 3.53 b 2.41 x 1.19 yz 1.79 a 7.99 5.46 6.73 2.70 1.70 2.20 a 3.03 4.89 3.95Wheat (n = 3) 2.03 yz 6.15 vx 4.09 ab 2.51 x 0.67 z 1.59 ab 4.94 3.56 4.25 0.65 0.93 0.79 c 1.72 3.31 2.51W × S (n = 13) 2.85 yz 7.41 v 5.13 a 1.75 xy 0.66 z 1.20 bc 4.29 4.53 4.41 1.27 0.97 1.12 bc 2.59 2.10 2.34S ×W (n = 10) 3.57 x–z 4.81 xy 4.19 ab 1.13 yz 0.73 z 0.92 c 3.53 4.55 4.04 1.85 0.95 1.40 b 2.64 3.95 3.30
mean (n = 31) 3.02 B 5.91 A 1.73 A 0.81 B 4.70 4.59 1.63 1.08 2.59 3.26
F values for:Cereals(C) F(3,54) = 3.59 F(3,54) = 8.77 F(3,54) = 1.83 F(3,54) = 4.09 F(3,54) = 1.27Years (Y) F(1,54) = 40.77 F(1,54) = 65.68 F(1,54) = 3.30 F(1,54) = 3.03 F(1,54) = 2.09
Int. (C × Y) F(3,54) = 6.72 F(3,54) = 4.49 F(3,54) = 2.43 F(3,54) = 0.98 F(3,54) = 0.84
SEW (n = 23) −0.344 −0.552 0.280 −0.542 −2.305SEK (n = 23) −0.314 −1.243 1.870 0.722 −6.627
All designations as in Table 4.
Agronomy 2020, 10, 43 10 of 16Agronomy 2019, 9, x FOR PEER REVIEW 10 of 16
Figure 2. Biplot presenting PCA results for the contents of the five macro elements in the grains of the studied cereals. W × S—wheat × spelt; S × W—spelt × wheat.
Significant differences between years were noted in the levels of Mn, Cu, Sr, Rb, B, Mo and Ni. In the PCA, spelt and bread wheat were clearly discriminated based on the content of the most desirable micro elements, but hybrids were not discriminated based on their parental forms (Figure 3). In most hybrids, the micro element profile of grain was more similar to bread wheat than spelt. It should also be noted that none of the tested hybrids had a more desirable micro element profile than spelt.
Figure 2. Biplot presenting PCA results for the contents of the five macro elements in the grains of thestudied cereals. W × S—wheat × spelt; S ×W—spelt ×wheat.
Agronomy 2019, 9, x FOR PEER REVIEW 10 of 16
Figure 2. Biplot presenting PCA results for the contents of the five macro elements in the grains of the studied cereals. W × S—wheat × spelt; S × W—spelt × wheat.
Significant differences between years were noted in the levels of Mn, Cu, Sr, Rb, B, Mo and Ni. In the PCA, spelt and bread wheat were clearly discriminated based on the content of the most desirable micro elements, but hybrids were not discriminated based on their parental forms (Figure 3). In most hybrids, the micro element profile of grain was more similar to bread wheat than spelt. It should also be noted that none of the tested hybrids had a more desirable micro element profile than spelt.
Figure 3. Biplot presenting PCA results for the contents of four desirable micro elements in the grain ofthe studied cereals. W × S—wheat × spelt; S ×W—spelt ×wheat.
Agronomy 2020, 10, 43 11 of 16
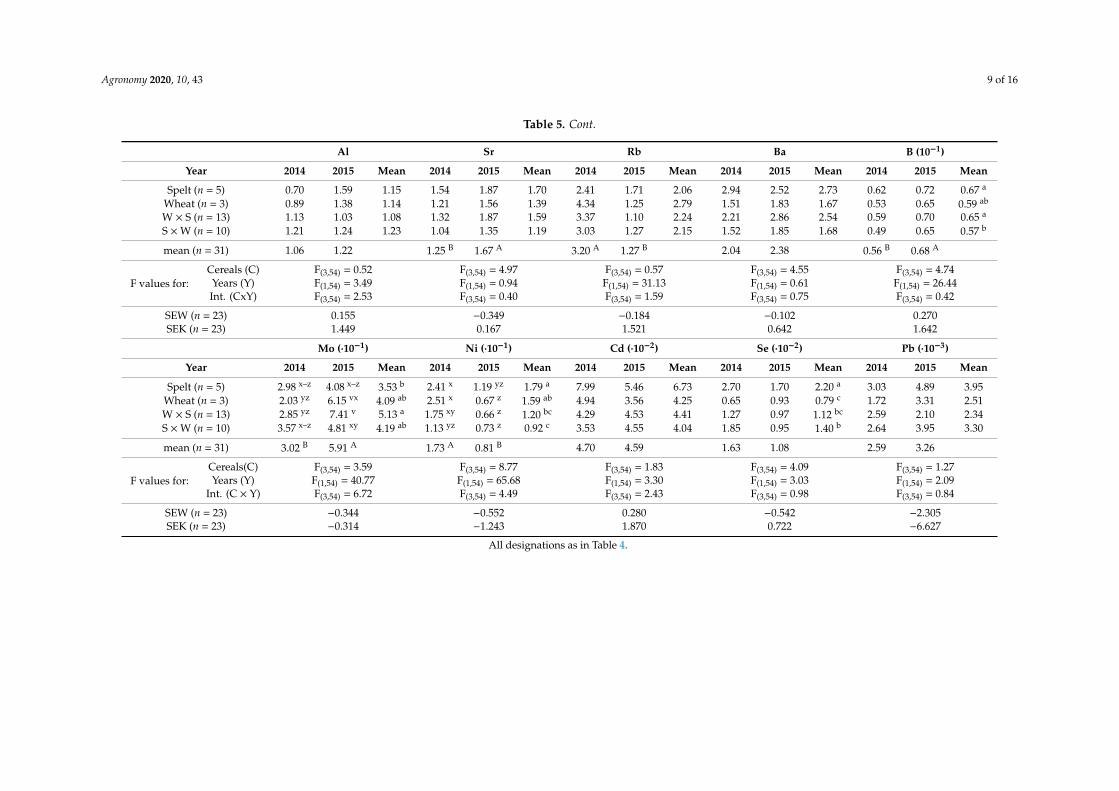
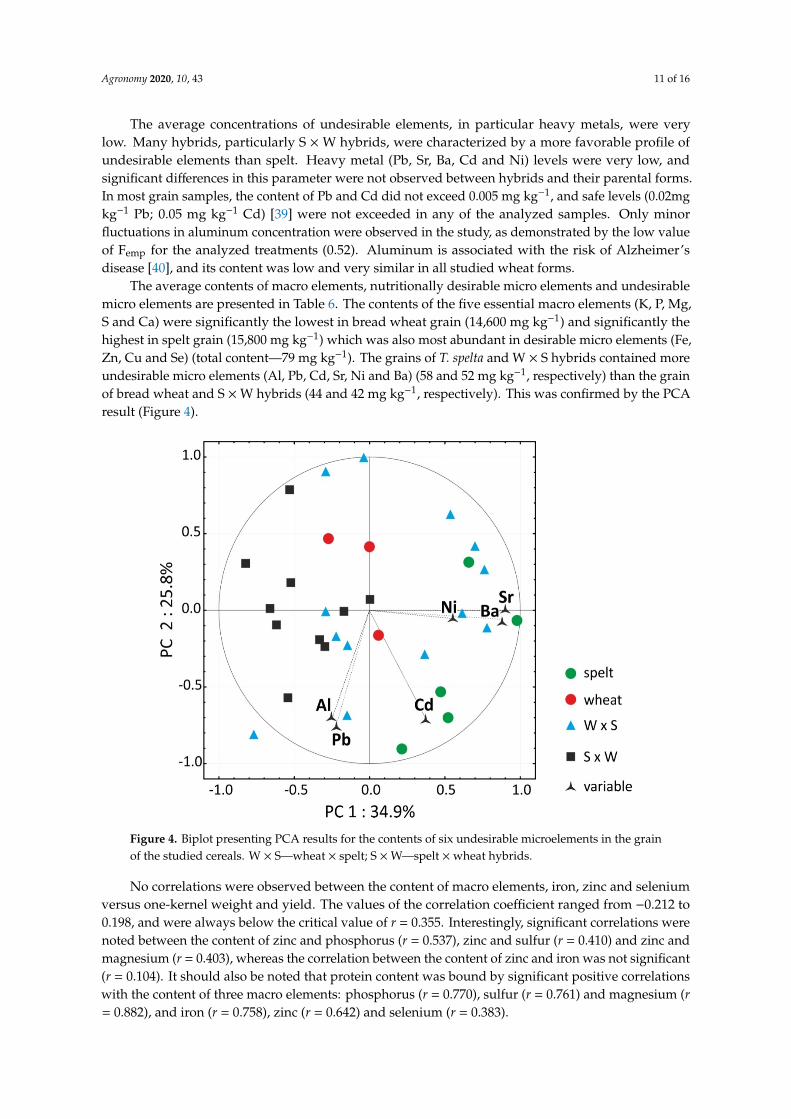
The average concentrations of undesirable elements, in particular heavy metals, were verylow. Many hybrids, particularly S ×W hybrids, were characterized by a more favorable profile ofundesirable elements than spelt. Heavy metal (Pb, Sr, Ba, Cd and Ni) levels were very low, andsignificant differences in this parameter were not observed between hybrids and their parental forms.In most grain samples, the content of Pb and Cd did not exceed 0.005 mg kg−1, and safe levels (0.02mgkg−1 Pb; 0.05 mg kg−1 Cd) [39] were not exceeded in any of the analyzed samples. Only minorfluctuations in aluminum concentration were observed in the study, as demonstrated by the low valueof Femp for the analyzed treatments (0.52). Aluminum is associated with the risk of Alzheimer’sdisease [40], and its content was low and very similar in all studied wheat forms.
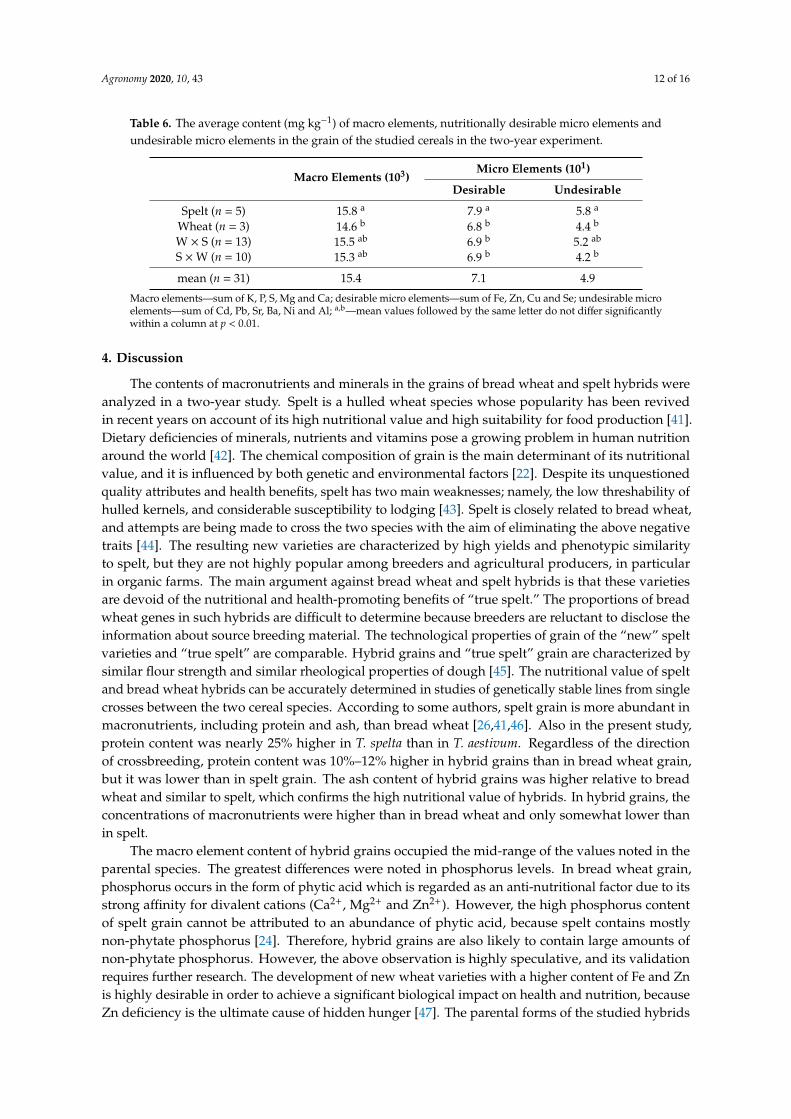
The average contents of macro elements, nutritionally desirable micro elements and undesirablemicro elements are presented in Table 6. The contents of the five essential macro elements (K, P, Mg,S and Ca) were significantly the lowest in bread wheat grain (14,600 mg kg−1) and significantly thehighest in spelt grain (15,800 mg kg−1) which was also most abundant in desirable micro elements (Fe,Zn, Cu and Se) (total content—79 mg kg−1). The grains of T. spelta and W × S hybrids contained moreundesirable micro elements (Al, Pb, Cd, Sr, Ni and Ba) (58 and 52 mg kg−1, respectively) than the grainof bread wheat and S ×W hybrids (44 and 42 mg kg−1, respectively). This was confirmed by the PCAresult (Figure 4).
Agronomy 2019, 9, x FOR PEER REVIEW 11 of 16
Figure 3. Biplot presenting PCA results for the contents of four desirable micro elements in the grain of the studied cereals. W × S—wheat × spelt; S × W—spelt × wheat.
The average concentrations of undesirable elements, in particular heavy metals, were very low. Many hybrids, particularly S×W hybrids, were characterized by a more favorable profile of undesirable elements than spelt. Heavy metal (Pb, Sr, Ba, Cd and Ni) levels were very low, and significant differences in this parameter were not observed between hybrids and their parental forms. In most grain samples, the content of Pb and Cd did not exceed 0.005 mg kg−1, and safe levels (0.02mg kg−1 Pb; 0.05 mg kg−1 Cd) [39] were not exceeded in any of the analyzed samples. Only minor fluctuations in aluminum concentration were observed in the study, as demonstrated by the low value of Femp for the analyzed treatments (0.52). Aluminum is associated with the risk of Alzheimer’s disease [40], and its content was low and very similar in all studied wheat forms.
The average contents of macro elements, nutritionally desirable micro elements and undesirable micro elements are presented in Table 6. The contents of the five essential macro elements (K, P, Mg, S and Ca) were significantly the lowest in bread wheat grain (14,600 mg kg−1) and significantly the highest in spelt grain (15,800 mg kg−1) which was also most abundant in desirable micro elements (Fe, Zn, Cu and Se) (total content—79 mg kg−1). The grains of T. spelta and W×S hybrids contained more undesirable micro elements (Al, Pb, Cd, Sr, Ni and Ba) (58 and 52 mg kg−1, respectively) than the grain of bread wheat and S×W hybrids (44 and 42 mg kg−1, respectively). This was confirmed by the PCA result (Figure 4).
Figure 4. Biplot presenting PCA results for the contents of six undesirable microelements in the grain of the studied cereals. W × S—wheat × spelt; S × W—spelt × wheat hybrids.
No correlations were observed between the content of macro elements, iron, zinc and selenium versus one-kernel weight and yield. The values of the correlation coefficient ranged from −0.212 to 0.198, and were always below the critical value of r = 0.355. Interestingly, significant correlations were noted between the content of zinc and phosphorus (r = 0.537), zinc and sulfur (r = 0.410) and zinc and magnesium (r = 0.403), whereas the correlation between the content of zinc and iron was not significant (r = 0.104). It should also be noted that protein content was bound by significant positive correlations with the content of three macro elements: phosphorus (r = 0.770), sulfur (r = 0.761) and magnesium (r = 0.882), and iron (r = 0.758), zinc (r = 0.642) and selenium (r = 0.383).
Figure 4. Biplot presenting PCA results for the contents of six undesirable microelements in the grainof the studied cereals. W × S—wheat × spelt; S ×W—spelt ×wheat hybrids.
No correlations were observed between the content of macro elements, iron, zinc and seleniumversus one-kernel weight and yield. The values of the correlation coefficient ranged from −0.212 to0.198, and were always below the critical value of r = 0.355. Interestingly, significant correlations werenoted between the content of zinc and phosphorus (r = 0.537), zinc and sulfur (r = 0.410) and zinc andmagnesium (r = 0.403), whereas the correlation between the content of zinc and iron was not significant(r = 0.104). It should also be noted that protein content was bound by significant positive correlationswith the content of three macro elements: phosphorus (r = 0.770), sulfur (r = 0.761) and magnesium (r= 0.882), and iron (r = 0.758), zinc (r = 0.642) and selenium (r = 0.383).
Agronomy 2020, 10, 43 12 of 16
Table 6. The average content (mg kg−1) of macro elements, nutritionally desirable micro elements andundesirable micro elements in the grain of the studied cereals in the two-year experiment.
Macro Elements (103)Micro Elements (101)
Desirable Undesirable
Spelt (n = 5) 15.8 a 7.9 a 5.8 a
Wheat (n = 3) 14.6 b 6.8 b 4.4 b
W × S (n = 13) 15.5 ab 6.9 b 5.2 ab
S ×W (n = 10) 15.3 ab 6.9 b 4.2 b
mean (n = 31) 15.4 7.1 4.9
Macro elements—sum of K, P, S, Mg and Ca; desirable micro elements—sum of Fe, Zn, Cu and Se; undesirable microelements—sum of Cd, Pb, Sr, Ba, Ni and Al; a,b—mean values followed by the same letter do not differ significantlywithin a column at p < 0.01.
4. Discussion
The contents of macronutrients and minerals in the grains of bread wheat and spelt hybrids wereanalyzed in a two-year study. Spelt is a hulled wheat species whose popularity has been revivedin recent years on account of its high nutritional value and high suitability for food production [41].Dietary deficiencies of minerals, nutrients and vitamins pose a growing problem in human nutritionaround the world [42]. The chemical composition of grain is the main determinant of its nutritionalvalue, and it is influenced by both genetic and environmental factors [22]. Despite its unquestionedquality attributes and health benefits, spelt has two main weaknesses; namely, the low threshability ofhulled kernels, and considerable susceptibility to lodging [43]. Spelt is closely related to bread wheat,and attempts are being made to cross the two species with the aim of eliminating the above negativetraits [44]. The resulting new varieties are characterized by high yields and phenotypic similarityto spelt, but they are not highly popular among breeders and agricultural producers, in particularin organic farms. The main argument against bread wheat and spelt hybrids is that these varietiesare devoid of the nutritional and health-promoting benefits of “true spelt.” The proportions of breadwheat genes in such hybrids are difficult to determine because breeders are reluctant to disclose theinformation about source breeding material. The technological properties of grain of the “new” speltvarieties and “true spelt” are comparable. Hybrid grains and “true spelt” grain are characterized bysimilar flour strength and similar rheological properties of dough [45]. The nutritional value of speltand bread wheat hybrids can be accurately determined in studies of genetically stable lines from singlecrosses between the two cereal species. According to some authors, spelt grain is more abundant inmacronutrients, including protein and ash, than bread wheat [26,41,46]. Also in the present study,protein content was nearly 25% higher in T. spelta than in T. aestivum. Regardless of the directionof crossbreeding, protein content was 10%–12% higher in hybrid grains than in bread wheat grain,but it was lower than in spelt grain. The ash content of hybrid grains was higher relative to breadwheat and similar to spelt, which confirms the high nutritional value of hybrids. In hybrid grains, theconcentrations of macronutrients were higher than in bread wheat and only somewhat lower thanin spelt.
The macro element content of hybrid grains occupied the mid-range of the values noted in theparental species. The greatest differences were noted in phosphorus levels. In bread wheat grain,phosphorus occurs in the form of phytic acid which is regarded as an anti-nutritional factor due to itsstrong affinity for divalent cations (Ca2+, Mg2+ and Zn2+). However, the high phosphorus contentof spelt grain cannot be attributed to an abundance of phytic acid, because spelt contains mostlynon-phytate phosphorus [24]. Therefore, hybrid grains are also likely to contain large amounts ofnon-phytate phosphorus. However, the above observation is highly speculative, and its validationrequires further research. The development of new wheat varieties with a higher content of Fe and Znis highly desirable in order to achieve a significant biological impact on health and nutrition, becauseZn deficiency is the ultimate cause of hidden hunger [47]. The parental forms of the studied hybrids
Agronomy 2020, 10, 43 13 of 16
differed significantly in concentration of Zn, but the Zn contents of hybrid grains approximated that ofbread wheat. Similarly to Fe levels in grain, the absence of significant differences in Zn content betweenyears could point to the low influence of environmental factors and the high impact of genetic variationon the content of both elements. Interestingly, the concentrations of Cu and Mn were significantlyaffected by the year of the study, as demonstrated by Femp values which were more than 12and 13-foldhigher for years than treatments.
Selenium is a trace element with important health-promoting properties. Selenium deficiencycan increase the risk of thyroid dysfunction, cancer, severe viral diseases, cardiovascular diseasesand inflammation. At least one billion people around the world are affected by Se deficiency [48].According to Breuer and Longin [49], spelt grain contains around 33% more Se (0.045 mg kg−1) thanbread wheat (0.034 mg kg−1) on average. In the current study, Se concentration was nearly 2.5-foldhigher in the grain of T. spelta (0.022 mg kg−1) than in bread wheat (0.0079 mg kg−1). There are tworeasons why Se concentrations were lower in our study. Firstly, the German researchers studied wintercultivars, which are probably more abundant in Se than spring cultivars because similar differencesexist in einkorn and emmer [50]. Secondly, soil Se is highly available for cereals in particular wheat,and the application of sodium selenate fertilizers in soils deficient in this element can increase Seconcentration in spring wheat grain by as much as 20–30 fold [51]. The average Se content of hybridgrains was approximately 42% (W × S hybrids) and was 77% (S ×W) higher in comparison with breadwheat, and the latter difference was significant. It should also be noted that, similarly to the effect oftreatment × year interaction, the difference between years was not significant. The above implies thatthe Se content of grain in the evaluated treatments was relatively similar in both years. The average Secontent of grain was also similar in both years of the experiment.
Despite the fact that spelt and bread wheat share a common evolutionary history and belongto the same species, a recent study by Liu et al. [52] revealed significant differences in their geneticsequence. Therefore, T. spelta could play a huge role in enriching the gene pool of bread wheat. Forthis reason, spelt has been long used in breeding programs of bread wheat as a source of valuablegenes [28,30,53,54]. Significant genetic variation between spelt and bread wheat is highly promising forimproving the nutritional value of wheat. Further research is required to identify the molecular markersassociated with the high nutrient content of spelt and to enhance spelt and wheat breeding programs.
The presence of significant positive correlations between the contents of protein and six nutritionallydesirable elements (P, S, Mg, Fe, Zn and Se) indicates that selective breeding of hybrids for high proteincontent can be linked with selective breeding for high content of nutritionally desirable elements.Similar correlations in bread wheat were reported by Zhao et al. [5], who observed that both Zn andFe concentrations in grain were positively and significantly correlated with the contents of proteinand P. In the cited study, the correlations with kernel size, kernel weight and bran yield were weak.The above findings are partially consistent with the results of our study, which demonstrated thatthe protein content and grain yield of the analyzed genotypes were bound by a negative, but anon-significant correlation.
The presented findings should not be used to formulate general conclusions regarding thesuitability of bread wheat and spelt hybrids for food production. Nonetheless, our results indicatethat the grains of spelt and bread wheat hybrids are generally more abundant in macronutrients, inparticular protein, than bread wheat. Most importantly, the yields of certain hybrids, in particularwheat and spelt hybrids, do not differ significantly from that of their parental forms. The abovesuggests that some of the examined hybrids can be successfully used for breeding high-yielding breadwheat varieties of high nutrient content. However, the concentrations of desirable macro elementsand micro elements were significantly lower in hybrid grains than in T. spelta, and only somewhathigher than in bread wheat. These findings suggest that spelt and bread wheat hybrids can constitutepromising source material in quality breeding in wheat.
It should also be noted that the yields of breeding lines and varieties are very difficult to determinereliably, because yield is a quantitative trait that is significantly determined by environmental
Agronomy 2020, 10, 43 14 of 16
factors. Bread wheat, spelt and their hybrids are self-pollinating plants that are far more sensitive toenvironmental changes than cross-pollinating crops such as rye. This paper presents the results of atwo-year experiment conducted in a single location. Several locations would have to be analyzed inorder to evaluate yields reliably. Nitrogen fertilization is one of the most important yield components.The nitrogen fertilizer rates for spring bread wheat (for example, a total rate of 120–160 kg ha−1) are notappropriate for spelt, which is susceptible to lodging and does not respond well to excessive nitrogensupply. Unlike in bread wheat, high rates of nitrogen fertilizer do not induce a significant increase inspelt yield. Therefore, a moderate fertilizer rate was applied in the present study (60 kg ha−1). Thisrate is not sufficient for bread wheat, but according to our extensive experience, it is the maximumamount of nitrogen that can be applied to spring spelt without retardants. The optimal rate of nitrogenfertilizer for the analyzed hybrids is difficult to determine based on the current state of knowledge.
Supplementary Materials: The following are available online at http://www.mdpi.com/2073-4395/10/1/43/s1,Table S1: Concentrations of elements (µg g−1) in the soil under the field experiment.
Author Contributions: Conceptualization, E.S. and M.W.; methodology, E.S. and W.K.; formal analysis, W.K. andR.K.; writing—original draft preparation, E.S. and M.W.; supervision, R.K. All authors have read and agreed tothe published version of the manuscript.
Funding: This research was financially supported by the Ministery of Science and Higher Education in the scopeofthe program entitled “Regional Initiative of Excellence” for the years 2019–2022, project number 010/RID/2018/19,amount of funding 12.000.000 PLN.
Acknowledgments: The authors wish to thank Waldemar Lajszner and Łukasz Graban for analysisof macronutrients.
Conflicts of Interest: The authors declare no conflict of interest.
References
1. The Statistics Portal for Market Data, Market Research and Market Studies. Available online: https://www.statista.com/topics/1668/wheat/ (accessed on 2 November 2019).
2. North America’s Grain Marketplace. Available online: https://farmlead.com/blog/graincents/april-8-durum-wheat-weekly-graincents-digest/ (accessed on 2 November 2019).
3. Callejo, M.J.; Vargas-Kostiuk, M.E.; Rodríguez-Quijano, M. Selection, training and validation process of asensory panel for bread analysis: Influence of cultivar on the quality of breads made from common wheatand spelt wheat. J. Cereal Sci. 2015, 61, 55–62. [CrossRef]
4. Fan, M.S.; Zhao, F.J.; Fairweather-Tait, S.J.; Poulton, P.R.; Dunham, S.J.; McGrath, S.P. Evidence of decreasingmineral density in wheat grain over the last 160 years. J. Trace Elem. Med. Biol. 2008, 22, 315–324. [CrossRef][PubMed]
5. Zhao, F.J.; Su, Y.H.; Dunham, S.J.; Rakszegi, M.; Bedo, Z.; McGrath, S.P.; Shewry, P.R. Variation in mineralmicronutrient concentrations in grain of wheat lines of diverse origin. J. Cereal Sci. 2009, 49, 290–295.[CrossRef]
6. Ward, J.L.; Poutanen, K.; Gebruers, K.; Piironen, V.; Lampi, A.-M.; Nyström, L.; Andersson, A.A.M.; Åman, P.;Boros, D.; Rakszegi, M.; et al. The HEALTHGRAIN cereal diversity screen: Concept, results, and prospects(Conference Paper). J. Agric. Food Chem. 2008, 21, 9699–9709. [CrossRef]
7. Sharma, P.; Aggarwal, P.; Kaur, A. Biofortification: A new approach to eradicate hidden hunger. Food Rev.Int. 2016, 33, 1–21. [CrossRef]
8. WHO. Guidelines on Food Fortification with Micronutrients; World Health Organization: Geneva, Switzerland,2006.
9. Bouis, H.E.; Welch, R.M. Biofortification—A sustainable agricultural strategy for reducing micronutrientmalnutrition in the global south. Crop Sci. 2010, 50, 20–30. [CrossRef]
10. Piergiovanni, A.R.; Rizzi, R.; Pannacciulli, E.; Della Gatta, C. Mineral composition in hulled wheat grains: Acomparison between emmer (Triticum dicoccon Schrank) and spelt (T. spelta L.) accessions. Int. J. Food Sci.Nutr. 1997, 4, 381–386. [CrossRef]
11. Tolonen, M. Vitamins and Minerals in Health and Nutrition; Woodhead Publishing Limited: Cambridge, UK,1990; pp. 148–151.
Agronomy 2020, 10, 43 15 of 16
12. Diaz, J.R.; de Las Cagigas, A.; Rodriguez, R. Micronutrient deficiencies in developing and affluent countries.Eur. J. Clin. Nutr. 2003, 57, 70–72. [CrossRef]
13. Whatham, A.; Bartlett, H.; Eperjesi, F.; Blumenthal, C.; Allen, J.; Suttle, C.; Gaskin, K. Vitamin and mineraldeficiencies in the developed world and their effect on the eye and vision. Ophthalmic Physiol. Opt. 2008, 28,1–12. [CrossRef]
14. Bhullar, N.K.; Gruissem, W. Nutritional enhancement of rice for human health: The contribution ofbiotechnology. Biotechnol. Adv. 2013, 31, 50–57. [CrossRef]
15. Miller, D.D.; Welch, R.M. Food system strategies for preventing micronutrient malnutrition. ESA Work. Pap.2013, 13, 1–34. [CrossRef]
16. Quintaes, K.D.; Barberá, R.; Cilla, A. Iron bioavailability in iron-fortified cereal foods: The contribution ofin vitro studies. Crit. Rev. Food Sci. Nutr. 2017, 57, 2028–2041. [CrossRef] [PubMed]
17. International Zinc Association. Available online: https://www.zinc.org/publications/ (accessed on 4 October2019).
18. Neeraja, C.N.; Kulkarni, K.S.; Madhu Babu, P.; Sanjeeva Rao, D.; Surekha, K.; Ravindra Babu, V. Transportergenes identified in landraces associated with high zinc in polished rice through panicle transcriptome forbiofortification. PLoS ONE 2018, 13, e0192362.
19. Velu, G.; Bhattacharjee, R.; Rai, K.N.; Sahrawat, K.L.; Longvah, T. A simple and rapid screening method forgrain zinc content in pearl millet. J. SAT Agric. Res. 2018, 6, 1–4.
20. Silva, C.A.; Abreu, A.F.B.; Ramalho, M.A.P. Genetic control of zinc and iron concentration in common beanseeds. Afr. J. Agric. Res. 2013, 8, 1001–1008.
21. Pandey, A.; Khan, M.K.; Hakki, E.E.; Thomas, G.; Hamurcu, M.; Gezgin, S.; Gizlenci, O.; Akkaya, M.S.Assessment of genetic variability for grain nutrients from diverse regions potential for wheat improvement.Springer Plus 2016, 5, 1912. [CrossRef]
22. Biel, W.; Stankowski, S.; Jaroszewska, A.; Puzynski, S.; Bosko, P. The influence of selected agronomic factorson the chemical composition of spelt wheat (Triticum aestivum ssp. spelta L.) grain. J. Integr. Agric. 2016, 15,1763–1769. [CrossRef]
23. Kohajdová, Z.; Karovicová, J. Nutritional value and baking applications of spelt wheat. Acta Sci. Pol. Technol.Aliment. 2008, 7, 5–14.
24. Ruibal-Mendieta, N.L.; Delacroix, D.L.; Mignolet, J.M.P.; Marques, C.; Rozenberg, R.; Petitjean, G.;Habib-Jiwan, J.L.; Meurens, M.; Qeentin-Leclerco, J.; Delzenne, N.M.; et al. Spelt (Triticum aestivumssp. spelta) as a source of bread making flours and bran naturally enriched in oleic acid and minerals but notphytic acid. J. Agric. Food Chem. 2005, 53, 2751–2759. [CrossRef]
25. Suchowilska, E.; Wiwart, M.; Kandler, W.; Krska, R. A comparison of macro- and microelement concentrationsin the wholegrain of four Triticum species. Plant Soil Environ. 2012, 58, 141–147. [CrossRef]
26. Frakolaki, G.; Giannou, V.; Topakas, E.; Tzia, C. Chemical characterization and bread making potential ofspelt versus wheat flour. J. Cereal Sci. 2018, 79, 50–56. [CrossRef]
27. Dvorak, J.; Deal, K.R.; Luo, M.-C.; You, F.M.; von Borstel, K.; Dehghan, H. The Origin of Spelt andFree-Threshing Hexaploid Wheat. J. Hered. 2012, 103, 426–441. [CrossRef] [PubMed]
28. Wiwart, M.; Suchowilska, E.; Lajszner, W.; Graban, Ł. Identification of hybrids of spelt and wheat and theirparental forms using shape and color descriptors. Comput. Electron. Agric. 2012, 83, 68–76. [CrossRef]
29. Srinivasa, J.; Arun, B.; Mishra, V.K.; Chand, R.; Sharma, D.; Bhardwaj, S.C.; Joshi, A.K. Accessing spelt genepool to develop well-adapted Zinc-and Iron-Rich bread wheat. Crop Sci. 2014, 54, 2000–2010. [CrossRef]
30. Cakmak, I. Enrichment of cereal grains with zinc: Agronomic or genetic biofortification? Plant Soil 2008, 302,1–17. [CrossRef]
31. Schmid, J.E.; Winzeler, M.; Winzeler, H. Analysis of disease resistance and quality characters of F1 hybrids ofcrosses between wheat (Triticum aestivum) and spelt (Triticum spelta). Euphytica 1994, 75, 105–110. [CrossRef]
32. Gacek, E. Polish National List of Agricultural Varieties; Research Center for Cultivar Testing: Słupia Wielka,Poland, 2013.
33. Witzenberger, A.H.; Hack, H.; van den Boom, T. Erläuterungen zum BBCH-Dezimal-Code für dieEntwicklungsstadien des Getreides—mit Abbildungen. Gesunde Pflanz. 1989, 41, 384–388.
34. Wiwart, M.; Suchowilska, E.; Kandler, W.; Sulyok, M.; Groenwald, P.; Krska, R. Can Polish wheat (Triticumpolonicum L.) be an interesting gene source for breeding wheat cultivars with increased resistance to Fusariumhead blight? Genet. Resour. Crop Evol. 2013, 60, 2359–2373. [CrossRef]
Agronomy 2020, 10, 43 16 of 16
35. Suchowilska, E.; Szafranska, A.; Słowik, E.; Wiwart, M. Flour from Triticum polonicum L. as a potentialingredient in bread production. Cereal Chem. 2019, 96, 554–563. [CrossRef]
36. Hoseney, R.C. Principles of Cereal Science and Technology; American Association of Cereal Chemists, Ed.;American Association of Cereal Chemists Inc.: StPaul, MN, USA, 1994; pp. 65–79, 87–93.
37. Bienkowska, T.; Suchowilska, E.; Kandler, W.; Krska, R.; Wiwart, M. Triticum polonicum L. as potential sourcematerial for the biofortification of wheat with essential micronutrients. Plant Genet. Resour. 2019, 17, 213–220.[CrossRef]
38. TIBCO Software Inc. Statistica (Data Analysis Software System), version 13. 2017. Available online:http://statistica.io (accessed on 25 December 2019).
39. European Commission. Commission Regulation (EC) No.1881/2006 of 19 December 2006 setting maximumlevels for certain contaminants in food stuffs. Off. J. Eur. Union 2006, 364, 5–24.
40. Rogers, M.A.M.; Simon, D.G. Aluminium intake and risk of Alzheimer’s disease. Age Ageing 1999, 28,205–209. [CrossRef] [PubMed]
41. Arzani, A.; Ashraf, M. Cultivated ancient wheats (Triticum spp.): A potential source of health-beneficial foodproducts. Compr. Rev. Food Sci. Food Saf. 2017, 16, 477–488. [CrossRef]
42. Gomez-Becerra, H.F.; Erdem, H.; Yazici, A.; Tutus, Y.; Torun, B.; Ozturk, L.; Cakmak, I. Grain concentrationsof protein and mineral nutrients in a large collection of spelt wheat grown under different environments. J.Cereal Sci. 2010, 52, 342–349. [CrossRef]
43. Miedaner, T.; Longin, C.F.H. Neglected Cereals: from Ancient Grains to Superfood; Agrimedia: Clenze, Germany,2016; p. 157.
44. Diordiieva, I.; Riabovol, L.; Riabovol, I.; Serzhyk, O.; Novak, A.; Kotsiuba, S. The characteristics of wheatcollection samples created by Triticum aestivum L./Triticum spelta L.hybridization. Agron. Res. 2018, 16,2005–2015.
45. Wiwart, M.; Szafranska, A.; Wachowska, U.; Suchowilska, E. Quality Parameters and Rheological DoughProperties of 15 Spelt (Triticum spelta L.) Varieties Cultivated Today. Cereal Chem. 2017, 94, 1037–1044.
46. Rapp, M.; Beck, H.; Gütler, H.; Heilig, W.; Starck, N.; Römer, P.; Cuendet, C.; Kurz, H.; Uhlig, F.; Würschum, T.;et al. Spelt: Agronomy, Quality, and Flavor of Its Breads from 30 Varieties Tested across Multiple Environments.Crop Sci. 2017, 57, 1–9. [CrossRef]
47. Graham, R.D.; Welch, R.M.; Saunders, D.A.; Ortiz-Monasterio, I.; Bouis, H.E.; Bonierbale, M.S.; deHaan, S.;Burgos, G.; Thiele, G.; Liria, R.; et al. Nutritious subsistence food systems. Adv. Agron. 2007, 92, 1–74.
48. Lyons, G.; Stangoulis, J.; Graham, R. High-selenium wheat: Biofortification for better health. Nutr. Res. Rev.2003, 16, 45–60. [CrossRef]
49. Breuer, F.; Longin, F. Alte Weizenarten. Ein Comeback fast vergessener Kulturpflanzen. Backwarenaktuell2011, 3, 9–13.
50. Lachman, J.; Miholová, D.; Pivec, V.; Jíru, K.; Janovská, D. Content of phenolic antioxidants and seleniumin grain of einkorn (Triticum monococcum), emmer (Triticum dicoccum) and spring wheat (Triticum aestivum)varieties. Plant Soil Environ. 2011, 57, 235–243. [CrossRef]
51. Eurola, M.; Ekholm, P.; Ylinen, M.; Koivistoinen, P.; Varo, P. Effects of selenium fertilization on the seleniumcontent of cereal grains, flour, and bread produced in Finland. Cereal Chem. 1990, 67, 334–337.
52. Liu, M.; Zhao, Q.; Qi, F.; Stiller, J.; Tang, S.; Miao, J.; Vrána, J.; Holušová, K.; Liu, D.; Doležel, J.; et al.Sequence divergence between spelt and common wheat. Theor. Appl. Genet. 2018, 131, 1125–1132. [CrossRef][PubMed]
53. Zanetti, S.; Winzeler, M.; Keller, M.; Keller, B.; Messmer, M. Genetic analysis of pre-harvest sproutingresistance in a wheat x spelt cross. Crop Sci. 2000, 40, 1406–1417. [CrossRef]
54. Sakai, Y.; Cao, L.; Funata, R.; Shiraishi, T.; Yoshikawa, K.; Maeno, K.; Miura, H.; Onishi, K. QTLs for agronomictraits detected in recombinant inbred lines derived from a bread wheat × spelt cross. Breed. Sci. 2018, 68,587–595. [CrossRef]
© 2019 by the authors. Licensee MDPI, Basel, Switzerland. This article is an open accessarticle distributed under the terms and conditions of the Creative Commons Attribution(CC BY) license (http://creativecommons.org/licenses/by/4.0/).