Embed Size (px)
Citation preview
Tributary-Stream Infiltration in Marsh Creek Valley, North-Central Pennsylvania
U.S. GEOLOGICAL SURVEY Water-Resources Investigations Report 90-4052

TRIBUTARY-STREAM INFILTRATION IN MARSH CREEK VALLEY,
NORTH-CENTRAL PENNSYLVANIA
by John H. Williams
U.S. GEOLOGICAL SURVEY
Water-Resources Investigation Report 90-4052
Albany, New York
1991
For additional information write to:
U.S. Geological Survey 343 Post Office &: Courthouse Post Office Box 1669 Albany, NY 12201
DEPARTMENT OF THE INTERIOR
MANUEL LUJAN, Jr., Secretary
U.S. GEOLOGICAL SURVEY
Dallas L. Peck, Director
ii
Copies of this report may purchased from:
Books and Open-File Reports U.S. Geological Survey Federal Center, Bldg. 41 Box25425 Denver, CO 80225
CONTENTS
Page
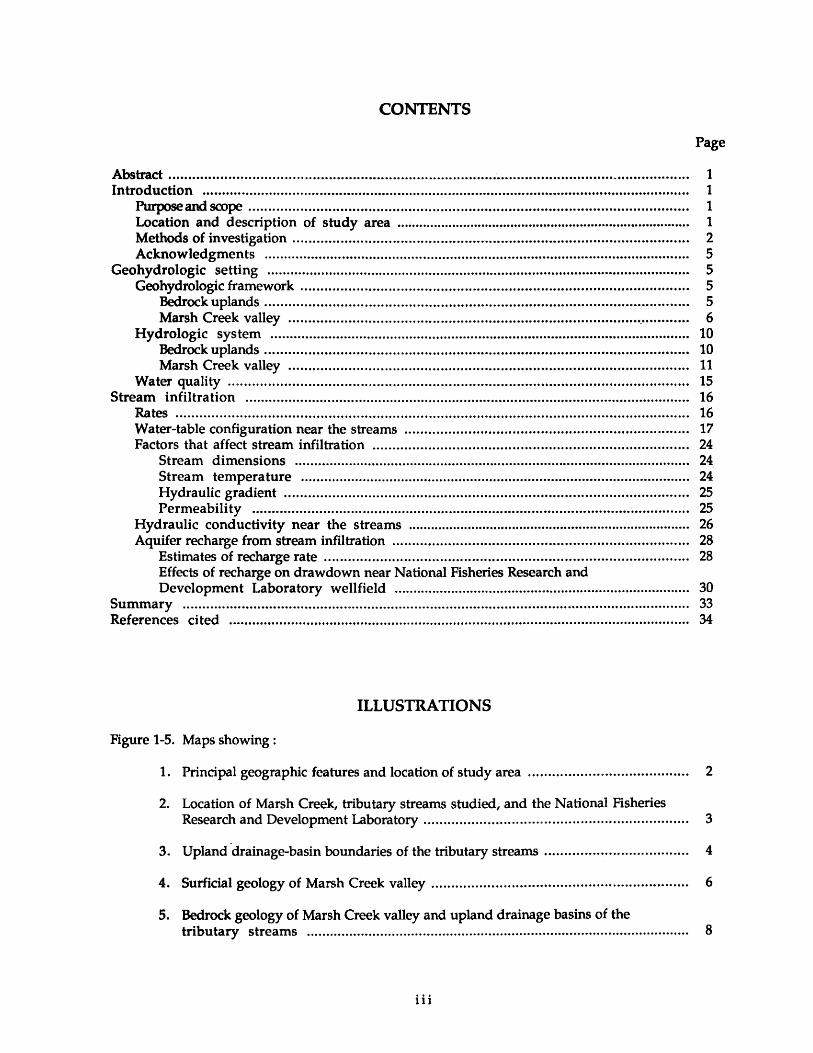
Abstract .................................................................................................................................. 1 Introduction ... ....... ...... ....... .... ... ...... ....... ....... ...... ....... ....... ....................................................... 1
Ptlr}x>se ai1d SCOJ:>e •••••.••••••••••••••••••••••••••••••••••••••••• 0 00 00. 00 •• 00 o.......................... .. . . . . . . . . . . . . . . . . . . . .. . 1 Location and description of study area ......... oooooooooo••oo ....... 0................................................. 1 Methods of investigation ····oo .................. o.•oooo•••o································································ 2 Acknowledgments ·····························oo·························••oooo•·············· .. ···························.... 5
Geohydrologic setting .......................................... 0 00 0 o• •• o 00 ........ o •o ........ o .. o• o o oo••o• .... o ..... 0 ....... 0 ..... o 5 Goo hydrologic framework oo ............ o• ...... 00.00 00 .... •o 00 .. 00 •o·• 00 0 .. 00 ..... o ...... o ... 000 ..... o 0000 .. o ....... o•• ... 5
Bedrock uplands ................. o .. o ........ o ... o .................... ooo .................. oo ... o .... oo ........... o.oooooo 5 Marsh Creek valley o .... o• •o ........ 0 •• 0 ..... 0 0 ... 0 ...... 0 ......... 000. oo• ........... 0 o• o• ...... 000 .... •o ....... o• o• 0000 6
Hydrologic system oooooooooooooooo ... o •• o.oooooo•ooooo•·····oooooo ... o .... o ...... o ......... o .......... o•••••o••········•ooooo•• 10 'Bedrock uplands ..... o •• o •• oo•o••o•o•ooooooooo··•ooooooooooo ............. o ................ o ............................ oo• 10 Marsh Creek valley ......... o• ....... o ............ o o• ........ 00 ....... ooo• .... •o .................. o •o o ...... o ...... 0 .. o 11
Water quality ... o .. o•o•oooo .... o ......... o .... oo ••••••• o .. ••ooo ................. o.o .... o ................ o ... o ... o ... o ..... o.oooo 15 Stream infiltration ..... ooo•••••ooo•oo•o····•ooooooooooooo••oooooooooooooooo ...... o.oo•o•••·o· .. ···o·oo•o ............. o ... ooooooooooo 16
Rates .............. oooo•oo•o•o .............. o ......... oooooooooooooo ...... o ........................................... o.oooo•··· ..... 16 Water-table configuration near the streams ................. o•o•oo ......... oo.o •• oo ........ oo•···••ooo•••ooooooooo 17 Factors that affect stream infiltration ........ oooooo .. oo 000 ... 0 ................. ooooo••oo••• .. o···· .. 0000............ 24
Stream dimensions •o• ooooooooooo••ooooooooooooooooooooooooooo••••o••ooo•o·······••oo••oooooooo••·o· .... oo•ooooooo•o•••oo• 24 Stream temperature ....................................... o ............. ooooo••·o·o••o•······oooooo•o••• .. o•oooo•o••oooo 24 Hydraulic gradient oo ..... o .... o ........... o ...... o ........... o ........... oo·•o••••o•••oo•o••••oo•••o··• .... o.o ... o.o ... 25 Permeability .................................. o.•ooooo•o••· .. ···•o• ....................... o••·········•o•••·o•• ...... o ... o. 25
Hydraulic conductivity near the streams ····••o•oo·····•ooo•o•·oo•ooo•o• ...... o ..... o ...... o ............. o ..... oo .. o 26 Aquifer recharge from stream infiltration ....... oo ...... o•o•••·o····o .......... o .... o ...... oo•o••ooooooo••• .... oo•o 28
Estimates of recharge rate o. o• o• .... o ..... 00 .... •o• o• ..................... •o •• o••· ... o .... 000000000 ........... o •• .... 28 Effects of recharge on drawdown near National Fisheries Research and Development Laboratory wellfield ............................... 00............................................. 30
Summary ................... o•o•o .............................. oo ..... oooooooo ............. o ................. oo ............. oo ......... 00. 33 References cited ....... •o ••••••••••• 0 •• 0 0. •o 0. 000 0 000 0 0 0 0 ••• 0 0 0 .. o 0 0 00 0 0 0 0. 0 ••• 0 ••• 00 0000. o .. 0 o ....... 0. o .. o. o•• o ... o o o 00 o o o o o• •• o o o o o o 34
ILLUSTRATIONS
Figure 1-5. Maps showing:
1. Principal geographic features and location of study area .. o .... 00.00 o o .. 00 ... 00 .o oo o .... o• .... .. 2
20 Location of Marsh Creek, tributary streams studied, and the National Fisheries Research and Development Laboratory o.o •• oo .... oo .. •oooo ...... oo ....... ooooooooo•oo•oooooooo••oooooooo 3
3. Upland ·drainage-basin boundaries of the tributary streams .o.oooooooooooooooooo ............ o.. 4
4o Surficial geology of Marsh Creek valley ... oo ............ 0 •• 00 ........... oo ....................... oo.... 6
5. Bedrock geology of Marsh Creek valley and upland drainage basins of the tributary streams o••· ••oo············· .................................................. 00 ••••• ·····oo·············· 8
iii

ILLUSTRATIONS (continued)
Figure 6. Map showing location of data-collection sites . .. .. .. .. . . .. . . . .. .. . . .. . . .. . . . . . .. .. .. . . . . . .. . . . . . . . . . . . . 9
7. Hydrographs showing streamflow from the upland drainage basins of Asaph and Straight Runs and estimated precipitation, water year 1985 ..................................... 11
8. Graph showing pumping rate at the National Fisheries Research and Development Laboratory wellfield, water year 1985 ................................................ 12
9. Hydrograph showing water levels in wel1470 near Straight Run and well 471 near Asaph Run, water year 1985 .... .... .......... ... .... .... .. .. .. .. ... .... .. .. .... .. . .. .. .. .... .. .. .. .. . .. . 13
10. Map showing water levels in selected wells and at staff gages near Asaph and Straight Runs, October 10, 1984; March 30, 1985; and September 8, 1985 ..................... 14
11. Hydrograph showing average water levels for October in we111 near Long Run, 8 miles west of the study area, 1935-1985 .................................................................... 15
12. Diagrams showing major cation and anion concentrations in water sampled at selected sites ........................................................................................................... 16
13-21. Graphs showing:
13. Cumulative infiltration along the tributary streams 0 ...... 0 ............... 0................. 18
14. Ground-water levels in relation to distance from farthest downstream bedrock outcrop along Asaph and Straight Runs .................................. 0 •o ................... o .. o 20
15. Ground-water levels in relation to distance from Asaph and Straight Runs ........ 21
16. Relation between water levels in well 348 and position of the point of stream dryness along Asaph Run, June through September 1985 o ................... o.. ... .. ........ 21
17. Water levels in selected wells near Asaph Run, water year 1985 ....................... 23
18. Infiltration rate for Asaph and Straight Runs in relation to (A) wetted perimeter, and (B) stream temperature ................... 0 ...... 0.................................. 24
19. Infiltration rate along Asaph and Straight Runs in relation to hydraulic gradient ................................................................... 0 •••••••••• o ••••••••••••• 0 ••••••• o •• • • • 25
20. Relation between ratio of infiltration to hydraulic conductivity and ratio of depth of ground water to stream width ....................... o•····· .. .... .. .. .. .. ... .. .. .. .. .. . .. . 27
21. Streamflow from the upland drainage basins and infiltration in Marsh Creek valley for Asaph and Straight Runs, water year 1985 ................ ~0 ...................... 29
22. Map showing location of pumped well and selected observation wells and points of stream dryness in Straight Run for aquifer tests of November 7-10,1977 and September 5-8 and 16-20, 1985, at the National Fisheries Research and Development Laboratory wellfield .................................................................. 0 ...... 31
iv

ILLUSTRATIONS (continued)
Figure 23. Graphs showing water levels in selected observation wells during aquifer tests at the National Fisheries Research and Development Laboratory wellfield on:
Page
A. November 7-10, 1977 and September 5-8, 1985. B. September 16-20, 1985 .............. 32
PLATE (in pocket)
Plate 1. Sections showing subsurface geology near the tributary streams.
TABLES
Table 1. Drainage-basin area and gradient of the tributary streams and Marsh Creek ............. 2
2. Geohydrologic characteristics of the postglacial and glacial deposits and bedrock..... 8
3. Summary of selected specific-capacity tests in the stratified-drift aquifer near Straight and Asaph Runs .................................................................................. 10
4. Specific conductance and hardness of water sampled at selected stream and well sites . . . . . . . . . . . . . . . . . . . . . . . . . . . . . . . . . . . . . . . . . . . . . . . . . . . . . . . . . . . . . . . . . . . . . . . . . . . . . . . . . . . . . . . . . . . . . . . . . . . . . . . . . . . . . . . . . 15
5. Infiltration rates along the tributary streams ............................................................ 18
6. Water levels and completion information in relation to stream surface for selected wells near the tributary streams .................................................................. 22
7. Stream-infiltration variables and estimated hydraulic conductivity near the tributary streams ....... .. ..... ... . .. . . . . . . . . . . . . . ............. ... .. . . . . ... . . . . . . ....... ... . ... . .. . . . . . . . . . . .. . . . . . . .. . 27
8. Sources and estimated rates of recharge to the stratified-drift aquifer in Marsh Creek valley, water year 1985 ........................................................................ 28
9. Monthly and annual averages of streamflow from the upland drainage basins and infiltration in Marsh Creek valley for Asaph and Straight Runs, water year 1985 . . . . . . . . .. . ...... .... ....... .. . ... . ... . . . . .... .. ... ... . . ...... ........ .. . . . . . .. . .. .. . .. .. .. . ... .. . . . .. . . . .. . . . . . .. 29
10. Summary of selected aquifer tests at the National Fisheries Research and Development Laboratory wellfield ........................................................................... 30
APPENDIXES
Appendix 1. Completion information for the selected wells and test holes . . .... .. . .. .. ... .... .. . .. .. .. . . 36
2. Streamflow and infiltration rates for the tributary-stream sites .......................... 38
v
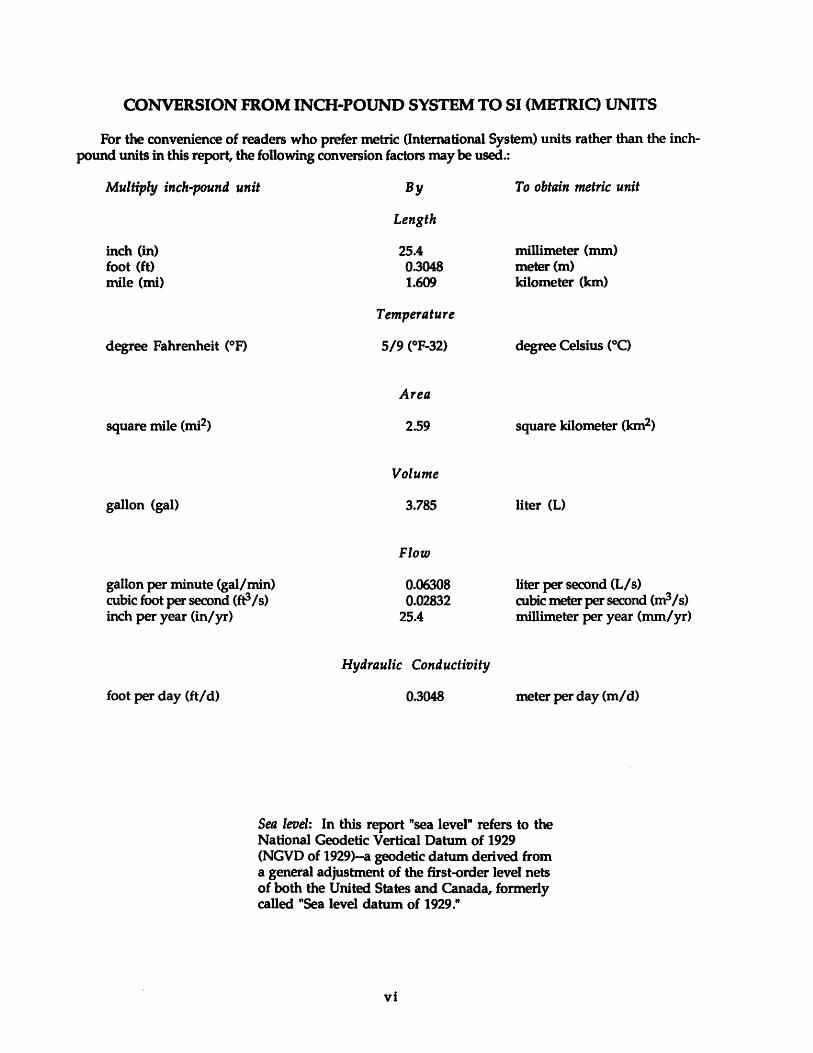
CONVERSION FROM INCH-POUND SYSTEM TO SI (METRIC) UNITS
For the convenience of readers who prefer metric (International System) units rather than the inchpound units in this report, the following conversion factors may be used.:
Multiply inch-pound unit By To obtain metric unit
inch (in) foot (ft) mile (mi)
degree Fahrenheit (0 F)
square mile (mi2)
gallon (gal)
Length
25.4 0.3048 1.609
Temperature
Area
2.59
Volume
3.785
Flow
millimeter (mm) meter (m) kilometer (km)
degree Celsius (°C)
square kilometer (km2)
liter (L)
gallon per minute (gal/min) cubic foot per second (ft3 Is) inch per year (in/yr)
0.06308 0.02832
25.4
liter per second (L/ s) cubic meter per second (m3 Is) millimeter per year (mm/yr)
foot per day (ft/ d)
Hydraulic Conductivity
0.3048 meter per day (m/ d)
Sea leoel: In this report "sea level" refers to the National Geodetic Vertical Datum of 1929 (NGVD of 1929)-a geodetic datum derived from a general adjustment of the first-order level nets of both the United States and Canada, formerly called "Sea level datum of 1929."
vi
TRIBUTARY-STREAM INFILTRATION IN MARSH CREEK VALLEY, NORTH-CENTRAL PENNSYLVANIA
By John H. Williams
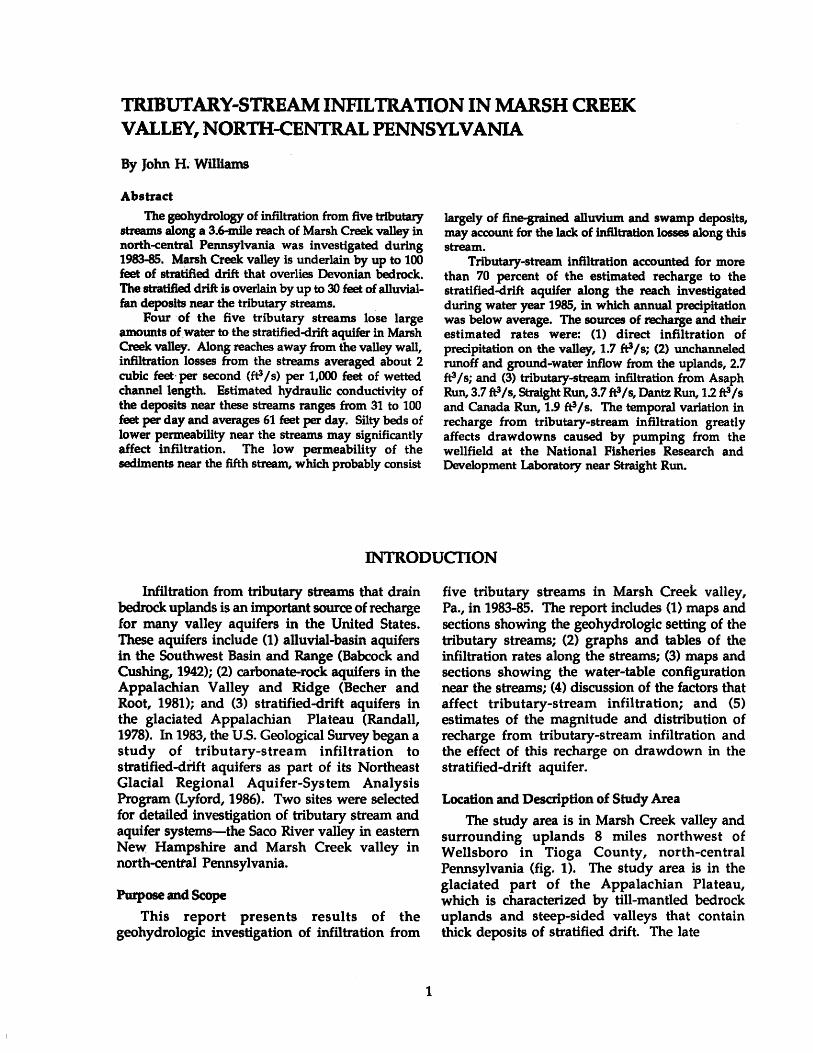
Abstract
The geohydrology of infiltration from five tributary streams along a 3.6-mlle reach of Marsh Creek valley in north-central Pennsylvania was investigated during 1983-85. Marsh Creek valley is underlain by up to 100 feet of stratified drift that overlies Devonian bedrock. The stratified drift is overlain by up to 30 feet of alluvialfan deposits near the tributary streams.
Four of the five tributary streams lose large amounts of water to the stratified-drift aquifer in Marsh Creek valley. Along reaches away from the valley wall, infiltration losses from the streams averaged about 2 cubic feet· per second (ft:1 Is) per 1,000 feet of wetted channel length. Estimated hydraulic conductivity of the deposits near these streams ranges from 31 to 100 feet per day and averages 61 feet per day. Silty beds of lower permeability near the streams may significantly affect infiltration. The low permeability of the sediments near the fifth stream, which probably consist
largely of fine-grained alluvium and swamp deposits, may account for the lack of infiltration losses along this stream.
Tributary-stream infiltration accounted for more than 70 percent of the estimated recharge to the stratified-drift aquifer along the reach investigated during water year 1985, in which annual precipitation was below average. The sources of recharge and their estimated rates were: (1) direct infiltration of precipitation on the valley, 1.7 ft11s; (2) unchanneled runoff and ground-water inflow from the uplands, 2.7 ft:1 Is; and (3) tributary-stream infiltration from Asaph Run, 3.7 ft3 Is, Straight Run, 3.7 ft3 Is, Dantz Run, 1.2 ft3 Is and Canada Run, 1.9 ft31s. The temporal variation in recharge from tributary-stream infiltration greatly affects drawdowns caused by pumping from the wellfield at the National Fisheries Research and Development Laboratory near Straight Run.
INTRODUCI'ION
Infiltration from tributary streams that drain bedrock uplands is an important source of recharge for many valley aquifers in the United States. These aquifers include (1) alluvial-basin aquifers in the Southwest Basin and Range (Babcock and Cushing, 1942); (2) carbonate-rock aquifers in the Appalachian Valley and Ridge (Becher and Root, 1981); and (3) stratified-drift aquifers in the glaciated Appalachian Plateau (Randall, 1978). In 1983, the U.S. Geological Survey began a study of tributary-stream infiltration to stratified-diift aquifers as part of its Northeast Glacial Regional Aquifer-Sys tern Analysis Program (Lyford, 1986). Two sites were selected for detailed investigation of tributary stream and aquifer systems-the Saco River valley in eastern New: Hampshire and Marsh Creek valley in north-central Pennsylvania.
Purpose and Scope This report presents results of the
geohydrologic investigation of infiltration from
1
five tributary streams in Marsh Creek valley, Pa., in 1983-85. The report includes (1) maps and sections showing the geohydrologic setting of the tributary streams; (2) graphs and tables of the infiltration rates along the streams; (3) maps and sections showing the water-table configuration near the streams; (4) discussion of the factors that affect tributary-stream infiltration; and (5) estimates of the magnitude and distribution of recharge from tributary-stream infiltration and the effect of this recharge on drawdown in the stratified-drift aquifer.
Location and Description of Study Area
The study area is in Marsh Creek valley and surrounding uplands 8 miles northwest of Wellsboro in Tioga County, north-central Pennsylvania (fig. 1). The study area is in the glaciated part of the Appalachian Plateau, which is characterized by till-mantled bedrock uplands and steep-sided valleys that contain thick deposits of stratified drift. The late
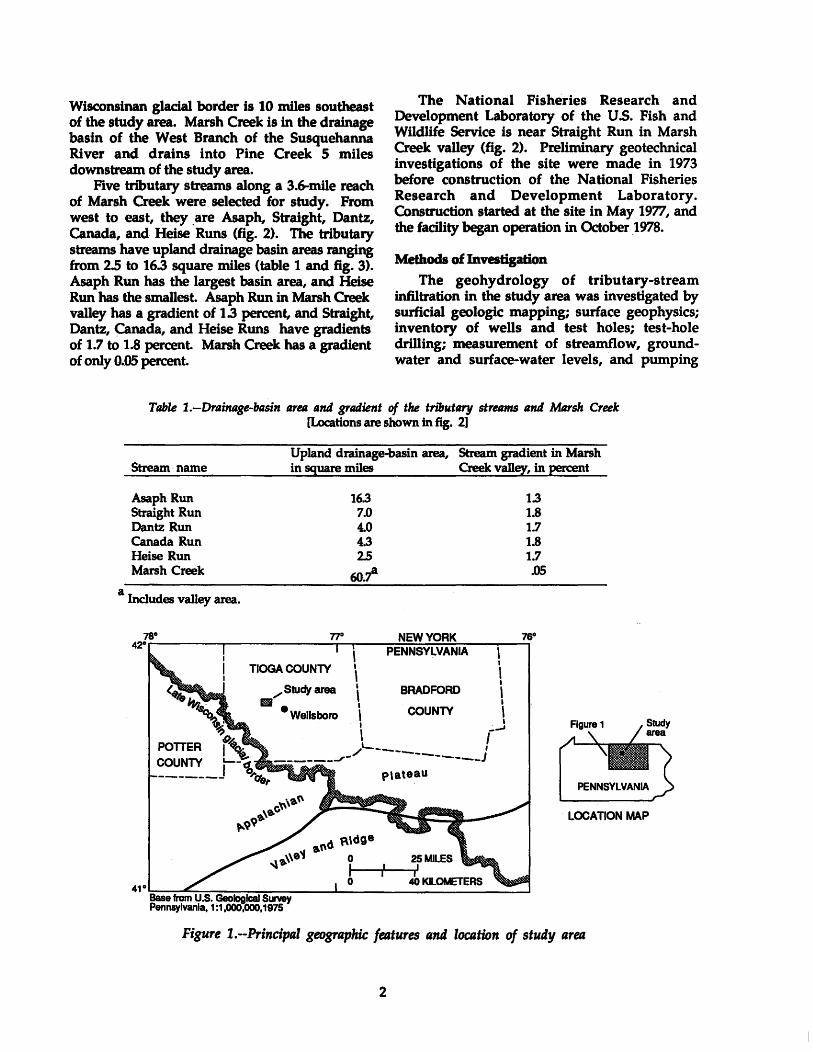
Wisconsinan gladal border is 10 miles southeast of the study area. Marsh Creek is in the drainage basin of the West Branch of the Susquehanna River and drains into Pine Creek 5 miles downstream of the study area.
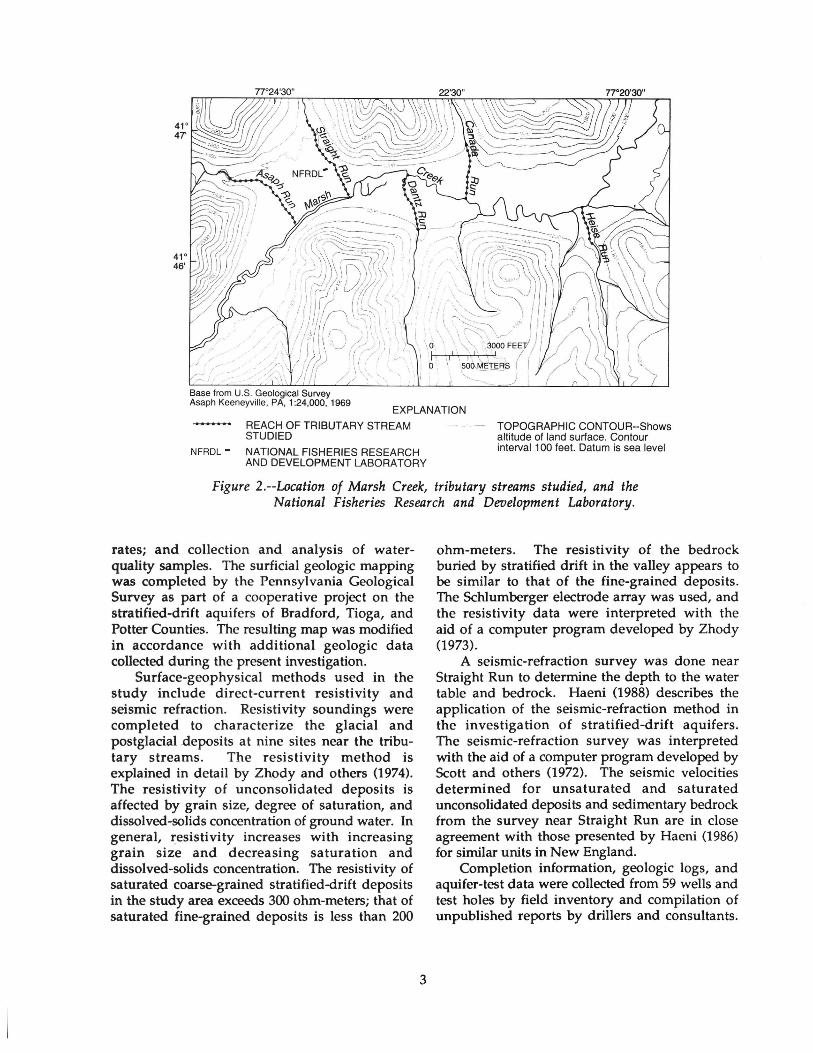
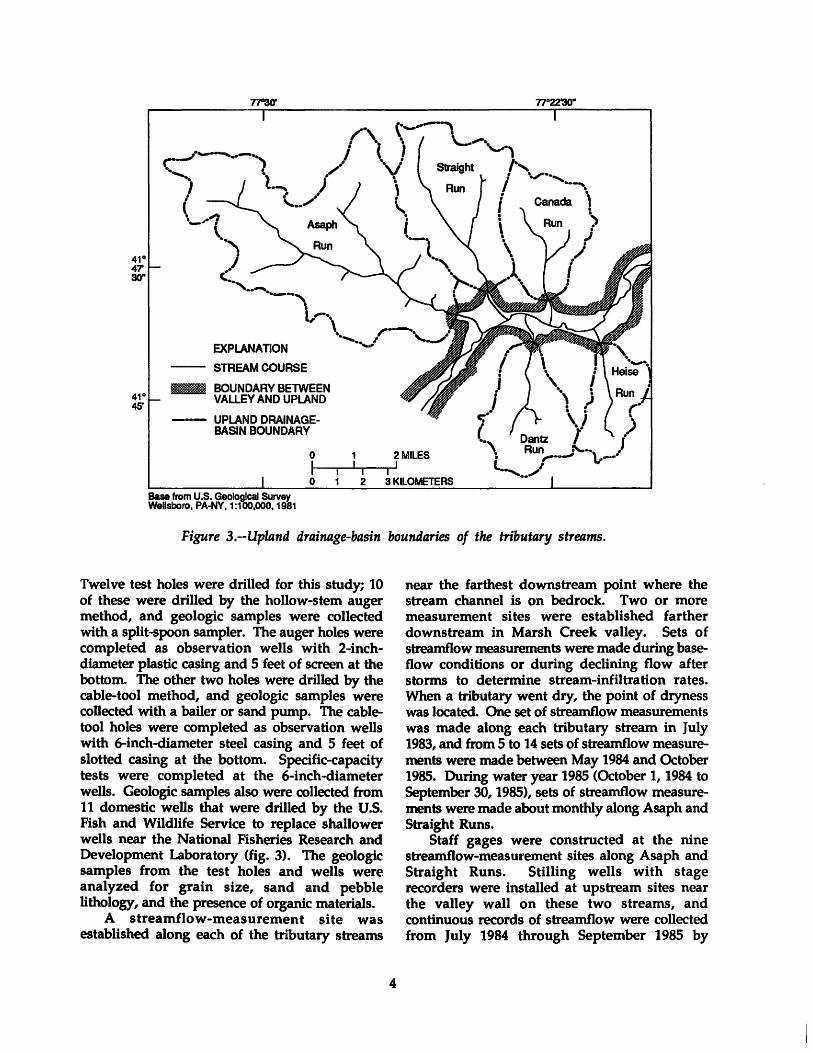
Five tributary streams along a 3.6-mile reach of Marsh Creek were. selected for study. From west to east, they .are Asaph, Straight, Dantz, Canada, and Heise Runs (fig. 2). The tributary streams have upland drainage basin areas ranging from 2.5 to 16.3 square miles (table 1 and fig. 3). Asaph Run has the largest basin area, and Heise Run has the smallest. Asaph Run in Marsh Creek valley has a gradient of 1.3 percent, and Straight, Dantz, Canada, and Heise Runs have gradients of 1.7 to 1.8 percent. Marsh Creek has a gradient of only 0.05 percent.
The National Fisheries Research and Development Laboratory of the ·U.S. Fish and Wildlife Service is near Straight Run in Marsh Creek valley (fig. 2). Preliminary geotechnical investigations of the site were made in 1973 before construction of the National Fisheries Research and Development Laboratory. Construction started at the site in May 1977, and the facility began operation in October 1978.
Methods of Investigation
The geohydrology of tributary-stream infiltration in the study area was investigated by surficial geologic mapping; surface geophysics; inventory of wells and test holes; test-hole
· drilling; measurement of streamflow, groundwater and surface-water levels, and pumping
Table I.-Drainage-basin area and gradient of the tributary streams and Mllrsh Creek [Locations are shown in fig. 2]
a
Stream name
AsaphRun Straight Run DantzRun Canada Run Heise Run Marsh Creek
Includes valley area.
POTTER
:ou~~-J
Upland drainage-basin area, Stream gradient in Marsh in square miles Creek valley, in percent
Tr
TIOGA COUNTY
..,....study area
•• Wellsboro
16.3 7.0 4.0 4.3 2.5
60.fl
\ I
\ I
\ I
\ I
NEW YORK PENNSYLVANIA
BRADFORD
COUNTY
1.3 1.8 1.7 1.8 1.7
.OS
76°
LOCATION MAP
Figure 1.-Principal geographic features and location of study area
2
o!
))",'' Base from U.S. Geological Survey Asaph Keeneyville , PA, 1:24,000, 1969
EXPLANATION
REACH OF TRIBUTARY STREAM STUDIED
NFRDL- NATIONAL FISHERIES RESEARCH AND DEVELOPMENT LABORATORY
TOPOGRAPHIC CONTOUR--Shows altitude of land surface. Contour interval 100 feet. Datum is sea level
Figure 2.--Location of Marsh Creek, tributary streams studied, and the National Fisheries Research and Development Laboratory.
rates; and collection and analysis of waterquality samples. The surficial geologic mapping was completed by the Pennsylvania Geological Survey as part of a cooperative project on the stratified-drift aquifers of Bradford, Tioga, and Potter Counties. The resulting map was modified in accordance with additional geologic data collected during the present investigation.
Surface-geophysical methods used in the study include direct-current resistivity and seismic refraction. Resistivity soundings were completed to characterize the glacial and postglacial deposits at nine sites near the tributary streams. The resistivity method is explained in detail by Zhody and others (1974). The resistivity of unconsolidated deposits is affected by grain size, degree of saturation, and dissolved-solids concentration of ground water. In general, resistivity increases with increasing grain size and decreasing saturation and dissolved-solids concentration. The resistivity of saturated coarse-grained stratified-drift deposits in the study area exceeds 300 ohm-meters; that of saturated fine-grained deposits is less than 200
3
ohm-meters. The resistivity of the bedrock buried by stratified drift in the valley appears to be similar to that of the fine-grained deposits. The Schlumberger electrode array was used, and the resistivity data were interpreted with the aid of a computer program developed by Zhody (1973).
A seismic-refraction survey was done near Straight Run to determine the depth to the water table and bedrock. Haeni (1988) describes the application of the seismic-refraction method in the investigation of stratified-drift aquifers. The seismic-refraction survey was interpreted with the aid of a computer program developed by Scott and others (1972). The seismic velocities determined for unsaturated and saturated unconsolidated deposits and sedimentary bedrock from the survey near Straight Run are in close agreement with those presented by Haeni (1986) for similar units in New England.
Completion information, geologic logs, and aquifer-test data were collected from 59 wells and test holes by field inventory and compilation of unpublished reports by drillers and consultants.
41° 47' 30"
EXPLANATION
-- STREAM COURSE
IIIII BOUNDARYBE~EEN VALLEY AND UPLAND
--- UPLAND DRAINAGEBASIN BOUNDARY
0 1 2MILES I I I I I
0 2 3 KILOMETERS Base from U.S. Geological Survey WeHsboro, PA-NY, 1 :100,000, 1981
Figure 3.--Upland drainage-basin boundaries of the tributary streams.
Twelve test holes were drilled for this study; 10 of these were drilled by the hollow-stem auger method, and geologic samples were collected with a split-spoon sampler. The auger holes were completed as observation wells with 2-inchdiameter plastic casing and 5 feet of screen at the bottom. The other two holes were drilled by the cable-tool method, and geologic samples were collected with a bailer or sand pump. The cabletool holes were completed as observation wells with 6-inch-diameter steel casing and 5 feet of slotted casing at the bottom. Specific-capacity tests were completed at the 6-inch-diameter wells. Geologic samples also were collected from 11 domestic wells that were drilled by the U.S. Fish and Wildlife Service to replace shallower wells near the National Fisheries Research and Development Laboratory (fig. 3). The geologic samples from the test holes and wells were analyzed for grain size, sand and pebble lithology, and the presence of organic materials.
A streamflow-measurement site was established along each of the tributary streams
4
near the farthest downstream point where the stream channel is on bedrock. Two or more measurement sites were established farther downstream in Marsh Creek valley. Sets of streamflow measurements were made during baseflow conditions or during declining flow after storms to determine stream-infiltration rates. When a tributary went dry, the point of dryness was located. One set of streamflow measurements was made along each tributary stream in July 1983, and from 5 to 14 sets of streamflow measurements were made between May 1984 and October 1985. During water year 1985 (October 1, 1984 to September 30, 1985), ~ts of streamflow measurements were made about monthly along Asaph and Straight Runs.
Staff gages were constructed at the nine streamflow-measurement sites along Asaph and Straight Runs. Stilling wells with stage recorders were installed at upstream sites near the valley wall on these two streams, and continuous records of streamflow were collected from July 1984 through September 1985 by
methods desoibed by Kennedy (1984). Surfacewater levels were measured at the staff gages periodically between July 1984 and October 1985. During water year 1985, surface-water levels and points of stream dryness on these two streams were measured weekly and more frequently after selected storms.
A network of 24 observation wells was established in selected areas along the tributary streams. Ground-water levels were measured periodically between May 1984 and October 1985. During water year 1985, water levels were measured weekly and more .frequently after selected storms in the observation wells along Asaph, Straight, and Heise Runs.
Two aquifer tests were completed by the U.S. Geological Survey and U.S. Fish and Wildlife Service in September 1985 at the National Fisheries Research and Development Laboratory wellfield. Data on pumping rates, ground-water levels in more than 20 observation wells, and stream infiltration along Straight and Asaph Runs were collected periodically during the tests. During the first test, all water pumped from the wellfield was discharged to Marsh Creek, but during the second test, some was discharged to
Straight Run upstream of the wellfield. Samples of ground water and surface water
were collected at 12 sites and were analyzed in the field for specific conductance and hardness. Water-quality samples from 8 sites were analyzed for total dissolved solids, major cation and anions, and metals by the Pennsylvania Department of Environmental Resources as part of the cooperative project with the Pennsylvania Geological Survey.
Acknowledgments
The author expresses appreciation to the residents of the study area for allowing access to private property and wells. The cooperation of the staff of the National Fisheries Research and Development Laboratory also is greatly appreciated. Special thanks are extended to Michael Smith of the National Fisheries Research and Development Laboratory for his extra time and effort. Lawrence Taylor of the Susquehanna River Basin Commission is acknowledged for his technical support to the study while working for the Pennsylvania Geological Survey.
GEOHYDROLOGIC SEITING
Geohydrologic Framework
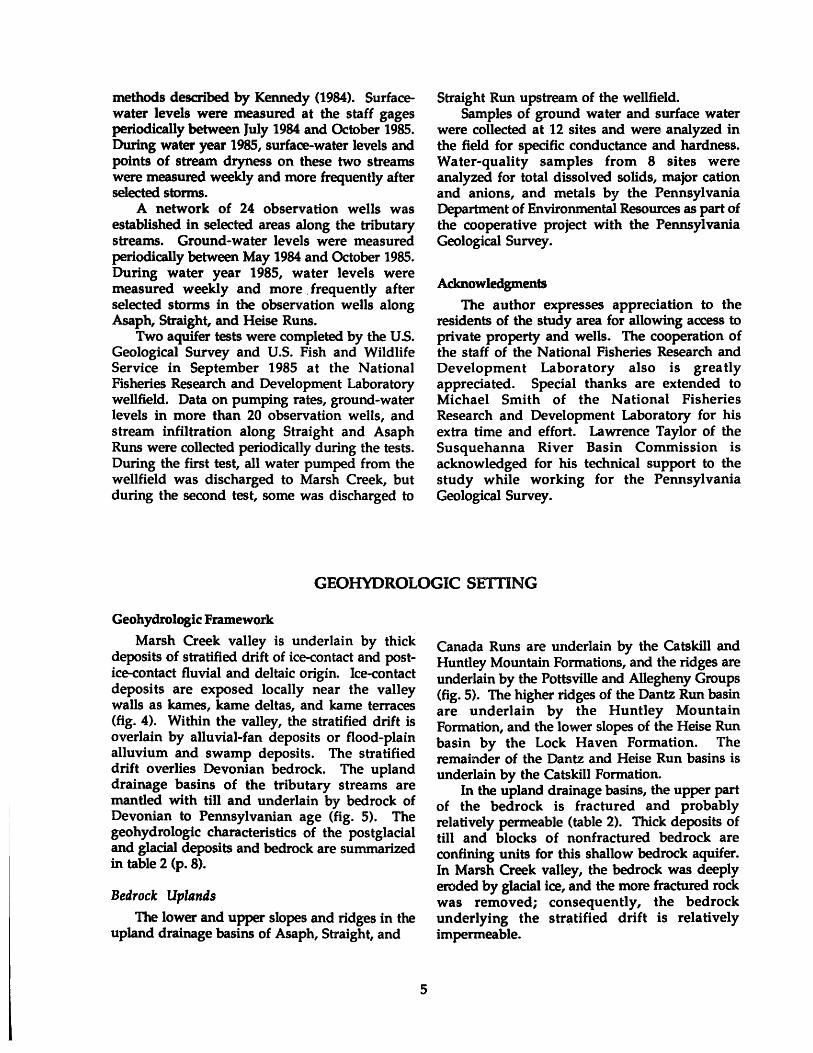
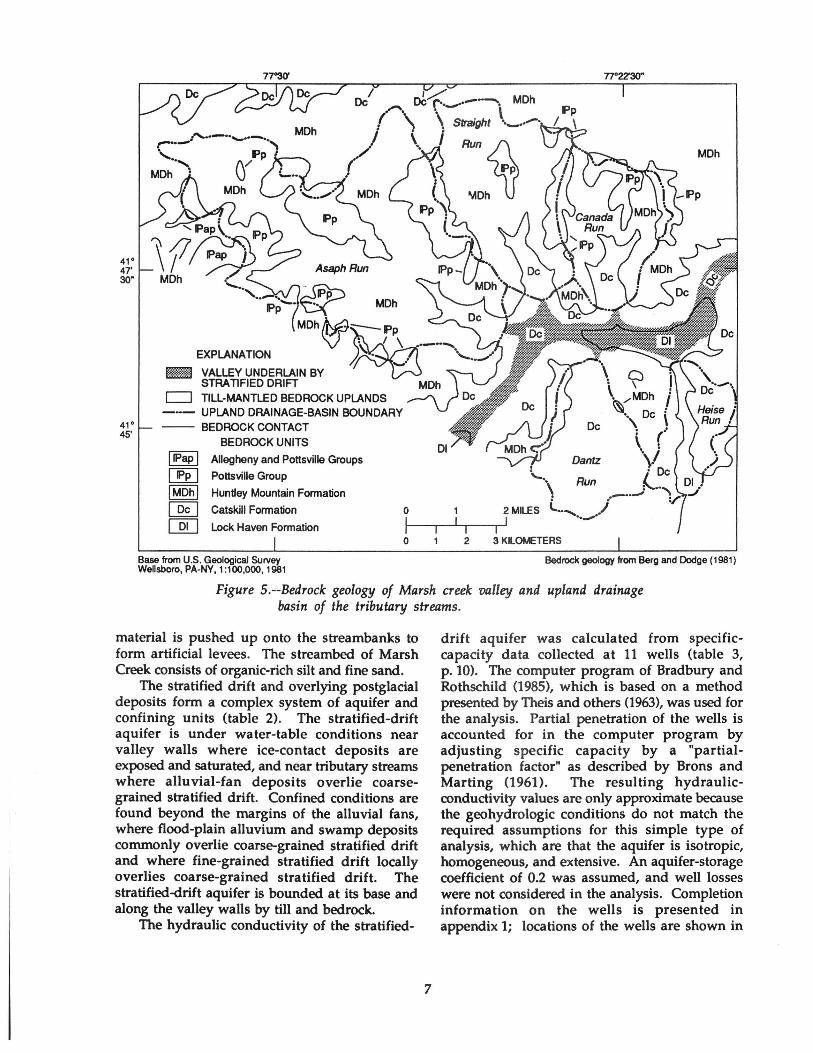
Marsh Creek valley is underlain by thick deposits of stratified drift of ice-contact and postice-contact fluvial and deltaic origin. Ice-contact deposits are exposed locally near the valley walls as kames, kame deltas, and kame terraces (fig. 4). Within the valley, the stratified drift is overlain by alluvial-fan deposits or flood-plain alluvium and swamp deposits. The stratified drift overlies Devonian bedrock. The upland drainage basins of the tributary streams are mantled with till and underlain by bedrock of Devonian to Pennsylvanian age (fig. 5). The geohydrologic characteristics of the postglacial and glacial deposits and bedrock are summarized in table 2 (p. 8).
Bedrock Uplands
The lower and upper slopes and ridges in the upland drainage basins of Asaph, Straight, and
5
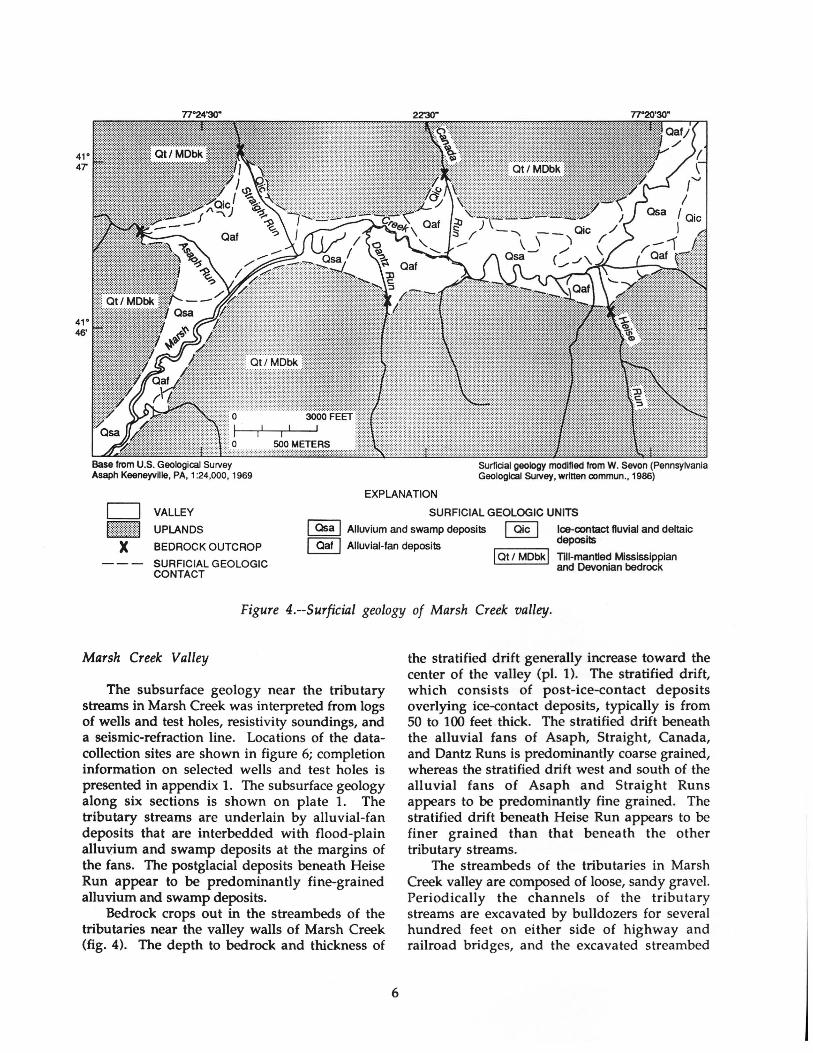
Canada Runs are underlain by the Catskill and Huntley Mountain Formations, and the ridges are underlain by the Pottsville and Allegheny Groups (fig. 5). The higher ridges of the Dantz Run basin are underlain by the Huntley Mountain Formation, and the lower slopes of the Heise Run basin by the Lock Haven Formation. The remainder of the Dantz and Heise Run basins is underlain by the Catskill Formation.
In the upland drainage basins, the upper part of the bedrock is fractured and probably relatively permeable (table 2). Thick deposits of till and blocks of nonfractured bedrock are confining units for this shallow bedrock aquifer. In Marsh Creek valley, the bedrock was deeply eroded by glacial ice, and the more fractured rock was removed; consequently, the bedrock underlying the str~tified drift is relatively impermeable.
41° 47
Base from U.S. Geological Survey Asaph Keeneyvllle, PA, 1:24,000, 1969
SOOMETERS
Surfidal geology modified from W. Sevon (Pennsylvania Geological Survey, written commun., 1986)
EXPLANATION
SURFICIAL GEOLOGIC UNITS c=J VALLEY
[htt)t:j UPLANDS I Osa I Alluvium and swamp deposits [§§] Ice-contact fluvial and deltaic
~ Alluvial-fan deposits deposits X BEDROCK OUTCROP
--- SURFICIAL GEOLOGIC CONTACT
I Ot I MDbk I Till-mantled Mississippian and Devonian bedrock
Figure 4.--Surficilll geology of Marsh Creek valley.
Marsh Creek Valley
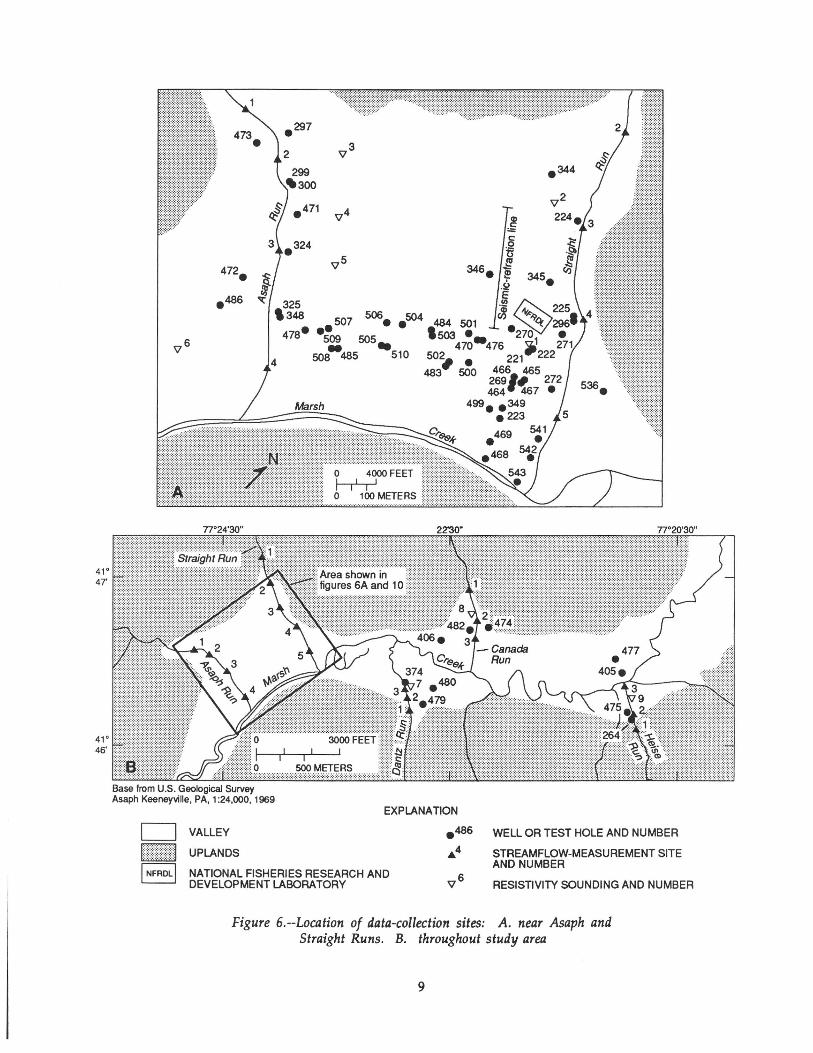
The subsurface geology near the tributary streams in Marsh Creek was interpreted from logs of wells and test holes, resistivity soundings, and a seismic-refraction line. Locations of the datacollection sites are shown in figure 6; completion information on selected wells and test holes is presented in appendix 1. The subsurface geology along six sections is shown on plate 1. The tributary streams are underlain by alluvial-fan deposits that are interbedded with flood-plain alluvium and swamp deposits at the margins of the fans. The postglacial deposits beneath Heise Run appear to be predominantly fine-grained alluvium and swamp deposits.
Bedrock crops out in the streambeds of the tributaries near the valley walls of Marsh Creek (fig. 4). The depth to bedrock and thickness of
6
the stratified drift generally increase toward the center of the valley (pl. 1). The stratified drift, which consists of post-ice-contact deposits overlying ice-contact deposits, typically is from 50 to 100 feet thick. The stratified drift beneath the alluvial fans of Asaph, Straight, Canada, and Dantz Runs is predominantly coarse grained, whereas the stratified drift west and south of the alluvial fans of Asaph and Straight Runs appears to be predominantly fine grained. The stratified drift beneath Heise Run appears to be finer grained than that beneath the other tributary streams.
The streambeds of the tributaries in Marsh Creek valley are composed of loose, sandy gravel. Periodically the channels of the tributary streams are excavated by bulldozers for several hundred feet on either side of highway and railroad bridges, and the excavated streambed
41° 47' 30"
41° 45'
EXPLANATION
m::~:::M VALLEY UNDERLAIN BY STRATIFIED DRIFT
CJ TILL-MANTLED BEDROCK UPLANDS -··- UPLAND DRAINAGE-BASIN BOUNDARY -- BEDROCK CONTACT
BEDROCK UNITS
IIPap I Allegheny and Pottsville Groups
~ Pottsville Group
n°2230"
Run~ Pp
".1Dh
MDh
I MDh I Huntley Mountain Formation
~ Catskill Formation 0 2MILES
[Q[J Lock Haven Formation 1--,.---...,_-r-'1 I I 0 2 3 KILOMETERS
Base from U.S. Geological Survey Wellsboro, PA-NY, 1:100,000, 1981
Bedrock geology from Berg and Dodge (1981)
Figure 5.--Bedrock geology of Marsh creek valley and upland drainage basin of the tributary streams.
material is pushed up onto the streambanks to form artificial levees. The streambed of Marsh Creek consists of organic-rich silt and fine sand.
The stratified drift and overlying postglacial deposits form a complex system of aquifer and confining units (table 2). The stratified-drift aquifer is under water-table conditions near valley walls where ice-contact deposits are exposed and saturated, and near tributary streams where alluvial-fan deposits overlie coarsegrained stratified drift. Confined conditions are found beyond the margins of the alluvial fans, where flood-plain alluvium and swamp deposits commonly overlie coarse-grained stratified drift and where fine-grained stratified drift locally overlies coarse-grained stratified drift. The stratified-drift aquifer is bounded at its base and along the valley walls by till and bedrock.
The hydraulic conductivity of the stratified-
7
drift aquifer was calculated from specificcapacity data collected at 11 wells (table 3, p. 10). The computer program of Bradbury and Rothschild (1985), which is based on a method presented by Theis and others (1963), was used for the analysis. Partial penetration of the wells is accounted for in the computer program by adjusting specific capacity by a "partialpenetration factor" as described by Brons and Marting (1961). The resulting hydraulicconductivity values are only approximate because the geohydrologic conditions do not match the required assumptions for this simple type of analysis, which are that the aquifer is isotropic, homogeneous, and extensive. An aquifer-storage coefficient of 0.2 was assumed, and well losses were not considered in the analysis. Completion information on the wells is presented in appendix 1; locations of the wells are shown in

Table 2.-Geohydrologic characteristics of the postglacial and glacial deposits and bedrock.
Age Geologic Unit Lithology Distribution and Thickness Hx:drology POSTGLACIAL DEPOSITS
Alluvium and Silt and fine sand with Flood plain of Marsh Creek Surficial confining unit; swamp organic-rich layers. and other low-lying areas; upward leakage from deposits about 20 feet thick. stratified-drift aquifer
discharges to Marsh Creek or is lost as evapotranspiration.
Alluvial-fan Silty sand and gravel Alluvial fans of the tributary Part of stratified-drift aquifer deposits with some organic streams in Marsh Creek where saturated; infiltration
valley; about 15 to 30 feet from direct precipitation and matter. thick. tributary streams recharges
underlying stratified drift. STRATIFIED DRIFT
Post-ice- Variably silty sand and Buried beneath postglacial contact fluvial gravel interbedded with deposits within Marsh and deltaic silt and sand; most Creek valley; typical deposits grains appear to be maximum thickness is
~ sandstone and shale of about 50 feet. Part of stratified -drift aquifer < local origin. where saturated; finer ~ Ice-contact Variably silty sand and Locally exposed near the grained beds are ~ :J fluvial and gravel interbedded with walls of Marsh Creek valley discontinuous confining units a deltaic silt and sand; contains as kames, kames deltas, and
deposits some limestone and kame terraces and buried
other calcareous beneath post-ice-contact
pebbles not of local and postglacial deposits
origin; may show within Marsh Creek valley;
collapsed features. typical maximum thickness is about 50 feet.
TILL
Unsorted mixture of Mantles bedrock in the Part of basal and lateral clay- to boulder-sized uplands; locally may overlie boundary of stratified-drift material; compact. bedrock in Marsh Creek aquifer; surficial confining
valley; typically less than 10 unit of shallow bedrock feet thick. aguifer in uElands.
BEDROCK
~ Allegheny Sandstone, shale and High upland ridges
! Group coal beds
Pottsville Sandstone and High upland ridges; about Shallow bedrock aquifer in
I Group conglomerate with 150 feet thick. uplands. some thin coal beds;
Q.. fluvial. z Huntley Sandstone with some Upper slopes and some ~ Mountain shale; fluvial ridges in the uplands; about Q..
~m Formation 650 feet thick.
-!a Catskill Sandstone and shale; Slopes and some low ridges ~~
~~ Formation shale; deltaic in the uplands and part of
Marsh Creek valley; about Shallow bedrock aquifer in 500 feet. uplands; part of basal and
~ Lock Haven Shale and· sandstone; Part of Marsh Creek valley lateral boundary of stratified-
~ Formation marine; contains some and the lower slope of the drift aquifer in Marsh Creek
~ calcareous beds. Heise Run basin; about valley. 0
3,000 feet thick.
8
41" 4T
41° 46'
Base from U.S. Geological Survey Asaph Keeneyville, PA, 1:24,000, 1969
VALLEY
UPLANDS
~ v5 ~
346• w 345 •
• $1
.~§y225 .507 506e e504 484 501 r$. 1-,..-9~ 2961 • ,503 • 270 • 5~ 505.. 470-476 ji 27
508 485 510 502 221 222
483.., ~0 466,465 269 ~ 272 464 467 •
499 •• 349 • 223
EXPLANATION
.486
&4
469 541
• • 468 54J
543
WELL OR TEST HOLE AND NUMBER
STREAMFLOW-MEASUREMENT SITE AND NUMBER
NATIONAL FISHERIES RESEARCH AND DEVELOPMENT LABORATORY RESISTIVITY SOUNDING AND NUMBER
Figure 6.--Location of data-collection sites: A. near Asaph and Straight Runs. B. throughout study area
9

Table 3.-Summary of selected specific-capacity tests in the stratified-drift aquifer near Straight and Asaph Runs
Length of test, Tested well Date of test in hours
222 C'B/73 3 223, 468, 469 ~/73 1
269 C'B/71 29 270 10/71 9 271 10/71 24 272 11/71 8 467 11/73 6 470 11/85 0.3 471 11/85 1
a Average based on range of reported drawdowns.
figure 6. Ten of the tested wells are near Straight Run, the other is near Asaph Run. Estimates of hydraulic conductivity for the aquifer range from 38 to 330 feet per day (ft/ d) and average 200 ft/ d.
Hydrologic: System
Bedrock Uplands
The bedrock aquifer in the uplands is recharged by infiltration of precipitation through the overlying till. Ground water flows in the bedrock aquifer toward topographic lows and discharges to the tributary streams. Along the valley walls of Marsh Creek, some ground water flows from the bedrock uplands to the stratifieddrift aquifer.
Tributary streamflow from the bedrock uplands consists of surface runoff and groundwater discharge. Streamflow typically peaks within a day after storms; after several days, surface runoff becomes negligible and streamflow consists entirely of ground-water discharge. Hydrographs of streamflow in Asaph and Straight Runs near the valley wall of Marsh Creek during water year 1985 are presented in figure 7, which also includes estimated daily precipitation in the study area. The precipitation data were interpolated from information collected at the National Weather
10
Specific capacity, in Estimated
Saturated gallons per hydraulic thickness, minute per conductivity,
in feet foot of in feet per day drawdown
90 40 250 60 10a 38 90 34 260 85 21 130 90 27 250 80 24 190
100 33 200 60 5.0 120 30 16 330
Average 200 Range 38--330
Service stations at Wellsboro and Galeton, 5 miles southeast and 12 miles west of the study area, respectively (National Oceanic and Atmospheric Administration, 1985). Estimated precipitation for water year 1985 was 30.1 inches, which is 4.8 inches less than the estimated long-term average. The hydrographs generally show the typical seasonal trends in tributary flow; streamflow increases in late fall and early winter as evapotranspiration decreases at the end of the growing season. During December 1984, flow in Asaph and Straight Runs averaged 39 and 19 ft3/s, respectively. During the winter freeze, streamflow decreases from the lack of surface runoff and ground-water recharge. In early February 1985, flow in Asaph and Straight Runs reached lows of 3.1 and 1.8 ft3/s, respectively.
In the early spring, evapotranspiration is low, and rains and snowmelt significantly increase streamflow. During March 1985, flow in Asaph and Straight Runs averaged 39 and 18 ft3/s, respectively. At the start of the growing season, streamflow decreases as evapotranspiration increases. The decrease of flow in Asaph and Straight Runs during April 1985 was greater than normal because precipitation for the month had been lower than average. Streamflow continues to decrease through the summer (although thunderstorms cause sharp peaks in streamflow) and reaches a minimum in late summer or early fall. In mid- to late August 1985, flow in Asaph

and Straight Runs reached lows of 0.85 and 0.47 ft3/s, respectively.
The average streamflow in Asaph and Straight Runs for water year 1985 was 16 and 7.0 ft3 Is, respectively, or about 13 inches of runoff from the upland drainage basins. Assuming no net change in surface- or ground-water storage in water year 1985, the difference between precipitation and runoff from the basins, about 17 inches, was water lost through evapotranspiration. The amount of evapotranspiration was minimal in winter and early spring and at a maximum in summer and early fall. Streamflow
1,000
c A. ASAPH RUN z 0 (.) w en 100 0: w a.. .,_. w w u.. (.)
m 10 ::::> (.)
~
~ 9 u.. ::E ~ 0: .,_. en
0.1 c 100 z 0 (.) w en 0: w a.. .,_.
10 w w u.. (.)
m ::::> (.)
~
~ 9 u. ~ < w a: ~ 0.1 en
data from Asaph and Straight Run basins indicate that evapotranspiration during March and August 1985 (2 months that appeared to have minimal net change in storage, as indicated by ground-water levels in Marsh Creek valley that are not affected by pumping) was less than 10 percent and greater than 90 percent, respectively.
Marsh Creek Valley The stratified-drift aquifer in Marsh Creek
valley is recharged by (1) direct infiltration of precipitation in areas underlain by alluvial-fan
2.0 ffi I (.)
1.5 ~ ~ z
1.0 0 ~ i5
0.5 a: 0 w
0.0 g:
2.0 ffi I (.)
15 ~ . ~ z
1.0 0 i= ~
0.5 a: 0 w
0.0 ~
Figure ?.--Streamflow from the upland drainage basins of Asaph and Straight Runs and estimated precipitation, water year 1985.
11
and valley-wall, ice-contact deposits, and, to a much lesser extent, fine-grained alluvium and swamp deposits; (2) infiltration from tributary streams that drain the uplands; and (3) ground-
, water inflow and infiltration at the valley walls of unchanneled runoff from small areas of upland not drained by tributary streams. Infiltration induced from Marsh Creek and swamps by pumping at the National Fisheries Research and Development Laboratory wellfield is probably minimal because these areas are underlain by 10 to 15 feet of fine-grained alluvium and swamp deposits (pl. 1, section C-C). In addition, south of the alluvial fan of Straight Run near Marsh Creek, the stratified drift appears to be finer grained and less permeable. Some of the ground water from the alluvial-fan and valley-wall areas flows beneath fine-grained postglacial or stratified-drift deposits and recharges the confined system. Ground water discharges from the stratified-drift aquifer by lateral flow or slow upward leakage to Marsh Creek and swamps, through evapotranspiration in swampy areas, and through ground-water pumping.
The only major ground-water withdrawal in the study area is the pumping at the National Fisheries Research and Development Laboratory wellfield. The wellfield contains three production wells that supply research facilities and one well for domestic use. The wells are 80 to 95 feet deep and are completed in the stratifieddrift aquifer. Locations of the wells are shown in figure 6; completion information is given in appendix 1. After use in the research facility, the water pumped from the production wells is discharged to Marsh Creek 500 feet downstream of the mouth of Straight Ruri. Almost all water pumped by the domestic well is returned to the ground by a septic system. Other ground-water pumping in the study area is for domestic and minor stock and irrigation use by private homes and small farms. The domestic water systems include dug, driven, and drilled wells. The wells are completed in alluvial-fan deposits, stratified drift, or bedrock. Completion information on selected domestic wells is given in appendix 1; their locations are ~hown in figure 6. Almost all of the water pumped from the domestic wells is returned to· the ground by septic systems.
The pumping rate from the production wells at the National Fisheries Research and Development Laboratory from the opening of the research facility in October 1978 through September 1983 was about 0.5 ftlls. In October
12
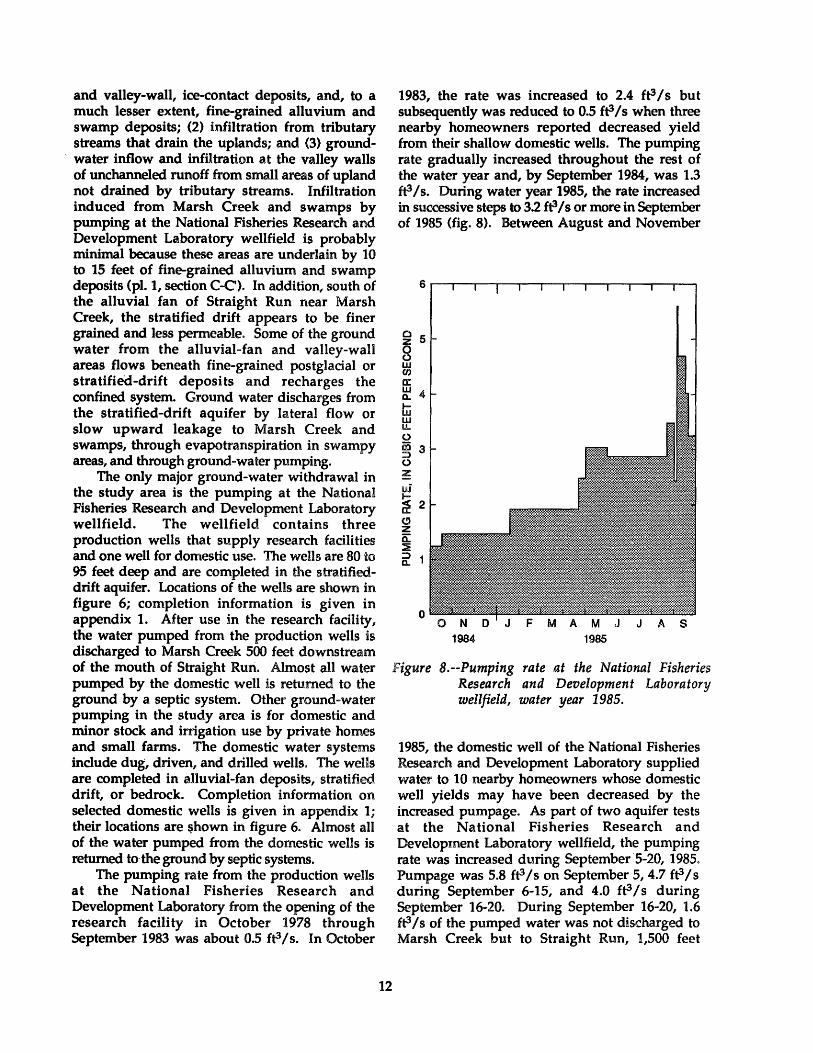
1983, the rate was increased to 2.4 ft.31s but subsequently was reduced to 0.5 ft31s when three nearby homeowners reported decreased yield from their shallow domestic wells. The pumping rate gradually increased throughout the rest of the water year and, by September 1984, was 1.3 ft31s. During water year 1985, the rate increased in successive steps to 3.2 ft3 Is or more in September of 1985 (fig. 8). Between August and November
~ 5
8 w en a: ~ 4
tu w I!.. 0 00 3 ::> 0 :z w ~ 2 <!' z a: :::E ::,:) Q.
0
1984 1985
Figure B.--Pumping rate at the National Fisheries Research and Development Laboratory wellfi.eld, water year 1985.
1985, the domestic well of the National Fisheries Research and Development Laboratory supplied water to 10 nearby homeowners whose domestic well yields may have been decreased by the increased pumpage. As part of two aquifer tests at the National Fisheries Research and Development Laboratory wellfield, the pumping rate was increased during SeptemberS-20, 1985. Pumpage was 5.8 ft.3 Is on September 5, 4.7 ft.3 Is during September 6-15, and 4.0 ft.31s during September 16-20. During September 16-20, 1.6 ft31s of the pumped water was not discharged to Marsh Creek but to Straight Run, 1,500 feet

upstream of the wellfield. In November 1985, in response to results of the aquifer tests, the U.S. Fish and Wildlife Service replaced 11 shallow domestic wells near the National Fisheries Research and Development Laboratory with drilled wells 75 to 95 feet deep.
The water table in the stratified-drift aquifer fluctuates with recharge and discharge. Hydrographs of water levels measured in wells 470 and 471 during water year 1985 are presented in figure 9. Well 470 is near Straight Run, and well 471 is near Asaph Run (fig. 6). The hydrograph from well 471 shows the typical seasonal trends in water levels in the stratifieddrift aquifer. Ground-water levels rise in late fall and early winter as evapotranspiration decreases at the end of the growing season, then stabilize or decline somewhat during the winter freeze as a result of decreased recharge, and then rise during the spring thaw with the increased recharge from infiltration of rain, snowmelt, overland runoff, and tributary streamflow. In late spring, ground-water levels decline as high evapotranspiration at the start of the growing season causes recharge to decrease. Ground-water levels continue to decline through the summer and reach their lowest levels in late summer and early fall. In water year 1985, the water-level fluctuation in well 471 was 7 feet; the highest levels occurred in early winter and spring and the lowest levels in late summer. During the summer of 1985, the water level in well 471 fluctuated rapidly in response to increases and decreases in infiltration from Asaph Run as streamflow varied.
Figure 9.
Water levels in well 470 near Straight Run and well 471 near Asaph Run, water year 1985.
1984
13
Pumping from the National Fisheries Research and Development Laboratory wellfield significantly lowered the water level in well 470 during water year 1985. The increase in pumpage between AprH and September 1985 (fig. 8) accentuated the natural water-level decline, and the water level in the well dropped about 20 feet during that time.
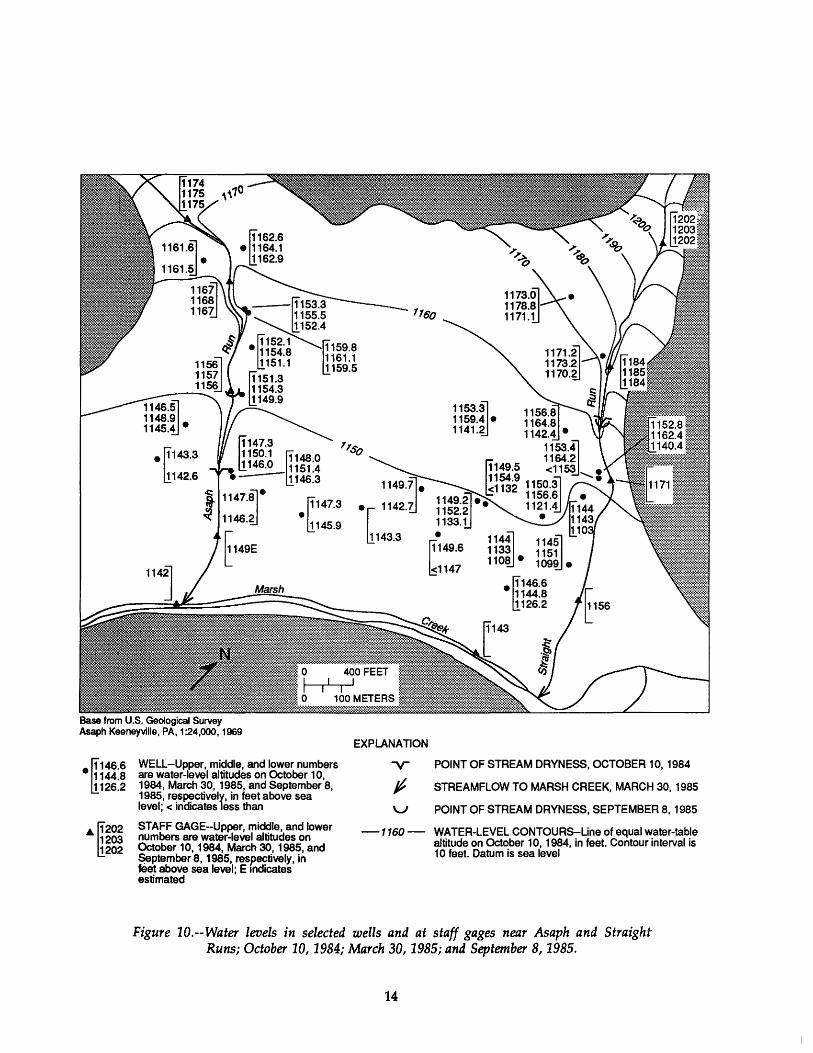
Water levels in selected wells completed in the stratified-drift aquifer near Straight and Asaph Runs on selected dates during water year 1985 are presented in figure 10. Ground-water levels near Asaph Run and the upper part of Straight Run rose 1.3 to 5.8 feet between October 10, 1984 and March 30, 1985, reflecting the increased recharge during the spring thaw. The 6.1- to 46-foot drop in water levels between October 10, 1984 and September 8, 1985 near the lower part of Straight Run is largely due to the increased pumping at the National Fisheries Research and Development Laboratory wellfield.
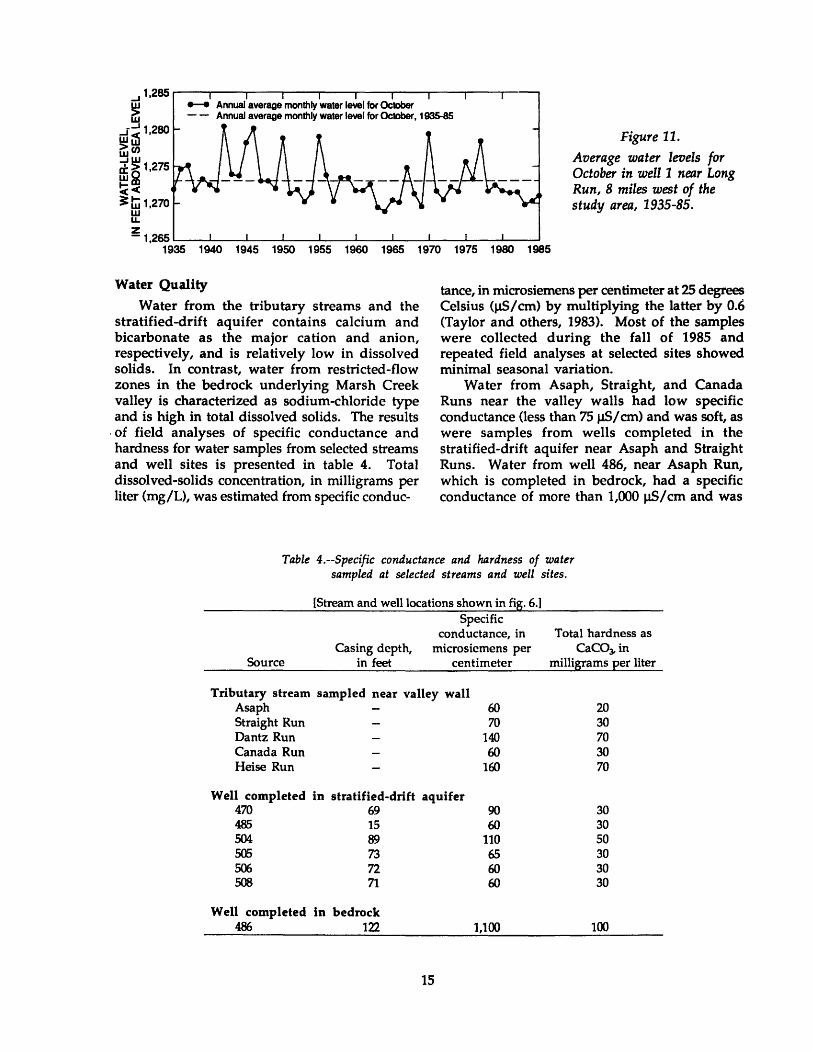
Average water levels for the month of October from 1935 through 1985 in well 1 are presented in figure 11. Weill is near Long Run, a tributary to Pine Creek at Gaines, 8 miles west of the study area. The well is 23 feet deep and completed in alluvial-fan deposits in a geohydrologic setting similar to the study area. October levels are generally representative of low-water conditions for the year and reflect annual variations in recharge. The hydrograph indicates that the average water levels for October 1983, 1984, and 1985 were significantly below normal. The lowest average October level was in 1964 as a result of the early 1960's drought.
1985
• f1143.3
~142.6
.f1147.3
~145.9
Base from U.S. Geological Survey Asaph Keeneyville, PA, 1:24,000, 1969
• [146.6 WELL-Upper, middle, and lower numbers 1144.8 are water-level altitudes on October 10, 1126.2 1984, March 30, 1985, and September 8,
1985, respectively, in feet above sea level;< indicates less than
·~202 1203 1202
STAFF GAGE-Upper, middle, and lower numbers are water-level altitudes on October 10, 1984, March 30, 1985, and ~ptember 8, 1985, respectively, in feet above sea level; E mdicates estimated
EXPLANATION
•
1153.~ 1159.4 • 1141.2
f1149.6
b1147
114~ 1151 1099 •
-~146.6 1144.8 1126.2
-y- POINT OF STREAM DRYNESS, OCTOBER 10, 1984
jt STREAMFLOW TO MARSH CREEK, MARCH 30, 1985
V POINT OF STREAM DRYNESS, SEPTEMBER 8, 1985
-1160- WATER-LEVEL CONTOURS-Line of equal water-table altitude on October 10, 1984, in feet. Contour interval is 10 feet. Datum is sea level
Figure 10.--Water levels in selected wells and at staff gages near Asaph and Straight Runs; October 10, 1984; March 30, 1985; and September 8, 1985.
14
Water Quality
Water from the tributary streams and the stratified-drift aquifer contains calcium and bicarbonate as the major cation and anion, respectively, and is relatively low in dissolved solids. In contrast, water from restricted-flow zones in the bedrock underlying Marsh Creek valley is characterized as sodium-chloride type and is high in total dissolved solids. The results
· of field analyses of specific conductance and hardness for water samples from selected streams and well sites is presented in table 4. Total dissolved-solids concentration, in milligrams per liter (mg/L), was estimated from specific conduc-
Figure 11.
Average water levels for October in well 1 near Long Run, 8 miles west of the study area, 1935-85.
tance, in microsiemens per centimeter at 25 degrees Celsius ()J.S/cm) by multiplying the latter by 0.6 (Taylor and others, 1983). Most of the samples were collected during the fall of 1985 and repeated field analyses at selected sites showed minimal seasonal variation.
Water from Asaph, Straight, and Canada Runs near the valley walls had low specific conductance (less than 75 )J.S/cm) and was soft, as were samples from wells completed in the stratified-drift aquifer near Asaph and Straight Runs. Water from well 486, near Asaph Run, which is completed in bedrock, had a specific conductance of more than 1,000 )J.S/cm and was
Table 4.--Specific conductance and hardness of water sampled at selected streams and well sites.
Source
[Stream and well locations shown in fig. 6.] Specific
conductance, in Casing depth, microsiemens per
in feet centimeter
Tributary stream sampled near valley wall Asaph 60 Straight Run 70 Dantz Run 140 Canada Run 60 Heise Run 160
Well completed in stratified-drift aquifer 470 69 90 485 15 60 504 89 110 505 73 65 506 72 60 508 71 60
Well completed in bedrock 486 122 1,100
15
Total hardness as CaC03- in
milligrams per liter
20 30 70 30 70
30 30 50 30 30 30
100
hard. The dissolved-solids concentration of the sample indicates the presence of some highly mineralized water from a restricted flow zone in the bedrock. A sample from a restricted-flow zone in bedrock that was penetrated by well498 in Marsh Creek valley, 5 miles east of the study area, had a dissolved-solids concentration of 7,800mgiL
Water from Dantz and Heise Runs had specific conductances of 140 to 160 JJ,Sicm and was moderately hard, presumably because the drainage basins of these streams are almost totally underlain by Devonian bedrock, which is more calcareous than the Mississippian and
WELL 486 NEAR ASAPH RUN
Na Cl
Pennsylvanian bedrock that underlies much of the Asaph, Straight, and Canada Run basins (fig. 5).
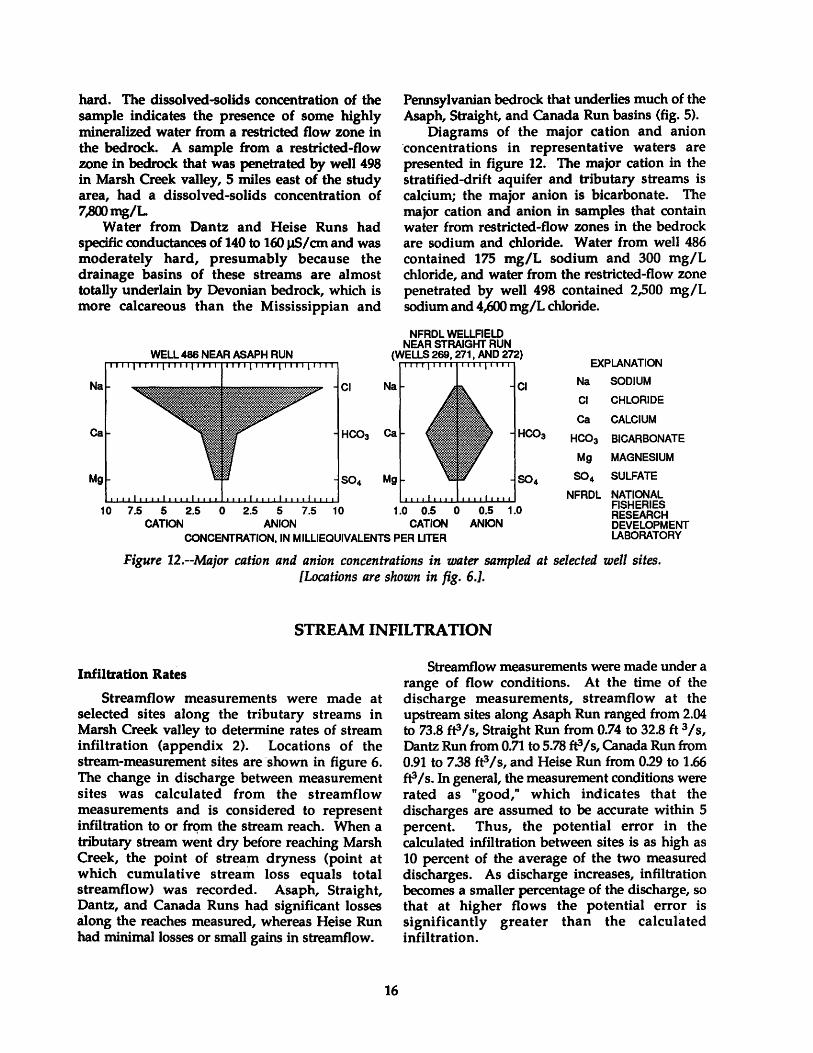
Diagrams of the major cation and anion ·concentrations in representative waters are presented in figure 12. The major cation in the stratified-drift aquifer and tributary streams is calcium; the major anion is bicarbonate. The major cation and anion in samples that contain water from restricted-flow zones in the bedrock are sodium and chloride. Water from well 486 contained 175 mgiL sodium and 300 mgiL chloride, and water from the restricted-flow zone penetrated by well 498 contained 2,500 mgiL sodium and 4,600 mgiL chloride.
NFRDL WELLFIELD NEAR STRAIGHT RUN
(WELLS 269, 271, AND 272) EXPLANATION
Na Na SODIUM
Cl CHLORIDE
ca CALCIUM
HC03 BICARBONATE
Mg MAGNESIUM
S04 SULFATE
10 7.5 5 2.5 0 2.5 5 7.5 10 1.0 0.5 0 0.5 1.0
NFRDL NATIONAL FISHERIES RESEARCH DEVELOPMENT LABORATORY
CATION ANION CATION ANION CONCENTRATION, IN MILLIEOUIVALENTS PER LITER
Figure 12.--Major cation and anion concentrations in water sampled at selected well sites. [Locations are shown in fig. 6.].
STREAM INFILTRATION
Infiltration Rates
Streamflow measurements were made at selected sites along the tributary streams in Marsh Creek valley to determine rates of stream infiltration (appendix 2). Locations of the stream-measurement sites are shown in figure 6. The change in discharge between measurement sites was calculated from the streamflow measurements and is considered to represent infiltration to or frqm the stream reach. When a tributary stream went dry before reaching Marsh Creek, the point of stream dryness (point at which cumulative stream loss equals total streamflow) was recorded. A·saph, Straight, Dantz, and Canada Runs had significant losses along the reaches measured, whereas Heise Run had minimal losses or small gains in streamflow.
16
Streamflow measurements were made under a range of flow conditions. At the time of the discharge measurements, streamflow at the upstream sites along Asaph Run ranged from 2.04 to 73.8 ft31s, Straight Run from 0.74 to 32.8 ft 31s, Dantz Run from 0.71 to 5.78 ft3 Is, Canada Run from 0.91 to 7 38 ft:3 Is, and Heise Run from 0.29 to 1.66 ft3 Is. In general, the measurement conditions were rated as "good," which indicates that the discharges are assumed to be accurate within 5 percent. Thus, the potential error in the calculated infiltration between sites is as high as 10 percent of the average of the two measured discharges. As discharge increases, infiltration becomes a smaller percentage of the discharge, so that at higher flows the potential error is significantly greater than the calculated infiltration.
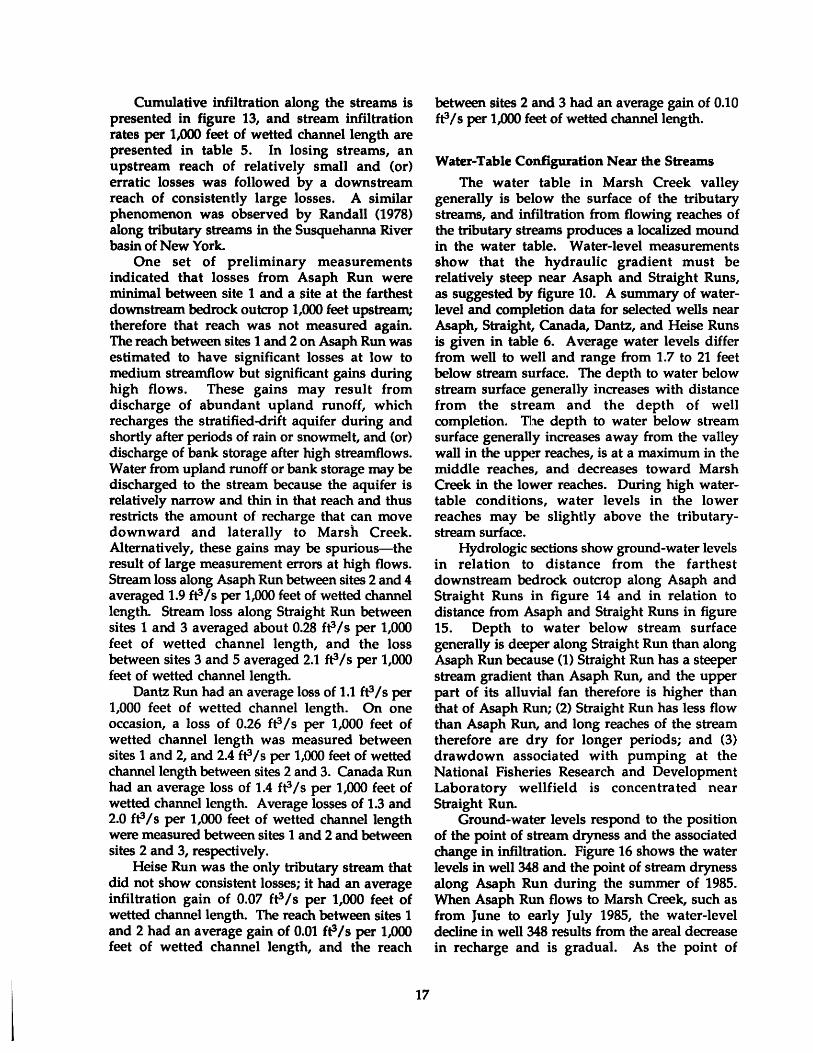
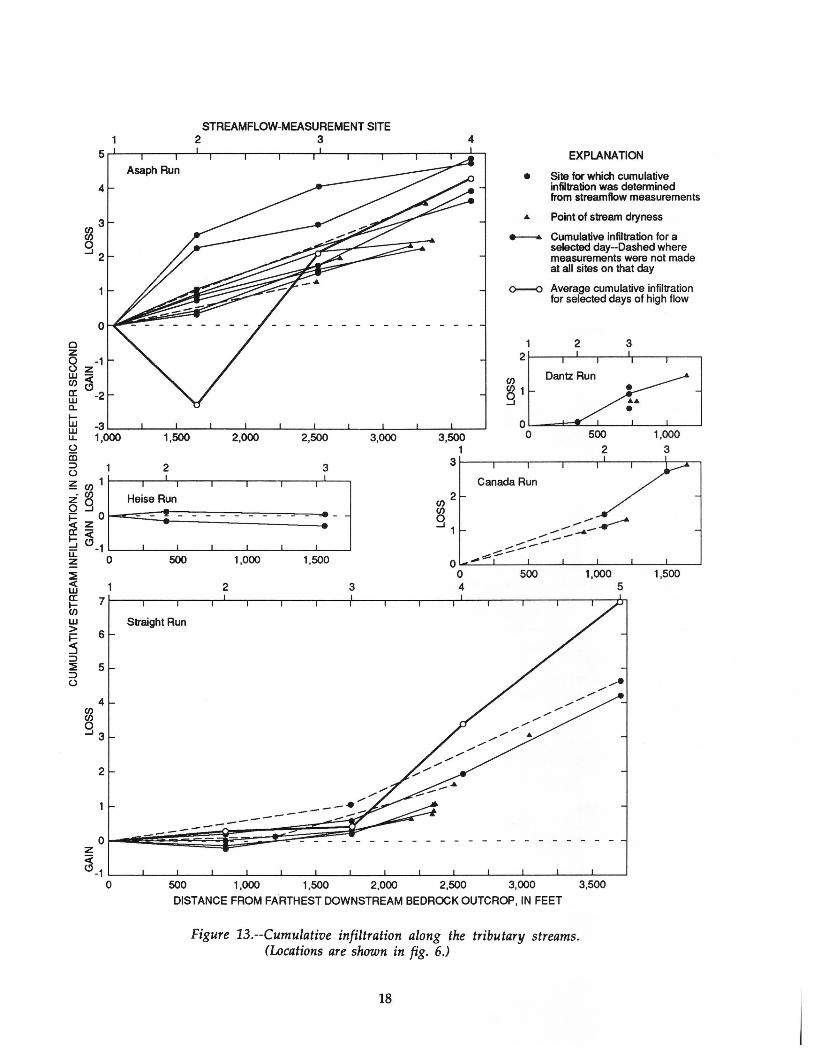
Cumulative infiltration along the streams is presented in figure 13, and stream infiltration rates per 1,000 feet of wetted channel length are presented in table 5. In losing streams, an upstream reach of relatively small and (or) erratic losses was followed by a downstream reach of consistently large losses. A similar phenomenon was observed by Randall (1978) along tributary streams in the Susquehanna River basin of New York.
One set of preliminary measurements indicated that losses from Asaph Run were minimal between site 1 and a site at the farthest downstream bedrock outcrop 1,000 feet upstream; therefore that reach was not measured again. The reach between sites 1 and 2 on Asaph Run was estimated to have significant losses at low to medium streamflow but significant gains during high flows. These gains may result from discharge of abundant upland runoff, which recharges the stratified-drift aquifer during and shortly after periods of rain or snowmelt, and (or) discharge of bank storage after high streamflows. Water from upland runoff or bank storage may be discharged to the stream because the aquifer is relatively narrow and thin in that reach and thus restricts the amount of· recharge that can move downward and laterally to Marsh Creek. Alternatively, these gains may be spurious-the result of large measurement errors at high flows. Stream loss along Asaph Run between sites 2 and 4 averaged 1.9 ft31s per 1,000 feet of wetted channel length. Stream loss along Straight Run between sites 1 and 3 averaged about 0.28 ft3 Is per 1,000 feet of wetted channel length, and the loss between sites 3 and 5 averaged 2.1 ft31s per 1,000 feet of wetted channel length.
Dantz Run had an average loss of 1.1 ft31s per 1,000 feet of wetted channel length. On one occasion, a loss of 0.26 ft3 Is per 1,000 feet of wetted channel length was measured between sites 1 and 2, and 2.4 ft3 Is per 1,000 feet of wetted channel length between sites 2 and 3. Canada Run had an average loss of 1.4 ft3 Is per 1,000 feet of wetted channel length. Average losses of 1.3 and 2.0 ft31s per 1,000 feet of wetted channel length were measured between sites 1 and 2 and between sites 2 and 3, respectively.
Heise Run was the only tributary stream that did not show consistent losses; it had an average infiltration gain of 0.07 ft3 Is per 1,000 feet of wetted channel length. The reach between sites 1 and 2 had an average gain of 0.01 ft31s per 1,000 feet of wetted channel length, and the reach
17
between sites 2 and 3 had an average gain of 0.10 ft31s per 1,000 feet of wetted channel length.
Water-Table Configuration Near the Streams
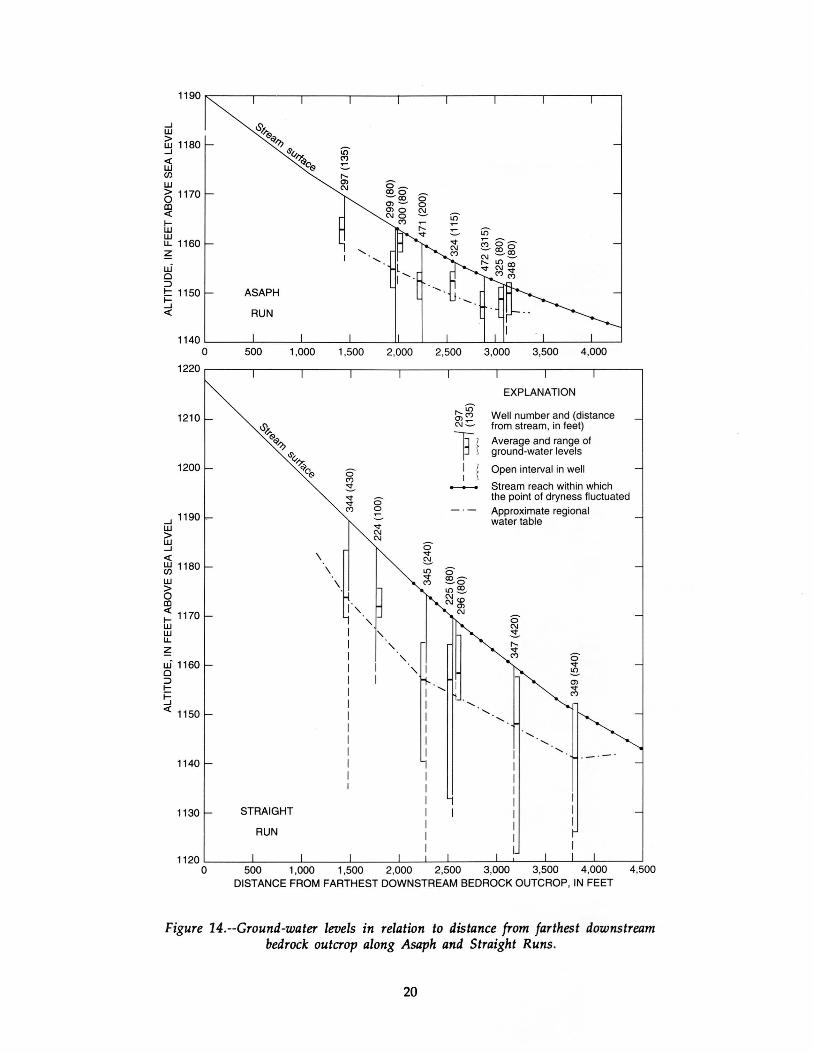
The water table in Marsh Creek valley generally is below the surface of the tributary streams, and infiltration from flowing reaches of the tributary streams produces a localized mound in the water table. Water-level measurements show that the hydraulic gradient must be relatively steep near Asaph and Straight Runs, as suggested by figure 10. A summary of waterlevel and completion data for selected wells near Asaph, Straight, Canada, Dantz, and Heise Runs is given in table 6. Average water levels differ from well to well and range from 1.7 to 21 feet below stream surface. The depth to water below stream surface generally increases with distance from the stream and the depth of well completion. The depth to water below stream surface generally increases away from the valley wall in the upp~r reaches, is at a maximum in the middle reaches, and decreases toward Marsh Creek in the lower reaches. During high watertable conditions, water levels in the lower reaches may be slightly above the tributarystream surface.
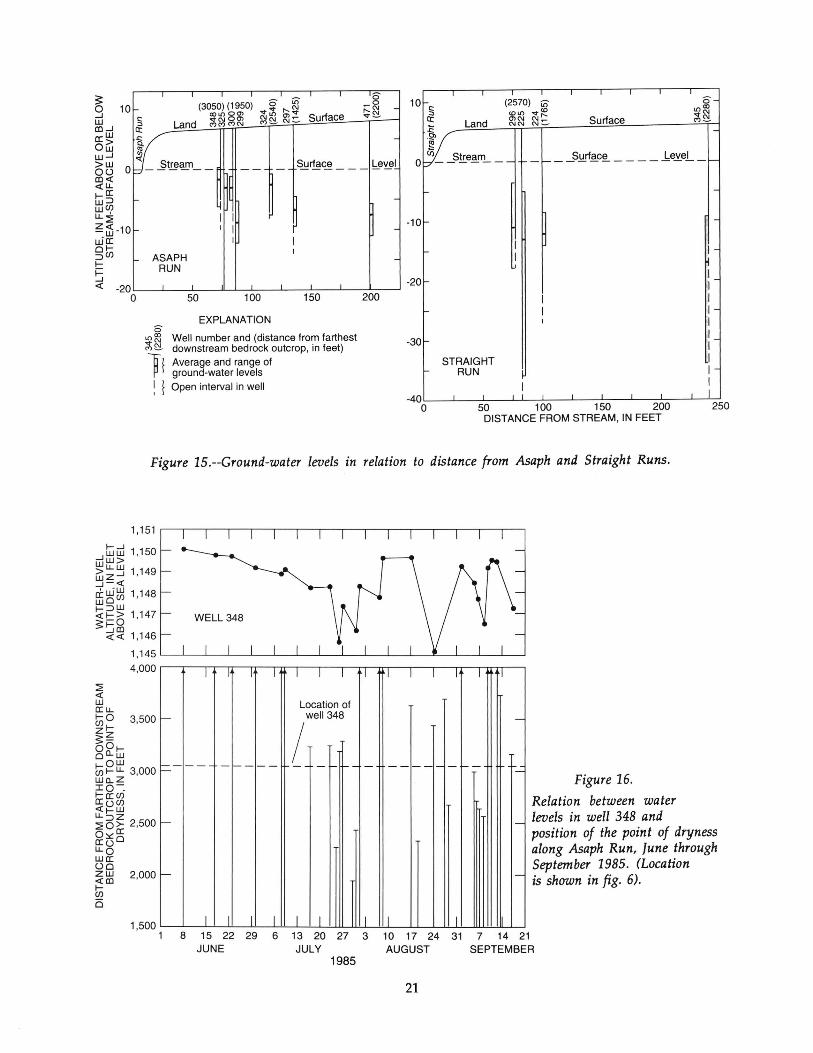
Hydrologic sections show ground-water levels in relation to distance from the farthest downstream bedrock outcrop along Asaph and Straight Runs in figure 14 and in relation to distance from Asaph and Straight Runs in figure 15. Depth to water below stream surface generally is deeper along Straight Run than along Asaph Run because (1) Straight Run has a steeper stream gradient than Asaph Run, and the upper part of its alluvial fan therefore is higher than that of Asaph Run; (2) Straight Run has less flow than Asaph Run, and long reaches of the stream therefore are dry for longer periods; and (3) drawdown associated with pumping at the National Fisheries Research and Development Laboratory wellfield is concentrated near Straight Run.
Ground-water levels respond to the position of the point of stream dryness and the associated change in infiltration. Figure 16 shows the water levels in well 348 and the point of stream dryness along Asaph Run during the summer of 1985. When Asaph Run flows to Marsh Creek, such as from June to early July 1985, the water-level decline in well348 results from the areal decrease in recharge and is gradual. As the point of
w > f= ~ ::::> ~ ::::> (.)
STREAMFLOW-MEASUREMENT SITE 2 3
500 1,000 1,500
2 3
Straight Run 6
5
4
~ .....13
2
--------------
4
C/)2
8 .....11
EXPLANATION
• Site for which cumulative infiltration was determined from streamflow measurements
.a. Point of stream dryness
------... Cumulative infiltration for a selected day-Dashed where measurements were not made at all sites on that day
o--o Average cumulative infiltration for selected days of high flow
2 3 1 2~----~-.--~----.---.
Canada Run
o~~~--~----L---~--~----~--~ 0 4
1,500
0 - - - - - - - - - - - - - - - - - - - - -z < ~-1 L---~--~----L---~--~----~--~--~----~--~--~----~---L----L-~
0 500 1,000 1,500 2,000 2,500 3,000 3,500
DISTANCE FROM FARTHEST DOWNSTREAM BEDROCK OUTCROP, IN FEET
Figure 13.--Cumulative infiltration along the tributary streams. (Locations are shown in fig. 6.)
18
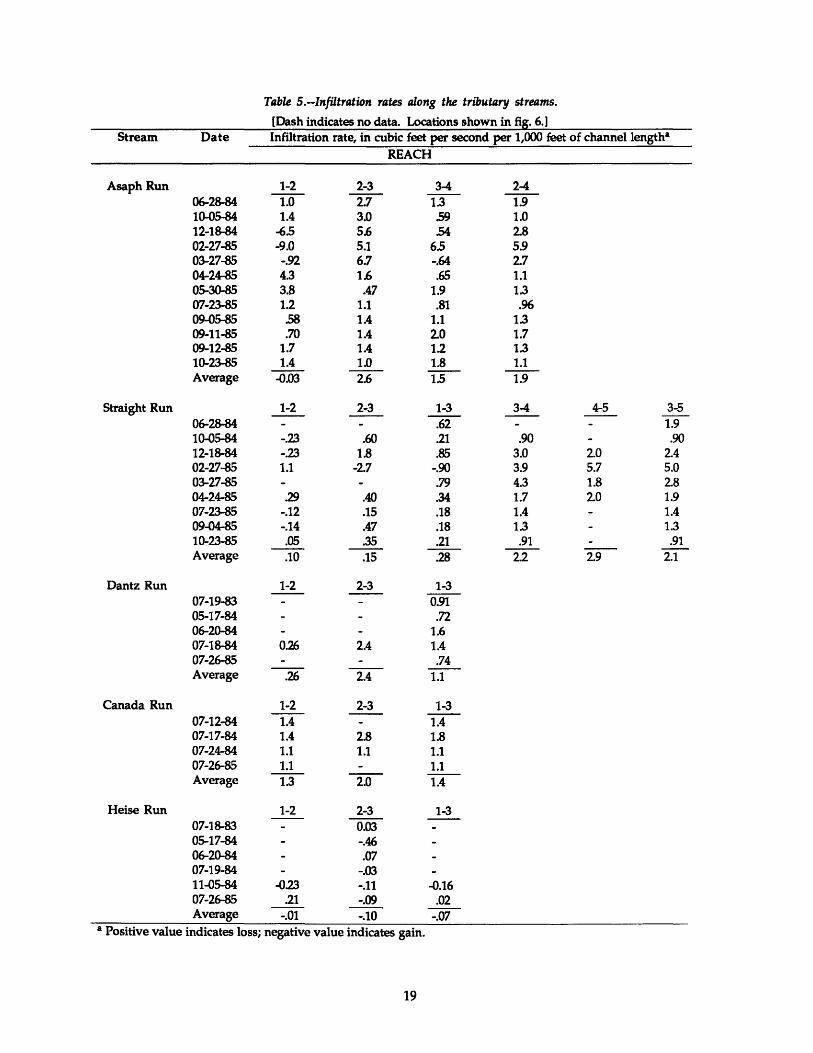
Table 5.-Infiltration rates along the tributary streams.
[Dash indicates no data. Locations shown in fig. 6.] Stream Date Infiltration rate, in cubic feet per second per 1,000 feet of channel length•
REACH
Asaph Run 1-2 2-3 3-4 2-4 06-28-84 1.0 2.7 1.3 1.9 10-05-84 1.4 3.0 .59 1.0 12-18-84 -6.5 5.6 .54 2.8 02-27-85 -9.0 5.1 6.5 5.9 03-27-85 -.92 6.7 -.64 2.7 04-24-85 4.3 1.6 .65 1.1 05-30-85 3.8 .47 1.9 1.3 07-23-85 1.2 1.1 .81 .96 09-05-85 .58 1.4 1.1 1.3 09-11-85 .70 1.4 2.0 1.7 09-12-85 1.7 1.4 1.2 1.3 10-23-85 1.4 1.0 1.8 1.1 Average -0.03 2.6 1.5 1.9
Straight Run 1-2 2-3 1-3 3-4 4-5 3-5 06-28-84 .62 1.9 10-05-84 -.23 .60 .21 .90 .90 12-18-84 -.23 1.8 .85 3.0 20 2.4 02-27-85 1.1 -27 -.90 3.9 5.7 5.0 03-27-85 .79 4.3 1.8 2.8 04-24-85 .29 .40 .34 1.7 2.0 1.9 07-23-85 -.12 .15 .18 1.4 1.4 09-04-85 -.14 .47 .18 1.3 1.3 10-23-85 .05 .35 .21 .91 .91 Average .10 .15 .28 2.2 29 2.1
Dantz Run 1-2 2-3 1-3 07-19-83 0.91 05-17-84 .72 06-20-84 1.6 07-18-84 0.26 2.4 1.4 07-26-85 .74 Average .26 2.4 1.1
Canada Run 1-2 2-3 1-3 07-12-84 1.4 1.4 07-17-84 1.4 2.8 1.8 07-24-84 1.1 1.1 1.1 07-26-85 1.1 1.1 Average 1.3 2.0 1.4
Heise Run 1-2 2-3 1-3 07-18-83 0.03 05-17-84 -.46 06-20-84 .07 07-19-84 -.03 11-05-84 -0.23 -.11 -0.16 07-26-85 .21 -.09 .02 Average -.01 -.10 -.07
a Positive value indicates loss; negative value indicates gain.
19
...J w (ij 1180 ...J
<1: w (f)
w i) 1170 co <1:
ti:i ~ 1160 z ui 0 ::::l § 1150
<1:
w > 0 co ~ 1170 w w u.. z ui 1160 0 ::::l 1--
5 <1: 1150
1140
A SA PH
RUN
\ \
0 0 :s
\
EXPLANATION
Well number and (distance from stream, in feet)
Average and range of ground-water levels
Open interval in well
Stream reach within which the point of dryness fluctuated
Approximate regional water table
.- ·-·
1130 STRAIGHT
RUN
1120L-----~----~----_L ____ ~ __ _L __ L_ ____ L_~--~--L__L ____ _j
0 500 1 ,000 1 ,500 2,000 2,500 3,000 3,500 4,000 4,500 DISTANCE FROM FARTHEST DOWNSTREAM BEDROCK OUTCROP, IN FEET
Figure 14.--Ground-water levels in relation to distance from farthest downstream bedrock outcrop along Asaph and Straight Runs.
20
(3050) (1950) CX)U') 00>
Land ~~ ?lRl
A SA PH RUN
EXPLANATION
Surtace
150
Well number and (distance from farthest downstream bedrock outcrop, in feet) Average and range of ground-water levels Open interval in well
-~
-
-
200
(2570) 10 o-§ <D<ll .... <D "'<X>
.... C\1 a: Land
CllC\1 C\1 ..... Surtace "'~ C\IC\1 C\1:::::.
10
-
" 0 t _ S!!:.e~m ___ - f- __ S!!_rt~cg_ ____ _he_yel_ _ f-
-10
-20
-30
-40 0
h
I I
I I I
STRAIGHT RUN
I I
50 100 150 200 DISTANCE FROM STREAM, IN FEET
I ~ I I I I I I I I I I I 250
Figure 15.--Ground-water levels in relation to distance from Asaph and Straight Runs.
1,500
l I I I I I ~I ~I I I I I tl
Location of 1- well348 -
I ~- -- -r-- -- - - 1-- - ----1- - 1--
1-
~ 1-
1- 1-
I I I I I I II II I 1 8 15 22 29 6 13 20 27 3 10 17 24 31 7 14 21
Figure 16.
Relation between water levels in well 348 and position of the point of dryness along Asaph Run, June through September 1985. (Location is shown in fig. 6).
JUNE JULY AUGUST SEPTEMBER 1985
21

dryness in Asaph Run retreats past well 348 in late July, the water-level decline increases. In August and September, the water level rises in response to storms that cause Asaph Run to flow past the well, but quickly declines when the point of dryness begins to move upstream.
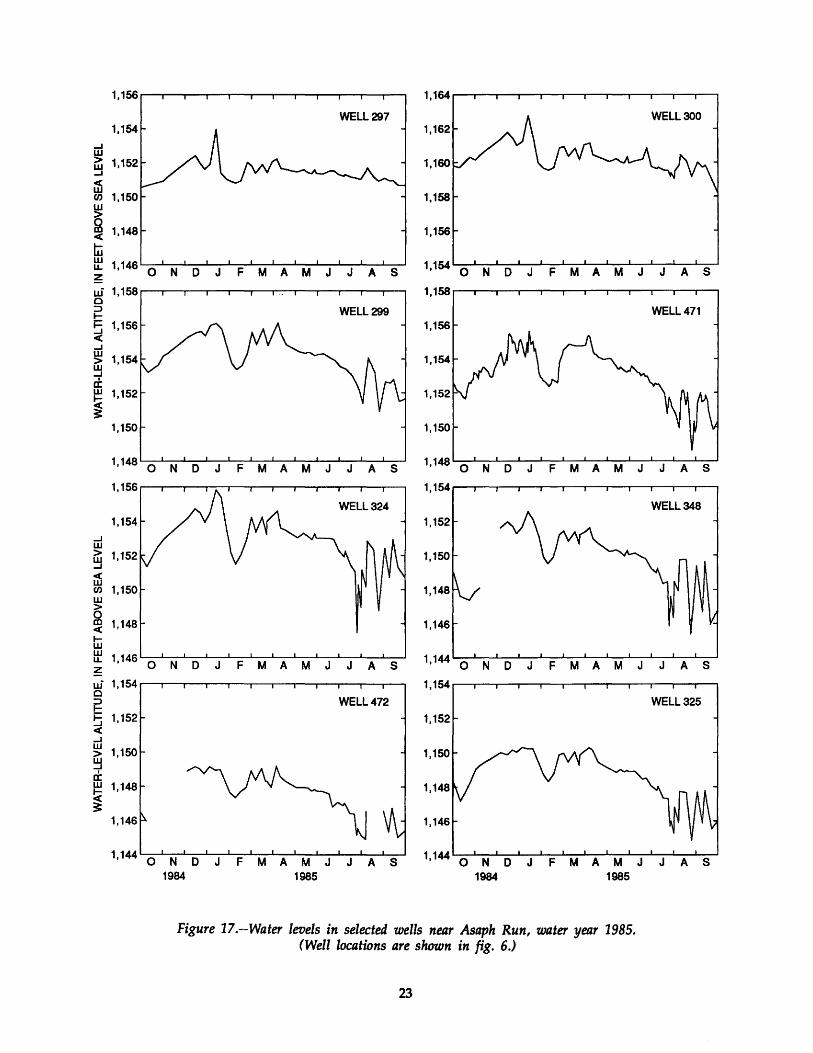
Hydrographs for selected wells along Asaph Run during water year 1985 are presented in figure 17. Water levels along reaches that have continuous flow, such as those observed in well
297, show minimal fluctuation except during the more extreme recharge events. Larger fluctuations are observed along reaches with discontinuous flow, particularly in the shallowest wells nearest the stream, such as wells 324 and 348. Wells that are completed deeper and (or) farther from the stream, such as wells 325 and 472, generally show less fluctuation in response to the position of the point of dryness.
Tllble 6.-Summary of water levels and completion information in relation to stream surface for selected wells near the tributary streams.
[Dash indicates no data. Well locations shown in fig. 6.] Distance Distance Well depth, in Casing depth, Depth to water level, in
from from feet below in feet below feet below stream valley wall, stream, in stream stream surfacea
Well number in feet feet surface surface Average Range
Asaph Run 'Bl 1425 135 14 9 6.9 4.5-9.4 299 1950 80 40 35 8.8 5.1-12 300 1950 80 12 7 3.0 1.1-5.0 471 2200 200 39 34 7.4 5.8-11 324 2540 115 8 3 3.5 1.9-7.6 472 2840 315 76 76 6.1 3.2-9.1 325 3050 47 37 3.0 0.6-6.6 348 3050 80 10 5 1.7 +0.4-6.1
Straight Run 344 1500 430 54 14 15 5.8-19 224 1765 100 27 22 12 8.3-14 345 2280 240 54 14 17 9.4-34 346 2320 850 60 20 21 12-33 225 2570 80 40 35 13 5.0-36 296 2570 80 18 13 11 32->18 470 3090 940 74 67 17 8.7-35 476 3090 940 31 21 16 8..5->31 347 3125 420 57 17 12 2.6-38 349 3785 540 57 17 9.7 +1.3-25
Canada.Run 482 1300 300 111 70 12 9.3-15
Dantz Run 479 280 650 135 14 11-17 374 890 100 17 12 7.7 48) 890 1100 12 10-15
Heise Run 264 25 31 31 10 8.8-12 475 120 27 27 9.1 6.5-10
a Water levels measured between May 1984 and October 1985; +indicates above stream surface.
22
1,156
...J w > ~ L:i U)
w > Q 1,148 c(
I-w w 1,146 IJ.. 0 ~ u.j 1,158 0 :::> I-
~ c( ...J w > w ...J
d: w I-
~
1,148 0
1,156
1,154
...J w > 1,152 w ...J c( w
1,150 U)
w > Q 1,148 c(
I-w w 1,146 IJ.. 0 ~ u.j 1,154 0 :::> I-
~ 1,152 c( ...J w
1,150 > w ...J
I a: w 1,148 ~ 3:
1,146
1,144 0
1,164
WELL297
1,156
N D J A M J J A s 1,154 0 N D J F M A M
1,158
WELL299
N D J F M A M J J A s 0 N D J F M A M
1,154
WELL324
1,150
1,148
N D J F M A M J J A s 1,144 0 N D J F M A M
1,154
WELL472
N D J 1,144 0 N D J F M A M
1984 1984 1985
Figure 17.--Water levels in selected wells near Asaph Run, water year 1985. (Well locations are shown in fig. 6 .)
23
WELL300
J J A s
WELL471
J J A s
WELL348
J J A s
WELL325
J J A s
Facton That Affect Stream Infiltration
Ground-water flow through porous media is governed by Darcy's Law, which is described by the following equation:
where Q K
dh/ dl A
Q=-Kd hA dl
=flow through the porous medium, =hydraulic conductivity, =hydraulic gradient, and = area perpendicular to flow.
Hydraulic conductivity is dependent on the characteristics of the porous medium as well as properties of the transmitted fluid. Hydraulic conductivity of an aquifer is described by the following equation:
where: K k
p g Jl
K=k Pg J.1
=hydraulic conductivity, = intrinsic permeability of porous
medium, = density of water, = gravitational constant, and =viscosity of water.
The density and viscosity of water are temperature dependent. The above equations, therefore, suggest that the following factors affect stream infiltration: 1) streamdimensions; 2) stream temperature; 3) hydraulic gradient near the streams; and 4) permeability of streambed and underlying
aquifer.
Stream Dimensions
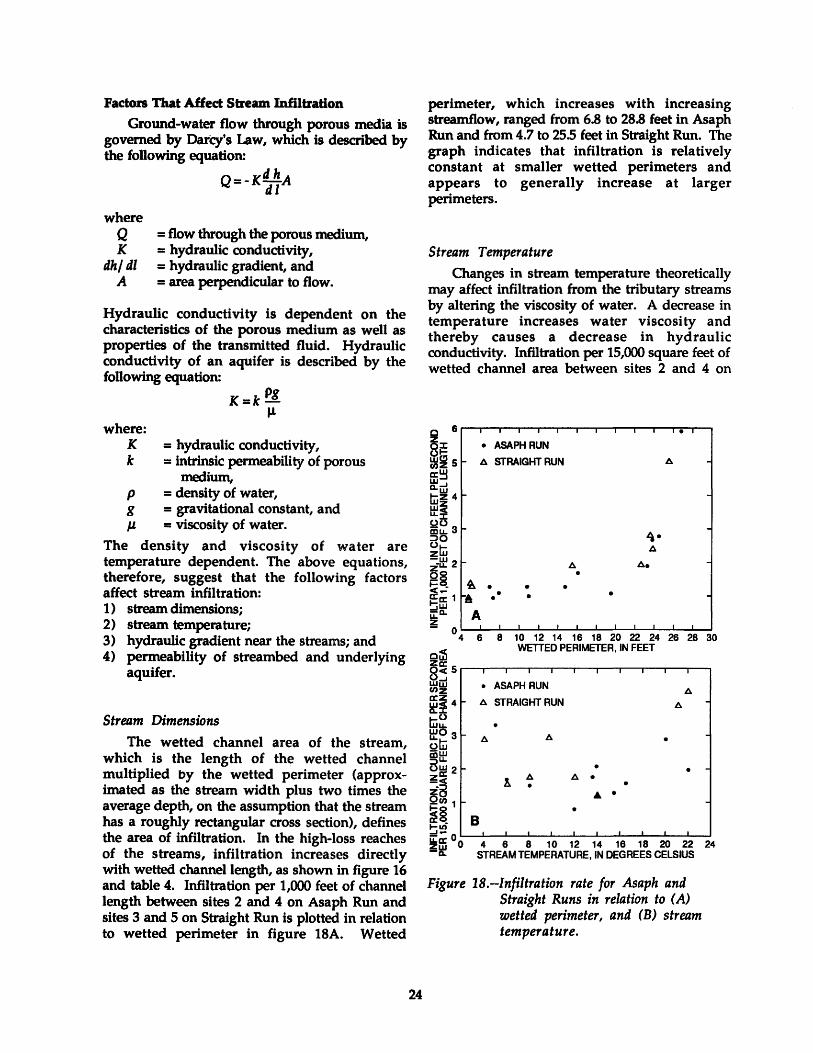
The wetted channel area of the stream, which is the length of the wetted channel multiplied by the wetted perimeter (approximated as the stream width plus two times the average depth, on the assumption that the stream has a roughly rectangular cross section), defines the area of infiltration. In the high-loss reaches of the streams, infiltration increases directly with wetted channel length, as shown in figure 16 and table 4. Infiltration per 1,000 feet of channel length between sites 2 and 4 on Asaph Run and sites 3 and 5 on Straight Run is plotted in relation to wetted perimeter in figure 18A. Wetted
24
perimeter, which increases with increasing streamflow, ranged from 6.8 to 28.8 feet in Asaph Run and from 4.7 to 25.5 feet in Straight Run. The graph indicates that infiltration is relatively constant at smaller wetted perimeters and appears to generally increase at larger perimeters.
Stream Temperature Changes in stream temperature theoretically
may affect infiltration from the tributary streams by altering the viscosity of water. A decrease in temperature increases water viscosity and thereby causes a decrease in hydraulic conductivity. Infiltration per 15,000 square feet of wetted channel area between sites 2 and 4 on
c s~~~~--r-~~~--~~~~~--~.~~~
8~ ~i 5 - L1 STRAIGHT RUN
• ASAPH RUN
ffi~ a.....J tu~ 4 ~ ~! ~~ 3-::l!O
~tu -:.~ 2
~§ .... - ~ . . ~.;; 1 ~ •• ~w u:::c.. A
• •
A •
•
~· A
-
-
Z I i ~ I I I
-0
4 6 8 10 12 14 16 18 20 22 24 26 28 30 eLlS WElTED PERIMETER, IN FEET
g~s I I
w...J (/)~ • ASAPH RUN c:z 4 ~ L1 STRAIGHT RUN ~~ tuo w~ 3 ~ ~tJj A
~~ ow 2 ~ ~~ za QCI) 1 ~
~§ ~.n B
•
I I
• A • •
..t.. •
•
I
-
-•
. -
-
;..J..- I I I I I I
~a: 0 0 4 6 8 10 12 14 16 18 20 22 24
-~ STREAM TEMPERATURE, IN DEGREES CELSIUS
Figure 18.-Infiltration rate for Asaph and Straight Runs in relation to (A) wetted perimeter, and (B) stream temperature.
Asaph Run and sites 3 and 5 on Straight Run is plotted in relation to stream temperature in figure 18B. Stream temperature ranged from 4° C to 22° C (degrees Celsius). Within this temperature range, a 1° C decrease in temperature increases viscosity by about 2.2 percent (Bouwer, 1978). Infiltration does not appear to decrease with decreasing stream temperature, which suggests that infiltration may not be greatly affected by conditions in the immediate streambed.
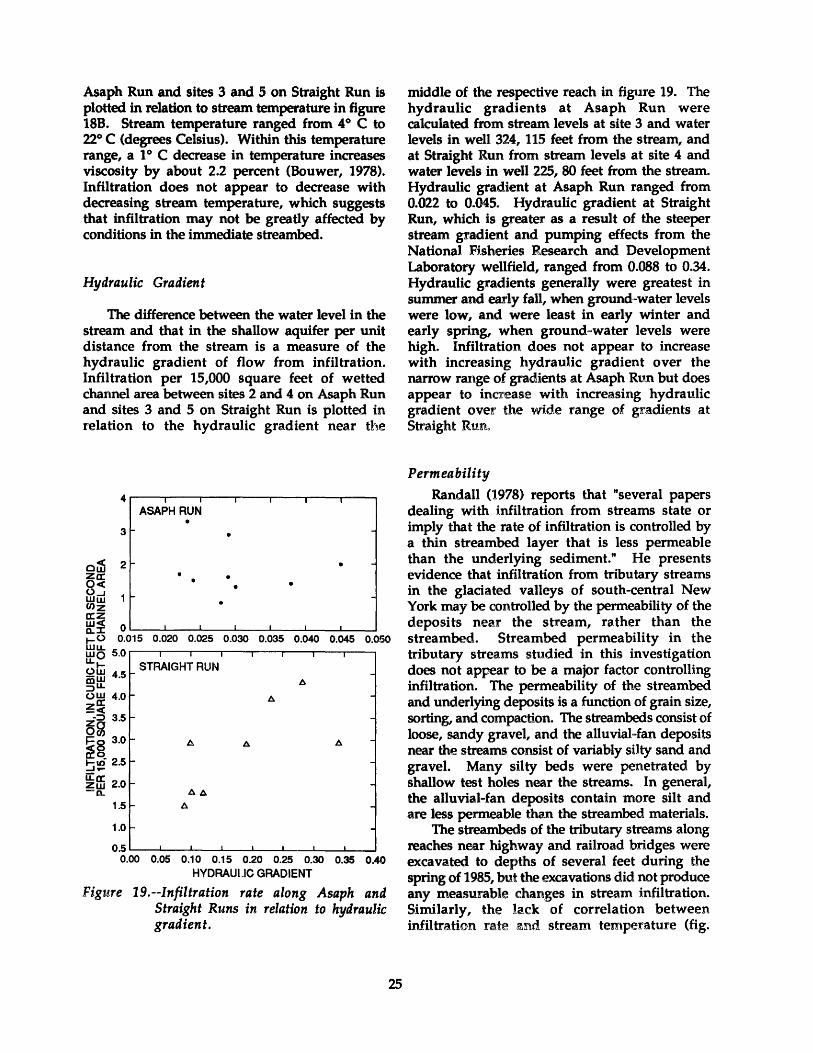
Hydraulic Gradient
The difference between the water level in the stream and that in the shallow aquifer per unit distance from the stream is a measure of the hydraulic gradient of flow from infiltration. Infiltration per 15,000 square feet of wetted channel area between sites 2 and 4 on Asaph Run and sites 3 and 5 on Straight Run is plotted in relation to the hydraulic gradient near the
4 I I I I I I
ASAPH RUN •
3 • -
cl':i 2 • -za: • 0< • • O...J 1 ~ -ww Cl)z a:z w< 0 I 1 I c.. :I: 1-0 0.015 0.020 0.025 0.030 0.035 0.040 0.045 0.050 ttl~ 5.0 I I I I I I I
~ti:i STRAIGHT RUN -mw 4.5 ~ ~ ::::>LL
0~ 4.0 ~ ~ -~< .z=> 3.5r -0~ I=§ 3.0- b. ~ /j. -
~16 2.5 r -~-iia: zw 2.0 r- --o. ~~
1.5 r- ~ -1.0 1- -05 I I L
0.00 0.05 0.10 0.15 0.20 0.25 0.30 0.35 0.40 HYDRAULIC GRADIENT
Figure 19.--lnfiltration rate along Asaph and Straight Runs in relation to hydraulic gradient.
25
middle of the respective reach in figure 19. The hydraulic gradients at Asaph Run were calculated from stream levels at site 3 and water levels in well 324, 115 feet from the stream, and at Straight Run from stream levels at site 4 and water levels in well225, 80 feet from the stream. Hydraulic gradient at Asaph Run ranged from 0.022 to 0.045. Hydraulic gradient at Straight Run, which is greater as a result of the steeper stream gradient and pumping effects from the National Fisheries Research and Development Laboratory wellfield, ranged from 0.088 to 0.34. Hydraulic gradients generally were greatest in summer and early fall, when ground-water levels were low, and were least in early winter and early spring, when ground-water levels were high. Infiltration does not appear to increase with increasing hydraulic gradient over the narrow range of gradients at Asaph Ru.n but does appear to increase with increasing hydraulic gradient over the wide range of gradients at Straight RtU'lo
Permeability Randall (1978) reports that "several papers
dealing with infiltration from streams state or imply that the rate of infiltration is controlled by a thin streambed layer that is less permeable than the underlying sediment." He presents evidence that infiltration from tributary streams in the glaciated valleys of south-central New York may be controlled by the permeability of the deposits near the stream, rather than the streambed. Streambed permeability in the tributary streams studied in this investigation does not appear to be a major factor controlling infiltration. The permeability of the streambed and underlying deposits is a function of grain size, sorting, and compaction. The streambeds consist of loose, sandy gravel, and the alluvial-fan deposits near the streams consist of variably silty sand and gravel. Many silty beds were penetrated by shallow test holes near the streams. In general, the alluvial-fan deposits contain more silt and are less permeable than the streambed materials.
The streambeds of the tributary streams along reaches near highway and railroad bridges were excavated to depths of several feet during the spring of 1985, but the excavations did not produce any measurable changes in stream infiltration. Similarly, the lack of correlation between infiltration rate ~nd stream temperature (fig.
18B) suggests that the streambed permeability may not be a controlling factor.
Heise Run is the only stream investigated that does not lose water (fig. 13). The streambed of Heise Run does not appear to differ significantly from the others, but the nearby deposits appear to consist largely of fine-grained alluvium and swamp deposits rather than the coarser grained alluvial-fan deposits (pl. 1, section F-F'). The low permeability of these finegrained sediments near the stream may account for the lack of stream loss.
At high streamflows, infiltration occurs not only through the bottom of the streambed but also through the streambank. The interbedded nature of the alluvial-fan deposits indicates that horizontal permeability is greater than vertical permeability near the streams. Lateral flow through more permeable beds in the streambank may account for the apparent increase in loss with increasing wetting perimeter at larger perimeter (fig. 18A). At larger perimeters, as the stream approaches bankful, most of the increase in wetted perimeter is due to increases in stream depth, which would allow for greater loss by lateral flow through the streambank.
Hydraulic Conductivity Near the Streams
The hydraulic conductivity of the deposits near tributary streams can be estimated from stream-infiltration and ground-water-level data. Randall (1978) used a set of general solutions for infiltration from canals, developed by Bouwer (1965), to calculate hydraulic conductivity near selected tributary streams in south-central New York. Bouwer's solutions, presented in a series of graphs, were obtained by steady-state analysis for homogeneous and isotropic flow conditions with a resistance-network analog. Randall extrapolated these relations to the shallow streams he investigated. His estimates of hydraulic conductivity near the streams ranged from 13 to 130 ft/ d and averaged 80 ft/ d. Assuming an anisotropy (ratio of horizontal to vertical hydraulic conductivity) of 10 to 1, Randall estimated that horizontal hydraulic conductivity would be about 1.5 times the hydraulic conductivity calculated from the assumed isotropic conditions.
The solutions that were used to determine hydraulic conductivity near the streams in the present investigation were developed by D. J. Morrissey (U.S. Geological Survey, written
26
commun., 1986). Expanding upon work by Bouwer (1965) as suggested by Randall (1978), Morrissey obtained solutions for infiltration from shallow streams by use of the finite-difference model program of McDonald and Harbaugh (1988). He developed a cross-sectional model that assumes homogeneous and isotropic flow conditions and constant heads in the stream nodes and in aquifer nodes at a distance of 200 feet from the stream. The model incorporated a 0.05 ratio of stream depth to stream width, which is generally representative of the streams in this investigation, and an impermeable boundary at the base of the aquifer. Solutions_ were developed in which the ratio of boundary depth to stream width ranged from 1· to 5. Bouwer (1965), in his analysis of losses from canals, concluded that any increase in depth to the impermeable boundary beyond five times the stream width had little effect on infiltration. In this investigation, bedrock is the only unit of low permeability that is continuous beneath the streams. In almost all reaches that were analyzed, the ratio of bedrock depth to stream width is greater than 5, although silty beds in the alluvial-fan and stratified-drift deposits form discontinuous layers of lower permeability at lesser depths. For the purpose of this analysis, the ratio of the depth of an impermeable boundary to stream width was assumed to be 5.
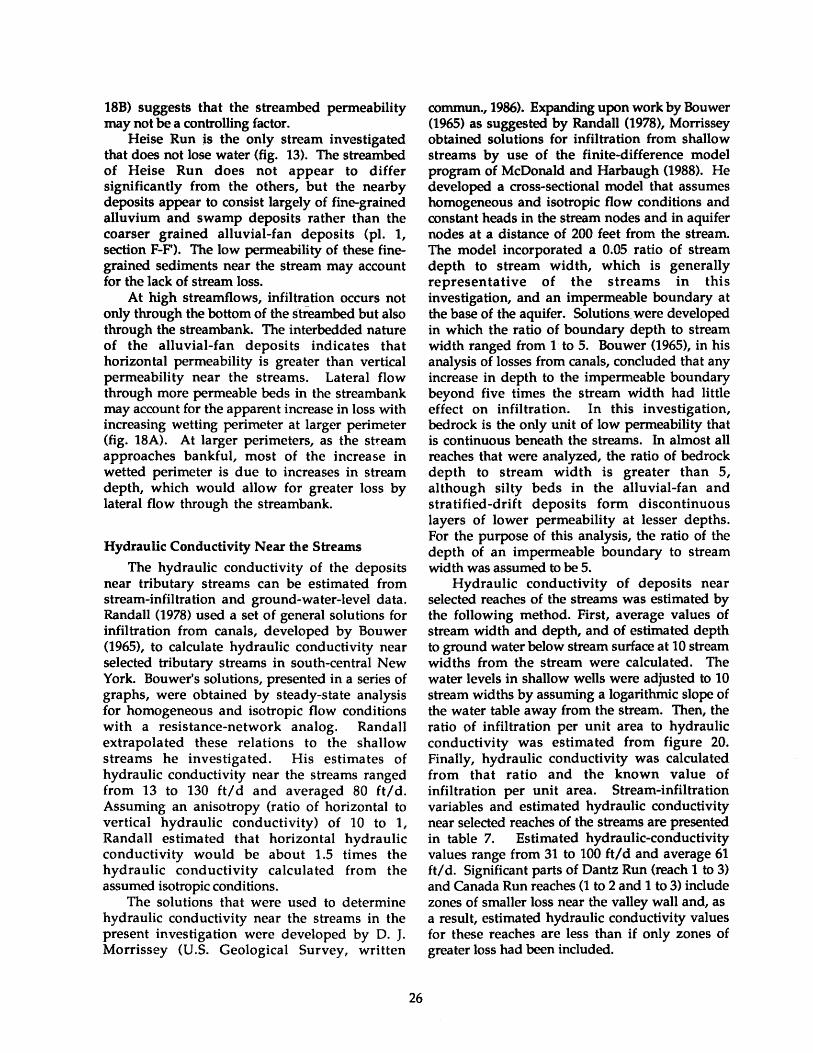
Hydraulic conductivity of deposits near selected reaches of the streams was estimated by the following method. First, average values of stream width and depth, and of estimated depth to ground water below stream surface at 10 stream widths from the stream were calculated. The water levels in shallow wells were adjusted to 10 stream widths by assuming a logarithmic slope of the water table away from the stream. Then, the ratio of infiltration per unit area to hydraulic conductivity was estimated from figure 20. Finally, hydraulic conductivity was calculated from that ratio and the known value of infiltration per unit area. Stream-infiltration variables and estimated hydraulic conductivity near selected reaches of the streams are presented in table 7. Estimated hydraulic-conductivity values range from 31 to 100 ft/d and average 61 ft/d. Significant parts of Dantz Run (reach 1 to 3) and Canada Run reaches (1 to 2 and 1 to 3) include zones of smaller loss near the valley wall and, as a result, estimated hydraulic conductivity values for these reaches are less than if only zones of greater loss had been included.
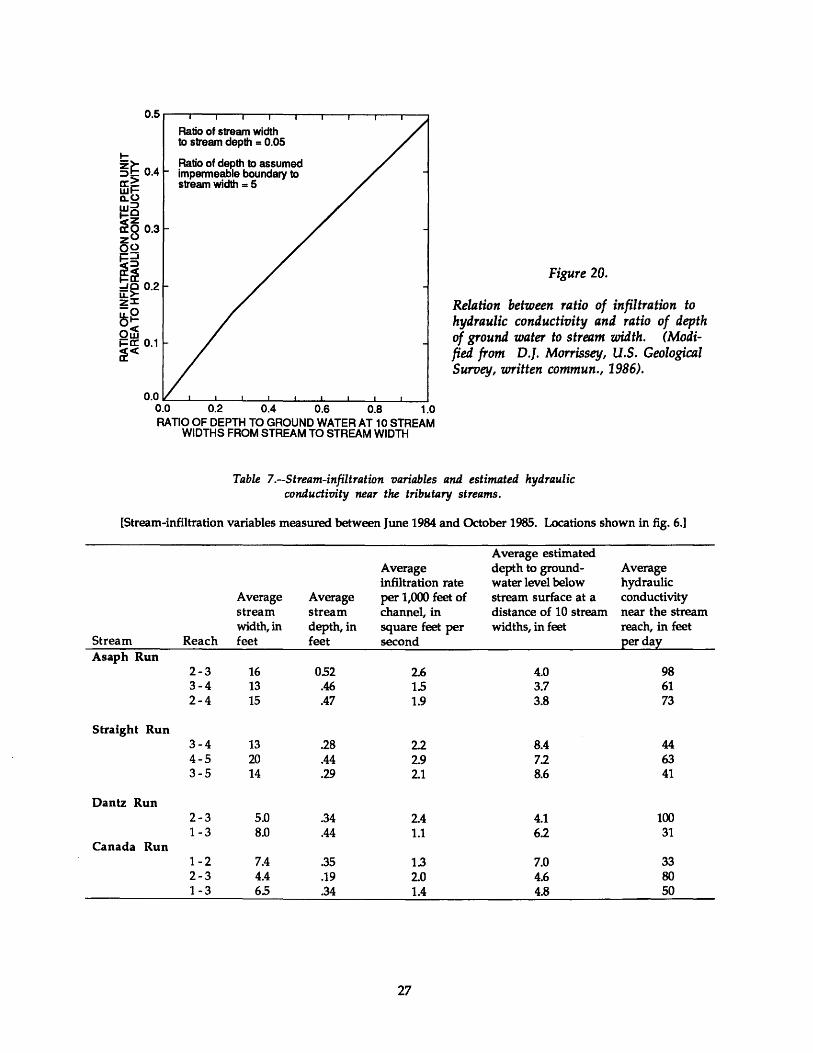
Ratio of depth to assumed impermeable boundary to stream width = 5
Figure 20.
Relation between ratio of infiltration to hydraulic conductivity and ratio of depth of ground water to stream width. (Modified from D.]. Morrissey, U.S. Geological Survey, written commun., 1986).
0.0 IL------L--L--I....-----L--1--I....---l..--'--.l...-__J
0.0 0.2 0.4 0.6 0.8 1.0 RATIO OF DEPTH TO GROUND WATER AT 10 STREAM
WIDTHS FROM STREAM TO STREAM WIDTH
Table ?.--Stream-infiltration variables and estimated hydraulic conductivity near the tributary streams.
[Stream-infiltration variables measured between June 1984 and October 1985. Locations shown in fig. 6.]
Average estimated Average depth to ground- Average infiltration rate water level below hydraulic
Average Average per 1,000 feet of stream surface at a conductivity stream stream channel, in distance of 10 stream near the stream width, in depth, in square feet per widths, in feet reach, in feet
Stream Reach feet feet second Eerda~ Asaph Run
2-3 16 0.52 2.6 4.0 98 3-4 13 .46 1.5 3.7 61 2-4 15 .47 1.9 3.8 73
Straight Run 3-4 13 .28 2.2 8.4 44 4-5 20 .44 2.9 7.2 63 3-5 14 .29 2.1 8.6 41
Dantz Run 2-3 5.0 .34 2.4 4.1 100 1-3 8.0 .44 1.1 6.2 31
Canada Run 1-2 7.4 .35 1.3 7.0 33 2-3 4.4 .19 2.0 4.6 80 1-3 6.5 .34 1.4 4.8 50
27
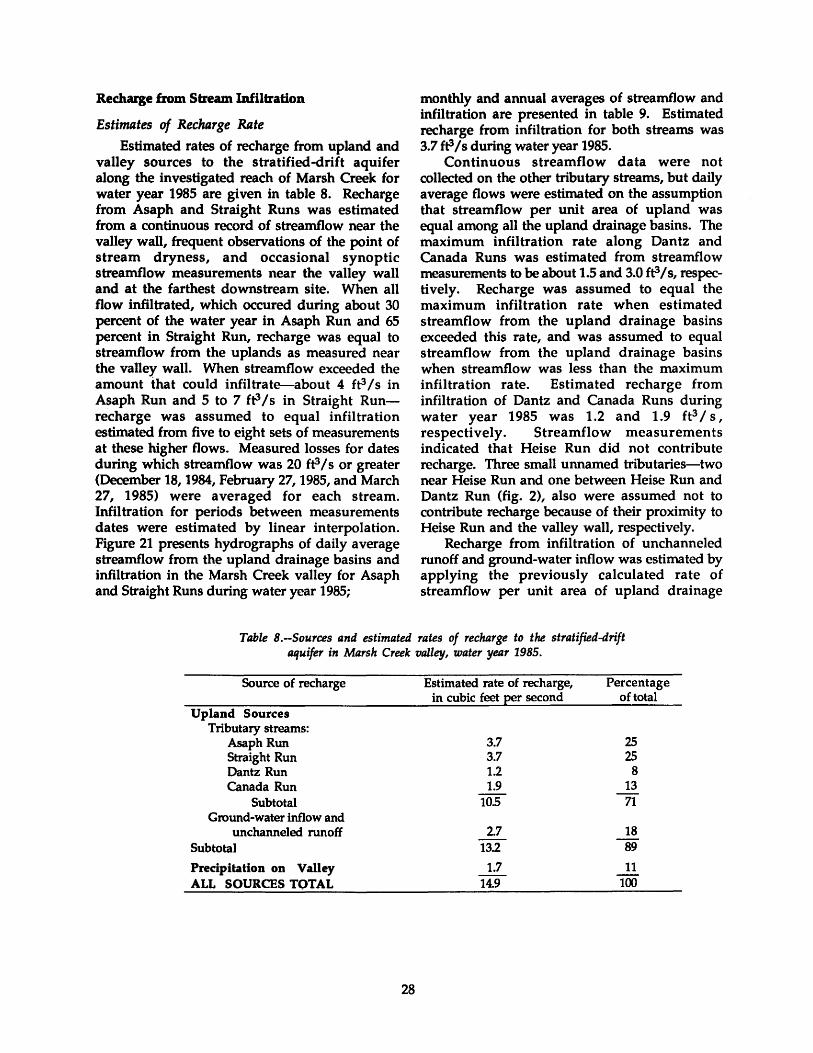
Recharge from Stream Infiltration
Estimates of Recharge Rate Estimated rates of recharge from upland and
valley sources to the stratified-drift aquifer along the investigated reach of Marsh Creek for water year 1985 are given in table 8. Recharge from Asaph and Straight Runs was estimated from a continuous record of streamflow near the valley wall, frequent observations of the point of stream dryness, and occasional synoptic streamflow measurements near the valley wall and at the farthest downstream site. When all flow infiltrated, which occured during about 30 percent of the water year in Asaph Run and 65 percent in Straight Run, recharge was equal to streamflow from the uplands as measured near the valley wall. When streamflow exceeded the amount that could infiltrate-about 4 ft3 Is in Asaph Run and 5 to 7 ft3 Is in Straight Runrecharge was assumed to equal infiltration estimated from five to eight sets of measurements at these higher flows. Measured losses for dates during which streamflow was 20 ft3 Is or greater (December 18, 1984, February 27, 1985, and March 27, 1985) were averaged for each stream. Infiltration for periods between measurements dates were estimated by linear interpolation. Figure 21 presents hydrographs of daily average streamflow from the upland drainage basins and infiltration in the Marsh Creek valley for Asaph and Straight Runs during water year 1985;
monthly and annual averages of streamflow and infiltration are presented in table 9. Estimated recharge from infiltration for both streams was 3.7 ft3 Is during water year 1985.
Continuous streamflow data were not collected on the other tributary streams, but daily average flows were estimated on the assumption that streamflow per unit area of upland was equal among all the upland drainage basins. The maximum infiltration rate along Dantz and Canada Runs was estimated from streamflow measurements to be about 1.5 and 3.0 ft3 Is, respectively. Recharge was assumed to equal the maximum infiltration rate when estimated streamflow from the upland drainage basins exceeded this rate, and was assumed to equal streamflow from the upland drainage basins when streamflow was less than the maximum infiltration rate. Estimated recharge from infiltration of Dantz and Canada Runs during water year 1985 was 1.2 and 1.9 ft3 I s , respectively. Streamflow measurements indicated that Heise Run did not contribute recharge. Three small unnamed tributaries-two near Heise Run and one between Heise Run and Dantz Run (fig. 2), also were assumed not to contribute recharge because of their proximity to Heise Run and the valley wall, respectively.
Recharge from infiltration of unchanneled runoff and ground-water inflow was estimated by applying the previously calculated rate of streamflow per unit area of upland drainage
Table B.-Sources and estimated rates of recharge to the stratified-drift aquifer in Marsh Creek valley, water year 1985.
Source of recharge Estimated rate of recharge, Percentage in cubic feet Eer second of total
Upland Sources Tributary streams:
Asaph Run 3.7 25 Straight Run 3.7 25 Dantz Run 1.2 8 Canada Run 1.9 13
Subtotal 10.5 71 Ground-water inflow and
unchanneled runoff 2.7 18 Subtotal 13.2 89
Precipitation on Valley 1.7 11 ALL SOURCES TOTAL 14.9 100
28

basins to the upland areas bordering the aquifer that are not drained by tributary streams. This estimate assumes that all precipitation not lost through evapotranspiration in these bordering areas either infiltrates and flows laterally into the stratified-drift aquifer or flows overland and infiltrates at the valley wall. Estimated
recharge from unchanneled runoff and groundwater inflow from the bordering upland areas during water year 1985 was 2.7 ft3 Is.
Recharge from infiltration of precipitation on the valley was estimated by applying the rate of streamflow per unit area of upland to the area of the valley. This estimate assumes that
Table 9.-Monthly and annual averages of streamflow from the upland drainage basins and infiltration in Marsh Creek valley for Asaph and Straight Runs, water year 1985.
0 z 0 ()
October 1984 November December January 1985 February March April May June July August September Water year 1985
~ 100 a: w a.. 1-w w LL ()
iii :::::> ()
~
~ g LL
10
[Flow and infiltration rates are in cubic feet per second.] Streamflow near
valley wall Asaph Run Straight Run
3.6 13 39 13 27 39 29 69 99 3.6 3.8 2.9
16
1985
1.1 4.5
19 7.7
10 18 11
3.4 4.0 20 20 1.4 7.0
1984
Tributary-stream infiltration Asaph Run Straight Run
2.8 42 4.2 42 4.0 4.2 3.5 4.6 4.7 29 2.4 2.4 3.7
1.1 3.4 7.0 4.8 3.6 7.0 5.1 3.1 3.8 20 1.7 1.4 3.7
STREAMFLOW
1985
Figure 21.--Streamflow from the upland drainage basins and infiltration in Marsh Creek valley for Asaph and Straight Runs, water year 1985.
29
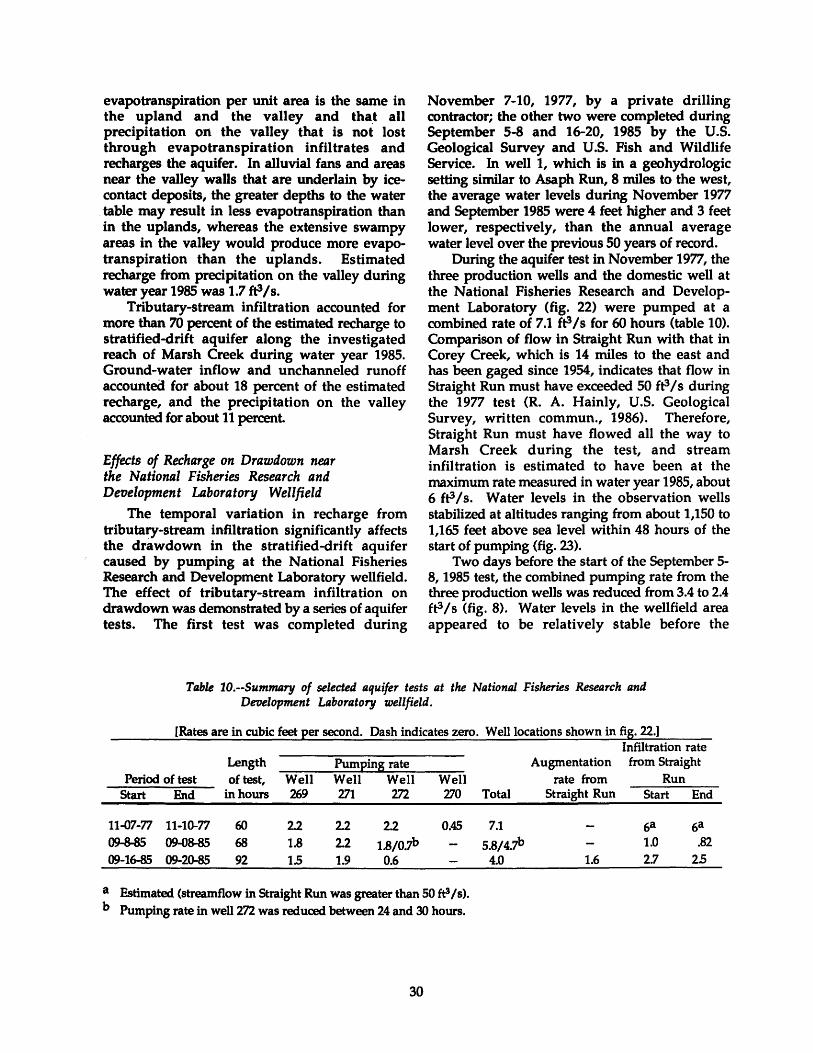
evapotranspiration per unit area is the same in the upland and the valley and tha_t all precipitation on the valley that is not lost through evapotranspiration infiltrates and recharges the aquifer. In alluvial fans and areas near the valley walls that are underlain by icecontact deposits, the greater depths to the water table may result in less evapotranspiration than in the uplands, whereas the extensive swampy areas in the valley would produce more evapotranspiration than the uplands. Estimated recharge from precipitation on the valley during water year 1985 was 1.7 ft3 Is.
Tributary-stream infiltration accounted for more than 70 percent of the estimated recharge to stratified-drift aquifer along the investigated reach of Marsh Creek during water year 1985. Ground-water inflow and unchanneled runoff accounted for about 18 percent of the estimated recharge, and the precipitation on the valley accounted for about 11 percent.
Effects of Recharge on Drawdown near the National Fisheries Research and Development Laboratory Wellfield
The temporal variation in recharge from tributary-stream infiltration significantly affects the drawdown in the stratified-drift aquifer caused by pumping at the National Fisheries Research and Development Laboratory wellfield. The effect of tributary-stream infiltration on drawdown was demonstrated by a series of aquifer tests. The first test was completed during
November 7-10, 1977, by a private drilling contractor; the other two were completed during September 5-8 and 16-20, 1985 by the U.S. Geological Survey and U.S. Fish and Wildlife Service. In well 1, which is in a geohydrologic setting similar to Asaph Run, 8 miles to the west, the average water levels during November 1977 and September 1985 were 4 feet higher and 3 feet lower, respectively, than the annual average water level over the previous 50 years of record.
During the aquifer test in November 1977, the three production wells and the domestic well at the National Fisheries Research and Development Laboratory (fig. 22) were pumped at a combined rate of 7.1 ftlls for 60 hours (table 10). Comparison of flow in Straight Run with that in Corey Creek, which is 14 miles to the east and has been gaged since 1954, indicates that flow in Straight Run must have exceeded 50 ft;3 Is during the 1977 test (R. A. Hainly, U.S. Geological Survey, written commun., 1986). Therefore, Straight Run must have flowed all the way to Marsh Creek during the test, and stream infiltration is estimated to have been at the maximurn rate measured in water year 1985, about 6 ftlls. Water levels in the observation wells stabilized at altitudes ranging from about 1,150 to 1,165 feet above sea level within 48 hours of the start of pumping (fig. 23).
Two days before the start of the September 5-8, 1985 test, the combined pumping rate from the three production wells was reduced from 3.4 to 2.4 ft31s (fig. 8). Water levels in the wellfield area appeared to be relatively stable before the
Table 10.--Summary of selected aquifer tests at the National Fisheries Research and Development Laboratory wellfield.
[Rates are in cubic feet per second. Dash indicates zero. Well locations shown in fig. 22.]
Period of test Start End
Length of test,
in hours Well 269
Pumping rate Well Well 271 272
Well 270 Total
11-07-77 11-10-77 09-8-85 09-08-85 09-16-85 09-20-85
60
68
92
22 1.8 1.5
22 22 1.9
2.2
1.8/0.7b 0.6
0.45 7.1
a Estimated (streamflow in Straight Run was greater than 50 ft3 /s). b Pumping rate in well272 was reduced between 24 and 30 hours.
30
5.8/4.7b 4.0
Infiltration rate Augmentation from Straight
rate from Run Straight Run Start End
1.6
6a
1.0 2.7
6a .82
2.5

aquifer test started. The combined pumping rate from the three wells for the first 24 hours of the test was 5.8 ft3 Is (table 10 and fig. 8). The pumping rate in well 272 was reduced twice between 24 and 30 hours into the test because the water level was rapidly approaching the top of the well screen and pump intake at an altitude of 1,092 feet above sea level; the combined rate for the remaining 38 hours of the test was 4.7 ft3 Is. Streamflow from the upland drainage basin of Straight Run at the start of the test was 1.0 ft31s, and the point of dryness was more than 250 feet upstream of the closest production well. Water levels measured in observation wells at the start of the test were 15 to 20 feet lower than those at the start of the November 1977 test (fig. 23A) as a result of previous pumping from the wellfield and lower recharge prior to the test. After 68 hours, water levels in the observation wells failed to stabilize, and at the end of the test, the water level in well347, near the center of the wellfield, had declined to an altitude of 1,122 feet above sea level and was still declining at a rate of 0.11 feet per hour.
National Fisheries Research and [::] Development ---
Laboratory (NFRDL)
.270
0476 0347
0 400 FEET I I I I I
0 100 METERS
31
The three production wells were continuously pumped at a combined rate of 4.7 ft3 Is from the end of September 5-8, 1985 test to the beginning of the September 16-20 test. Recharge from precipitation (fig. 7) starting at the end of the September 5-8 test caused water levels to rise in the observation wells in the wellfield area, and the water levels continue to rise until September 11, after which they began to decline. Water levels before the start of the September 16-20 test were slightly below those at the end of the September 5-8 test and were still declining. For example, the water level in well 347, near the center of the wellfield, was at an altitude of 1,119 feet and was declining at a rate of 0.07 feet per hour.
The three production wells were pumped at a combined rate of 4.0 ft3 Is for 92 hours during the September 16-20 test (table 10). Streamflow from the upland drainage basin of Straight Run at the start of the test was 1.1 ft3 Is. Instead of discharging all the pumped water to Marsh Creek, 1.6 ft3 Is was used to augment streamflow in Straight Run 1,500 feet upstream of the wellfield.
EXPLANATION
c=J VALLEY
M:1:::1:1:1:1~:~8 UPLANDS
e 270 NFRDL DOMESTIC WELL
*269 NFRDL PRODUCTION WELL
u
OBSERVATION WELL
STREAMFLOW TO MARSH CREEKNovember 7-10, 1977
POINT OF STREAM DRYNESSSeptember 5-8, 1985
POINT OF STREAM DRYNESSSeptember 16-20, 1985, during streamflow augmentation
Figure 22.
Location of pumped and selected observation wells and points of stream dryness in Straight Run from aquifer tests of November 7-10, 1977 and September 5-8 and 16-20, 1985, at the National Fisheries Research and Development Laboratory wellfield.
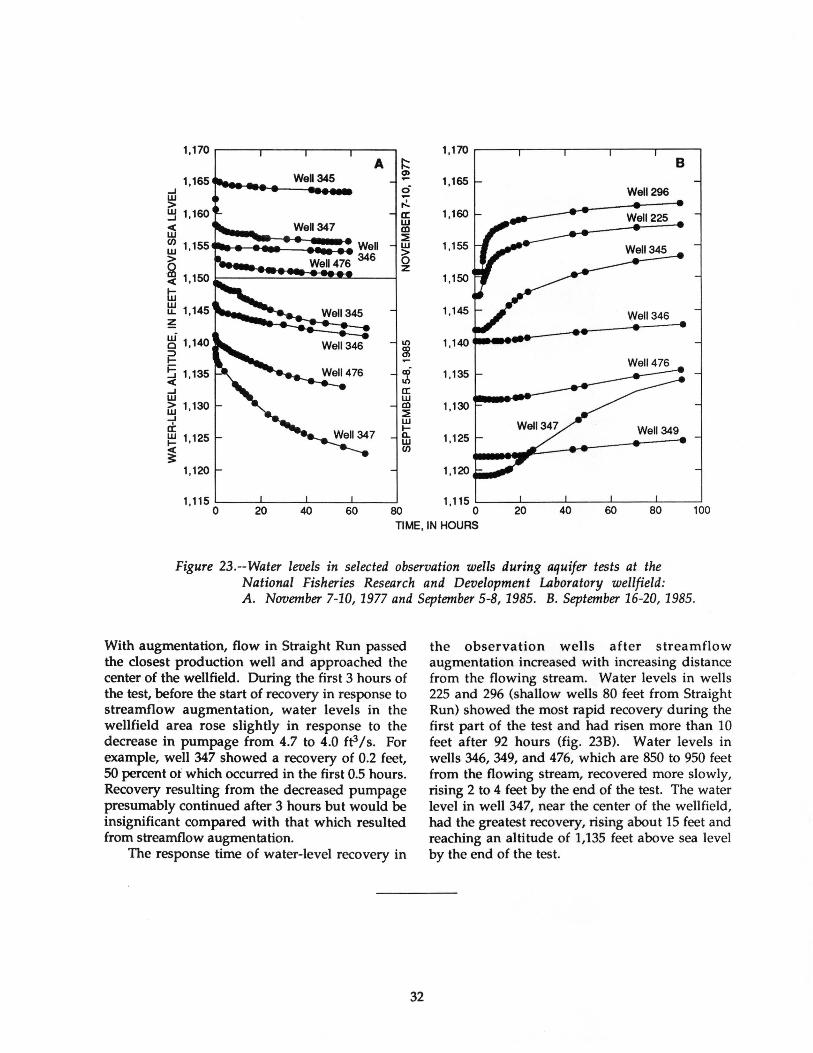
A 1:: (J) .... ci .... ,.:.. a: w CXl ::E w > 0 z
LO
~
:t a: w !D ::E w 1-Q. w C/)
1,170 ,.-----,-----,----.--.....------, B
1,165 Well296
1,160
1,155
1,150
1,145
1,135
1,130
1,115 L_ _ ____I. __ __._ __ -'--__ ...J...._ _ ___J
0 20 40 60 80 1 00 TIME, IN HOURS
Figure 23.--Water levels in selected observation wells during aquifer tests at the National Fisheries Research and Development Laboratory wellfield: A. November 7-10, 1977 and September 5-8, 1985. B. September 16-20, 1985.
With augmentation, flow in Straight Run passed the closest production well and approached the center of the wellfield. During the first 3 hours of the test, before the start of recovery in response to streamflow augmentation, water levels in the wellfield area rose slightly in response to the decrease in pumpage from 4.7 to 4.0 ft3 Is. For example, well 347 showed a recovery of 0.2 feet, 50 percent ot' which occurred in the first 0.5 hours. Recovery resulting from the decreased pumpage presumably continued after 3 hours but would be insignificant compared with that which resulted from streamflow augmentation.
The response time of water-level recovery in
32
the observation wells after streamflow augmentation increased with increasing distance from the flowing stream. Water levels in wells 225 and 296 (shallow wells 80 feet from Straight Run) showed the most rapid recovery during the first part of the test and had risen more than 10 feet after 92 hours (fig. 23B). Water levels in wells 346, 349, and 476, which are 850 to 950 feet from the flowing stream, recovered more slowly, rising 2 to 4 feet by the end of the test. The water level in well 347, near the center of the wellfield, had the greatest recovery, rising about 15 feet and reaching an altitude of 1,135 feet above sea level by the end of the test.
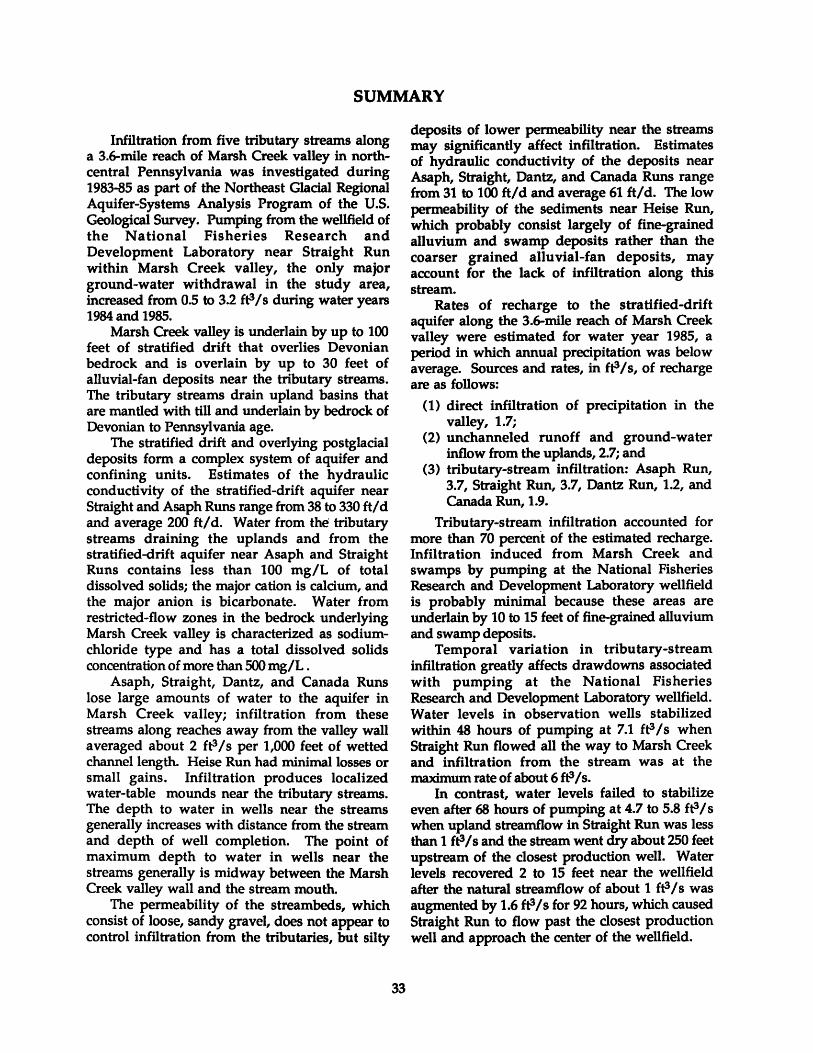
SUMMARY
Infiltration from five tributary streams along a 3.6-mile reach of Marsh Creek valley in northcentral Pennsylvania was investigated during 1983-85 as part of the Northeast Glacial Regional Aquifer-Systems Analysis Program of the U.S. Geological Survey. Pumping from the wellfield of the National Fisheries Research and Development Laboratory near Straight Run within Marsh Creek valley, the only major ground-water withdrawal in the study area, increased from 0.5 to 3.2 ft31s during water years 1984 and 1985.
Marsh Creek valley is underlain by up to 100 feet of stratified drift that overlies Devonian bedrock and is overlain by up to 30 feet of alluvial-fan deposits near the tributary streams. The tributary streams drain upland basins that are mantled with till and underlain by bedrock of Devonian to Pennsylvania age.
The stratified drift and overlying postglacial deposits form a complex system of aquifer and confining units. Estimates of the hydraulic conductivity of the stratified-drift aquifer near Straight and Asaph Runs range from 38 to 330 ftl d and average 200 ftld. Water from the tributary streams draining the uplands and from the stratified-drift aquifer near Asaph and Straight Runs contains less than 100 mgiL of total dissolved solids; the major cation is calcium, and the major anion is bicarbonate. Water from restricted-flow zones in the bedrock underlying Marsh Creek valley is characterized as sodiumchloride type and has a total dissolved solids concentration of more than 500 mgiL .
Asaph, Straight, Dantz, and Canada Runs lose large amounts of water to the aquifer in Marsh Creek valley; infiltration from these streams along reaches away from the valley wall averaged about 2 ftlls per 1,000 feet of wetted channel length. Heise Run had minimal losses or small gains. Infiltration produces localized water-table mounds near the tributary streams. The depth to water in wells near the streams generally increases with distance from the stream and depth of well completion. The point of maximum depth to water in wells near the streams generally is midway between the Marsh Creek valley wall and the stream mouth.
The permeability of the streambeds, which consist of loose, sandy gravel, does not appear to control infiltration from the tributaries, but silty
33
deposits of lower permeability near the streams may significantly affect infiltration. Estimates of hydraulic conductivity of the deposits near Asaph, Straight, Dantz, and Canada Runs range from 31 to 100 ftld and average 61 ftld. The low permeability of the sediments near Heise Run, which probably consist largely of fine-grained alluvium and swamp deposits rather than the coarser grained alluvial-fan deposits, may account for the lack of infiltration along this stream.
Rates of recharge to the stratified-drift aquifer along the 3.6-mile reach of Marsh Creek valley were estimated for water year 1985, a period in which annual precipitation was below average. Sources and rates, in ftlls, of recharge are as follows:
(1) direct infiltration of precipitation in the valley, 1.7;
(2) unchanneled runoff and ground-water inflow from the uplands, 2.7; and
(3) tributary-stream infiltration: Asaph Run, 3.7, Straight Run, 3.7, Dantz Run, 1.2, and Canada Run, 1.9.
Tributary-stream infiltration accounted for more than 70 percent of the estimated recharge. Infiltration induced from Marsh Creek and swamps by pumping at the National Fisheries Research and Development Laboratory wellfield is probably minimal because these areas are underlain by 10 to 15 feet of fine-grained alluvium and swamp deposits.
Temporal variation in tributary-stream infiltration greatly affects drawdowns associated with pumping at the National Fisheries Research and Development Laboratory wellfield. Water levels in observation wells stabilized within 48 hours of pumping at 7.1 ft31s when Straight Run flowed all the way to Marsh Creek and infiltration from the stream was at the maximum rate of about 6 ft;3 Is.
In contrast, water levels failed to stabilize even after 68 hours of pumping at 4.7 to 5.8 ft3 Is when upland streamflow in Straight Run was less than 1 ft3 Is and the stream went dry about 250 feet upstream of the closest production well. Water levels recovered 2 to 15 feet near the wellfield after the natural streamflow of about 1 ft3 Is was augmented by 1.6 ft31s for 92 hours, which caused Straight Run to flow past the closest production well and approach the center of the wellfield.
REFERENCES 01 ED
Babcock, H. M. and Cushing, E. M., 1942, Recharge to groundwater from floods in a typical desert wash, Penal County, Arizona: Transactions American Geophysical Union, v. 23, p. 49-55.
Becher, A. E. and Root, S. 1., 1981, Groundwater resources and geology of Cumberland valley, Cumberland County, Pennsylvania: Pennsylvania Geological Survey Water Resources Report 50, 95 p.
Berg, T. M. and Dodge, C. M. 1981, Atlas of preliminary geologic maps of Pennsylvania: Pennsylvania Geological Survey Map 61, 636 p.
Bouwer, Herman, 1965, Theoretical aspect of seepage from open channels: American Society of Civil Engineers Proceedings, Journal Hydraulics Division, v. 91, no. HY3, p. 37-59.
_ 1978, Groundwater hydrology: New York, McGrawHill,480 p.
Bradbury, K. R. and Rothschild, E. R., 1985, A computerized technique for estimating the hydraulic conductivity of aquifers from specific capacity data: Groundwater, v. 23, no. 2, p. 240-245.
Brons, F. and Marting, V. E., 1961, The effect of restricted fluid entry on well productivity: Journal of Petroleum Technology, v. 13, no. 2, p. 172-174.
Haeni, F. P., 1986, Application of seismic-refraction methods in ground-water modeling studies in New England: Geophysics, v. 51, no. 2, p. 236-249.
_ 1988, Application of seismic-refraction tech-niques to hydrologic studies: U.S. Geological Survey Techniques of Water-Resources Investigations, book 2, chap. D2, 86 p.
Kennedy, E. J., 1984, Discharge ratings at gaging stations:· U.S. Geological Survey Techniques of Water-Resources Investigations, book 3, chap. A10, 59p.
Lyford, F. P., 1986, Northeast glacial regional aquifersystem study, in Sun, R.J., ed., Regional aquifer-
34
system analysis program of the U.S. Geological Survey, summary of projects, 1978-1984: U.S. Geological Survey Circular 1002, 264 p.
McDonald, M. G. and Harbaugh, A. W., 1988, A modular three-dimensional finite-difference ground-water flow model: U.S. Geological Survey Techniques of Water-Resources Investigations, book 6, chap. A1, 586 p.
National Oceanic and Atmospheric Administration, 1985, Climatological data for Pennsylvania, v. 90, nos. 1 through 12.
Randall, A. D., 1978, Infiltration from tributary streams in the Susquehanna River basin, New York: U.S. Geological Survey Journal of Research, v. 6, no. 3, p. 285-297.
Scott, J. H., Tibbitts, and B. L., Burdick, R. G., 1972, Computer analysis of seismic refraction data: U.S. Bureau of Mines Report of Investigations 7595, 95p.
Taylor, L. E., Werkheiser, W. H., and Kriz, M. L., 1983, Groundwater resources of the West Branch Susquehanna River Basin, Pennsylvania: Pennsylvania Geological Survey Water Resources Report 56, 143 p.
Theis, C. V., Brown, R. H., and Meyer, R. R., 1963, Estimating the transmissivity of aquifers from the specific capacity of wells in Bentall, Ray,. ed. Methods of determining permeability, transmissivity, and drawdown: U.S. Geological Survey Water-Supply Paper 1536-I, p. 331-341.
Zhody, A. A. R., 1973, A computer program for the automatic interpretation of Schlumberger sounding curves over horizontally stratified media: U.S. Geological Survey Report USGS-GD-74-017, 25p.
Zhody, A. A. R., Eaton, G. P., and Mahby, D. R., 1974, Applications of surface geophysics to ground water investigations: U.S. Geological Survey Techniques of Water Resources Investigations, book 2, chap. D1, 116 p.

APPENDIXES
Page
1. Completion information for selected wells and test holes . .. .. . . .. .. .. . .. .. .. .. . . . . . .. .. . . .. . . . .. .. .. .. .. .. . . 36
2. Streamflow and infiltration rates for the tributary-stream sites ......................................... 38
35

Appendix 1.--Completion information for selected wells and test holes.
[Locations are shown in fig. 6. Dash indicates no data.] Depth of well
Well or or hole, in 'feet Casing depth, Casing test-hole Year Type of Geologic below land in feet below diameter, number1 Owner Completed completion2 Usel unit4 surface land surface in inches
221 U.S. Fish &: Wildlife 1973 s T Qsd 115 75 5 222 U.S. Fish &: Wildlife 1973 s T Qsd 100 80 14 223 U.S. Fish &: Wildlife 1973 s T Qsd 62 22 5 224 U.S. Geological Survey 1984 s 0 Qsd 34 29 2 225 U.S. Geological Survey 1984 s 0 Qsd 45 40 2 264 Marsh Creek Church 1978 0 H Qsd 36 36 6 '}1,9 .u.s. Fish&: Wildlife 1977 s NP Qsd 93 73 14 270 U.S. Fish &: Wildlife 1977 s NH Qsd 96 77 14 271 U.S. Fish &: Wildlife 1977 s NP Qsd 97 70 14 272 U.S. Fish&: Wildlife 1977 s NP Qsd 88 68 14
296 U.S. Geological Survey 1984 s 0 Qsd 23 18 2 797 U.S. Geological Survey 1984 s 0 Qaf 20 15 2 2.99 U.S. Geological Survey 1984 s 0 Qsd 48 43 2
w 300 U.S. Geological Survey 1984 s 0 Qaf 20 15 2 0\
324 U.S. Geological Survey 1984 s 0 Qaf 15 10 2 325 U.S. Geological Survey 1984 s 0 Qsd 53 43 2 344 U.S. Fish&: Wildlife 1977 s 0 Qsd 60 20 2 345 U.S. Fish &: Wildlife 1977 s 0 Qsd 60 20 2 346 U.S. Fish&: Wildlife 1977 s 0 Qsd 60 20 2 347 U.S. Fish &: Wildlife 1977 s 0 Qsd 60 20 2
348 U.S. Geological Survey 1984 s 0 Qsd 16 11 2 349 U.S. Fish&: Wildlife 1977 s 0 Qsd 60 20 2 374 U.S. Geological Survey 1984 p 0 Qaf 15 10 2 405 Webster, W. 1967 0 H Qsd 36 36 6 406 Miller, R. 1979 0 H Qsd 45 45 6 464 U.S. Fish&: Wildlife 1973 s T Qsd 96 56 5 465 U.S. Fish&: Wildlife 1973 s T Qsd 108 68 5 466 U.S. Fish &: Wildlife 1973 s T Qsd 102 62 5 467 U.S. Fish&: Wildlife 1973 s T Qsd 105 85 14 468 U.S. Fish&: Wildlife 1973 N T Dck 61
469 U.S. Fish &: Wildlife 1973 N T Dck 64 470 U.S. Fish&: Wildlife 1984 p 0 Qsd 73 69 6 471 U.S. Fish&: Wildlife 1984 p 0 Qsd 47 42 6
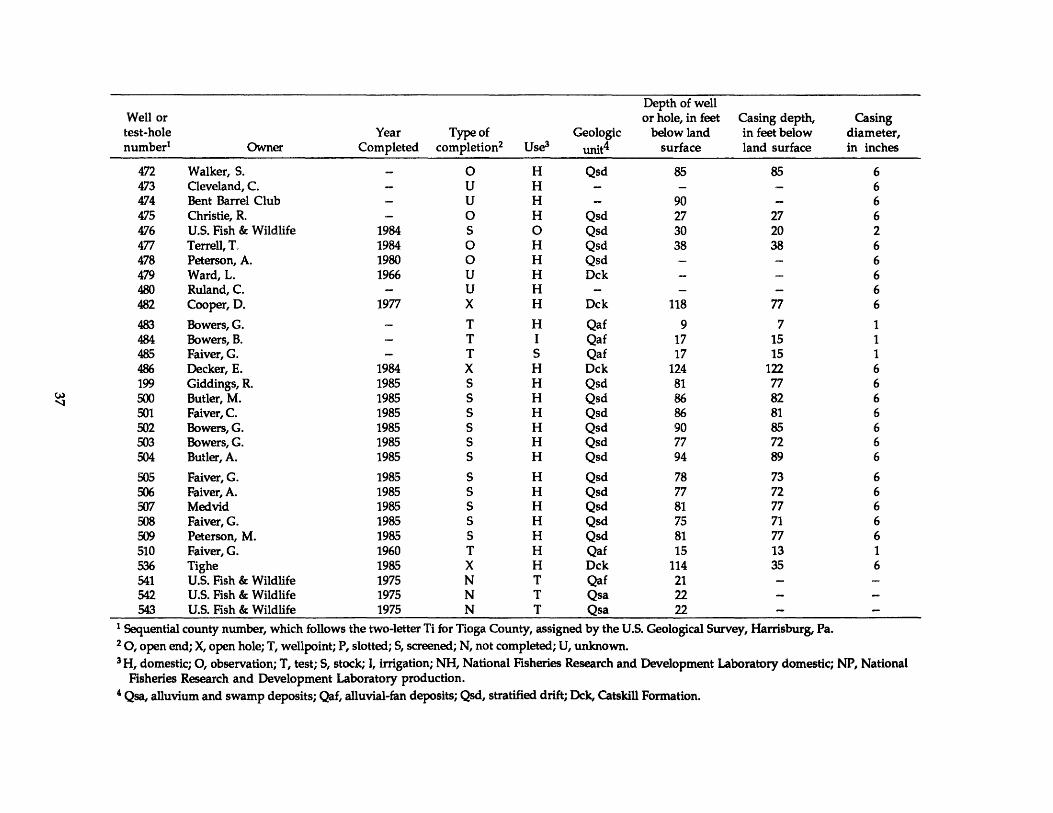
Depth of well Well or or hole, in feet Casing depth, Casing test-hole Year Type of Geologic below land in feet below diameter, number1 Owner Completed completion2 Use3 unit4 surface land surface in inches
472 Walker, S. 0 H Qsd 85 85 6 473 Cleveland, C. u H 6 474 Bent Barrel Club u H 90 6 475 Christie, R. 0 H Qsd 27 27 6 476 U.S. Fish & Wildlife 1984 s 0 Qsd 30 20 2 477 Terrell, T. 1984 0 H Qsd 38 38 6 478 Peterson, A. 1980 0 H Qsd 6 479 Ward, L. 1966 u H Dck 6 480 Ruland, C. u H 6 482 Cooper, D. 1977 X H Dck 118 77 6
483 Bowers, G. T H Qaf 9 7 1 484 Bowers, B. T I Qaf 17 15 1 485 Faiver,G. T s Qaf 17 15 1 486 Decker, E. 1984 X H Dck 124 122 6 199 Giddings, R. 1985 s H Qsd 81 77 6
(JJ 500 Butler, M. 1985 s H Qsd 86 82 6 ~
501 Faiver,C. 1985 s H Qsd 86 81 6 502 Bowers, G. 1985 s H Qsd 90 85 6 503 Bowers, G. 1985 s H Qsd 77 72 6 504 Butler, A. 1985 s H Qsd 94 89 6
505 Faiver,G. 1985 s H Qsd 78 73 6 506 Faiver,A. 1985 s H Qsd 77 72 6 507 Medvid 1985 s H Qsd 81 77 6 508 Faiver,G. 1985 s H Qsd 75 71 6 509 Peterson, M. 1985 s H Qsd 81 77 6 510 Faiver, G. 1960 T H Qaf 15 13 1 536 Tighe 1985 X H Dck 114 35 6 541 U.S. Fish & Wildlife 1975 N T Qaf 21 542 U.S. Fish & Wildlife 1975 N T Qsa 22 543 U.S. Fish & Wildlife 1975 N T Qsa 22
1 Sequential county number, which follows the two-letter Ti for Tioga County, assigned by the U.S. Geological Survey, Harrisburg, Pa. 2 0, open end; X, open hole; T, wellpoint; P, slotted; S, screened; N, not completed; U, unknown. 3 H, domestic; 0, observation; T, test; S, stock; I, irrigation; NH, National Fisheries Research and Development Laboratory domestic; NP, National
Fisheries Research and Development Laboratory production. 4 Qsa, alluvium and swamp deposits; Qaf, alluvial-fan deposits; Qsd, stratified drift; Dck, Catskill Formation.
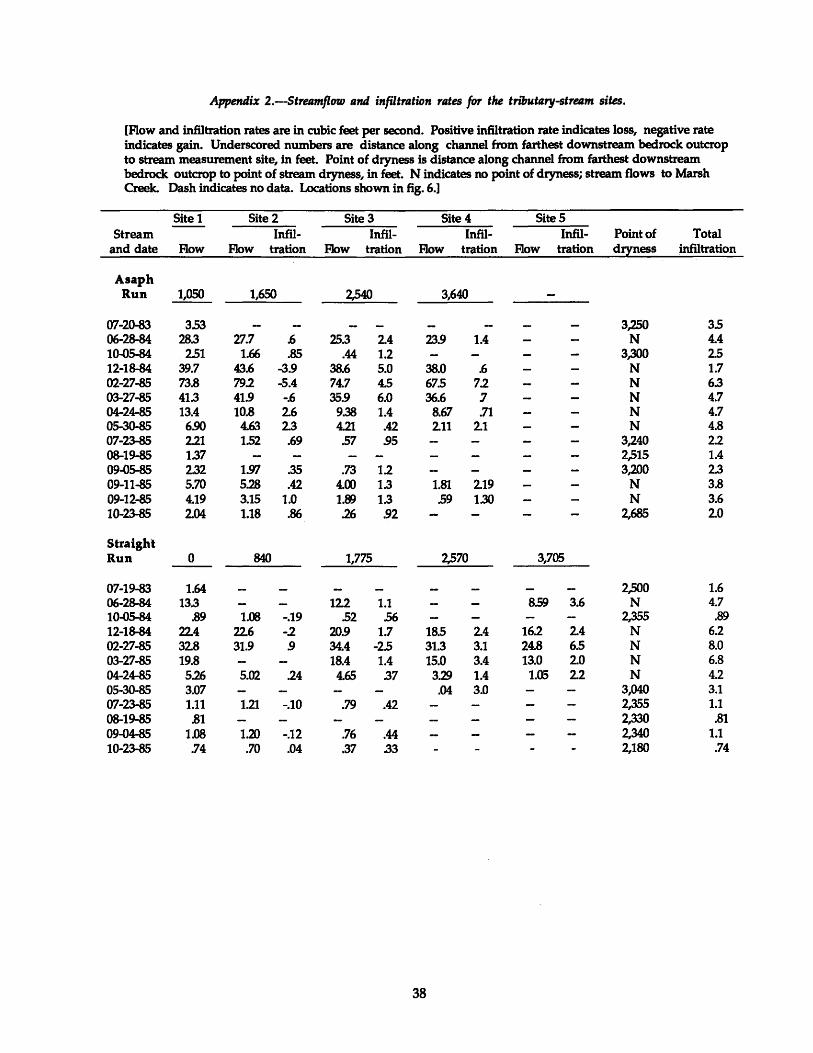
Appendix 2.-Streamflow and infiltration rates for the tributary-stream sites.
[Flow and infiltration rates are in cubic feet per second. Positive infiltration rate indicates loss, negative rate indicates gain. Underscored numbers are distance along channel from farthest downstream bedrock outcrop to stream measurement site, in feet. Point of dryness is distance along channel from farthest downstream bedrock outcrop to point of stream dryness, in feet. N indicates no point of dryness; stream flows to Marsh Creek. Dash indicates no data. Locations shown in fig. 6.]
Site 1 Site 2 Site 3 Site 4 Site 5 Stream Infil- Infil- Infil- lnfil- Point of Total
and date Flow Flow tration Flow tration Flow tration Flow tration dryness infiltration
A sa ph Run 1,050
07-20-83 06-28-84 10~5-84 12-18-84 02-27-85 03-27-85 04-24-&5 05-30-85 07-23-85 08-19-85 09~5-85
09-11-85 09-12-85 10-23-85
Straight Run
07-19-83 06-28-84 10~5-84
12-18-84 02-27-85 03-27-85 04-24-85 05-30-85 07-23-85 08-19-85 09~4-85 10-23-85
3.53 28.3
2.51 39.7 73.8 41.3 13.4
6.90 2.21 1.37 2.32 5.70 4.19 204
0
1.64 13.3
.89 22.4 328 19.8 526 3.07 1.11
.81 1.0S .74
1,650
27.7 .6 1.66 .85
43.6 -3.9 79.2 -5.4 41.9 -.6 10.8 26
4.63 23 1.52 .69
1.97 .35 5.28 .42 3.15 1.0 1.18 .86
840
1.(1J -.19 22.6 -.2 31.9 9
5.02 .24
1.21 -.10
1.20 -.12 .70 .04
2,540
25.3 24 .44 1.2
38.6 5.0 74.7 4.5 35.9 6.0
9.38 1.4 4.21 .42 .57 95
.73 1.2 4.00 1.3 1.89 1.3 26 .92
1,775
122 1.1 .52 .56
20.9 1.7 34.4 -2.5 18.4 1.4
4.65 .37
.79 .42
.76 .44
.37 .33
3,640
23.9 1.4
38.0 " 67.5 7.2 36.6 7
8.67 .71 211 21
1.81 219 .59 1.30
2,570
18.5 24 31.3 3.1 15.0 3.4
3.29 1.4 .04 3.0
38
3,705
8.59 3.6
16.2 24 24.8 6.5 13.0 20
1.05 22
3,250 N
3,300 N N N N N
3,240 2,515 3,200
N N
2,685
2,500 N
2,355 N N N N
3,040 2,355 2,330 2,340 2,180
3.5 4.4 25 1.7 6.3 4.7 4.7 4.8 2.2 1.4 23 3.8 3.6 20
1.6 4.7 .89
6.2 8.0 6.8 4.2 3.1 1.1 .81
1.1 .74
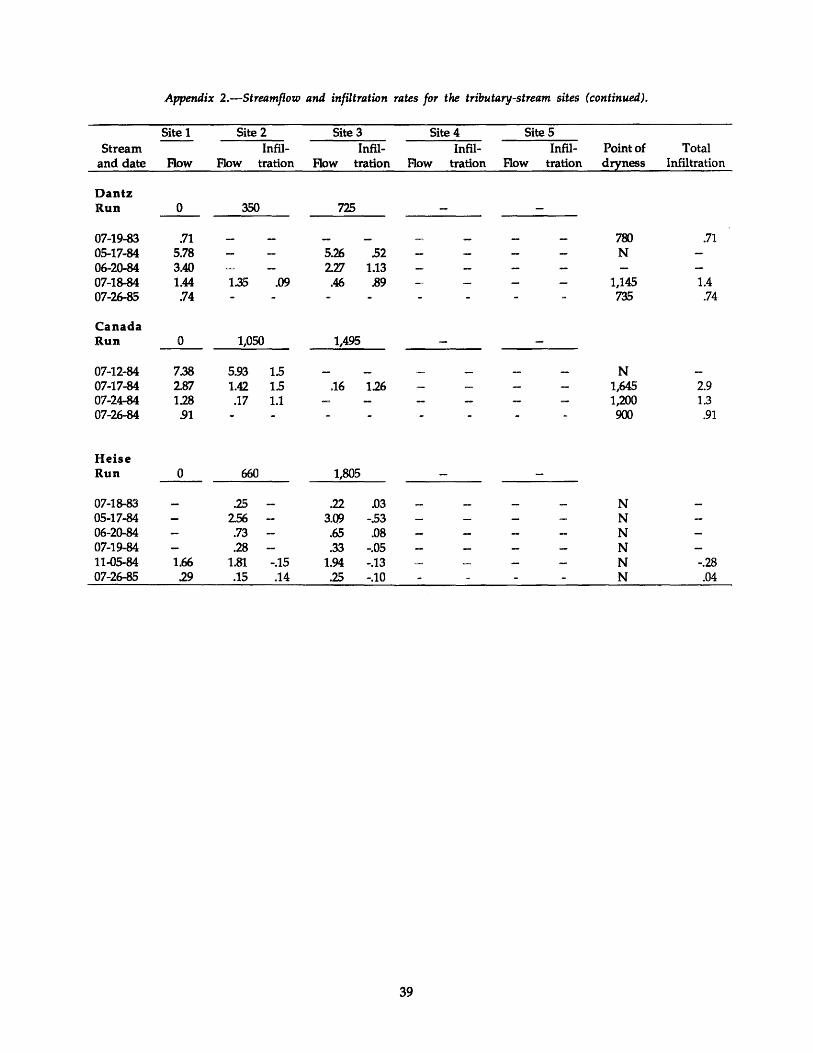
Appendix 2.--Streamflow and infiltration rates for the tributary-stream sites (continued).
Site 1 Site 2 Site 3 Site 4 Site 5 Stream Infil- Infil- Infil- Infil- Point of Total
and date Flow Flow tration Flow tration Flow tration Flow tration dryness Infiltration
Dantz Run 0 350 725
07-19-83 .71 78) .71 05-17-84 5.78 5.26 .52 N 06-20-84 3.40 227 1.13 07-18-84 1.44 1.35 .09 .46 .89 1,145 1.4 07-26-85 .74 735 .74
Canada Run 0 1,050 1,495
07-12-84 7.38 5.93 1.5 N 07-17-84 287 1.42 1.5 .16 126 1,645 2.9 07-24-84 128 .17 1.1 1,200 1.3 07-26-84 91 900 .91
Heise Run 0 660 1,805
07-18-83 .25 .22 .03 N 05-17-84 256 3.09 -.53 N 06-20-84 .73 .65 .08 N 07-19-84 .28 .33 -.05 N 11-05-84 1.66 1.81 -.15 1.94 -.13 N -.28 07-26-85 29 .15 .14 .25 -.10 N .04
39


\
l

John H. W
illiams
Tributary S
tream Infiltration in M
arsh Creek V
alley, North-C
entral Pennsylvania
qD ~
USG
S WR
I 11-4052
•