Embed Size (px)
Citation preview

Tri‐State Paving and Sealcoating, LLC Process Flow Diagramdba MoZack Ready Mix Dry Concrete Batch Plant
Scott Depot, West Virginia
APCD‐2
HR‐WS Silo Capacity = 207/28 tonscement/additive
UL‐BH Paved RoadsTC‐MD‐1 HR‐WS
SL‐WG TC‐MD‐3
Paved Ducting
Roads SL‐WG TC‐PE‐2 TC‐PE‐BH APCD‐1
HR‐WS TC‐PE‐4
SL‐WG TC‐PE‐5
Process Flow Rate: Aggregate/Sand = 140/107 TPH and 350,000/268,000 TPY
Legend:SF‐X Storage Pile with Wind Wall ‐ number TC‐MD‐X Transfer Point with Minimized Drop ‐ numberE3‐X Three sided enclosure/bin ‐number SL‐WG Storage Load Out with Wind WallBS‐X Enclosed Silo ‐number HR‐WS Haul Road/Storage Pile Water SprayWH‐X Weight Hopper/Batcher ‐ number TC‐PE‐BH Transfer with partial enclosure and baghouseAPCD‐X Air Pollution Control Device ‐ number UL‐BH Truck Unloading with baghouse control
Equipment Sizes:Plant Capacity: 150 yd3/hr (302 tons/hour)
(Concrete) 375,000 yd3/year (755,000 tons/year) E3‐1 25 (34) Cubic Yards (tons)SF‐1, 2, 3 Max Height 20 feet E3‐2 90 (121) Cubic Yards (tons)
Max Diameter 50 feet BS‐1 7,300 Cubic Feet
Water Spray
Sand
& Aggregate by Truck
Direct Dum
p
with
Wind Walls
Pile and
Work Area
Sand
and
Aggregate Storage Piles
Flexible Shroud
Con
veyor transfer
Transfer by Loader
Pnem
atic transfer
Cemen
t and
add
itive by Truck
Process Flow Rate:
Additive = 5 TPH and 14,000 TPYCement = 37 TPH and 92,000 TPY
Moveable conveyor transfer
SF‐1
E3‐2
BS‐1
WH‐2
Concrete Truck
SF‐2
SF‐3
E3‐1
WH‐1

MoZack Ready MixAir Permit ApplicationAssumptions
Production:150 yd3/hour
2500 hours/year (10 hours/day, 5 days/wk, 50 weeks/yr)375,000 yd3/year
Typical Mix Ratios:1865 aggregate 46.3%1428 sand 35.5%491 cement 12.2%73 lbs additive 1.8%
167 lbs water 4.2%4024 lbs/yd3 total149 lbs/ft3 total
Hourly and Annual Throughputs:
yd3 tons yd3 tonsaggregate 69.5 139.9 173,801 349,688 sand 53.2 107.1 133,077 267,750 cement 18.3 36.8 45,757 92,063 lbs additive 2.7 5.5 6,803 13,688 water 6.2 12.5 15,563 31,313 Total 301.8 754,500 Total no water 289 723188
Conversions:27 ft3/yd3
4024 lbs/yd3 concrete
Plant Configuration:
Hourly Annual
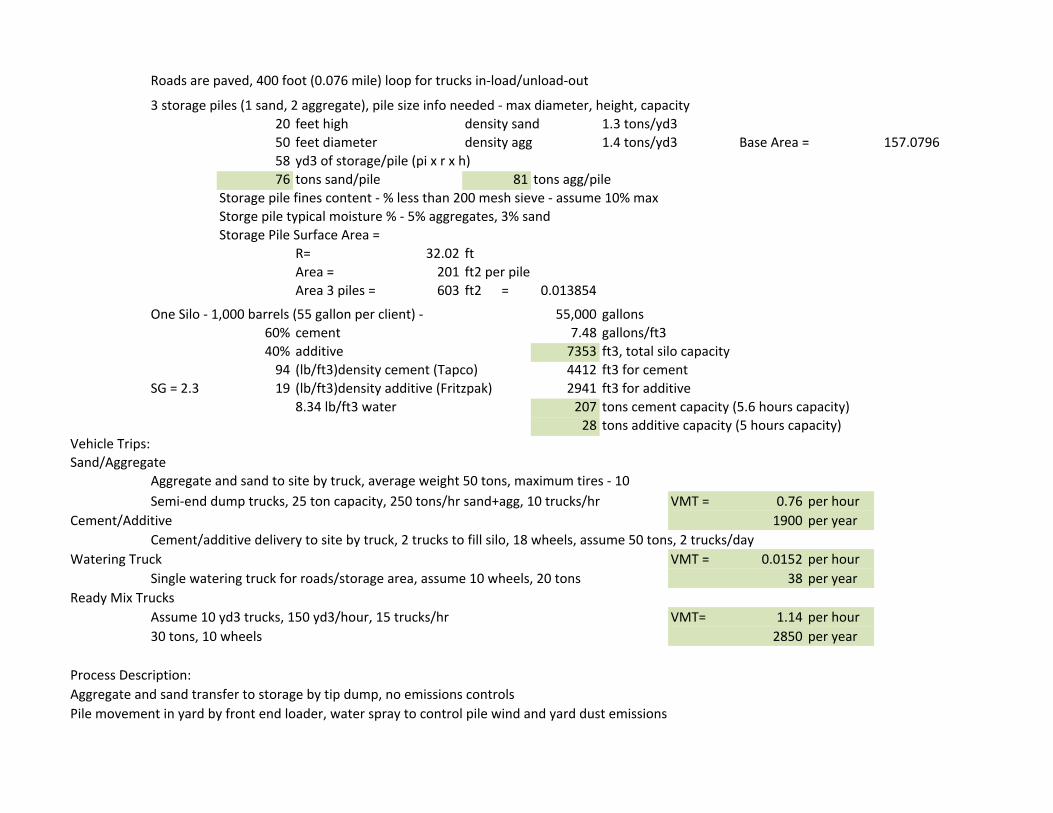
Roads are paved, 400 foot (0.076 mile) loop for trucks in‐load/unload‐out
3 storage piles (1 sand, 2 aggregate), pile size info needed ‐ max diameter, height, capacity20 feet high density sand 1.3 tons/yd350 feet diameter density agg 1.4 tons/yd3 Base Area = 157.079658 yd3 of storage/pile (pi x r x h)76 tons sand/pile 81 tons agg/pile
Storage pile fines content ‐ % less than 200 mesh sieve ‐ assume 10% maxStorge pile typical moisture % ‐ 5% aggregates, 3% sandStorage Pile Surface Area =
R= 32.02 ftArea = 201 ft2 per pileArea 3 piles = 603 ft2 = 0.013854
One Silo ‐ 1,000 barrels (55 gallon per client) ‐ 55,000 gallons60% cement 7.48 gallons/ft340% additive 7353 ft3, total silo capacity94 (lb/ft3)density cement (Tapco) 4412 ft3 for cement
SG = 2.3 19 (lb/ft3)density additive (Fritzpak) 2941 ft3 for additive8.34 lb/ft3 water 207 tons cement capacity (5.6 hours capacity)
28 tons additive capacity (5 hours capacity)Vehicle Trips:Sand/Aggregate
Aggregate and sand to site by truck, average weight 50 tons, maximum tires ‐ 10Semi‐end dump trucks, 25 ton capacity, 250 tons/hr sand+agg, 10 trucks/hr VMT = 0.76 per hour
Cement/Additive 1900 per yearCement/additive delivery to site by truck, 2 trucks to fill silo, 18 wheels, assume 50 tons, 2 trucks/day
Watering Truck VMT = 0.0152 per hourSingle watering truck for roads/storage area, assume 10 wheels, 20 tons 38 per year
Ready Mix TrucksAssume 10 yd3 trucks, 150 yd3/hour, 15 trucks/hr VMT= 1.14 per hour30 tons, 10 wheels 2850 per year
Process Description:Aggregate and sand transfer to storage by tip dump, no emissions controlsPile movement in yard by front end loader, water spray to control pile wind and yard dust emissions

Transfer to elevated sand/agg bin using loaderTransfer from elevated bin to conveyor by direct drop with minimum dropTransfer from conveyor to batch mixer by direct drop with minimize dropCement/additive transfer to silo pnematic, silo controlled with VH 245JP silo vent baghouseCement/additive transfer to batcher totally enclosedCement/additive/aggregate/sand transfer to ready mix haul trucks controlled by flexible shroud (partial enclosure) vented to baghouseAssume saturated surface dry + 1% moisture for pile conditions ‐ 5% for aggregate, 3% for sandAssume aggregate feed bin dimensions at top are 28'x14', at bottom are 14'x4' at discharge to batcher with 4' straight vertical section at top and 9
Bin Capacity = 2324 ft386 yd3
116.2 tonsAssume loader bin is 25 yd3 and 34 tons capacity


' vertical slope to batcher

Attachment A: Current Business Certificate
.

Attachment B: Process Description
Tri-State Paving and Sealcoating is planning to construct a dry concrete batch plant in Scott Depot, West Virginia. Travel, working and storage areas within the plant site will be paved in concrete or asphalt. Sand, aggregate, cement and cement additive will be delivered by truck.
Sand and aggregate will be transferred to storage piles (SF-1 through SF-3) by direct dump from delivery trucks. The pile storage area will have wind walls to minimize emissions (SL-WG). From the sand and aggregate storage piles, material loadout will use a front end loader to transfer sand and aggregate to a three-sided conveyor feed bin (E3-1). The loader operator will minimize the drop distance to reduce fugitive emissions (TC-MD-1). The bin will act as a partial enclosure as well. Sand and aggregate will be transferred via open, moveable conveyor to an open-top aggregate and sand process bin (E3-2). The drop distance onto the conveyor will be minimized and fitted with a partial enclosure (TC-PE-2). The drop distance into the aggregate and sand process storage will be minimized (TC-MD-3). The bin will act as a partial enclosure as well. Sand and aggregate will bottom discharge from E3-2 into a weigh hopper (WH-1). The drop into WH-1 will be partially enclosed (TC-PE-4). From WH-1 the sand and aggregate will discharge onto an open transfer conveyor routed to the concrete truck loading rack. The drop distance onto the conveyor from the process bin will be minimized and fitted with a partial enclosure (TC-PE-5). Particulate emissions from loading of sand and aggregate into concrete trucks will be collected by a flexible shroud enclosure (TC-PE-BH) and routed to a baghouse (APCD-1). In addition to minimizing drop distances, conveyor transfer points will be fitted with either a partial enclosure, or a hood, or a curtain, or a shroud as required by the concrete batch plant general permit condition 2.2.5.d.viii. The specific treatment for each point will be determined as the plant design is finalized.
Cement and additive will be pneumatically transferred from delivery trucks to a single, split storage silo (BS-1) direct vented through a baghouse (APCD-2) for particulate control (UL-BH). Cement and cement additive will be bottom discharged from the storage silo (BS-1) through a total enclosure to the weigh hopper/batcher (WH-2). Discharge from the batcher into concrete trucks will be within a flexible shroud enclosure (TC-PE-BH). Particulate emissions from truck loading will be collected by the flexible shroud and routed to a baghouse (APCD-1).
Fugitive emissions from trucks traveling on the paved roads will be controlled by watering during dry weather (HR-WS). Wind erosion on storage piles will be controlled by pile watering during dry weather using the same water truck (HR-WS).
The plant capacity, based on final mixed concrete volume, is 150 cubic yards per hour (yd3/hr), and 375,000 cubic yards per year (yd3/yr). This is approximately 302 tons per hour (TPH), and 755,000 tons per year (TPY) respectively on a weight basis.

The plant process flow volumes and weights are based on final mix concrete with the following approximate composition for one yard of concrete (per AP-42, Section 11.12, Concrete Batching):
Aggregate 1865 pounds 46.3%
Sand 1428 pounds 35.5%
Cement 491 pounds 12.2%
Cement Additive 73 pounds 1.8%
Water 167 pounds 4.2%
Total 4024 pounds

Attachment C: Description of Fugitive Emissions
Fugitive emissions may occur as a result of truck travel on paved roads, travel of the front end loader between sand and aggregate storage piles and the process feed bin (E3-1), wind erosion on sand and aggregate storage piles (SF-1, SF-2, SF-3), and at transfer points for sand and gravel in the process (TC-MD/PE-1 through 5).
The following control methods will be employed to reduce fugitive emissions:
• Site Fugitives from Vehicles (trucks on roads, loader movement on site) – the site will be paved, a water truck (HR‐WS) will be used during dry weather to water roads and work areas.
• Storage Piles – storage piles will be surrounded by a wind wall (SL‐WG) to minimize fugitives during truck unloading and watered during dry weather conditions using the watering truck (HR‐WS).
• Sand and Aggregate Transfers – drop distance will be minimized at all transfers (TC‐MD). Non‐bin transfer points will be fitted with partial enclosures (TC‐PE).
The exact watering plan will be developed as the owner gains experience with this specific site and requirements to minimize dust emissions. To start, the watering plan is to water active work areas and roads at the site during dry weather conditions with an anticipated frequency of three times per day. Storage piles will be watered only if dust is observed leaving the piles from wind erosion to maintain product water content near needed levels.
The watering truck has not been procured, but a typical truck will have an application rate of approximately 120 to 400 gallons per minute per spray head. The anticipated watering truck will have 4 spray heads and an expected water application rate of 500 to 1,000 gallons per minute. Winterization methods are also still under investigation. A water heater may be installed at the site for production purposes and may be used for winter water application. Alternatively, additives may be used.
Best Management Practices – if fugitive dust emissions are observed moving offsite, the watering frequency or application rate will be increased until emissions are controlled.

Attachment D: Process Flow Diagram

Attachment E and Attachment F: Plot Plan and Area Maps
To supply the information requested by the G50-B application, the following drawings are attached:
• USGS 7.5 minute map showing the facility, nearest residential use, and nearest commercial use • A Google Earth Map showing the facility, nearest residential use, and nearest commercial use,
site access, and existing onsite building. The approximate boundary of the working area of the site is also shown. The working area of the site is more than 300 feet from the nearest adjacent use, which is commercial.
• A site layout plan showing property lines, driveway location, and existing onsite building which will remain.
• A site /grading & drainage plan showing equipment locations

Attachment G: Equipment Data Sheets and Registration Section Applicability Form
CBP PRODUCTION AFFECTED SOURCE SHEET
CBP Production Information
Source Identification Number1 WH-1
Manufacturer & Model Number VH*, LP12B
Date of Manufacture New
Maximum Design Production Rate2 250 tons/hour
Maximum Annual Production3 620,000 tons/year
Daily Operation 10 hours/day
Annual Operation 250 days/year
2500 hours/year
Approximate Percentage of Operation from: Note: This will vary based on sales
25 Jan - Mar
25 April - June
25 July - Sept
25 Oct - Dec
1. Enter the appropriate Source Identification Number for each concrete batch plant production weigh hopper
or central mixer. Batch plant weigh hopper should be designated WH-1, WH-2, etc. Batch plant central mixer should be designated CM-1, CM-2, etc.
2. Enter the manufacturer’s Maximum Design Production Rate of the concrete batch plant production
equipment. Specify units in tons/hour.
3. Enter the Maximum Annual Production of the concrete batch plant. Specify units of cubic yards per year or tons per year. To calculate Maximum Annual Production, multiply the Maximum Design Production Rate (tons/hr) by the Annual Operation (hrs/yr).
*VH = Vince Hagan

CBP PRODUCTION AFFECTED SOURCE SHEET
CBP Production Information
Source Identification Number1 WH-2
Manufacturer & Model Number VH*, LP12B
Date of Manufacture New
Maximum Design Production Rate2 42 tons/hour
Maximum Annual Production3 106,000 tons/year
Daily Operation 10 hours/day
Annual Operation 250 days/year
2500 hours/year
Approximate Percentage of Operation from: Note: This will vary based on sales
25 Jan - Mar
25 April - June
25 July - Sept
25 Oct - Dec
4. Enter the appropriate Source Identification Number for each concrete batch plant production weigh hopper
or central mixer. Batch plant weigh hopper should be designated WH-1, WH-2, etc. Batch plant central mixer should be designated CM-1, CM-2, etc.
5. Enter the manufacturer’s Maximum Design Production Rate of the concrete batch plant production
equipment. Specify units in tons/hour.
6. Enter the Maximum Annual Production of the concrete batch plant. Specify units of cubic yards per year or tons per year. To calculate Maximum Annual Production, multiply the Maximum Design Production Rate (tons/hr) by the Annual Operation (hrs/yr).
*VH = Vince Hagan

Attachment H: Air Pollution Control Devise Sheets
AIR POLLUTION CONTROL DEVICE AFFECTED SOURCE SHEET
CBP Air Pollution Control Device Data Sheet Fabric Filter Baghouse Filter Vent Fabric Filter
Discharge Sock
General Information
APCD Identification Number1 APCD-1 APCD-2
Manufacturer & Model Number Vince Hagan VH-700JP
Vince Hagan VH245JP
Number of Compartments 1
Gas Inlet Area (ft2) 1.07 5.05
Gas Outlet Area (ft2) 2.35 0.226
Fabric Filter Cleaning Mechanism2 Pulsr Jet Pulse Jet
Total Cloth (fabric) Area (ft2) 700 245
Draft Fan HP 7.5
Outlet Stack Area (ft2) No stack
Operational Parameters
Minimum Design PD (in H2O) 2 Maximum Design PD (in H2O) 6 Inlet Gas Flow Rate (ACFM) 4200 600 Inlet Gas Temperature (oF) 70 70 Inlet Gas Pressure (PSIA) 0.19 Inlet Gas Velocity (ft/sec) 65.4 2 PM Inlet Rate (grains/scf) PM Outlet Rate (grains/scf) <0.005 Operating Air/Cloth Ratio (ft/min) 6 2.45
1. Enter the appropriate Air Pollution Control Device Identification Number for each fabric filter baghouse, filter vent or discharge sock. The devices should be designated APCD-1, APCD-2, APCD-3, etc. 2. Enter method used to clean bags: shaker, pulse jet, reverse jet or other. 3. Complete more than one CBP Air Pollution Control Device Data Sheet if necessary. 4. Enter the fractional efficiency of the fabric filter baghouse.

CBP PARTICULATE MATTER CAPTURE SYSTEM AFFECTED SOURCE SHEET
Pursuant to Section 2.2.4 of General Permit G50-B, the registrant shall not cause, suffer, allow, or permit any registered concrete batch plant to operate that is not equipped with an effective particulate matter capture system(s) and associated air pollution control device(s) to minimize the emission of particulate matter from production equipment, storage structures and silos. The particulate matter capture system shall ensure the lowest fugitive particulate emissions reasonably achievable. A particulate matter capture system shall be used to confine, collect, and transport displaced particulate matter from production weigh hoppers, cement and flyash storage structures and/or silos to an air pollution control device. Particulate matter capture systems may include but not be limited to: hoods, bins, ductwork, enclosures and air pollution control devices such as fabric filter baghouses, associated fans, discharge socks and filter vents. Provide a written description of the concrete batch plant’s particulate matter capture system below:
WH-2 (Cement/Additive Weigh Hopper/Batcher) Capture System A flexible dust shroud will be used to capture particulate from the weigh hopper. Captured Emissions will be routed through flexible and hard ducting to the baghouse (APCD-1). This system will also capture emissions from sand/aggregate loading to concrete trucks. BS-1 (Cement/Additive Silo) Capture System The silo vent dust collector will be direct mounted to the top of the cement/additive storage silo And does not have an associated capture system.

CBP MATERIAL STORAGE & HANDLING AFFECTED SOURCE SHEET
Source Identification Number1 SF-1 SF-2 SF-3 E3-1 E3-2 BS-1
Material Stored2 Sand/Flyash Aggregate Aggregate Sand and Aggregate
Sand and Aggregate
Cement and Additive
Maximum Yearly Throughput (tons/year)3 268,000 175,000 175,000 618,000 618,000 106,000
Typical Moisture Content (%)4 3% 5% 5% 3 to 5% 3 to 5% Nil
Average % of Material Passing Through 200 Mesh Sieve5 5 – 10% -- -- 2 – 5 % 2 – 5% 100
Maximum Stockpile Base Area (ft2)6 160 160 160 NA NA NA
Maximum Stockpile Height (ft)7 20 20 20 NA NA NA
Maximum Storage Capacity (tons)8 76 81 81 34 121 235
Dust Control Method Applied to Storage9 HR-WS HR-WS HR-WS OT – partial
enclosure OT – partial enclosure FE
Method of Material Load-in to Bin or Stockpile10 TD TD TD FE MC OT -pneumatic
Dust Control Method Applied During Load-in11 MD MD MD MD MD OT-
FE+baghouse
Method of Material Load-out from Bin or Stockpile10 FE FE FE MC SS OT –direct
coupled
Dust Control Method Applied During Load-out11 HR-WS HR-WS HR-WS MD/PE OT- shroud/
baghouse OT – shroud/ baghouse
1. Enter the appropriate Source Identification Number for each storage activity using the following codes. For example, if the facility utilizes four open stockpiles and one storage silo, the Source Identification Numbers should be OS-1, OS-2, OS-3, and OS-4; and BS-1, respectively. OS Open Stockpile E3 Enclosure (three-sided enclosure) BS Bin or Storage Silo (full enclosure) SB Storage Building (full enclosure) SF Stockpiles with wind fences OT Other (please specify) 2. Describe the type of material stored or stockpiled. 3. Enter the maximum yearly storage throughput for each storage activity. 4. Enter the average percent moisture content of the stored material. 5. Enter the average percent of material that will pass through a 200 mesh sieve. 6. For stockpiles, enter the maximum stockpile base area. 7. For stockpiles, enter the maximum stockpile height. 8. Enter the maximum storage capacity for each storage activity in tons (e.g. silo capacity, maximum stockpile size, etc.). 9. Enter the dust control method applied to storage activity using the following codes: CA Crusting Agent WS Water Spray FE Full Enclosure NO None OT Other ___________________________ (please specify) 10. Enter the method of load-in or load-out to/from stockpiles or bins using the following codes: FE Front Endloader SS Stationary Conveyor/Stacker ST Stacking Tube MC Mobile Conveyor/Stacker CS Clamshell TD Truck Dump OT Other ___________________________ (please specify) 11. Enter the dust control method applied during load-in or load-out using the following codes: CA Crusting Agent WS Water Spray FE Full Enclosure MD Minimize Drop Height ST Stacking Tube NO None OT Other ___________________________ (please specify)

CBP FUGITIVE DUST CONTROL SYSTEM AFFECTED SOURCE SHEET
Fugitive Dust Control
System Data
Fugitive Dust Control Method 1 WT (HS-WS) Design Water Flow Rate (gpm) 2 400 to 1000 Chemical Additive 3 None Water/Additive Mix Ratio 4 NA Amount (gal/yd) 5 Unknown Frequency of Application 6 Initial 3 times per day Haulroad Surface 7 Paved Work/Storage Area Surface 7 Paved Haulroad Length 8 Approx.. 400 feet (0.076 mile) Number of Vehicles per day 9 250 Number of Wheels per Vehicle 10 10 (most), 16 (cement trucks) Weight of Vehicle (tons) 11 38
1.Enter the fugitive dust control method(s) using the following codes: WT Water Truck WS Fixed Water Sprays UW Underbody Truck Wash RS Rumble Strips OT Other ___________________________ (please specify) 2. Enter the design water flow rate for the water truck or fixed water sprays in gallons per minute. 3. Enter manufacturer and type, specification or grade of chemical additive. 4. Enter the water/chemical additive mix ratio. 5. Enter the amount of water or water/chemical additive mix to be applied to haulroads, storage and work areas in gallons per square yard. 6. Enter the frequency of application of water/chemical additive mix to haulroads, storage and work areas during periods of dry weather. 7. Enter the type of haulroad, work and storage area surface (asphalt pavement, concrete, dirt, coarse gravel, reddog, etc.). 8. Enter the approximate length of haulroad(s) in miles or feet. List appropriate units. 9. Enter the maximum daily vehicle traffic (trucks per day). 10. Enter the maximum number of wheels per vehicle. 11. Enter the mean vehicle weight in tons. 12. Complete a separate HMA Plant Fugitive Dust Control System Data sheet for each fugitive dust control system. Provide a written description of the concrete batch plant’s particulate matter capture system below:
Please refer to the”CBP PARTICULATE MATTER CAPTURE SYSTEM” form.

Attachment I: Emissions Calculations

Attachment J: Class I Legal Advertisement
AIR QUALITY PERMIT NOTICE
Notice of Application
Notice is given that Tri-State Paving & Sealcoating, LLC has applied to the West Virginia Department of Environmental Protection, Division of Air Quality, for a General Permit for a Concrete Batch Plant located on 962 Winfield Rd, Winfield in Putnam County, West Virginia. The latitude and longitude coordinates are: 38.44796 N and 81.83978 W.
The applicant estimates the potential to discharge the following Regulated Air Pollutants will be:
• Particulate Matter: 24.8 tons per year • Fine Particulate Matter (PM-10): 9.4 tons per year
Startup of operation is planned to begin on or about the 1st day of May, 2015. Written comments will be received by the West Virginia Department of Environmental Protection, Division of Air Quality, 601 57th Street, SE, Charleston, WV 25304, for at least 30 calendar days from the date of publication of this notice.
Any questions regarding this permit application should be directed to the DAQ at (304) 926-0499, extension 1227, during normal business hours.
Dated this the 17th day of March, 2015.
By: Tri-State paving & Sealcoating, LLC Un Kyung (U.K.) Corns Member of LLC P.O. Box 9449 Huntington, WV 25704

Attachment L: General Permit Registration Application Fee
General Permit G50-B Class II Concrete Batch Plant processing fee is $500.00 and 45 day processing time for facilities not subject to a New Source Performance Standard (NSPS). This facility does not include crushing, grinding, or screening operations and is not subject to the NSPS.
A check for the fee is included with this application submittal.

Attachment N: Material Safety Data Sheets (MSDS)

Attachment O: Emissions Summary Sheets

G50-B Emission Calculation SpreadsheetsFor purposes of the General Permit for concrete batch plants, the following emissioncalculation methods will provide an adequate estimate of facility emissions from point sources and fugitiveemission sources. However, where source (facility) specific tests are available, such information is preferable. Other emission factors may be acceptable provided documentation as to accuracy and appropriateness are provided by the applicant.
Completely fill out the following pages with all requested facility specific information.
Tri-State Paving & Sealcoating, LLC
MoZack Ready Mix
Please print out all pages of the completed spreadsheet and submit with Registration Application.
Revised 06/11/2007
Tri-State Paving Sealcoating, LLC

General Permit G50-B Emission Calculation Spreadsheet G50ECALC for Concrete Batch PlantsBATCH DROP/CONTINUOUS DROP OPERATIONS
TRANSFER RATE TYPE OF CONTROL PM PM-10 PM PM-10TRANSFER POINT TPH TPY CONTROL EFFICIENCY lb/hour lb/hour TPY TPYAGGREGATE TRANSFER EMISSIONSe= 0.0069 lb/ton (PM emission factor) e= 0.0033 lb/ton (PM-10 emission factor)
Dump truck to stockpile 140 350000 SL-WG 50 0.4830 0.2310 0.6038 0.2888loader to stockpile 0 0 0.0000 0.0000 0.0000 0.0000loader to feed hopper 140 350000 TC-MD-1 0.9660 0.4620 1.2075 0.5775hopper to conveyor 140 350000 TC-MD/PE-2 50 0.4830 0.2310 0.6038 0.2888conveyor to bin 140 350000 TC-MD-3 0.9660 0.4620 1.2075 0.5775bin to scale hopper 140 350000 TC-MD/PE-4&5 50 0.4830 0.2310 0.6038 0.2888conveyor to mixer truck 140 350000 TC-PE-BH 90 0.0966 0.0462 0.1208 0.0578
TOTAL AGGREGATE TRANSFER EMISSIONS 3.4776 1.6632 4.3470 2.0790
SAND TRANSFER EMISSIONSe= 0.0021 lb/ton (PM emission factor) e= 0.0010 lb/ton (PM-10 emission factor)
Dump truck to stockpile 107 268000 SL-WG 50 0.3692 0.1766 0.4623 0.2211loader to stockpile 0 0 0.0000 0.0000 0.0000 0.0000loader to feed hopper 107 268000 TC-MD-1 0.7383 0.3531 0.9246 0.4422hopper to conveyor 107 268000 TC-MD/PE-2 50 0.3692 0.1766 0.4623 0.2211conveyor to bin 107 268000 TC-MD-3 0.7383 0.3531 0.9246 0.4422bin to scale hopper 107 268000 TC-MD/PE-4&5 50 0.3692 0.1766 0.4623 0.2211conveyor to mixer truck 107 268000 TC-PE-BH 90 0.0738 0.0353 0.0925 0.0442
TOTAL SAND TRANSFER EMISSIONS 2.6579 1.2712 3.3286 1.5919
Tri-State Paving Sealcoating, LLC

BATCH DROP/CONTINUOUS DROP OPERATIONSTRANSFER RATE TYPE OF CONTROL PM PM-10 PM PM-10
TRANSFER POINT TPH TPY CONTROL EFFICIENCY lb/hour lb/hour TPY TPYCEMENT UNLOADING TO ELEVATED STORAGE SILO (PNEUMATIC)e= 0.7200 lb/ton (PM emission factor) e= 0.4600 lb/ton (PM-10 emission factor)
truck to cement silo 37 92000 UL-BH 99 0.2664 0.1702 0.3312 0.2116
CEMENT SUPPLEMENT UNLOADING TO ELEVATED STORAGE SILO (PNEUMATIC)e= 3.1400 lb/ton (PM emission factor) e= 1.1000 lb/ton (PM-10 emission factor)
truck to cement silo 5 14000 UL-BH 99 0.0360 0.0230 0.0504 0.0322
WEIGH HOPPER LOADINGe= 0.0051 lb/ton (PM emission factor) e= 0.0024 lb/ton (PM-10 emission factor)
silo to cement weigh bin 42 106000 FE 100 0.0000 0.0000 0.0000 0.0000
TRUCK LOADING (TRUCK MIX)e= 0.9950 lb/ton (PM emission factor) e= 0.2780 lb/ton (PM-10 emission factor)
cement weigh bin to truck 42 106000 TC-PE-BH 90 3.0240 1.9320 3.8160 2.4380
TOTAL CEMENT TRANSFER EMISSIONS 3.3264 2.1252 4.1976 2.6818
TOTAL TRANSFER EMISSIONS 9.4619 5.0596 11.8732 6.3527
Tri-State Paving Sealcoating, LLC

UNPAVED HAULROADS - Aggregate Truck Sand & gravelPM EMISSIONS PM-10 EMISSIONSk 4.9 particle size multiplier (assumed) k 1.5 particle size multiplier (assumed)s 10 silt in road surface (%) s 10 silt in road surface (%)a 0.7 equation constant a 0.9 equation constantb 0.45 equation constant b 0.45 equation constantS mean vehicle speed (mph) S mean vehicle speed (mph)W mean vehicle weight (tons) W mean vehicle weight (tons)w mean number of wheels w mean number of wheelsp 150 days of precipitation (assumed) p 150 days of precipitation (assumed)e 0.0000 LB/VMT e 0.0000 LB/VMTTRAVEL VMT/HOUR TRAVEL VMT/HOURTRAVEL VMT/YR TRAVEL VMT/YRCONTROLS control efficiency (%) CONTROLS control efficiency (%)
EMISSIONS 0.0000 lb/hour EMISSIONS 0.0000 lb/hourEMISSIONS 0.0000 TPY EMISSIONS 0.0000 TPY
PAVED HAULROADS - Aggregate Trucks Sand & gravelPM EMISSIONS PM-10 EMISSIONSk 0.082 base emission factor for particle k 0.016 particle size multiplier (assumed)sL 12 road surface silt load. (g/m^2) s 5.5 silt in road surface (%)W 50 mean vehicle weight (tons) W 50 mean vehicle weight (tons)P 151 # of wet days with at least 0.01" precip P 151 # of wet days with at least 0.01" precipC 0.00047 emission factor for brake/tire wear C 0.00047 emission factor for brake/tire wearN 365 # of days in averaging period N 365 # of days in averaging periode 17.8803 LB/VMT e 2.1007 LB/VMTTRAVEL 1 VMT/HOUR TRAVEL 1 VMT/HOURTRAVEL 1,900 VMT/YR TRAVEL 1,900 VMT/YRCONTROLS 70 control efficiency (%) CONTROLS 70 control efficiency (%)
EMISSIONS 5.3641 lb/hour EMISSIONS 0.4727 lb/hourEMISSIONS 5.0959 TPY EMISSIONS 0.5987 TPY
Tri-State Paving Sealcoating, LLC

UNPAVED HAULROADS - Cement TankerPM EMISSIONS PM-10 EMISSIONSk 4.9 particle size multiplier (assumed) k 1.5 particle size multiplier (assumed)s 10 silt in road surface (%) s 10 silt in road surface (%)a 0.7 equation constant a 0.9 equation constantb 0.45 equation constant b 0.45 equation constantS mean vehicle speed (mph) S mean vehicle speed (mph)W mean vehicle weight (tons) W mean vehicle weight (tons)w mean number of wheels w mean number of wheelsp 150 days of precipitation (assumed) p 150 days of precipitation (assumed)e 0.0000 LB/VMT e 0.0000 LB/VMTTRAVEL VMT/HOUR TRAVEL VMT/HOURTRAVEL VMT/YR TRAVEL VMT/YRCONTROLS control efficiency (%) CONTROLS control efficiency (%)
EMISSIONS 0.0000 lb/hour EMISSIONS 0.0000 lb/hourEMISSIONS 0.0000 TPY EMISSIONS 0.0000 TPY
PAVED HAULROADS - Cement TankerPM EMISSIONS PM-10 EMISSIONSk 0.082 base emission factor for particle k 0.016 particle size multiplier (assumed)sL 12 road surface silt load. (g/m^2) s 5.5 silt in road surface (%)W 50 mean vehicle weight (tons) W 50 mean vehicle weight (tons)P 151 # of wet days with at least 0.01" precip P 151 # of wet days with at least 0.01" precipC 0.00047 emission factor for brake/tire wear C 0.00047 emission factor for brake/tire wearN 365 # of days in averaging period N 365 # of days in averaging periode 17.8803 LB/VMT e 2.1007 LB/VMTTRAVEL 0 VMT/HOUR TRAVEL 0 VMT/HOURTRAVEL 38 VMT/YR TRAVEL 38 VMT/YRCONTROLS 70 control efficiency (%) CONTROLS 70 control efficiency (%)
EMISSIONS 0.0805 lb/hour EMISSIONS 0.0095 lb/hourEMISSIONS 0.1019 TPY EMISSIONS 0.0120 TPY
Tri-State Paving Sealcoating, LLC
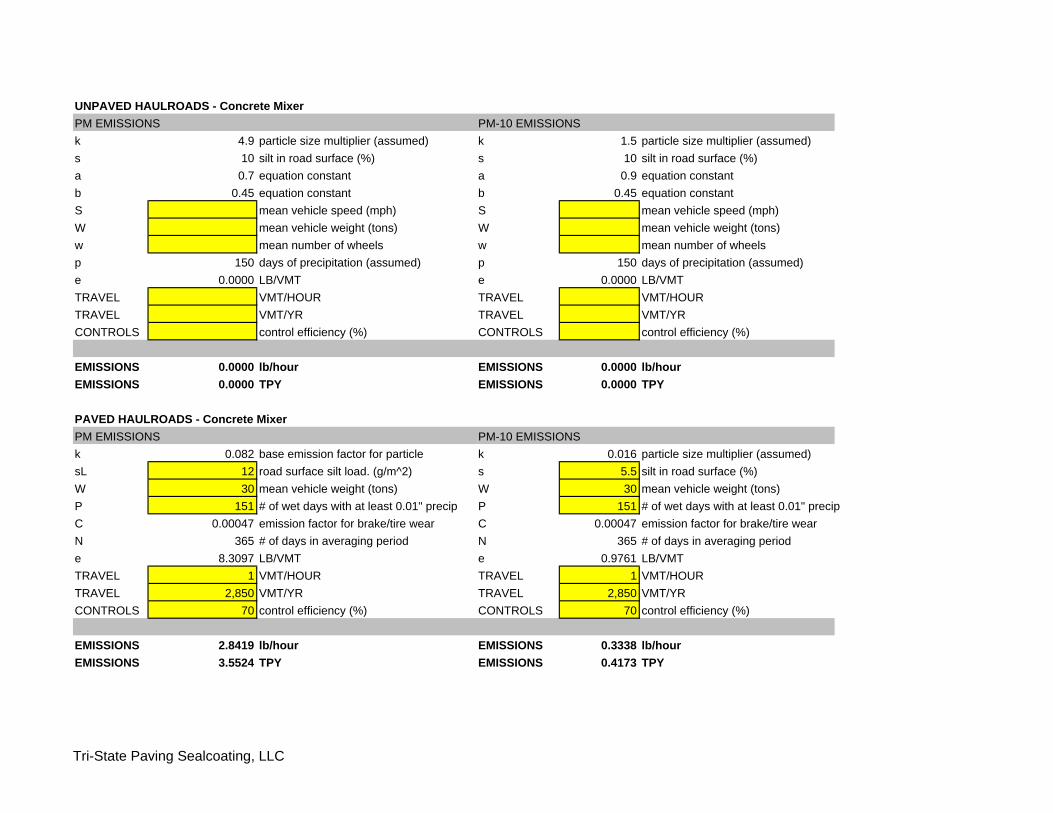
UNPAVED HAULROADS - Concrete MixerPM EMISSIONS PM-10 EMISSIONSk 4.9 particle size multiplier (assumed) k 1.5 particle size multiplier (assumed)s 10 silt in road surface (%) s 10 silt in road surface (%)a 0.7 equation constant a 0.9 equation constantb 0.45 equation constant b 0.45 equation constantS mean vehicle speed (mph) S mean vehicle speed (mph)W mean vehicle weight (tons) W mean vehicle weight (tons)w mean number of wheels w mean number of wheelsp 150 days of precipitation (assumed) p 150 days of precipitation (assumed)e 0.0000 LB/VMT e 0.0000 LB/VMTTRAVEL VMT/HOUR TRAVEL VMT/HOURTRAVEL VMT/YR TRAVEL VMT/YRCONTROLS control efficiency (%) CONTROLS control efficiency (%)
EMISSIONS 0.0000 lb/hour EMISSIONS 0.0000 lb/hourEMISSIONS 0.0000 TPY EMISSIONS 0.0000 TPY
PAVED HAULROADS - Concrete MixerPM EMISSIONS PM-10 EMISSIONSk 0.082 base emission factor for particle k 0.016 particle size multiplier (assumed)sL 12 road surface silt load. (g/m^2) s 5.5 silt in road surface (%)W 30 mean vehicle weight (tons) W 30 mean vehicle weight (tons)P 151 # of wet days with at least 0.01" precip P 151 # of wet days with at least 0.01" precipC 0.00047 emission factor for brake/tire wear C 0.00047 emission factor for brake/tire wearN 365 # of days in averaging period N 365 # of days in averaging periode 8.3097 LB/VMT e 0.9761 LB/VMTTRAVEL 1 VMT/HOUR TRAVEL 1 VMT/HOURTRAVEL 2,850 VMT/YR TRAVEL 2,850 VMT/YRCONTROLS 70 control efficiency (%) CONTROLS 70 control efficiency (%)
EMISSIONS 2.8419 lb/hour EMISSIONS 0.3338 lb/hourEMISSIONS 3.5524 TPY EMISSIONS 0.4173 TPY
Tri-State Paving Sealcoating, LLC

UNPAVED HAULROADS- Endloader
PM EMISSIONS PM-10 EMISSIONSk 4.9 particle size multiplier (assumed) k 1.5 particle size multiplier (assumed)s 10 silt in road surface (%) s 10 silt in road surface (%)a 0.7 equation constant a 0.9 equation constantb 0.45 equation constant b 0.45 equation constantS mean vehicle speed (mph) S mean vehicle speed (mph)W mean vehicle weight (tons) W mean vehicle weight (tons)w mean number of wheels w mean number of wheelsp 150 days of precipitation (assumed) p 150 days of precipitation (assumed)e 0.0000 LB/VMT e 0.0000 LB/VMTTRAVEL VMT/HOUR TRAVEL VMT/HOURTRAVEL VMT/YR TRAVEL VMT/YRCONTROLS control efficiency (%) CONTROLS control efficiency (%)
EMISSIONS 0.0000 lb/hour EMISSIONS 0.0000 lb/hourEMISSIONS 0.0000 TPY EMISSIONS 0.0000 TPY
Note: Endloader operates on paved areas. Loader trips are included with other paved road trips.
Tri-State Paving Sealcoating, LLC
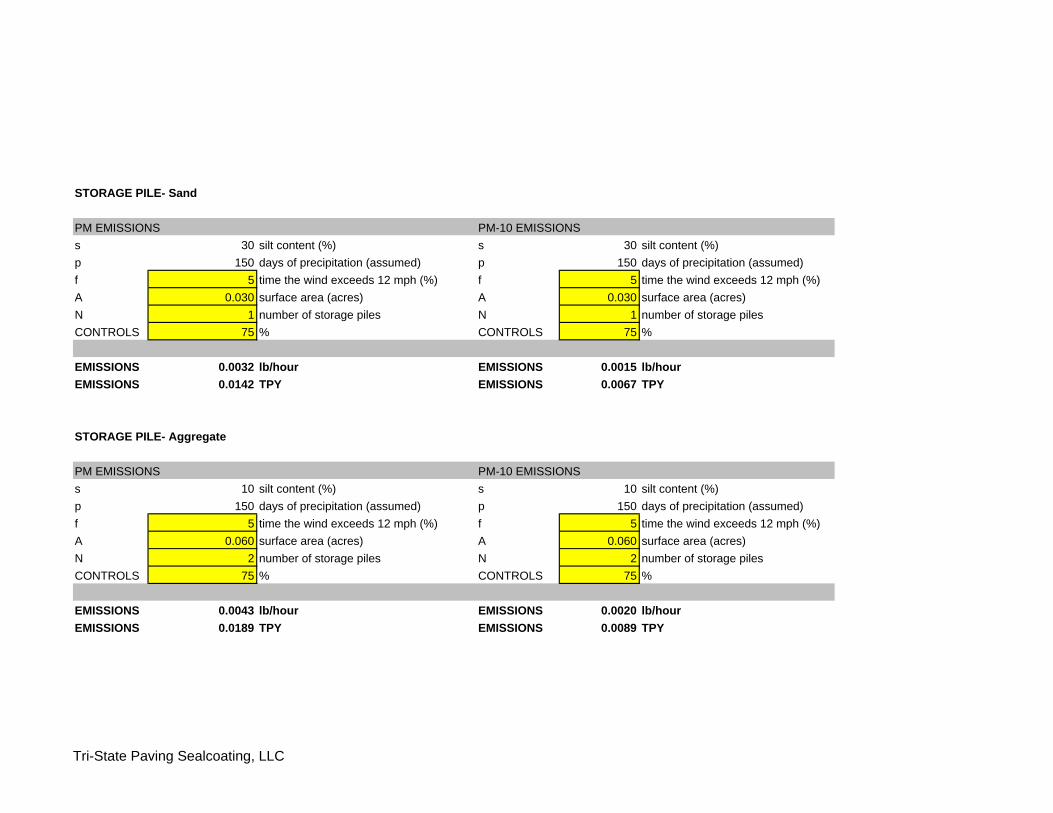
STORAGE PILE- Sand
PM EMISSIONS PM-10 EMISSIONSs 30 silt content (%) s 30 silt content (%)p 150 days of precipitation (assumed) p 150 days of precipitation (assumed)f 5 time the wind exceeds 12 mph (%) f 5 time the wind exceeds 12 mph (%)A 0.030 surface area (acres) A 0.030 surface area (acres)N 1 number of storage piles N 1 number of storage pilesCONTROLS 75 % CONTROLS 75 %
EMISSIONS 0.0032 lb/hour EMISSIONS 0.0015 lb/hourEMISSIONS 0.0142 TPY EMISSIONS 0.0067 TPY
STORAGE PILE- Aggregate
PM EMISSIONS PM-10 EMISSIONSs 10 silt content (%) s 10 silt content (%)p 150 days of precipitation (assumed) p 150 days of precipitation (assumed)f 5 time the wind exceeds 12 mph (%) f 5 time the wind exceeds 12 mph (%)A 0.060 surface area (acres) A 0.060 surface area (acres)N 2 number of storage piles N 2 number of storage pilesCONTROLS 75 % CONTROLS 75 %
EMISSIONS 0.0043 lb/hour EMISSIONS 0.0020 lb/hourEMISSIONS 0.0189 TPY EMISSIONS 0.0089 TPY
Tri-State Paving Sealcoating, LLC
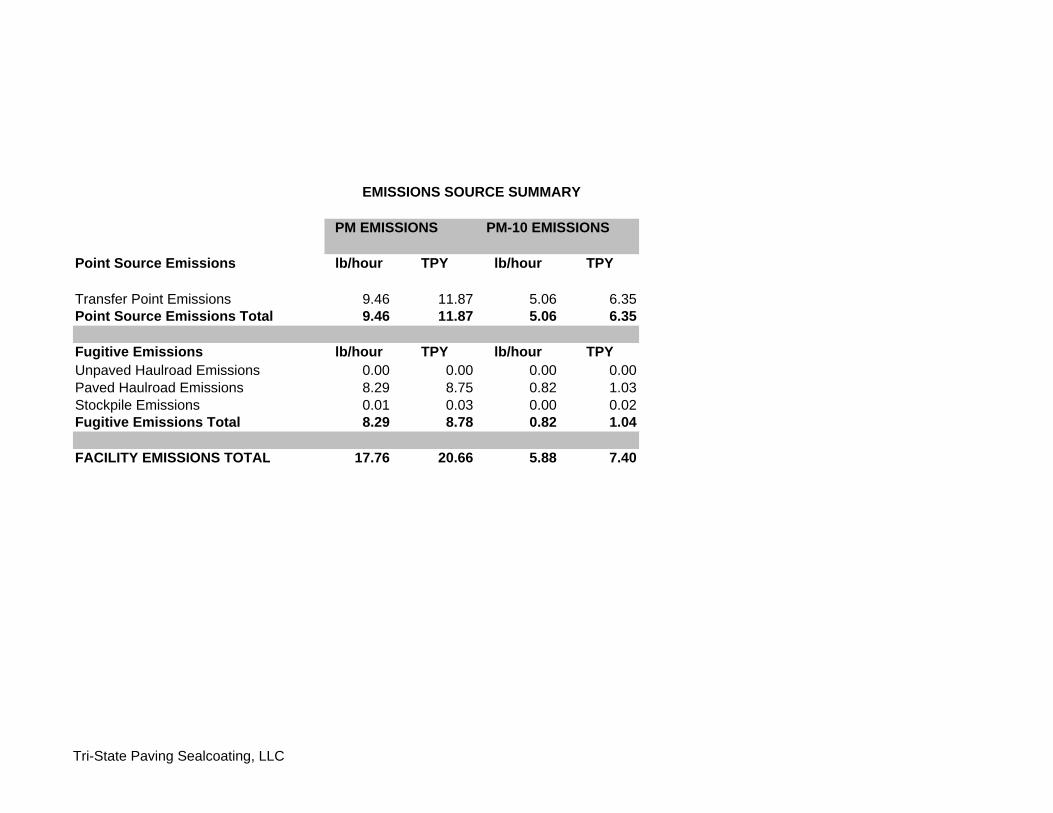
EMISSIONS SOURCE SUMMARY
PM EMISSIONS PM-10 EMISSIONS
Point Source Emissions lb/hour TPY lb/hour TPY
Transfer Point Emissions 9.46 11.87 5.06 6.35Point Source Emissions Total 9.46 11.87 5.06 6.35
Fugitive Emissions lb/hour TPY lb/hour TPYUnpaved Haulroad Emissions 0.00 0.00 0.00 0.00Paved Haulroad Emissions 8.29 8.75 0.82 1.03Stockpile Emissions 0.01 0.03 0.00 0.02Fugitive Emissions Total 8.29 8.78 0.82 1.04
FACILITY EMISSIONS TOTAL 17.76 20.66 5.88 7.40
Tri-State Paving Sealcoating, LLC