Embed Size (px)
Citation preview
National Center for Postsecondary Improvement Page 1
P A T R I C I A J . G U M P O R T
M A R I A I A N N O Z Z I
S U S A N S H A M A N
R O B E R T Z E M S K Y
National Center for Postsecondary Improvement508 CERAS
School of EducationStanford University, Stanford, CA 94305-3084
©1997 National Center for Postsecondary Improvement
The work reported herein was supported in part by the Educational Research and Development Center program, agreement
number R309A60001, CFDA 84.309A, as administered by the Office of Educational Research and Improvement (OERI), U.S.
Department of Education. The findings and opinions expressed in the report do not reflect the position or policies of OERI or the
U.S. Department of Education. Publication Number NCPI-1-04.
Trends in United StatesHigher Educationfrom Massification
to Post Massification
National Center for Postsecondary Improvement Page 2
The rapid expansion of American higher education in the years following World War II is anoften-told and well-documented story. In this report on the changing condition of highereducation in the United States, we will be covering some familiar ground, as well as drawingon the framework established by Professor Arimoto in launching this seminar and extended byProfessor Zemsky in his keynote. What makes this report different—and indeed what givesthis seminar its importance—is Professor Arimoto’s proposition that national systems ofhigher education have evolved similarly, moving from massification to maturation and, now,to post-massification. We have organized our report on the evolution of the U.S. system ac-cording to this organizing framework.
The Era of Massification
Prior to World War II, only a small minority of the U.S. population—most of whom were maleand white—continued their education after high school. The initial expansion of Americanhigher education came immediately following World War II, and again after the Korean War,when returning soldiers were offered financial assistance from the federal government underthe GI Bill of Rights. Designed to ameliorate the labor market crunch that would otherwisehave been created by the large number of returning soldiers, the GI Bill extended access tohigher education to veterans and their families. The 1950s also saw an expansion of the middleclass, increasing family wealth, and the rapid development of suburban areas. For these fami-lies, a college education became a ticket to social and economic mobility, and the children ofthe middle class began enrolling in higher education in increasing numbers.
Building on the advances made in the 1950s, American higher education showed a period ofunprecedented growth—often characterized by the term “massification”—during the decadeof the 1960s and through the mid-1970s. Upward social and economic mobility and overallnational economic growth continued, causing a general increase in demand for higher educa-tion. Social and political changes, such as the civil rights and women’s rights movements andexpanded federal financial aid, opened access to higher education for underrepresented popu-lations—women, minorities, part-time and intermittent learners, and students well past thetraditional ages of college attendance. Expansion in enrollment also led to a sharp increase inthe number of institutions, as well as a fundamentally different mix of institutions, as thediverse needs of students became reflected in the programmatic and institutional structures ofthe system. Finally, the infusion of federal dollars to fund academic research (especially in thesciences and medicine) fostered an increase in the production of Ph.D.s, as well as a prolifera-tion of the numbers and types of professional personnel who staffed on-campus researchinstitutes and increasingly complex administrative services.
Let us now examine the trends in several dimensions of American higher education’s expan-sion that together make up the evidence of massification: changes in enrollment, changingstudent demographics, and institutional shifts.
Increasing Demand and Expanding Enrollment
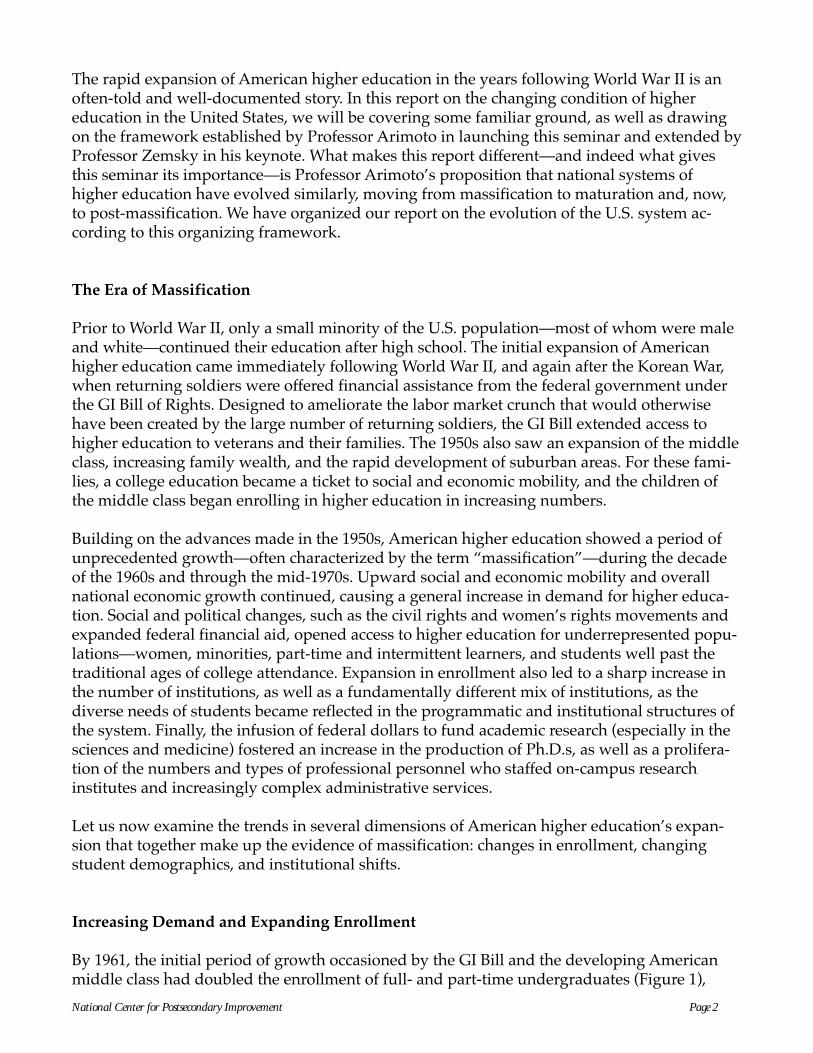
By 1961, the initial period of growth occasioned by the GI Bill and the developing Americanmiddle class had doubled the enrollment of full- and part-time undergraduates (Figure 1),
National Center for Postsecondary Improvement Page 3
although the actual number of higher education institutions had not yet increased dramati-cally. Instead, institutions began expanding their capacity and programs to meet the increasedenrollment demand. During the 1960s, enrollment doubled once again, and, by the mid-1970s,the college population had increased to five times its size in 1951. It is interesting to note thatbetween 1964 and 1965—and, again, between 1973 and 1974—there was a sharp gain in collegeenrollments, indicating that young Americans matriculated as an alternative to economicemployment or military service in the Vietnam War.
Figure 1Enrollment in Higher Education: 1950 to 1991
Tota
l E
nrol
lmen
t
0
3,000,000
6,000,000
9,000,000
12,000,000
15,000,000
19
50
19
54
19
58
19
62
19
66
19
70
19
74
19
78
19
82
19
86
19
90
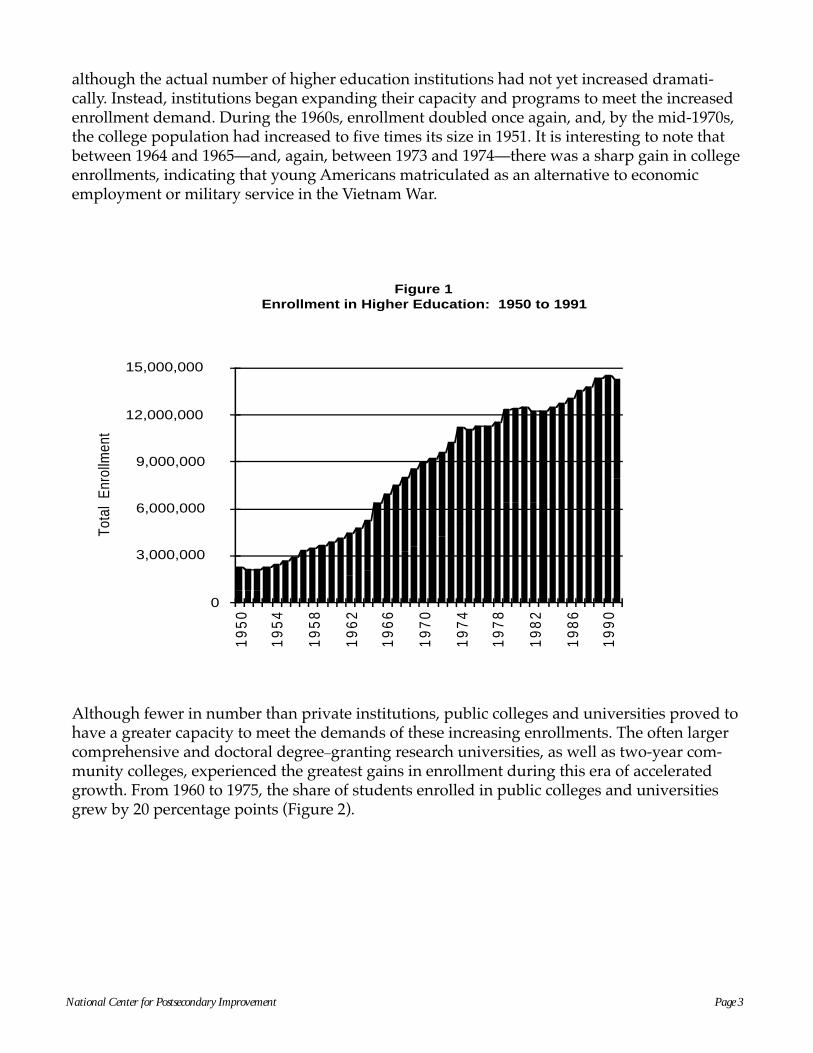
Although fewer in number than private institutions, public colleges and universities proved tohave a greater capacity to meet the demands of these increasing enrollments. The often largercomprehensive and doctoral degree–granting research universities, as well as two-year com-munity colleges, experienced the greatest gains in enrollment during this era of acceleratedgrowth. From 1960 to 1975, the share of students enrolled in public colleges and universitiesgrew by 20 percentage points (Figure 2).
National Center for Postsecondary Improvement Page 4
Figure 2
Enrollment in Higher Education by Institutional Control: 1950 to 1993
0%
20%
40%
60%
80%
100%
1950
1954
1958
1962
1966
1970
1974
1978
1982
1986
1990
Public Institutions Private Institutions
The New American Student
In the early days of the 1960s, the American postsecondary student was still most often white,male, and between the ages of 18 and 22. Over the course of the 1960s, however, the demo-graphics of American higher education’s students would begin to change. Much of the in-crease in college enrollment and the diversity of higher education’s students was fostered byhistoric changes in institutional and federal policies. Colleges and universities began expand-ing their own financial aid programs, and formerly “exclusive” institutions began openingtheir doors to a wider range of student populations. For example, beginning in the 1960s andextending into the mid-1970s, many formerly all-male schools began to admit female students.
Perhaps the most significant change that fostered increasingly diverse student enrollment wasthe expansion of federal student financial aid programs throughout the 1960s and early 1970s.The federal government expanded access to higher education by offering direct grants to low-income students based on economic need; it also began dispensing grant funds directly tocolleges and universities for redistribution to targeted populations of students in the form offinancial aid. For example, a federal college work-study program enabled students to gainemployment on their campuses; their wages were paid primarily by federal funds, althoughinstitutions did provide a small percentage of matching dollars. Finally, a low-interest loanprogram subsidized by the federal government made borrowing to finance higher education

National Center for Postsecondary Improvement Page 5
an option attractive to many students—particularly since the “return” on a college educationpromised wages that far outweighed any debt incurred. The annual salaries of male collegegraduates rose steadily after 1950 and reached a peak at $45,000 in 1970—after which theybegan to decline.
Supported by the growing women’s rights movement and by changing notions of the role ofwomen in society, female students began enrolling in higher education at an increasing rateduring this period. An examination of enrollment by gender reveals that women began enter-ing higher education at an accelerated rate beginning in the mid-1960s (Figure 3). By the closeof the era of massification in the mid-1970s, the participation of female students in highereducation equaled that of males.
Figure 3Enrollment in Higher Education by Gender:
1950 to 1991
Tota
l En
rollm
ent
0
3,000,000
6,000,000
9,000,000
12,000,000
15,000,000
19
50
19
54
19
58
19
62
19
66
19
70
19
74
19
78
19
82
19
86
19
90
Women Men
The civil rights movement of the late 1960s marked a period in which racial and ethnic minori-ties—particularly African- and Hispanic-Americans—pressed for and gained access to institu-tions from which they were formerly excluded, either by law or by practice. The percentage ofAfrican-Americans aged 18 to 24 attending college more than doubled, going from under 10percent to 20 percent between 1964 and 1972 (Figure 4). As the era of massification came to aclose in 1976, just over 20 percent of the African-American population was enrolled in highereducation. The participation of 18- to 24-year-old Hispanic-Americans also increased signifi-cantly. By 1975, almost 20 percent of this population was enrolled in higher education.

National Center for Postsecondary Improvement Page 6
0%
10%
20%
30%
40%
19
64
19
68
19
72
19
76
19
80
19
84
19
88
19
92
White Hispanic-American
African- American
Figure 4Enrollment of 18-to-24 Year Olds in Higher Education by
Ethnic Group
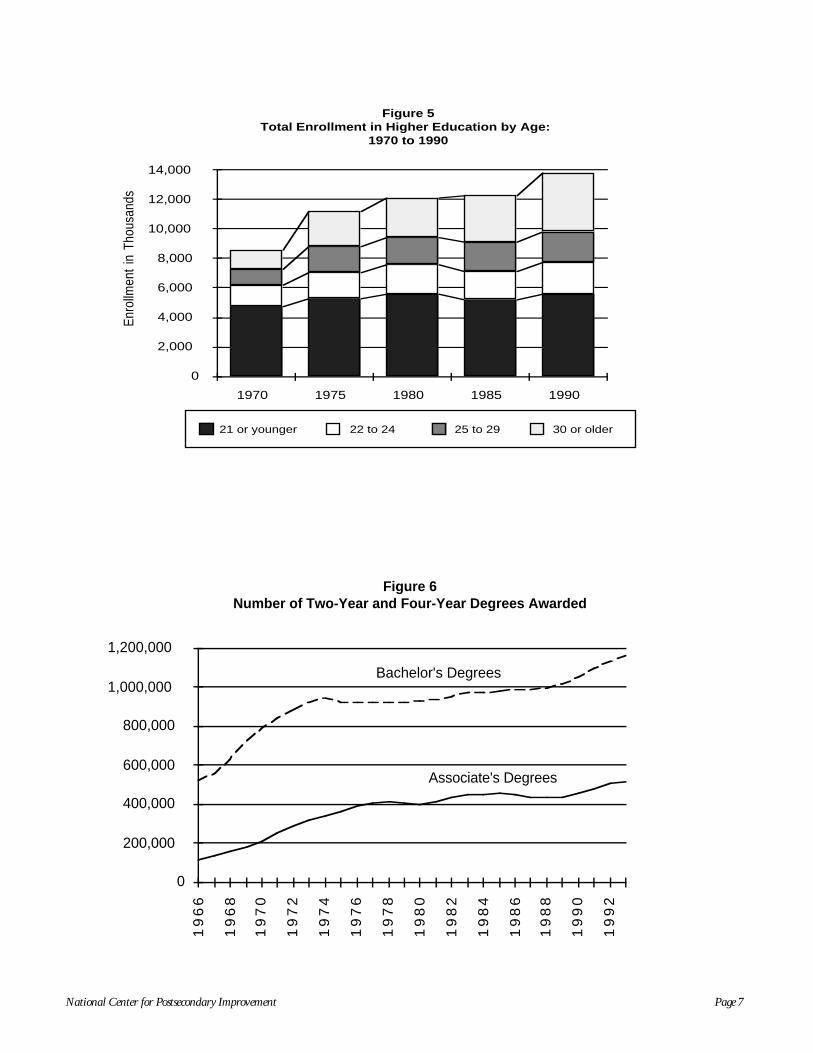
Older students also began enrolling in increasing numbers, although, until 1975, the majorityof the college-going population was still of traditional age (Figure 5). Between 1970 and 1975,these older matriculants began to make gains, as the number of students aged 22 or olderincreased by more than 50 percent, while the number of traditional-age students remainedrelatively constant.
Corresponding to these enrollment shifts was an increase in the production of both associate’sand bachelor’s degrees. As noted in Figure 6, between 1966 and 1976, the number of associate’sdegrees awarded more than tripled, from 111,607 to 391,454. During the same time period, thenumber of bachelor’s degrees conferred almost doubled, from 520,115 in 1966 to 925,746 in1976.
National Center for Postsecondary Improvement Page 7
Figure 5Total Enrollment in Higher Education by Age:
1970 to 1990En
rollm
ent
in T
hous
ands
0
2,000
4,000
6,000
8,000
10,000
12,000
14,000
1970 1975 1980 1985 1990
21 or younger 22 to 24 25 to 29 30 or older
Figure 6Number of Two-Year and Four-Year Degrees Awarded
0
200,000
400,000
600,000
800,000
1,000,000
1,200,000
19
66
19
68
19
70
19
72
19
74
19
76
19
78
19
80
19
82
19
84
19
86
19
88
19
90
19
92
Bachelor's Degrees
Associate's Degrees
National Center for Postsecondary Improvement Page 8
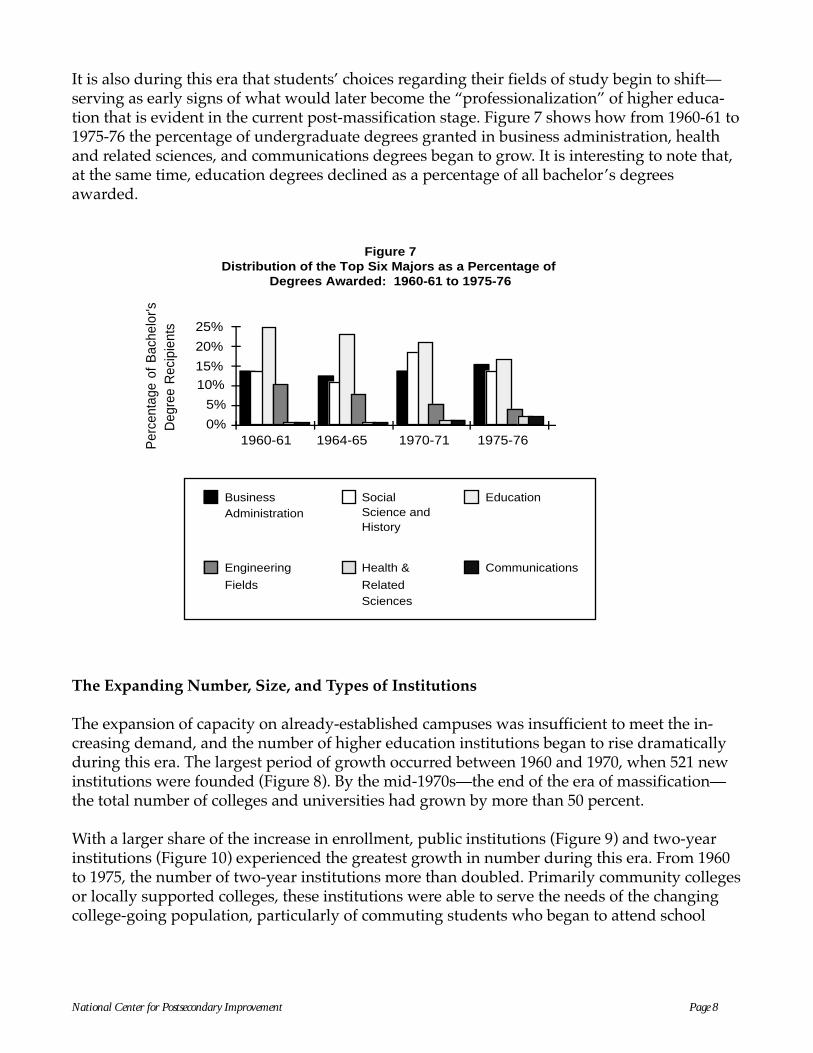
It is also during this era that students’ choices regarding their fields of study begin to shift—serving as early signs of what would later become the “professionalization” of higher educa-tion that is evident in the current post-massification stage. Figure 7 shows how from 1960-61 to1975-76 the percentage of undergraduate degrees granted in business administration, healthand related sciences, and communications degrees began to grow. It is interesting to note that,at the same time, education degrees declined as a percentage of all bachelor’s degreesawarded.
Per
cent
age
of B
ache
lor's
Deg
ree
Rec
ipie
nts
0%
5%
10%15%
20%
25%
1960-61 1964-65 1970-71 1975-76
BusinessAdministration
Social Science and History
Education
Engineering
Fields
Health &
RelatedSciences
Communications
Figure 7Distribution of the Top Six Majors as a Percentage of
Degrees Awarded: 1960-61 to 1975-76
The Expanding Number, Size, and Types of Institutions
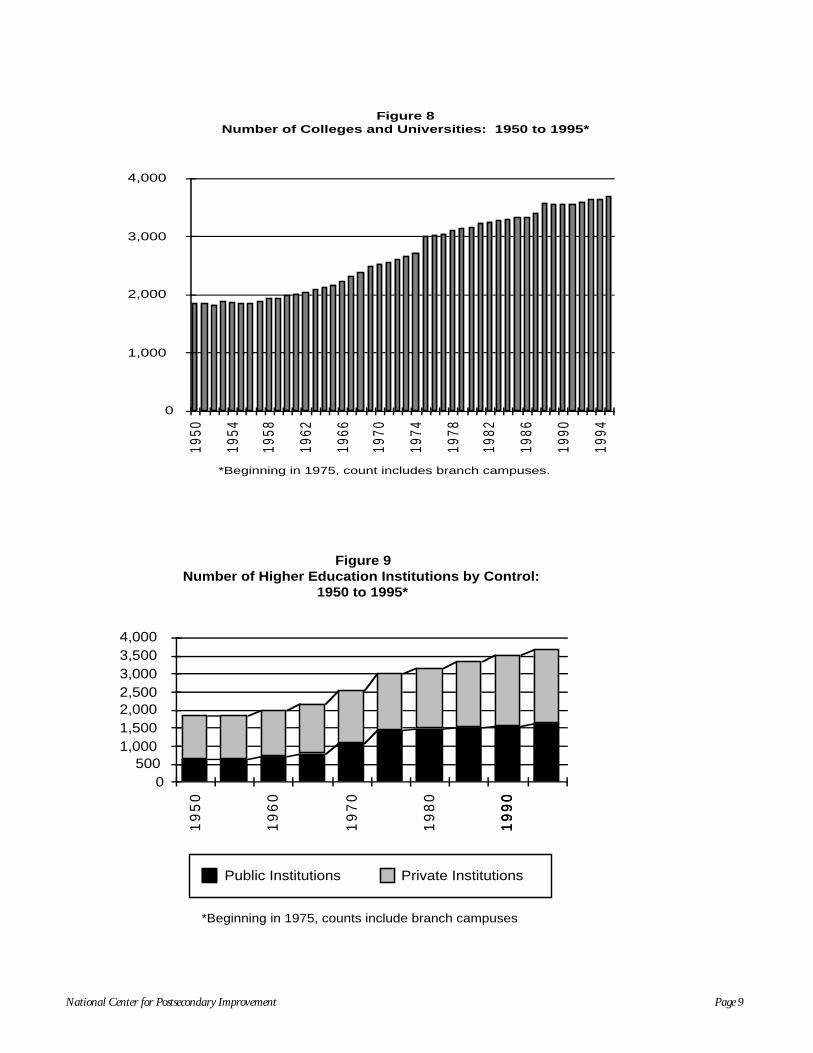
The expansion of capacity on already-established campuses was insufficient to meet the in-creasing demand, and the number of higher education institutions began to rise dramaticallyduring this era. The largest period of growth occurred between 1960 and 1970, when 521 newinstitutions were founded (Figure 8). By the mid-1970s—the end of the era of massification—the total number of colleges and universities had grown by more than 50 percent.
With a larger share of the increase in enrollment, public institutions (Figure 9) and two-yearinstitutions (Figure 10) experienced the greatest growth in number during this era. From 1960to 1975, the number of two-year institutions more than doubled. Primarily community collegesor locally supported colleges, these institutions were able to serve the needs of the changingcollege-going population, particularly of commuting students who began to attend school
National Center for Postsecondary Improvement Page 9
Figure 8Number of Colleges and Universities: 1950 to 1995*
*Beginning in 1975, count includes branch campuses.
0
1,000
2,000
3,000
4,000
1950
1954
1958
1962
1966
1970
1974
1978
1982
1986
1990
1994
Figure 9Number of Higher Education Institutions by Control:
1950 to 1995*
0500
1,0001,5002,0002,5003,0003,5004,000
19
50
19
60
19
70
19
80
19
90
Public Institutions Private Institutions
*Beginning in 1975, counts include branch campuses
19
90
19
90

National Center for Postsecondary Improvement Page 10
Figure 10Number of Two-Year and Four-Year Higher Education
Institutions: 1950 to 1995*
0
1,000
2,000
3,000
4,0001
95
0
19
60
19
70
19
80
19
90
Two-Year Institutions Four-Year Institutions
*Beginning in 1975, count includes branch campuses.
Figure 11Number of Faculty in Higher Education by Full-Time and
Part-Time Status: 1960 -1991
Tot
al F
acul
ty (
in T
hous
ands
)
0
100
200
300
400
500
600
700
800
900
19
60
19
64
19
68
19
72
19
76
19
80
19
84
19
88
Part-Time Faculty Full-Time Faculty
National Center for Postsecondary Improvement Page 11
part-time and of students who sought special training and certification, associate’s degrees, orthe first two years of courses in preparation for the bachelor’s degree. More affordable and lessselective regarding access, these institutions also offered more flexible schedules and providedremedial education. As the numbers of institutions increased, so did the demand for faculty. Inonly 15 years, the total number of full- and part-time faculty employed in American collegesand universities almost tripled from 236,000 in 1960 to 628,000 in 1975 (Figure 11). Institutionsalso began employing an increasing number of faculty on a part-time basis. The growth issteepest between 1970 and 1977, which marks the end of the era of massification and the begin-ning of American higher education’s “maturation” stage.
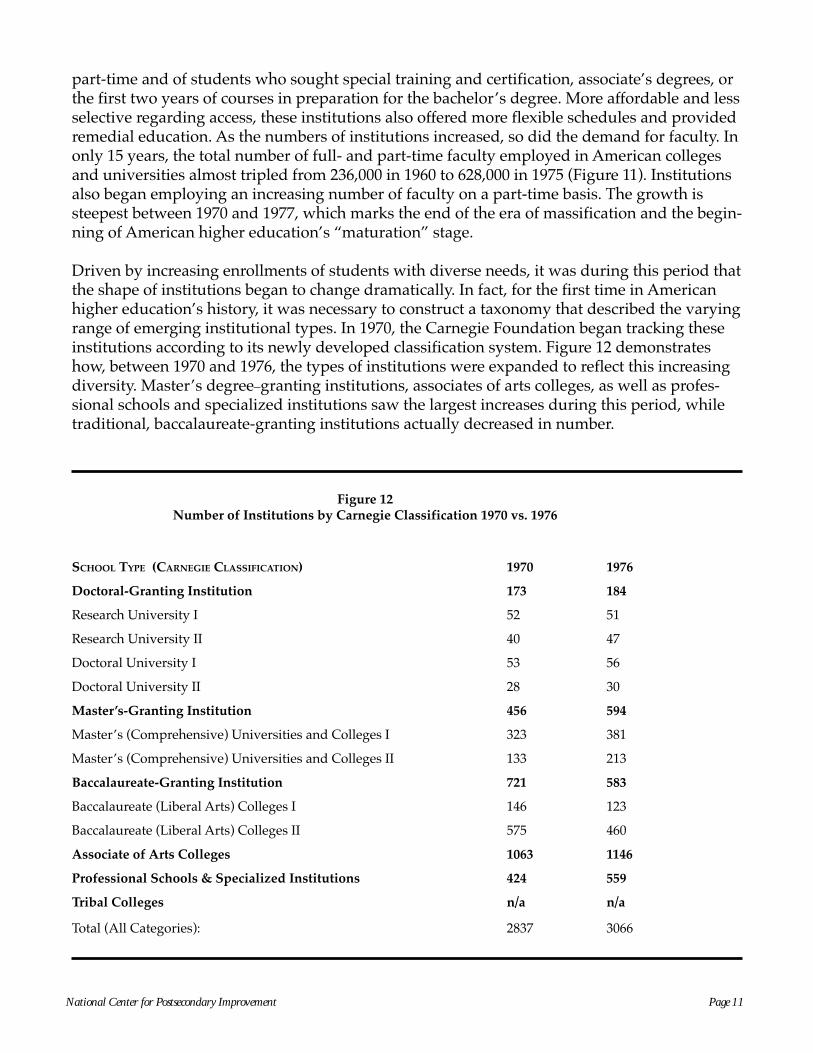
Driven by increasing enrollments of students with diverse needs, it was during this period thatthe shape of institutions began to change dramatically. In fact, for the first time in Americanhigher education’s history, it was necessary to construct a taxonomy that described the varyingrange of emerging institutional types. In 1970, the Carnegie Foundation began tracking theseinstitutions according to its newly developed classification system. Figure 12 demonstrateshow, between 1970 and 1976, the types of institutions were expanded to reflect this increasingdiversity. Master’s degree–granting institutions, associates of arts colleges, as well as profes-sional schools and specialized institutions saw the largest increases during this period, whiletraditional, baccalaureate-granting institutions actually decreased in number.
Figure 12Number of Institutions by Carnegie Classification 1970 vs. 1976
SCHOOL TYPE (CARNEGIE CLASSIFICATION) 1970 1976
Doctoral-Granting Institution 173 184
Research University I 52 51
Research University II 40 47
Doctoral University I 53 56
Doctoral University II 28 30
Master’s-Granting Institution 456 594
Master’s (Comprehensive) Universities and Colleges I 323 381
Master’s (Comprehensive) Universities and Colleges II 133 213
Baccalaureate-Granting Institution 721 583
Baccalaureate (Liberal Arts) Colleges I 146 123
Baccalaureate (Liberal Arts) Colleges II 575 460
Associate of Arts Colleges 1063 1146
Professional Schools & Specialized Institutions 424 559
Tribal Colleges n/a n/a
Total (All Categories): 2837 3066
National Center for Postsecondary Improvement Page 12
Not surprisingly, at the same time, this increase prompted the expansion of more formalizedstructures for statewide coordination of higher education, an arrangement into which institu-tions voluntarily entered in an effort to discuss planning and resource allocation at the statelevel. For example, states such as California began to develop elaborate public educationstructures that included flagship research universities, comprehensive institutions, and two-year community colleges. The California Master Plan—a remarkably coherent vision of highereducation—was enacted in 1960 to provide both increased access and quality. As originallyconceived, there were to be three distinct layers of public institutions—community colleges,state colleges, and university campuses—each stratum with a specific mission in terms ofprograms, degrees, and services offered to a particular academic segment of the college-goingpopulation. An integral part of the Master Plan was its generous scholarship program to assistresidents choosing to enroll in a private institution within the state. To ensure full access, thecost to the student was kept purposefully low.
Federal Research Support
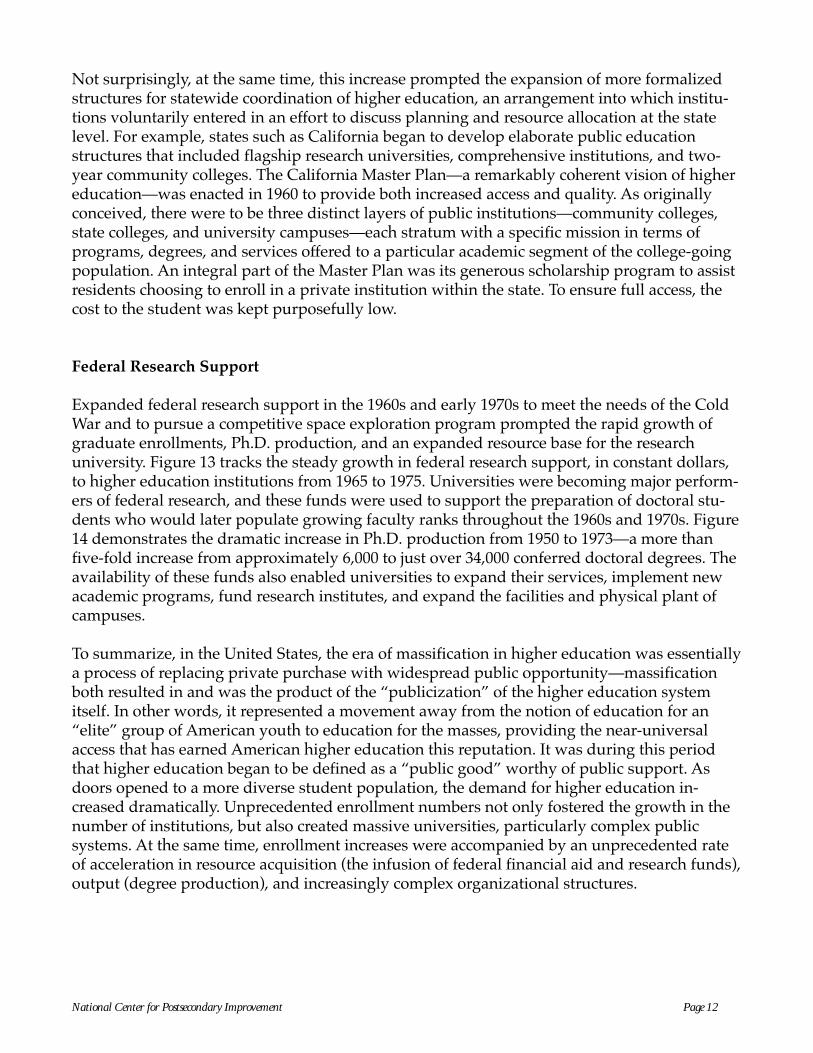
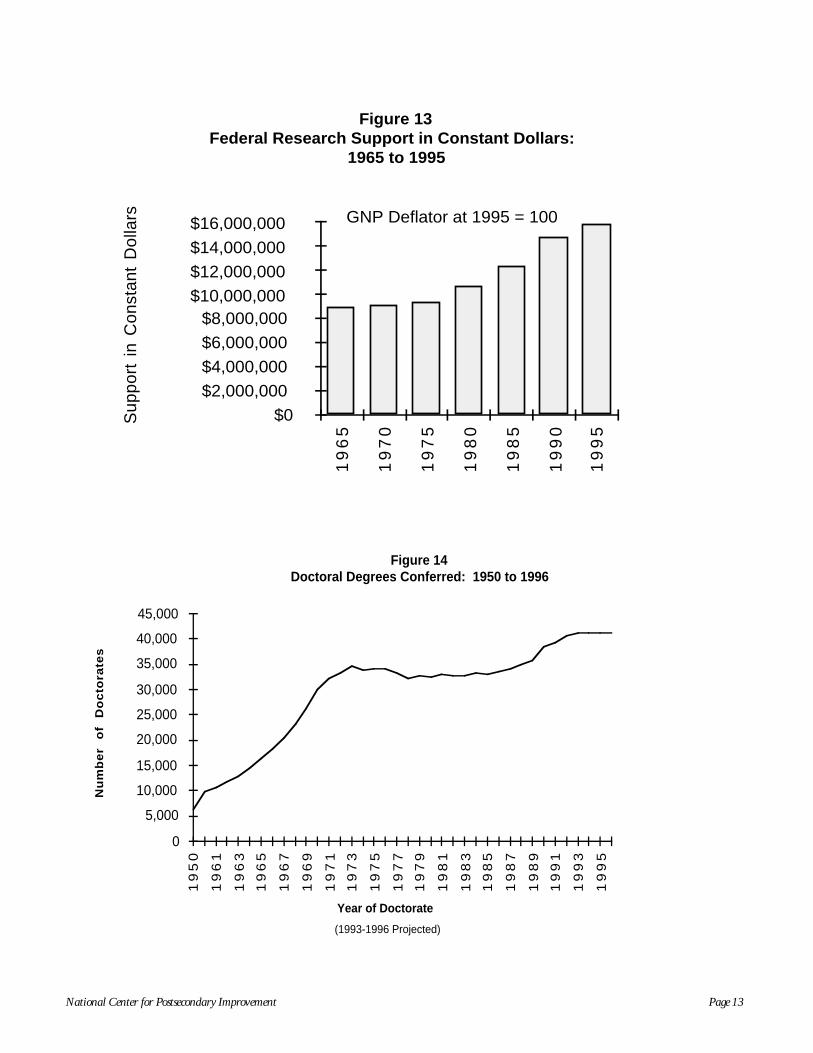
Expanded federal research support in the 1960s and early 1970s to meet the needs of the ColdWar and to pursue a competitive space exploration program prompted the rapid growth ofgraduate enrollments, Ph.D. production, and an expanded resource base for the researchuniversity. Figure 13 tracks the steady growth in federal research support, in constant dollars,to higher education institutions from 1965 to 1975. Universities were becoming major perform-ers of federal research, and these funds were used to support the preparation of doctoral stu-dents who would later populate growing faculty ranks throughout the 1960s and 1970s. Figure14 demonstrates the dramatic increase in Ph.D. production from 1950 to 1973—a more thanfive-fold increase from approximately 6,000 to just over 34,000 conferred doctoral degrees. Theavailability of these funds also enabled universities to expand their services, implement newacademic programs, fund research institutes, and expand the facilities and physical plant ofcampuses.
To summarize, in the United States, the era of massification in higher education was essentiallya process of replacing private purchase with widespread public opportunity—massificationboth resulted in and was the product of the “publicization” of the higher education systemitself. In other words, it represented a movement away from the notion of education for an“elite” group of American youth to education for the masses, providing the near-universalaccess that has earned American higher education this reputation. It was during this periodthat higher education began to be defined as a “public good” worthy of public support. Asdoors opened to a more diverse student population, the demand for higher education in-creased dramatically. Unprecedented enrollment numbers not only fostered the growth in thenumber of institutions, but also created massive universities, particularly complex publicsystems. At the same time, enrollment increases were accompanied by an unprecedented rateof acceleration in resource acquisition (the infusion of federal financial aid and research funds),output (degree production), and increasingly complex organizational structures.
National Center for Postsecondary Improvement Page 13
Figure 13Federal Research Support in Constant Dollars:
1965 to 1995
GNP Deflator at 1995 = 100
Sup
port
in
Con
stan
t D
olla
rs
$0$2,000,000$4,000,000$6,000,000$8,000,000
$10,000,000$12,000,000$14,000,000$16,000,000
19
65
19
70
19
75
19
80
19
85
19
90
19
95
Figure 14Doctoral Degrees Conferred: 1950 to 1996
Year of Doctorate
Nu
mb
er
of
Do
cto
rate
s
0
5,000
10,000
15,000
20,000
25,000
30,000
35,000
40,000
45,000
19
50
19
61
19
63
19
65
19
67
19
69
19
71
19
73
19
75
19
77
19
79
19
81
19
83
19
85
19
87
19
89
19
91
19
93
19
95
(1993-1996 Projected)
National Center for Postsecondary Improvement Page 14
The Era of Maturation
The rapid expansion of the American system of higher education in the 1960s and early 1970swas followed by a period of entrenchment—or “maturation”—of the gains made during thismassification era. During the era of maturation, approximately 1975 to the late 1980s, highereducation was still perceived as a “public good.” With the momentum of preceding decadespropelling its expansion, the system and many of its constituent parts would experience con-tinuing growth, but did so at a less rapid rate. The most significant shifts during the matura-tion era would occur in the diversity of the student body, in the rates of part-time enrollment,and in the cost of college tuition, setting the stage for the trends that appear in the current post-massification era.
Enrollment Shifts: Higher Education’s New Majority
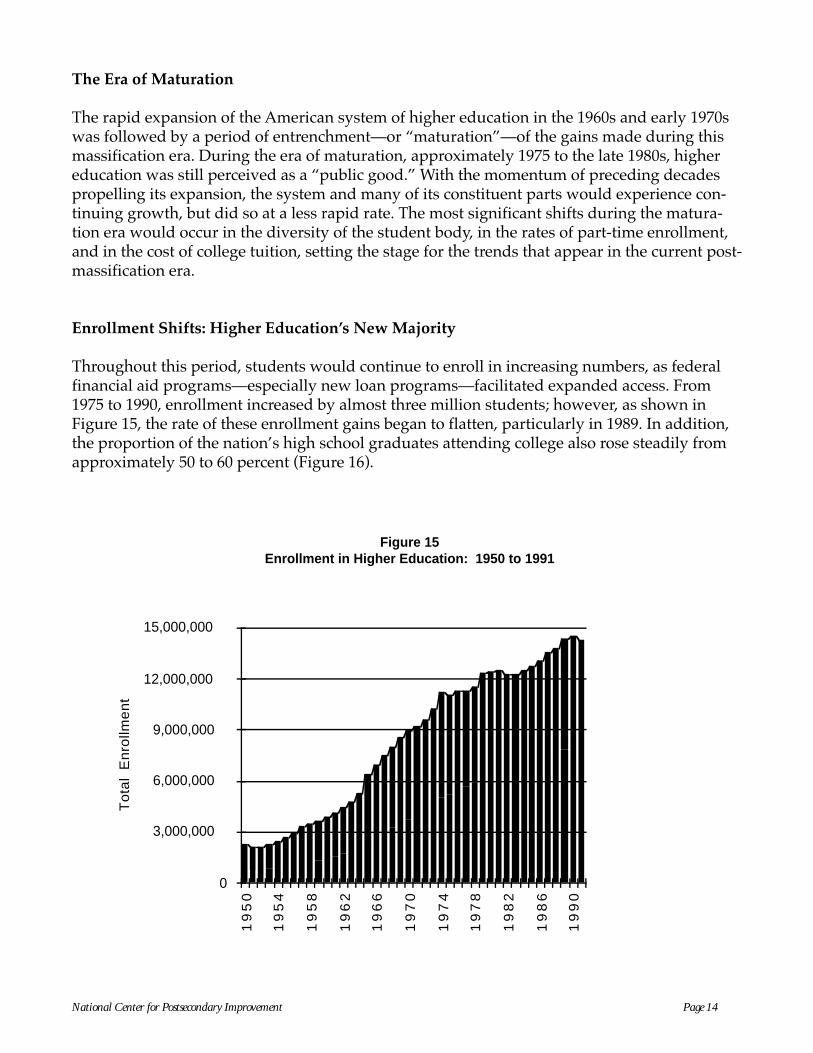
Throughout this period, students would continue to enroll in increasing numbers, as federalfinancial aid programs—especially new loan programs—facilitated expanded access. From1975 to 1990, enrollment increased by almost three million students; however, as shown inFigure 15, the rate of these enrollment gains began to flatten, particularly in 1989. In addition,the proportion of the nation’s high school graduates attending college also rose steadily fromapproximately 50 to 60 percent (Figure 16).
Figure 15Enrollment in Higher Education: 1950 to 1991
To
tal
En
rollm
en
t
0
3,000,000
6,000,000
9,000,000
12,000,000
15,000,000
19
50
19
54
19
58
19
62
19
66
19
70
19
74
19
78
19
82
19
86
19
90

National Center for Postsecondary Improvement Page 15
Figure 16Rate of College Attendance Among High School Graduates:
1960 to 1994
25%
35%
45%
55%
65%
75%
19
60
..
19
64
..
19
68
..
19
72
..
19
76
..
19
80
..
19
84
..
19
88
..
19
92
..
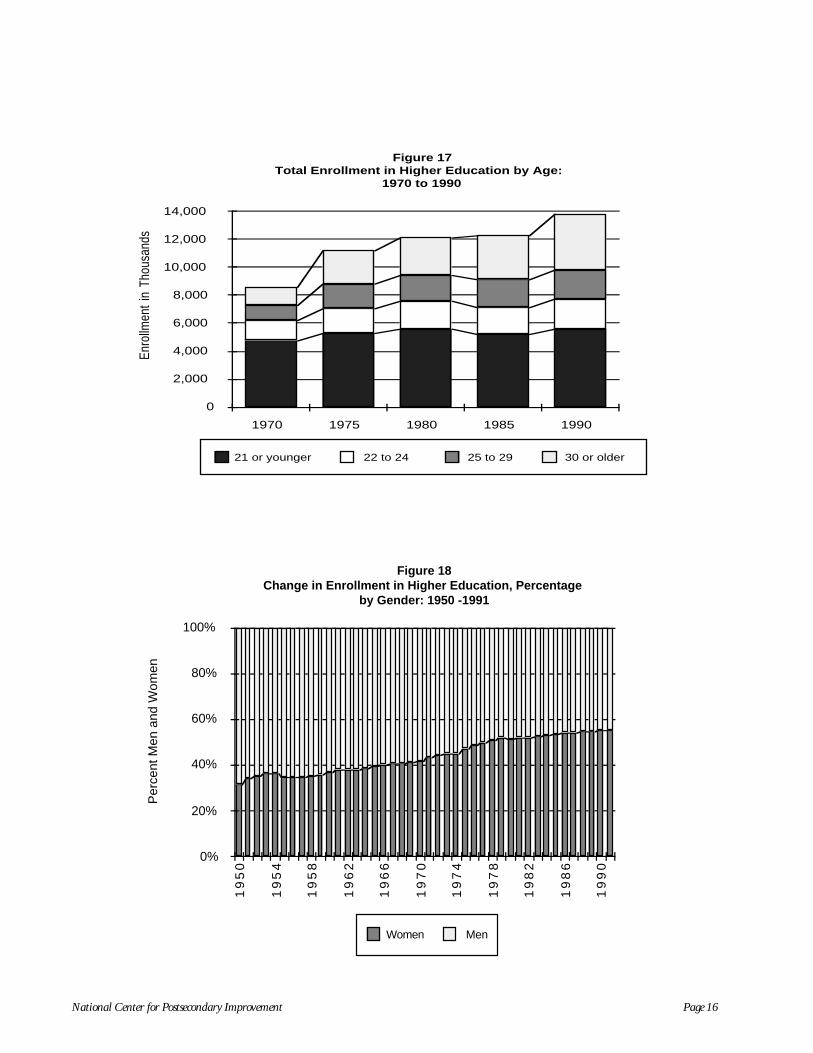
The predominant change in enrollment during this period was not in the number of studentsattending college, but in their age. From 1975 to 1980, the largest increase in enrollment occuredamong students over 30 years of age (Figure 17). By 1990, the majority of higher education’sstudents—its “new majority”—would be 22 years of age or older. No longer did white, tradi-tional-aged males comprise the largest proportion of students in higher education’s class-rooms. The new majority was not only older, it was increasingly diverse. With regard to gen-der, the number of women enrolled increased ten-fold, from 750,000 in 1950 to more than 7.5million in 1991—eclipsing the enrollment of male students and becoming the majority ofmatriculants in American higher education (Figure 18). Racial and ethnic minorities continuedto make gains in participation during this period (Figure 19).
With the influx of higher education’s new majority—older, and often working, students—alsocame a shift in attendance patterns. By 1990, more than 40 percent of American students wereattending a college or university on a part-time basis (Figure 20), and most of these studentsbelonged to higher education’s new majority. Figure 21 shows how, since 1970, the greatestshare of part-time students have been over the age of 22. The most dramatic growth in thenumber of part-time students occurred for those over age 30, with a more than 40 percentincrease between 1980 and 1990. In fact, that age group accounts for nearly all of the growth inpart-time attendance.
National Center for Postsecondary Improvement Page 16
Figure 17Total Enrollment in Higher Education by Age:
1970 to 1990
Enro
llmen
t in
Thou
sand
s
0
2,000
4,000
6,000
8,000
10,000
12,000
14,000
1970 1975 1980 1985 1990
21 or younger 22 to 24 25 to 29 30 or older
Figure 18Change in Enrollment in Higher Education, Percentage
by Gender: 1950 -1991
Per
cent
Men
and
Wom
en
0%
20%
40%
60%
80%
100%
19
50
19
54
19
58
19
62
19
66
19
70
19
74
19
78
19
82
19
86
19
90
Women Men

National Center for Postsecondary Improvement Page 17
Figure 19Numbers of Students Enrolled in Higher Education by Racial
and Ethnic Group: 1976-1993
0
3,000
6,000
9,000
12,000
15,000
1976 1980 1984 1988 1990 1993
African-American
Hispanic- American
Asian- American
Native-American
International White
Figure 20Full-Time and Part-Time Enrollment in Higher
Education: 1960 to 1993
0%
20%
40%
60%
80%
100%
1960
1964
1968
1972
1976
1980
1984
1988
1992
Part-Time Full-Time

National Center for Postsecondary Improvement Page 18
Figure 21Part-Time Enrollment in Higher Education by Age:
1970 to 1990
Enr
ollm
ent
in T
hous
ands
0
1,000
2,000
3,000
4,000
5,000
6,000
1970 1975 1980 1985 1990
21 or younger 22 to 24 25 to 29 30 or older
Figure 22Number of Colleges and Universities: 1950 to 1995*
*Beginning in 1975, count includes branch campuses.
0
1,000
2,000
3,000
4,000
19
50
19
54
19
58
19
62
19
66
19
70
19
74
19
78
19
82
19
86
19
90
19
94

National Center for Postsecondary Improvement Page 19
The Slowing Growth of Traditional Institutions
Although the number of institutions continued to increase during the era of maturation, therate of increase in the number of institutions—like that of enrollment—began to flatten (Figure22). There is a sharp spike in the number of institutions between 1974 and 1975, when branchcampuses are included in the total count of colleges and universities, which reflects an artifactof data collection, not an increase in the number of branch campuses themselves. Anotherspike occurs between 1986 and 1987, after which the number of institutions remained constant.The proliferation of traditional higher education institutions also began to slow during thisperiod, although non-traditional colleges—such as two-year associate’s-granting schools andprofessional and specialized schools—experienced a significant jump in number between 1976and 1987 (Figure 23).
Figure 23Number of Institutions by Carnegie Classification 1976 vs. 1987
SCHOOL TYPE (CARNEGIE CLASSIFICATION) 1976 1987
Doctoral-Granting Institution 184 213
Research University I 51 70
Research University II 47 34
Doctoral University I 56 51
Doctoral University II 30 58
Master’s-Granting Institution 594 595
Master’s (Comprehensive) Universities and Colleges I 381 424
Master’s (Comprehensive) Universities and Colleges II 213 171
Baccalaureate-Granting Institution 583 572
Baccalaureate (Liberal Arts) Colleges I 123 142
Baccalaureate (Liberal Arts) Colleges II 460 430
Associate of Arts Colleges 1146 1367
Professional Schools & Specialized Institutions 559 642
Tribal Colleges n/a n/a
Total (All Categories): 3066 3389
Increased Organizational Complexity
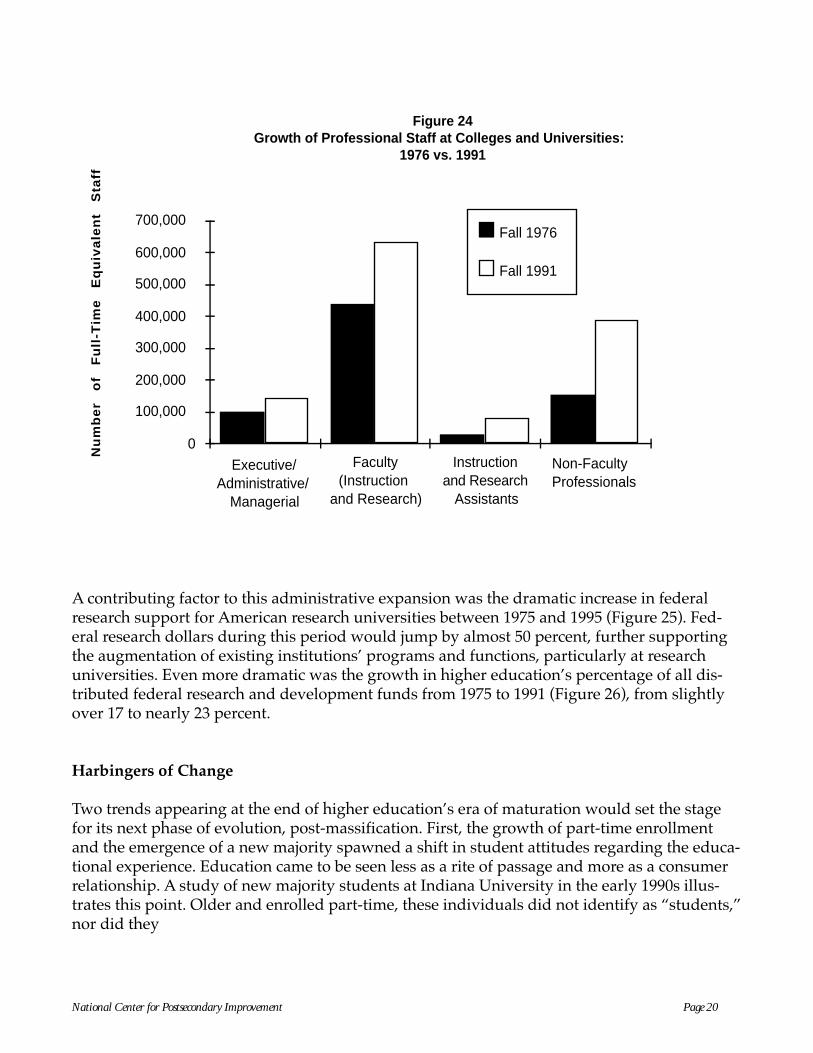
What continued to expand was the sheer size of institutions—in terms of their administrativestaffs—as they added programs, student services, research institutes, and administrative unitsin an era of continued expansion. Figure 24 demonstrates how the number of non-facultyprofessionals, as well as instruction and research assistants, employed at colleges and universi-ties more than doubled between 1976 and 1991.
National Center for Postsecondary Improvement Page 20
Figure 24Growth of Professional Staff at Colleges and Universities:
1976 vs. 1991
Nu
mb
er
of
Fu
ll-T
ime
E
qu
iva
len
t S
taff
0
100,000
200,000
300,000
400,000
500,000
600,000
700,000
Fall 1976
Fall 1991
Non-Faculty Professionals
Executive/Administrative/
Managerial
Faculty(Instruction
and Research)
Instruction and Research
Assistants
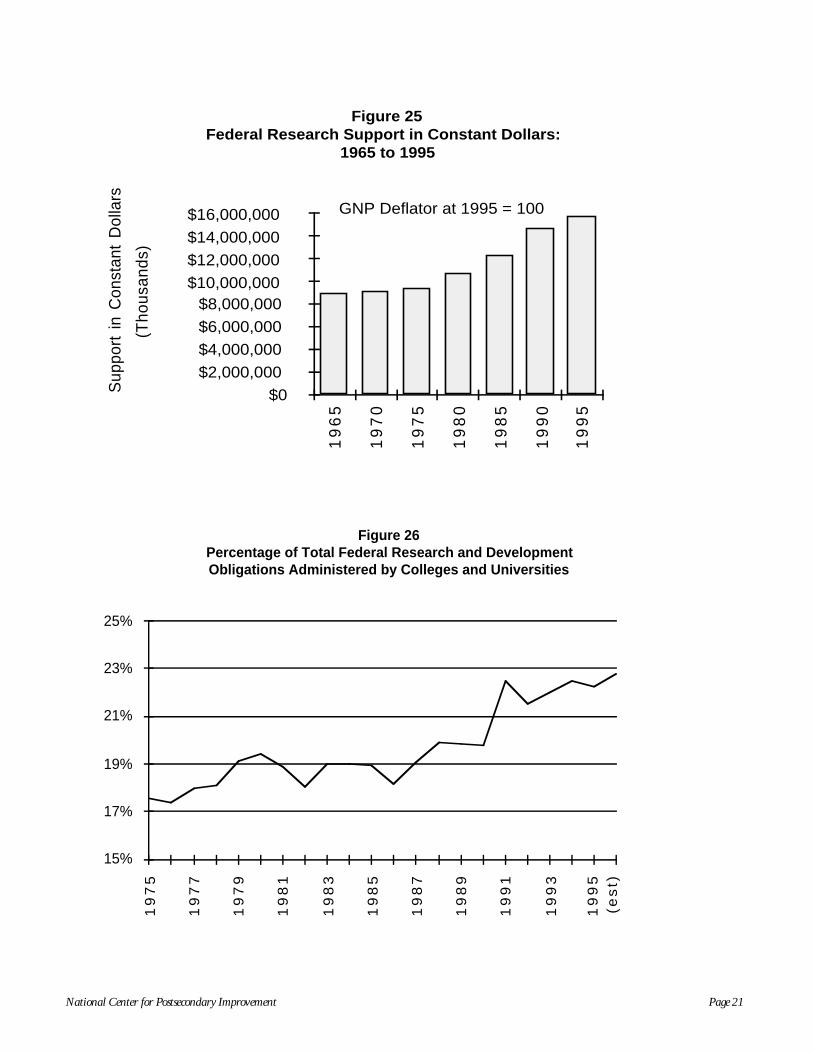
A contributing factor to this administrative expansion was the dramatic increase in federalresearch support for American research universities between 1975 and 1995 (Figure 25). Fed-eral research dollars during this period would jump by almost 50 percent, further supportingthe augmentation of existing institutions’ programs and functions, particularly at researchuniversities. Even more dramatic was the growth in higher education’s percentage of all dis-tributed federal research and development funds from 1975 to 1991 (Figure 26), from slightlyover 17 to nearly 23 percent.
Harbingers of Change
Two trends appearing at the end of higher education’s era of maturation would set the stagefor its next phase of evolution, post-massification. First, the growth of part-time enrollmentand the emergence of a new majority spawned a shift in student attitudes regarding the educa-tional experience. Education came to be seen less as a rite of passage and more as a consumerrelationship. A study of new majority students at Indiana University in the early 1990s illus-trates this point. Older and enrolled part-time, these individuals did not identify as “students,”nor did they
National Center for Postsecondary Improvement Page 21
Figure 25Federal Research Support in Constant Dollars:
1965 to 1995
GNP Deflator at 1995 = 100
Sup
port
in
Con
stan
t D
olla
rs
(Tho
usan
ds)
$0$2,000,000$4,000,000$6,000,000$8,000,000
$10,000,000$12,000,000$14,000,000$16,000,000
19
65
19
70
19
75
19
80
19
85
19
90
19
95
Figure 26 Percentage of Total Federal Research and Development Obligations Administered by Colleges and Universities
15%
17%
19%
21%
23%
25%
19
75
19
77
19
79
19
81
19
83
19
85
19
87
19
89
19
91
19
93
19
95
(es
t)
National Center for Postsecondary Improvement Page 22
feel a strong attachment to their postsecondary institutions. They considered themselves to be“workers” or “homemakers” first, and students second or third. This shift in attitude demon-strates the departure from the identities of traditional-age students, who characterized them-selves primarily as “students,” even if they worked while in school. It also contributed to thedevelopment of higher education’s outlet market, as students have become shoppers who“buy” their higher education one course at a time, perhaps from a variety of institutions.
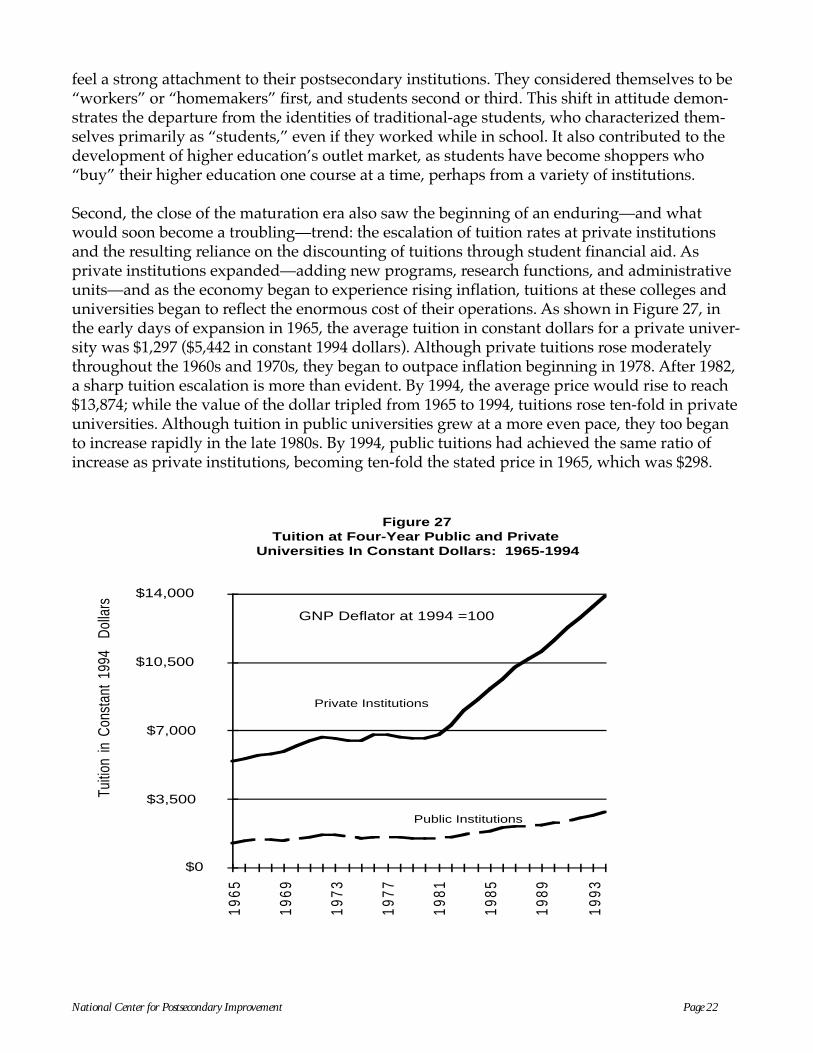
Second, the close of the maturation era also saw the beginning of an enduring—and whatwould soon become a troubling—trend: the escalation of tuition rates at private institutionsand the resulting reliance on the discounting of tuitions through student financial aid. Asprivate institutions expanded—adding new programs, research functions, and administrativeunits—and as the economy began to experience rising inflation, tuitions at these colleges anduniversities began to reflect the enormous cost of their operations. As shown in Figure 27, inthe early days of expansion in 1965, the average tuition in constant dollars for a private univer-sity was $1,297 ($5,442 in constant 1994 dollars). Although private tuitions rose moderatelythroughout the 1960s and 1970s, they began to outpace inflation beginning in 1978. After 1982,a sharp tuition escalation is more than evident. By 1994, the average price would rise to reach$13,874; while the value of the dollar tripled from 1965 to 1994, tuitions rose ten-fold in privateuniversities. Although tuition in public universities grew at a more even pace, they too beganto increase rapidly in the late 1980s. By 1994, public tuitions had achieved the same ratio ofincrease as private institutions, becoming ten-fold the stated price in 1965, which was $298.
Figure 27Tuition at Four-Year Public and Private
Universities In Constant Dollars: 1965-1994
Tuiti
on in
Con
stan
t 19
94
Dolla
rs
$0
$3,500
$7,000
$10,500
$14,000
1965
1969
1973
1977
1981
1985
1989
1993
GNP Deflator at 1994 =100
Private Institutions
Public Institutions
National Center for Postsecondary Improvement Page 23
The Era of Post-Massification
The enormous, expensive, and elaborate systems of higher education that developed andmatured from 1960 to the late-1980s were predicated on an ever-expanding resource base andlittle regulation from the public sphere. During the eras of massification and maturation, it waspossible for colleges and universities to look inward and define the challenges confrontingthem in their own terms; beginning in the late 1980s, however, the system’s expansion becameundercut by a growing set of external pressures.
Beginning in the late 1980s, there were visible signs of an erosion of support for Americanhigher education, as it increasingly became perceived as an individual good, rather than apublic good. Students and parents began to question the value of higher education’s expensivecredentials, particularly since the return on—though not the necessity of—a college degreeeroded in the American job market. Economic retrenchment, the rise of market forces, andincreased competition for declining public appropriations have also eroded the foundationupon which higher education has flourished in the decades after World War II. As a result,colleges and universities have begun to rethink the size, shape, mission, and financing of theirenterprises. In a sense, just as massification signaled the “publicization” of American highereducation, the process of post-massification may be signaling the “privatization” of the sys-tem. This shift is accompanied by increasingly vocal concerns over the viability of particularkinds of institutions and over the continued feasibility of access for all.
Data have yet to be collected that reveal the abrupt halt in American higher education’s marchtoward expansion and the shattering of long-held premises. However, a series of emergingcrises indicate that the system is moving in the direction characterized by Professor Arimoto’spostulates—in essence, a shift toward post-massification. This shift is characterized by in-creased public scrutiny and calls for accountability, the withdrawal of public support, priceresistance and discounting, rising market pressures and competition, a shift towardvocationalism, and persistence problems related to the elongation of time-to-degree.
Increased Public Scrutiny and Calls for Accountability
Postsecondary education’s lowered place in the queue for public funds may derive from asense that the enterprise’s costs are out of control and from a feeling that public institutions,like their private counterparts, have become not just expensive but wasteful in pursuit of theirown, as opposed to the public’s, agenda. A number of postsecondary education’s politicalcritics have come to assert that reduced public funding will not only make public universitiesmore efficient (almost by definition), but more accountable for delivering access and qualityeducation. While American colleges and universities still claim societal purpose, legislativecritics in particular are concerned that, if left to their own devices, these institutions will con-tinue to use public monies while simultaneously insulating themselves from the rigors ofpublic accountability. Throughout policy discussions, various stakeholders have begun torethink taken-for-granted answers to a number of core questions about the premises of theAmerican higher education enterprise. These questions include: To what extent should highereducation institutions adapt to changing market demands? Should the state be an owner or aregulator of higher education institutions? And, what financing and operational practices of
National Center for Postsecondary Improvement Page 24
higher education will best serve the public’s interest?
Withdrawal of Public Support
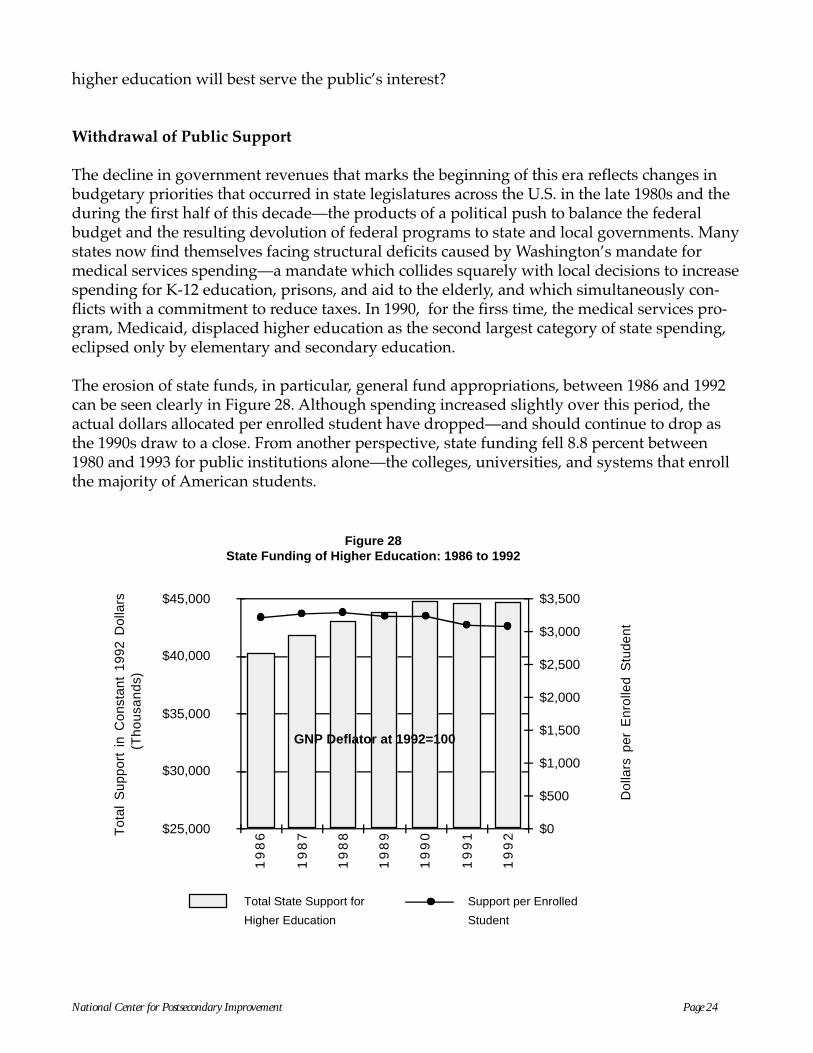
The decline in government revenues that marks the beginning of this era reflects changes inbudgetary priorities that occurred in state legislatures across the U.S. in the late 1980s and theduring the first half of this decade—the products of a political push to balance the federalbudget and the resulting devolution of federal programs to state and local governments. Manystates now find themselves facing structural deficits caused by Washington’s mandate formedical services spending—a mandate which collides squarely with local decisions to increasespending for K-12 education, prisons, and aid to the elderly, and which simultaneously con-flicts with a commitment to reduce taxes. In 1990, for the firss time, the medical services pro-gram, Medicaid, displaced higher education as the second largest category of state spending,eclipsed only by elementary and secondary education.
The erosion of state funds, in particular, general fund appropriations, between 1986 and 1992can be seen clearly in Figure 28. Although spending increased slightly over this period, theactual dollars allocated per enrolled student have dropped—and should continue to drop asthe 1990s draw to a close. From another perspective, state funding fell 8.8 percent between1980 and 1993 for public institutions alone—the colleges, universities, and systems that enrollthe majority of American students.
Figure 28State Funding of Higher Education: 1986 to 1992
Tot
al S
uppo
rt i
n C
onst
ant
1992
Dol
lars
(T
hous
ands
)
$25,000
$30,000
$35,000
$40,000
$45,000
19
86
19
87
19
88
19
89
19
90
19
91
19
92 $0
$500
$1,000
$1,500
$2,000
$2,500
$3,000
$3,500
Dol
lars
per
Enr
olle
d S
tude
nt
Total State Support for
Higher Education
Support per Enrolled
Student
GNP Deflator at 1992=100

National Center for Postsecondary Improvement Page 25
Although it has not declined significantly, direct local and federal support for higher educationflattened between 1981 and 1993 (Figure 29). Overall, government funding as a percentage ofall revenue sources for higher education declined between 1981 and 1993 by almost 10 percent-age points (Figure 30).
Figure 29Government Support for Higher Education:
1981 to 1993
Sup
port
in
Con
stan
t 19
93 D
olla
rs
$0
$10,000,000
$20,000,000
$30,000,000
$40,000,000
$50,000,0001
98
1
19
85
19
89
19
93
Federal State Local
Figure 30Government Funding as a Percentage of All Funding for
Higher Education: 1981 to 1993
Per
cent
of
Rev
enue
fro
m A
ll G
over
nmen
t S
ourc
es
25%
35%
45%
55%
19
81
19
83
19
85
19
87
19
89
19
91
19
93
All Government Support

National Center for Postsecondary Improvement Page 26
Confronted with a steady decline in government support, most colleges and universities haveoffset their revenue losses by passing the costs on to students through dramatic tuition in-creases. Figure 31 reports the steep increase in revenues from tuition and fees from 1981 to1993; by the end of that 12-year period, revenue from these sources had more than doubled.
Figure 31Tuition and Fee Revenues of Higher Education:
1981 to 1993
Tuiti
on R
even
ue in
Con
stan
t 199
3 Do
llars
(Tho
usan
ds)
$0
$10,000
$20,000
$30,000
$40,000
$50,000
1982
1984
1986
1988
1990
1992
Tuition and fees
GNP Deflator at 1993=100
Price Resistance and Discounting
The success of sustained tuition increases to fill the fiscal gap now promises to become self-defeating. Political resistance to these tuition hikes has increased as middle-income familiesexpress fears about college being priced out of reach. As a result, the past two years havewitnessed only modest increases in public tuition levels in most states, and it is no longerpolitically feasible to impose double-digit tuition increases, at least for in-state undergraduatestudents.
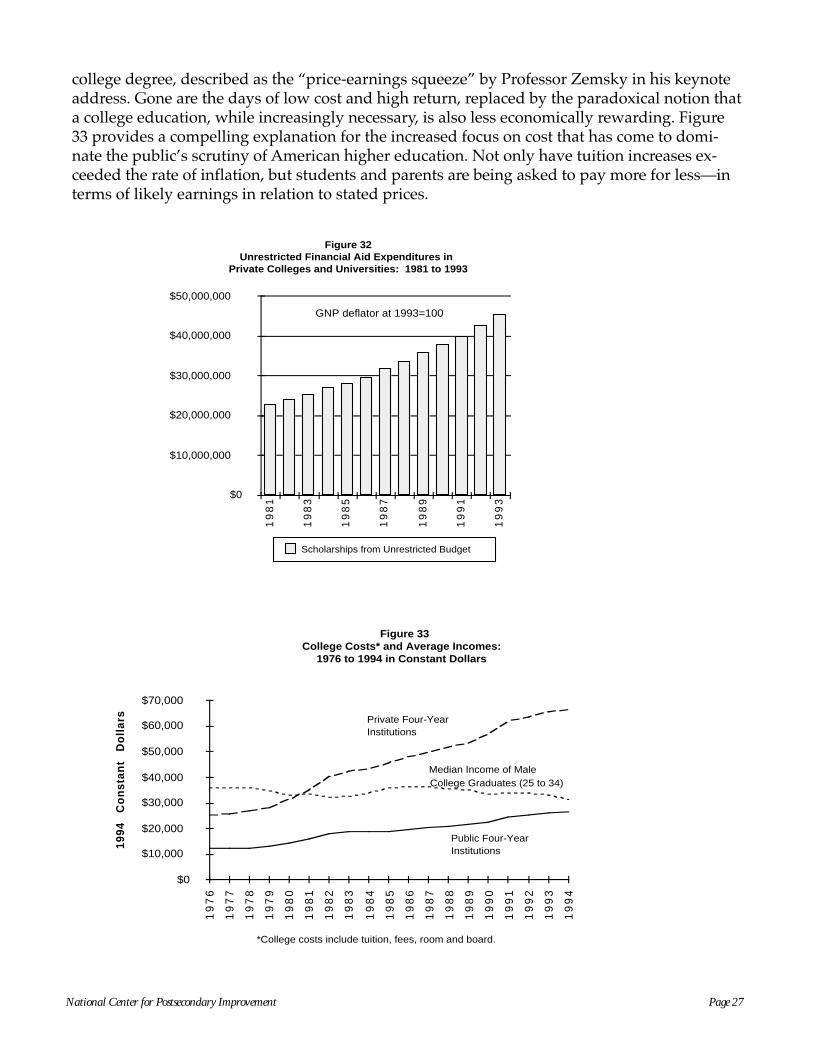
Of necessity, private colleges and universities have been subsidizing student financial aid byrecycling tuition revenues—a practice that redistributes the tuition burden by supportingstudents of fewer means with the tuition dollars of those who pay the full price. In recentyears, many four-year public institutions have come to operate increasingly like their privatecounterparts. Called “discounting,” this practice has actually become one of the factors exert-ing upward pressure on tuition levels. Figure 32 demonstrates how expenditures for studentfinancial aid from private institutions’ unrestricted operating budgets increased from 1981 to1993.
Much of the price resistance phenomenon has its foundations in the decreasing value of a
National Center for Postsecondary Improvement Page 27
college degree, described as the “price-earnings squeeze” by Professor Zemsky in his keynoteaddress. Gone are the days of low cost and high return, replaced by the paradoxical notion thata college education, while increasingly necessary, is also less economically rewarding. Figure33 provides a compelling explanation for the increased focus on cost that has come to domi-nate the public’s scrutiny of American higher education. Not only have tuition increases ex-ceeded the rate of inflation, but students and parents are being asked to pay more for less—interms of likely earnings in relation to stated prices.
Figure 32Unrestricted Financial Aid Expenditures in
Private Colleges and Universities: 1981 to 1993
$0
$10,000,000
$20,000,000
$30,000,000
$40,000,000
$50,000,000
19
81
19
83
19
85
19
87
19
89
19
91
19
93
Scholarships from Unrestricted Budget
GNP deflator at 1993=100
1994
C
on
stan
t D
oll
ars
$0
$10,000
$20,000
$30,000
$40,000
$50,000
$60,000
$70,000
19
76
19
77
19
78
19
79
19
80
19
81
19
82
19
83
19
84
19
85
19
86
19
87
19
88
19
89
19
90
19
91
19
92
19
93
19
94
Private Four-Year Institutions
Public Four-Year Institutions
Median Income of Male College Graduates (25 to 34)
*College costs include tuition, fees, room and board.
Figure 33College Costs* and Average Incomes:
1976 to 1994 in Constant Dollars
National Center for Postsecondary Improvement Page 28
Increased Market Pressures and Vocationalism
Fiscal constraints and calls for accountability have been accompanied by emerging pressuresfrom the market. Higher education has become increasingly consumer-driven, as students andparents offer resistance to tuition increases and demand greater accountability for the qualityand cost-effectiveness of institutions. Other competitive forces—particularly from the for-profitsector and especially from the growing information-services industry—have further taxedtraditional institutions, as outlet markets begin to emerge and higher education’s near-mo-nopoly in conferring training and education credentials breaks down.
In many ways, those who have best understood the changing nature of this educational mar-ket are the new, often proprietary, institutions that have emerged to challenge traditionallyorganized colleges and universities, as well as the nation’s community colleges, which havealways offered vocational education and training. Unfettered by the traditions of the academy,these specialized providers are proving that they can offer educational programs that satisfy aconsumer movement increasingly concerned with attaining the credentials that postsecondaryeducational programs are expected to provide. Just over the horizon is a second wave of entre-preneurs ready to combine the educational and entertainment potential of electronic technolo-gies, creating products and services to attract both younger and older learners who are accus-tomed to shopping for the services they seek.
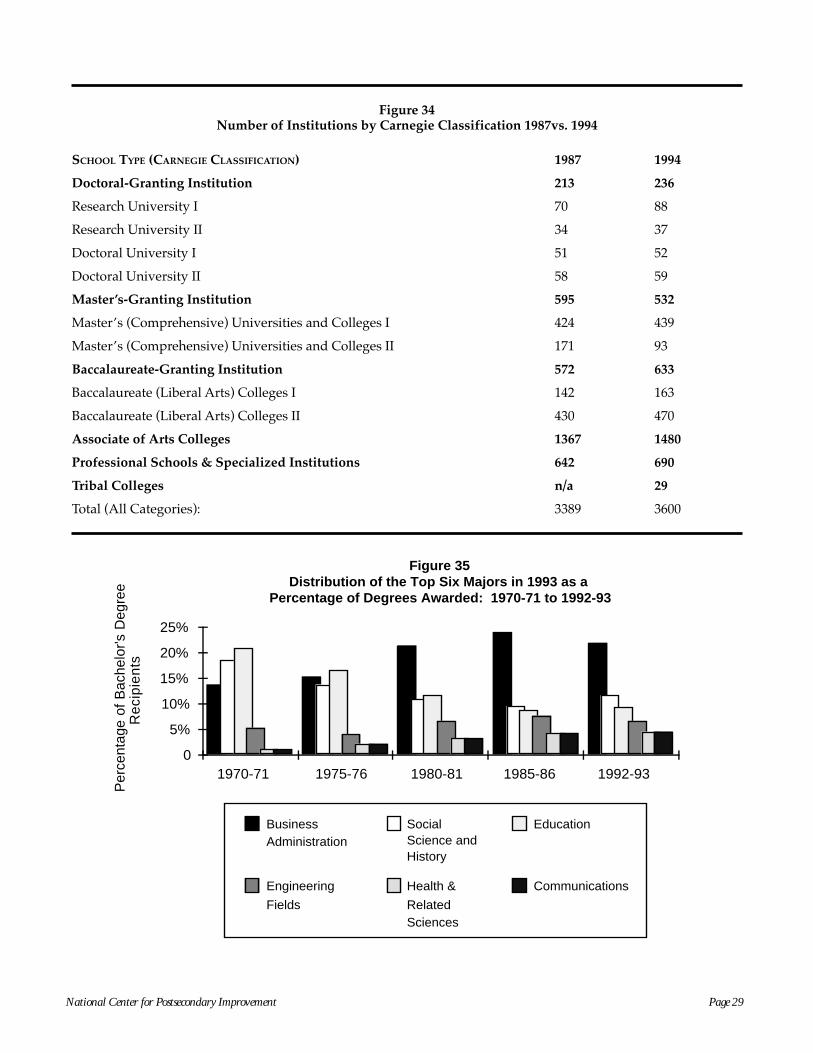
The proliferation of these education outlets is evident in the growth in the number of institu-tions by their Carnegie classification (Figure 34) from 1987 to 1994. During the maturation era,when this trend first began to appear, associate’s degree–granting as well as specialized andprofessional institutions experienced the greatest growth in number, and they continued toincrease in the current era of post-massification. It is important to note here that—while thenumber of doctoral degree–granting institutions increased slightly, and master’s degree–grant-ing institutions actually declined—the number of baccalaureate institutions jumped. What thisfact may reflect is the sheer necessity of a bachelor’s degree to compete in the American labormarket of the 1990s, as described by Professor Zemsky in his keynote.
On a programmatic level, similar shifts are evident. Students continue to choose majors lead-ing towards vocational and professional degrees, as they seek to ensure their own success in aturbulent labor market. Figure 35 demonstrates how, between 1970 and 1993, business admin-istration degrees skyrocketed; engineering, health and related sciences, and communicationsdegrees also increased significantly.
National Center for Postsecondary Improvement Page 29
Figure 34Number of Institutions by Carnegie Classification 1987vs. 1994
SCHOOL TYPE (CARNEGIE CLASSIFICATION) 1987 1994
Doctoral-Granting Institution 213 236
Research University I 70 88
Research University II 34 37
Doctoral University I 51 52
Doctoral University II 58 59
Master’s-Granting Institution 595 532
Master’s (Comprehensive) Universities and Colleges I 424 439
Master’s (Comprehensive) Universities and Colleges II 171 93
Baccalaureate-Granting Institution 572 633
Baccalaureate (Liberal Arts) Colleges I 142 163
Baccalaureate (Liberal Arts) Colleges II 430 470
Associate of Arts Colleges 1367 1480
Professional Schools & Specialized Institutions 642 690
Tribal Colleges n/a 29
Total (All Categories): 3389 3600
Figure 35Distribution of the Top Six Majors in 1993 as a
Percentage of Degrees Awarded: 1970-71 to 1992-93
Per
cent
age
of B
ache
lor's
Deg
ree
Rec
ipie
nts
0
5%
10%
15%
20%
25%
1970-71 1975-76 1980-81 1985-86 1992-93
BusinessAdministration
Social Science and History
Education
Engineering
Fields
Health &
RelatedSciences
Communications
National Center for Postsecondary Improvement Page 30
Persistence Problems and the Elongation of Time to Degree
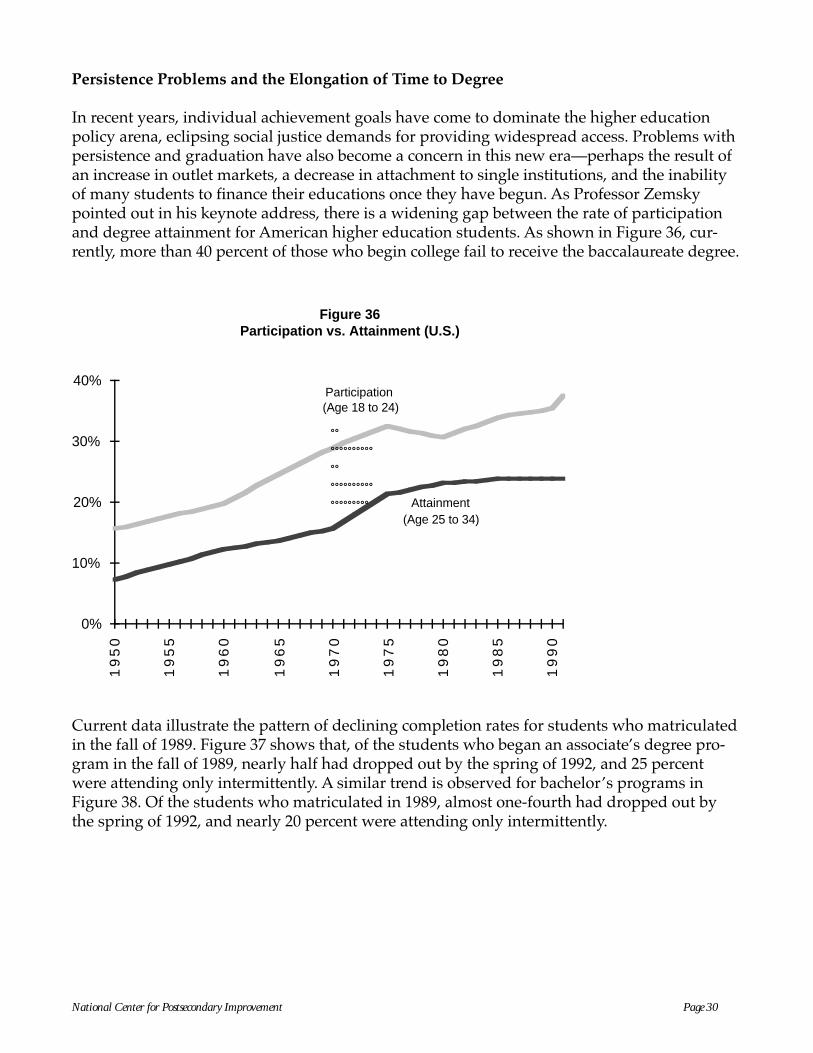
In recent years, individual achievement goals have come to dominate the higher educationpolicy arena, eclipsing social justice demands for providing widespread access. Problems withpersistence and graduation have also become a concern in this new era—perhaps the result ofan increase in outlet markets, a decrease in attachment to single institutions, and the inabilityof many students to finance their educations once they have begun. As Professor Zemskypointed out in his keynote address, there is a widening gap between the rate of participationand degree attainment for American higher education students. As shown in Figure 36, cur-rently, more than 40 percent of those who begin college fail to receive the baccalaureate degree.
0%
10%
20%
30%
40%
19
50
19
55
19
60
19
65
19
70
19
75
19
80
19
85
19
90
(Age 25 to 34)Attainment
(Age 18 to 24)Participation
Figure 36Participation vs. Attainment (U.S.)
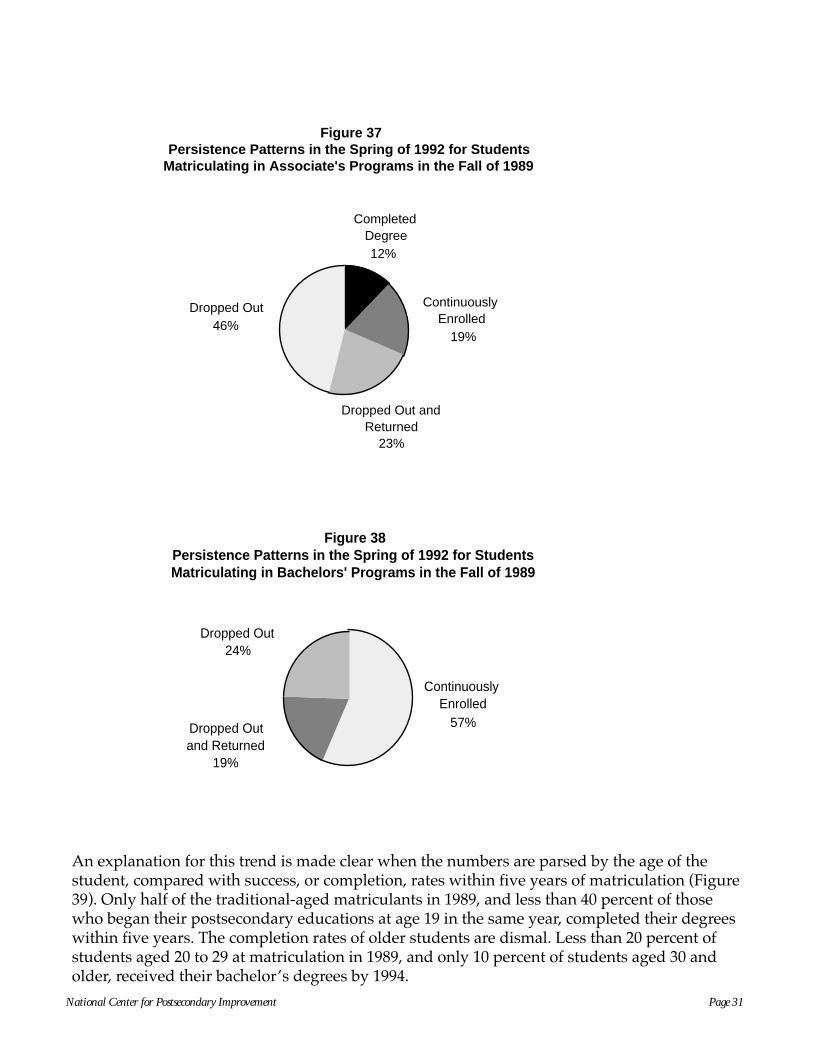
Current data illustrate the pattern of declining completion rates for students who matriculatedin the fall of 1989. Figure 37 shows that, of the students who began an associate’s degree pro-gram in the fall of 1989, nearly half had dropped out by the spring of 1992, and 25 percentwere attending only intermittently. A similar trend is observed for bachelor’s programs inFigure 38. Of the students who matriculated in 1989, almost one-fourth had dropped out bythe spring of 1992, and nearly 20 percent were attending only intermittently.
National Center for Postsecondary Improvement Page 31
CompletedDegree12%
ContinuouslyEnrolled
19%
Dropped Out andReturned
23%
Dropped Out46%
Figure 37Persistence Patterns in the Spring of 1992 for Students
Matriculating in Associate's Programs in the Fall of 1989
ContinuouslyEnrolled
57%Dropped Outand Returned
19%
Dropped Out24%
Figure 38Persistence Patterns in the Spring of 1992 for Students Matriculating in Bachelors' Programs in the Fall of 1989
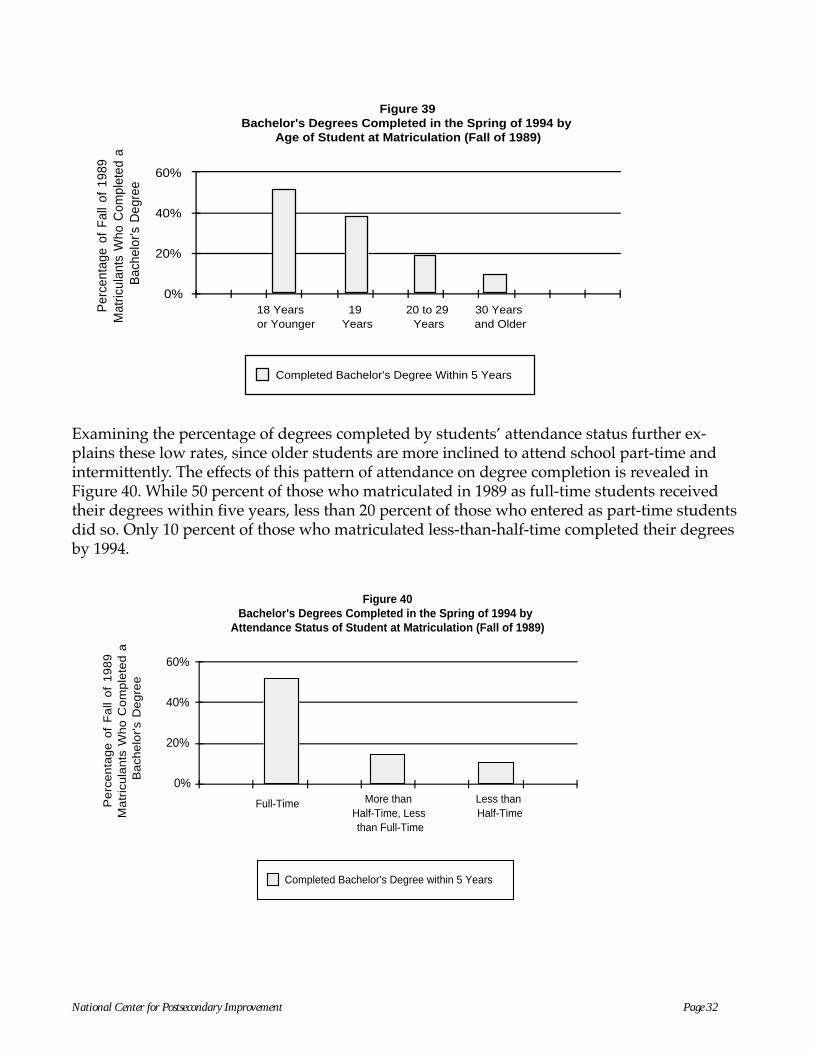
An explanation for this trend is made clear when the numbers are parsed by the age of thestudent, compared with success, or completion, rates within five years of matriculation (Figure39). Only half of the traditional-aged matriculants in 1989, and less than 40 percent of thosewho began their postsecondary educations at age 19 in the same year, completed their degreeswithin five years. The completion rates of older students are dismal. Less than 20 percent ofstudents aged 20 to 29 at matriculation in 1989, and only 10 percent of students aged 30 andolder, received their bachelor’s degrees by 1994.
National Center for Postsecondary Improvement Page 32
Figure 39Bachelor's Degrees Completed in the Spring of 1994 by
Age of Student at Matriculation (Fall of 1989)
Per
cent
age
of F
all
of 1
989
Mat
ricul
ants
Who
Com
plet
ed a
B
ache
lor's
Deg
ree
Completed Bachelor's Degree Within 5 Years
19 Years
18 Years or Younger
20 to 29 Years
30 Years and Older
0%
20%
40%
60%
Examining the percentage of degrees completed by students’ attendance status further ex-plains these low rates, since older students are more inclined to attend school part-time andintermittently. The effects of this pattern of attendance on degree completion is revealed inFigure 40. While 50 percent of those who matriculated in 1989 as full-time students receivedtheir degrees within five years, less than 20 percent of those who entered as part-time studentsdid so. Only 10 percent of those who matriculated less-than-half-time completed their degreesby 1994.
Figure 40Bachelor's Degrees Completed in the Spring of 1994 by
Attendance Status of Student at Matriculation (Fall of 1989)
0%
20%
40%
60%
Full-Time
Completed Bachelor's Degree within 5 Years
Less than Half-Time
More than Half-Time, Less than Full-Time
Pe
rce
nta
ge
of
Fa
ll o
f 1
98
9
Ma
tric
ula
nts
Wh
o C
om
ple
ted
a
Ba
che
lor's
De
gre
e
National Center for Postsecondary Improvement Page 33
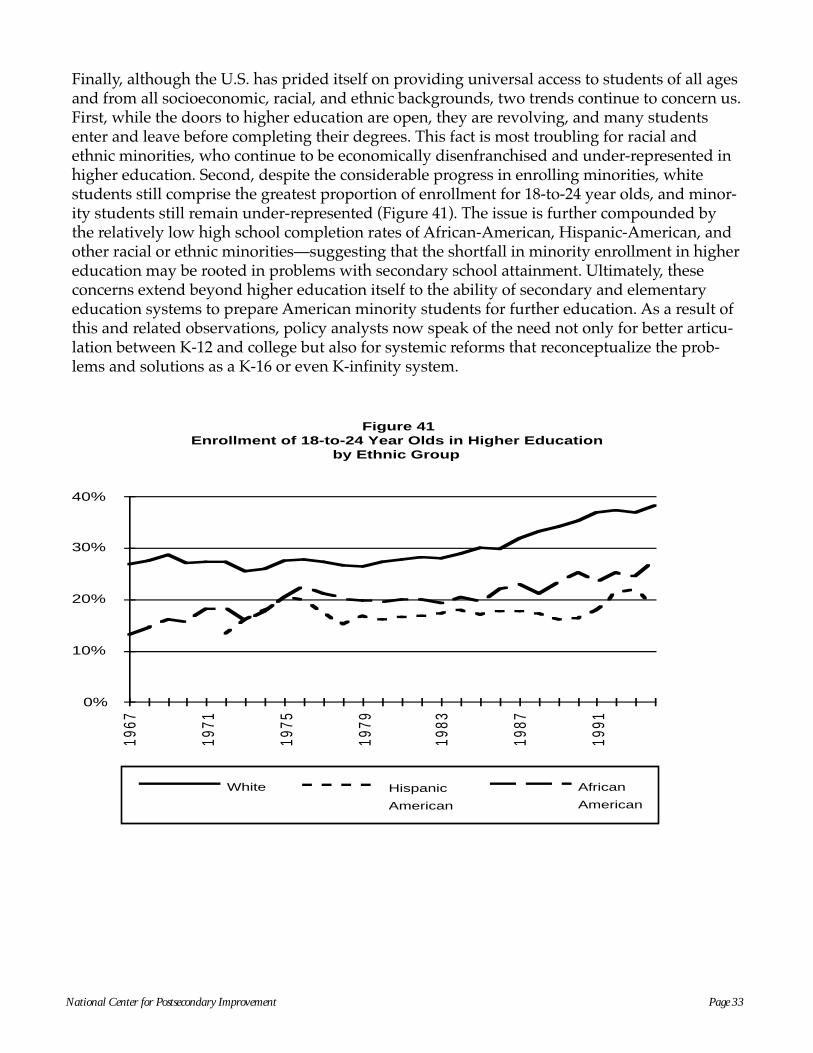
Finally, although the U.S. has prided itself on providing universal access to students of all agesand from all socioeconomic, racial, and ethnic backgrounds, two trends continue to concern us.First, while the doors to higher education are open, they are revolving, and many studentsenter and leave before completing their degrees. This fact is most troubling for racial andethnic minorities, who continue to be economically disenfranchised and under-represented inhigher education. Second, despite the considerable progress in enrolling minorities, whitestudents still comprise the greatest proportion of enrollment for 18-to-24 year olds, and minor-ity students still remain under-represented (Figure 41). The issue is further compounded bythe relatively low high school completion rates of African-American, Hispanic-American, andother racial or ethnic minorities—suggesting that the shortfall in minority enrollment in highereducation may be rooted in problems with secondary school attainment. Ultimately, theseconcerns extend beyond higher education itself to the ability of secondary and elementaryeducation systems to prepare American minority students for further education. As a result ofthis and related observations, policy analysts now speak of the need not only for better articu-lation between K-12 and college but also for systemic reforms that reconceptualize the prob-lems and solutions as a K-16 or even K-infinity system.
Figure 41Enrollment of 18-to-24 Year Olds in Higher Education
by Ethnic Group
0%
10%
20%
30%
40%
1967
1971
1975
1979
1983
1987
1991
White Hispanic
American
African
American

National Center for Postsecondary Improvement Page 34
The Agenda for Reform in a Time of Post-Massification
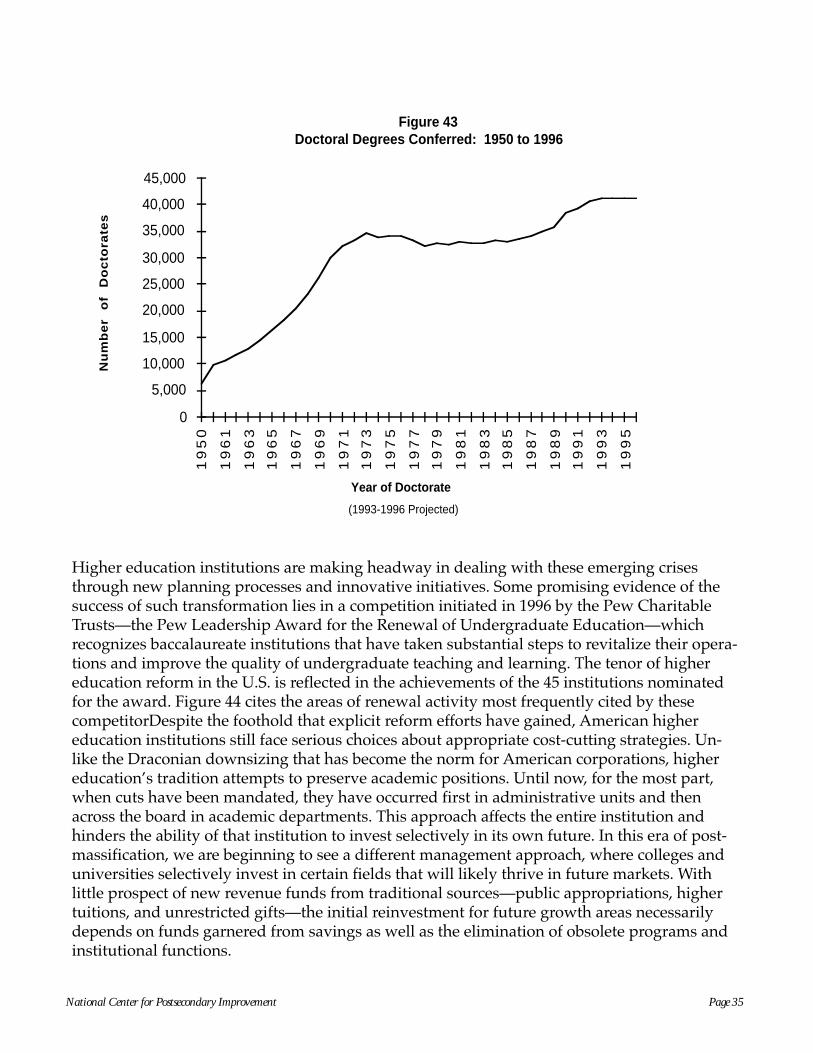
Faced with these pressures—declining revenue, increased expenditures for financial aid, grow-ing demands for quality and accountability from consumers, trustees, and government, as wellas resistance to tuition hikes—higher education has been forced to rethink its own enterprise.It has begun to borrow new business models from industry by downsizing, outsourcing, andreengineering many of its administrative functions in an attempt to cut costs. These reformefforts are being extended to the academic arena as well. In response to public complaintsregarding faculty—in particular, faculty time spent on research rather than on undergraduateteaching—institutions have begun to reconsider mechanisms for enhancing faculty productiv-ity as well as the very viability of tenure. As an interim strategy, institutions have increasinglyrelied on part-time and adjunct faculty positions in which the explicit job responsibility isteaching. As shown in Figure 42, the percentage of part-time faculty almost doubled between1970 and 1991. It is important to note that institutions’ hiring practices have a ripple effect,altering the demand for Ph.D.s, and that there is currently a widespread concern about theoversupply of doctorates. As shown in Figure 43, at a time when academic departments areexperiencing retrenchment and downsizing, the number of doctorates granted rose sharplyfrom 1989 to 1993 and then began to level off. Across the country, policy discussions are takingplace about possibly limiting the number of admits to Ph.D. programs in selected fields—fromphysics to history—due to discouraging job market projections.
Figure 42Percentage of Full-Time and Part-Time Faculty in Higher
Education: 1970 to 1991
0
19
70
19
74
19
78
19
82
19
86
19
90
Part-Time Faculty Full-Time Faculty
100%
80%
60%
40%
20%
National Center for Postsecondary Improvement Page 35
Figure 43Doctoral Degrees Conferred: 1950 to 1996
Year of Doctorate
Nu
mb
er
of
Do
cto
rate
s
0
5,000
10,000
15,000
20,000
25,000
30,000
35,000
40,000
45,000
19
50
19
61
19
63
19
65
19
67
19
69
19
71
19
73
19
75
19
77
19
79
19
81
19
83
19
85
19
87
19
89
19
91
19
93
19
95
(1993-1996 Projected)
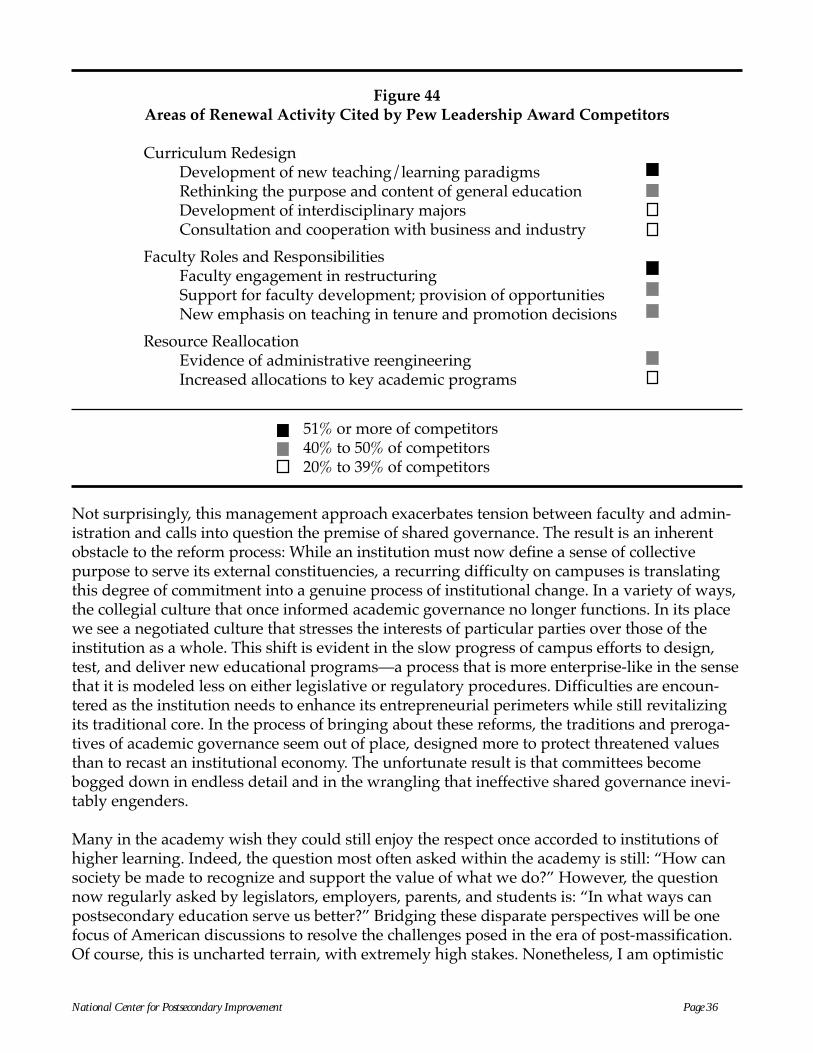
Higher education institutions are making headway in dealing with these emerging crisesthrough new planning processes and innovative initiatives. Some promising evidence of thesuccess of such transformation lies in a competition initiated in 1996 by the Pew CharitableTrusts—the Pew Leadership Award for the Renewal of Undergraduate Education—whichrecognizes baccalaureate institutions that have taken substantial steps to revitalize their opera-tions and improve the quality of undergraduate teaching and learning. The tenor of highereducation reform in the U.S. is reflected in the achievements of the 45 institutions nominatedfor the award. Figure 44 cites the areas of renewal activity most frequently cited by thesecompetitorDespite the foothold that explicit reform efforts have gained, American highereducation institutions still face serious choices about appropriate cost-cutting strategies. Un-like the Draconian downsizing that has become the norm for American corporations, highereducation’s tradition attempts to preserve academic positions. Until now, for the most part,when cuts have been mandated, they have occurred first in administrative units and thenacross the board in academic departments. This approach affects the entire institution andhinders the ability of that institution to invest selectively in its own future. In this era of post-massification, we are beginning to see a different management approach, where colleges anduniversities selectively invest in certain fields that will likely thrive in future markets. Withlittle prospect of new revenue funds from traditional sources—public appropriations, highertuitions, and unrestricted gifts—the initial reinvestment for future growth areas necessarilydepends on funds garnered from savings as well as the elimination of obsolete programs andinstitutional functions.
National Center for Postsecondary Improvement Page 36
Figure 44Areas of Renewal Activity Cited by Pew Leadership Award Competitors
Curriculum RedesignDevelopment of new teaching/learning paradigmsRethinking the purpose and content of general educationDevelopment of interdisciplinary majorsConsultation and cooperation with business and industry
Faculty Roles and ResponsibilitiesFaculty engagement in restructuringSupport for faculty development; provision of opportunitiesNew emphasis on teaching in tenure and promotion decisions
Resource ReallocationEvidence of administrative reengineeringIncreased allocations to key academic programs
Not surprisingly, this management approach exacerbates tension between faculty and admin-istration and calls into question the premise of shared governance. The result is an inherentobstacle to the reform process: While an institution must now define a sense of collectivepurpose to serve its external constituencies, a recurring difficulty on campuses is translatingthis degree of commitment into a genuine process of institutional change. In a variety of ways,the collegial culture that once informed academic governance no longer functions. In its placewe see a negotiated culture that stresses the interests of particular parties over those of theinstitution as a whole. This shift is evident in the slow progress of campus efforts to design,test, and deliver new educational programs—a process that is more enterprise-like in the sensethat it is modeled less on either legislative or regulatory procedures. Difficulties are encoun-tered as the institution needs to enhance its entrepreneurial perimeters while still revitalizingits traditional core. In the process of bringing about these reforms, the traditions and preroga-tives of academic governance seem out of place, designed more to protect threatened valuesthan to recast an institutional economy. The unfortunate result is that committees becomebogged down in endless detail and in the wrangling that ineffective shared governance inevi-tably engenders.
Many in the academy wish they could still enjoy the respect once accorded to institutions ofhigher learning. Indeed, the question most often asked within the academy is still: “How cansociety be made to recognize and support the value of what we do?” However, the questionnow regularly asked by legislators, employers, parents, and students is: “In what ways canpostsecondary education serve us better?” Bridging these disparate perspectives will be onefocus of American discussions to resolve the challenges posed in the era of post-massification.Of course, this is uncharted terrain, with extremely high stakes. Nonetheless, I am optimistic
51% or more of competitors 40% to 50% of competitors 20% to 39% of competitors
National Center for Postsecondary Improvement Page 37
about the utility of the national research and policy analysis efforts currently underway in anumber of American venues, especially that of my colleagues in the National Center forPostsecondary Improvement.
I greatly appreciate—and learn from—forums like this, which enable all of us to better under-stand the challenges we face in an international context. Thank you for your attention, and Ilook forward to our continued deliberations.